Embed Size (px)
Citation preview

U.S. Department of Justice
Bureau of Justice Statistics
Teenage Victims A National Crime Survey Report
NCJ-103138, November 1986
'"

•
Bureau of Justice Statistics reports (revised December 1986)
Call toll-free 800-732-3277 (IQca( 251-5500) to order BJS reports, to be added to one of the BJS mailing lists, or 10 speak to a reference specialist in s\aUsticn at the Justice Statistics Clearinghouse, Na~tonal Criminal Justice Reference Service, Box 6000, Rockville, MD 20850. Single. caples of reports are free; use NCJ number to order. Postage and handling are char~led for bulk orders of single reports. For singt~ copies of multiple titles, up to 1 ° titles are free: 11-40 titles $10: more than 40, $20; librarie~\ call for special rates.
Public',use tapes of BJS data sets and other criminal justice data are available from the Criminal Justice Archive and Information Network, P.O. Box 1248, Ann Arbor, M14t\106 (313-763-5010).
National Crime Survey Criminal \Ilctiml,~a\lon In the U.5.:
1984 (final rept'lrt), NCJ-100435, 5/86 1983 (final repo.1), NCJ.96459, 10/85 1982 (final reper)), NCJ.92820, 11/84 1973-82 trends, NCJ-90541, 9/83 1980 (final report), NCJ-84015, 4/83 1979 (final report), NCJ.76710, 12/81
BJS special reports: Preventing domestic violence against women,
NCJ.102037, 8/86 Crime prevantion measuros, NCJ-1 00438, 3/86 The use of weapons III committing crimes,
NCJ.99643, 1/86 Reporting crimes to the police, NCJ-99432,
12/85 Locating city, suburban, and rural crime, NCJ-
99535, 12/85 The risk of violent crime, NCJ.97t19. 5/85 The economic cost of crime to victims, NCJ-
93450,4/84 Hmlly violence, NCJ-93449. 4.';~4
BJS bulletins: HouseholdS tOUched by ~rlme, 1985,
NCJ.1018B5,6/86 Crlmlnalvlctlml~<'!Ion, 1984, NCJ.98904. 10/85 The crime of r~.p()i NCJ.96777, 3/85 HousehOld l>urglalJ', NCJ-96021, 1/85 CrIminal vlctimlzati~'n, 1983, NCJ.93B69. 6/84 Violent crime by strMgerS, NCJ-80829, 4/82 Crime and the elderly, NCJ.79614, 1/82 Measuring crIme, NOH5710. 2/81
Teenage vIctims, NCJ.103138. 12/86 Response 10 screening questions In the National
Crime Survey (BJS technical report), NCJ. 97624,7/85
Victimization and fear 01 crime: World perspecllves, NCJ'9;~872, 1/85
The National Crime S(\F~ey: Working papers, vol. I: Cui rent anel i1lstor'ical perspecliveS, NCJ.75374, 8/82 vol. II: Methologlcal stUdies, NCJ-90307, 12/84
Issues In the m8a~urement of victimization NCJ.748B2,10/ill '
The cost of negligence: Losses from preventable household burglaries, NCJ-53527, 12/79
Rape victimIzation In 26 American cities, NCJ.55878, 6179
Criminal victimIzation In urban schools, NCJ.58396, 6/79
An Introduction to the National Crime Survey, NCJ.43732, 4/78
Local victim surveys: A review of Ihe issues. NCJ.39973,8m
Parole and probation BJS bulletins:
Probation and parole 1984, NCJ-l00181, 2/86
Setting prison terms, NCJ.76218, 8/83
Parole In the U. S., 1980 and 1981, NCJ.87387 3/86 '
Characteristics of persons entering parole during 1978 and 1979, NCJ.87243,5/83
CharacteristIcs of the parole population 1978 NCJ.66479,4/81 ' ,
Parole In the U,S., 1979, NCJ-69562, 3/81
~. . Corrections eJS bulletins lind special reporis:
Capital pUnlahmellt, 1985, NCJ-1 02742, 11/86 State and Fedoral ,)rlsoners, 1925-85,
NCJ.l02494. 11/8~\ PrlsDners In 1985, NCJ-101384, 6/86 Prison admission and j'eleases, 1983,
NCJ-l 00582, 3/86 Capita! punishment 19a.~. NCJ.98399. 8/85 Examining recidivIsm, NCJ-96501, 2/85 Returnlntl to prison, NCJ-S5700, 11/84 Time served In prison, NCJ'93924, 6/84
Historical corrections stllllstlcs In the U.S., 1 850-1984, NCJ.'J 02529, 12/116
Prisoners In St.ate and Fedorallnstltutions on Dec. 31, 198:3, NCJ.9986 j, 6/81'';
Capital punlshm<'lnt 1984 (final), NOJ.99562, 5/86 Capital punishment 1983 (final), NC,~99561, 4/86 1979 surveyoflnmales of State correctIonal facil/Jles and 1979 census 0/ Slate correcl/onal/acilities: BJS speCial repPfls:
The prevalence of imprisonment, NCJ-93657, 7/85
Career patterns In crlmo, NCJ-88672, 6/83
BJS bulletins: PrIsoners and drugs, NCJ'87575, 3/83 Prisoners and alc()hol, IIICJ-86223, 1/83 Prisons and prisonlUs, NCJ-80697, 2/82 Veterans In prison, NCJ-7'9232, 11/81
Census of jal/s and surv6'y of 1,~iI inmates: Jail inmates, 1984, NCJ.101094, 5/B6 Jail Inmates, 1983 (BJS bullelln), NCJ-99175.
11/85 The 1983 Jail census (BJS bulletin). NCJ-95536,
11/84 Cer)sus of Jails, 1978: Oal({ lor hldivldual jails,
vois. HV, Northeast, North Centra:. South. West. NCH2279-72282.12/81
Profile of Jail Inmates, 1978, NCJ.B5412, 2/81
Children in Gustody: Public juvenlf6' facilities, 1985 (bulletm).
NCJ.102457. 10/86 1982-83 census of jUvenile detention afid
correctional facilities, NCJ-101686. 9/86
Expenditure and empioyment BJS Bul/etins:
Justice expenditure and employment: 1983, NCJ.l01776. 7/8U 1982, NCJ.98327. 8/85
JustIce e~pendlture and employment In the U.S.: 1980 and 1981 extracts, NCJ-96007. 6/85 1971-79, NCJ-92596. 11/84
Courts BJS bulletins:
The growth of appeals; 1973-83 trends, NCJ-96381, 2/85
Case filings In State courts 1983, NCJ-951 I 1, 10/84
8JS special reporis: Felony case-processing time. NCJ-1 01985, 8/86 Felony sentencing In 18 local
JUrisdictions, NCJ.978B1, 6/85 The prevalence ot guilty pleas, NCJ.96018.
12/84 Sentencln9 practices In 13 States, NCJ-95399
10/84 ' Criminal defense systems: A national
survey, NCJ.94630, 8/84 Habeas corpus, NCJ-92948, 3/84 State court caseload statistics, 1977 and
1981, NCJ.87587, 2/83
National CrimInal Defense Systems Study, NCJ. 94702, 10/86
The prosecution of felony arrests: 1981, NCJ.l013B0, 9/86 1980, NCJ.978B4. 10/85 1979, NCJ.86482, 5/84
State court mOdel statistical dictionary, Supplement, NCJ.98326, 9/85 1 st edItion, NCJ.62320, 9/80
State court organization 1980, NCJ-76711 7/82 A cross-city comparison of felony case '
processing, NCJ.55171, 7/79
Federal offenses and offenders BJS spac/al reports:
Pretrial release and miscondUct, NCJ.96132 lffl5 '
BJS bUl/ellns: Bank robbery, NCJ.94483, 8/84 Federal drug law Violators, NCJ-92692, 2/84 Federal JUstice statistics, NCJ-80814, 3/82
W*
Privacy and security Computer crime: BJS spsclel reports:
'"
Electronic fund transfer fraud, NCJ.96666,3/85 Electronic fund transfer and crime,
NCJ.92650. 2/84 Electronic fund transfer fraud, NCJ-100461,
4/86 Computer security techniques,
NCJ-84049, 9/82 Electronic fund transfer systems and crime,
NCJ-83736, 9/62 Expert witness manual. NCJ.77927, 9/81 Criminal Justice resource manual, NCJ-61550,
12/19
Privacy and security of criminal history Information:
Compendium of State legislation, 1984 overvlow, NCJ-98077, 9/85
Criminal justice Information polley; Crlmlraljulltlce "hot" flies, NCJ-1 01850, 12/86 Data quality policies and procedures:
Proceedln9s of a BJS/SEARCH conferenca, NCJ-101849.12/86
Crime control and crIminal records (BJS special reporl), NCJ·99176, 10/85
Stato criminal records repositories (BJS lechnical report), NCJ-99017, 10/85
Data quality of criminal history records, NCJ-98079, 10185
Intelligence and Investigative records, NCJ-95787. 4/85
Victim/witness legislation: An overview. NCJ-94365, 12/84
Information policy and crime control strategies (SE:ARCH/BJS COnference), NCJ-93926. 10/84
Research access to criminal justice data, NCJ-84154, 2/83
Privacy and juvenile justice records, NCJ'84152, 1/83
Survey of State laws IBJS bullelm). NCJ-80836, 6/82
.Privacy and the private emplOYer, NCJ-79651. 11181
General BJS bulletins and speCial reports:
BJS telephone contacts '87, NCJ-l02009, 12/86 Tracking offenders: Whlte-coilar crime,
NCJ-l02867.11/86 Police employment and expenditure,
NCJ-l00117.2/86 Tracking offenders: The child victim, NCJ·
95785, 12/84 The severity of crime, NCJ.92326. 1/84 The American response to crime: An overview
of criminal Justice systems, NCJ.91936, 12/83 Tracking offenders, NCJ-91572, 11/83 Victim and witness assistance: New State
laws and the syste,'I's response, NCJ·87934, 5/83
1986 directory of automated crImlnallustlce Information systems, NCJ.102260. 12/86, S20
Crime and Justice facts, 1985, NCJ-l00757, 5/86 National survey of crime severity, NCJ-96017.
10/85 Criminal victlmlzallon 01 Plstrlct of Columbia
residents and Capitol Hill employees, 1982-83, NCJ-97982;Summary, NCJ.98567; 9/a5
The DC crime victimization study Implementation, NCJ-98595, 9/85. $7.80 domestic/59. 20 Canadlan/S 12.80 foreign
The DC household victimization survey data base: DOCUmentation, NCJ.98596, $6.4(\/56.40/511 User manual, NCJ-98597. $8.20/$9.80/$12.80
How to gain access to BJS data (brochureJ. BC-OQO022, 9/84
Proceedings of the 2nd workshop on law and justice statistics, 1984, NCJ-93310. 8/84
Report to the nallon on crime and justIce: The data, NCJ-8708B. 10/83
Dictionary of crimInal justlca data termlnolo9Y: 2nd ed., NCJ.76939. 2/82
Technical standards for machine-readable data supplied to BJS, NCJ.75318, 6/81
See order form on last page
U.S. Department of Justice
Bureau of Justice Statistics
~ ,'.' ': ". ~ , . ,'" .,' ~
Teenage Victims A National Crime Survey Report
NCJ-103138, November 1986
103138
:r~~~~s~n to reproduce this OOfIYfig!lled material has been
Public Domain/Bureau of Justice u. S. Deparbnent of ,.Justice ....... ~--
to the National Criminal Justice Reference Service (NCJRS),
~~~ho~rt~eeP~ti~nt outside of the NCJRS system requires permis--.'p,.!}n owner.

"------------------~------------------------------------------------------------
U.S. Department of Justice Bureau of Justice Statistics
steven R. Schlesinger Director
Joseph M. Bessette Deputy Director
Benjamin H • .Renshaw III Deputy Director
Charles R. Kindermann Associate Director
Patsy A. Klaus NCS Unit Director
Acknowledgments. This report was written by Catherine J. Whitaker of the Bureau of Justice Statistics. Marshall M. DeBerry of BJS provided sta tistical review. Frank D. Balog provided editorial assistance. Statistical assistance was provided by Gertrude Thomas and production assistance was furnished by Tina Dorsey. Marilyn Marbrook administered its publication and was assisted by Millie J. Baidea and Jeanne Harris.
National Crime Survey data collection and processing activities are conducted by the Bureau of the Census. At present, the program is under the supervision of Evan Davey, Acting Chief, Crime Surveys Branch, Demographic Surveys Division. He is assisted by Helen Montagliani, Patricia BOWles, Donna Brooks, Jennifer Jones, Marilyn Monahan, Sherrie Schrama, Janice Sebold, and Bruce Wilder.
Guidance on technical matters related to this program was provided by Inez Chen and David Hubble, Statistical Methods DiVision, Bureau of the Census, under the supervision of Charles Alexander.
In the Bureau of Justice Statistics the data collection program is monitored by Michael R. Rand.
ii Teenage Victims
.
Contents
Introduction 1 Victimization rates 1 Trends 2 Crime charal'}teristics 2
Place and time of occurrence 2
The use of w~\apons in crimes 2
Self-protective measures 2
Injuries and medical care 3
Number of victims and offenders 3
Offender characteristics 3 Relationship to victim 3 Sex of offenders 3 Race of offenders 4 Age of offenders 4
Reporting crimes to the police 4 Methodology 5
Tables
1. Average annual victimization rates and numbers of victimizations, by age of victim and type of crime, 1982-84 & 2. Victimization rates by type of crime and age of victim, 1984 6 3. Victimization rates per 1,000 persons, by type of crime, age of victim, and demographic characteristics, 1982-84 6 4. Victimization rates by type of crime and age of victim, 1973 and 1984 6 5. Place of occurrence of personal crimes, by age of victim and type of crime, 1982-84 7 6. Time of occurrence of personal crimes, by age of victim and type of crime, 1982-84 8 7. Presence of weapon, by age of victim and type of violent crime, 1982-84 8 8. Percent distribution of selfprotective measures used in violent crimes, by age of victim, 1982-84 9 9. Percent distribution of attacks, injuries in violent crimes, and medical care obtained, by age of victim, 1982-84 9 10. Percent distribution of injured victims, by seriousness of injury and age of victim, 1982-84 9 11. Number of victims in violent crimes, by number of offenders and age of victim, 1982-84 10 12. Relationship of offender(s) to victim in crimes of violence, by age of victim and type of crime, 1982-84 10 13. Perceived sex of offender(s), by sex and age of victim and type of violent crime, 1982-84 11 14. Perceived l'ace of offender(s), by race and age of victim, and type of violent crime, 1982-84 12 15. Perceived age of offender(s), by age of victim end type of violent crime, 1982-84 12 16. Police reporting rates, by age of victim and type of crime, 1982-84 12 17. Most important reason for reporting crimes to police for victims ages 12-19, 1982-84 13 18. Most important reason for not reporting crimes to police, by age of victim and type of crime, 1982-84 13
Teenage Victims iii

•
Introduction
From 1982 through 1984, teenagers (ages 12-19) experienced an average of 1.8 million violent crimes and 3.7 million crimes of theft annually. Teenage victimization rates for these crimes were about twice as high as those of the adult population, ages 20 and older. 'The average annual violent crime vic timization rate was 60.1 per 1,000 teenagers compared to 26.9 for the adult population. For crimes of theft, the teenage rate was 123.5; the adult rate, 65.6.
Within the teenage population itself, older teens (age.s 16-19) had higher violent crime vi<.\timization rates than did younger teens (ages 12-15). The two groups had similar victimization ratel; for crimes of theft.
Trends in crime rates against teenagers since 1973 have been similar to those for adults. Teenagers have experienced a decline in theft victimization rates, but violent crime victimization rates have remained essentially unchanged.
80th younger and older teens were more likely than adults to be attacked during a violent crime and were less likely than adults to be injured. In other ways, however, the characteristics of incidents against older teens more closely resembled those of adult victimizations. Similar proportions of older teens and adults faced armed offenders and, if injured, sustained serious injuries. By contrast, younger teens were least likely of the three age groups to face armed offenders; if injured, they were less likely to sustain serious injuries.
Crimes against teenager's were less likely to be reported to the police than crimes against adults. Among teenagers, crimes against younger teens were less likely t() be reported than crimes against older teens.
Violent crimes against teenagers were more likely to be committed by other teenagers than by adults. Most
of these crimes against younger teenagers were committed by offenders under 18 years old. Close to half of the violent crimes against older teenagers were committed by offenders under 21. By contrast, 70% of the violent crimes against adults were committed by offenders age 21 or older.
Teenagers of all ages also reported knowing their assailants more often than adults. Younger teens were most likely to report that the offender was a casual acquaintance or someone known by sight, but least likely to identify their assailant as a complete stranger.
The information in this report is based on data obtained from the National Crime Survey (NCS) for the years 1982 through 1984. The NCS obtains information about personal and household crimes, including crimes not reported to the police, from Individuals ages 12 and over in a nationally representative sample of households. Although NCS interviewers obtain information directly from most household members, nearly all the interviews for 12- and 13-yearolds are completed by a knowledgeable adult household member (see methodology).
Victimization rates
• Teenagers had higher annual violent crime victimization rates than did adults from 1982 through 1984. Young teenagers had a rate of 52.0 per 1,000 teens; the rate for older teens was 67.8 per 1,000 (table 1). Adults had a violent crime victimization rate of 26.9 per 1,000. For each category of violent crime (rape, robbery, and assault) teenagers in both age groups had higher victimization rates than adults.
• Overall, teenagers had higher victimization rates for crimes of theft than adults. The rates for personallarc1:lny with contact (purse snatching or pocket picking) were not measurably different for teens and adults. The rate for personal
larceny without contact, however, was higher for teenagers than for adults.
• Within the adolescent population, older teenagers had higher victimization rates than younger teens for crimes of violence in general and for the specific violent crimes of robbery and aggravated assault. Younger and older teens experienced similar rates of personal thefts.
• Within the U.S. population, personal victimization rates generally decrease as the age of the victim increases (table 2). Because older age groups have lower personal victimization rates than do young adults, the rates for the entire adult population are lower than the rates for teenagers. However, the victimization rates for young adults ages 20-24 and teenagers are more similar than the aggregated adult rates suggest.
• Similar to the adult population, male teenagers had higher violent and theft crime rates than did female teens. Black teenagers had higher violent crime rates than teenagers of other racial groups. Within categories of teenagers based on race and sex, however, older teens consistently had higher victimization rates for violent crimes than you¥'er teens in the same group (table 3). On the other hand, victimization rates for crimes of theft generally did not vary by age within these same categories; young black teens, however, had higher rates than older black teens.
lThe difference between vIctimization rates for 12-15-year-old blacks and 16-19-year-old blacks was Significant at the 90% conridence level.
Teenage Victims 1

•
TreDds
• The trends in crime rates against teenagers are similar to those for the population as a whole. Annual rates of crimes of theft experienced by teenagers have generally declined since the inception of NCS in 1973 (figure 1). The rate in 1984 (120.4 per 1,000) was measurably lower than the rates for all if9vious years except 1980 and 1983.
• Overall, the violent crime victimization rate for teenagers has remained essentially stable since 1973. However, the rates for individual categories of violent crime have changed. Between 1973 and 1984 the rate of aggravated assault declined by 17% from 19.2 to 16.0 per 1,000 teenagers. The robb~ry rate for teenagers was somewhat lower in 1984 than in 1974.
• In contrast to the decreases in robbery and aggravated assault rates, the annual rate of simple assault rose by 21% from 27.3 per 1,000 teenagers in 1973 to 32.9 in 1984.
• Younger and older teens had similar trends in victimization rates over time (table 4). For both groups, theft victimization rates were lower in 1984 than in 1973; violent crime victimization rates did not change during this same period for either group;
• Younger teens had a somewhat higher theft victimization rate than older teens in 1973, but in 1984 there was no measurable difference in the rates for the two groups. On the other haM, older teens had consistently higher violent crime victimization rates than ~ounger teens during these years.
2'l'~ difference between the 1984 rate and the 1982 rate was significant at the 90% confidence level.
3The difference between Violent crime ra tes for younger and older teens in 1973 was significant at the 90% confidence level.
2 Teenage Victims
Victimization rate per 1 ,000 persons age 12-19, 1973-84
Rate per 1 000 persons age t 2·\ q
180-
160-
14(}o
120-
100-
80-
Crimes of theft (personal larceny)
Crimes of violence (rape, robbery, and assault) 60-_------
40- Simple assault
-----~-Robbery o r i 197:3
FIgure 1
Crime characteristics
Place and time of occurrence
The likelihood of experiencing a crime at a particular place or time is related to the daily activities of the potential victim. Because young teens spend a significant amount of time at school, they are more likely than adults to be victimized there (table 5). Since the daily activities of adults may include employment, housekeeping, and leisure activities, they are more likely than teenagers to experience violent crime while at or near home or in a restaurant or commercial building.
Other findings include:
• Young teenagers were most likely to experience robberies and aggravated assaults on a street or in a park but were most likely to be victims of simple assault while in a school building or on school property.
• Older teenagers were most likely to be victims of all types of violent cl'ime while on a street ot(' in a park.
• Teenagers in both age groups were most likely to experience crimes of the ft in a school building 01' on school property. Younger teenagel's, however, were about twice as likely as older teens to experience thefts at school (83% vs. 42%).
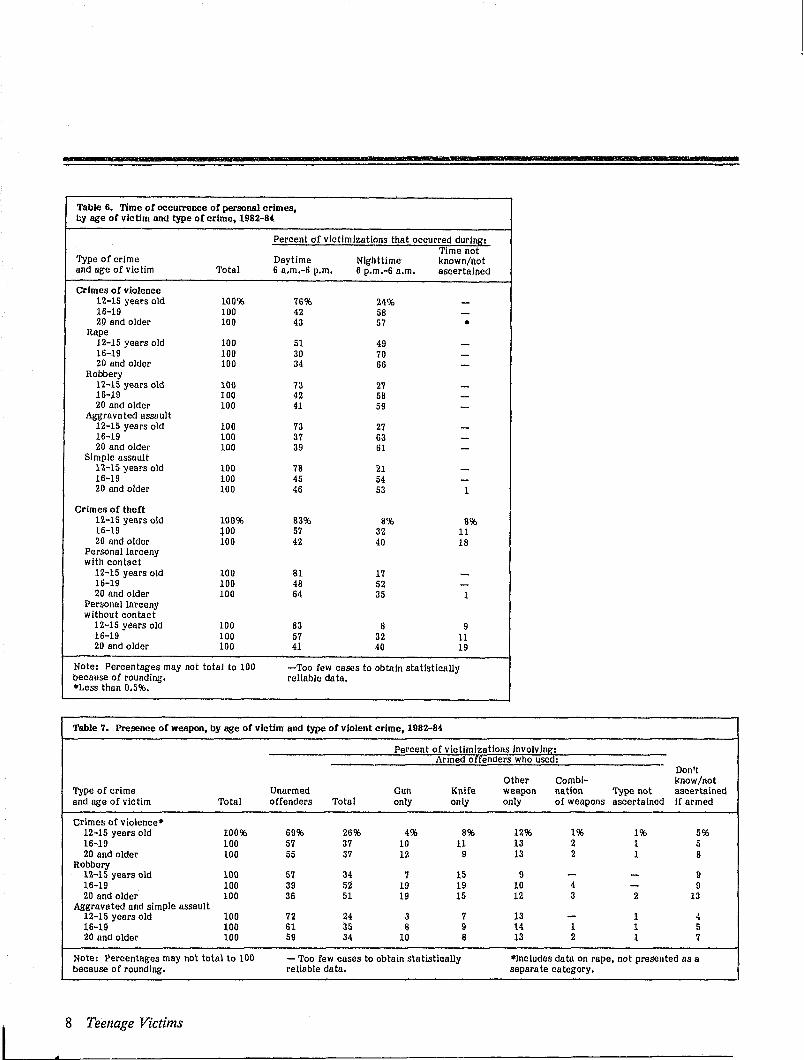
• Younger teenagers were more likely than either older teenagers or adults to experience crimes of violence or theft during the daytime, that is, between 6 a.m. and 6 p.m. (table 6). This finding is related in part to the proportion of young teens who were victimized at school.
• Similar proportions of older teens and adults were victimized by violent crimes during the day. Older teens were morp. likely than adults to experience larcenies without contact in the daytime. They were, however, less likely than adults to experience larcenies with contact during the day.
The use of weapons in crimes
• Young teenagers were the least likely of the three age groups to face armed offenders during crimes of violence. There were no measurable differences in the proportions of older teenagers and adults who faced armed offenders (table 7).
• Younger teenagers were the least likely of the three age groups to face offenders armed with guns, and were somewhat less likely than older teens to be victimized by offenders armed with knives.
Self-protective measures
Nes collects information on selfprotective measures taken by victims during violent cl'imes. These measures, ranked from most to least serious, are: 1) using or brandishing a weapon; 2) using or attempting to use physical force; 3) trying to get help or attract

attention; arguing or reasoning with or threatening the offender; 4) resisting without force, running away, hiding.
Major findings on self-protection include:
1\ Younger teens were less likely than older teens (74% vs. 79%) and somewhat less likely than adults (74% vs. 77%) to take self-protective measures.
• Of those who took self-protective measures, teenagers were less likely than adults to try to get help or to argue or reason with the offender (table 8).
• Younger teenagers were the most likely of the three age groups to resist without force.
• Older teens (37%) were more likely than adults (30%) and somewhat more likely than younger teens (32%) to use or try to use physical force when they took self-protective measures.
• Among the self-protective measures taken by young teenagers, similar proportions resisted without force (38%) and used physical force or attempted force as selfprotective measures (32%). A larger proportion resisted without force than tried to get help or argue or reason with the offenders (25%).
• Among the self-protective measures taken by older teens, the proportion who used or tried to use physical force (37%) was higher than those who tried to get help (27%) and somewhat higher than those who resisteCi without force (31 %). They were less likely to use or attempt to use weapons.
Injuries and medical care
Violent crimes, as measured in the NCS, include different components of attacks and threats. In a violent crime, an offender may attack the victim using a weapon or physical force. The victim mayor may not sustain injuries as a reS1llt of
attacks. Violent crimes can also consist of threats against the victim rathel' than actual attacks. Examples of threats include verbal threats, displaying a weapon, following a victim, or attempting to use a weapon, such'as shooting at but missing the victim.
Findings on a ttacks, injuries, and medical care for teenage and adult victims include:
• Teenagers were more likely than adults to be attacked during a violent crime (table 9). The proportions of older and younger teens attaclced were not measurably different.
• Younger teens were more likely and older teens were somewhat more likely them adults to be a ttacked but not injured.
• A higher proportion of teenagers than adults were injured but did not obtain subsequent medical care.
• The proportions of violent crime victims who were injured and who obtained medical care did not vary by age.
• Younger teenage victims who were injured were less likely than adult or older teenage injured victims to sustain serious injuries (table 10). The proportions of older teenage and adult injured victims who sustained serious injuries were not measurably different.
Number of victims and offenders
• Higher proportions of teens than adults faced multiple offenders when alone or when others were present but not victimized, such as when the crime took place in school or in another public place (table 11).
• Teenagers were also more likely than adults to face multiple offenders when there was more than one victim.
Offender characteristics
Relationship to victim
Because respondents may be re~uctant to mention crimes committed against them by relatives and acquaintances, and because adults answer NCS questions for nearly all 12- and 13-year-olds, it is likely that the NCS undercounts crimes committed against teenagers by relatives or family friends. Even given this likelihood, teenage violent crime victims were more likely than adult victims to report that they knew the offender (table 12).
Other findings concerning the victim-offender relationship are:
• Young teenage violent crime victims were the most likely of the three age groups to have known their offenders casually or by sight. In many of these situa tions, the teenager may have recognized the offender as a fellow student in school or as someone living in the neighborhood.
• The proportions of older teenagers and adults victimized by persons known by sight were not measurably different. Older teenage violent crime victims, however, were more likely than adults to report that the offenders were casual acquaintances.
• The proportion of violent crime victims who reported that their offenders were completely unknown was highest for adults (51%) followed by older teenagers (43%) and younger teenagers (32%).
• For all three age groups, the proportions of violent crimes committed by persons completely unknown to the victim varied by type of crime. The proportions of all vic Ums robbed by persons they did not know at all was higher than the comparable percentages for aggravated assaults and for simple assaults.
Sex of offenders
• In the vast majority of violent
Teenage Victims 3

-crimes, males, regardless of age, were victimized by other males (table 13). Male teenagers, however, were even more likely than male adults to be victimized by male offenders (94% vs. 89%).
• In general, females were also more likely to be victimized by males. Female teenagers, however, were more likely than female adults to be victimized by other females (37% vs. 15%).
• Female teenagers were about as likely to suffer simple assaults committed by other females (47%) as by males (48%).
Race of offenders
• Teenagers, like adults, were victimized more orten by persons of the same race (table 14). White teenagers, however, were victimized by other whites more often than were white adults. Black teenagers were victimized by other blacks somewhat more often than were black adults.
• Most black robbery victims-both teenage and adult-reported tha t the offenders were black. Black teenagers, however, were somewhat more likely than black adults to be robbed by blacks (86% vs. 80%).
• Robbery was less intraracial for White victims. About 49% of white teenagers and 41% of white adults were robbed by white offenders.
• White teenagers were more likely than white adults to experience simple assaults by white offenders (83% vs. 79%). About the same proportions experienced aggravated assaults by white offenders (76% vs. 75%).
• Black teenagers were about as likely as black adults to experience simple assaults by black offenders, but more likely to experience aggravated assaults by black offenders (86% vs. 76%).
4 Teenage Victims
m
Age of offenders
• Teenagers and adults were generally victimized oy persons within their own age groups (table 15).
• Young teenagers were most likely to be victimized by offenders under 15 or 15-17 (61 %). Adults were most likely to be victimized by offenders age 21 or older (70%).
• Almost half of the offenders against older teens were under 21. Almost a thirc;l, however, were 21 or older.
Repot'ting crimes to the police
• Both violent and theft crimes against teenagers wel'e less likely than those against adults to be repol'ted to the police (table 16).
• Robberies, simple a.ssaults, and personal thefts were more likely to be reported if an older teenagel' was victimized than if a young teenager was victimizer;!. The proportions of aggravated ass!lults reported to the police, however, were not measurably different for these two age groups.
• Unlike the patterns for other crimes, rapes of young teenagers were more likely to be reported to policetiliiti rapes of adults and somewhat more likely to be reported than rapes of older tecns. These findings, however, are based on a relatively small number of sample cases.
• The proportion of teenage victimizations reported to police rose as the seriousness of the crime increased. More than three times as many violent crimes as theft crimes against younger teens were reported to the police. About twice as many violent as theft crimes against older teens were reported.
• About 31% of those who notified police of violent crimes against teenagers stated that the most important reason was to prevent the incident from happening again to the victim or to others (table 17). The
T
desire to recover property was mentioned most often as the primary reason crimes of theft were reported.
• Survey respondents were also asked the most important reason the police were not notified. A higher proportionof violent crimes against teenagers than against adults were not reported to police because the incident was not viewed as important enough (table 18).
• For younger teens, the most often mentioned reasons for not reporting a violent crime were that it was not considered important enough (28%) or it was reported to someone else (26%), possibly a parent, teacher, or school official. The most often mentioned reason for not reporting a theft crime was that it was reported to someone else (43%).
• For older teens, the most often mentioned reasons for not reporting a violent crime were that it was a private, personal matter (28%) or it was unimportant (25%). The most often mentioned reason for not reporting a theft crime Was that it was not considered important (31%).
AUi
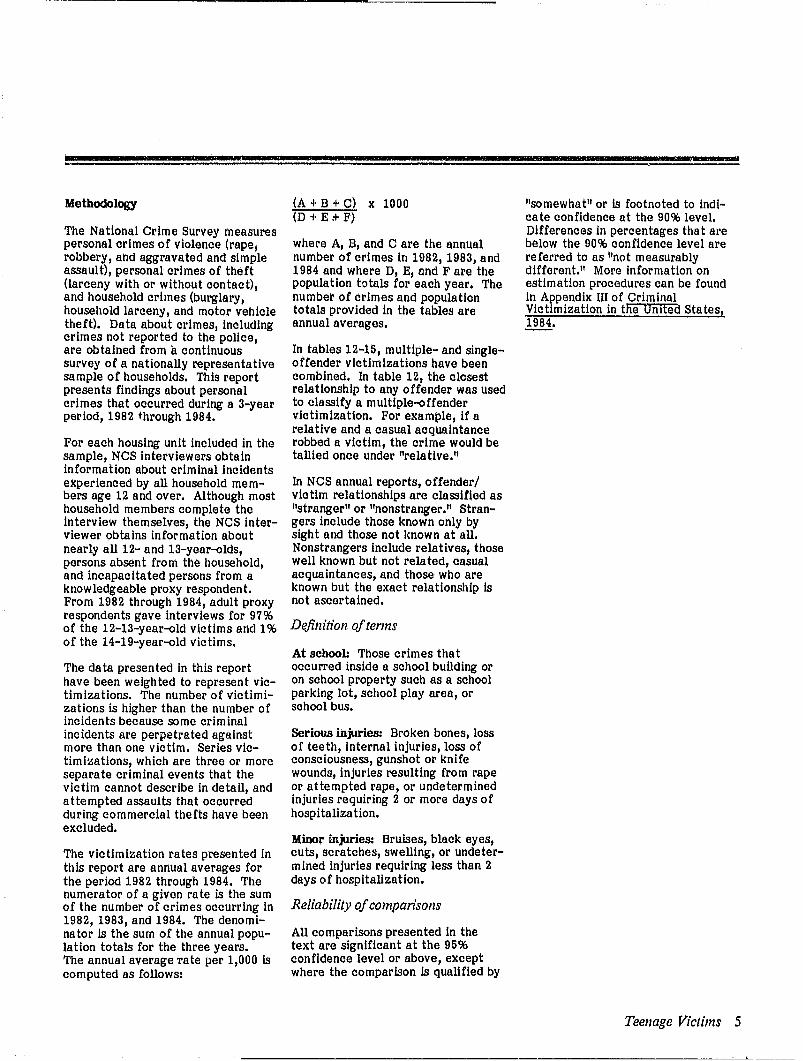
Methodology
The National Crime Survey measures personal crimes of violence (rape, robbery, and aggravated and simple assault), personal crimes of theft (larceny with or without contact), and household crimes (burglary, household larceny, and motor vehicle theft). Data about crimes, Including crimes not reported to the police, are obtained from a continuous survey of a nationally representative sample of households. This report presents findings about personal crimes that occurred during a 3-year period, 1982 through 1984.
For each housing unit included in the sample, NCS Interviewers obtain Information about criminal incidents experienced by all household members age 12 and over. Although most household members complete the interview themselves, the NCS interviewer obtains Information about nearly all 12- and 13-year-olds, persons absent from the household, and incapacitated persons from a knowledgeable proxy respondent. From 1982 through 1984, adult proxy respondents gave interviews for 97% of the 12-13-year-old victims and 1 % of the 14-19-year-old victims.
The data presented in this report have been weighted to represent victimizations. The number of victimizations is higher than the number of incidents because some criminal incidents are perpetrated against more than one victim. Series victimizations, which are three or more separate criminal events that the victim cannot describe in detail, and attempted assaults that occurred during commercial thefts have been excluded.
The victimization rates presented in this report are annual averages for the period 1982 through 1984. The numerator of a given rate is the sum of the number of crimes occurring in 1982, 1983, and 1984. The denominator is the sum of the annual population totals for the three years. The annual average Tate per 1,000 is computed as follows:
(A + B + C) x 1000 (D + E;t F)
where A, B, and C are the annual number of crimes In 1982, 1983, and 1984 and where D, E, cmd F are the population totals for each year. The number of crimes and popUlation totals provided in the tables are annual averages.
In tables 12-15, multlple- and singleoffender victimizations have been combined. In table 12, the closest relationship to any offender was used to classify a multiple-offender victimization. For example, If a relative and a casual acqU8.intance robbed a victim, the crime would be tallied once under "relative."
In NCS annual reports, offender/ victim relationships are classified as "stranger" or "nonstranger." Strangers include those known only by sight and those not Imown at all. Nonstrangers Include relatives, those well known but not related, casual acquaintances, and those who are known but the exact relationship is not ascertained.
Definition oftenns
At school: Those crimes that occurred inside a school building or on school property such as a school parking lot, school play area, or school bus.
Serious injuries: Broken bones, loss of teeth, internal injuries, loss of consciousness, gunshot or knife woundS, injuries resulting from rape or attempted rape, or undetermined injuries requiring 2 or more days of hospitalization.
Minor injuries: Bruises, black eyes, cuts, scratches, swelling, or undetermined Injuries requiring less than 2 days of hospitalization.
Reliability of comparisons
All comparisons presented in the text are significant at the 95% confidence level or above, except where the comparison Lo:; qualified by
,-"somewhat" or is footnoted to Indicate confidence at the 90% level. Differences In percentages tha tare below the 90% confidence level are referred to as "not measurably different." More Information on estimation procedures can be founa in Appendix III of Criminal Victimization in tfieUllltea States, 1984.
Teenage Victims 5
------------~ --~~~
- Hi M - -=
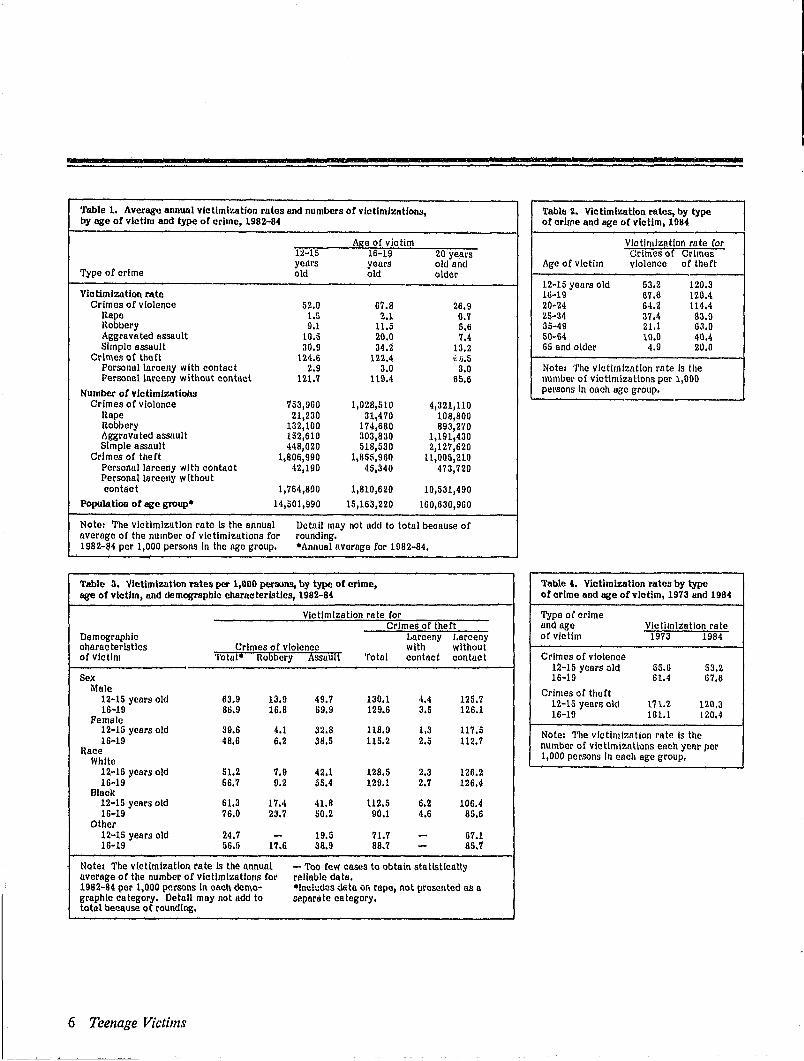
'fable 1. Average annual victimization rates and numbers of victimizations, by age of victim and type of crime, 1982-84
Table 2. Victimization rates, by type at crime and age of victim, 1984
Age of victim 12-15 16-19 20 years years years old and
Type of crime old old older
Victlmlzo.tion rllte for Crimes of Crimes
Age of victim violence of theft
Victimization rate 12-15 years old 53.2 120.3 16-19 67.6 120.4
Crimes of violence 52.0 67.8 26.9 20-24 64.2 114.4 nape 1.5 2.1 0.7 25-34 37.4 83.9 Robbery 9.1 11.5 5.6 35-49 21.1 63.0 Aggravated assault 10.5 20.0 7.4 50-64 10.0 40.4 Simple assault 30.9 34.2 13.2 65 and older 4.9 20.0
Crimes of the rt 124.6 122A ';1,.5 Personal larceny with contact 2.9 3.0 3.0 t-lote: The Victimization rate is the Personallnrccny without contud 121.7 119.4 65.6 number of victimizations per 1,000
Number ot vlctimbmtiOOll persons In each age group.
Crimes of violence 753,960 1,028,510 4,321,110 Rape 21,230 31,470 108,800 Robbery 132,100 174,680 893,2'/0 Aggravated assault 152,610 303,830 1,191,430 Simple assault 448,020 518,530 2,127,620
Crimes or theft 1,806,990 1,855,960 tl,OOS,210 Personal larceny with contact 42,190 46,340 473,720 Personal larceny w {thout contact 1,764,800 1,810,620 10,531,490
Population at age group. 14,501,990 15,163,220 160,630,960
Note: The victimization rate Is the annual Detail may not add to total because or average of the number of victimi~ations for rounding. 1982-84 per 1,000 persons In the age group. .Annual average for 1982-84.
Table 3. Victimization rntell per 1,000 persons, by type of crime, Table.. Vlotimization rates by type age of victim, IlIld demographic characteristics, 1982-84 or crime and age of victim, 1973 IlIld 1984
Victimization rate for Type at crime Crimes of the ft and age VictimiZation rate
Demographic Larceny Larceny of villtim 1973 1984 characteristics Crimes of violence with without of Victim Total· Robbery Assault Total contact contact Crimes of violence
12-15 years {lId 55.6 53.2 Sex 16-19 61.4 67.6
Male 12-15 years old 63.9 13.9 49.7 130.1 4.4 125.7 16-19 86.9 16.8 69.9 129.6 3.5 126,1
Female
Crimes of theft 12-1S years old 171.2 120.3 16-19 161.1 120.4
12-15 years old 39.6 4.1 32.8 11B.9 1.3 117;5 16-19 48.6 6.2 38.5 115.2 2.5 112.7
Race Whit(l
Note: The victimization rate is the number of victimizations ench year per 1,000 persons in each age group,
12-15 years old 51.2 7.9 42.1 128.5 2.3 126.2 16-19 66.7 9.2 $5.4 129.1 2.7 126.4
Black 12-15 years old 61.3 17.4 41.8 112.5 6.2 106.4 16-19 76.0 23.7 50.2 90.1 4.6 85.6
Other 12-15 years old 24.7 - 19.5 71.7 - 67.1 LN9 56.5 1'1'.6 38.9 88.7 - 85:t
Note: The victimization rate Is the annual - Too few cases to obtain statistically average of the number of victimizations for reliable da tao 1982-84 per t,OOO persons In each demo- -Includes data on fIlpe, (lot presented as a graphic (lategory. Detail may not Iidd to total because of rounding.
separa te ca tegory.
6 Teenage Victims
------~ ~~~--~-

-. Table 5. Place of occurrence of personal crimes, by age of victim and tyl?C of crime, 1982-84
Percent of victimizations that occurred: At or near On public
At friend's, In a transpor-or relatin's, restaurant, tation, in Ina In or At
Type of crime and near or neigh- commercial a parking street at another age of victim Total home bor's home building lot or park schOOl location
Crimes of violencea
12-15 years old 100% 14% 6% 4% 5% 34% 34% 3% 16-19 100 15 11 8 11 35 14 6 20 and older 100 27 8 15 11 30 2 8
Robbery 12-15 years old 100 13 - 4 7 48 24 -16-19 100 16 6 5 12 50 7 4 20 and older 100 23 4 9 15 44 1 5
Aggravated assault 12-15 years old 100 13 9 2 5 41 26 -16-19 100 14 12 7 13 38 9 7 20 and older 100 29 9 11 11 30 2 9
Simple assault 12-15 years old 100 14 5 4 4 28 41 3 16-19 100 15 12 10 10 28 19 6 20 and older 100 27 8 20 9 24 3 8
Crimes of thectb
12-15 years old 100% 2% 4% 3% 5% 83% 4% 16-19 100 9 12 20 10 42 7 20 and older 100 8 19 37 17 7 13
Note: Percentages may not total to 100 aIncludes da ta on rape, not presented as a crimes of theft, cannot occur at or near because of rounding. ~parate category. home, personal larcenies with contact that -Too few cases to obtain statistically ince by definition, personal larcenies occurred a t or near home have been re liable da tao without contact, which comprise almost all exclUded.
Teenage Victims 7
z
Table 6. Time ot occurrence of personal crimes, by age of victim and type of crime, I982-8ol
Percent of victimizations that occurred duri!:!!!:: Time not
Type of crime Daytime Nighttime known/not and age of victim Total 6 a.m.-6 p.m. 6 p.m.-6 a.m. ascerta lned
Crimes oC violence 12-15 years old 100% 76% 24% -16-19 100 42 58 -20 and older 100 43 57 •
Rape 12-15 years old 100 51 49 -16-19 100 30 70 -20 and older 100 34 66 -
Robbery 12-15 years old 100 73 27 -16-19 100 42 58 -20 and older 100 41 59 -
Aggravated assault 12-15 years old 100 73 27 -16-19 100 37 63 -20 and older 100 39 61 -
Simple assault 12-15 years old 100 78 21 -16-19 100 45 54 -20 Ilnd older 100 46 53 1
Crimes of tbeft 12-15 years old 100% 83% 8% 8% 16-19 lOO 57 32 11 20 and older 100 42 40 18
Personal larceny with contact
12-15 years old 100 81 17 -16-19 100 48 52 -20 and older 100 64 35 1
Personal larceny without contact
12-15 yesrs old 100 83 8 9 16-19 100 57 32 11 20 and older 100 41 40 19
Note: Percentages may not total to 100 -Too few cases to obtain statistically because of rounding. reliable da tao *Less than 0.5%.
Table 7. Presence oC weapon, by age of victim and type oC violent crime, 1982-84
Percent of victimizations Involving: Armed oHenders who used: .
Don't Other Combi- know/not
Type of crime Unarmed Gun Knife weapon nation Typo not ascertained and age of victim Total offenders Total only only only of weapons ascertained if armed
Crimes of violence. 12-15 years old 100% 69% 26% 4% 8% 12% 1% 1% 5% 16-19 100 57 37 10 11 13 2 1 5 20 and older 100 55 37 12 9 13 2 1 8
Robbery 12-15 years old 100 57 34 7 15 9 - - 9 16-19 100 39 52 19 19 10 4 - 9 20 and older 100 36 51 19 15 12 3 2 13
Aggravated and simple assault 12-15 years old 100 72 24 3 7 13 - 1 4 16-19 100 61 35 8 9 14 1 1 5 20 and older 100 59 34 10 8 13 2 1 7
Note: Percentages may not total to 100 - Too few cases to obtain statistically *Jncludes data on rape, not presented as a beeause of rounding. reliable data. separa te ea tegory.
8 Teenage Victims
•

p'
Table 8. Pet'cent dioItribution oC selC-protective measures used in violent crimes, by age oC victim, 1982-84
Age of victim 12-15 16-19 20 years
Self-protective measures ranked years years old and by seriousness. old old older
Total 100% 100% 100% Used or brandished a weapon - 3 6
Used or tried to use physical force 32 37 30
Tried to get help, scare offender away, argued or reasoned with offender 25 27 35 Resisted without force, including evasion 38 31 26
Other measures or measure not ascertained 4 2 4
Average annual number of victimizations Involving self-protection 554,790 814,590 3,319,390
Note: Percentages may not total to 100 ·Victims who reported more than one self-because of rounding. protective measure al'e tallied once in the -Too few cases to obtain statistically most serious category of measure used. reliable data.
Table 9. Percent dioItribution oC attacks, injuries In violent crimes, and medical care obtained, by age of victim, 1982-84
Age of victim 12-15 16-19 20 years years years old and
Crime characteristics Total old old older
Total 100% 100% 100% 100% Victim was:
Not attacked. 52% 44% 48% 54% Attacked 49% 56% 52% 46%
Not injured 18 22 19 16 Injured 31 34 33 30
Without medical care 16 19 18 15 With medical care 15 15 15 15
Note: Percentages may not total to 100 because of rounding. ·Includes attempted attacks with weapon.
Table 10. Percent distribution oC injured vict~(IIs, by seriousness oC injury and age of victim, 1982-84
Extent of injuries Extent not
Age of victim Total Serious Minor ascertained
12-15 years old 100% 11% 87% 2% 16-19 100 18 81 -20 and older 100 22 76 2
Note: Percentages may not total to 100 because of rounding. -Too few cases to obtain statistically reliable data.
Teenage Victims 9
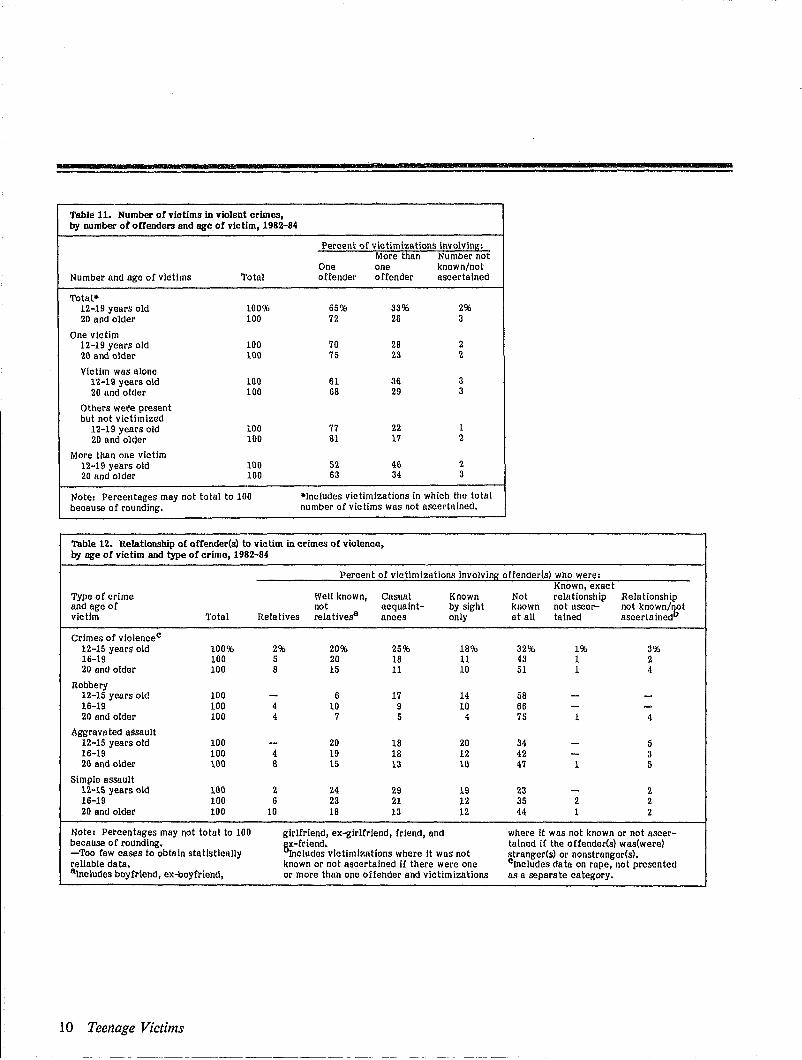
Table U. Number of victims in violent crimes, by number of offenders and age of victim, 1982-84
Percent of victimizations involving: More than Number not
One one known/not Number and age of victims Total offender offender ascertained
Total-12-19 years old 100% 65% 33% 2% 20 and older 100 72 26 3
One victim 12-19 years old 100 70 28 2 20 and older 100 75 23 2
Victim was alone 1'1.-19 yaers old 100 61 36 3 20 and older 100 68 29 3
Others were present but not victimized
12-19 years old 100 77 22 1 20 and older 100 81 17 2
More than one victim 12-19 years old 100 52 46 '2 20 and older 100 63 34 3
Note: Percentages may not total to 100 -Includes victimizations In which the total because of rounding. number of victims was not ascertained.
Table U. Relationship or oCCender(s) to victim in crimes of violence, by age of victim and type ot crime, 1982-84
Percent of victimizntions involving offender(s) who were: Known, exact
Type of crime Well known, Casual Known Not rela tionsh ip Rela tionsh ip and age of not acquaint- by sight known not ascer- not known/~t victim Total Relatives relativesa ances only at all talned ascertained
Crimes of vloiencec 12-15 years old 100% 2% 20% 25% 18% 32% 1% 3% 16-19 100 5 20 18 11 43 1 2 20 and older 100 8 15 11 10 51 1 4
Robbery 12-15 years old 100 - 6 17 14 58 - -16-19 100 4 10 9 10 66 - -20 and older 100 4 7 5 4 75 1 4
Aggrava ted assault 12-15 years old 100 - 20 18 20 34 - 5 16-19 100 4 19 18 12 42 - 3 20 and older 100 8 15 13 10 47 1 5
Simple assault 12-15 years old 100 2 24 29 19 23 - 2 16-19 100 6 23 21 12 35 2 2 20 and older 100 10 18 13 12 44 1 2
Note: Percentages may not total to 100 girlfriend, ex-girlfriend, friend, and where it was not known or not ascer-because of rounding. ~rriend. tained If the offender(s) was(were) -Too Cew cases to obtain statistically cludes victimizations where It was not stranger(s) or nonstranger(s). reliable data. known or not ascertained if there were one clncludes data on rape, not presented alncludes boyfriend, ex-boyfrlend, or more than one offender and victimizations as a separa te ca tegory.
10 Teenage Victims

-Table 13. Perceived sex oC offender(s), by sex and age oC victim and type oC violent crime, 1982-84
Percent of victimizations involvl!}g offender(s) who were: Male Sex not
Type of crime and age AU AU and known/not and sex of victim Total male female female ascertained
Male victims
Crimes of violence· 12-19 years old 100% 94% 2% 2% 2% 20 and older 100 89 5 4 3
Robbery 12-19 years old 100 96 - 3 -20 and older 100 90 3 4 3
Aggravated assault 12-19 years old 100 93 2 2 3 20 and older 100 85 6 5 4
Simple assault 12-19 years old 100 95 2 2 1 20 and older 100 90 5 3 2
Female victims
Crimes of violence· 12-19 years old 100 57 37 4 2 20 and older 100 78 15 4 2
Robbery 12-19 years old 100 74 19 - 2 20 and older 100 87 7 3 2
Aggravated assault 12-19 years old 100 62 30 6 -20 and older 100 76 14 5 4
Simple assault 12-19 years old 100 48 47 4 2 20 and older 100 74 21 4 2
Note: Percentages may not total to 100 because of rounding. -Too few cases to obtain statistically reliable data. ·Includes data on rape, not presented as 1\ separate category.
Teenage Victims 11

Table 14. Perceived race at ottender(s)/ by race and age ot victim, and type of violent crime, 1982-84
Percent of victimizations involvln~: Race not Type of crime All All All other Of enders known and race and white black race of differ~ not ascer-age of victIms Total offenders otfenders offenders ent races talned
White victims
Crim es at violence· 12-19 years old 100% 76% 15% 4% 3% 2% 20 and older 100 71 20 4 2. 4
Robbery 12~19 years old 100 49 38 5 6 -20 and older 100 41 46 5 4 4
Aggravated assault 12-19 years old 100 76 12 6 2 4 20 and older 100 75 15 3 2 5
Simple assault 12-19 years old 100 83 10 3 2 2 ao and older 100 79 14 3 1 3
Black victims
Crimes of violence· 12-19 years old 100 11 83 2 2. 3 20 and older 100 13 78 2. 3 5
Robbery 12-19 years old 100 8 86 - - -20 and older 100 9 80 - 4 6
Aggravated assault 12-19 years old 100 9 86 - - -20 and older 100 14 76 2 3 5
Simple assault 12-19 years old 100 14 79 - - -2.0 and older lOa 14 78 - - 4
Note: Percentages may not total to 100 because of rounding. -Too few cases to obtain statistically reliable data. • Includes data on rape, not presented as a separate category.
Table 15. Perceived age at otteoder(s), by age ot victim and type or violent crime, 1982-84
Percent of victimizations
Type of crime Involving: offender(s) who were:
All All Age not and age of under All All 21 and Mixed known/not victim Total 15 15-17 18-20 older ages ascertained
Crimes of violence. 12-15 years old 100% 32% 29% 7% 13% 16% 4% 16-19 100 1 20 24 35 16 4 20 and older 100 1 4 10 70 8 7
Robbery 12-15 years old 100 22 32 10 8 25 -16-19 100 - 13 23 30 27 7 20 and older 100 1 6 12 54 15 11
AggraVated assault 12-15 years old 100 29 21 6 16 20 8 16-19 100 - 17 23 38 17 4 20 and older 100 1 3 9 71 9 7
Simple assault 12-15 years old 100 37 30 6 11 12 3 16-19 100 - 24 25 33 13 4 20 and older 100 1 3 9 76 6 4
Note: Percentages may not total to 100 because of rounding. -Too few cases to obtain statistically reliable data • • lncludes data on rape, not presented as a separate category.
12 Teenage Victims
-
Table 16. Police reporting rates, by age of victim and type or crime, 1982-84
Percent of victimizations:
Reported Not Type oC crime to reported and age of Victim pollce to pollee
Crimea or violence 12~15 years old 31% 67% 16~19 41 58 20 and older 53 46
Rape 12-15 years old 74 -16-19 53 47 20 and older 48 51
Robbery 12-15 years old 34 64 16-19 46 54 20 and older 60 39
Aggrava ted assault 12-15 years old 41 57 16-19 48 50 20 and older 61 38
Simple assault 12-15 years old 25 74 16-19 34 65 20 and older 45 54
Crimes of theft 12-15 years old 9% 90% 16-19 19 79 20 and older 31 67
Note: Percentages may not total to 100 because of rounding and the exclusion from the table of percentages (2% or less) where police reporting was not known or not ascertained • -Too few cases to obtain statistica1ly reliable data.

Table 17. Most Important reallOn Cor reporting crimes to police Cor victims ages 12-19, 1982-84
Crimes Crimes Most of of Important reason violence theft
Total 100% 100%
Desire to recover property 6 60
In order to collect InsuranC'e - 6
To keep it from happening again or to others 31 11
To punish the offender 18 4 To stop or preven t
this incident 16 3 Because It was
n crime 5 5 Because it wns
victim's duty 3 2 Need for help due to
injurY 4 -Other' 17 9
Average annual number of victimizations reported t~poJjce by respondent 231,060 276,780
Note: Percentages may not total to 100 because of rounding. -Too few cases to obtain statistically rellable data. 'Includes respondents who repol'ted other reasons, those who cited the existence of evidence or proof as the most Important reason, those who said that no one reason was most Important, and those for whom I!. reason was not ascertained. "VIctimizations reported to police by someone other than the respondent are not InclUded.
Table 18. Most important reason Cor not reporting crimes to pollee, by age oC victim and type oC crime, 1982-84
Most important reason for not Crimes of violencea Crimes reporting, by age of victim Total Robbery Assault of theft
Total 12-15 years old 100% 100% 100% 100% 16-19 100% 100% 100% 100% 20 and older 100% 100% 100% 100%
Did not think it was important 12-15 years old 28 23 30 31 16-19 25 18 27 31 20 and older 18 10 20 28
Reported to someone else 12-15 years old 26 23 26 43 16-19 10 7 11 24 20 and older 8 4 9 11
Priva te, personal ma tter 12-15 years old 17 10 19 2 16-19 28 12 31 4 20 and older 29 17 32 4
Object recovered or offender unsuccessful
12-15 years old 2 9 - 2 16-19 3 11 2 3 20 and older 4 11 3 4
Didn't realize crime had happened until later
12-15 years old - - - 1 16-19 - - - 4 20 and older c - - 8
Property hard to recover 12-15 years old - - - 2 16-19 - - - 4 20 and older c 2 - 5
Lack of proof 12-15 years old 5 10 3 8 16-19 6 18 4 15 20 and older 8 18 6 18
Pollee wouldn't think it Important enough
12-15 years old 5 8 5 3 16-19 5 - 6 4 20 and older 5 6 5 6
Pollee would be inefficient, insensitive
12-15 years old 2 3 1 -16-19 2 8 1 1 20 and older 5 8 4 3
Too inconvenient 12-15 years old - - - 1 16-19 2 4 1 1 20 and older 3 3 2 3
Afraid of reprisal 12-15 years old 3 - 3 c 16-19 6 6 5 c 20 ~nd older 5 4 5 c
Other 12-15 years old 10 8 10 6 16-19 12 11 11 7 20 and older 14 15 13 10
Annual average number of victimizations not reported to police 12-15 years old 507,730 85,180 417,590 1,625,370 16-19 596,660 93,944 487,900 1,471,130 20 and older 1,996,908 347,582 1,593,598 7,415,525
Note: Percentages may not total to 100 blncludes respondents who reported other because of rounding. reasons, those who said no one reason was -Too few cases to obta in sta tistically (11ost important, and those for whom the reliable data. reason was not ascertained. aIncludes data on rape, not presented as a cLess than 0.5%. separa te ca tegory.
Teenage Victims 13
-Bureau of Justice Statistics reports (revised December 1986)
Call toll-free e00-732-3277 (local 251-5500) to order BJS reports, to be added to one of the BJS mailing lists, or to speak to a reference specialist In statistics at the Justice Statistics Clearinghouse, National Criminal Justice Reference Service, Box 6000, Rockville, MD 20850. Single copies of reports are free; use NCJ number to order. Postage and handling are charged for bulk orders of single reports. For single copies of multiple titles, up to 10 titles are free; 11-40 titles $10; more than 40, $20; libraries call for special rates,
Public-use tapes of BJS data sets and other criminal justice data are available from the Criminal Justice Archive and Information Network, P.O, Box 1248, Ann Arbor, MI48106 (313-763-5010),
National Crime Survey Criminal victimization In the U.S.:
1984 (ilnal report), NCJ·l00435, 5/86 1983 (Ilnal report), NCJ-96459, 10/85 1982 (final report), NCJ·92820, 11/84 1973·82 trends, NCJ'90541, 9/83 1980 (final report), NCJ·84015, 4/83 1979 (fInal report), NCJ-7671O, 12/81
BJS special reporls: Preventing domestic Violence against women,
NCJ.l02037,8/86 Crime prevention measures, NCJ'100438,3/86 The use 01 weapons In committing crimes,
NCJ·99643, 1/86 Reporting crimes to the police, NCJ·99432,
12/85 Locating city, suburban, and rural crime, NCJ·
99535, 12/85 The risk 01 vlolen! crime, NCJ'97119, 5/85 The economic cost ot crime to Victims, NCJ·
93450.4/84 Family viole nco, NC.J·93449. 4/84
BJS bullelins: Households touched by crime, 1985.
NCJ'101685,6/86 Criminal Victimization, 1984, NCJ.98904, 10/85 The crime of rape, NCJ·96777, 3/85 Household burglary, NCJ·96021. 1185 Criminal victimization, 1983, NCJ.93869, 6/84 Violent Chme by strangers, NCJ·80829, 4/82 Crime and the elderly, NCJ·79614, 1/82 Measuring crime, NCJ'75710, 2/81
Teenage vIctims, NCJ·103138, 12/86 Response to screening questions In the National
Crime Survey (BJS technical report), NCJ· 97624.7/85
VIctimIzation and tear ot crime: World perspectives, NCJ-93872, 1/85
The National Crime Survey: Working papers. vol. I: Current and histOrical perspectives, NCJ-75374,8/82 vol II: Methologlcal studies, NCJ·90307, 12/84
Issues In the measurement ot victimization, NCJ-74682, 10/81
The cost 01 negligence: Losses from preventable household burg lanes, NCJ·53527, 12/79
Rape vIctimIzation In 26 AmerIcan cities, NCJ.55878, 8/79
Criminal vIctimization in urban schools, NCJ-56396, 8/79
An Introduction to the National Crime Survey NCJ.43732, 4178 '
Local Victim surveys: A reView of the Issues. NCJ.39973, 8/77
Parole and probation BJS bulletins:
Probation and parole 1984, NCJ·l00181 2/86 •
Settln9 prison terms, NCH6218. 8/83 Parole In the U,S" 1980 and 1981, NCJ'87387
3/86 ' Characteristics of persons entering parole
during 1978 and 1979, NCJ.87243, 5/83 Characteristics of the parole population, 1978
NCJ.6S479.4/81 ' Parole In the U.S., 1979, NCJ'69562, 3/81
Corrections BJS bullelins and spec/al reporls:
Capital ~unlshment, 1985, NCJ'102742, 11/86 StatD and Federal prisoners, 1925'85,
NCJ'102494,11/86 Prisoners In 1985, NCJ·l01384, 6/86 Prison admission and releases, 1983,
NCJ.l00582.3/86 Capital punishment 1984, NCJ'98399, 8/85 Examining recidivism, NCJ·96501 , 2/85 RetUrning to prison, NCJ·95700. 11/84 Time served In prison, NCJ·939~4, 6/84
Historical corrections statistics In the U. S., 1850' 1984, NCJ·l02529. 12/86
Prisoners In State and Fedoral Institutions on Dec. 31, 1983, NCJ'99861, 6/86
Capital punishment 1984 (final), NCJ·99562. 5/86 Capital punishment 1983 (final), NCJ.99561. 4/86
1979 surveyo/ inmates 0/ State correctional/aclillies and 1979 censuS Of Slate correctional facilities: BJS special reports
The prevalence of Imprisonment, NCJ·93657, 7/85
Career patterns In crime, NCJ·88672. 6/83 BJS bulleltns:
Prisoners and drugs, NCJ·87575. 3/83 Prisoners and alcohol, NCJ·86223. 1/83 Prisons and prisoners, NCJ·80697, 2/82 Veterans In prl30n, NCJ"79232. 11/81
Census 0/ Jails and survey of Jail inmates Jail Inmates, 1984. NCJ·l01094, 5/86 Jail Inmates, 1983 (BJS bulletrn), NCJ'99175.
11185 The 1983 Jail census (BJS bullehn!. NCJ·95536.
11/84 Census of Jails, 1978: Data for IOdlvlduallnlls.
vols HV, Northeast. NOrlh Central. South. West, NCJ-72279·72282. 12/81
Profile ot Jail inmates, 1978, NCJ·654 1 2, 2/81
Children in custody: Public JUVenile facilities. 1985 fbullettnl
NCJ-l02457. 10/86 1982·83 census 01 juvenile detention and
correctional ta~lIlt1es. NCJ·l01686, 9/86
Expenditure and employment BJS Bulle/ms:
justice expenditure and employment: 1983, NCJ-l01776. 7186 1982, NCJ·98327. 8/85
Justice expenditure and employment in the U.S.: 1980 and 1981 extracts, NCJ,96007, 8/85 1971-79, NCJ-92596, 11/84
Courts BJS bulletms.
The 9rowth of appeals: 1973·83 trends, NCJ·96381.2/85
Case tilings In State courts 1983, NCJ·95111. 10/84
BJS speCial reports: Felony case-processing time, NCJ·l0 1985, 8/86 Felony sentencing In 18 local
jurisdictions, NCJ·97681. 6/85 The prevalence 01 guilty pleas, NCJ.96018,
12/84 Sentencing practices In 13 States, NCJ·95399.
10/84 Criminal defense systems: A national
survey, NCJ'94630, 8/84 Habeas corpus, NCJ'92948, 3/84 State court caseload statistics, 1977 and
1981, NCJ.87587. 2/83 National Criminal Defense Systems Study, NCJ·
94702, 10/86 The prosecution of telony arrests:
1981, NCJ.l01380. 9/86 1980, NCJ.97684. 10/85 1979, NCJ.86482, 5/84
State court model statistical dictionary, Supplement, NCJ.98326, 9/85 1 st edition, NCJ'62320, 9/80
State court organization 1980, NCJ'76711, 7/82 A crosll'clty comparison ot felony case
processing, NCJ.55171, 7179
Federal offenses and offenders BJS speCial reports:
Pretrial release and misconduct, NCJ.96132 lffl5 '
BJS bullelins: Bank robbery, NCJ.94463. 8/84 Federal drug law Violators, NCJ.92692, 2/84 Fedoral justice statistics, NCJ·80814, 3/82
*U.S, GOVERNMENT PRINTING OFFICE, 1986-181-478,40022
Privacy and security Computer crime: BJS speCial reports;
Electronic fund transter fraud, NCJ-96666, 3/85 Electronic tund transtor and crime,
NCJ·92650, 2/84 Electronic tund tronster traud, NCJ'100461,
4/86 Computer security techniques,
NCJ·84049, 9/82 Electronic fund transfer systems and crime,
NCJ·83736, 9/82 Expert witness manual, NCJ.77927. 9/81 Criminal justlco resource manual, NCJ·61550.
12179 Privacy and security of criminal history Information:
Compendium of State legislation, 1984 overview, NCJ·980n. 9/85
Criminal justice Information policy: Criminal justice "hot" tiles, NCJ·l0 1850. 12/86 Data quality pOlicies and procedures:
Proceedings of a BJS/SEARCH conference, NCJ·l01849,12/86
Crime control and criminal records (BJS special report!. NCJ·99176. 10185
State criminal records repositories (BJS technical report), NCJ-99017. 10!85
Data quality of criminal history records, NCJ· 98079. 10/85
Intelligence and InvestigatiYe records. NCJ·95787. 4/85
Vlctlmlwltness legislation: An overview, NCJ·94365. 12/84
Information policy and crime control strategies (SEARCH/BJS conference) NCJ·9;1926, 10/84
Research access to criminal jusllce data, NCJ·84154, 2183
Privacy and Juvenile justice records, NCJ'84152,1/83
Survey of State laws (BJS bullet",). NCJ·80836, 6/82
Privacy and the private employer, NCJ079651, 11/81
General BJS bulletms and spacial repOtts
BJS telephone contacts '87, NCJ.l02909 12186 Tracking offenders: White-collar crime,
NCJ·102867.11/86 Police employment and expenditure,
NCJ·l00117,2/86 Tracking offenders: The child vlcllm, NCJ-
95785. 12/84 The severity 01 crime, NCJ.92326. 1/84 The American response to crime: An overview
of criminal justice systems, NCJ.91936. 12/83 Tracking offenders, NCJ·91572, 11/83 Victim and witness assistance: New State
laws and the system's response, NCJ·87934, 5/83
1986 directory of automated criminal Justice Intormation systems, NCJ.l02260. 12/86, $20
Crime and Justice facts, 1985, NCJ·l00757, 5/86 National survey of crime seVerity, NCJ·96017.
10/85 Criminal victimization ot District ot Columbia
residents and Capitol HIli employees, 1982·83, NCJ-97982,Summary, NCJ.98567; 9I!l5
The DCcrlmevictlmlzation study implementation, NCJ·98595, 9/85, $7 60 domestlc/$9 20 Canadl' an/$12.80 foreign
The DC household victimization survey data base: Documentation, NCJ·98596. $6 40/$8.40/$11 User manual, NCJ·98597. $820/$980/$1280
How to 9aln access to BJS data (brOchure). BC-000022. 9/84
Proceedings of the 2nd workshop on law and Justice statistics, 1984, NCJ·93310, 8/84
Report to the nation on crime and justice: The data, NCJ·87068. 10/83
Dictionary ot criminal justice data termlnol09Y: 2nd ed, NCJ-76939. 2/82
Technical standards tor machine-readable data supplied to BJS, NCJ-75318, 6/81
See order form on last page
Please put me on the mailing list for:
o Justice expenditure and employment l"eports-annual spending and staffing by Federal/Sta te/local govern ments and by function (police, courts, etc.)
o o
o
o
Computer crime reports-electronic fund transfer system crimes
Privacy and security of criminal history information and information pollcy-new legislation; maintaining and releasing intelligence and investigative records; data quality issues
Federal statistics-data describing Federal case processingt from investigation through prosecution, adjudication, and corrections
BJS bulletins and special reports-timely reports of the most" current justice da ta
o Courts reports-Sta te court case load surveys, model annual state reports, state court organization surveys
o Corrections reports-results of sample SUl'veys and censuses of jails, prisons, parole, probation, and other corrections data
Name:
Title:
Organiza tion:
Street or box:
City, State, Zip:
Daytime telephone number: )
Interest in criminal justice:
u.s. Department of Justice Bureau of Justice statistics Washington, DC 20531
o o
National Crime Survey reports-the only regular national survey of crime victims
Sourcebook of Criminal Justice Statistics (annual)-broad-based data from 150+ sources (400+ tables, 100+ figures, index)
The National Institute of Justice/National Criminal Justice Reference Service (NCJRS) abstracts documents published in the criminal justice field. Persons registered with the Reference Service receive NIJ Reports every other month. It includes an order form for Bureau of Justice statistics publications. If you want an NCJRS registration form please check here: 0 To receive copies of l'ecent BJS reports, list titles and NCJ numbers here or check them on the reverse side of this sheet:
Place stamp here
Justice Statistics Clearinghouse/NCJRS U.S. Department of Justice User Services Department 2 Box 6000 Rockville, MD 20850