Embed Size (px)
Citation preview

TEENAGEPREGNANCY
ARIZONA, 2006-2016

~ Health and Wellness for all Arizonans ~
Doug A. Ducey, Governor State of Arizona
Cara M. Christ, M.D., M.S., Director Arizona Department of Health Services
ARIZONA DEPARTMENT OF HEALTH SERVICES BUREAU OF PUBLIC HEALTH STATISTICS
POPULATION HEALTH AND VITAL STATISTICS SECTION 150 North 18th Avenue, Suite 550
Phoenix, Arizona 85007 Phone: 602-542-7333; FAX: 602-542-2940
http://pub.azdhs.gov/health-stats
This publication can be made available in alternative format. Please contact the Bureau of Public Health Statistics
at 602-542-7333 (voice) or call 1-800-367-8939 (TDD).
The Arizona Department of Health Services is an Equal Employment Opportunity Agency.
Permission to quote from or reproduce materials from this publication is granted when due acknowledgment is made.

TEENAGE PREGNANCY, ARIZONA, 2006-2016
by
Marguerite L. Sagna, Ph.D., Arizona Vital Statistician Sanhita Gupta, Vital Statistics Health Management Analyst
Clare Torres, Senior Health Data Analyst
January 2018


TEENAGE PREGNANCY, ARIZONA, 2006-2016
Table of Contents
PURPOSE ...................................................................................................................................................................................... 1 METHODS AND SOURCES ............................................................................................................................................................. 1 DATA ORGANIZATION .................................................................................................................................................................. 1 COMPARATIVE NATIONAL AND STATE DATA ............................................................................................................................... 2 KEY FINDINGS ............................................................................................................................................................................. 2 DATA TABLES ............................................................................................................................................................................. 11
List of Figures
Figure 1 ................................................................................................................................................................................................. 3 PREGNANCY RATES BY AGE GROUP AND YEAR AMONG FEMALES 19 OR YOUNGER, ARIZONA, 2006-2016
Figure 2 ................................................................................................................................................................................................. 3 TRENDS IN THE NUMBER OF PREGNANCIES AND PREGNANCY RATES AMONG FEMALES 19 OR YOUNGER, ARIZONA, 2006-2016
Figure 3 ................................................................................................................................................................................................. 4 TRENDS IN THE NUMBER OF PREGNANCIES BY RACE/ETHNICITY AMONG FEMALES 19 OR YOUNGER, ARIZONA, 2006-2016
Figure 4 ................................................................................................................................................................................................. 4 COMPARISON OF PREGNANCY RATES BY YEAR AMONG HISPANIC OR LATINOS AND ALL FEMALES 19 OR YOUNGER, ARIZONA, 2006-2016
Figure 5 ................................................................................................................................................................................................. 5 COMPARISON OF PREGNANCY RATES BY YEAR AMONG WHITE NON-HISPANICS AND ALL FEMALES 19 OR YOUNGER, ARIZONA, 2006-2016
Figure 6 ................................................................................................................................................................................................. 5 COMPARISON OF PREGNANCY RATES BY YEAR AMONG AMERICAN INDIAN OR ALASKA NATIVES AND ALL FEMALES 19 OR YOUNGER, ARIZONA, 2006-2016
Figure 7 ................................................................................................................................................................................................. 6 COMPARISON OF PREGNANCY RATES BY YEAR AMONG BLACK OR AFRICAN AMERICANS AND ALL FEMALES 19 OR YOUNGER, ARIZONA, 2006-2016
Figure 8 ................................................................................................................................................................................................. 6 COMPARISON OF PREGNANCY RATES BY YEAR AMONG ASIAN OR PACIFIC ISLANDERS AND ALL FEMALES 19 OR YOUNGER, ARIZONA, 2006-2016
Figure 9 ................................................................................................................................................................................................. 7 PROPORTIONAL CONTRIBUTION OF SURGICAL AND NON-SURGICAL ABORTIONS BY YEAR AMONG FEMALES 19 OR YOUNGER, ARIZONA, 2006-2016
Figure 10 ............................................................................................................................................................................................... 7 CUMULATIVE NUMBER OF MOTHERS WHO WERE 19 OR YOUNGER IN ARIZONA BY YEAR, 2006-2016 2014Figure 11 ............................................................................................................................................................................................... 8 RATES OF FIRST AND REPEAT BIRTHS TO FEMALES 15-19 YEARS, ARIZONA, 2006 AND 2016
Figure 12 ............................................................................................................................................................................................... 8 BIRTHS TO MOTHERS 19 OR YOUNGER BY MARITAL STATUS, ARIZONA, 1996, 2006, AND 2016
Figure 13 ............................................................................................................................................................................................... 9 NUMBER OF BIRTHS TO MOTHERS 19 OR YOUNGER BY PAYER, ARIZONA, 2006 AND 2016
Figure 14 ............................................................................................................................................................................................... 9 TRENDS IN THE INCIDENCE OF SEXUALLY TRANSMITTED INFECTIONS AMONG FEMALES 15-19 YEARS, ARIZONA, 2006-2016
Figure 15 ............................................................................................................................................................................................. 10 BIRTH RATES FOR TEENAGERS 15-19 YEARS, NATIONALLY AND IN ARIZONA, 2006-2016
Figure 16 ............................................................................................................................................................................................. 10 BIRTH RATES FOR HISPANIC OR LATINO TEENAGERS 15-19 YEARS, NATIONALLY AND IN ARIZONA, 2006-2016
Teen Pregnancy, Arizona 2006-2016

List of Tables
Table 1 ................................................................................................................................................................................................. 12 PREGNANCIES AND PREGNANCY OUTCOME BY AGE GROUP AND YEAR, FEMALES 19 OR YOUNGER, ARIZONA, 2006-2016
Table 2 ................................................................................................................................................................................................. 13 PREGNANCY RATES BY PREGNANCY OUTCOME, AGE GROUP, AND YEAR, FEMALES 19 OR YOUNGER, ARIZONA, 2006-2016
Table 3 ................................................................................................................................................................................................. 14 LIVE BIRTHS TO FEMALES 19 OR YOUNGER BY AGE GROUP, RACE/ETHNICITY, AND YEAR, ARIZONA, 2006-2016
Table 4 ................................................................................................................................................................................................. 15 ABORTIONS TO FEMALES 19 OR YOUNGER BY AGE GROUP, RACE/ETHNICITY, AND YEAR, ARIZONA, 2006-2016
Table 5 ................................................................................................................................................................................................. 16 NUMBER OF PREGNANCIES BY PREGNANCY OUTCOME, RACE/ETHNICITY, AND YEAR AMONG FEMALES AGE 17 OR YOUNGER WITH RATES, ARIZONA, 2006-2016
Table 6 ................................................................................................................................................................................................. 17 NUMBER OF PREGNANCIES BY PREGNANCY OUTCOME, RACE/ETHNICITY, AND YEAR AMONG FEMALES 15-17 YEARS OLD WITH RATES, ARIZONA, 2006-2016
Table 7 ................................................................................................................................................................................................. 18 NUMBER OF PREGNANCIES BY PREGNANCY OUTCOME, RACE/ETHNICITY, AND YEAR AMONG FEMALES 18-19 YEARS OLD WITH RATES, ARIZONA, 2006-2016
Table 8 ................................................................................................................................................................................................. 19 NUMBER OF PREGNANCIES BY PREGNANCY OUTCOME, RACE/ETHNICITY, AND YEAR AMONG FEMALES 19 OR YOUNGER WITH RATES, ARIZONA, 2006-2016
Table 9 ................................................................................................................................................................................................. 20 TRENDS IN PREGNANCY RATES BY COUNTY OF RESIDENCE AMONG FEMALES 10-17 YEARS, 18-19 YEARS, AND 19 YEARS OR YOUNGER, ARIZONA, 2006-2016
Table 10 ............................................................................................................................................................................................... 21 LIVE BIRTHS TO FEMALES 19 OR YOUNGER AS A PERCENTAGE OF TOTAL LIVE BIRTHS BY AREA, RACE/ETHNICITY, AND YEAR, ARIZONA, 2006-2016
Table 11 ............................................................................................................................................................................................... 22 BIRTH RATES BY AGE GROUP FOR FEMALES 19 OR YOUNGER, ARIZONA AND UNITED STATES, 2006-2016
Table 12 ............................................................................................................................................................................................... 23 REPEAT PREGNANCIES AMONG TEENAGE MOTHERS GIVING BIRTH BY AGE AND YEAR, ARIZONA, 2006-2016
Table 13 ............................................................................................................................................................................................... 24 CUMULATIVE NUMBER OF MOTHERS WHO WERE 19 OR YOUNGER IN ARIZONA IN 2016
Table 14 ............................................................................................................................................................................................... 25 TRENDS IN TEEN PREGNANCY RATES BY RACE/ETHNICITY AND AGE GROUP, ARIZONA, 2006-2016
Table 15 ............................................................................................................................................................................................... 26 TRENDS IN SEXUALLY TRANSMITTED INFECTIONS BY AGE GROUP AND YEAR AMONG FEMALES 10-19 YEARS, ARIZONA, 2006-2016
Table 16 ............................................................................................................................................................................................... 27 TRENDS IN THE INCIDENCE RATES OF SEXUALLY TRANSMITTED INFECTIONS BY AGE GROUP AND YEAR AMONG FEMALES 10-19 YEARS, ARIZONA, 2006-2016
Table 17 ............................................................................................................................................................................................... 28 PREGNANCIES AND PREGNANCY RATES OF FEMALES 19 OR YOUNGER BY COUNTY OF RESIDENCE, ARIZONA, 2016
Table 18 ............................................................................................................................................................................................... 29 BIRTHS AND BIRTH RATES, FEMALES 19 OR YOUNGER BY COUNTY OF RESIDENCE, ARIZONA, 2016
Table 19 ............................................................................................................................................................................................... 30 PREGNANCY RATES AND NUMBER OF LIVE BIRTHS, FETAL DEATHS, AND ABORTIONS TO TEENS BY INDIVIDUAL AGE, ARIZONA, 2016
Table 20 ............................................................................................................................................................................................... 31 BIRTHS TO FEMALES 19 OR YOUNGER BY AGE AND COUNTY OF RESIDENCE, ARIZONA, 2016
Table 21 ............................................................................................................................................................................................... 32 ABORTIONS TO FEMALES 19 OR YOUNGER BY AGE AND COUNTY OF RESIDENCE, ARIZONA, 2016
Teen Pregnancy, Arizona 2006-2016 ii

List of Tables (continued) Table 22 ............................................................................................................................................................................................... 33 SOURCES OF PAYMENT FOR LABOR AND DELIVERY, FEMALES 19 OR YOUNGER BY AGE, AND COUNTY OF RESIDENCE, ARIZONA, 2016 Table 23 ............................................................................................................................................................................................... 34 SOURCES OF PAYMENT FOR LABOR AND DELIVERY, FEMALES 19 OR YOUNGER BY AGE GROUP, ARIZONA, 2016 Table 24 ............................................................................................................................................................................................... 35 TEENAGE BIRTHS BY NUMBER OF PREVIOUS PREGNANCIES BY AGE GROUP, ARIZONA, 2016 Table 25 ............................................................................................................................................................................................... 35 TEENAGE BIRTHS BY MARITAL STATUS AND AGE GROUP, ARIZONA, 2016 Table 26 ............................................................................................................................................................................................... 35 TEENAGE BIRTHS BY MOTHER’S EDUCATION AND AGE GROUP, ARIZONA, 2016 Table 27 ............................................................................................................................................................................................... 36 TEENAGE BIRTHS BY TRIMESTER OF ENTRY INTO PRENATAL CARE AND AGE GROUP, ARIZONA, 2016 Table 28 ............................................................................................................................................................................................... 36 TEENAGE BIRTHS BY NUMBER OF PRENATAL VISITS AND AGE GROUP, ARIZONA, 2016 Table 29 ............................................................................................................................................................................................... 37 TOBACCO AND/OR ALCOHOL USE DURING PREGNANCY AMONG FEMALES 19 OR YOUNGER BY AGE GROUP, ARIZONA, 2016 Table 30 ............................................................................................................................................................................................... 38 RISK FOR LOW-BIRTHWEIGHT (LBW) BIRTHS BY SELECTED CHARACTERISTICS OF FEMALES 19 OR YOUNGER, ARIZONA, 2016 Table 31 ............................................................................................................................................................................................... 39 POPULATION OF FEMALES 19 OR YOUNGER, NUMBER OF PREGNANCIES AND PREGNANCY RATES BY AGE GROUP, AND RACE/ETHNICITY, ARIZONA, 2016 Table 32 ............................................................................................................................................................................................... 40 POPULATION OF FEMALES 19 OR YOUNGER BY COUNTY OF RESIDENCE, ARIZONA, 2016 Appendix ............................................................................................................................................................................................. 41 HOW TO COMPUTE THE RATES OF FIRST AND REPEAT CHILDBEARING
Teen Pregnancy, Arizona 2006-2016 iii

PURPOSE
This report is the annual update of information about pregnancies among females under age 20. The data for 2016 is placed in a temporal context by comparing it with the data from the preceding years. Earlier reports are available online at http://pub.azdhs.gov/health-stats/report/tp/index.php.
METHODS AND SOURCES
In this report, pregnancies are measured as the sum of three components: live births, fetal deaths (or stillbirths), and reported abortions to Arizona resident women, unless otherwise specified. Not included are spontaneous fetal losses that occur at less than 20 weeks of gestation. Induced terminations of pregnancy do not include those performed out-of-state to Arizona residents, since they are not reported in Arizona. Pregnancy statistics for Arizona are not available on a sub-county level.
Teens are defined as 10-14 year old preadolescents and adolescents 15-19 years of age. Where possible, the data presented distinguishes 18-19 year old teenagers from those aged 15-17 and girls less than 15 years of age.
The primary source documents for the data are the certificates of live births, certificates of fetal deaths, and reports of induced terminations of pregnancy filed with the Arizona Department of Health Services.
The population denominators for Arizona's resident females used to calculate rates for 2003-2009 and 2011-2016 are population estimates of Arizona resident females aged 10-19 years. The 2010 denominators are the actual census enumerations from the U.S. Census Bureau. Detailed information about the assumptions and specific data sources is available online at http://pub.azdhs.gov/health-stats/menu/info/pop/index.php.
The 2016 Teenage Pregnancy report suppresses information in tables with small cell sizes. To protect the anonymity of the individuals included in this report, cells in tables with five or fewer observations are denoted by an asterisk (*), cells containing rates based on counts of five or fewer are denoted by a double-asterisk (**), and cells containing sums based on addends of five or fewer are rounded to the nearest tens-unit and denoted by a dagger (†).
DATA ORGANIZATION
Tables 1-14 present annual numbers and rates of pregnancy, fertility, and abortion by year from 2006 to 2016 for Arizona teens. Information is presented for specific age groups and by race/ethnicity. Temporal trends and changes may be assessed from this data. Proportional contribution of teen births to all births is shown in Table 10 by area of residence and race/ethnic group in Arizona from 2006 to 2016. Table 11 compares birth rates in Arizona to those in the United States. The annual numbers of repeat pregnancies among teenage mothers are shown by age and year from 2006 to 2016 in Table 12.
Table 14 presents teen pregnancy rates by race/ethnicity and age group by year from 2006 to 2016. Table 15 provides information about the incidence of sexually transmitted infections among females 10-14 and 15-19 years old in Arizona in 2006-2016. Table 16 shows the incidence rates by year from 2006 to 2016.
Frequency counts, proportions, and rates in Tables 17-32 all apply to the 2016 data. Tables 17-18 and 20-22 provide data by county of residence. Table 19 presents pregnancy rates by single year of age among females 19 and younger. Live births to teenage mothers are also reported in Tables 23-30 by source of payment for labor and delivery, previous pregnancies, marital status, education, trimester of entry into prenatal care, number of prenatal visits, tobacco use during pregnancy, and risk for low-birthweight by selected characteristics. The 2016 population denominators for Arizona resident females by age group and race/ethnicity, as well as by age group and county of residence, are presented in Table 31 and Table 32. The Appendix demonstrates “How to compute the rates of first and repeat childbearing” using the annual data for 2006-2016.
Teen Pregnancy, Arizona 2006-2016 1

COMPARATIVE NATIONAL AND STATE DATA
Timely, comparable, and reliable teen pregnancy statistics for other States and the Nation provide meaningful comparisons to place Arizona’s teenage birth experiences in context. The Center for Disease Control (CDC) provides a useful source of information on national pregnancy outcomes. The most recent national abortion data provided by the CDC available is for 20131 and the most recent fetal death data distributed by the CDC is available for 20142. Another source of national data on reproductive health is the Guttmacher Institute. The latest report3, published by the Institute in April 2016, covers statistics available on the incidence of teen pregnancy, birth and abortion in the United States for 2011, with trend analysis since 1973. The authors present the complete count of births provided by every state to the NCHS in combination with the estimated numbers of abortions, early miscarriages, and fetal deaths. The number of abortions is estimated from surveys the Alan Guttmacher Institute conducts of known abortion providers (i.e. these data are by the place of occurrence and not by the woman’s place of residence). The fetal loss estimates – including early miscarriages before 20 weeks of gestation (and estimated as 20% of live births plus 10% of abortions) - are from pregnancy history information collected by the National Survey of Family Growth (NSFG). Unlike vital statistics reports of fetal losses occurring at gestations of 20 weeks or more, NSFG include all gestations. Since the majority of fetal losses occur early in pregnancy before the reporting requirements for fetal deaths are in effect, their inclusion dramatically raises both the fetal loss rate and the pregnancy rate. The National Survey of Family Growth data are not state-specific. The pregnancy rates for Arizona teens cannot be compared with the rates for their peers nationally.
No comparable state-by-state teen pregnancy data for 2006 – 2016 are available at this time.
KEY FINDINGS
The following section presents some illustrative findings contained in the figures and tables of the report. It is not intended to be an exhaustive analysis of the tabulated data.
• In 2016, the pregnancy rate of 14.9 pregnancies per 1,000 females 19 years or younger was 56.2 percentlower than the rate of 34.1 per 1,000 in 2006. The teen pregnancy rate of 14.9 per 1,000 females 19 yearsor younger was the lowest teen pregnancy rate since at least 1983.
• It is only since 2008 that the reduction in the number of teen pregnancies was accompanied by an equallyimpressive decline in pregnancy rates.
• Historically, the declines in teenage pregnancy have been steeper for younger than for older teenagers, butrecently are becoming more closely aligned. The rate for teenagers 15-17 years dropped steeply by 67.7percent from 39.0 per 1,000 in 2006 to 12.6 in 2016. The rate for older teenagers (aged 18-19 years) fellby 52.4 percent from 115.6 per 1,000 in 2006 to 55.0 per 1,000 in 2016.
• The 2016 teen pregnancy rate of 14.9 per 1,000 was based on 6,724 pregnancies occurring among 450,084females aged 10-19 years. The number of 6,724 teen pregnancies in 2016 was 5.6 percent lower than 2015and was the lowest number of teen pregnancies since 1984.
• From 2007 to 2016, the number of teen pregnancies declined most among Hispanic or Latino teens (56.4percent), followed by declines among American Indians (57.2 percent), and White non-Hispanic teens(55.3 percent).
• In 2016, Hispanic or Latino females accounted for 55.4 percent of all pregnancies in this age group,followed by White non-Hispanics (27.3 percent).
• In each year from 2006 to 2016, the pregnancy rates of Hispanic or Latino females were consistentlygreater than the average rates for all females 19 years or younger in Arizona. In 2016, the Hispanic rateexceeded the average rate for all groups by 28.9 percent.
• If the 2016 “risk of pregnancy” for Asian teens (i.e., their pregnancy rate of 5.0 per 1,000), were to beapplied to all Arizona females 19 years or younger, it would reduce the number of Arizona teen pregnanciesfrom 6,724 to just 2,250 ((5.0 per 1,000) * 450,084).
• The first birth rate for childless teenagers has dropped 58.7 percent from 49.5 first-time births per 1,000females 15-19 years old in 2006 to 20.4 per 1,000 in 2016.
• The repeat birth rates for teenagers who had already had a child decreased by 30.1 percent from 202.1 in2006 to 141.2 per 1,000 females 15-19 years old in 2016, who had a previous birth.
• Unwed mothers have accounted for an increasing annual proportion of births throughout the 1990s and2000s. In 2016, non-marital births accounted for 89.7 percent of births to mothers 19 years or younger.
• The total number of births to mothers 19 years or younger decreased by 58.3 percent from 12,916 in 2006to 5,390 in 2016. In contrast, the proportional share of births paid for by the Arizona Health Care CostContainment System (AHCCCS, the State’s Medicaid program) increased from 79.9 percent in 2006 to 83.4percent in 2016.
------------------------------ 1https://www.cdc.gov/mmwr/volumes/65/ss/ss6512a1.htm 2https://www.cdc.gov/nchs/nvss/fetal_death.htm 3 https://www.guttmacher.org/report/us-teen-pregnancy-trends-2011
Teen Pregnancy, Arizona 2006-2016 2

KEY FINDINGS
Figure 1 Pregnancy Rates by Age Group and Year among
Females 19 or Younger, Arizona, 2006-2016
Note: All rates are per 1,000 females in specified group.
Teenage pregnancy rates dropped 56.2 percent overall from 2006 to 2016. (Figure 1, Table 2). The declines in teenage pregnancy have been much steeper for younger than for older teenagers. The rate for teenagers 15-17 years dropped steeply by 67.7 percent from 39.0 per 1,000 in 2006 to 12.6 in 2016. The rate for older teenagers (aged 18-19 years) fell by 52.4 percent from 115.6 per 1,000 in 2006 to 55.0 per 1,000 in 2016.
From 2007 to 2016, birth rate of teenagers 19 years old or younger declined; fetal losses rate fell and remained pretty stable at 0.1 per 1,000 females, while the abortion rate increased from 2010 to 2011 and returned to 3.4 per 1,000 females in 2012 then declined at 2.9 per 1,000 females in 2016(Table 2). The increase in the teenage abortion rate from 2010 to 2011 is likely attributable to changes in abortion reporting requirements that took effect in 2011.
Figure 2 Trends in the Number of Pregnancies and Pregnancy Rates
among Females 19 or Younger, Arizona, 2006-2016
Note: Pregnancy rate = the number of pregnancies per 1,000 females in specified group.
Trends in the number of pregnancies to teenage women do not always parallel the pregnancy rate. The teen pregnancy rate measures the proportion of teenagers becoming pregnant in a given year; in other words, the relative “risk for pregnancy” in a population “at risk.” The number of pregnancies is, however, also determined by the size of the population “at risk,”, or in this case by the number of teenage females in the population.
The 2016 teen pregnancy rate of 14.9 per 1,000 was based on 6,724 pregnancies occurring among 450,084 females aged 10-19 years. The number of 6,724 teen pregnancies in 2016 was 5.6 percent lower than 2015 and was the lowest number of teen pregnancies since 1984.
Teen Pregnancy, Arizona 2006-2016 3

KEY FINDINGS
The number of pregnancies to Hispanic females aged 19 years or younger exceeded the number of pregnancies among White non-Hispanic peers in every year since 1994 (Figure 3 and Table 8 in this report show only the data for 2006-2016). In 2016, Hispanic or Latino females accounted for 55.4 percent of all pregnancies in this age group, followed by White non-Hispanics (27.3 percent). Black or African American, Asian or Pacific Islander, and American Indian females aged 19 years or younger accounted for a larger share of pregnancies in 2016 (16.2 percent) than they did in 2006 (14.3 percent). From 2007 to 2016, the number of teen pregnancies declined particularly steeply for American Indians (57.2 percent), Hispanic or Latino (56.4 percent), and White non-Hispanic (55.3 percent).
Figure 3
Trends in the Number of Pregnancies* by Race/Ethnicity among Females 19 or Younger, Arizona, 2006-2016
Note: The sum of live births + induced abortions + spontaneous fetal deaths.
The teen pregnancy rates for all race and ethnic groups were lower in 2016 than in 2006 (Figure 1). However, the temporal trends in annual teen pregnancy rates differed considerably by race/ ethnicity. Figures 4, 5, 6, 7, and 8 reveal race/ ethnicity-specific trends in teen pregnancy rates in Arizona in 2006-2016. From 2006 to 2016, the teenage pregnancy rate for Hispanic or Latino women declined more than 50 percent (65.6 percent), with the majority of the decline occurring between 2007 and 2016 (Figure 4). In each year from 2006 to 2016, the pregnancy rates of Hispanic or Latino females were consistently greater than the average rates for all females 19 years or younger in Arizona. In 2016, the Hispanic rate exceeded the average rate for all groups by 29.5 percent.
Figure 4
Comparison of Pregnancy Rates by Year among Hispanic or Latinos and all Females 19 or Younger, Arizona, 2006-2016
Note: All rates are per 1,000 females in specified group.
Teen Pregnancy, Arizona 2006-2016 4

KEY FINDINGS
Figure 5 Comparison of Pregnancy Rates by Year among White non-Hispanics
and all Females 19 or Younger, Arizona, 2006-2016
Note: All rates are per 1,000 females in specified group.
The pregnancy rate for White non-Hispanics has substantially declined from 2006 to 2016 (49.7 percent) save for an increase from 2006 to 2008 (Figure 5). In each year from 2006 to 2016, the pregnancy rates for White non-Hispanic females were lower than the average rates for all females 19 years or younger in Arizona.
Figure 6
Comparison of Pregnancy Rates by Year among American Indian or Alaska Natives and all Females 19 or Younger, Arizona, 2006-2016
Note: All rates are per 1,000 females in specified group.
The pregnancy rate among American Indian females 19 years or younger varied somewhat erratically from 2006 to 2016, showing a 21.1 percent decrease from 2010 to 2011, a 15.1 percent increase from 2011 to 2012, a 35.4 decline from 2013 to 2014, an increase in 2015, then again a 7.8 decrease in 2016 (Figure 6). The American Indian teenage pregnancy rate was higher than the average for all groups from 2006 to 2016.
Teen Pregnancy, Arizona 2006-2016 5
KEY FINDINGS
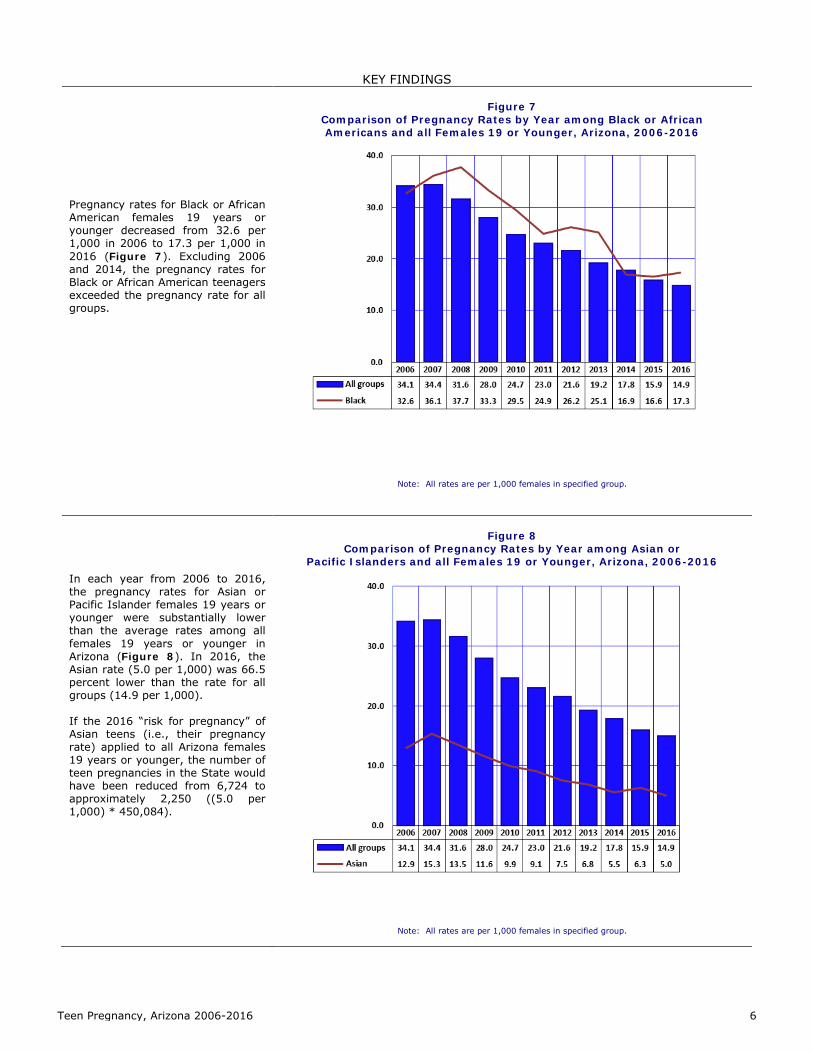
Pregnancy rates for Black or African American females 19 years or younger decreased from 32.6 per 1,000 in 2006 to 17.3 per 1,000 in 2016 (Figure 7). Excluding 2006 and 2014, the pregnancy rates for Black or African American teenagers exceeded the pregnancy rate for all groups.
Figure 7
Comparison of Pregnancy Rates by Year among Black or African Americans and all Females 19 or Younger, Arizona, 2006-2016
Note: All rates are per 1,000 females in specified group.
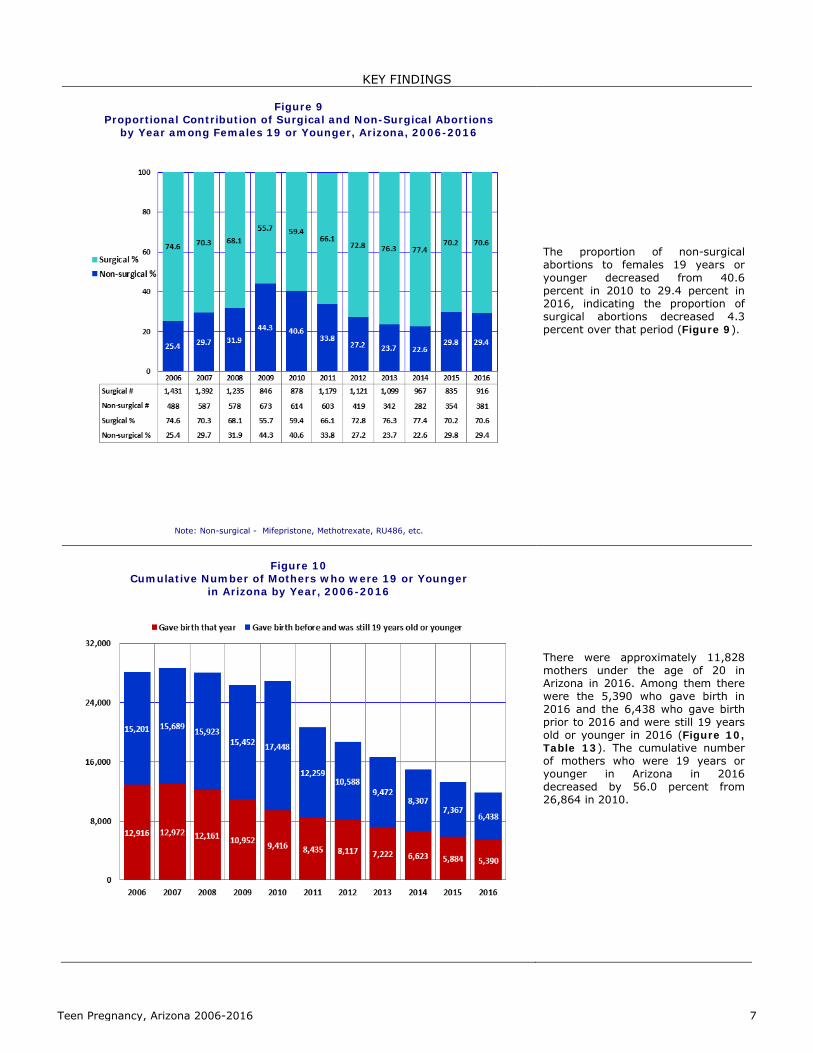
In each year from 2006 to 2016, the pregnancy rates for Asian or Pacific Islander females 19 years or younger were substantially lower than the average rates among all females 19 years or younger in Arizona (Figure 8). In 2016, the Asian rate (5.0 per 1,000) was 66.5 percent lower than the rate for all groups (14.9 per 1,000). If the 2016 “risk for pregnancy” of Asian teens (i.e., their pregnancy rate) applied to all Arizona females 19 years or younger, the number of teen pregnancies in the State would have been reduced from 6,724 to approximately 2,250 ((5.0 per 1,000) * 450,084).
Figure 8
Comparison of Pregnancy Rates by Year among Asian or Pacific Islanders and all Females 19 or Younger, Arizona, 2006-2016
Note: All rates are per 1,000 females in specified group.
Teen Pregnancy, Arizona 2006-2016 6
KEY FINDINGS
Figure 9 Proportional Contribution of Surgical and Non-Surgical Abortions
by Year among Females 19 or Younger, Arizona, 2006-2016
Note: Non-surgical - Mifepristone, Methotrexate, RU486, etc.
The proportion of non-surgical abortions to females 19 years or younger decreased from 40.6 percent in 2010 to 29.4 percent in 2016, indicating the proportion of surgical abortions decreased 4.3 percent over that period (Figure 9).
Figure 10
Cumulative Number of Mothers who were 19 or Younger in Arizona by Year, 2006-2016
There were approximately 11,828 mothers under the age of 20 in Arizona in 2016. Among them there were the 5,390 who gave birth in 2016 and the 6,438 who gave birth prior to 2016 and were still 19 years old or younger in 2016 (Figure 10, Table 13). The cumulative number of mothers who were 19 years or younger in Arizona in 2016 decreased by 56.0 percent from 26,864 in 2010.
Teen Pregnancy, Arizona 2006-2016 7

KEY FINDINGS
The first birth rate for childless teenagers has dropped 58.7 percent from 49.5 first-time births per 1,000 females 15-19 years old in 2006 to 20.4 per 1,000 in 2016 (Figure 12).
The repeat birth rates for teenagers who had already had a child decreased by 30.1 percent from 202.1 in 2006 to 141.2 per 1,000 females 15-19 years old in 2016 who had a previous birth (Figure 12).
Figure 11 Rates of First and Repeat Births to Females 15-19 Years,
Arizona, 2006 and 2016
Notes: * Number of first births per 1,000 females 15-19 years old who have not had a birth; ** Number of repeat births per 1,000 females 15-19 years old who have had a previous birth; See Appendix “How to compute rates of first and repeat childbearing.”
Unwed mothers have accounted for an increasing annual proportion of births throughout the 1990s and 2000s. Two decades ago, more than 7 out of 10 teenage mothers were unmarried (Figure 13). In 2016, non-marital births accounted for 89.7 percent of births to mothers 19 years or younger.
Figure 12 Births to Mothers 19 or Younger by Marital Status,
Arizona, 1996, 2006, and 2016
Teen Pregnancy, Arizona 2006-2016 8

KEY FINDINGS
Figure 13 Number of Births to Mothers 19 or Younger by Payer,
Arizona, 2006 and 2016
The total number of births to mothers 19 years or younger decreased by 58.3 percent from 12,916 in 2006 to 5,390 in 2016 (Table 1). In contrast, the proportional share of births paid for by the Arizona Health Care Cost Containment System (AHCCCS, the State’s Medicaid program) increased from 79.9 percent in 2006 to 83.4 percent in 2016 (Figure 13).
Figure 14 Trends in the Incidence of Sexually Transmitted Infections*
among Females 15-19 Years, Arizona, 2006-2016
Note: * The sum of annually reported cases of gonorrhea, chlamydia, and early syphilis. Source: Bureau of Epidemiology and Disease Control Services, Office of Infectious Disease Services.
In each year from 2007 to 2012, the total number of sexually transmitted infections (STI) among females aged 19 or younger exceeded 7,300, but fell to 6,723 in 2014, then increased to 6,872 in 2015, to 7,452 in 2016. (Table 15). Among females 15-19 years, the rate of 2016 was also higher than 2015, but 1.5 percent lower than the rate of 2006.
These STIs include chlamydia and syphilis. Chlamydia can cause sterility in the affected mother and eye infections and pneumonia in the newborn. Syphilis can cause blindness and maternal and/or infant death.
Teen Pregnancy, Arizona 2006-2016 9

KEY FINDINGS
In each year from 2006 to 2016, birth rates for Arizona teenagers 15-19 years old exceeded the rates of their national peers (Figure 15, Table 11).
In Arizona, Hispanic or Latino females 15-19 years old, a high-fertility group, accounted for 32.6 percent of females aged 15-19 years in 2016. A high proportional representation of Hispanic or Latino females in Arizona puts upward pressure on the overall teen birth rate.
Figure 15 Birth Rates for Teenagers 15-19 Years, Nationally and in Arizona,
2006-2016
Note: The number of births per 1,000 females 15-19 years old.
In 2016, Hispanics or Latino teens aged 15-19 years disproportionately accounted for 57.6 percent of births to mothers in this age group in Arizona (3,104 out of 5,390; see Table 6 and Table 7).
Historically the birth rates among Hispanic or Latino teenagers have been higher in Arizona than nationally.
Figure 16 Birth Rates for Hispanic or Latino Teenagers 15-19 Years, Nationally,
and in Arizona, 2006-2016
Notes: The number of births per 1,000 females 15-19 years old; the U.S. birth rate for Hispanic teens 15-19 years was not available at the time of the preparation of this report.
Teen Pregnancy, Arizona 2006-2016 10

TEENAGE PREGNANCY, ARIZONA, 2006-2016
DATA TABLES

Total, 15-19 years 15-17 years 18-19 years
ALL PREGNANCIES2006 14,918 242 14,676 5,105 9,5712007 15,038 325 14,713 4,975 9,7382008 14,047 230 13,817 4,740 9,0772009 12,537 156 12,381 3,945 8,4362010 10,980 150 10,830 3,363 7,4672011 10,269 150 10,119 2,939 7,1802012 9,710 116 9,594 2,860 6,7342013 8,715 91 8,624 2,385 6,2392014 7,924 68 7,856 2,125 5,7312015 7,121 66 7,055 1,887 5,1682016 6,724 85 6,639 1,707 4,932
LIVE BIRTHS2006 12,916 170 12,746 4,450 8,2962007 12,972 180 12,792 4,361 8,4312008 12,161 161 12,000 4,151 7,8492009 10,952 132 10,820 3,501 7,3192010 9,416 105 9,311 2,910 6,4012011 8,435 101 8,334 2,447 5,8872012 8,117 67 8,050 2,430 5,6202013 7,222 71 7,151 1,985 5,1662014 6,623 46 6,577 1,770 4,8072015 5,884 41 5,843 1,582 4,2612016 5,390 54 5,336 1,420 3,916
ABORTIONS2006 1,919 69 1,850 624 1,2262007 1,979 142 1,837 576 1,2612008 1,813 67 1,746 567 1,1792009 1,519 24 1,495 418 1,0772010 1,512 44 1,468 435 1,0332011 1,785 49 1,736 478 1,2582012 1,539 48 1,491 414 1,0772013 1,441 20 1,421 382 1,0392014 1,249 22 1,227 330 8972015 1,189 25 1,164 287 8772016 1,297 31 1,266 277 989
FETAL LOSSES2006 80† * 80 31 492007 90† * 84 38 462008 70† * 71 22 492009 66 0 66 26 402010 50† * 51 18 332011 49 0 49 14 352012 50† * 53 16 372013 52 0 52 18 342014 52 0 52 25 272015 48 0 48 18 302016 37 0 37 10 27
TABLE 1PREGNANCIES AND PREGNANCY OUTCOME BY AGE GROUP AND YEAR,
FEMALES 19 OR YOUNGER, ARIZONA, 2006-2016
Notes: * Cell suppressed due to non-zero count less than 6; † Sum rounded to nearest tens unit due to non-zero addend less than 6.
Pregnancy outcome by year
Total, females 19 years or younger 10-14 years
15-19 years old
Teen Pregnancy, Arizona 2006-2016 12

Total, 15-19 years 15-17 years 18-19 years
ALL PREGNANCIES2006 34.1 1.1 68.7 39.0 115.62007 34.4 1.5 68.4 36.9 121.42008 31.6 1.0 63.2 34.6 111.32009 28.0 0.7 56.1 28.5 102.52010 24.7 0.7 48.3 25.5 80.82011 23.0 0.7 44.8 22.1 77.22012 21.6 0.5 42.2 21.8 70.22013 19.2 0.4 37.7 18.0 64.82014 17.8 0.3 35.7 16.1 65.22015 15.9 0.3 31.8 14.1 58.42016 14.9 0.4 29.5 12.6 55.0
LIVE BIRTHS2006 29.6 0.8 59.6 34.0 100.22007 29.7 0.8 59.5 32.3 105.12008 27.4 0.7 54.9 30.3 96.32009 24.4 0.6 49.1 25.3 89.02010 21.2 0.5 41.5 22.1 69.22011 19.0 0.5 37.2 18.6 63.72012 18.0 0.3 35.4 18.5 58.62013 15.9 0.3 31.3 15.0 53.62014 14.9 0.2 29.9 13.4 54.72015 13.1 0.2 26.3 11.8 48.22016 12.0 0.2 23.7 10.5 43.7
ABORTIONS2006 4.4 0.3 8.7 4.8 14.82007 4.5 0.6 8.5 4.3 15.72008 4.1 0.3 8.0 4.1 14.52009 3.4 0.1 6.8 3.0 13.12010 3.4 0.2 6.5 3.3 11.22011 4.0 0.2 7.7 3.6 13.52012 3.4 0.2 6.6 3.1 11.22013 3.2 0.1 6.2 2.9 10.82014 2.8 0.1 5.6 2.5 10.22015 2.7 0.1 5.2 2.1 9.92016 2.9 0.1 5.6 2.0 11.0
FETAL LOSSES2006 0.2 ** 0.4 0.2 0.62007 0.2 ** 0.4 0.3 0.62008 0.2 ** 0.3 0.2 0.62009 0.2 0.0 0.3 0.2 0.52010 0.1 ** 0.2 0.1 0.42011 0.1 0.0 0.2 0.1 0.42012 0.1 ** 0.2 0.1 0.42013 0.1 0.0 0.2 0.1 0.42014 0.1 0.0 0.2 0.2 0.32015 0.1 0.0 0.2 0.1 0.32016 0.1 0.0 0.2 0.1 0.3
Notes: ** Cell suppressed due to rate/ratio/percent based on non-zero count less than 6; a The number of pregnancies (live births + abortions + fetal deaths) per 1,000 females in specified age group; 0.0: Quantity more than zero but less than 0.05.
TABLE 2PREGNANCY RATESa BY PREGNANCY OUTCOME, AGE GROUP, AND YEAR,
FEMALES 19 OR YOUNGER, ARIZONA, 2006-2016
Pregnancy outcome by year
Total, females 19 years or younger 10-14 years
15-19 years old
Teen Pregnancy, Arizona 2006-2016 13

Total, 15-19 years 15-17 years 18-19 years
2006 3,209 19 3,190 852 2,3382007 3,100 26 3,074 779 2,2952008 2,993 15 2,978 769 2,2092009 2,715 20 2,695 649 2,0462010 2,386 12 2,374 541 1,8332011 2,089 13 2,076 494 1,5822012 1,977 8 1,969 475 1,4942013 1,781 8 1,773 365 1,4082014 1,757 8 1,749 344 1,4052015 1,530† * 1,526 339 1,1872016 1,347 8 1,339 283 1,056
2006 7,738 123 7,615 2,923 4,6922007 7,782 115 7,667 2,892 4,7752008 7,168 111 7,057 2,724 4,3332009 6,341 87 6,254 2,253 4,0012010 5,348 68 5,280 1,859 3,4212011 4,631 61 4,570 1,467 3,1032012 4,627 46 4,581 1,528 3,0532013 4,080 47 4,033 1,244 2,7892014 3,813 23 3,790 1,115 2,6752015 3,409 28 3,381 972 2,4092016 3,136 32 3,104 877 2,227
2006 601 7 594 187 4072007 621 12 609 195 4142008 656 12 644 203 4412009 603 6 597 181 4162010 562 10 552 151 4012011 561 10 551 152 3992012 540† * 539 159 3802013 507 6 501 122 3792014 390† * 389 102 2872015 310† * 311 77 2342016 320† * 313 81 232
2006 1,216 19 1,197 430 7672007 1,285 26 1,259 445 8142008 1,185 22 1,163 408 7552009 1,170 17 1,153 394 7592010 988 14 974 331 6432011 987 14 973 293 6802012 890 7 883 251 6322013 775 8 767 243 5242014 602 9 593 196 3972015 569 7 562 177 3852016 540 11 529 167 362
2006 90† * 91 28 632007 103 0 103 31 722008 110† * 112 26 862009 90† * 86 18 682010 100† * 102 23 792011 110† * 109 26 832012 80† * 78 17 612013 80† * 77 11 662014 60† * 56 13 432015 63 0 63 17 462016 51 0 51 12 39
TABLE 3LIVE BIRTHS TO FEMALES 19 OR YOUNGER BY AGE GROUP, RACE/ETHNICITY,
AND YEAR, ARIZONA, 2006-2016
10-14 years15-19 years old
WHITE NON-HISPANIC
HISPANIC OR LATINO
Racial/ethnic group and year
Total, females 19 years or younger
Notes: * Cell suppressed due to non-zero count less than 6; † Sum rounded to nearest tens unit due to non-zero addend less than 6.
BLACK OR AFRICAN AMERICAN
AMERICAN INDIAN OR ALASKA NATIVE
ASIAN OR PACIFIC ISLANDER
Teen Pregnancy, Arizona 2006-2016 14

Total, 15-19 years 15-17 years 18-19 years
2006 917 28 889 296 5932007 982 71 911 282 6292008 841 21 820 266 5542009 720 11 709 207 5022010 694 16 678 198 4802011 289 10 279 80 1992012 238 6 232 65 1672013 257 6 251 66 1852014 488 7 481 133 3482015 488 6 482 111 3712016 476 11 465 96 369
2006 609 24 585 193 3922007 710 44 666 210 4562008 561 34 527 173 3542009 525 8 517 136 3812010 532 16 516 151 3652011 638 17 621 179 4422012 441 12 429 138 2912013 509 6 503 136 3672014 531 7 524 134 3902015 467 13 454 118 3362016 564 8 556 131 425
2006 124 9 115 48 672007 136 13 123 42 812008 140† * 138 43 952009 110† * 107 28 792010 70† * 66 24 422011 17 0 20† * 132012 10† * 10† 6 *2013 20† * 22 8 142014 90† * 88 34 542015 90† * 83 25 582016 110† * 109 23 86
2006 60† * 54 24 302007 63 8 55 22 332008 50† * 52 17 352009 52 0 52 22 302010 40† * 34 13 212011 10† 0 10† * *2012 0† 0 0† * *2013 8 0 10† * *2014 30† * 20† * 182015 50† * 47 13 342016 40† * 36 11 25
2006 40† * 37 11 262007 60† * 59 8 512008 40† * 34 12 222009 40† * 39 8 312010 14 0 10† * 92011 10† * 0† 0 *2012 9 0 10† * 72013 0† 0 0† * *2014 40† * 34 10 242015 28 0 30† * 252016 30† * 30† * 22
TABLE 4ABORTIONS TO FEMALES 19 OR YOUNGER BY AGE GROUP, RACE/ETHNICITY,
AND YEAR, ARIZONA, 2006-2016
10-14 years15-19 years old
WHITE NON-HISPANIC
HISPANIC OR LATINO
Racial/ethnic group and year
Total, females 19 years or younger
Notes: * Cell suppressed due to non-zero count less than 6; † Sum rounded to nearest tens unit due to non-zero addend less than 6.
BLACK OR AFRICAN AMERICAN
AMERICAN INDIAN OR ALASKA NATIVE
ASIAN OR PACIFIC ISLANDER
Teen Pregnancy, Arizona 2006-2016 15

WH
ITEc
NO
N-H
ISP
AN
IC,
tota
l:1,
204
1,16
51,
074
894
770
600
564
448
496
462
401
2.6
Bir
ths
871
805
784
669
553
507
483
373
352
344
291
1.9
Abo
rtio
ns32
435
328
721
821
490
7172
140
117
107
0.7
HIS
PA
NIC
OR
LA
TIN
O,
tota
l:3,
281
3,28
63,
057
2,49
62,
106
1,73
11,
728
1,44
31,
292
1,14
41,
055
6.8
Bir
ths
3,04
63,
007
2,83
52,
340
1,92
71,
528
1,57
41,
291
1,13
81,
000
909
5.8
Abo
rtio
ns21
725
420
714
416
719
615
014
214
113
113
90
.9
BLA
CK
OR
AFR
ICA
N
AM
ERIC
AN
, to
tal:
255
268
266
221
189
170†
174
140
145
106
111
5.6
Bir
ths
194
207
215
187
161
162
164
128
107
7884
4.2
Abo
rtio
ns57
5548
3125
*9
936
2727
1.4
AM
ERIC
AN
IN
DIA
N O
R
ALA
SK
A N
ATI
VE,
tot
al:
477
504
452
436
361
310†
260†
260†
217
204
191
10
.2
Bir
ths
449
471
430
411
345
307
258
251
205
184
178
9.5
Abo
rtio
ns25
3019
2215
**
*7
1713
0.7
AS
IAN
OR
PA
CIF
IC
ISLA
ND
ER,
tota
l:43
4341
3030
†30
†20
†20
†25
20†
20†
1.3
Bir
ths
2931
2720
2428
1813
1417
121
.0
Abo
rtio
ns14
1214
9*
**
*11
**
**
ALL
RA
CIA
L/ET
HN
IC
GR
OU
PS
d, to
tal:
5,34
75,
300
4,97
04,
101
3,51
33,
089
2,97
62,
476
2,19
31,
953
1,79
25
.0
Bir
ths
4,62
04,
541
4,31
23,
633
3,01
52,
548
2,49
72,
056
1,81
61,
623
1,47
44
.1
Abo
rtio
ns69
371
863
444
247
952
746
340
235
231
230
80
.9
Pre
gn
ancy
rat
e, t
otal
:1
5.1
14
.81
3.7
11
.21
0.0
8.7
8.4
6.9
6.1
5.4
5.0
Fert
ilit
y ra
tee
13
.01
2.7
11
.99
.98
.67
.27
.15
.85
.14
.54
.1A
bor
tion
rat
e2
.02
.01
.71
.21
.41
.51
.31
.11
.00
.90
.9
TAB
LE 5
NU
MB
ER
OF
PR
EG
NA
NC
IES
a B
Y P
RE
GN
AN
CY
OU
TCO
ME
, R
AC
E/
ETH
NIC
ITY
, A
ND
YE
AR
AM
ON
G F
EM
ALE
S A
GE
D 1
7 A
ND
YO
UN
GE
R
WIT
H R
ATE
Sb,
AR
IZO
NA
, 2
00
6-2
01
6
20
07
20
08
20
09
20
16
20
16
R
ates
Not
es:
* Cel
l sup
pres
sed
due
to n
on-z
ero
coun
t le
ss t
han
6; *
* Cel
l sup
pres
sed
due
to r
ate/
ratio
/per
cent
bas
ed o
n no
n-ze
ro c
ount
less
tha
n 6;
† Sum
rou
nded
to
near
est
tens
uni
t du
e to
non
-ze
ro a
dden
d le
ss t
han
6; a
Feta
l dea
ths
are
incl
uded
in t
he t
otal
cou
nts
of p
regn
anci
es;
b All
rate
s pe
r 1,
000
fem
ales
10-
17 y
ears
old
; c N
ot o
f H
ispa
nic
orig
in;
d In
clud
es o
ther
and
uns
peci
fied
ethn
icity
; e N
umbe
r of
birth
s pe
r 1,
000
fem
ales
10-
17 y
ears
old
.
20
10
20
11
20
12
20
13
20
14
20
15
Rac
e/et
hn
icit
y
P
reg
nan
cy o
utc
ome
20
06
Teen Pregnancy, Arizona 2006-2016 16

WH
ITEc
NO
N-H
ISP
AN
IC,
tota
l:1,
157
1,06
71,
038
863
742
577
549
434
481
451
382
6.5
Bir
ths
852
779
769
649
541
494
475
365
344
339
283
4.8
Abo
rtio
ns29
628
226
620
719
880
6566
133
111
961
.6
HIS
PA
NIC
OR
LA
TIN
O,
tota
l:3,
131
3,12
62,
911
2,40
12,
021
1,65
31,
670
1,39
01,
262
1,10
31,
015
17
.6
Bir
ths
2,92
32,
892
2,72
42,
253
1,85
91,
467
1,52
81,
244
1,11
597
287
71
5.2
Abo
rtio
ns19
321
017
313
615
117
913
813
613
411
813
12
.3
BLA
CK
OR
AFR
ICA
N
AM
ERIC
AN
, to
tal:
239
242
248
212
178
160†
166
133
138
103
104
14
.0
Bir
ths
187
195
203
181
151
152
159
122
102
7781
10
.9
Abo
rtio
ns48
4243
2824
*6
834
2523
3.1
AM
ERIC
AN
IN
DIA
N O
R
ALA
SK
A N
ATI
VE,
tot
al:
457
470
428
419
345
300†
250†
250†
210†
193
178
24
.8
Bir
ths
430
445
408
394
331
293
251
243
196
177
167
23
.2
Abo
rtio
ns24
2217
2213
**
**
1311
1.5
AS
IAN
OR
PA
CIF
IC
ISLA
ND
ER,
tota
l:39
3938
30†
30†
2620
†10
†23
20†
20†
3.4
Bir
ths
2831
2618
2326
1711
1317
122
.7
Abo
rtio
ns11
812
**
0*
*10
**
**
ALL
RA
CIA
L/ET
HN
IC
GR
OU
PS
d,
tota
l:5,
105
4,97
54,
740
3,94
53,
363
2,93
92,
860
2,38
52,
125
1,88
71,
707
12
.6
Bir
ths
4,45
04,
361
4,15
13,
501
2,91
02,
447
2,43
01,
985
1,77
01,
582
1,42
01
0.5
Abo
rtio
ns62
457
656
741
843
547
841
438
233
028
727
72
.0
Pre
gn
ancy
rat
e, t
otal
:3
9.0
36
.93
4.6
28
.52
5.5
22
.12
1.8
18
.01
6.1
14
.11
2.6
Fert
ilit
y ra
tee
34
.03
2.3
30
.32
5.3
22
.11
8.4
18
.51
5.0
13
.41
1.8
10
.5A
bor
tion
rat
e4
.84
.34
.13
.03
.33
.63
.12
.92
.52
.12
.0
TAB
LE 6
NU
MB
ER
OF
PR
EG
NA
NC
IES
a B
Y P
RE
GN
AN
CY
OU
TCO
ME
, R
AC
E/
ETH
NIC
ITY
, A
ND
YE
AR
AM
ON
G F
EM
ALE
S 1
5-1
7 Y
EA
RS
OLD
WIT
H R
ATE
Sb,
AR
IZO
NA
, 2
00
6-2
01
6
20
07
20
08
20
09
20
16
20
16
R
ates
Not
es:
* Cel
l sup
pres
sed
due
to n
on-z
ero
coun
t le
ss t
han
6; *
* Cel
l sup
pres
sed
due
to r
ate/
ratio
/per
cent
bas
ed o
n no
n-ze
ro c
ount
less
tha
n 6;
† Sum
rou
nded
to
near
est
tens
uni
t du
e to
non
-ze
ro a
dden
d le
ss t
han
6; a
Feta
l dea
ths
are
incl
uded
in t
he t
otal
cou
nts
of p
regn
anci
es;
b All
rate
s pe
r 1,
000
fem
ales
15-
17 y
ears
old
; c N
ot o
f H
ispa
nic
orig
in;
d In
clud
es o
ther
and
uns
peci
fied
ethn
icity
; e N
umbe
r of
birth
s pe
r 1,
000
fem
ales
15-
17 y
ears
old
.
20
10
20
11
20
12
20
13
20
14
20
15
Rac
e/et
hn
icit
y
Pre
gn
ancy
ou
tcom
e2
00
6
Teen Pregnancy, Arizona 2006-2016 17

WH
ITEc
NO
N-H
ISP
AN
IC,
tota
l:2,
944
2,93
62,
778
2,56
02,
316
1,79
21,
675
1,60
21,
759
1,56
21,
433
36
.4
Bir
ths
2,33
82,
295
2,20
92,
046
1,83
31,
582
1,49
41,
408
1,40
51,
187
1,05
62
6.8
Abo
rtio
ns59
362
955
450
248
019
916
718
534
837
136
99
.4
HIS
PA
NIC
OR
LA
TIN
O,
tota
l:5,
115
5,25
94,
707
4,40
03,
812
3,56
63,
357
3,17
53,
078
2,76
42,
668
71
.5
Bir
ths
4,69
24,
775
4,33
34,
001
3,42
13,
103
3,05
32,
789
2,67
52,
409
2,22
75
9.7
Abo
rtio
ns39
245
635
438
136
544
229
136
739
033
642
51
1.4
BLA
CK
OR
AFR
ICA
N
AM
ERIC
AN
, to
tal:
476
498
546
501
446
413
390†
397
345
294
320
63
.5
Bir
ths
407
414
441
416
401
399
380
379
287
234
232
46
.0
Abo
rtio
ns67
8195
7942
13*
1454
5886
17
.1
AM
ERIC
AN
IN
DIA
N O
R
ALA
SK
A N
ATI
VE,
tot
al:
800
849
794
793
664
690†
640†
530†
417
423
388
83
.9
Bir
ths
767
814
755
759
643
680
632
524
397
385
362
78
.3
Abo
rtio
ns30
3335
3021
**
*18
3425
5.4
AS
IAN
OR
PA
CIF
IC
ISLA
ND
ER,
tota
l:89
124
108
9988
90†
6870
†67
7261
19
.0
Bir
ths
6372
8668
7983
6166
4346
391
2.1
Abo
rtio
ns26
5122
319
*7
*24
2522
6.8
ALL
RA
CIA
L/ET
HN
IC
GR
OU
PS
d,
tota
l:9,
571
9,73
89,
077
8,43
67,
467
7,18
06,
734
6,23
95,
731
5,16
84,
932
55
.0
Bir
ths
8,29
68,
431
7,84
97,
319
6,40
15,
887
5,62
05,
166
4,80
74,
261
3,91
64
3.7
Abo
rtio
ns1,
226
1,26
11,
179
1,07
71,
033
1,25
81,
077
1,03
989
787
798
91
1.0
Pre
gn
ancy
rat
e, t
otal
:1
15
.61
21
.41
11
.31
02
.58
0.8
77
.27
0.2
64
.86
5.2
58
.45
5.0
Fert
ilit
y ra
tee
10
0.2
10
5.1
96
.38
9.0
69
.26
3.3
58
.65
3.6
54
.74
8.2
43
.7A
bor
tion
rat
e1
4.8
15
.71
4.5
13
.11
1.2
13
.51
1.2
10
.81
0.2
9.9
11
.0
TAB
LE 7
NU
MB
ER
OF
PR
EG
NA
NC
IES
a B
Y P
RE
GN
AN
CY
OU
TCO
ME
, R
AC
E/
ETH
NIC
ITY
, A
ND
YE
AR
AM
ON
G F
EM
ALE
S 1
8-1
9 Y
EA
RS
OLD
WIT
H R
ATE
Sb,
AR
IZO
NA
, 2
00
6-2
01
6
20
06
20
07
20
08
20
09
20
16
20
16
R
ates
Not
es:
* Cel
l sup
pres
sed
due
to n
on-z
ero
coun
t le
ss t
han
6; †
Sum
rou
nded
to
near
est
tens
uni
t du
e to
non
-zer
o ad
dend
less
tha
n 6;
a Fe
tal d
eath
s ar
e in
clud
ed in
the
tot
al c
ount
s of
pr
egna
ncie
s; b
All
rate
s pe
r 1,
000
fem
ales
18-
19 y
ears
old
; c N
ot o
f H
ispa
nic
orig
in;
d In
clud
es o
ther
and
uns
peci
fied
ethn
icity
; e N
umbe
r of
birth
s pe
r 1,
000
fem
ales
18-
19 y
ears
old
.
20
10
20
11
20
12
20
13
20
14
20
15
Rac
e/et
hn
icit
y
Pre
gn
ancy
ou
tcom
e
Teen Pregnancy, Arizona 2006-2016 18

WH
ITEc
NO
N-H
ISP
AN
IC,
tota
l:4,
148
4,10
13,
852
3,45
43,
086
2,39
22,
239
2,05
02,
255
2,02
41,
834
9.5
Bir
ths
3,20
93,
100
2,99
32,
715
2,38
62,
089
1,97
71,
781
1,75
71,
531
1,34
77
.0
Abo
rtio
ns91
798
284
172
069
428
923
825
748
848
847
62
.5
HIS
PA
NIC
OR
LA
TIN
O,
tota
l:8,
396
8,54
57,
764
6,89
65,
918
5,29
75,
085
4,61
84,
370
3,90
83,
723
19
.3
Bir
ths
7,73
87,
782
7,16
86,
341
5,34
84,
631
4,62
74,
080
3,81
33,
409
3,13
61
6.2
Abo
rtio
ns60
971
056
152
553
263
844
150
953
146
756
42
.9
BLA
CK
OR
AFR
ICA
N
AM
ERIC
AN
, to
tal:
731
766
812
722
635
580
562
537
490
400
431
17
.3
Bir
ths
601
621
656
603
562
561
544
507
394
312
316
12
.7
Abo
rtio
ns12
413
614
311
067
1714
2390
8511
34
.5
AM
ERIC
AN
IN
DIA
N O
R
ALA
SK
A N
ATI
VE,
tot
al:
1,27
71,
353
1,24
61,
229
1,02
51,
000†
900†
787
634
627
579
24
.7
Bir
ths
1,21
61,
285
1,18
51,
170
988
987
890
775
602
569
540
23
.1
Abo
rtio
ns55
6354
5236
**
825
5138
1.6
AS
IAN
OR
PA
CIF
IC
ISLA
ND
ER,
tota
l:13
216
714
912
911
712
0†88
80†
9292
775
.0
Bir
ths
9210
311
388
103
111
7979
5763
513
.3
Abo
rtio
ns40
6336
4014
*9
*35
2826
1.7
ALL
RA
CIA
L/ET
HN
IC
GR
OU
PS
d,
tota
l:14
,918
15,0
3814
,047
12,5
3710
,980
10,2
699,
710
8,71
57,
924
7,12
16,
724
14
.9
Bir
ths
12,9
1612
,972
12,1
6110
,952
9,41
68,
435
8,11
77,
222
6,62
35,
884
5,39
01
2.0
Abo
rtio
ns1,
919
1,97
91,
813
1,51
91,
512
1,78
51,
539
1,44
11,
249
1,18
91,
297
2.9
Pre
gn
ancy
rat
e, t
otal
:3
4.1
34
.43
1.6
28
.02
4.7
23
.02
1.6
19
.21
7.8
15
.91
4.9
Fert
ilit
y ra
tee
29
.62
9.7
27
.42
4.4
21
.21
8.9
18
.01
5.9
14
.91
3.1
12
.0A
bor
tion
rat
e4
.44
.54
.13
.43
.44
.03
.43
.22
.82
.72
.9
TAB
LE 8
NU
MB
ER
OF
PR
EG
NA
NC
IES
a B
Y P
RE
GN
AN
CY
OU
TCO
ME
, R
AC
E/
ETH
NIC
ITY
, A
ND
YE
AR
AM
ON
G F
EM
ALE
S 1
9 A
ND
YO
UN
GE
R,
WIT
H R
ATE
Sb,
AR
IZO
NA
, 2
00
6-2
01
6
20
08
20
09
20
16
20
16
R
ates
Not
es:
* Cel
l sup
pres
sed
due
to n
on-z
ero
coun
t le
ss t
han
6; †
Sum
rou
nded
to
near
est
tens
uni
t du
e to
non
-zer
o ad
dend
less
tha
n 6;
a Fe
tal d
eath
s ar
e in
clud
ed in
the
tot
al c
ount
s of
pr
egna
ncie
s; b
All
rate
s pe
r 1,
000
fem
ales
19
or y
oung
er;
c N
ot o
f H
ispa
nic
orig
in;
d In
clud
es o
ther
and
uns
peci
fied
ethn
icity
; e N
umbe
r of
birth
s pe
r 1,
000
fem
ales
19
or y
oung
er.
20
10
20
11
20
12
20
13
20
14
20
15
Rac
e/et
hn
icit
y
Pre
gn
ancy
ou
tcom
e2
00
62
00
7
Teen Pregnancy, Arizona 2006-2016 19

ARIZONA
APACHE
COCHISE
COCONINO
GILA
GRAHAM
GREENLEE
LA PAZ
MARICOPA
MOHAVE
NAVAJO
PIMA
PINAL
SANTA CRUZ
YAVAPAI
YUMA
20
06
34.1
25.6
24.2
31.0
37.7
35.5
24.7
30.0
35.4
33.0
30.0
32.9
34.1
32.9
29.6
38.0
20
07
34.4
27.5
29.1
33.2
41.7
40.1
25.4
50.9
35.4
31.9
33.7
30.5
37.4
32.2
33.0
37.8
20
08
31.6
25.3
27.2
28.6
45.9
33.2
33.2
38.6
32.5
28.1
36.3
29.0
31.3
31.5
26.9
35.1
20
09
28.0
27.7
28.7
27.6
40.8
33.7
41.2
27.8
27.4
25.9
33.2
27.0
27.6
29.1
25.0
36.1
20
10
24.7
26.7
27.5
22.5
39.7
33.3
35.7
38.1
23.7
24.6
32.8
24.7
22.8
30.5
21.4
34.1
20
11
23.0
23.6
24.7
20.3
35.9
28.5
34.1
31.9
22.4
18.9
33.4
22.6
21.7
27.9
19.9
30.1
20
12
21.6
21.6
24.0
18.0
29.9
29.2
18.9
25.3
20.7
19.2
29.8
21.4
20.6
29.0
18.7
29.0
20
13
19.2
19.1
18.9
16.2
32.0
26.7
28.8
37.6
18.4
15.8
23.3
19.2
16.4
20.6
16.7
25.1
20
14
17.8
17.7
18.4
14.7
29.0
27.1
26.8
33.4
17.4
17.5
21.8
16.9
15.5
20.0
17.2
19.7
20
15
15.9
13.7
20.0
14.4
25.6
23.7
20.5
22.9
15.3
14.7
21.4
15.0
15.1
13.6
16.4
18.2
20
16
14.9
17.2
18.8
13.0
31.3
18.2
21.5
20.7
14.4
13.5
19.3
14.2
12.9
18.1
13.5
17.5
20
06
115.
687
.971
.184
.013
9.8
95.6
69.0
63.0
125.
014
2.1
99.4
95.8
129.
310
8.5
109.
212
2.8
20
07
121.
489
.499
.881
.216
4.0
103.
412
2.4
242.
813
1.9
157.
612
5.8
89.6
144.
910
2.8
129.
912
9.8
20
08
111.
389
.592
.472
.216
5.9
94.7
133.
315
6.1
120.
013
5.7
135.
786
.512
1.8
111.
610
0.1
121.
72
00
910
2.5
100.
210
2.7
68.9
160.
293
.220
3.9
127.
210
6.0
129.
213
2.3
82.3
108.
411
5.7
101.
311
9.9
20
10
80.8
96.6
90.6
40.2
137.
996
.012
2.4
177.
880
.396
.512
2.7
68.7
96.8
94.2
84.5
114.
72
01
177
.294
.278
.936
.213
2.6
81.7
163.
312
7.8
78.4
75.9
121.
164
.394
.710
4.2
71.3
109.
32
01
270
.279
.680
.233
.410
5.8
95.2
64.7
87.7
69.3
69.6
115.
761
.982
.297
.964
.690
.12
01
364
.868
.565
.230
.813
3.0
103.
210
8.8
146.
164
.259
.492
.954
.667
.792
.462
.283
.02
01
465
.266
.466
.725
.811
4.8
108.
714
2.9
126.
468
.379
.581
.048
.770
.866
.975
.572
.02
01
558
.443
.977
.025
.910
5.7
95.0
86.2
77.3
59.5
67.9
78.9
45.9
71.4
50.9
64.5
69.9
20
16
55.0
68.1
73.0
21.3
114.
270
.684
.594
.956
.463
.270
.243
.558
.969
.355
.163
.12
00
615
.110
.812
.014
.116
.617
.6**
13.1
15.7
12.4
14.9
14.7
13.4
16.5
11.8
16.6
20
07
14.8
12.5
12.0
16.3
16.2
19.3
**15
.815
.310
.714
.413
.616
.417
.712
.816
.02
00
813
.79.
711
.313
.221
.012
.916
.217
.014
.39.
515
.512
.513
.615
.010
.914
.62
00
911
.210
.110
.813
.015
.914
.213
.39.
511
.08.
112
.511
.211
.811
.48.
416
.12
01
010
.011
.010
.811
.518
.111
.919
.3**
9.5
8.1
12.5
10.3
8.6
17.1
6.6
14.9
20
11
8.7
7.8
10.4
10.6
14.6
10.3
**10
.18.
45.
813
.69.
07.
711
.97.
811
.22
01
28.
47.
79.
28.
311
.712
.2**
8.9
8.1
6.3
10.4
8.0
7.2
15.0
7.4
12.6
20
13
6.9
8.1
6.9
7.3
10.7
10.0
10.8
12.8
6.6
4.4
7.1
7.4
5.3
7.7
5.4
10.1
20
14
6.1
6.0
6.4
7.1
9.9
9.5
**11
.65.
94.
88.
86.
65.
19.
14.
36.
72
01
55.
46.
86.
36.
29.
58.
1**
10.3
5.2
3.9
9.7
5.2
4.7
5.2
5.3
5.7
20
16
5.0
6.5
6.3
6.9
13.7
6.4
****
4.6
3.4
8.8
4.8
4.3
6.9
3.8
6.7
TAB
LE 9
TREN
DS
IN
PR
EGN
AN
CY
RA
TES
a B
Y C
OU
NTY
OF
RES
IDEN
CE
AM
ON
G F
EMA
LES
10
-17
AN
D 1
8-1
9 Y
EAR
S O
LD,
AR
IZO
NA
, 2
00
6-2
01
619 Years or Younger 18-19 Years 10-17 Years N
otes
: **
Cel
l sup
pres
sed
due
to r
ate/
ratio
/per
cent
bas
ed o
n co
unt
less
tha
n 6;
a N
umbe
r of
pre
gnan
cies
per
1,0
00 fem
ales
in s
peci
fied
grou
p.
Teen Pregnancy, Arizona 2006-2016 20

Gro
up
20
06
20
07
20
08
20
09
20
10
20
11
20
12
20
13
20
14
20
15
20
16
AR
IZO
NA
, TO
TALa
# B
irth
s (a
ll ag
es)
102,
042
102,
687
99,2
1592
,616
87,0
5385
,190
85,7
2584
,963
86,6
4885
,024
84,4
04#
Birth
s to
tee
nage
rs12
,916
12,9
7212
,161
10,9
529,
416
8,53
58,
117
7,22
26,
623
5,88
45,
390
% B
irth
s to
tee
nage
rs12
.712
.612
.211
.810
.810
.09.
58.
57.
66.
96.
4U
RB
AN
CO
UN
TIES
b
# B
irth
s (a
ll ag
es)
87,9
1088
,266
85,2
6379
,046
74,6
2474
,040
74,1
2873
,493
74,6
7773
,547
72,8
99#
Birth
s to
tee
nage
rs10
,809
10,6
9310
,013
8,86
77,
690
6,88
66,
697
6,01
15,
447
4,85
64,
412
% B
irth
s to
tee
nage
rs12
.312
.111
.711
.210
.39.
39.
08.
27.
36.
66.
1R
UR
AL
CO
UN
TIES
# B
irth
s (a
ll ag
es)
14,0
8314
,413
13,9
5213
,570
12,4
2912
,150
11,5
9711
,470
11,9
5511
,467
11,5
02#
Birth
s to
tee
nage
rs2,
100
2,27
92,
148
2,08
51,
726
1,54
91,
420
1,21
11,
175
1,02
897
8%
Birth
s to
tee
nage
rs14
.915
.815
.315
.413
.912
.712
.210
.69.
89.
08.
5W
HIT
E N
ON
-HIS
PA
NIC
# B
irth
s (a
ll ag
es)
43,0
1342
,216
41,9
2539
,781
38,7
7738
,294
38,6
7038
,220
40,0
9738
,180
37,7
62#
Birth
s to
tee
nage
rs3,
209
3,10
02,
993
2,71
52,
386
2,08
91,
977
1,78
11,
757
1,53
11,
347
% B
irth
s to
tee
nage
rs7.
57.
37.
16.
86.
25.
55.
14.
74.
44.
03.
6H
ISP
AN
IC O
R L
ATI
NO
# B
irth
s (a
ll ag
es)
44,8
6245
,731
42,6
3938
,362
34,3
3332
,398
33,1
4633
,075
33,7
1534
,264
33,8
74#
Birth
s to
tee
nage
rs7,
738
7,78
27,
168
6,34
15,
348
4,63
14,
627
4,08
03,
813
3,40
93,
136
% B
irth
s to
tee
nage
rs17
.217
.016
.816
.515
.614
.314
.012
.311
.39.
99.
3B
LAC
K O
R A
FRIC
AN
AM
ERIC
AN
# B
irth
s (a
ll ag
es)
3,86
44,
165
4,30
14,
378
4,32
84,
366
4,71
54,
726
4,52
24,
361
4,38
8#
Birth
s to
tee
nage
rs60
162
165
660
356
256
154
450
739
431
231
6%
Birth
s to
tee
nage
rs15
.614
.915
.213
.813
.012
.811
.58.
78.
77.
27.
2A
MER
ICA
N I
ND
IAN
OR
ALA
SK
A N
ATI
VE
# B
irth
s (a
ll ag
es)
6,36
46,
408
6,36
26,
170
5,81
55,
830
5,56
95,
476
5,14
54,
984
5,03
0#
Birth
s to
tee
nage
rs1,
216
1,28
51,
185
1,17
098
898
789
077
560
256
954
0%
Birth
s to
tee
nage
rs19
.120
.018
.619
.017
.016
.916
.014
.211
.711
.410
.7A
SIA
N O
R P
AC
IFIC
IS
LAN
DER
# B
irth
s (a
ll ag
es)
3,13
63,
412
3,42
53,
396
3,29
33,
505
3,62
53,
466
3,16
93,
235
3,35
0#
Birth
s to
tee
nage
rs92
103
113
8810
311
179
7957
6351
% B
irth
s to
tee
nage
rs2.
93.
03.
22.
63.
13.
22.
22.
31.
81.
91.
5
Not
es:
a In
clud
es r
ecor
ds for
eth
nic
grou
ps o
ther
tha
n W
hite
Non
-His
pani
c, H
ispa
nic
or L
atin
o, B
lack
or
Afr
ican
Am
eric
an,
Am
eric
an I
ndia
n or
Ala
ska
Nat
ive,
or
Asi
an o
r Pa
cific
Isl
ande
r; b
Urb
an =
Mar
icop
a, P
ima,
Pin
al,
and
Yum
a. T
he r
emai
ning
cou
ntie
s co
mpr
ise
Arizo
na's
rur
al a
reas
.
TAB
LE 1
0LI
VE
BIR
THS
TO
FEM
ALE
S 1
9 O
R Y
OU
NG
ER A
S A
PER
CEN
TAG
E O
F TO
TAL
LIV
E B
IRTH
S B
Y A
REA
, R
AC
E/ET
HN
ICIT
Y,
AN
D Y
EAR
, A
RIZ
ON
A,
20
06
-20
16
Teen Pregnancy, Arizona 2006-2016 21

AZ U.S. AZ U.S. AZ U.S. AZ U.S.
2006 0.8 0.6 59.6 41.1 34.0 21.6 100.2 71.2
2007 0.8 0.6 59.5 41.5 32.3 21.7 105.1 71.7
2008 0.7 0.6 54.9 40.2 30.3 21.1 96.3 68.2
2009 0.6 0.5 49.1 37.9 25.3 19.6 89.0 64.0
2010 0.5 0.4 41.5 34.2 22.1 17.3 69.2 58.2
2011 0.5 0.4 37.2 31.3 18.6 15.4 63.7 54.1
2012 0.3 0.4 35.4 29.4 18.5 14.1 58.6 51.4
2013 0.3 0.3 31.3 26.5 15.0 12.3 53.6 47.1
2014 0.2 0.3 29.9 24.2 13.4 10.9 54.7 43.8
2015 0.2 0.2 26.3 22.3 11.8 9.9 48.2 40.7
2016 0.2 0.2 23.7 20.3 10.5 8.8 43.7 37.5
Note: The U.S. data is from the National Vital Statistics reports published by the National Center for Health Statistics.
TABLE 11BIRTH RATES BY AGE GROUP FOR FEMALES 19 OR YOUNGER,
ARIZONA, AND UNITED STATES, 2006-2016
Year10-14 years
15 - 19 years old
Total 15-17 years 18-19 years
Teen Pregnancy, Arizona 2006-2016 22

20
06
20
07
20
08
20
09
20
10
20
11
20
12
20
13
20
14
20
15
20
16
Tota
l
593
604
570
446
339
249
293
220†
184
193
170†
Pre
viou
s p
reg
nan
cies
Non
e55
855
355
342
831
723
928
321
717
319
316
3
O
ne
or m
ore
3551
1718
2210
8*
100
*
U
nkn
own
00
00
00
**
*0
0
Tota
l
1,44
81,
360
1,25
01,
107
937
792
774
609
531
472
426
Pre
viou
s p
reg
nan
cies
Non
e1,
290
1,19
91,
146
988
848
743
732
571
511
441
403
O
ne
or m
ore
158
161
104
119
8949
4238
2031
22
U
nkn
own
00
00
00
00
00
*
Tota
l
2,40
92,
397
2,33
11,
948
1,63
41,
406
1,36
31,
153
1,05
591
782
7
Pre
viou
s p
reg
nan
cies
Non
e1,
905
1,89
51,
983
1,59
81,
343
1,19
71,
218
1,02
293
883
575
0
O
ne
or m
ore
502
502
348
350
291
209
145
129
116
8277
U
nkn
own
*0
00
00
0*
*0
0
Tota
l
3,52
33,
661
3,37
63,
078
2,64
72,
399
2,28
12,
012
1,88
61,
620
1,53
7
Pre
viou
s p
reg
nan
cies
Non
e2,
519
2,64
52,
576
2,22
61,
967
1,90
11,
845
1,65
81,
545
1,36
51,
276
O
ne
or m
ore
1,00
41,
016
799
851
680
498
434
351
341
255
260
U
nkn
own
00
**
00
**
00
*
Tota
l
4,77
34,
770
4,47
34,
241
3,75
43,
488
3,33
93,
154
2,92
12,
641
2,37
9
Pre
viou
s p
reg
nan
cies
Non
e2,
961
2,98
03,
065
2,66
72,
459
2,41
42,
444
2,37
62,
233
2,01
71,
873
O
ne
or m
ore
1,81
21,
790
1,40
71,
570
1,29
51,
074
892
777
687
622
506
U
nkn
own
00
**
00
**
**
0
TAB
LE 1
2R
EPEA
T P
REG
NA
NC
IES
AM
ON
G T
EEN
AG
E M
OTH
ERS
GIV
ING
BIR
TH B
Y A
GE
AN
D Y
EAR
, A
RIZ
ON
A,
20
06
-20
16
Mot
her
's
age
Pre
gn
anci
esY
ear
15
16
17
18
19
Not
es:
* C
ell s
uppr
esse
d du
e to
non
-zer
o co
unt
less
tha
n 6;
† Sum
rou
nded
to
near
est
tens
uni
t du
e to
non
-zer
o ad
dend
less
tha
n 6.
Teen Pregnancy, Arizona 2006-2016 23

10
11
12
13
14
15
16
17
18
19
20
07
00
†
20
08
0*
0†
20
09
00
*0
†
20
10
0*
*11
10
†
20
11
00
*7
931
00
†
20
12
00
**
6129
33
60
†
20
13
00
*15
5522
360
99
00
†
20
14
00
06
4018
453
11,
055
1,8
16
20
15
00
0*
3819
347
291
71,
620
2,64
13
,24
0†
20
16
00
*9
4416
742
682
715
3723
795
,39
0†
Cu
mu
lati
ve n
um
ber
of
mot
her
s 1
9 o
r yo
un
ger
00
†1
0†
50
†3
31
1,0
60
2,0
38
2,7
99
3,1
57
2,3
79
11
,83
0†
Not
es:
* C
ell s
uppr
esse
d du
e to
non
-zer
o co
unt
less
tha
n 6;
† S
um r
ound
ed t
o ne
ares
t te
ns u
nit
due
to n
on-z
ero
adde
nd le
ss t
han
6; T
he a
bove
tab
le foc
uses
on
the
2016
coh
ort
of
Arizo
na m
othe
rs w
ho w
ere
19 o
r yo
unge
r th
at y
ear.
Am
ong
them
are
tho
se w
ho g
ave
birt
h in
201
6 an
d th
ose
who
gav
e bi
rth
prio
r to
201
6 an
d w
ere
still
19
or le
ss y
ears
old
in 2
016.
Th
e nu
mbe
rs b
elow
the
mai
n di
agon
al (
and
belo
w t
he s
tair-l
ike
line)
rep
rese
nt t
he n
umbe
r of
mot
hers
mee
ting
eith
er o
ne o
f th
e ab
ove
crite
ria.
The
last
col
umn
to t
he r
ight
giv
es t
he
cum
ulat
ive
tota
l for
201
6 by
the
yea
r th
e ba
by w
as b
orn.
Fo
r ex
ampl
e, fro
m a
mon
g th
ose
girls
and
adol
esce
nts
who
had
the
ir b
aby
in 2
010,
abo
ut 1
0 re
mai
ned
in t
heir t
eens
in
2016
. Th
e bo
ttom
row
giv
es t
he c
umul
ativ
e to
tal b
y m
othe
r's
age
whe
n th
e ba
by w
as b
orn.
For
exa
mpl
e, a
mon
g th
e 11
,828
mot
hers
und
er 2
0 in
Arizo
na in
201
6, a
roun
d 10
ha
d gi
ven
birt
h w
hen
13 y
ears
old
. Ex
clud
ed fro
m t
he c
umul
ativ
e to
tals
and
not
sho
wn
abov
e th
e m
ain
diag
onal
(an
d ab
ove
stai
r-lik
e lin
e) a
re t
he n
umbe
r of
mot
hers
who
wer
e 19
yea
rs
old
or y
oung
er w
hen
the
baby
was
bor
n, b
ut w
ho w
ere
no lo
nger
und
er t
he a
ge 2
0 by
201
6. Fo
r ex
ampl
e, m
othe
rs w
ho w
ere
11 y
ears
old
in 2
007
wer
e 20
yea
rs o
ld in
201
6. T
he
figur
es in
Tab
le 1
3 ar
e un
adju
sted
for
in-a
nd-o
ut m
igra
tion,
as
wel
l as
mor
talit
y of
mot
hers
, in
the
per
iod
of 2
007-
2016
. F
or s
impl
icity
, th
e nu
mbe
r of
mot
hers
equ
als
the
num
ber
of
babi
es (
i.e.,
no
adju
stm
ent
was
mad
e fo
r m
ultip
le b
irth
eve
nts)
.
TAB
LE 1
3C
UM
ULA
TIV
E N
UM
BER
OF
MO
THER
S W
HO
WER
E 1
9 O
R Y
OU
NG
ER I
N A
RIZ
ON
A I
N 2
01
6
Yea
r B
aby
Was
Bor
n
MO
THER
'S A
GE
WH
EN B
AB
Y W
AS
BO
RN
Mot
her
was
19
or
you
ng
er in
20
16
Teen Pregnancy, Arizona 2006-2016 24

Total, females
19 years or younger
10-14 years 15-19 years 15-17 years 18-19 years
2006 18.9 0.4 37.2 17.2 68.62007 19.0 0.9 36.3 15.6 70.32008 17.5 0.3 34.1 14.9 65.32009 15.6 0.3 30.3 12.3 59.62010 15.9 0.3 30.5 12.9 53.92011 11.8 0.2 22.8 9.6 40.82012 10.7 0.1 20.6 9.0 35.62013 9.8 0.1 18.9 7.1 34.02014 11.6 0.2 23.0 8.2 45.52015 10.5 ** 20.6 7.7 40.22016 9.5 0.2 18.5 6.5 36.4
2006 56.0 1.9 117.3 72.7 188.12007 55.3 1.9 116.8 68.5 201.22008 49.4 1.7 104.4 62.7 177.22009 43.5 1.1 92.4 51.3 164.22010 33.8 0.9 67.9 38.9 112.62011 30.2 0.9 60.5 31.8 104.02012 28.0 0.6 56.7 31.6 93.82013 25.0 0.6 50.7 25.9 87.42014 25.4 0.3 51.9 25.2 91.72015 20.4 0.4 41.4 19.5 74.72016 19.3 0.4 38.7 17.6 71.5
2006 32.6 1.4 67.2 36.1 118.12007 36.1 2.3 73.9 36.9 144.12008 37.7 1.6 78.1 37.2 155.72009 33.3 0.8 69.5 31.6 141.72010 29.5 1.1 56.1 27.3 97.02011 24.9 0.9 47.7 22.3 84.02012 26.2 ** 49.8 26.2 81.22013 25.1 0.7 47.5 20.9 82.92014 16.9 ** 33.3 15.9 59.42015 16.6 ** 32.6 14.2 59.82016 17.3 ** 34.0 14.0 63.5
2006 36.2 1.1 71.1 41.5 119.82007 39.1 2.0 73.8 42.4 124.92008 35.5 1.4 67.4 38.1 115.22009 34.7 1.0 66.2 36.9 114.02010 37.0 1.2 69.5 40.5 111.02011 29.2 0.8 55.7 28.8 94.22012 33.6 0.5 65.5 32.2 110.72013 29.7 0.6 58.6 31.5 98.02014 19.2 0.7 37.8 21.0 62.72015 26.8 0.9 52.5 27.3 90.82016 24.7 1.1 47.9 24.8 83.9
2006 12.9 ** 25.7 13.0 45.02007 15.3 0.0 31.1 12.0 62.22008 13.5 ** 27.6 11.6 53.52009 11.6 ** 23.6 8.2 48.72010 9.9 ** 19.9 8.3 35.52011 9.1 ** 18.0 7.2 32.72012 7.5 ** 14.6 5.6 26.62013 6.8 ** 13.2 3.7 25.52014 5.5 ** 10.9 4.6 20.32015 6.3 0.0 12.8 4.8 23.82016 5.0 0.0 10.0 3.4 19.0
TABLE 14 TRENDS IN TEEN PREGNANCY RATES BY RACE/ETHNICITY AND AGE GROUP,
ARIZONA, 2006-2016
WHITE NON-HISPANIC
HISPANIC OR LATINO
BLACK OR AFRICAN AMERICAN
AMERICAN INDIAN OR ALASKA NATIVE
ASIAN OR PACIFIC ISLANDER
Note: ** Cell supressed due to rate/ratio/percent based on non-zero count less than 6.
Teen Pregnancy, Arizona 2006-2016 25
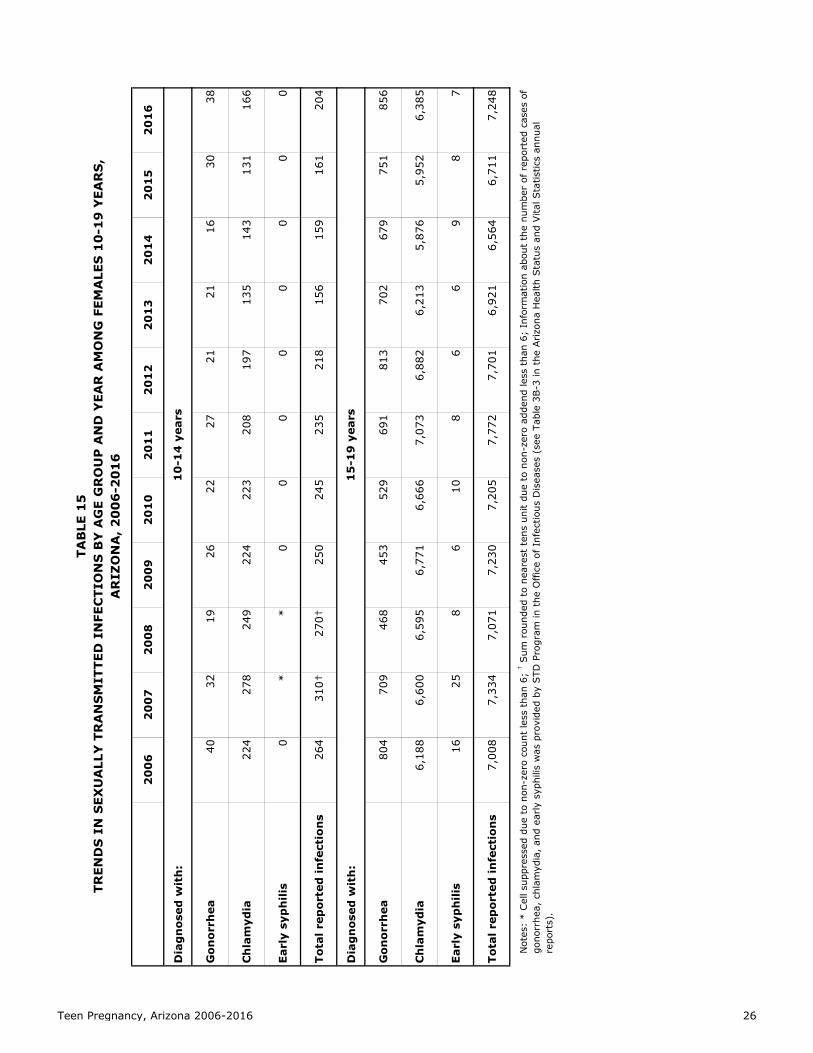
20
06
20
07
20
08
20
09
20
10
20
11
20
12
20
13
20
14
20
15
20
16
Dia
gn
osed
wit
h:
Gon
orr
hea
4032
1926
2227
2121
1630
38
Ch
lam
ydia
224
278
249
224
223
208
197
135
143
131
166
Earl
y sy
ph
ilis
0*
*0
00
00
00
0
Tota
l rep
ort
ed in
fect
ion
s26
431
0†27
0†25
024
523
521
815
615
916
120
4
Dia
gn
osed
wit
h:
Gon
orr
hea
804
709
468
453
529
691
813
702
679
751
856
Ch
lam
ydia
6,18
86,
600
6,59
56,
771
6,66
67,
073
6,88
26,
213
5,87
65,
952
6,38
5
Earl
y sy
ph
ilis
1625
86
108
66
98
7
Tota
l rep
ort
ed in
fect
ion
s7,
008
7,33
47,
071
7,23
07,
205
7,77
27,
701
6,92
16,
564
6,71
17,
248
TAB
LE 1
5TR
END
S I
N S
EXU
ALL
Y T
RA
NS
MIT
TED
IN
FEC
TIO
NS
BY
AG
E G
RO
UP
AN
D Y
EAR
AM
ON
G F
EMA
LES
10
-19
YEA
RS
,A
RIZ
ON
A,
20
06
-20
16
Not
es:
* C
ell s
uppr
esse
d du
e to
non
-zer
o co
unt
less
tha
n 6;
† Sum
rou
nded
to
near
est
tens
uni
t du
e to
non
-zer
o ad
dend
less
tha
n 6;
Inf
orm
atio
n ab
out
the
num
ber
of r
epor
ted
case
s of
go
norr
hea,
chl
amyd
ia,
and
early
syph
ilis
was
pro
vide
d by
STD
Pro
gram
in t
he O
ffic
e of
Inf
ectio
us D
isea
ses
(see
Tab
le 3
B-3
in t
he A
rizo
na H
ealth
Sta
tus
and
Vita
l Sta
tistic
s an
nual
re
port
s).
10
-14
yea
rs
15
-19
yea
rs
Teen Pregnancy, Arizona 2006-2016 26

20
06
20
07
20
08
20
09
20
10
20
11
20
12
20
13
20
14
20
15
20
16
Dia
gn
osed
wit
h:
Gon
orr
hea
17.9
14.4
8.4
11.4
10.0
12.3
9.4
9.4
7.1
13.3
16.9
Ch
lam
ydia
100.
312
5.1
110.
398
.310
1.5
94.7
88.5
60.4
63.7
58.3
73.9
Earl
y sy
ph
ilis
0.0
****
0.0
0.0
0.0
0.0
0.0
0.0
0.0
0.0
Tota
l rep
ort
ed in
fect
ion
s11
8.2
140.
011
9.1
109.
711
1.5
107.
097
.969
.870
.871
.690
.8
Dia
gn
osed
wit
h:
Gon
orr
hea
376.
232
9.6
214.
120
5.4
253.
830
8.1
374.
732
1.0
306.
933
4.1
380.
8
Ch
lam
ydia
2,89
5.7
3,06
8.6
3,01
7.7
3,07
0.0
2,97
1.9
3,15
3.3
3,17
1.8
2,84
0.6
2,65
6.2
2,64
7.8
2,84
0.4
Earl
y sy
ph
ilis
7.5
11.6
3.7
2.7
4.5
3.6
2.8
2.7
4.1
3.6
7.6
Tota
l rep
ort
ed in
fect
ion
s3,
279.
43,
409.
93,
235.
53,
278.
13,
230.
23,
465.
03,
549.
33,
164.
32,
967.
22,
985.
53,
228.
8
TAB
LE 1
6TR
END
S I
N T
HE
INC
IDEN
CE
RA
TES
a O
F S
EXU
ALL
Y T
RA
NS
MIT
TED
IN
FEC
TIO
NS
BY
AG
E G
RO
UP
AN
D Y
EAR
AM
ON
G
FEM
ALE
S 1
0-1
9 Y
EAR
S,
AR
IZO
NA
, 2
00
6-2
01
6
10
-14
yea
rs
15
-19
yea
rs
Not
es:
** C
ell s
upre
ssed
due
to
rate
/rat
io/p
erce
nt b
ased
on
non-
zero
cou
nt le
ss t
han
6; a
Num
ber
of c
ases
per
100
,000
fem
ales
in s
peci
fied
age
grou
p.
Teen Pregnancy, Arizona 2006-2016 27

Total, 15-19 years
15-17 years 18-19 years
Apache 100† * 97 28 69
Cochise 140† * 139 37 102
Coconino 150† * 147 44 103
Gila 90† * 88 30 58
Graham 50† * 50 13 37
Greenlee 17 0 20† * 12
La Paz 19 0 20† * 15
Maricopa 4,021 48 3,973 996 2,977
Mohave 140† * 140 28 112
Navajo 155 0 155 59 96
Pima 901 11 890 223 667
Pinal 337 6 331 88 243
Santa Cruz 70† * 73 22 51
Yavapai 150† * 142 30 112
Yuma 260† * 260 79 181
TOTAL STATE 6,724 90† 6,639 1,710† 4,932
Total 15-19 years 15-17 years 18-19 years
Apache 17.2 ** 34.2 15.3 68.1
Cochise 18.8 ** 37.9 16.3 73.0
Coconino 13.0 ** 20.1 17.7 21.3
Gila 31.3 ** 62.9 33.7 114.2
Graham 18.2 ** 35.0 14.4 70.6
Greenlee 21.5 0.0 43.0 ** 84.5
La Paz 20.7 0.0 42.9 ** 94.9
Maricopa 14.4 0.3 28.8 11.7 56.4
Mohave 13.5 ** 26.9 8.1 63.2
Navajo 19.3 0.0 40.0 23.5 70.2
Pima 14.2 0.4 26.5 12.2 43.5
Pinal 12.9 0.4 27.1 10.9 58.9
Santa Cruz 18.1 ** 36.6 17.5 69.3
Yavapai 13.5 ** 26.4 9.0 55.1
Yuma 17.5 ** 35.3 17.6 63.1
TOTAL STATE 14.9 0.4 29.5 12.6 55.0
TABLE 17PREGNANCIES AND PREGNANCY RATES OF FEMALES 19 OR YOUNGER
BY COUNTY OF RESIDENCE, ARIZONA, 2016
County of residence
NUMBER OF PREGNANCIESa
Total, females 19 years or
younger10-14 years
15-19 years old
Notes: * Cell suppressed due to non-zero count less than 6; ** Cell suppressed due to rate/ratio/percent based on non-zero count less than 6; † Sum rounded to nearest tens unit due to non-zero addend less than 6; a The sum of live births, fetal deaths and abortions; b
The number of pregnancies per 1,000 females in specified group.
County of residence
PREGNANCY RATESb
Total, females 19 years or
younger10-14 years
15-19 years old
Teen Pregnancy, Arizona 2006-2016 28

Total 15-19 years 15-17 years 18-19 years
Apache 100† * 96 28 68
Cochise 125 0 125 30 95
Coconino 120† * 118 37 81
Gila 80† * 74 30 44
Graham 50† * 46 11 35
Greenlee 15 0 20† * 11
La Paz 19 0 20† * 15
Maricopa 3,150 29 3,121 819 2,302
Mohave 140† * 135 26 109
Navajo 149 0 149 55 94
Pima 723 6 717 181 536
Pinal 290† * 285 76 209
Santa Cruz 70† * 69 20 49
Yavapai 120† * 118 22 96
Yuma 250† * 249 77 172
TOTAL STATE 5,390 50† 5,336 1,420† 3,916
Total 15-19 years 15-17 years 18-19 years
Apache 17.0 ** 33.8 15.3 67.1
Cochise 16.8 0.0 34.1 13.2 68.0
Coconino 10.5 ** 16.1 14.8 16.8
Gila 26.5 ** 52.9 33.7 86.6
Graham 16.8 ** 32.2 12.2 66.8
Greenlee 19.0 0.0 38.0 ** 77.5
La Paz 20.7 0.0 42.9 ** 94.9
Maricopa 11.3 0.2 22.6 9.6 43.6
Mohave 13.0 ** 25.9 7.6 61.5
Navajo 18.5 0.0 38.4 21.9 68.7
Pima 11.4 0.2 21.3 9.9 35.0
Pinal 11.0 ** 23.4 9.4 50.7
Santa Cruz 17.1 ** 34.6 15.9 66.6
Yavapai 11.2 ** 21.9 6.6 47.2
Yuma 16.8 ** 33.8 17.1 60.0
TOTAL STATE 12.0 0.2 23.7 10.5 43.7
TABLE 18BIRTHS AND BIRTH RATES, FEMALES 19 OR YOUNGER BY COUNTY OF RESIDENCE,
ARIZONA, 2016
County of residence
NUMBER OF BIRTHS
Total, females 19 years or
younger10-14 years
15-19 years old
Notes: * Cell suppressed due to non-zero count less than 6; ** Cell suppressed due to rate/ratio/percent based on non-zero count less than 6; † Sum rounded to nearest tens unit due to non-zero addend less than 6; a The number of births per 1,000 females in specified group.
County of residence
BIRTH RATESa
Total, females 19 years or
younger10-14 years
15-19 years old
Teen Pregnancy, Arizona 2006-2016 29
Live births
Induced terminations of
pregnancy (or abortions)
Spontaneous fetal losses Number Rate
10 45,399 0 * 0 * **
11 44,420 0 0 0 0 0.0
12 45,022 * 6 0 7 0.2
13 44,635 9 * 0 12 0.3
14 45,498 44 20 0 64 1.4
10-14 224,974 50† 30† 0 90† 0.4
15 46,040 167 35 * 203 4.4
16 44,961 426 85 * 513 11.4
17 44,505 827 157 7 991 22.3
15-17 135,506 1,420 277 10† 1,707 12.6
18 45,206 1,537 410 13 1,960 43.4
19 44,398 2,379 579 14 2,972 66.9
18-19 89,604 3,916 989 27 4,932 55.0
Total 10-19 450,084 5,390 1,297 37 6,724 14.9
TABLE 19PREGNANCY RATESa AND NUMBER OF LIVE BIRTHS, FETAL DEATHS, AND
ABORTIONS TO TEENS BY INDIVIDUAL AGE, ARIZONA, 2016
PREGNANCIES BY OUTCOME TOTAL PREGNANCIES
Notes: * Cell suppressed due to non-zero count less than 6; ** Cell suppressed due to rate/ratio/percent based on non-zero count less than 6; † Sum rounded to nearest tens unit due to non-zero addend less than 6; a Rates per 1,000 female population in specific group.
Age Population
Teen Pregnancy, Arizona 2006-2016 30

12 13 14 15 16 17 18 19
TOTAL 5,390† 0† 10† 40† 170† 430† 830† 1,540† 2,379
Apache 100† 0 * * * 9 18 37 31
Cochise 130† 0 0 0 * 6 23 33 62
Coconino 120† 0 0 * 9 11 17 27 54
Gila 80† 0 0 * 7 8 15 23 21
Graham 50† * 0 * * * 7 14 21
Geenlee 20† 0 0 0 0 * * * 7
La Paz 20† 0 0 0 * 0 * * 12
Maricopa 3,150† 0 * 24 99 243 477 925 1,377
Mohave 140† 0 0 * * 6 19 40 69
Navajo 150† 0 0 0 * 16 34 40 54
Pima 723 0 0 6 17 54 110 190 346
Pinal 290† 0 * * 9 26 41 85 124
Santa Cruz 70† 0 0 * * 11 8 19 30
Yavapai 120† 0 * * * 9 11 38 58
Yuma 250† 0 0 * 12 23 42 59 113
TABLE 20BIRTHS TO FEMALES 19 OR YOUNGER BY AGE AND COUNTY OF RESIDENCE,
ARIZONA, 2016
Note: * Cell suppressed due to non-zero count less than 6; † Sum rounded to nearest tens unit due to non-zero addend less than 6.
TotalMother's age
Teen Pregnancy, Arizona 2006-2016 31

Total 10 11 12 13 14 15 16 17 18 19
TOTAL 1,300† 0† 0 10† 0† 20† 40† 90† 160† 410† 580†
Apache 0† 0 0 0 0 0 0 0 0 * 0
Cochise 10† 0 0 0 0 * 0 * * * *
Coconino 30† 0 0 0 0 0 * * * * 15
Gila 10† 0 0 0 0 0 0 0 0 * 10
Graham 0† 0 0 0 0 0 0 0 * * *
Greenlee 0† 0 0 0 0 0 0 * 0 0 0
La Paz 0 0 0 0 0 0 0 0 0 0 0
Maricopa 850† * 0 * * 14 24 48 102 273 388
Mohave 0† 0 0 0 0 0 0 0 0 * *
Navajo 10† 0 0 0 0 0 0 * * 0 *
Pima 170† * 0 * 0 0 * 15 20 50 77
Pinal 50† 0 0 0 0 * 0 * 8 11 22
Santa Cruz 0† 0 0 0 0 0 0 * * * *
Yavapai 20† 0 0 0 0 * * * * 7 8
Yuma 10† 0 0 0 0 0 * * 0 * 7
Unknown 120† 0 0 0 * * * * 14 53 44
Notes: * Cell suppressed due to non-zero count less than 6; † Sum rounded to nearest tens unit due to non-zero addend less than 6.
TABLE 21ABORTIONS TO FEMALES 19 OR YOUNGER BY AGE AND COUNTY OF RESIDENCE,
ARIZONA, 2016
Teen Pregnancy, Arizona 2006-2016 32

Total AHCCCS IHS Private insurance Self-pay Unknown
TOTAL 5,390 4,497 120† 550† 200† 20†
Apache 100† 74 23 * 0 0
Cochise 125 96 0 7 21 *
Coconino 120† 101 6 10 * 0
Gila 80† 57 13 * * 0
Graham 48 29 7 6 6 0
Greenlee 20† 6 0 * 6 0
La Paz 20† 15 * * * 0
Maricopa 3,150 2,748 18 287 86 11
Mohave 140† 114 * 16 * *
Navajo 150† 126 6 14 * *
Pima 723 535 26 128 34 0
Pinal 288 220 18 43 7 0
Santa Cruz 70† 62 0 * * *
Yavapai 120† 107 * 11 * 0
Yuma 250† 207 * 17 25 0
Notes: * Cell suppressed due to non-zero count less than 6; † Sum rounded to nearest tens unit due to non-zero addend less than 6.
TABLE 22SOURCES OF PAYMENT FOR LABOR AND DELIVERY, FEMALES 19 OR YOUNGER
BY AGE AND COUNTY OF RESIDENCE, ARIZONA, 2016
Teen Pregnancy, Arizona 2006-2016 33

<15 15-17 18-19
Total5,390† 50† 1,420† 3,916
Count 4,497 44 1,185 3,268
Percent 83.4 81.5 83.5 83.5
Count 120† * 46 73
Percent 2.3 ** 3.2 1.9
Count 550† * 114 435
Percent 10.3 ** 8.0 11.1
Count 200† * 70 129
Percent 3.7 ** 4.9 3.3
Count 20† 0 * 11
Percent 0.3 0.0 0.0 0.3
TABLE 23SOURCES OF PAYMENT FOR LABOR AND DELIVERY, FEMALES 19 OR YOUNGER
BY AGE GROUP, ARIZONA, 2016
TotalMother's age group
Count
Payer for births AHCCCS
IHS
Private insurance
Self-pay
Unknown
Notes: * Cell suppressed due to non-zero count less than 6; ** Cell suppressed due to rate/ratio/percent based on non-zero count less than 6; † Sum rounded to nearest tens unit due to non-zero addend less than 6.
Teen Pregnancy, Arizona 2006-2016 34
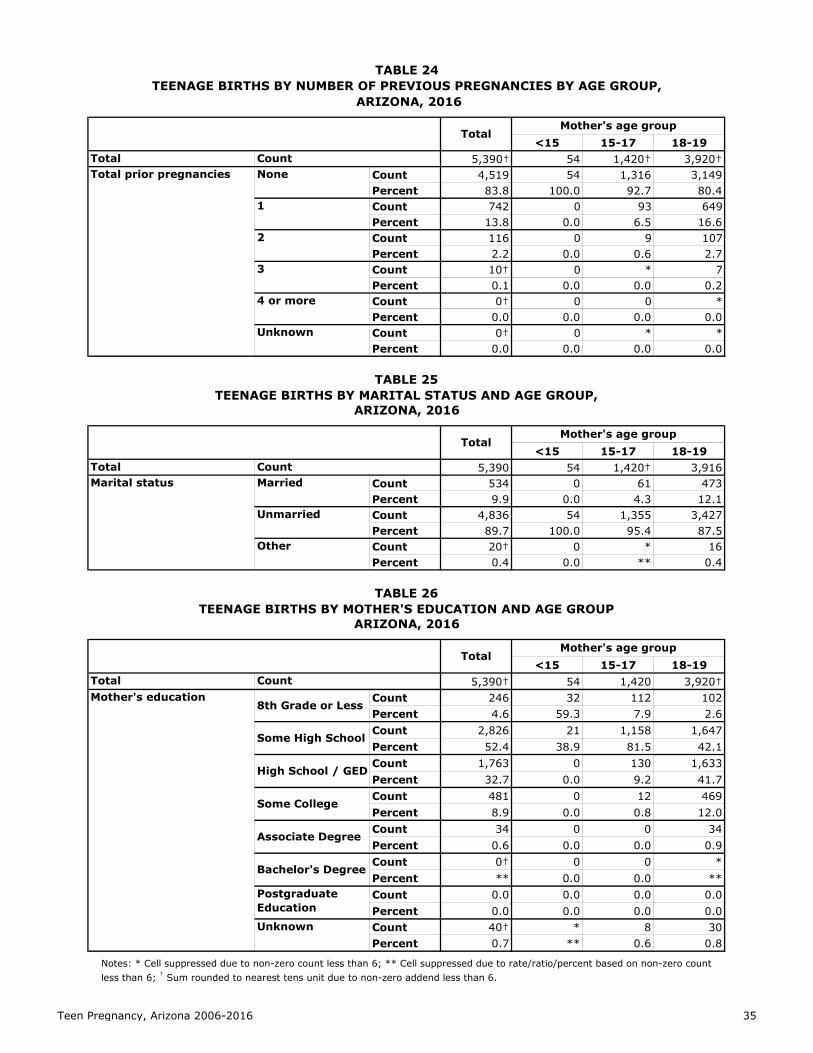
<15 15-17 18-19Total 5,390† 54 1,420† 3,920†
Count 4,519 54 1,316 3,149Percent 83.8 100.0 92.7 80.4Count 742 0 93 649Percent 13.8 0.0 6.5 16.6Count 116 0 9 107Percent 2.2 0.0 0.6 2.7Count 10† 0 * 7Percent 0.1 0.0 0.0 0.2Count 0† 0 0 *Percent 0.0 0.0 0.0 0.0Count 0† 0 * *Percent 0.0 0.0 0.0 0.0
<15 15-17 18-19Total 5,390 54 1,420† 3,916
Count 534 0 61 473Percent 9.9 0.0 4.3 12.1Count 4,836 54 1,355 3,427Percent 89.7 100.0 95.4 87.5Count 20† 0 * 16Percent 0.4 0.0 ** 0.4
<15 15-17 18-19Total 5,390† 54 1,420 3,920†
Count 246 32 112 102Percent 4.6 59.3 7.9 2.6Count 2,826 21 1,158 1,647Percent 52.4 38.9 81.5 42.1Count 1,763 0 130 1,633Percent 32.7 0.0 9.2 41.7Count 481 0 12 469Percent 8.9 0.0 0.8 12.0Count 34 0 0 34Percent 0.6 0.0 0.0 0.9Count 0† 0 0 *Percent ** 0.0 0.0 **Count 0.0 0.0 0.0 0.0Percent 0.0 0.0 0.0 0.0Count 40† * 8 30Percent 0.7 ** 0.6 0.8
Mother's age group
TABLE 24TEENAGE BIRTHS BY NUMBER OF PREVIOUS PREGNANCIES BY AGE GROUP,
ARIZONA, 2016
Total
CountTotal prior pregnancies None
1
2
3
4 or more
Unknown
Mother's age group
TABLE 25TEENAGE BIRTHS BY MARITAL STATUS AND AGE GROUP,
ARIZONA, 2016
Total
CountMarital status Married
Unmarried
Other
Mother's age group
TABLE 26TEENAGE BIRTHS BY MOTHER'S EDUCATION AND AGE GROUP
ARIZONA, 2016
Total
CountMother's education
8th Grade or Less
Some High School
High School / GED
Some College
Associate Degree
Bachelor's Degree
Postgraduate Education
Unknown
Notes: * Cell suppressed due to non-zero count less than 6; ** Cell suppressed due to rate/ratio/percent based on non-zero count less than 6; † Sum rounded to nearest tens unit due to non-zero addend less than 6.
Teen Pregnancy, Arizona 2006-2016 35

<15 15-17 18-19Total 5,390 50† 1,420 3,916
Count 210† * 70 141
Percent 4.0 ** 4.9 3.6
Count 2,864 17 671 2,176
Percent 53.1 31.5 47.3 55.6
Count 1,463 15 435 1,013
Percent 27.1 27.8 30.6 25.9
Count 598 15 180 403
Percent 11.1 27.8 12.7 10.3
Count 250† * 64 183
Percent 4.7 ** 4.5 4.7
<15 15-17 18-19Total 5,390 50† 1,420 3,916
Count 210† * 70 141
Percent 4.0 ** 4.9 3.6
Count 442 8 141 293
Percent 8.2 14.8 9.9 7.5
Count 1,222 14 349 859
Percent 22.7 25.9 24.6 21.9
Count 2,381 20 592 1,769
Percent 44.2 37.0 41.7 45.2
Count 1,045 10 238 797
Percent 19.4 18.5 16.8 20.4
Count 87 0 30 57
Percent 1.6 0.0 2.1 1.5
TABLE 27TEENAGE BIRTHS BY TRIMESTER OF ENTRY INTO PRENATAL CARE
AND AGE GROUP, ARIZONA, 2016
TotalMother's age group
Count
Prenatal care No care
1st trimester
2nd trimester
3rd trimester
Unknown
TABLE 28TEENAGE BIRTHS BY NUMBER OF PRENATAL VISITS AND AGE GROUP,
ARIZONA, 2016
TotalMother's age group
Count
Prenatal visits No visits
1-4 visits
5-8 visits
Notes: * Cell suppressed due to non-zero count less than 6; ** Cell suppressed due to rate/ratio/percent based on non-zero count less than 6; † Sum rounded to nearest tens unit due to non-zero addend less than 6.
9-12 visits
13+ visits
Unknown
Teen Pregnancy, Arizona 2006-2016 36

<15 15-17 18-19
Total5,390 54 1,420 3,916
Count 5,132 54 1,372 3,706
Percent 95.2 100.0 96.6 94.6
Count 149 0 28 121
Percent 2.8 0.0 2.0 3.1
Count 58 0 7 51
Percent 1.1 0.0 0.5 1.3
Count 51 0 13 38
Percent 0.9 0.0 0.9 1.0
Unknown
Count
Substance use
Nonsmoker
Light smoker
Heavy smoker
TABLE 29TOBACCO USE DURING PREGNANCY AMONG FEMALES 19 OR YOUNGER BY
AGE GROUP, ARIZONA, 2016
TotalMother's age group
Teen Pregnancy, Arizona 2006-2016 37

Cou
nt
Per
cen
tC
ou
nt
Per
cen
tC
ou
nt
Per
cen
t
Wh
ite
no
n-H
isp
anic
8*
**28
319
6.7
1,05
692
8.7
His
pan
ic o
r La
tin
o32
***
877
667.
52,
227
168
7.5
Bla
ck o
r A
fric
an A
mer
ican
30
0.0
8115
18.5
232
3314
.2
Am
eric
an I
nd
ian
or
Ala
ska
Nat
ive
110
0.0
167
127.
236
219
5.2
Asi
an
00
0.0
120
0.0
39*
**
No
nsm
oke
r54
***
1,37
210
87.
93,
706
291
7.9
Lig
ht
smo
ker
00
0.0
28*
**12
116
13.2
Hea
vy s
mok
er
00
0.0
70
0.0
51*
**
Un
know
n0
00.
013
00.
038
718
.4
AH
CC
CS
44*
**1,
185
958.
03,
268
261
8.0
IHS
50
0.0
46*
**73
79.
6
Pri
vate
in
sura
nce
40
0.0
114
76.
143
535
8.0
Sel
f-p
ay1
00.
070
***
129
118.
5
Un
know
n0
00.
05
***
11*
**
36
wee
ks o
r le
ss9
***
115
6657
.432
418
356
.5
37
wee
ks o
r m
ore
450
0.0
1,30
043
3.3
3,58
013
03.
6
Un
know
n0
00.
05
***
12*
**
Less
th
an 5
10*
**21
129
13.7
434
5312
.2
5 o
r m
ore
44*
**1,
179
776.
53,
425
249
7.3
Un
know
n0
00.
030
620
.057
1322
.8
TAB
LE 3
0R
ISK
FO
R L
OW
-BIR
THW
EIG
HT
(LB
W)
BIR
THS
BY
SEL
ECTE
D C
HA
RA
CTE
RIS
TIC
S O
F FE
MA
LES
19
OR
YO
UN
GER
,A
RIZ
ON
A,
20
16
Mot
her
's a
ge
gro
up
<1
51
5-1
71
8-1
9
Tota
l b
irth
sLB
W b
irth
sTo
tal
bir
ths
LBW
bir
ths
Tota
l b
irth
sLB
W b
irth
s
Rac
e/et
hn
icit
y
Pre
nat
al v
isit
s
Not
es:
* C
ell s
uppr
esse
d du
e to
non
-zer
o co
unt
less
tha
n 6;
**
Cel
l sup
pres
sed
due
to r
ate/
ratio
/per
cent
bas
ed o
n no
n-ze
ro c
ount
less
tha
n 6.
Sm
oki
ng
du
rin
g
pre
gn
ancy
Pay
er f
or b
irth
s
Len
gth
of
ges
tati
on
Teen Pregnancy, Arizona 2006-2016 38

All 19 years or younger
10-14 years
15-19 years
15-17 years
18-19 years
All groups 450,084 224,974 225,110 135,506 89,604
White non-Hispanic 193,090 94,936 98,154 58,746 39,408
Hispanic or Latino 193,357 98,285 95,072 57,759 37,313
Black or African American 24,911 12,432 12,479 7,436 5,043
American Indian or Alaska Native 23,423 11,614 11,809 7,183 4,626
Asian or Pacific Islander 15,303 7,707 7,596 4,382 3,214
All 19 years or younger
10-14 years
15-19 years
15-17 years
18-19 years
All groups 6,724 90† 6,639 1,707 4,932
White non-Hispanic 1,834 19 1,815 382 1,433
Hispanic or Latino 3,723 40 3,683 1,015 2,668
Black or African American 431 7 424 104 320
American Indian or Alaska Native 579 13 566 178 388
Asian or Pacific Islander 80† * 76 15 61
All 19 years or younger
10-14 years
15-19 years
15-17 years
18-19 years
All groups 14.9 0.4 29.5 12.6 55.0
White non-Hispanic 9.5 0.2 18.5 6.5 36.4
Hispanic or Latino 19.3 0.4 38.7 17.6 71.5
Black or African American 17.3 0.6 34.0 14.0 63.5
American Indian or Alaska Native 24.7 1.1 47.9 24.8 83.9
Asian or Pacific Islander 5.0 ** 10.0 3.4 19.0
TABLE 31POPULATION OF FEMALES 19 OR YOUNGER, NUMBER OF PREGNANCIES AND PREGNANCY
RATES BY AGE GROUP, AND RACE/ETHNICITY, ARIZONA, 2016
POPULATION
Note: The 2015 population denominators are population estimates.
NUMBER OF PREGNANCIES
PREGNANCY RATES PER 1,000 FEMALES
Notes: * Cell suppressed due to non-zero count less than 6; ** Cell suppressed due to rate/ratio/percent based on non-zero count less than 6; † sum rounded to nearest tens unit due to addend less than 6.
Teen Pregnancy, Arizona 2006-2016 39

15
-19
yea
rs
15
-17
yea
rs
18
-19
yea
rs
AR
IZO
NA
450,
084
224,
974
225,
110
135,
506
89,6
04
Ap
ach
e5,
811
2,97
32,
838
1,82
51,
013
Coc
his
e7,
445
3,77
93,
666
2,26
91,
397
Coc
onin
o11
,380
4,05
77,
323
2,49
24,
831
Gila
2,91
01,
511
1,39
989
150
8
Gra
ham
2,85
91,
431
1,42
890
452
4
Gre
enle
e78
939
439
525
314
2
La P
az91
947
644
328
515
8
Mar
icop
a27
9,83
814
1,85
713
7,98
185
,174
52,8
07
Moh
ave
10,5
435,
329
5,21
43,
442
1,77
2
Nav
ajo
8,04
44,
165
3,87
92,
511
1,36
8
Pim
a63
,616
30,0
2033
,596
18,2
7315
,323
Pin
al26
,163
13,9
6212
,201
8,07
84,
123
San
ta C
ruz
4,08
32,
088
1,99
51,
259
736
Yav
apai
10,7
225,
338
5,38
43,
350
2,03
4
Yu
ma
14,9
627,
594
7,36
84,
500
2,86
8
h
ttp:
//pu
b.az
dhs.
gov/
heal
th-s
tats
Not
e: Po
pula
tion
deno
min
ator
tab
les
can
be fou
nd:
TAB
LE 3
2P
OP
ULA
TIO
N O
F FE
MA
LES
19
OR
YO
UN
GER
BY
CO
UN
TY O
F R
ESID
ENC
E, A
RIZ
ON
A,
20
16
All
19
yea
rs o
r yo
un
ger
10
-14
yea
rs
15
-19
yea
rs
Teen Pregnancy, Arizona 2006-2016 40
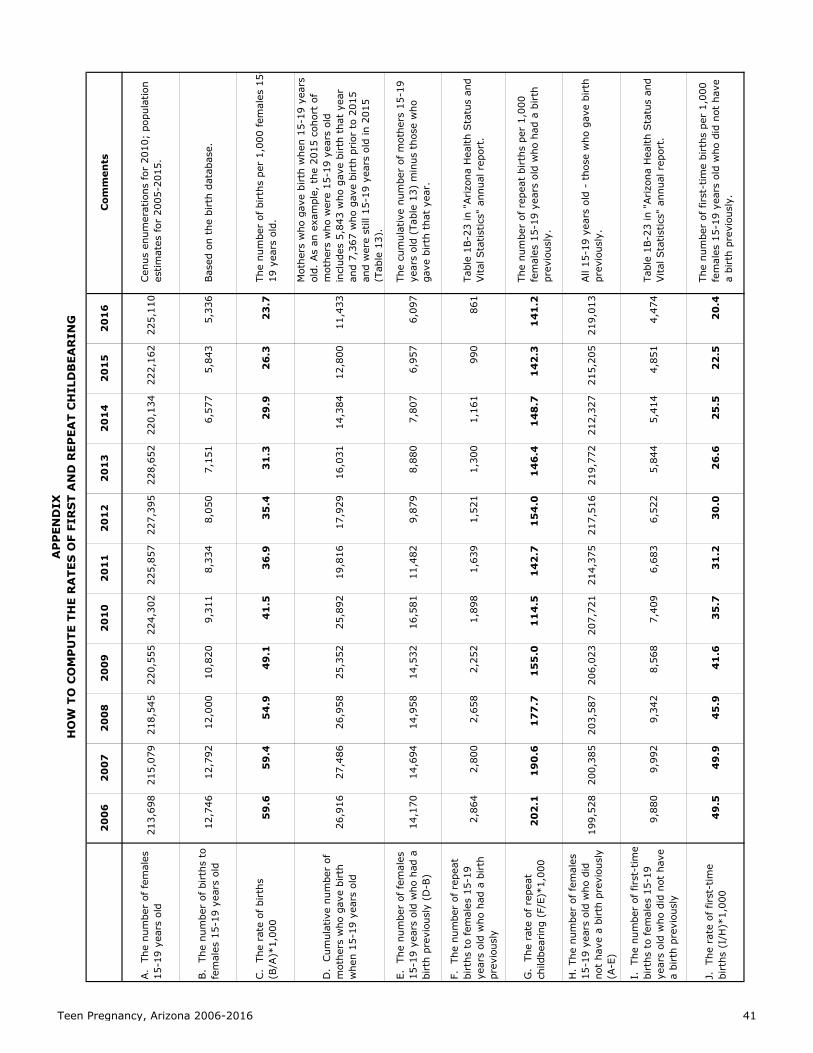
20
06
20
07
20
08
20
09
20
10
20
11
20
12
20
13
20
14
20
15
20
16
Com
men
ts
A.
The
num
ber
of fem
ales
15
-19
year
s ol
d21
3,69
821
5,07
921
8,54
522
0,55
522
4,30
222
5,85
722
7,39
522
8,65
222
0,13
422
2,16
222
5,11
0Cen
us e
num
erat
ions
for
201
0; p
opul
atio
n es
timat
es for
200
5-20
15.
B.
The
num
ber
of b
irth
s to
fe
mal
es 1
5-19
yea
rs o
ld12
,746
12,7
9212
,000
10,8
209,
311
8,33
48,
050
7,15
16,
577
5,84
35,
336
Bas
ed o
n th
e bi
rth
data
base
.
C.
The
rat
e of
birth
s (B
/A)*
1,00
05
9.6
59
.45
4.9
49
.14
1.5
36
.93
5.4
31
.32
9.9
26
.32
3.7
The
num
ber
of b
irth
s pe
r 1,
000
fem
ales
15-
19 y
ears
old
.
D.
Cum
ulat
ive
num
ber
of
mot
hers
who
gav
e bi
rth
whe
n 15
-19
year
s ol
d26
,916
27,4
8626
,958
25,3
5225
,892
19,8
1617
,929
16,0
3114
,384
12,8
0011
,433
Mot
hers
who
gav
e bi
rth
whe
n 15
-19
year
s ol
d. A
s an
exa
mpl
e, t
he 2
015
coho
rt o
f m
othe
rs w
ho w
ere
15-1
9 ye
ars
old
incl
udes
5,8
43 w
ho g
ave
birt
h th
at y
ear
and
7,36
7 w
ho g
ave
birt
h pr
ior
to 2
015
and
wer
e st
ill 1
5-19
yea
rs o
ld in
201
5 (T
able
13)
.
E. Th
e nu
mbe
r of
fem
ales
15
-19
year
s ol
d w
ho h
ad a
bi
rth
prev
ious
ly (
D-B
)14
,170
14,6
9414
,958
14,5
3216
,581
11,4
829,
879
8,88
07,
807
6,95
76,
097
The
cum
ulat
ive
num
ber
of m
othe
rs 1
5-19
ye
ars
old
(Tab
le 1
3) m
inus
tho
se w
ho
gave
birth
tha
t ye
ar.
F. Th
e nu
mbe
r of
rep
eat
birt
hs t
o fe
mal
es 1
5-19
ye
ars
old
who
had
a b
irth
pr
evio
usly
2,86
42,
800
2,65
82,
252
1,89
81,
639
1,52
11,
300
1,16
199
086
1Ta
ble
1B-2
3 in
"Arizo
na H
ealth
Sta
tus
and
Vita
l Sta
tistic
s" a
nnua
l rep
ort.
G.
The
rat
e of
rep
eat
child
bear
ing
(F/E
)*1,
000
20
2.1
19
0.6
17
7.7
15
5.0
11
4.5
14
2.7
15
4.0
14
6.4
14
8.7
14
2.3
14
1.2
The
num
ber
of r
epea
t bi
rths
per
1,0
00
fem
ales
15-
19 y
ears
old
who
had
a b
irth
pr
evio
usly
.
H.
The
num
ber
of fem
ales
15
-19
year
s ol
d w
ho d
id
not
have
a b
irth
pre
viou
sly
(A-E
)
199,
528
200,
385
203,
587
206,
023
207,
721
214,
375
217,
516
219,
772
212,
327
215,
205
219,
013
All
15-1
9 ye
ars
old
- th
ose
who
gav
e bi
rth
prev
ious
ly.
I. Th
e nu
mbe
r of
first
-tim
e bi
rths
to
fem
ales
15-
19
year
s ol
d w
ho d
id n
ot h
ave
a bi
rth
prev
ious
ly
9,88
09,
992
9,34
28,
568
7,40
96,
683
6,52
25,
844
5,41
44,
851
4,47
4Ta
ble
1B-2
3 in
"Arizo
na H
ealth
Sta
tus
and
Vita
l Sta
tistic
s" a
nnua
l rep
ort.
J. Th
e ra
te o
f fir
st-t
ime
birt
hs (
I/H
)*1,
000
49
.54
9.9
45
.94
1.6
35
.73
1.2
30
.02
6.6
25
.52
2.5
20
.4Th
e nu
mbe
r of
first
-tim
e bi
rths
per
1,0
00
fem
ales
15-
19 y
ears
old
who
did
not
hav
e a
birt
h pr
evio
usly
.
AP
PEN
DIX
HO
W T
O C
OM
PU
TE T
HE
RA
TES
OF
FIR
ST
AN
D R
EPEA
T C
HIL
DB
EAR
ING
Teen Pregnancy, Arizona 2006-2016 41

Our Web site at http://www.azdhs.gov/plan provides access to a wide range of statistical information about the health status of Arizonans. The Arizona Health Status and Vital Statistics annual report examines trends in natality, mortality, and morbidity towards established health objectives. In addition to the print and original online versions, the 2016 report is made available as a mobile-friendly e-book. Additional reports and studies include Advance Vital Statistics by County of Residence, Injury Mortality among Arizona Residents (accidents, suicides, homicides, legal intervention, firearm-related fatalities, drug-related deaths, drowning deaths, falls among Arizonans 65 years or older), Hospital Inpatient and Emergency Room Statistics (first-listed diagnosis, procedures, mental disorders, asthma, diabetes, influenza and pneumonia, and substance abuse), Community Vital Statistics, Teenage Pregnancy, Differences in Health Status Among Racial/Ethnic Groups, and Health Status Profile of American Indians in Arizona.
ARIZONA DEPARTMENT OF HEALTH SERVICES Bureau of Public Health Statistics
Population Health and Vital Statistics Section


![Teenage Pregnancy in KZN - KwaZulu-Natal€“ Permission from Department of Basic Education and Health ... Pongola “ ... Teenage Pregnancy in KZN [Compatibility Mode]](https://img.pdfslide.us/doc/110x75/5b1a70f47f8b9a3c258daa84/teenage-pregnancy-in-kzn-kwazulu-permission-from-department-of-basic-education.jpg)