Embed Size (px)
Citation preview

TEEKAYTEEKAY
TEEKAY TANKERS Q4 AND FISCAL 2015 EARNINGS PRESENTATION
February 19, 2016
2
Forward Looking Statements
This presentation contains forward-looking statements (as defined in Section 21E of the Securities Exchange Act of 1934,
as amended) which reflect management’s current views with respect to certain future events and performance, including
statements regarding: future dividend payout ratio; the impact of the U.S. government’s decision to lift the ban on crude oil
exports, including new trade routes for mid-size tankers; the crude oil and refined product tanker market fundamentals,
including the balance of supply and demand in the tanker market, estimated growth in the world tanker fleet, estimated
growth in global oil demand, crude oil tanker demand and OPEC crude oil supply; tanker fleet utilization, spot tanker rates,
the potential for localized floating storage and port delays and future newbuild ordering; the effect of lower global oil
prices, including the potential impact on oil stockpiling, refinery throughput and bunker fuel prices; the impact of the tanker
market on the Company’s earnings, free cash flow, net asset value, future dividends and financial leverage, including the
estimated dividend payout range; the delivery of one chartered-in Aframax tanker; the impact of the lightering Aframax
tanker acquisition on the Company’s earnings and free cash flow per share; and the impact on the Company’s debt
maturity profile and financial flexibility as a result of the new $900 million long-term debt facility, including the Company’s
scheduled repayments. The following factors are among those that could cause actual results to differ materially from the
forward-looking statements, which involve risks and uncertainties, and that should be considered in evaluating any such
statement: changes in the production of, or demand for, oil or refined products; changes in trading patterns significantly
affecting overall vessel tonnage requirements; greater or less than anticipated levels of tanker newbuilding orders and
deliveries and greater or less than anticipated rates of tanker scrapping; changes in global oil prices; changes in
applicable industry laws and regulations and the timing of implementation of new laws and regulations; the amount of
cash reserves established by the Company’s Board of Directors; actual payout ratio determined by the Company’s Board
of Directors; increased costs; and other factors discussed in Teekay Tankers’ filings from time to time with the United
States Securities and Exchange Commission, including its Report on Form 20-F for the fiscal year ended December 31,
2014 and on Form 6-K for the quarters ended March 31, 2015, June 30, 2015 and September 30, 2015. The Company
expressly disclaims any obligation or undertaking to release publicly any updates or revisions to any forward-looking
statements contained herein to reflect any change in the Company’s expectations with respect thereto or any change in
events, conditions or circumstances on which any such statement is based.

3
Recent Highlights • Q4-15 Financial Results
○ Generated adjusted net income1 of
$48.5 million, or $0.31 per share,
versus adjusted net income of
$18.6 million, or $0.21 per share in
Q4-14
○ Generated free cash flow1 of $74.0
million, or $0.48 per share, versus
$31.7 million, or $0.35 per share in
Q4-14
• Implemented new earnings-based
variable dividend policy
• Acquired two purpose-built lightering
Aframaxes for $80 million en bloc to
bolster strategic US Gulf presence
• Refinanced majority of fleet through
new five-year, ~$900 million debt
facility
(1) See the Q4-15 earnings release for explanations and reconciliations of these non-
GAAP measures to the most directly comparable financial measures under GAAP.

4
• Distribute 30% to 50% of quarterly adjusted net income, while maintaining minimum
quarterly dividend of $0.03 per share
○ Significantly increased dividend from $0.03 per share to $0.12 per share in Q4-15
• New dividend policy provides investors opportunity to directly participate in Company’s
strong free cash flow
• Maintains financial flexibility and allows for continued balance sheet delevering
Dividend Increase Rewarding shareholders while continuing to build financial strength
Annual Dividend Per Share1
(1) Based on estimated results for fiscal year 2016 assuming current fleet
(2) Aframax equivalent TCE: Suezmax = 1.30x, LR2 = 1.00x, MR = 0.70x
(3) Based on 40% dividend payout
(4) Pro-forma to include Q1-15 vessel acquisitions that were committed for in Q4-14
60%4
55%
46%
72%
43%
40%
30%
40%
50%
60%
70%
80%
Q4-2013 Q4-2014 Q4-2015 Q4-2016
Net Debt to Book Capitalization
Financial Leverage3
Aframax Equivalent TCE2
$25,000
$30,000
$35,000
$0.00
$0.20
$0.40
$0.60
$0.80
$1.00
$1.20
$1.40
$10,000 $15,000 $20,000 $25,000 $30,000 $35,000
$ P
er
Sh
are
Aframax Equivalent TCE2
Payout range based
on new variable
dividend policy
Dividend Floor
5
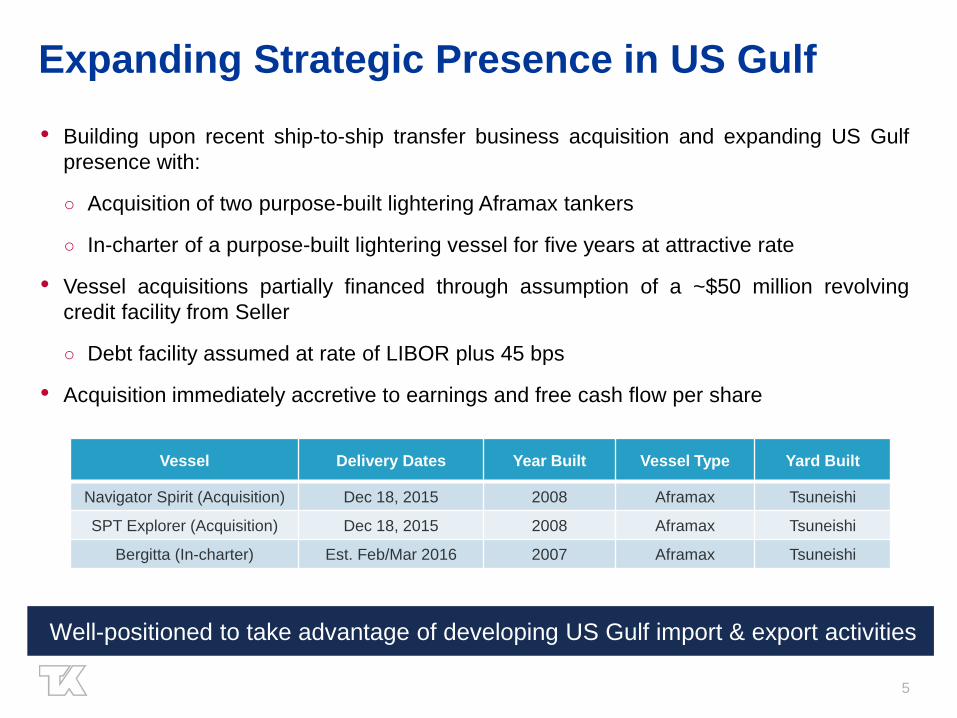
Vessel Delivery Dates Year Built Vessel Type Yard Built
Navigator Spirit (Acquisition) Dec 18, 2015 2008 Aframax Tsuneishi
SPT Explorer (Acquisition) Dec 18, 2015 2008 Aframax Tsuneishi
Bergitta (In-charter) Est. Feb/Mar 2016 2007 Aframax Tsuneishi
Expanding Strategic Presence in US Gulf
• Building upon recent ship-to-ship transfer business acquisition and expanding US Gulf
presence with:
○ Acquisition of two purpose-built lightering Aframax tankers
○ In-charter of a purpose-built lightering vessel for five years at attractive rate
• Vessel acquisitions partially financed through assumption of a ~$50 million revolving
credit facility from Seller
○ Debt facility assumed at rate of LIBOR plus 45 bps
• Acquisition immediately accretive to earnings and free cash flow per share
Well-positioned to take advantage of developing US Gulf import & export activities

6
Secured New Debt Facility
• Completed ~$900 million debt facility in January 2016 which includes both term loan and
revolving credit facility components
○ 1.4 times oversubscribed
○ Used to refinance 36 existing vessels
○ Replaces five facilities including TNK’s two bridge loans which matured in January
2016 and its main revolving credit facility which was scheduled to mature in November
2017
• Provides financial flexibility while extending debt maturity profile to 2021
2016 2017 2018 2019 2020 2021
0
100
200
300
400
500
600
700
1 2 3 4 5 6 7 8 9 10 11 12 13 14 15 16 17 18 19
$ M
illio
ns
Pre-refinancing (Scheduled Repayments) Pre-refinancing (Bullet Payments)
Post-refinancing (Scheduled Repayments) Post-refinancing (Bullet Payments)
Scheduled Debt Repayment Profile (Assumes Revolving Credit Facilities are Fully Drawn)

7
0
10,000
20,000
30,000
40,000
50,000
60,000
US
D/d
ay
2015 Crude Tanker Rates
Suezmax Aframax
0 10,000 20,000 30,000 40,000 50,000
Aframax
Suezmax
$ / day
Annual Average Crude Tanker Rates
2015
2014
2013
2012
2011
2010
2009
2015: Strongest Crude Tanker Rates In 7 Years
Source: 90% Clarksons
Low fleet growth and surging demand gave rise to rate volatility
• The strong tanker market in 2015 was driven by a combination of factors:
○ Low crude tanker fleet growth of ~2%
○ 1.0 mb/d increase in OPEC crude oil production led by Saudi Arabia and Iraq
○ 5-year high global oil demand growth of 1.7 mb/d
○ Strong refining margins, strategic & commercial stockpiling and lower bunker prices
were all driven by the lowest crude oil prices seen in 11 year (averaging $52 / bbl)

8
2016: Strong Demand Fundamentals Intact
93.5
94.0
94.5
95.0
95.5
96.0
96.5
97.0
Q1-2016 Q2-2016 Q3-2016 Q4-2016
Millio
n b
bl /
day
Rising Global Oil Demand
Source: IEA
0
50
100
150
200
250
300
350
400
2016 Stockbuild Storage Capacity
Millio
n B
arr
els
2016 Stock build vs. Spare Storage Capacity
New Capacity -China
New Capacity -Other
Available USStorage
Source: IEA
Low oil prices are positive for tanker demand
• Global oil demand is expected to grow by ~1.2 mb/d
• Increase in crude trade volumes due to rising OPEC supply (Iran +0.5 mb/d)
• Ullage delays / floating storage as a result of rising global oil inventories
• Vessel fuel costs expected to remain low due to weak global bunker prices

9
New Trade Routes for Mid-Size Tankers US import / export changes & Panama Canal expansion create opportunities
PANAMA CANAL
Expansion from Q2-16 may drive transshipment
opportunities through the Canal:
• US crude & product to Asia on Aframaxes / LR2s
• WCSA crude to USG / Caribs or CBS to USWC and Asia
US GULF
New import / export dynamics have the potential to drive
increased demand for STS services via:
• A return to long haul imports from WAF and Middle East
• Reverse lightering for new US crude exports
• The US is now free to export surplus light sweet crude to markets in Europe and Asia
• Volume of trade dependent on relative pricing between US crude and international grades (exports
will increase when US crude is trading at a discount)
• Conversely, US Atlantic Coast refineries may import more WAF crude on Suezmaxes when US crude
is trading at a premium

10
Fleet Utilization Remains High in 2016 Demand growth is sufficient to largely offset higher tanker fleet growth
78%
80%
82%
84%
86%
88%
90%
92%
-2%
0%
2%
4%
6%
8%2
00
8
200
9
201
0
201
1
201
2
201
3
201
4
201
5
201
6E
% F
lee
t U
tili
za
tio
n
% S
up
ply
/ D
em
an
d G
row
th
Tanker Demand Growth Tanker Supply Growth Fleet Utilization
Source: Clarksons / Internal Assumptions
• Tanker ordering is expected to moderate in 2016 as owners face additional cost of NOx Tier
III compliance.
• Tighter credit conditions and lack of private equity interest in the sector will dampen new-build
demand
○ No tanker orders have been placed in 2016-to-date
• Ballast Water Treatment Systems (BWTS) legislation could give upside to scrapping in the
next 12-24 months

11
Q1-16 Spot Earnings Update
• Spot rates averaged significantly higher year-on-year in Q4-15
• Strong demand fundamentals lead to continued strength in Q1-16
Suezmax Aframax LR2
Q1-16 spot ship
days 1,717 1,369 731
Q1-16 % booked
to-date 63% 54% 54%
$39,433
$30,708
$24,899
$40,580
$28,393 $27,120
$-
$10,000
$20,000
$30,000
$40,000
$50,000
Suezmax Aframax RSA LR2
Q1-15 Actual Q1-16 to-date
$26,627 $25,677
$21,884
$41,430
$31,575
$26,468
$-
$10,000
$20,000
$30,000
$40,000
$50,000
Suezmax Aframax RSA LR2
Q4-14 Actual Q4-15 Actual

12
Building our brand, our capabilities and our financial strength
Focusing on core segments, aligning sea and shore capabilities to
drive our operational excellence
Expansion and modernization of our fleet • Invested ~$1 billion in 19 modern Suezmax, Aframax and LR2 tankers
• Reduced our fleet age profile by 2 years
• Generated $42 million of net income through 15 in-chartered vessels
Refocusing customer strategy by consolidating Teekay Tanker brand • Brought technical management back in-house
• Brought all our fleet’s commercial management back under Teekay control
• Added new services dimension in form of Ship-to-Ship transfer capabilities
Enhancing financial strength and rewarding shareholder loyalty • Reduced financial leverage to 55% in 2015
• Implemented higher pay-out variable dividend policy
• Refinanced debt facilities
2015 Year in Review

13
APPENDIX

14
Fleet Employment Profile
(1) 50/50 profit share if earnings are above $12,000/day and $13,000/day, respectively
(2) 50/50 profit share if earnings are between $16,000 and $24,000 /day plus 75/25 profit share in TNK’s favor if earnings are above
$24,001/day
(3) The Company’s ownership interest in this vessel is 50%. 50/50 profit share if earnings are above $40,500/day
In-Charter Portfolio
Aframax 2008
Aframax 2008
Aframax 2008
Aframax 2008
Aframax 2009
Aframax 2008
Aframax 2008
Aframax 2008
Aframax 2003
Aframax 2007
Aframax 2002
LR2 2006
LR2 2009
LR2 2001
Out-Charter Porfolio
Aframax 2004
Aframax 2005
Aframax 2008
Aframax 2004
Aframax 2005
Aframax 2004
Aframax 2004
LR2 2001
Suezmax 2012
Suezmax 2006
Suezmax 2006
Suezmax 2009
Suezmax 2004
VLCC 2013
4Q15 1Q16 2Q16 3Q16 4Q16 1Q17 2Q17 3Q17 4Q17 1Q18 2Q18 3Q18
$12,000 (1)
$18,600
$25,000
$21,000
Optional Period
$32,906
$29,000
$24,900
$17,750
$17,750
$18,500
$20,500
$16,000 (2)
$16,250
$18,900
$22,000
$22,000
$15,600
$16,750
$24,000
$19,500
$18,066
$32,906
$18,066
$25,000
$37,500 (3)
$28,000
$19,500
$22,750
Optional Period
$13,000(1)
Optional Period
$26,000 Optional Period
Optional Period
$15,500

15
Drydock & Offhire Schedule
Teekay Tankers
Segment
Vessels
Total
Off-hire
Days
Vessels
Total
Off-hire
Days
Vessels
Total
Off-hire
Days
Vessels
Total
Off-hire
Days
Vessels
Total
Off-hire
Days
Spot Tanker 1 10 1 23 1 14 - - 3 47
Fixed-Rate Tanker 1 91 - 15 - - - - 1 106
2 101 1 38 1 14 - - 4 153
Note:
(1) In the case that a vessel drydock straddles between quarters, the drydock has been allocated to the quarter in which majority of drydock days occur.
(2) Only owned vessels were accounted for in this schedule.
March 31, 2016 (E) June 30, 2016 (E) September 30, 2016 (E) December 31, 2016 (E) Total 2016

16
Q4-15 vs. Q3-15 Results
• $40m increase from the Principal vessels acquired during Q3-15 and Q4-15;
• $2m increase from a full quarter impact of the full service lightering and lightering
support business from the acquisition of SPT; and partially offset by
• $2m decrease from heavier drydocking activity;
• $2m decrease due to employment changes;
• $1m decrease due to lower average realized spot TCE rates; and
• $1m decrease due to the sale of the Mahanadi Spirit .
• $10m increase due to the purchase of the Principal vessels;
• $3m increase due to timing/scope of repair and planned maintenance activities;
and
• $2m increase from a full quarter of operations for the ship-to-ship transfer
business.
Time charter hire expense (23,403) (22,600) • Increase mainly due to higher time-charter rates on two vessels from exercising
of options to extend.
Depreciation and amortization (25,130) (17,399) • Increase mainly due to the impact of the Principal vessels acquired and higher
drydock amortization costs.
General and administrative expenses (6,217) (4,138) • Increase due to higher costs associated with additional administrative, legal and
strategic support related to recent acquisitions and refinancing activity.
Income from operations 54,599 45,070
Net interest expense and realized loss on derivative
instruments
(10,002) (6,351) • Increase due to higher interest and loan cost amortization expense associated
with the bridge loan, which was to partially finance the purchase of the Principal
vessels.
• $2m increase in equity income from TIL is primarily due to a full quarter of
operations of their newly acquired vessels and higher average spot rates earned in
Q4-15; and
Equity income • $1m increase in equity income from TTOL is mainly due to higher management
fee income due to the new full services lightering pool commenced in November
2015.
Other expense (1,661) (1,341) Other expense consists mainly of freight tax expenses.
Adjusted net income attributable to shareholders
of Teekay Tankers 48,542 40,297
Adjusted net income per share 0.31 0.30
(1) Adjusted net income attributable to the shareholders of Teekay Tankers is a non-GAAP financial measure. Both periods exclude the results of Entities under Common Control. Please refer to Appendix A to the Q4-15
and Q3-15 Earnings Releases.
Vessel operating expenses (33,574)
($’000’s, except share and per share data)
Q3-15 Adjusted
(unaudited)(1) Comments
Net revenues 122,781
2,919
Q4-15 Adjusted
(unaudited)(1)
157,907
(48,558)
5,606