Embed Size (px)
Citation preview
TEEB Country StudiesCBD-COP 13 side event
6 December 2016, Cancun
Dr Salman Hussain
UNEP TEEB Office
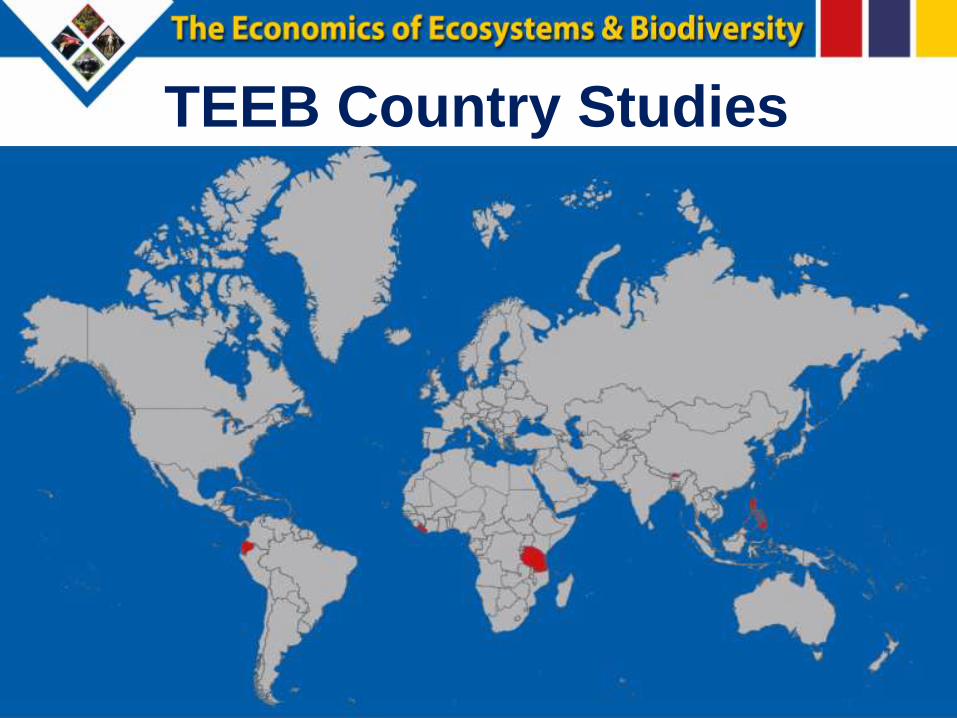
TEEB Country Studies
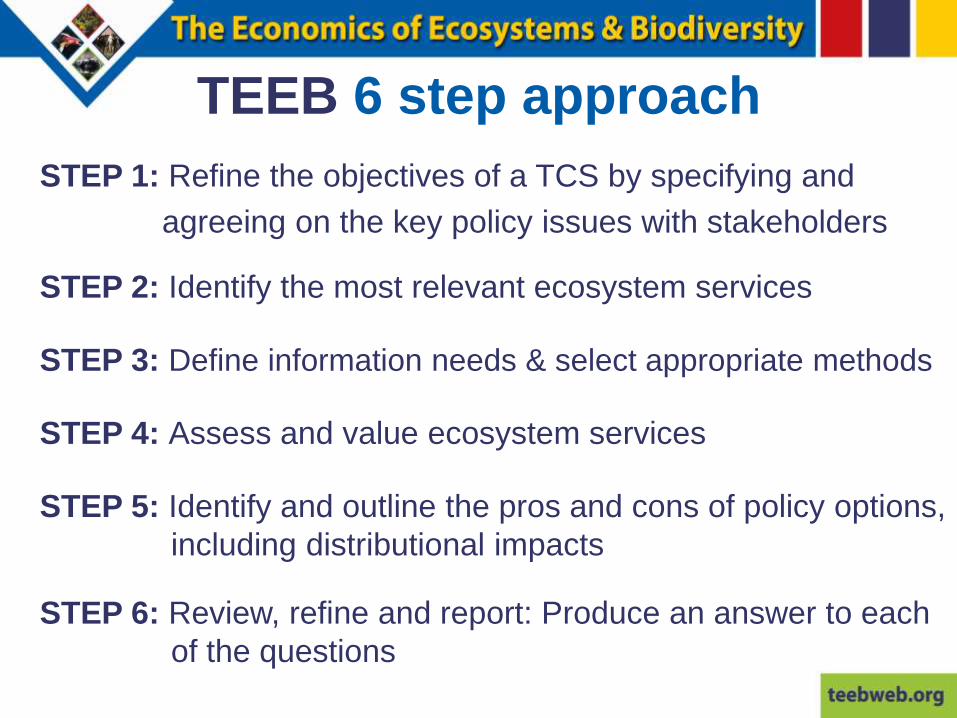
TEEB 6 step approach
STEP 1: Refine the objectives of a TCS by specifying and
agreeing on the key policy issues with stakeholders
STEP 2: Identify the most relevant ecosystem services
STEP 3: Define information needs & select appropriate methods
STEP 4: Assess and value ecosystem services
STEP 5: Identify and outline the pros and cons of policy options,
including distributional impacts
STEP 6: Review, refine and report: Produce an answer to each
of the questions
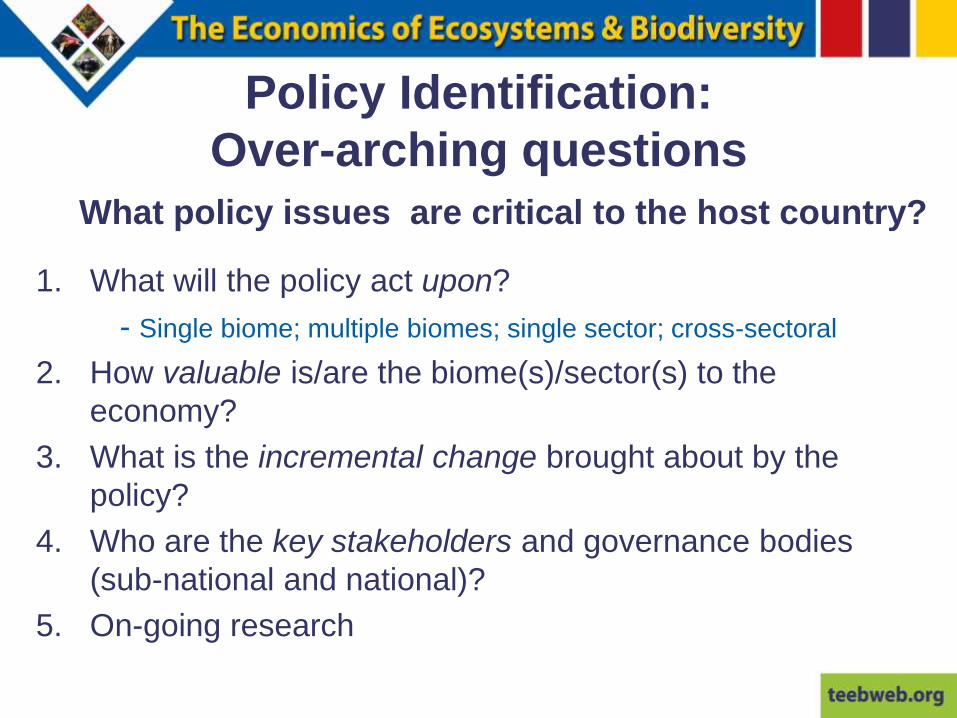
Policy Identification:
Over-arching questions
What policy issues are critical to the host country?
1. What will the policy act upon?
- Single biome; multiple biomes; single sector; cross-sectoral
2. How valuable is/are the biome(s)/sector(s) to the
economy?
3. What is the incremental change brought about by the
policy?
4. Who are the key stakeholders and governance bodies
(sub-national and national)?
5. On-going research

Thomas J. Chali
VICE PRESIDENT’S OFFICE-Environment
TEEB - Tanzania
THE RUFIJI RIVER BASIN

TEEB Project in TanzaniaThe study aimes at creating and comparing
alternative quantitative scenarios for land
management of the Rufiji River Basin in Tanzania.
The Rufiji watershed is critical for Tanzania’s
development;
draining 21% of the country,
The basin offers a variety of ecosystems and
biodiversity services including (food, timber,
Carbon sequestration, biodiversity etc
There are competing water use and land use
options in the basin; afforestation of mountain
grasslands, planned dam construction for
irrigation and HEP, and water-intensive farming
practices

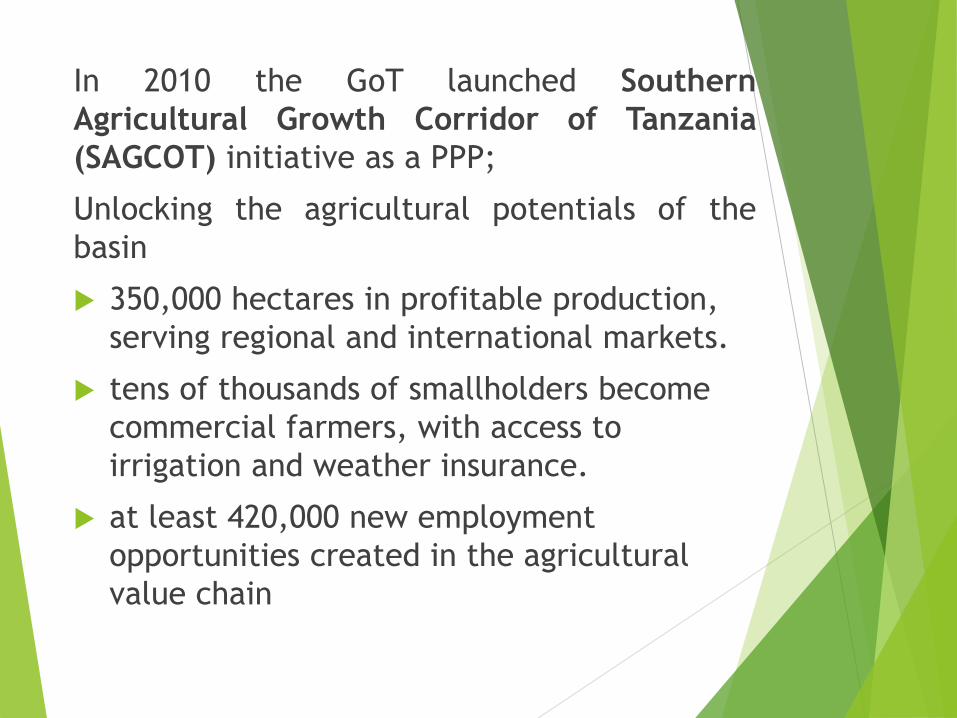
In 2010 the GoT launched Southern
Agricultural Growth Corridor of Tanzania
(SAGCOT) initiative as a PPP;
Unlocking the agricultural potentials of the
basin
350,000 hectares in profitable production,
serving regional and international markets.
tens of thousands of smallholders become
commercial farmers, with access to
irrigation and weather insurance.
at least 420,000 new employment
opportunities created in the agricultural
value chain
Main Objective
“To examine major land uses/cover in
the Rufiji river catchment and conduct
policy scenario analyses to inform
policies for better land management in
the basin; through detecting long-term
trends and changes in stream flows and
how the changes are correlated to land
use/cover changes”.
Scope of the Study
In the Mountain Highland zone (1,900 –
2,700 m.a.s.l.), examined and compared
impacts of continued traditional conversion
of mountain grasslands to pine and
eucalyptus forest and agricultural expansion
In the Midlands zone (1500 and 1900
m.a.s.l.), examined the impacts on
ecosystem services under the BAU scenario,
under traditional conversion of natural
woodlands or forests into tea plantations,
fruits plantations, as per the BRN initiative.
In the Lowlands Rufiji River Delta zone
(0 to 2 m.a.s.l. ), considered the BAU
scenario involving continued traditional
conversion of mangrove forest to traditional
shifting paddy cultivation
Scenarios
Business As Usual (BAU)
simulated to estimate projected changes in the Kilombero
cluster under continuation of existing trends (e.g.
population growth, agriculture) and related impacts on
the environment (e.g. carbon sequestration and water
yield)
SAGCOT Scenario
Simulated to estimate projected changes in the Kilombero
cluster under the SAGCOT strategy
Aspects: water, food, carbon sequestration, land use
changes

Research Findings
Highest sediment yield is observed in the
uplands and midlands regions.
Lowlands have lower sediment yield
because the wetland acts as sediment
trap.
Between December and April the basin
experiences a water surplus due to excess
of rainfall over evaporation.
Between May and October the
evaporation exceeds the precipitation and
results in water deficits
Decline in carbon sequestration

Policy Implications
BAU
Population growth is projected to increase over time
following the historical trend, which will lead the
number of inhabitants to double by the year 2030
Population growth will cause a steady increase in
agriculture land to cover the demand for food,
which increases at the same rate as population
Total income from agriculture, which is the sum of
profits from smallholders and the labor income of
farm workers, will increase at its historical rate
Land conversion takes place to increase the amount
of agriculture land and urban area to accommodate
the needs of the growing population
SAGCOT
Expansion of farmland by 52,000ha (2018-
2022)
growth in food production for domestic and
export and income
risk of overusing surface and ground water
gains from SAGCOT may be short-lived, as side
effects and competition for water could
emerge in the medium term
attractive for the population and businesses
(more land for settlement and agriculture)
both scenarios, the expansion of agriculture
land bears the risk of over-extraction of
surface water especially dry months
Need for identification of suitable crops for
dry months and investments in water
efficiency technologies
Need for assessment of water budget for
proper planning of the basin (hectares, crop
types)
Policy Recommendations
Conclusion
“There is need for TEEB project not to end
up with NO or YES answers but balanced
scenario (negotiated from BAU and
SAGCOT) to advice the decision makers for
the development path that will maximize
benefits and minimize externalities to the
environment”

Aknowledgement
Institute of Resource Assessment (IRA)
University of Dar es Salaam (Technical TEEB
Team)
UNEP TEEB Team (Technical Backstopping )
Generous Support of European Commission

Thank You
Asante Sana
Mucho gracias
TEEB-Bhutan
December 6, 2016
Cancun


Landlocked
Eastern Himalayas: A Fragile Mountainous Landscapes
Heavily Forested
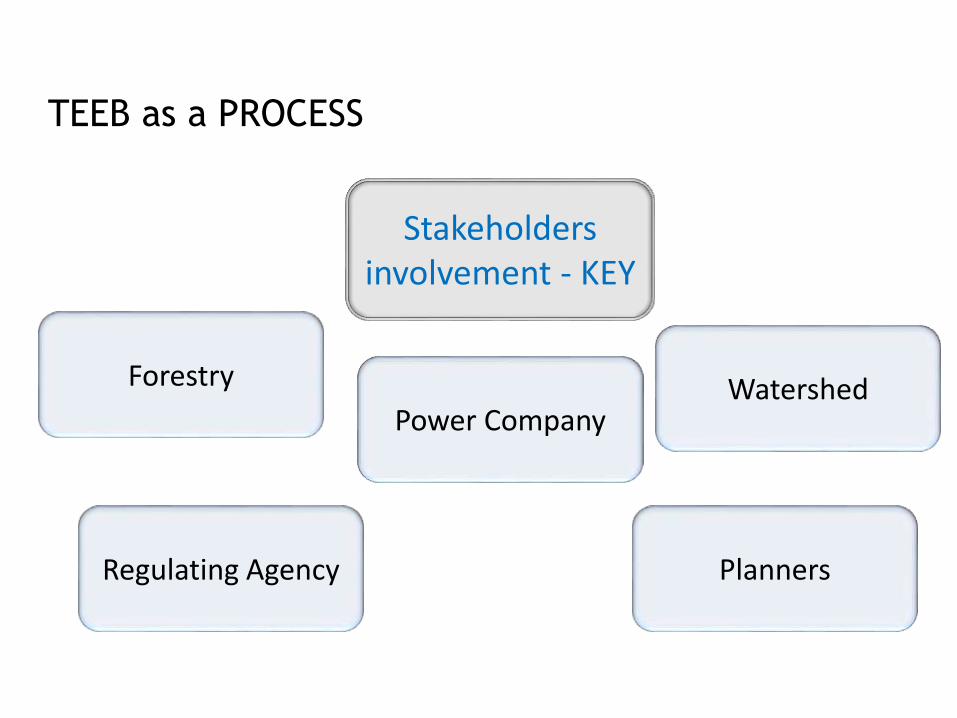
TEEB as a PROCESS
Stakeholders involvement - KEY
Regulating Agency
Power CompanyWatershedForestry
Planners
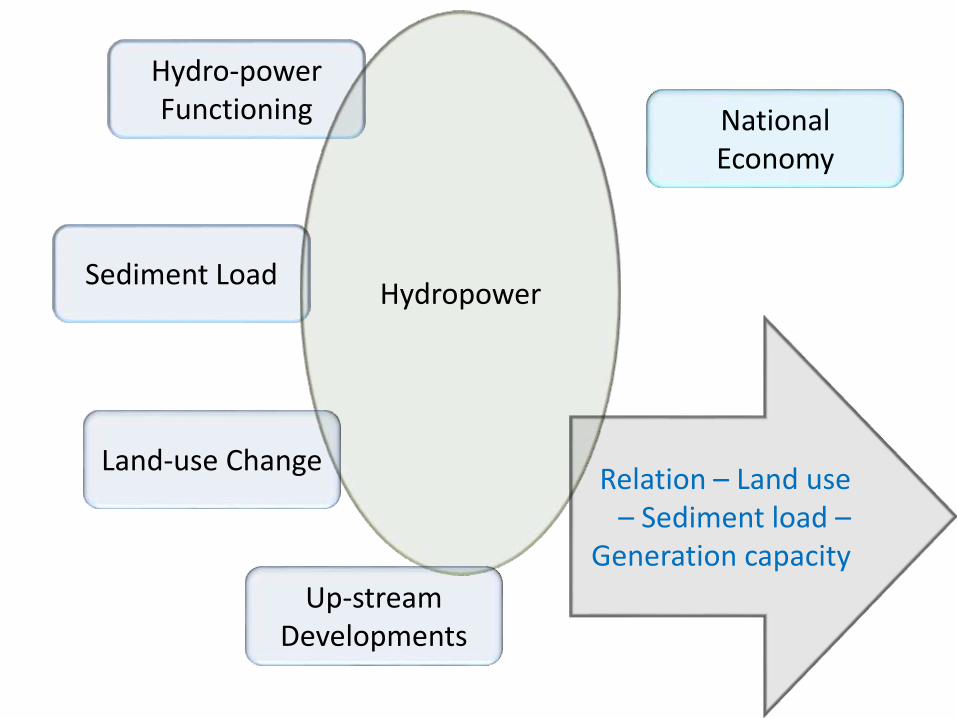
Sediment Load
Hydro-power Functioning
Hydropower
Land-use Change
Up-stream Developments
National Economy
Relation – Land use – Sediment load –
Generation capacity
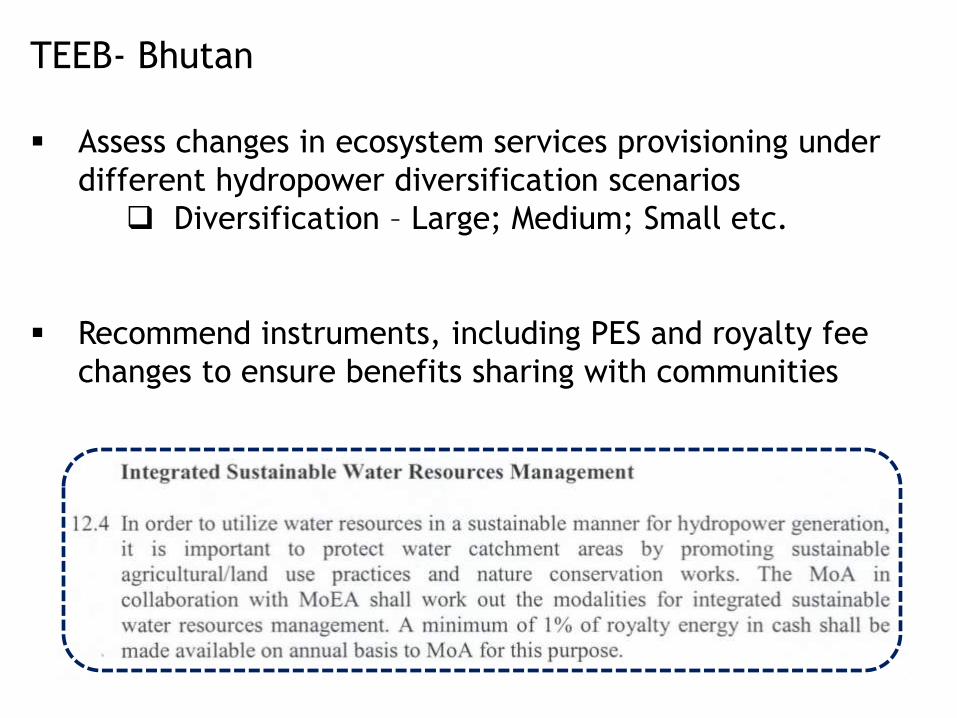
TEEB- Bhutan
Assess changes in ecosystem services provisioning under
different hydropower diversification scenarios
Diversification – Large; Medium; Small etc.
Recommend instruments, including PES and royalty fee
changes to ensure benefits sharing with communities
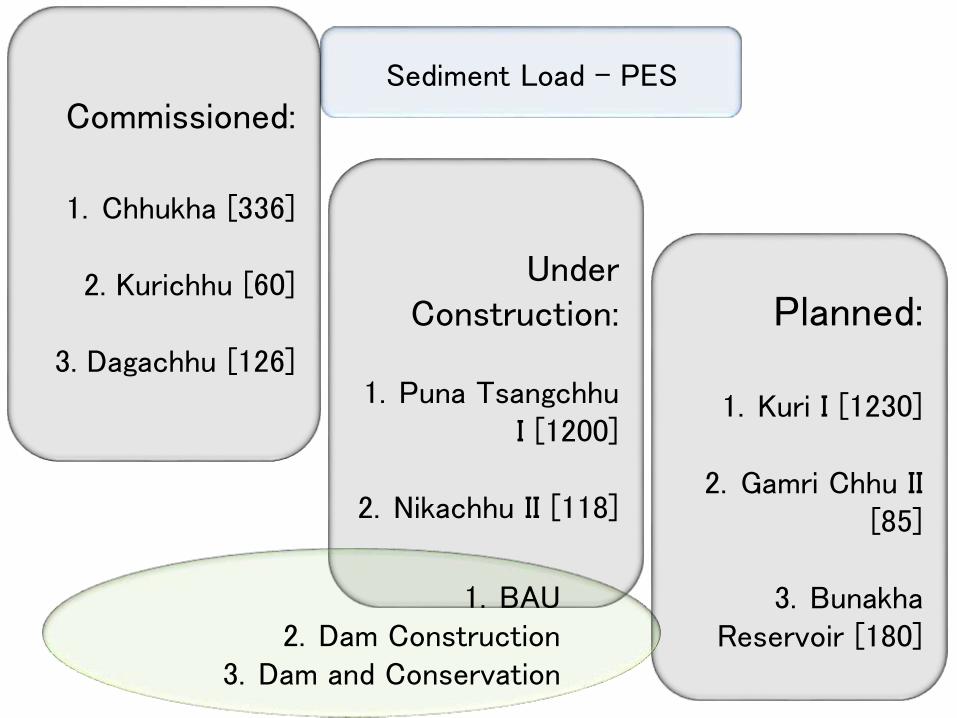
Commissioned:
1. Chhukha [336]
2. Kurichhu [60]
3. Dagachhu [126]
Under Construction:
1. Puna TsangchhuI [1200]
2. Nikachhu II [118]
Planned:
1. Kuri I [1230]
2. Gamri Chhu II [85]
3. BunakhaReservoir [180]
1. BAU2. Dam Construction
3. Dam and Conservation
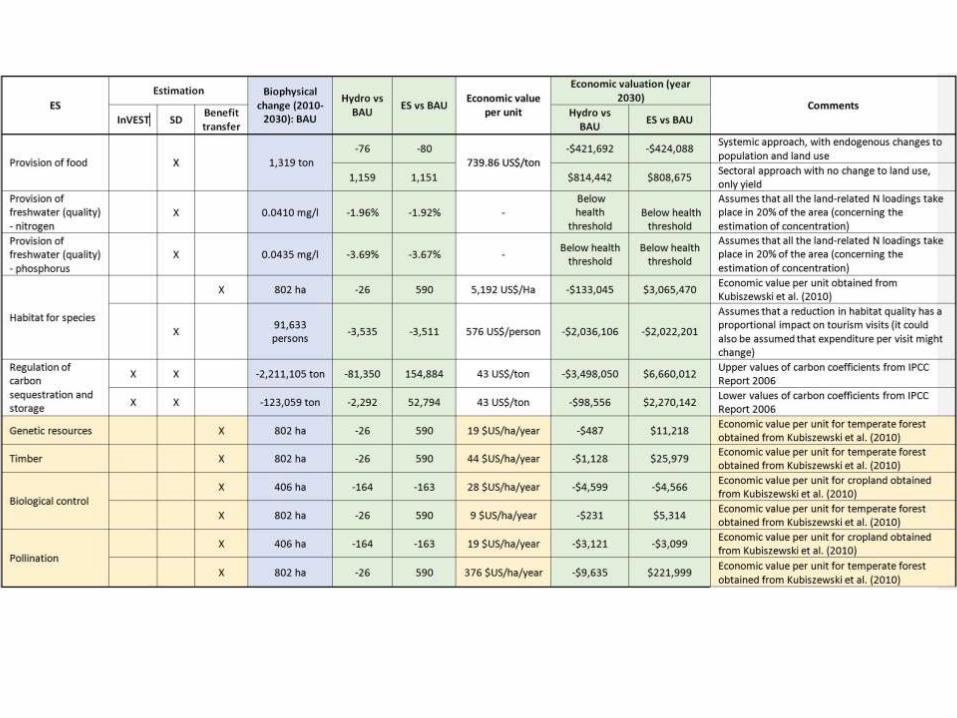
Sediment Load - PES
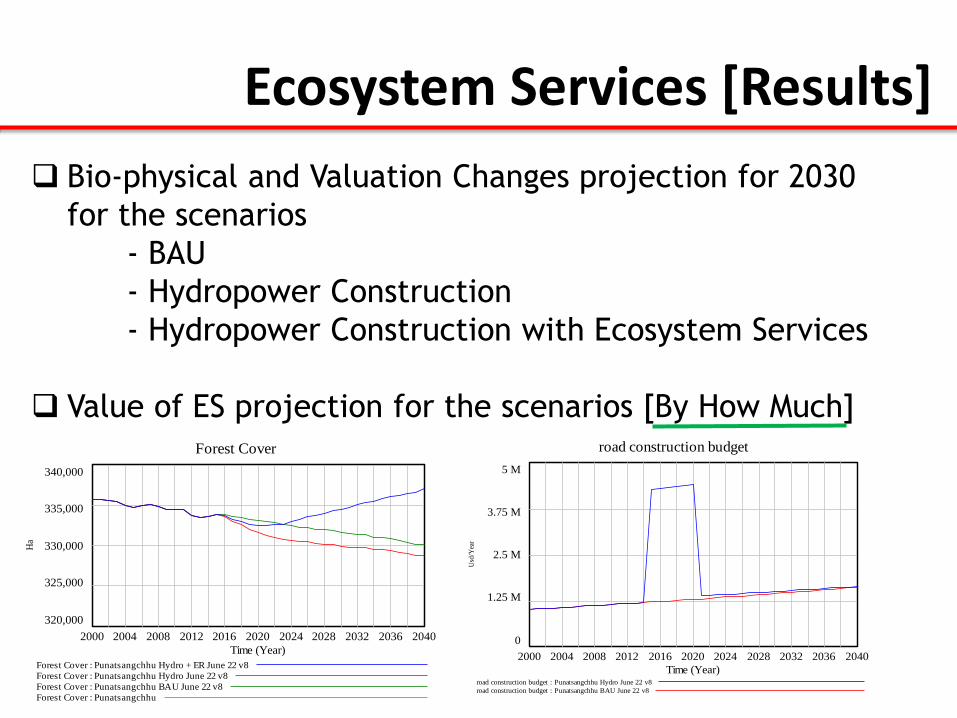
Bio-physical and Valuation Changes projection for 2030
for the scenarios
- BAU
- Hydropower Construction
- Hydropower Construction with Ecosystem Services
Value of ES projection for the scenarios [By How Much]
Ecosystem Services [Results]
Forest Cover
340,000
335,000
330,000
325,000
320,000
2000 2004 2008 2012 2016 2020 2024 2028 2032 2036 2040
Time (Year)
Ha
Forest Cover : Punatsangchhu Hydro + ER June 22 v8
Forest Cover : Punatsangchhu Hydro June 22 v8
Forest Cover : Punatsangchhu BAU June 22 v8
Forest Cover : Punatsangchhu
road construction budget
5 M
3.75 M
2.5 M
1.25 M
0
2000 2004 2008 2012 2016 2020 2024 2028 2032 2036 2040
Time (Year)
Usd
/Yea
r
road construction budget : Punatsangchhu Hydro June 22 v8
road construction budget : Punatsangchhu BAU June 22 v8
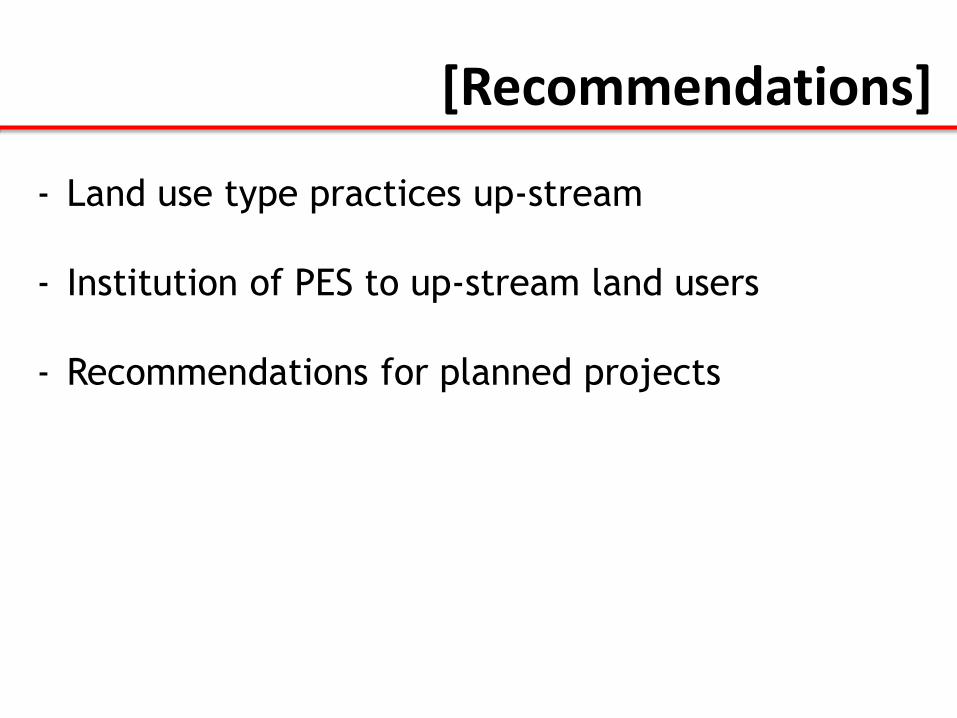
[Recommendations]
- Land use type practices up-stream
- Institution of PES to up-stream land users
- Recommendations for planned projects

Tashi Delek
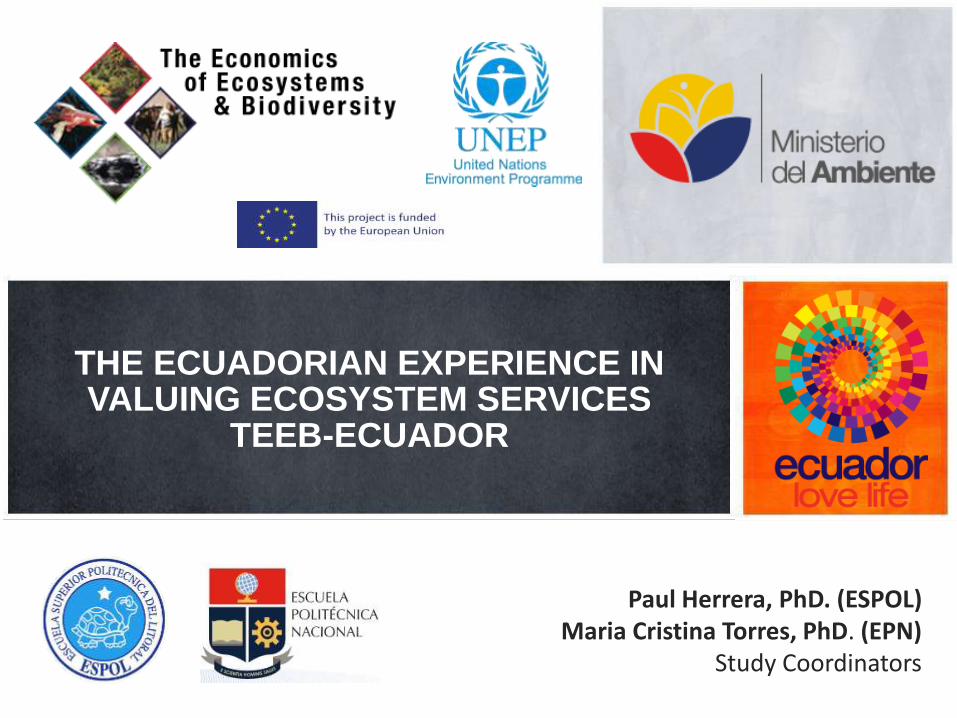
THE ECUADORIAN EXPERIENCE IN VALUING ECOSYSTEM SERVICES
TEEB-ECUADOR
Paul Herrera, PhD. (ESPOL)Maria Cristina Torres, PhD. (EPN)
Study Coordinators
CONTEXT
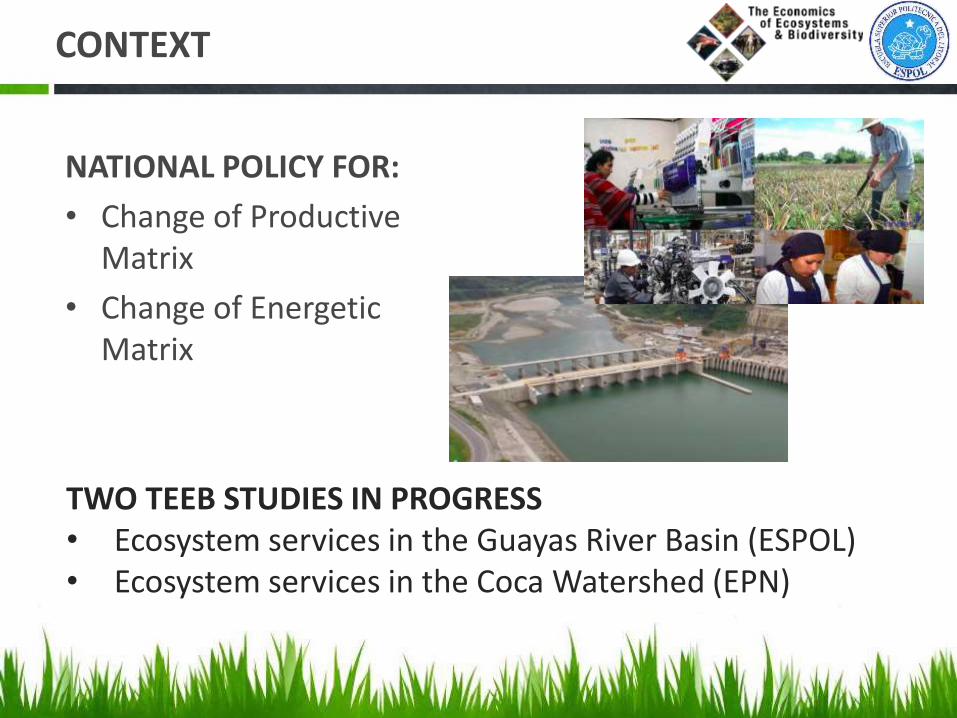
NATIONAL POLICY FOR:
• Change of Productive Matrix
• Change of Energetic Matrix
TWO TEEB STUDIES IN PROGRESS• Ecosystem services in the Guayas River Basin (ESPOL)• Ecosystem services in the Coca Watershed (EPN)
Integrating the Value of Ecosystem Services in the Cocoa Value Chain: the case of the Daule-Vinces
Irrigation project in the Guayas River Basin, Ecuador.
Paul Herrera, Ph.D.Study Coordinator
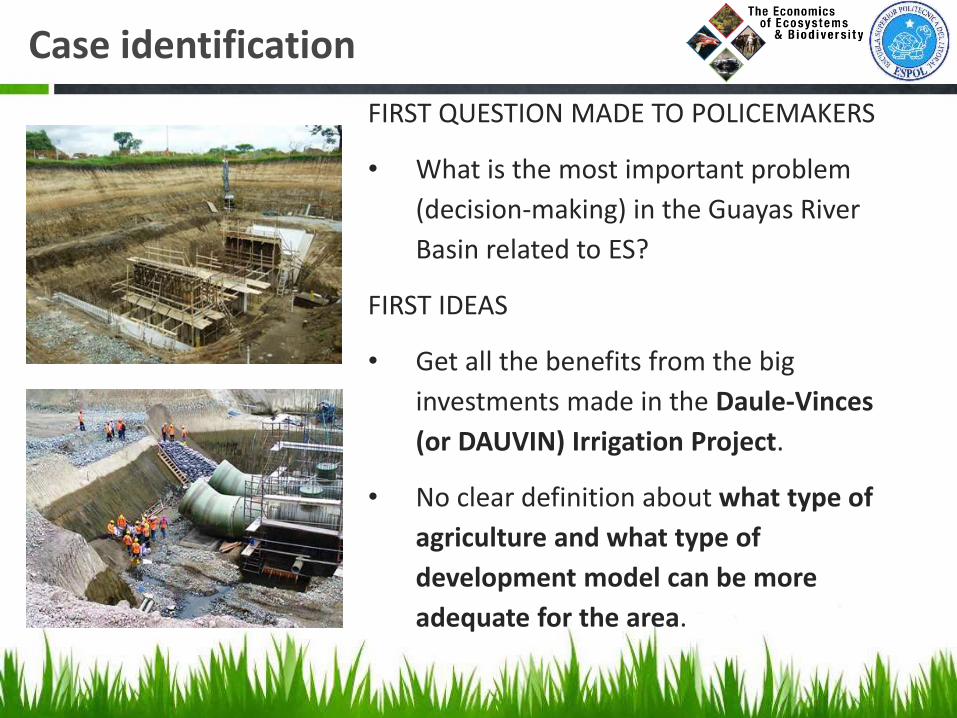
FIRST QUESTION MADE TO POLICEMAKERS
• What is the most important problem
(decision-making) in the Guayas River
Basin related to ES?
FIRST IDEAS
• Get all the benefits from the big
investments made in the Daule-Vinces
(or DAUVIN) Irrigation Project.
• No clear definition about what type of
agriculture and what type of
development model can be more
adequate for the area.
Case identification
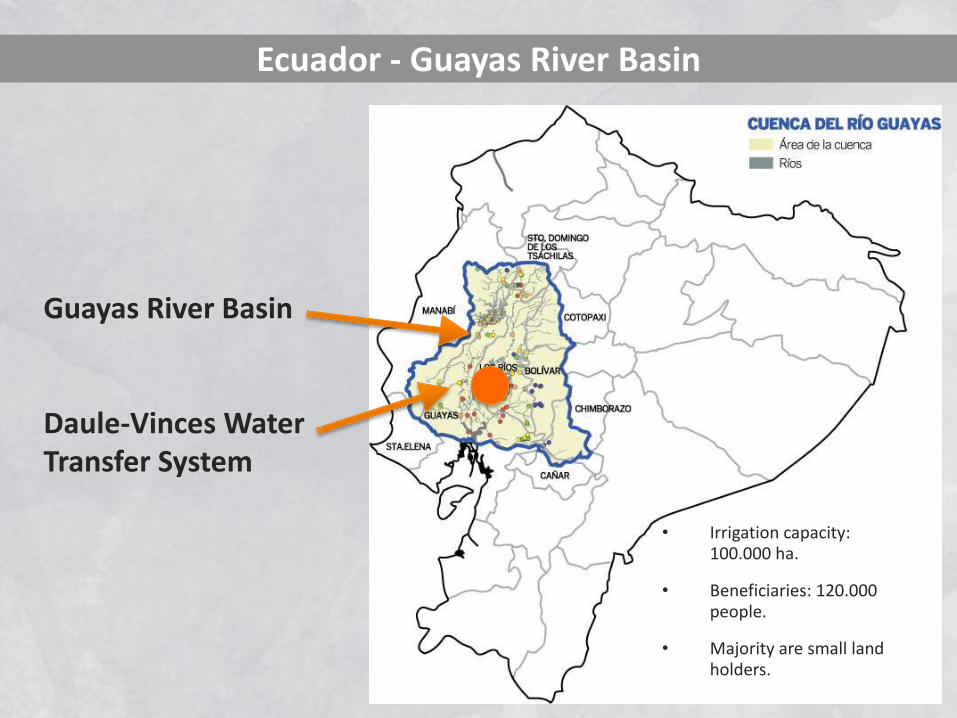
Ecuador - Guayas River Basin
Guayas River Basin
Daule-Vinces Water Transfer System
• Irrigation capacity: 100.000 ha.
• Beneficiaries: 120.000 people.
• Majority are small land holders.
1. IMPACT ORIENTED ECOSYSTEM SERVICES
VALUATION (POLICY)
2. FROM BIOPHYSICAL MODELING TO
ECONOMIC VALUATION MODELING
3. RESULTS BASED ON VALUATION SCENARIOS
4. MULTI-SECTORIAL PARTICIPATION AND
COMMUNICATION
TEEB FRAME FOR THE STUDY
IMPACT ORIENTED ECOSYSTEM SERVICE VALUATION
Based on consultations and effective collaboration

THE ECUADORIAN COCOA
• Ecuador is one of the leading countries in cocoa production and exports.
• About 8% of world cocoa production is
“Cacao Fino de Aroma” (Fine Cocoa Aroma).
• 80% of this cocoa is produced en LA.
FOCUSING THE STUDY
• Ecuador alone produces about 70% of this cocoa.
• About 90% are small farmer.
• Ministry of Agriculture started to promote Cocoa
production in the area of the Dauvin Irrigation Project.
• International firms (American and European) started to
invest in the area (collecting and processing facilities).
• Among farmers, there is an increasing interest in cocoa,
based on its profitability.
• Excellent future perspectives in the international market,
but high concern on quality issues associated to presence
of heavy metals (Cadmium, Mercury, etc).
CURRENT SITUATION

FROM BIOPHYSICAL TO ECONOMIC MODELING
Based on a multidisciplinary approach

Categories:1. Optimal2. High3. Medium4. Low (not shown)
About 13.000 has.
AGRICULTURAL PRACTICES
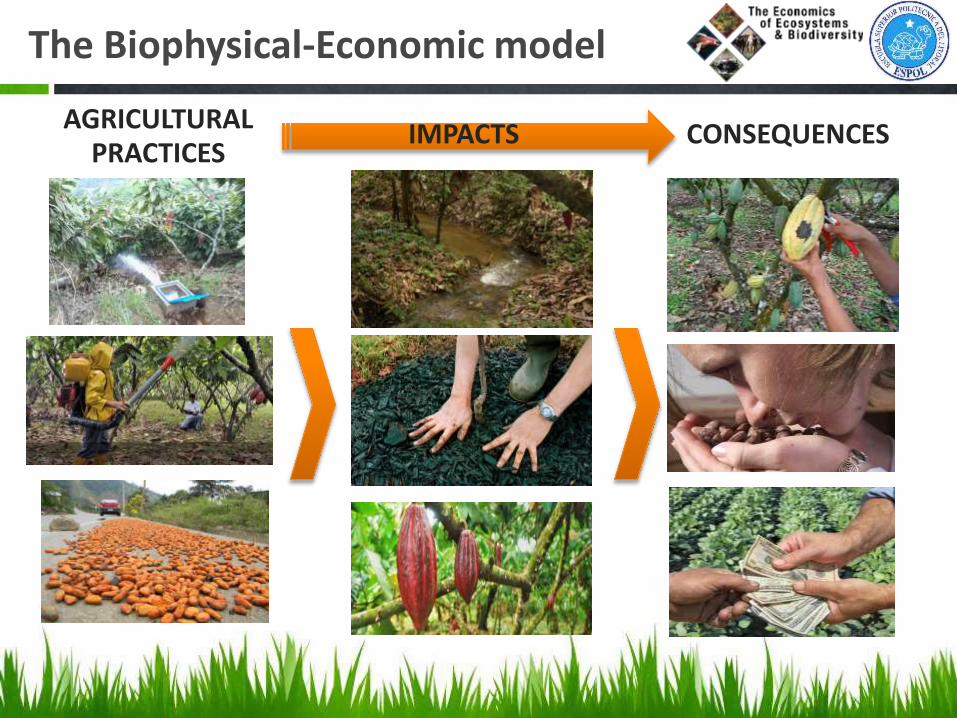
The Biophysical-Economic model
IMPACTS CONSEQUENCES
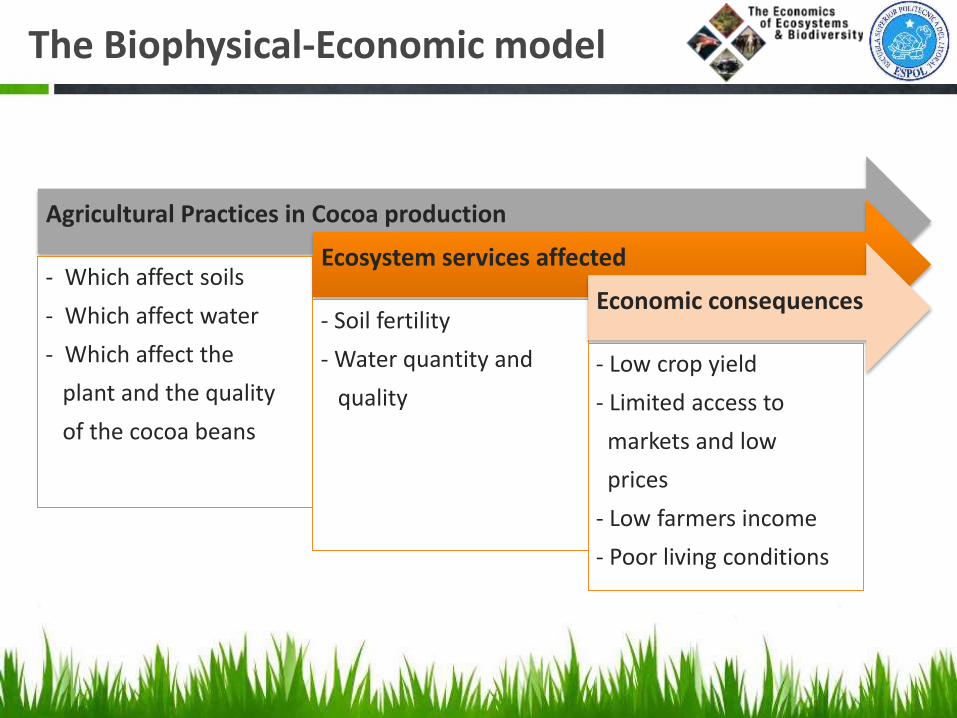
The Biophysical-Economic model
Agricultural Practices in Cocoa production
- Which affect soils
- Which affect water
- Which affect the
plant and the quality
of the cocoa beans
Ecosystem services affected
- Soil fertility
- Water quantity and
quality
Economic consequences
- Low crop yield
- Limited access to
markets and low
prices
- Low farmers income
- Poor living conditions
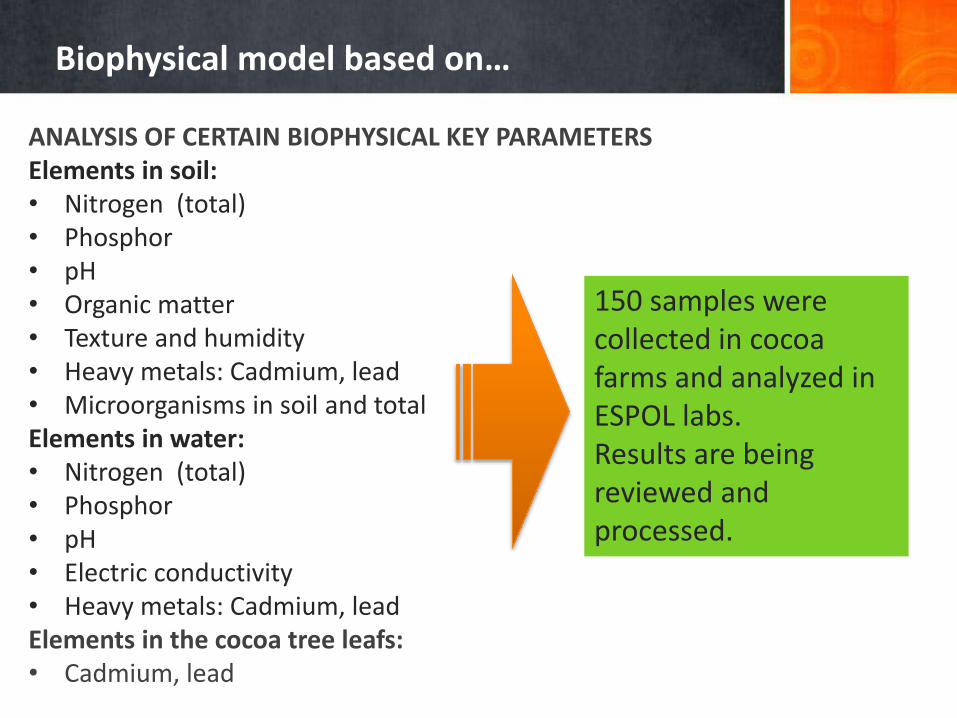
ANALYSIS OF CERTAIN BIOPHYSICAL KEY PARAMETERSElements in soil: • Nitrogen (total)• Phosphor • pH• Organic matter• Texture and humidity• Heavy metals: Cadmium, lead• Microorganisms in soil and totalElements in water:• Nitrogen (total)• Phosphor • pH• Electric conductivity• Heavy metals: Cadmium, leadElements in the cocoa tree leafs:• Cadmium, lead
Biophysical model based on…
150 samples were collected in cocoa farms and analyzed in ESPOL labs.Results are being reviewed and processed.

A survey campaign based on a:
• Sampling plan that includes the
150 initial sampled points, plus
350 points inside and outside the
Dauvin irrigation project area
(Organic producers as control).
• Format included questions about
agricultural practices, farm
structure and assets, economic
aspects of cocoa production, as
well as some idiosyncratic
variables.
510 questionnaires were completed and are being analyzed by experts in statistics and economic valuation
Economic model based on…
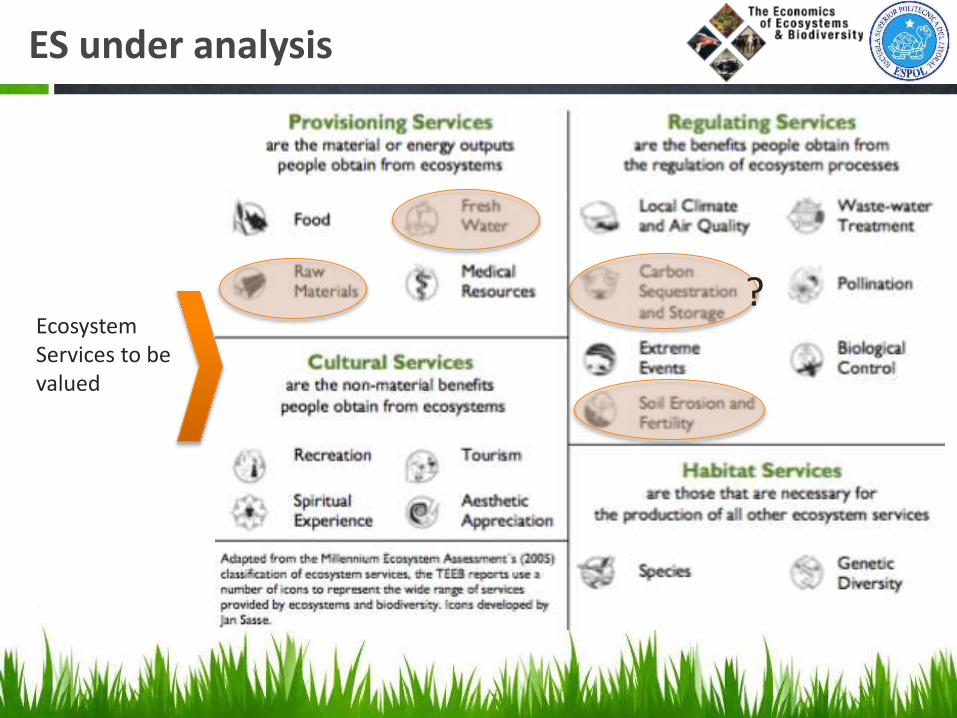
ES under analysis
Ecosystem Services to be valued
?
RESULTS BASED ON VALUATION SCENARIOS
Based on data analysis and stakeholders participation

BASED ON THE CONSTRUCTION OF A TYPOLOGY OF AGRICULTURAL PRACTICESIN COCOA PRODUCTION.
VALUATION SCENARIOS
Group Profile Description %
1. Smallfarmers
1Use of modern and non-modern irrigation techniques; Exclusive use of chemical pesticides and fertilizers. Low yield.
50.25
2Non use of irrigation nor chemical pesticides or fertilizers. Low yield
45.24
2. Medium-Big size farmers up to 100 has.
1Big size farmer, with technical use of irrigation. High use of chemical pesticides and fertilizers. Medium to high yield.
2.30
2
Medium size farmers, with technical and non-technical use of irrigation. High use of chemical pesticides and fertilizers. Medium yield.
1.23
3Medium size farmers, with non-technical or non-use of irrigation and/or chemical pesticides and fertilizers. Low yield.
0.98
Key aspects for definition of Valuation Scenarios
• Not necessarily small farmers are ES friendly as neither medium or big farmers
• The higher the size of the farm the higher the importance of productivity (which may demand more agricultural inputs)
• Trade off between practices that improve productivity but may affect Ecosystem Services
• Differences in capacity to adopt agricultural practices that are ES friendly
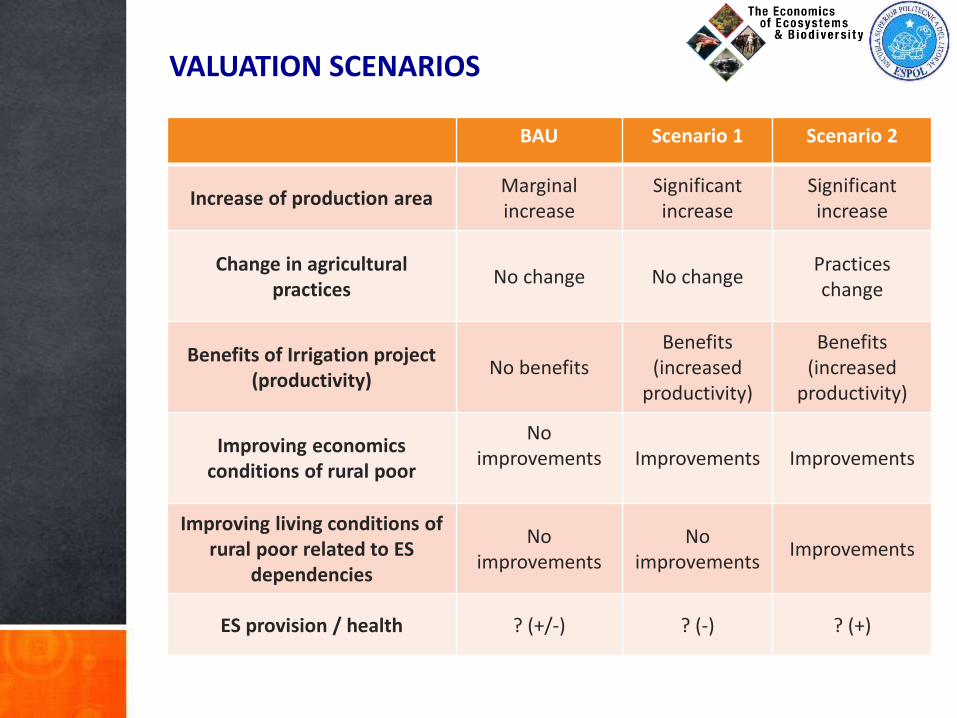
VALUATION SCENARIOS
BAU Scenario 1 Scenario 2
Increase of production areaMarginal increase
Significant increase
Significant increase
Change in agricultural practices
No change No changePractices change
Benefits of Irrigation project (productivity)
No benefitsBenefits
(increased productivity)
Benefits (increased
productivity)
Improving economics conditions of rural poor
No improvements Improvements Improvements
Improving living conditions of rural poor related to ES
dependencies
No improvements
No improvements
Improvements
ES provision / health ? (+/-) ? (-) ? (+)

MULTI-SECTORIAL PARTICIPATION AND COMMUNICATION
Based on a defined strategy
QUESTIONS FOR POLICY DESIGN
Which technologies for cultivation, irrigation, crop protection, harvest, etc, should be promoted in the area?
Which practices can help to reduce the impact over the ecosystems?
Which institutional arrangements can help to have a sustainable irrigation system?
What socio-environmental aspects should be considered to reduce conflicts and improve the resilience of the eco-systems in the Dauvin area?

Local collaborations from…
Farmer’s participation

Paúl Herrera, Ph.D.Tlf: (593) 04.2269269
Email & Skype: [email protected]
Maria Cristina Torres, PhD.
Tlf: (593) 02.29776300Email: [email protected]: ma.cristorres
Additional information


Manila Bay• 30 % of the country's
population (of 100+ M) is in Manila Bay watershed area,
• Contributes as much as 52% of GDP
• Economic value estimated at PhP 8 Billion/year (PEMSEA, 2005) – focused on losses due to decline in water quality
• Supreme Court December 18, 2008 writ of continuing mandamus “to rehabilitate, restore, and conserve the Manila Bay at the earliest possible time?
Philippines isamong 17 megadiverse areas
Project Scope
57

• Coastal ecosystems
conversion including
reclamation, particularly
in the Manila Bay
coastlines
• Increasing pollutants
causing algal blooms
and fish kills
• Rapid loss of ecosystems
and biodiversity
• Rapid expansion of
settlements,
• infrastructure
development,
• coastal developments
58
Why topic was chosen..
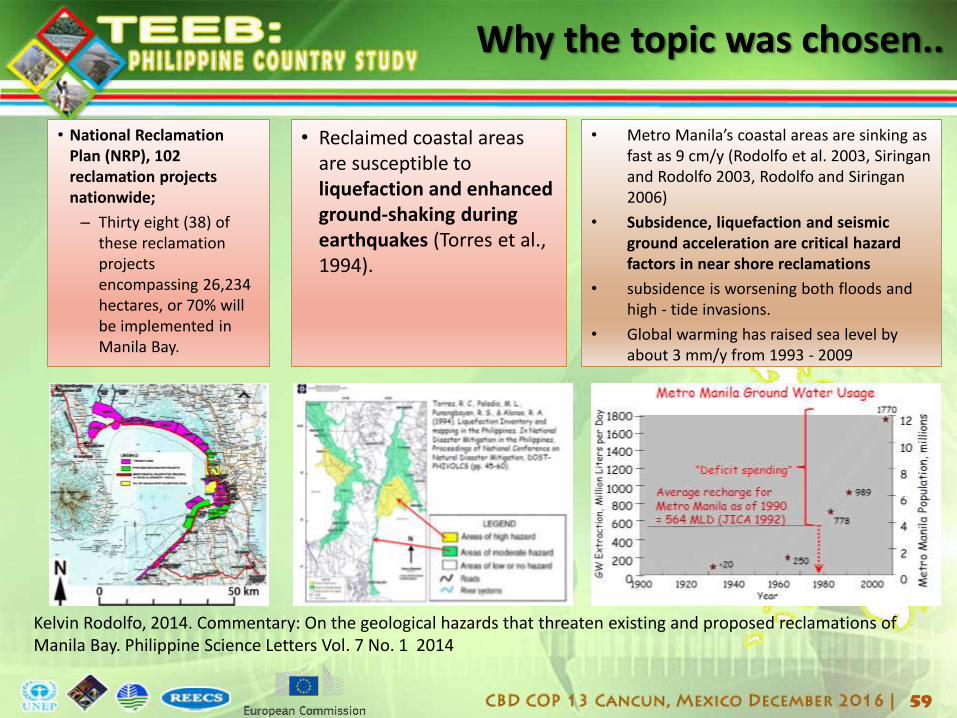
• National Reclamation Plan (NRP), 102 reclamation projects nationwide;
– Thirty eight (38) of these reclamation projects encompassing 26,234 hectares, or 70% will be implemented in Manila Bay.
Kelvin Rodolfo, 2014. Commentary: On the geological hazards that threaten existing and proposed reclamations of Manila Bay. Philippine Science Letters Vol. 7 No. 1 2014
Why the topic was chosen..
59
• Reclaimed coastal areas are susceptible to liquefaction and enhanced ground-shaking during earthquakes (Torres et al., 1994).
• Metro Manila’s coastal areas are sinking as fast as 9 cm/y (Rodolfo et al. 2003, Siringanand Rodolfo 2003, Rodolfo and Siringan2006)
• Subsidence, liquefaction and seismic ground acceleration are critical hazard factors in near shore reclamations
• subsidence is worsening both floods and high - tide invasions.
• Global warming has raised sea level by about 3 mm/y from 1993 - 2009
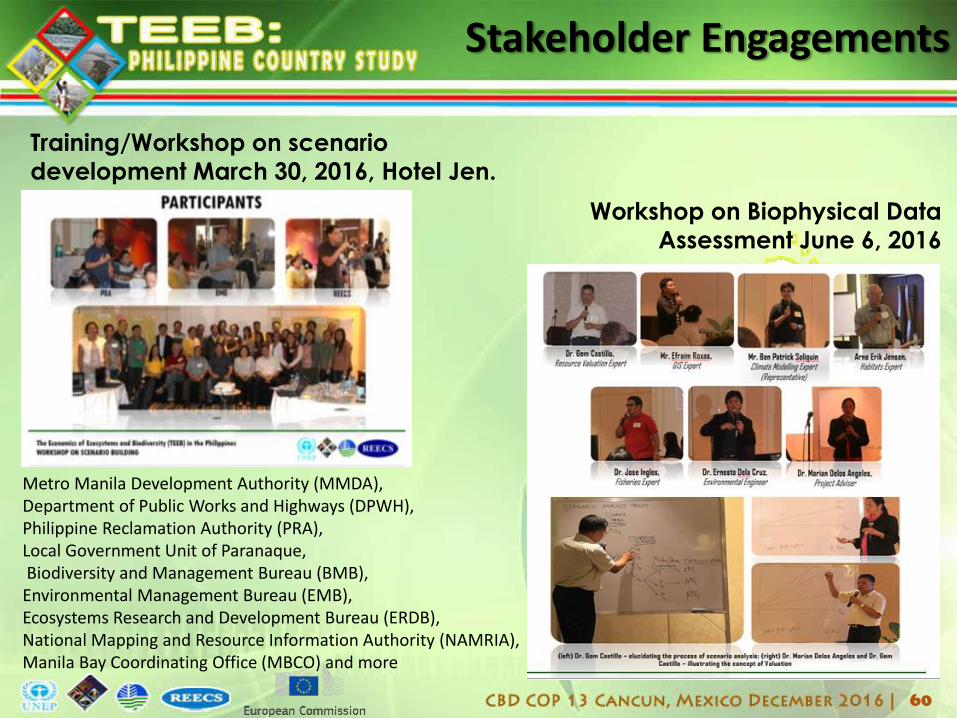
Training/Workshop on scenario
development March 30, 2016, Hotel Jen.
Workshop on Biophysical Data
Assessment June 6, 2016
Metro Manila Development Authority (MMDA),Department of Public Works and Highways (DPWH), Philippine Reclamation Authority (PRA), Local Government Unit of Paranaque,Biodiversity and Management Bureau (BMB), Environmental Management Bureau (EMB), Ecosystems Research and Development Bureau (ERDB), National Mapping and Resource Information Authority (NAMRIA), Manila Bay Coordinating Office (MBCO) and more
60
Stakeholder Engagements
61
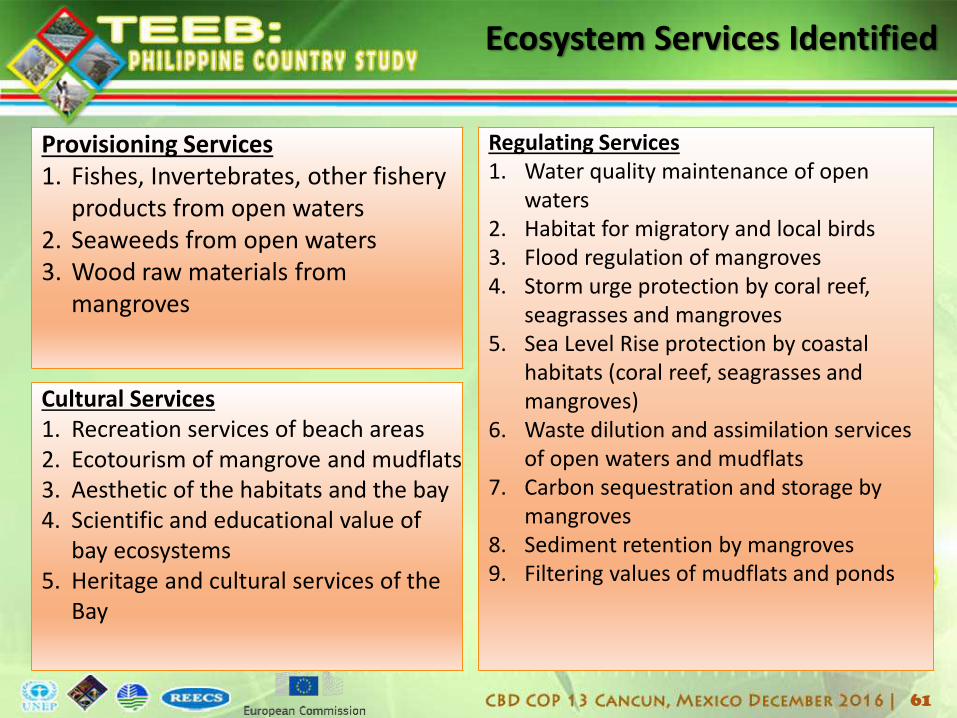
Ecosystem Services Identified
Provisioning Services1. Fishes, Invertebrates, other fishery
products from open waters2. Seaweeds from open waters3. Wood raw materials from
mangroves
Regulating Services1. Water quality maintenance of open
waters2. Habitat for migratory and local birds3. Flood regulation of mangroves4. Storm urge protection by coral reef,
seagrasses and mangroves5. Sea Level Rise protection by coastal
habitats (coral reef, seagrasses and mangroves)
6. Waste dilution and assimilation services of open waters and mudflats
7. Carbon sequestration and storage by mangroves
8. Sediment retention by mangroves9. Filtering values of mudflats and ponds
Cultural Services1. Recreation services of beach areas2. Ecotourism of mangrove and mudflats3. Aesthetic of the habitats and the bay4. Scientific and educational value of
bay ecosystems5. Heritage and cultural services of the
Bay
62
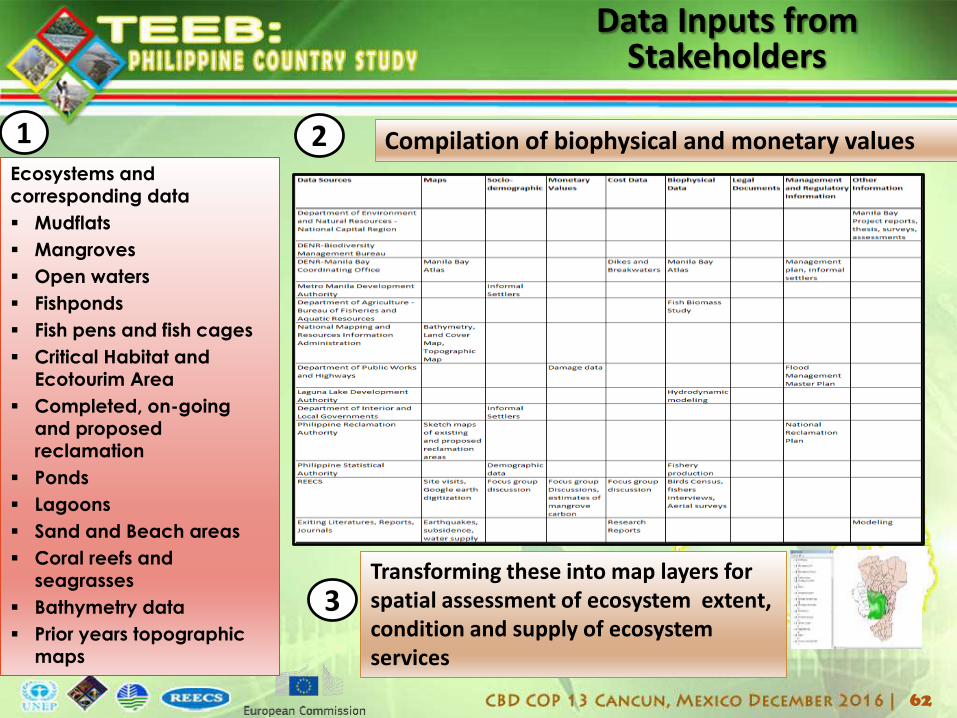
Data Inputs from Stakeholders
Ecosystems and corresponding data
Mudflats
Mangroves
Open waters
Fishponds
Fish pens and fish cages
Critical Habitat and Ecotourim Area
Completed, on-going and proposed reclamation
Ponds
Lagoons
Sand and Beach areas
Coral reefs and seagrasses
Bathymetry data
Prior years topographic maps
Transforming these into map layers for spatial assessment of ecosystem extent, condition and supply of ecosystem services
Compilation of biophysical and monetary values1 2
3
63
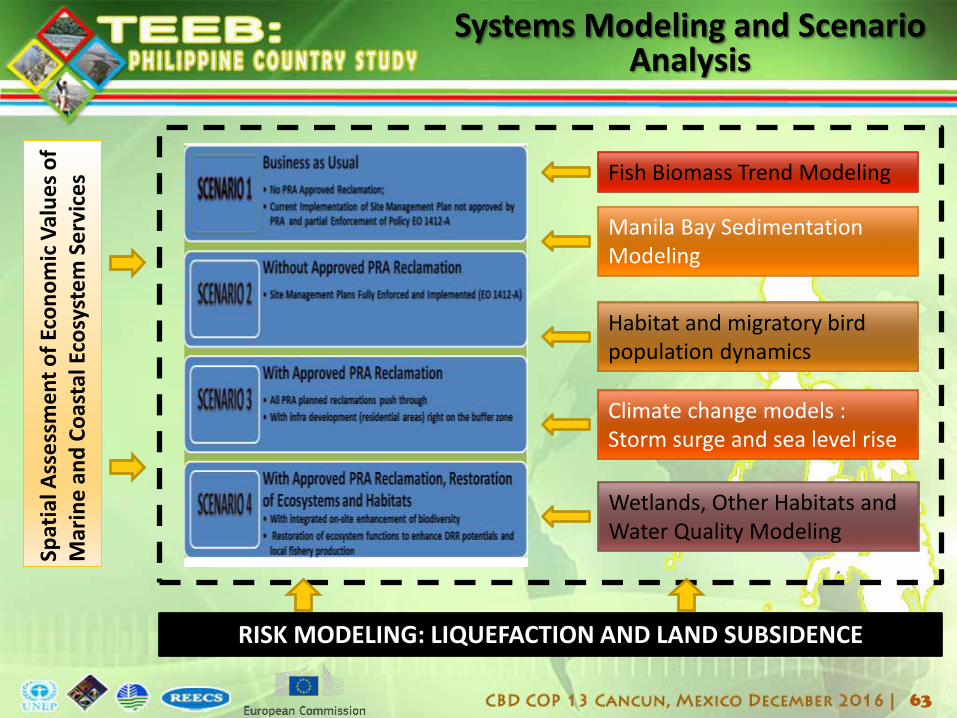
Fish Biomass Trend Modeling
Manila Bay Sedimentation Modeling
Habitat and migratory bird population dynamics
Climate change models : Storm surge and sea level rise
RISK MODELING: LIQUEFACTION AND LAND SUBSIDENCE
Wetlands, Other Habitats and Water Quality Modeling
Spat
ial A
sse
ssm
en
t o
f Ec
on
om
ic V
alu
es
of
Mar
ine
an
d C
oas
tal E
cosy
ste
m S
erv
ice
s
Systems Modeling and Scenario Analysis
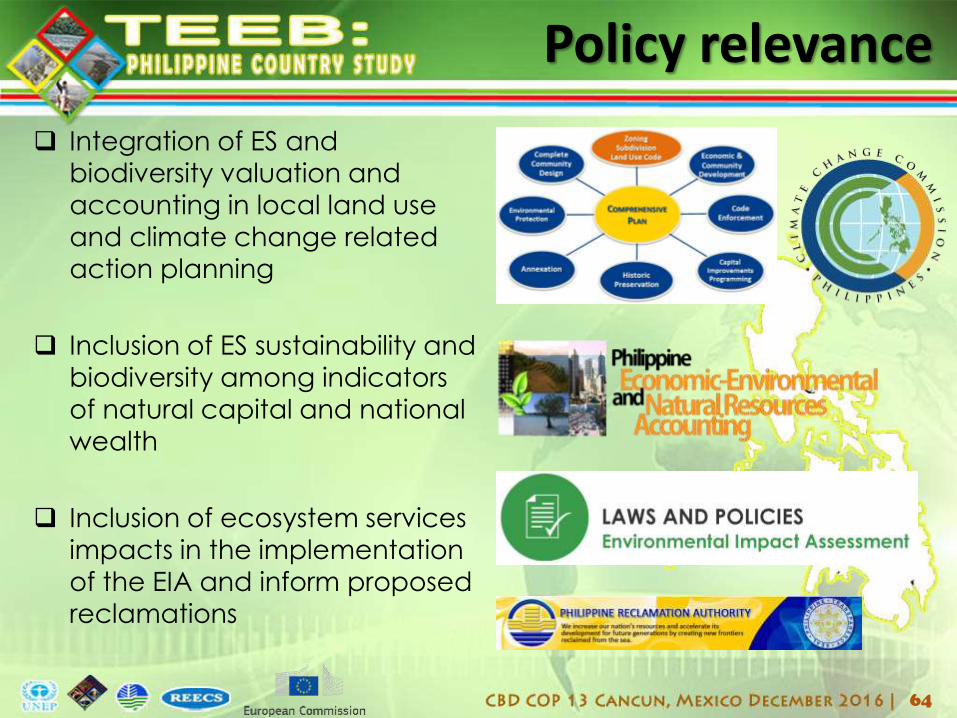
Integration of ES and
biodiversity valuation and
accounting in local land use
and climate change related
action planning
Inclusion of ES sustainability and
biodiversity among indicators
of natural capital and national
wealth
Inclusion of ecosystem services
impacts in the implementation of the EIA and inform proposed
reclamations
64
Policy relevance

Improvement of the EIA process
Integration of biodiversity and ecosystem considerations in local land use planning such as estimating its direct and indirect contributions to economic and other human activities
Institutionalizing ecosystem and biodiversity accounting in the Philippine Statistical Authority
65
Targeted Policy Processes and Intitutionalization
66
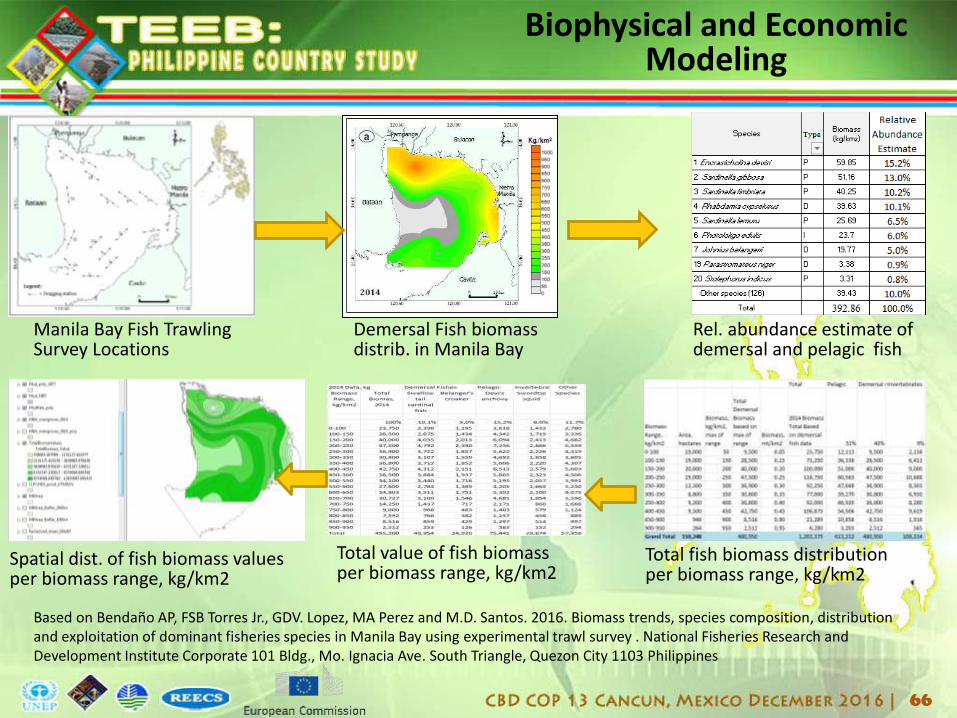
Manila Bay Fish Trawling Survey Locations
Based on Bendaño AP, FSB Torres Jr., GDV. Lopez, MA Perez and M.D. Santos. 2016. Biomass trends, species composition, distribution and exploitation of dominant fisheries species in Manila Bay using experimental trawl survey . National Fisheries Research and Development Institute Corporate 101 Bldg., Mo. Ignacia Ave. South Triangle, Quezon City 1103 Philippines
Demersal Fish biomass distrib. in Manila Bay
Rel. abundance estimate of demersal and pelagic fish
Total fish biomass distribution per biomass range, kg/km2
Total value of fish biomass per biomass range, kg/km2
Spatial dist. of fish biomass values per biomass range, kg/km2
Biophysical and Economic Modeling