Embed Size (px)
Citation preview

TEE INFLUENCE OF AMBIENT PRESSURE
ON HYDRAULIC JUMPS
A Thesis submitted for the Degree of Master of Philosophy of the University of London
by
David Frederick Jaques
April 1973
-1-
Acknowledgements
My thanks are due to Professor Francis for the original idea of the
topic of this Research, Mr. Maurice Kenn for his meticulous supervision,
Mr. Geoffrey Thomas for his major contribution to the design of the
equipment and continued support thereafter, Miss Joyce Gurr for her
excellent photography, and to all the technician staff and research
students at Imperial College London who have helped and with whom it
has been a pleasure to work; also to The Hatfield Polytechnic for
allowing me time to pursue the research and for their subsequent
patience in awaiting its completion; to colleagues at Hatfield for
their help; and lastly to my wife, Penny, who so nobly endured my
pursuit of something she had no wish to understand.
-2-
Abstract
This thesis is based on experimental work conducted in the Hydraulics
Laboratory of Imperial College London. Its primary aim was to study
the properties of hydraulic jumps at near vacuum pressures and to
compare these with those at atmospheric pressure. The experimental
rig necessary for this work demanded an original and well-executed
design in order to withstand the necessary pressures and this is
described under "Experimental Equipment". Some of the snags encountered
in the measurement of fast flow depth and in the computation of mean
velocity are recounted in "Experimental Procedure" and examined more
thoroughly under "Flow Force Imbalance". It is because of the
apparently substantial drop in Flow Force through the jump that a
"great deal of experimental and study time was devoted to this problem.
The production of high-speed fast flow (Froude Numbers > 15) and the
availability of a high speed film camera and an excellent still camera
all lent themselves to an interesting examination of some of the
general properties of the hydraulic jump. This is described under
"Results and Discussion - General". A more detailed study of one of
these properties, air-entrainment, follows the section sub-titled
"Air Entrainment". This is particularly concerned with an investiga-
tion of the mechanisms by which air is entrained. A comparison of the
effects of atmospheric and low ambient pressures on the jump is made
under "The Effect of Low Pressures" with the conclusion that there is
no apparent difference except that the still photographs reveal a
lower concentration of entrained air at near vacuum ambient pressures.
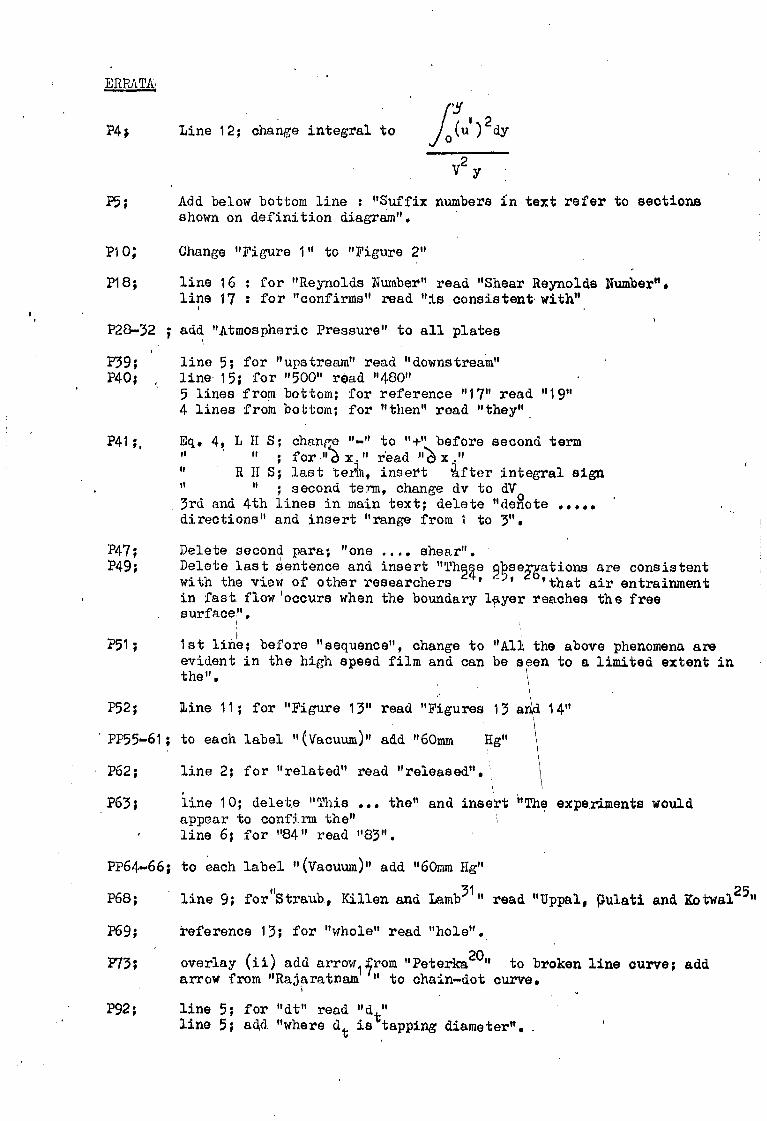
ERRATA.
P4; Line 12; change integral to
jo (u1)2dY V2 y
P5; Add below bottom line : "Suffix numbers in text refer to sections shown on definition diagram".
1110; Change "Figure 1" to "Figure 2"
P18; line 16 : for "Reynolds Number" read "Shear Reynolds Number". line 17 : for "confirms" read "is consistent with"
P28-32 ; add "Atmospheric Pressure" to all plates
P39; line 5; for "upstream" read "downstream" P40; line.15; for "500" read "480"
5 lines from bottom; for reference "17" read "19" 4 lines from bottom; for "then" read "they"
P41;, Eq. 4, L H S; change "—" to "+" before second term I " ; for "3 x." read "6x ." R H S; last te/411, insert after integral sign
; second term, change dv to dV 3rd and 4th lines in main text; delete "derlote directions" and insert "range from 1 to 3".
P47; Delete second pare; "one .... shear". P49; Delete last sentence and insert "The psegations are consistent
with the view of other researchers ' 'that air entrainment in fast, flow'occurs when the boundary layer reaches the free surface".
P51; let line; before "sequence", change to "All the above phenomena are evident in the high speed film and can be seen to a limited extent in the". \
P52; line 11; for "Figure 13" read "Figures 13 and 14"
PP55-61; to each label "(Vacuum)" add "60mm Hg" \
P62; line 2; for "related" read "released".'
P63; line 10; delete "This ... the" and insert "The experiments would appear to confirm the" line 6; for "84" read "83".
PP64.66; to each label "(Vacuum)" add "60mm Hg"
P68; line 9; for"Straubl Killen and Lamb31" read "Uppal, pulati and Xotwal25"
P69; reference 13; for "whole" read "hole".
P73; overlay (ii) add arrowl;rom "Peterka20" to broken line curve; add arrow from "Rajaratpam ." to chain—dot curve.
P92; line 5; for "dt" read "dt" line 5; add "where dt is tapping diameter". .

-3- Contents
Page Acknowledgements
1 Abstract
2 Contents 3 List of Symbols
4 Definition Diagram
6 I INTRODUCTION
7 Layout Diagram
10 II EXPERIMENTAL EQUIPMENT
11 III EXPERIMENTAL PROCEDURE
17 IV RESULTS AND DISCUSSION
21 1 General 2 Flow-Force Imbalance
' 35 3 Air Entrainment
48 4 Effects of Low Pressure
52 V CONCLUSIONS
67 References
69 VI GRAPHS AND
71. TABULATED RESULTS
79 VII APPENDIX
87
Figures
1 Definition Diagram 2 Layout Diagram 3-9 Textual Sketches 10 Graph of Y2/y1 versus Froude No. 11 Graph of F2/F1 versus Froude No. 12 Graph of E versus Froude No. 13 Graph of 6111/yi versus Froude No. 14 Graph of '1,/H1 versus Froude No. 15 Graph of Y.,/y versus u/V' 16 Graph of Y /y versus u/V' 17 Graph of Orifice calibration 18 Detail of Bed Tapping Hole 19 Graph of Handwheel Turns versus Undershot Gate opening 20 Graph of Bed Tapping Error
6 10
23, 24, 26, 37, 49, 50 71 72 73 74 75 76 77 88 89 91 93
Plates 1 General View of Working Section 2-15 Various Views of Hydraulic Jump - Still Photographs
16-48 Ditto but printed from High-Speed Film 49 View of Underside of Jump - Still 50-73 Comparative Views of Jump at Atmospheric
and.Vacuum Pressures - Still., 74-75 View of Jump at Vacuum Pressure - High Speed 77-83 View of Jets of Water discharging into Still Water
Surface at Atmospheric and Vacuum Pressures - Still
11 28-31 32, 33
34
55-60 61
64-66

—4—
List of Symbols Units
b width of flow (flume)
d opening beneath undershot (sluice) gate
F flow force per unit width at any section
F' flow force per unit width at any section
g acceleration due to gravity
hp head measured by pitot tube above flow surface
ho
head measured by orifice plate H V2/ total head at any section = y + /2g
f2 H' total head at any section = y + V
i coordinate direction
I
turbulence flux correction factor = luta 2dy Vy
j coordinate direction
Y2/y1
1 longitudinal distance along flow from undershot gate
Li length of jump
M momentum force per unit width at any section = /0V2y
Y 2 M' momentum force per unit width at any section = J, u2 dy
MS1 momentum force per unit width at any
section = (ITO 2y
NE, Froude Number at any section =
NF,
Froude Number at any section = /a-Y
NR
•
Reynolds Number at any section =AI
P hydrostatic force per unit width at any section /ogy 2/2 N/m
il p error in stilling well readings due to tapping error 17/62
q flow rate per unit width = /la m/s
mm
mm
N/m
Wm
ti/s2
mm
mm
m
m
mm
N
N /111
N

-5- Units
Q flow rate measured by orifice plate m3/s
Q' flow rate measured by helix meter m3/0
t time
u velooity at any point m/8
u'v'w' instantaneous velocity components at any point . m/s
u,v,w temporal mean velocity components at any point m/s
V, v mean velocity at any section .7,9,37 m/a
Y • V' mean velocity at any section = udy
y
x,y,z coordinate directions of flow velocity
X longitudinal component of body force/unit masa
y depth of flow at any section
level measured above bed of flume
ce energy correction factor =.../Y u3 dy
2glY udy
/9 momentum correction factor = M /M"
6 boundary layer thickness
increment of any quantity
mass density
bed shear stress
144" absolute viscosity
V / 2g
kg/m3
N/m2'
Ns/m2
m/s
MM

6-rj
tuto..tblorct u0s4.1.u!+aci
1h
!A.
ww OSS ww
CD 0

a
INTRODUCTION

-7-
Introduction
The hydraulic jump is a phenomenon of both fascination and value to
the hydraulic engineer. It is of fascination as a spectacle and in
the variety of forms which it assumes, varying from a mere surface
undulation at Froude Numbers just above 1 to a violent, frothy,
exploding roller at Froude Numbers in excess of 9. It is of value
when employed in dissipating energy, mixing chemicals into a flow of
water, raising the surface level of flow indicating rates of flow or
removing air from closed conduits. It is also a useful means of
restoring conditions of uniformity to flow.
According to Rouse and Ince1 the existence of the hydraulic jump Was
first described in 1500 by Leonardo da Vinci, proposed by Venturi in
1797 as a means of gaining potential head from fast flow, wrongly
analysed using energy principles by Belanger in 1828, and correctly
analysed using momentum principles by Bresse in 1835.
Much research has been conducted into the behaviour of the hydraulic
jump2 but there are still several characteristics, including the
mechanism of air entrainment and the propagation of downstream waves,
which are not yet fully understood. The particular purpose of this
research was to investigate the effect of low ambient pressures on
the various characteristics of the jump. Such an investigation has
specific-relevance in respect of jumps forming in the top limbs of
siphon conduits, but it was also hoped that the work might throw
further light in general on the nature of the hydraulic jump.
-8-
In order to study the jump at a wide range of Froude Numbers a flume
was built with a working section 3m long by 100mm wide by 375mm high.
One technique for lowering the ambient pressure, as used by Binnie and
Sims3 (and others), was to enclose the working section (e.g. of
vertical pipe and siphon outlets) in a de-compression chamber. However,
with the large equipment required for the present research this
procedure was impractical and a design based on that devised at Leeds
University by Hunter, Swales and Cole4 was adopted. This equipment
comprised essentially a water tunnel operating on a closed circuit
with a circulating pump located sufficiently far below the working
section to avoid cavitation problems.
It was not expected that there would be any significant change in the
properties of the hydraulic jump at low ambient pressures. From
consideration of momentum principles it is apparent that provided the
ambient pressure is the same at either end of the 'control volume'
the momentum equation and hence the various physical dimensions on
which it is based should remain unchanged by a varying ambient
pressure. In a different context Binnie and Sims showed that for
vertical pipe outlets and siphon spillways flowing both full and part-
full "the reduction of ambient pressure had no noticeable effect on
the relation between head and water discharge, although the air
discharge was lessened".
The formation of bubbles in a water stream is normally considered to
be influenced by both surface tension and viscosity but it is possible
that at very low pressures the incipient release of dissolved gases
(if not the formation of bubbles of water vapour) will affect the air
entrainment properties of a hydraulic jiMp, and hlhce such factors

-9-
as bulking and splashing, in that there would be two 'bubble—forming'
activities occurring together. Furthermore it is argued5 that air
entrainment depends on the velocity rather than the Froude Number of
the flow approaching the jump. An analysis based on this assertion
was therefore indicated. With the use of high speed photography
detailed observations might reveal some of the mechanisms involved in
air entrainment.
The test rig was designed to give flow rates up to 0.015 m3/s with
Froude Numbers of up to 16. Surprisingly, little research has
apparently been done into the properties of jumps over the range 104(
Npr.16. The theory of the hydraulic jump by Bresse assumes a horizontal
bed, hydrostatic pressure and uniform velocity distribution, and
negligible boundary shear. In 1936 Bakhmeteff and Matzke6 referred
to the "slight effect of friction forces" and stated "it remains for
experiments to show in general whether this assumption of negligible
shear is justified". The present research indicated that for NF>8
the boundary shear is not negligible even with the smooth boundaries
of a laboratory flume, thus confirming similar findings by Rajaratnam6.
This thesis falls into the following main sections:
I Experimental Equipment
II Experimental procedure
III Discussion of results (a) General
(b) Air entrainment
(c) Flow force imbalance
(d) Effects of vacuum pressures
IV Conclusions
V -Graphs and Tabulated Results
VI Appendices
Photographs & diagrams are included at appropriate places in the text.

II EXPERIMENTAL EQUIPMENT
-)

FIGURE 1

Low - PRessURE FLUMe.
3000",,,,.
I375,.,...D~~PX 100_ WIDe
P""1t5PEX /
M,f..IN LASORATOIlY.rLOOR. Ll!VEL.
Low- PR~S5l.1R~ FLIJ"'~,
/ .';'AN"~S_Ol.ITL~r rANI<
600",,,,)( .300"".")( (075".... HIGH
V!I!WINtI PAN~L.
/!JItV..ANC''''(J T.yfJ<1200...,., X 750_X 7~O",,,, HIGH.
) .
, !
FIGURE f.LAYOUT DIAGRAM 0': EXPERIMENTAL. RIG.
''', '; ... ~ !.> t .... ~; .~. ~ /. -

. .
arirgr: , ue 7
Plca_te 1
11

Experimental Equipment
The working section of the equipment comprised a 100 mm flume
which had previously been proved to be suitable for studying open
channel flow phenomena in two dimensions. The height and length of
the flume were based on considerations of the anticipated sizes of
the hydraulicjumps and were fixed at 375 mm and 3 m respectively.
In order to facilitate a change of ambient pressure the flume had to
be enclosed with a roof. Both the roof and walls needed to be of
substantial strength in order to resist the intended differential
between the changing. ambient pressure inside the flume and atmospheric
pressure outside. The working section was therefore designed as a
bolted steel frame with removable 38 mm thick Perspex side windows
each of which was suspended above its centre of gravity by a pivotted
arm. This enabled the window to be swung out single-handed whenever
access to the inside of the flume was required. Rubber '0' ring
seals effected the seal between the windows and the main frame of the
working section. The structural design of the working section was
similar to that designed for the study of cavitation and associated
phenomena with bodies piercing or near to a free surface at Leeds
University.4
Whilst the equipment for this present research was designed with a
variety of possible future uses in mind, its primary function was to
provide the fast flow necessary for the formation of a wide range of
• hydraulic jumps (as observed by Chow8 ) with supercritical flow
velocities up to 6 m/s. An undershot gate was included,at the entry
to the flume, and, in order to give a flow parallel to the bed (i.e.
no versa contracta) and to avoid the posdibility oll'leakage or
-13-
cavitation effects past any slots, a slotless gate with a semi-circular
bottom profile was moulded in silicone rubber reinforced with a steel
backing plate. The width of the gate was such that the sides fitted
flush with the inside walls of the working section. Adjustment of the
gate was effected by a non-rising spindle passing through an ,01 ring
seal. The tailgate was an overshot sharp-edged weir operated in a
vertical plane by an inverted version of the inlet gate spindle.
The intended variation of ambient pressure gave rise to two problems'
which had to be resolved in the design of the apparatus.
-First, exposure of the water to atmospheric pressure could not be
allowed anywhere in the flow system otherwise changes of flow rate
could occur with every change of ambient pressure. The equipment was
therefore designed as a closed loop circuit with the working section
uppermost; a pump rather than an open overhead tank was employed for
maintaining a water flow, a by-pass with a valve (operated by an
extended spindle) was included so that the flow could be controlled
at the level of the working section. The flow was measured with a
75 mm diameter sharp-edged orifice plate designed in accordance with
B.S. 1042. Rigid 100 mm P.V.C. pipework made up the rest of the
circuit with the exception of the lengths just upstream of the inlet
structure to the flume and just downstream of the outlet tank. These
were made up with 100 mm diameter flexible armoured hose in order to
allow movement in the pipework when the flume was tilted.
Second, there was a danger of cavitation occurring at certain
vulnerable locations in the flow circuit at low ambient pressures.
In order to avoid such dangers in the pump the latter was sited at

-14-
basement level some 8 m below the working section. Both the by-pass
valve and the orifice were located at positions on the delivery pipe
such that cavitation would be avoided.
The,transition from a 100 mm diameter circular pipe to the 375 mm by 100 mm rectangular duct of the working section was realised by using
a short 'round to square' transition 50 mm long connected to a long
curved square to rectangular transition. These changes of cross-
section were designed so as to reduce the possibility of separated
flow and cavitation at the changes of direction in the inlet structure
and to produce an acceptably uniform velocity profile in the working
section. In pursuit of this latter requirement, turning vanes and a
honeycomb flow straightener were allowed for in the inlet, but they
proved to be unnecessary in practice. The design of the transitions
was based on formulae devised by Hoffmann9.
One further consideration in the design of the flow system was that
there had to be sufficient capacity in the circuit to provide for a
working section full of water during experimental work, yet empty when
not in use. This would permit access to the flume when required and
preclude the growth of algae and rust marks on or near the viewing
panels. Problems of pump surge and (more importantly) removal of
entrained air had also to be solved. Although air entrainment is a
typical property of the hydraulic jump, a false picture of the jump
could have resulted if the upstream fast flow had included air which
had been carried round the flow circuit. In order to eliminate
these problems a balancing tank of capacity 0.75 m3 was incorporated
in the system downstream of the flume outlet. The design of this
balancing tank was the result of experimental work which was

-15-
conducted on a full-size model to ascertain what manner of flow through
such a tank was most likely to de-aerate the water. Figure 2 illustrates
the final design.
Depth measurements in the working section were to be made by means of
bed tappings connected to stilling wells. The former, however, proved
.unreliable with flow velocities in excess of 2 m/s (see page 18 ) and
the fast flow depths were therefore measured by a simple point gauge
cranked so as to obtain a set of transverse depths. Velocity profiles
were obtained with total head probes and the flow rate by means of the
pipe-orifice plate and water manometer.
The ambient pressure was reduced by a jet pump connected to the
upstream and downstream ends of the flume roof with a further connection
to the roof of the balancing tank. It was thus hoped to obviate any
pressure imbalances along the working section which might arise whilst
the ambient air was being evacuated and which might have affected the
force relationships of the hydraulic jump.
One problem which the Leeds University researchers4 had encountered
with a closed loop system was an increase in turbidity of the water
due to rust in the circuit. The problem was dealt with in the present
rig by cadmium plating all the steel of the working section, galvanis-
ing all other steel and using plastic pipe fittings throughout the
circuit. - The pump which was Sigmund pulsometer TPN3-150/150 was
constructed of bronze throughout and had a rating of 180 gpm at 1450 rpm
and 13 ft head (0.0136m3/s at 24c/s and 4m head).
The detailed design and construction of the equipment was all undertaken
'at Imperial College. As soon as it had been erected it was tested in
situ for air-tightness down to ambient pressures of 3 mm of mercury

-16-
absolute. After one or two minor adjustments the equipment proved
acceptable for proceeding with the experimental work. Tests for air-
tightness at ambient pressures above atmospheric were not conducted
as it was not intended to pursue research at such pressures at this
stage. When such research is undertaken a 'burst-plate' will have to
be fitted for reasons of safety.
The working section of the equipment was located on the steel platform
comprising the uppermost level of the Imperial College Hydraulics
Laboratory. This platform was deliberately sited one atmosphere above
sump level. An estimate of the maximum gross weight of the working
section was calculated at 18 kN, well within the loading limit of the
platform.
A diagram of the complete apparatus and a photograph of the working
section are shown in Figure 2 and Plate 1.

III EXPERIMENTAL PROCEDURE

-17-
Experimental Procedure
Before the apparatus could be completely designed and constructed an
appropriate means of removing entrained air from the flow leaving the
working section had. to be devised. The balancing tank already
described offered a suitable location for air removal. A full-sized
model of the tank, the size and shape being gauged on the balancing
volume, was therefore subjected to tests to ascertain an efficient and
economic means of removing air from the water.- Water carrying a large
amount of entrained air was passed through the tank, which was set up
' to simulate its anticipated flow conditions, and a variety of baffle
plates were manoevered so as to give maximum encouragement to the
entrained air bubbles to surface. The design eventually adopted is
shown in Figure 2.
The orifice plate, described under Experimental Equipment was
calibrated volumetrically in a rig in which the orifice was located
between the actual upstream and downstream lengths of pipe which
would accompany it in the main experimental work.
Following the installation of the completed experimental rig, tests
were conducted for water tightness (no problem), air tightness at low
pressures (slight leaks in, which were progressively minimised but
never entirely eliminated) and effectiveness of the air separator
(very effective except for minute bubbles).
It was intended to measure the depths throughout the working section
by means of bed tappings 3/32" (2.4 mm) in diameter connected to
stilling wells. Whilst at low velocities (4:0.5 m/s) the levels in
the stilling wells tallied with the observed depths in the flume, at
high velocities (7-3 m/s) this was not so. As a test, fast flow was

-18-
produced along the whole length of the flume at the lowest flow rate
for a particular undershot gate setting and the flow rate then
gradually increased in stages. Although the stilling well levels were
uniform at first at each stage, the levels changed in a random manner
as the velocity increased. At 6 m/s the level from the most upstream
tapping for instance became 10 mm higher than both its neighbour and
the observed level of the water surface in the flume. Inserts with
1/32" (0.8 mm) diameter holes were then fitted into the three most
upstream of the tappings but, with every usual precaution taken
against imperfect finishing, alignment etc., the level variation
described above persisted though not to such a marked degree. One
could but draw the conclusion that water surface levels in flows with
velocities in excess of 3 m/s cannot be measured reliably by means of
bed tappings and stilling wells. This problem has been studied by
other researchers11,12,13. Of these, Whitell has shown that the
error depends on tapping diameter and the Reynolds' Number. This
confirms the findings in the present research. One of White's graphs
and an appropriate sample calculation are included in the Appendix (pages
92 and 93). To look at this another way, White states that "in general
there is a curvature of streamlines adjacent to the hole which creates
pressures marginally above the true static pressure". If only 1% of
the kinetic head at a main stream speed of 6 m/s is impounded in this
way an error of approximately +20 mm is likely to occur in the stilling
well reading. With bed tappings thus ruled out, a cranked point gauge
on a micrometer screw was used for depth measurements in the fast flow
region. This enabled a traverse of the surface elevation to be made
for each value of y1 and Q.
The main quantitative results of this research were achieved using
the following procedure:
(a) the undershot sluice gate was set at a fixed opening
*A detail of one of these tappings is shown on page 91.

-19-
(b) with the ambient pressure at atmospheric the flow rate
was varied, by operating the by-pass valve, for anything
between 4 and 6 values which were based largely on the
visual recognition of different types of jump; upstream
depths, y1 , as near the toe of the jump as possible were
measured by point gauge; downstream depths, y2, beyond
the zone of aeration, were measured by stilling wells
connected to bed tappings; the jump was kept in position
by adjusting the overshot tailgate so that the fixed point
at which yl was measured was always just upstream of the
toe.
(c) this procedure was repeated for different gate settings.
(d) the ambient pressure was reduced to as near absolute zero
as possible (it was usually 20-75mm mercury absolute) and
maintained at this pressure for at least 30 minutes; the
processes in (b) and (c) were then repeated, visual
judgement again being used in deciding the form of jump
at which to take readings.
In this way a cycle of sets of readings at atmospheric and at vacuum
pressure was obtained.
In addition to taking quantitative observations it was necessary to
make visual observations of any changes in the characteristics of the
jump as the ambient pressure was varied. These were not only described
from observation but also recorded by still photographs and high-speed

-20-
film. The still photographs taken at a speed of 1/250 sec were of
the complete length of the flume but the high speed camera, for
photographic reasons, could cover an area no larger than that
occupied by the toe of a jump. In order to film as much of a jump
as possible,, low Froude Numbers (3 and 1.8) were therefore chosen.
The speed of the film varied between 800 and 900 frames per second.
Owing to the apparent problem of flow force imbalance (see page 35)
various attempts were made to obtain more detailed information through
measurement. These included:
(1) measurements made with a Betz micromanometer connected
across the most upstream and the most downstream roof
tappings to ascertain whether the transport of entrained
air to the downstream end of the flume was causing a local
increase of ambient pressure there and resulting in a
pressure gradient opposite to the direction of the water
flow.
(2) measurement with a total head tube to determine velocity
profiles on the vertical centre-line.
(3) measurements using a triple-pointed set of total head
tubes to check on the velocity distribution transverse
to the flow direction.
Throughout all the experimentation. the slope of the flume was kept
constant at 1 in 480. This provided enough slope to stabilize the
location of the jumpl° whilst making a negligible contribution
through the effects of gravity to the flow force.
*atppiecelwassuicktotheside.oftheAaume for some of the high-speed film 'takes' in order to give an Idea of the size of the area filmed.

IV RESULTS & DISCUSSION
1 General

-21-
Results and Discussion
1. General
Before looking at the observations and measurements specifically
relating to the effect of low ambient pressures on the hydraulic jump
some of the more general observations made during the experimental
work in this research, and particularly those revealed by some of the
special features of the equipment, will be considered.
The silicone-rubber sluice gate proved most effective in producing a
fast flow without an apparent vena contracta and without 'slot' leakage.
It was unfortunate that as the work proceeded the gate appeared to
shrink a little so that with high heads upstream of the gate slight
leakage did occur at one side of the gate causing a somewhat uneven
surface downstream. Generally, however, the surface of the fast flow
exhibited a rough or wavy form, which can be seen in detail on high-
speed film, (Plates 16-36). At higher velocities (>4m/s) bubbles
could be observed floating on the surface. This uneven surface is
significant in that firstly, as the roughness increases with increasing
velocity, "bubbles of air can be observed being drawn into the flow
and splashes of water can be seen rising into the air".14 This may
be the commencement of self-entrainment of air by a stream. Self-
entrainment was not however observed in the present research with a
smooth bed possibly because of the limited development of the boundary
layer (see page46). It was however observed when a rough bed was
-inserted -(see page 44). Secondly, it is probable that a rougher water
surface will draw along with it a greater amount of air as a form of
boundary layer. This induced air movement is a possible contributory
factor to the magnitude of the air entrainment at the toe of the jump.
The effects of these surface features are discussed in the section
entitled 'Air Entrainment'.

-22-
The velocity distribution of the fast floW*when measured with a total
head tube exhibited a typical turbulent flow profile in the vertical
plane and showed a similar almost uniform distribution in horizontal
planes transverse to the flow. It was therefore assumed reasonable
to calculate the upstream momentum from the mean velocity defined as
/by Chow8
states that the effect of non-uniform velocity distri-
bution on the computed momentum is small compared with the other
uncertanties involved in the computation (e.g. depth measurement).
In this experiment, with the significant problems associated with
depth measurement, this statement is undoubtedly valid. Furthermore,
calculations based on velocity traverses and described later in this thesis
(page 43) show thatligi , the fast flow momentum correction factor was
almost always unity.
With regard to the measurement of y1 a careful check was kept on the
possibility of a random variation of measurement due to splashing or
. unevenness of the water surface by basing calculations on the value
of y1 measured at the lowest flow rate (for a given gate setting) when
the surface was smoother. Little variation was observed between the
' values obtained with a rough surface (high velocity) and those
obtained with a smooth surface (low velocity). Further reference to
depth measurement is made later in this thesis (page 35 et seq.)
Progressing downstream with the discussion, interesting observations
were made of particular characteristics of the hydraulic jump. (The
more general characteristics are well documented in standard texts.)8'15
*at Section (1)

-23-
ht 0.••■ w•••■•■
• 7 6-nt-r-oina.ce Z
Figure 3
At all values of Froude Number the position of the toe of the jump
`continually fluctuated upstream and downstream, the shift distance, /,
varying from about 50 mm at NF = 3 to about 500 mm at NF = 15. (See I
Figure 3) This factor raised problems in establishing the precise
location of yi at high values of Froude Number. The high-speed films
reveal a very similar mechanism in this regard at low NFI (1.8) to
that at higher values of NF (10-16) though this similarity is not
immediately apparent to the naked eye. In the high-speed films the
structure of the movement of the toe could be more closely examined.
In fact, the movement appeared,when observed in a slow motion playback
of a high-speed film, to be more that of a tongue rather than a toe,
successively thrusting forward and retracting rather like a lizard's
tongue and always 'flapping' on the rough surface of the approaching
flow. The overall movement of water in the jump is that of a reverse
roller. The fast moving flow passes downstream underneath the
surging toe. In the toe itself the flow is upstream on the free
surface and downstream in the shear_layer which occurs at the liquid
to liquid interface on the underside of the toe. (See Figure 3 )
This shear layer gradually thickens in the downstream direction as
more of the upper region of the fast flow becomes retarded and more
of the lower region of the toe becomes accelerated in the downstream
direction. The movement of the tongue is clearly shown in Plates 2
and 3 taken at a 1 sec interval.
*all plates show flow from right to left unless otherwise stated.

Looking further along the body of the jump it could be seen that the
shear layer interface (between the fast flowing jet under the jump
and the reverse roller) became undulating in nature at NF = 3. At
this Froude Number and for progressively higher values this undulation
caused the downstream end of the toe of the jump to snake up and down,
producing both splashing and gulping in of, air: this phenomenon is
at its most consistent at 3>Nr,.‹. 4. The undulating shear layer might 2.
be explained as a form of critical flow which occurs when the fast
moving jet is retarded by the wall of slower-moving water so that it
reaches the state where a train of waves forms in a similar manner to
that which occurs with free surface flow at critical conditions.
Plate 4 and Figure 4 illustrate this phenomenon. The decrease in
specific energy which this implies might also be encouraged by the
formation of a separation bubble as the boundary layer separates under
the toe of the jump as described by Silberman and as shown in the
following sketch:
z*-
eindu laShea
/ / / / / La yer-
Figure 4
Stefrelt-crtion ac.4.6.6./e
An indication of this separation bubble was produced in the present
research by causing the hydraulic jump to move first upstream and then
downstream over a bed tapping through which a jet of dye was injected
into the flow. Whereas the jet was generally directed firmly downstream
by the flow adjacent to the flume bed, it was observed to flicker
alternately upstream and downstream at a point approximately three
quarters of the length of the jump from the toe.

-25-
At lower values of Froude Number the undulating shear layer is not
apparent, and at higher values, it becomes part of a larger scale
violent eddying in which the wave train appears intermittently. It
is possible that these violent eddies constitute a breakdown of the
wave train. Whatever their origin they appear to be closely linked
to two types of upwash: surges and 'explosions' which occur at the
surface of the jump. The roller takes pronounced vertical leaps in
'riding' both the undulating waves and the eddies. Silberman looks at
this slightly differently: "slugs of water roll intermittently down the
steep face and fall into the high velocity jet. A surface surge is
created each time the slug makes contact with the jet". The observations
of the present research suggest that the series of events, described above,
at the toe of the jump is closely linked to the eddy formation described
earlier. This is well illustrated in Plates 5 and 6 taken 2 sec apart,
and in Plates 30-36 taken from the high-speed film at approximately
1/20 sec intervals. The 'explosions' or sudden upwashes of water are
of random frequency and amplitude. They occur in the shallower depths
of the jump and produce considerable spray. At the deeper end of the
jump the upwashes assume a less violent form of surge and often cause a
small surface roller to occur in the opposite direction to that of the
main surface roller of the jump (see Plate 7). The "explosion" does
not appear well on still photographs but Plate 8 shows one occurring
at N = 15. Still photographs taken from the high-speed film show Fl
the sequence of events during the occurrence of an "explosion". (See
Plates 23 to 29 which are on average /50 sec apart).
One further feature related to the upwash is the formation of a large
solitary wave which moves downstream from the jump following the
occurrence of a surge. This is illustrated in Plates 9 and 10 taken
at 1 sec intervals and in Plates 16 to 22 taken from the high-speed
1 film at intervals averaging /50 sec.*
*All the plates taken from the high-speed film are negative prints.

-26-
As the Froude Number increases to 15 there also appears a clockwise
(with flow from left to right) eddying motion in the jump, which is
opposite in circulation to, and downstream of, the reverse roller.
A stagnation point forms at the surface and appears as an exaggerated
form of the surge.
/ / / / /
-Figure 5
This point can also be seen in Plate 11 where the jump hits the roof
of the flume.
Another interesting aspect to observe as the Froude Number progresses
from 1.5 to 15 is in the outline shape of the jump. At 1.5 the reverse
roller is a compact phenomenon, stable and largely confined to a depth
in excess of y1 (see Plate 12) At a Froude Number of 3- 4 the wave
train previously referred to causes a breaking up of this stable
roller and the toe or tongue is longer (see Plate 13).
At Froude Number 5- 9 the jump becomes more stable with only inter-
• mittent large scale wave formation in the fast jet. For values of
NF1
of 9-15 as described previously the jump becomes unstable and
violent with a long tongue snaking upstream for as much as 0.5 m.
Various experimenters17,18,19,
have examined the parameters relating
to the length of the hydraulic jump. 4 Although their work is well
documented comparisons are of doubtful value because (a) there are
varied definitions of the end of a jump and (b) the suggeSted 'ends'
such as the point at which the jet rises from the floor, and the
location of the downstream end of the rolrer are dif!icult to determine

-27--
in practice. Rajaratnam7 claims however that general agreement has
been reached to define the end of the jump as the section at which the
water surface becomes essentially level and the mean surface elevation
is maximal. This point is taken up again at the end of the next
paragraph.
As Mentioned in the Introduction Kenn and Zanker5 have argued that air
entrainment is related to the velocity rather than the Froude Number of
the fast jet. This being so it is probable that if any properties of
a hydraulic jump are dependent on the air entrainment process then they
will also be dependent on the velocity rather than the Froude Number of
the fast flow. Accordingly measurements and photographs were taken of
hydraulic jumps having approximately the same value of Froude Number,
6.4; but different velocities. Plates 14 and 15 illustrate the
visible differences. The faster flowing jet 3.5 m/s in Plate 15
entrains more air than that in Plate 14 at 2.85 m/s. Furthermore the
.length of the jump, as defined by Rajaratnam, appears to be greater
for the jump with the higher upstream velocity. Whether there is any
direct connection between air entrainment and jump length, each
• perhaps related to energy loss, it is impossible to say at this stage
of this research.

Plate Z. 9.37 lji = 5.1m/s
Plate 3
N F, 9.37 v-s =5.1mis
rr- PLate 4 ti
N Ft= 305 tr,= L3M/S
Plate 5 NF, =15-3 6.8m/s •
Co

Plate
NF/ 15-3 1).1 = G- ?m/s
Plate 7
N 15.3 11., -:. 6-8mis
Plate 8 = (o• 8 rn/s
Plate 9
NF, = 9- (0 4--25tris

Kate 10 NF1= 9.6 u, =4.25mis
Plate 11 NF1 = 3.3 v-,:--- 6.8mjs
Plate 12. NFC--- 1.8 u-,--: 1.4-m/s
Plate 13 NF, = 3.25 -tr, = 2 .5 mis

Plate 14 NF, =6,-4 u,= 2.85 m/s
Plate_ 15 NF, = 6.4 vc---: 3.5 m/s

32
Plates Plotes Plates
23 30
17 t
I I. 4 h I IN I I I I I r ay.. MI I II
18 ZS 32
Z 3?
27
11
21 ZS
as
..111$ Jaw
22
29 S
N., = 3
NF, = 3 N F = 3

Plates 35
1
1
N r, =1-8
Underside of Jump Flow Left to Right
.10
Nr, = 1.8
41
42
45
48

Nate 49

III RESULTS & DISCUSSION
2 Flow Force Imbalance

2. Flow-Force Imbalance
The flow force, defined as the force required theoretically to bring
the flow to a halt and described algebraically as pgy:2
+pV„q per
unit width, was calculated from measured values of yl y2 and Q.
One of the first things the calculations revealed was that the
upstream value of flow force was greater than that downstream i.e.
F1 > F2.
This difference is Most clearly seen in the graph of Fel vs Nri
(Fig. 11) and also in the divergence of the curve of y21y1 vs
NFl (Fig. 10) from the elementary classical theory which gives
y2/y1(..11 8NF12 - 1). A careful analysis of the possible
causes of this divergence was necessary. Immediate comparison with
previous researchers(see overlay0Dig. 10) indicated that the
discrepancy in this research was unusually great. Both Rajaratnam17
and Harleman18
agree that a divergence exists but whereas at NF1
10
their deviation from the elementary theory is about 5%, that obtained
in this present research was of the order of 10% with an even more
marked divergence at higher values of NFl. A check on the accuracy
of measurements was therefore made.
The most suspect measurement was that of y1, the upstream depth. An
error of in the measurement of y1 would have resulted in an error
of 5% in F1; dF1 dy1 Mi
F.
and 5% represents. the difference,
F1 y1
--at N= 10 between these values of F1 and those of other researchers.
For a depth of 20 mm this means an error of 1 mm. As the higher
values of NFl could only be obtained at depths of the order of 20 mm
and it was at these values that the discrepancy was most apparent,
*Equation (1)
-35°
the accuracy of the measurements of y1 was subjected to close
scrutiny.
The first problem arising in this regard was that the bed tappings
proved unreliable in giving true readings of fast flow depth, a fact
elaborated upon under 'Experimental Procedure' (page 18 ). The only
available alternative and specific means of measuring depth was a
point gauge. This device very accurately locates the free surface
in tranquil flow where a surface ripple immediately becomes apparent
when the point touches the surface. In shooting flow, however, not
only are all ripples carried downstream, but as the velocity rises,
the surface level becomes progressively difficult to locate due to
the increasing activity of surface waves and splashes, a problem
encountered by other researchers.31
It is therefore necessary to
establish by eye a mean surface level by some other method such as
judging the level of the tip of the pointer when it breaks the surface
for approximately half an observed time, in this case 30 seconds. As
a further check, for each gate setting, the value of y1 , measured at
the lowest value of flow rate when surface disturbance was not great,
was compared with y1 measured at the highest flow rate. In each case
the values correlated accurately within 2%.
Any error in the measurement of y1 would have to be an underestimate
of the depth in order to cause an overestimate of the upstream flow
force. The possibility was investigated, therefore, that a dishing
of the fast flow surface might exist due to a vortex formation
upstream of the sluice gate being carried downstream under the gate.
However, such vortices would usually be expected to rotate in plan
as follows:

'37)-
0 Row ),›
Figure 6
and therefore produce an upwelling rather than a dishing at the centre
of the fast flow downstream of the gate. This sense of rotation was
observed in vortices upstream of a sluice gate in an open flume of
similar dimensions.
A traverse of the depth y1 with a cranked pointed confirmed that there
was no dishing of the fast flow surface. There was, however, a
variation of depth across the width, at velocities in excess of 3m/s,
mainly due to the presence of superelevated waves which probably
resulted from a slight assymmetry of flow. It will be recalled that
in the later stages of the experimental work there appeared an
increasing amount of leakage past the side of the rubber sluice gate
at high velocities, a factor which would have caused such waves to
appear.
In order to reduce the likelihood of errors due to variation of depth
across the flow depth traverses were taken at all depths and flow
rates. The mean depths which were calculated from these traverses
were always within 1% of the centre line depth. A further check on
the depth measurement was undertaken by measuring the gate opening
for each flow and, with the toe of the jump only 350 mm from the gate,
assuming y1 to be equal to the gate opening. The gate is designed to
have a contraction coefficient of 1. (A full scale replica of the
gate was tested in an open flume at velocities up to 2m/s and the

value of contraction coefficient was confirwed. It was, however,
impossible to obtain velocities nearer the 6m/s obtained in the
experimental flume.) A calculation showed the displacement thickness
of the boundary layer at this distance from the gate would be no more
than 1 mm at V1 6m/s which for a depth of 20 mm gives an error of 5%.
This error would, however, have the effect of reducing the upstream
flow force. Values of various parameters based on the assumption that
,yi is equal to the gate opening are shown in the graphs and do not show
any substantial deviation from the pattern of values obtained from the
point gauge readings.
As stated under 'Experimental Procedure' the downstream depth y2 was
measured by means of bed tappings and stilling wells. The question
arose, therefore, whether the values of y2 were accurate and indeed
valid as a basis of estimating pgy2./ the downstream hydrostatic
force per unit width. Comparisons of the stilling well levels
appropriate to different values of y2 were made with values estimated
by eye on a scale fixed to the side of the flume at the appropriate
position. The two sets of values thus obtained corresponded with
each other well within the limits of accuracy required. It was also
apparent that in cases where the last two or three bed tappings were
all downstream of the jump, the two or three equivalent stilling well
readings correlated with each other to within 1 or 2%. The value of
y2
was already measured downstreaM-O'f,the zone of aeration and the
density of the flow at that point could validly be taken as that of
water and not an air/water mixture.

The one outstanding possible source of experimental error was the
calibration of the orifice plate by which the flow rate was measured.
In order to avoid the possibility of cavitation at the orifice when
pressures near absolute zero existed in the flume, it was necessary
to site it only 2500 mm (i.e. 25 pipe diameters)XStream of the
by-pass tee in the pipework and 2800 mm from the pump. It will be
recalled from 'Experimental Procedure' that the orifice was calibrated
in another part of the laboratory in a horizontal length of straight
100 mm diameter pipe with an approach length of 4000 mm. A check on
the calibration curve (Figure 17) using BS1042 indicated that this
calibration was accurate. However the situation of the orifice in
the experimental rig was by no means identical to that in the calibra-
tion rig and it was clear that an approach length of 25 pipe diameters*
was close to the limits of accuracy prescribed by BS1042. A confirm-
atory in-situ calibration was impractical so a helix meter was fitted
into the suction pipe about 1m above the pump and with a straight
approach length of 5.5 m. The values of discharge registered by the
helix meter were plotted against AH,the orifice manometer reading,
for five separate flow rates and these values were found to correspond
almost exactly with the original orifice calibration. The helix
meter manufacturers (Kent Meters) confirmed the accuracy of this device
to be within -± 2% in this location. The orifice calibration and
confirmatory values are shown in Figure 17.
The validity of the assumptions made in the elementary theory
(Equation ) had then to be checked. These are:
a) uniform pressure distribution
b) uniform velocity distribution
c) negligible gravity effects
d) negligible boundary shear.
or 2500mm in the experimental rig.
739-

-40-
With regard to pressure distribution, Rajaratnam15 using a Prandtl
tube established that the pressure distribution is non-hydrostatic
only in a short length near the beginning of but within the jump.
There was no evidence in this research to contradict this.
Rajautnam's15
measurement of velocity distribution in the fast flow
indicated uniformity for approximately 95% of the depth. His •
measurements were however located at the vena contracta immediately
downstream of an undershot gate where it was unlikely that the
boundary layer had developed to any significant extent. Visual
observations of movement of minute air bubbles downstream of the
jump in this research indicated at all times that the velocity
distribution downstream.(Section 2)was as uniform as that in the fast
flow. The question of momentum correction due to velocity distri-
bution is dealt with more fully in the following pages. The slopeof
the flume throughout this work was 1 in 500 and the maximum error in
Flow Force which could result from this due to gravity effects was
only 0.5N/m.
Boundary shear therefore became the most probable source of the flow
force discrepancy. The most thorough analysis of the dynamic
characteristics of the hydraulic jump allowing for boundary shear
is given by Rouse et a1.17 In addition to considerations of the
above mentioned assumptions they include a term which allows for the
effect of turbulence flux.
Rouse et al showed that the equation of motion
— — — u au +.. v au + w au + 7671 + 7671.1" + wi au' ax ay az dx ay az
g (D a2—u. - x --47 ax ax ay- az4

-41-
and the continuity equation
41■14.
au acr aw ax + ay ' az -
au' ay' ax"
; -87 -57 • • • (3)
can be combined and reduced to
— ax I ax- U j . S • an U.
j 0.S
f 5 ex.ds 1. —1. P X dv j ax an --t jds
ax. vo S an where s is the surface of the region over which the integration is
to be performed, n is the outward normal to the surface,Vo is enclosed
volume, and the indices i and j denote in turn each of the coordinate
directions. The first term of the left hand side of the equation
embodies the net momentum flux of the mean flow and the second term
the difference between rates of influx and efflux turbulence (i.e.
the net turbulence flux). The first term on the right hand side
embodies the mean normal force exerted externally on the surface of
the region; the second term the three components of the weight of
fluid contained in the region and the third term the 3 components of
the mean tangential force exerted on the surface. If the hydraulic
jump is in two dimensions the relevant equation is for direction x.
In their analysis Rouse et al assumed ;that the turbulence flux is
negligible at section 1, that the pressure distribution is hydrostatic
and that both the viscous stress and turbulence stress are negligible

--42-
over the free surface. If the bed is horizontal the effects of
•
gravity may be neglected. These assumptions reduce equation 4 to
0
72
Purdy p73.12 0
dY
Li payi2 p af
p (PI)c x = \. ay .1 y=0
where Lj refers to the 'length' of the jump.
If as Harlemanh ' suggests, one puts
. (5)
Pi
Yi , u. ay =!• i
772 o • 4.1 Y1
72 7Z' ay 1,
2(112)2,71.7
132 = = s'N/ 1.22 '
0 Y2 0 V2y2
-where /a l and /s 0 are momentum flux correction factors for a non-,
uniform velocity distribution and 12 the turbulence flux correction
factor (Ii assumed zero) and the equation is divided byf g, then
the following equation results:
R2. V22 YP , A. 1/12:T1 - Ia5.2 g r g 12
= yi2
5122 2 Pg
dx
By introducing the continuity equation = V2y2 and Froude
Number NF
and Reynolds Number NR equation 6 is rewritten
F12 = J/2 [ + 1) (J I) S
1314/ (N2 + 12)
in which j = Y2/ /yi
and S
and 7. (a.
ViNR J ay Y=0 dx

If 131 = 132=1and 12 = 0 & Nicti = 10
(this implies frictionless flow) then equation 7 reduces to
2 37-2/ ( + 1) or Yfy = -2- (I/ 1 +8N. 2 F1 = 2 iyi yl
which is equation 1.
Using Rouse et al's values of mean point velocities and mean
disturbance velocities, fu ,3 2. and 12 can be calculated. Such
derived values show that the momentum flux corrections /3, and/
and the turbulence flux correction 12 tend to cancel each other. For
instance at a value of NF1 of 6, the values of /3" 7a 2_,I2 and J are
respectively 1.01, 1.02, 0.15 and 7.70. These figures yield a value
for the denominator of equation 7 of 6.63. If s, = 1 and 12 = 0
as the elementary theory assumes, then the denominator becomes 6.67.
This illustrates the way in which the above mentioned corrections tend
to cancel each other. As a check, velocity profiles at section (1)
were measured in this present research with a total head tube for a
variety of depths and values of /31 calculated by dividing the
cirintegrated momentum profiles O udy by the mean momentum
g‘ 0/9 The values, f based on a (V1') y where V, : a /
shown in Table 6 show that *" was unity within— 1%, thus
confirming the above assumptions. In equation 7 therefore the only
remaining factor which could affect the flow force balance resulting
in a reduction of the downstream dept4 is that due to bed shear.
(The effect of bed shear may be seen as similar to that of baffle
piers in applying a force to the stream in the opposite direction to
the flow.) Bed shear was therefore considered to be the principal
factor in the reduction of the flow force in this research.
Rajaratnam17 confirmed this view as a result of measurements of bed
-43—

-44-
shear in hydraulic jumps using a Preston Tube. Nominating E; as
F1 F2 that is the ratio of the integrated bed shear force
gY2/2
per unit width to the hydrostatic component of force at the beginning
of the jump, he developed the equation
2( Y1Y )3 - 37.2/,/yi (1 - C 2NF12 ) 2R,„ = 0 ri . . . (8)
Both this equation and equation 7 derived byqlarleman yield a common
curve on the graph of y2/y1 us NF1 shown in Overlay (i) for Fig. 10.
The difference between this curve and that derived from equation 1 is
about 4% at NF1 = 10.
However, the difference between the curve derived in this present
research and that resulting from equation 1 is of the order of
10 - 15% at NF1 = 10. Further examples of the differences in the
flow force discrepancy is shown in overlay (i) for Fig. 10 where
values from the present tests are compared with those derived by
Rajaratnam,15 Harleman16
and Peterka.1,8
There are, however, significant differences in the conditions of flow
in all the other tests referred to. Harleman's figures are based on
an air flow simulation of the hydraulic jump in a duct 24 inches
(600 mm) wide: Rajaratnam's flume was 12 inches (300 mm) and Peterka's
12.125 inches (307 mm) wide. It is possible that the narrowness of the
4 inch (100 mm) flume in the present tfsts affected the flow force in
that the sidewalls made a more significant contribution to the
boundary shear than in the wider flumes of other researchers.
Two further sets of tests were conducted in order to investigate this
'problem further. In one, a rough bed was inserted into the flume.
-45-
This was a piece of English Abrasives Aluminium oxide RH Cloth
147,* of mean roughness height 1.256 mm glued along the complete length
of the flume bed. It had the incidental effect of aerating the fast flow
jet at velocities above 5m/s. The quantitative results are shown in
overlays (ii), Figs, 10, 11 and 12 and indicate a further reduction of
flow force through the jump compared with the results obtained with the
normal machined steel bed. However, the reduction is not so significant as
to lead to the conclusions that the differences in values produced by this
research with the normal bed and those obtained by Rajaratnam, Harleman,
and Peterka might be the result of the normal bed of this flume being
rougher than those of the other researchers mentioned.
In another set of tests, an attempt was made to estimate the value of
boundary shear by establishing uniform fast flow throughout the length
of the flume at various depths and flow rates! The maximum slope of
1/20 obtainable with the flume imposed a limitation on the maximum
velocity and minimum depth which could be observed in this manner.
It is not possible to calculate what factor should be applied to the
values of shear thus obtained in order to relate them to the equivalent
hydraulic jumps where the fast flow exists in only part of the flume,
but they do show some similarity with the main experimental results. At
the maximum value of NF1 obtained, 4.1, the value of F1 F2 over the
length of the flume was 28N/m width which compares with the value of
17.7 Wm for the same NF1(arrowed in Table 2(a)) for a jump whose length
was approximately i of the length of the flume.
More detailed calculations of the upstream momentum force were made
using the values obtained by means of the total head traverses described
on page 43. The integrated profiles were used to derive the values of
V1 '' M1 M2' F1', F2 NF1 1 etc. shown in Table 6 and these values
plotted on overlays (ii) of Figures 10, 11 and 12. These show a consistent
*a sample of this cloth is attached to page 89 in the Appendix.
7ITable 4 shows values obtained.

-46-
deviation from the classical relationship of the same order as those
obtained previously in the present research.
In a recently published paper21 Leutheusser and Kartha concluded that
inflow conditions could have a marked effect on the boundary shear. They
observed that for a fully developed fast jet (Lel. y1) into the jump,
the boundary shear is considerably higher than that indicated by Rajaratnam
for NF1;>10, although for undeveloped flow (g4. y1) it corresponds more
closely with Rajaratnam's values. Leutheusser and Kartha define the
conditions for fully developed flow as 1/d)200 where 1 is the distance
• from the undershot gate to the toe of the jump and d is the gate opening.
In the present research the value of 1/d for V1 = 6m/s and y1 = 19mm was
950
approximately 3 - 18.4 which indicates an undeveloped flow by the 1
above definition. The experimental work described on page 43 was also
used to determine the state of boundary layer development at section (1)
where all the upstream depths were measured for the main hydraulic jump
experimentation. Vertical traverses with a total head tube were made
on the centre-line of the fast flow at sections (1) (3) and (4) with the
hydraulic jump well downstream. These results are synthesised in Figs.
14 and 15* showing Ythr versus u/V1 , where it can clearly be seen that the
boundary layer at section (1) was only partially developed compared with
sections (3) and (4) where it appears to be fully developed. At section
(3) 1/d = 40 and at section (4) 1/d = 64. This neither confirms nor
contradicts the work of Leutheusser and Kartha as (a) the details of
their investigation are not available, at this stage and (b) in this
present work it proved impossible to measure the velocity at depths
*Table 5 shows detailed results.
41 .03

-47-
exceeding Y.'/y = 0.8 with the total head tube because of surface
disturbance and the resulting air pockets.
•
Y1 Overlay (iii} on the graph of Y2 against NF1 (Fig. 10) shows
the curve for developed inflow by Leutheusser and Kartha which may
be compared with the experimental results of the present research.
One final remark on this problem is that it would be misleading to
extrapolate from the value of boundary shear determined in a
laboratory flume to a larger scale situation according to Froude
scaling because the boundary shear stress ocV2. A velocity
scaling, as with air entrainment, would therefore seem appropriate
for boundary shear.
Although it is not directly connected with momentum a mention should
be made here of the values obtained for integrated total head by
adding the values of y1 to 0(v /2g. The latter were obtained by
integrating graphically the expression 51 1.13dy and dividing it by 0
2g udy. The change of total head expressed as All' and AH' o Y1 H1'
(Figures 13 and 14) plotted against NFl' show little divergence from
those obtained during the main experimental work.
*Table 6 shows detailed results

III RESULTS & DISCUSSION
3 Air Entrainment

-48-
3, Air Entrainment
The precise criteria for the inception of air entrainment have not
yet been established. Various experimenters have however observed
the physical conditions of flow which apparently contribute to the
phenomenon. Lin and Donnelly22
conducted investigations into the
nature of entrainment of gases by liquids by studying the effect of
jets of water falling vertically on to a still water surface. They •
noted that laminar jets drew into the still water a thin envelope of
air which broke up into bubbles at a certain depth. This envelope is
assumed to result from the momentum of the 'carrier' boundary layer
(that is the layer of air adjacent to the surface of the jet which is
drawn into motion by boundary friction) overcoming the surface
tension force at the water surface. An additional factor is the effect
of wave lapping at the shear line between the jet and the still surface.
In the case of turbulent jets Lin and Donnelly observed that distur-
bances developed on the jet surface and Zanker23
observed that under
certain conditions, when subjected to stroboscope lighting, turbulent
jets were not a continuous body of fluid but rather a series of 'blobs'.
In this case there was therefore another possible mechanism of air
entrainment namely the encapsulating of air both in the jet and at the
point of entry to the still surface by discreet blobs of water. It
should be noted that even if the flow has not disintegrated in the way
Zanker described the rough surface.o a turbulent jet would undoubtedly
increase the momentum of the 'carrier' boundary layer and hence
contribute to an envelope of air overcoming the surface tension
force at the water surface.

-49-
;Laminar
Turbulent
Figure 7
There is some similarity between the circular jet falling on to a
still water surface and the high velocity rectangular jet meeting the
reversed roller in an open channel flow hydraulic jump.. All the
mechanisms observed from a falling jet, except for the formation of
discreet blobs in the fast jet, are observable in the hydraulic jump,
and in a similar way their existence as significant factors depends
on the degree of fast jet turbulence. For instance the roughness
of the water surface of the fast flow depends on the general turbulence
of the flow. The small surface waves, which increase in size and
activity with increasing velocity of flow and boundary roughness, are
undoubtedly a factor in the development of the 'carrier' boundary
layer which appears to contribute to air entrainment, e.g. when the
jump was advanced up the flume almost to the point of submergence the
amount of air entrainment at the jump decreased markedly. Furthermore
as the velocity and boundary roughness increase so the possibility
arises of air entrainment taking place in the fast flow itself thereby
creating a 'pre—entrained' jump. All of these observations lead to
the conclusion of many researchers 24' 25' 26
that air entrainment
in fast flow occurs when the boundary layer reaches the free surface.

-50-
Even without pre-entrainment however the rough free surface of the
fast jet probably plays a part in trapping air when it meets the toe
of the jump. Progressing to the air entrainment process at the jump
itself, examination of both the high speed films of the jump and still
photographs of the underside of the toe (Plate 49) indicate that the
following phenomena contribute to air entrainment in the hydraulic
jump:
1. pre-entrainment in the fast flow;
2. an envelope of air which is drawn in as a continuous stream of
bubbles at the interface or 'shear layer' between the fast flow
jet and the reverse roller; the greater part of the entrainment
appears to take place here;
.41 0
cr 0 • tzto•e4-, 0 0 • Lex.ya
/ / / i Figure 8
3. the lapping of waves traps air both at the toe (perhaps a
contributory factor to the shear layer entrainment) and on the
surface of the roller;
Wag/4S
V Figure 9
z r z
4. splashes from the surface of the roller return as drops or jets
of water and entrain air when they return to the water surface
in the same way as a circular jet; the occurrence of these
splashes implies a degree of turbulence in the roller greater
than that necessary for a particle of water to have sufficient
momentum to overcome surface tension and leave the surface.
• a. s 0 ° •■•

-51-
All of the above phenomena can be clearly seen in the sequence of
frames from the high-speed film (Plates 16 to 48) which are selected
at intervals ranging between - 1 - and - 1— sec (Table 7 gives details).
50 25
Various researches have commented on the effect of aeration on the
hydraulic jump: Voinitch26 in respect of length, Chanishvili27
Hamid28
and Hanko29
in respect of energy dissipation and Jevdjevich30
in respect of boundary shear and bulking. None of these effects was
strictly within the terms of reference of this research but the
references are mentioned in passing.
Two other researchers,Uppal25 and Lamb31
have devised and used
techniques for the measurement of air concentration. Such techniques
although they might have been of'great- value were not available for
this research.
One aspect of air entrainment which was illustrated to a limited
extent however was the paramount effect of velocity on the degree of
entrainment. Kenn and Zanker have drawn attention to this matter,
arguing that it is the velocity rather than the Froude Number of the
fast jet which determines the amount of air entrainment. Plates .14
and 15 illustrate this point where the marginally higher velocity
fast jet for the same Froude Number produces apparently a greater
concentration of entrained air in the jump and, as mentioned on
page 27 this is in turn related to a greater length of jump.

IV RESULTS & DISCUSSION
4 Effects of Low Pressures

-52-
4. Effects of Low Pressures
As mentioned in the Intioduction it was not anticipated from the
considerations of momentum principles that a change of ambient
pressure would affect the classical hydraulic jump relationship.
Both the graphs (Figures 10, 11 and 12) and the photographs (Plates 50
* and 51 and all other plates subsequently referred to) confirm this
expectation. Apart from a rather large random scatter, evident in
the graphs, which is probably due to the problem of measuring y1
accurately, the values of Conjugate Depth Ratio, Flow Force Ratio
and Non-Dimensional Boundary Shear, (Figures 10, 11 and 12) are
unchanged by a reduction in pressure. The energy loss also appears
to be unchanged (Figure 13A). The above physical quantities were
compared by graphical examination of numerical values derived from
measurements.
Other comparisons were made by inspection of the still photographs
both at atmospheric pressure and at low pressures. The only
discernable difference observable in these photographs is that the
concentration of the entrained air appears to be less at pressures
near absolute zero (between 20 and 75 mm mercury absolute). This can
most clearly be seen in Plates 54 and 55, 56 and 57, 58 and 59, and
60 and 61. The explanation of this occurrence is not readily apparent.
It could be said that air entrained at lower pressures has perforce
a lower density and therefore rises more quickly to the surface.
However if the bubble sizes are similar in both cases the ratio of
the bubble rise velocity at atmospheric pressure to that at 80 mbar
is approximately 1000:999 which suggests that this is an unlikely
explanation. It may also be possible that because the momentum of
the 'carrier' boundary layer of air at low pressures is less, the
*All the plates taken from the high-speed film are of negative prints.

-53-
entrainment of air at the shear layer is less. A more detailed study
of the movement of air within the jump would be necessary to reach
any conclusions on this matter.
A full list of all the visual observations which were made is given
in Table 1. A set of photographs appropriate to the table is shown
in Plates 50 to 63 immediately following this chart. The remaining
Plates 64 to 73 are included as further typical illustrations of the
charaCteristics opserved. Each pair of photographs was taken at the
same value of Froude Number.

-54-
Table 1
Observations from Photographs of Hydraulic Jump at Atmospheric
and Vacuum Pressures
Vacuum Pressure
Remarks Feature Atmospheric Pressure
Similar Plates 50 and 51
Similar Plates 52 and 53
No visible difference
'Humping'
Some on surface of fast flow jet
Splashing
'Length' of jump
Shape of downstream 'bubble train'
Bubble size
Downstream waves
Visible in both Plates 54 and 55
All plates
High-speed film, plates 74 and 75
• No visible difference Plates 56 and 57
No visible difference Plates 58 and 59
No difference Plates 60 and 61
No visible difference
No visible difference Plates 62 and 63
Overall picture
Degree of surface disturbance
Degree of stream turbulence
Entrained air concentration
Surface bubbles
Greater downstream
VI

Kate 52(Atmosi:)heri
Plata 53 (Vacuum)
Nate 50(Atrnostheric)
1
NT, = 3-25 v-, = Z5 ryqs
Plata 5 I (Vacuum)

. 19.°7•111./"Vem&'41L'I,4,..,311
Nate 54 (Atmospheric)
• IIIP•■ • •••• NF1 r 9-17 U, = 5-1 rra
EOM 61 7.0•111111
Pia+e 55 (Vacuum)
MI •
Plate 56 (Atmospheric) ,
NF, w- 15.3 A •
Co•g rrtis
Plate 57(Vacuum)

Plate (00 (Atmospheric)
NF, =9.37
Plate Co I (Vcicmurn)
I lij Plate 58 (Atmospheric)
Rillit ...7341} tir, = 3.25
v-,= 2 -5nvs
6.1•-•• ..-711•■■•••••1111111Pmle
Nate 59 (VoctAurn) •
•

'N. elk
Kcal-a Ca. (Afmosiaheric)
i N F-1 T-- 40 • LH
U-1 •:.-- L. g5 rn/s
Kate (03 (Vacuum)
Nate CoLF(At-rnosipheric
NF, = 3.25 ti- , = 2 • 6 rrqs
Plate 65 (Vacuum,

••1101 • 1■111_ • MIMI • 11•11M1 • •MI•1
19.41P.,16.111Willt:
II
Plate 66 (Aftlias¢heric)
N F, 9 . 37
• -It' 7.11 .-22,1 , • -1.r, = 5.71 rn is
II •
.41#11110rimmii■•••=111111 • * Plate V7 (Vacuum)
•••
Plate 68 (Atmospheric)
9.37
= 5.71 ni/s ,
Nate 6,9 (Vac-uurr) •
_ 211111616_ Nome __ Sb
\J1

Plake 70 (Atrnostheric)
%
Rate. 71 (Vocuurn)
MIMI • ••••1 •
Plate 72 (AtrnosPheri
NFI= 3.25 = 2-5 rn/s
Plate 73 ( Vacuum)
.....,..„.

Plate 75
Flow from le-et to right
NF, = 1.8
Pressure : 830 turn t4a.ter (Abs.
Plate 74-
61

-62-
It is of interest that whenever a change of pressure occurred
rapidly, for instance when the vacuum was related, a temporary change
of the position of the jump occurred. As the pressure was allowed to
return to atmospheric the jump moved up to submerge the undershot gate
and only after about a minute following the attainment of atmospheric
pressure did the jump return to the position it held at vacuum pressure.
This occurrence was assumed to be due to the adjustment of pressures
within the flow circuit.
In the discussion of air entrainment in the jump, a circular jet of
water falling on to a still water surface was used as a study model.
It seemed appropriate therefore to investigate the effect of vacuum
pressures on the concentration of entrained air by observing the
behaviour of a jet in the experimental flume as it plunged vertically
on to the surface of a still reservoir of water 'trapped' in the
working section. The sluice gate was completely lowered thus
preventing flow through the flume proper, and a tube was connected
from a tapping upstream of the undershot gate to a length of pitot
tubing which passed through one of the roof tapping points. Two sets
of tests were conducted. Each allowed visual comparisons to be made
between the behaviour of the jet at atmospheric and vacuum pressures.
In the first set insufficient time was allowed in the vacuum condition
to permit the dissolved air in the water to be released and evacua-
ted. As a result the water, in flowing from the higher pressure
upstream of the undershot gate to the vacuum pressure as it emanated
from the pitot tube, arrived at a condition in which the dissolved air
was in the process of being released, and this 'fizzy' jet, plunging
into the still water, gave rise to the cloud of minute bubbles which
can be seen in Plate 77. In comparing Plates 76 and 77 the jet can

-63-
clearly be seen to be plunging deeper in the atmospheric pressure
condition although the apparent release of dissolved air in the
vacuum pressure condition precludes a definite conclusion. In a
separate run of tests the water in the rig was allowed to circulate
in the normal way for three hours, with the jet pump continuously
evacuating, before Plates 81-84 were photographed. These clearly
show an absence of the cloud of minute bubbles previously observed, -
and in comparison with Plates 78-80 indicate a slightly shallower
penetration of the still water by the bubbles of entrained air in
the vacuum pressure condition. This would appear to tally with the
observation of lower air entrainment in the jump under vacuum
pressures, though whether it is due to the lower density of the air
bubbles under these conditions causing them to have less momentum,
or whether it is some other effect, is impossible to say at this stage.
Vacuum pressures then do not appear to affect the overall physical
dimensions of the hydraulic jump but do appear to affect the concen-
tration of entrained air. Further investigations into air concentra-
tion at pressures higher than atmospheric might well prove interesting.

(mmno OA)
Lb z.-4'°1 cl

(olJayclsougv) ,L -01-11c1
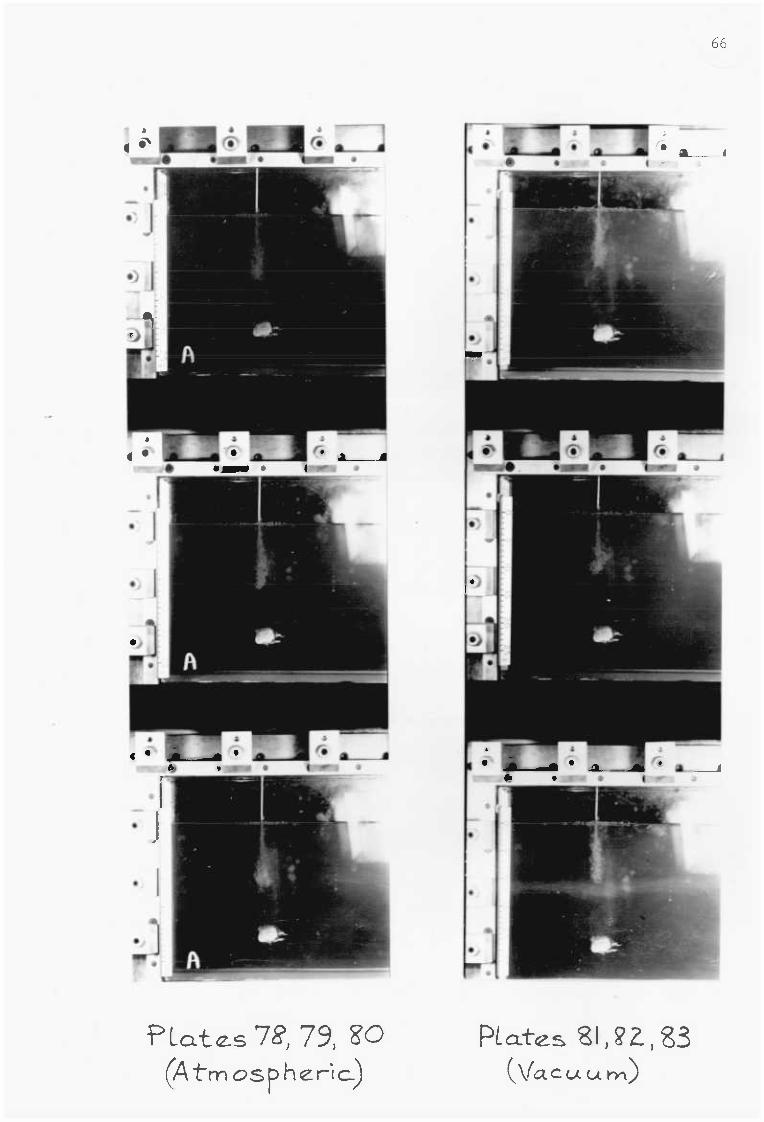
:my. 6 1111k. • o` ro` 03 • .• • • •
I
4 S k
66
PLates7g, 79, 80
Plates SI , SZ, S3 trn osp her-lc)
(Vacu. u ryl)

Conclusions
In this research different characteristics of the hydraulic jump have
been studied both qualitively and quantitatively. Rather than leading
to more straightforward explanations on the phenomenon, the study has
thrown light on many more complex properties and effects than are
generally considered; for instance the various mechanisms whereby
air is entrained and the effect of boundary shear on the classical
hydraulic jump relationship. Furthermore considerable thought has
been put into the problem of depth measurement for jets of fast or
supercritical flow without, alas, a truly satisfactory solution being
obtained within the limitations of the equipment. Regarding the
effect of low ambient pressures on the hydraulic jump, what can best
be described as a rather negative conclusion was reached: namely
that there is little effect save in the apparent reduction in the
concentration of entrained air. The wide scatter of values resulting
from the problem of precise fast flow depth measurement casts some
doubt on the conclusion that air concentration is the only property
affected by low pressures, but should there be any others, the
associated trends are not discernable in the graphs.
In a sense it is true to say that this research followed two different
but closely connected paths: one relating to the subject of the title
of this thesis and the other a more general study of the hydraulic
jump which grew out of the special facilities offered by the equipment
e.g. high Froude Numbers, and high speed film. The solid roof and
removable but heavy side panels on the working section were indis-
pensible for conducting tests at low ambient pressures but proved an
encumbrance for the more general study in that they hindered access
-67 -
66-
to the working section. This research therefore, whilst valuable as
a study was not completely satisfactory in arriving at solutions to
problems or in reaching definite conclusions. It does however suggest
at least three areas of further research:
(i) studying the effect of different boundary roughnesses on the
hydraulic jump
(ii) verification of the apparent lower air concentration in
jumps at vacuum pressures using techniques such as those
described by Straub, Killen and LamO
(iii) investigating the influence of ambient pressures higher than
atmospheric on the hydraulic jump.
-69—
References
1. ROUSE, H., and INCE, S., "History of Hydraulics", Iowa Institute of Hydraulic Research, State University, Iowa City, Iowa, 1957.
2. ELEVATORSKI, E., "The Hydraulic Jump - a Bibliography", Albuquerque, New Mexico, May 1955.
3. BINNIE, A., and SIMS, G.P., "Air Entrainment by Flowing Water at Reduced Atmospheric Pressure" Journal of Hydraulic Research, Vol. 7, 1969, No.3.
4. HUNTER, B., SALES, P., and COLE, B., "Variable Pressure Re-circulating Water Channel, The Engineer, 29 March 1968.
5. KENN, M., and ZANIER, K., "Aspects of Similarity for Air Entraining Water Flows, Nature, Vol. 213, No.5071, 7 January 1967.
6. BAKHMETEFF, B., and MATZKE, A., "The Hydraulic Jump in Terms of Dynamic Similarity", Trans ASCE, Vol. 101, p.638.
7. RAJARATNAM, N., "Hydraulic Jumps", Advances in Hydroscience 1967, Ed. V.T. Chow, Academic Press.
8. CHOW, V.T., "Open Channel Hydraulics", McGraw-Hill Book Co. Inc., New York, 1959.
9. HOFFMAN, C., "Outlet Works", Design for Small Dams, p.379, U.S. Dept. of Interior Bureau of Reclamation, U.S. Govt. Printing Office, Washington, D.C.
10. WILSON, E., "Location of Hydraulic Jumps in Open Rectangular Channels", The Engineer, 27 January, 1967 Vol. 223.
11. WHITE, W. and WHITEHEAD, E., "The Performance of Piezometric Tappings", Report No. INT 98, Hydraulics Research Station, Wallingford.
12. FRANKLYN, R: and WALLACE, J., "Absolute Measurements of Static Hole Error Using Flush Transducers", Jnl. Fluid Mech.1970 Vol. 42 Part
13. SHAW, R., "The Influence of,Ohole Dimensions on Static Pressure Measurements", Jnl. Fluid Mech.1960 Vol 7.
14. KILLFIN, D., "A Study of the Air-Water Interface in Air-Entrained Flow in Open Channels", 13th Congress, IAHR Japan 1969.
15. HENDERSON, F., "Open Channel Flow" Collier-MacMillan, London 1966.
16. SILBERMAN, E., "Turbulence Characteristics of the Hydraulic Jump" Discussion, Trans ASCE: 124: 951;. 1959.

17. RAJARATNAM, N., "The Hydraulic Jump as a Wall Jet", ASCE Jnl. Hyd. Div., 91, HY5, Sept. 1965.
18. HARLEMAN, R., "Turbulence Characteristics of the Hydraulic Jump", Discussion, Trans ASCE: 124: 959; 1959.
19. ROUSE, H., SIAO,T., and NAGARATNAM, S., "Turbulence Characteristics of the Hydraulic Jump" Trans. ASCE, 124: 926; 1959.
20. PETERKA, A., "Hydraulic Design of Stilling Basins and Energy Dissipators", Eng. Monograph No.25, revised ed., U.S. Dept. of the Interior, Bureau of Reclamation, U.S. Govt. Printing Office, Washington, D.C., 1963.
21. TAUTHEUSSER, H. and KARTHA, V., "Effects of Inflow Condition on Hydraulic Jump". ASCE Jnl. Hyd. Div., HY8, August 1972.
22. LIN, J., and DONNELLY, H.G., "Gas Bubble Entrainment by Plunging Laminar Liquid Jets", A.I. Ch.E. Jnl, Vol 12, No.3.
23. ZANKER, K., "Some Hydraulic Modelling Techniques" Proc. I.Mech.E., Vol. 182, Part 3m, 1967-8.
24. ANDERSON, A., "Influence of Channel Roughness on The Aeration of High Velocity Open Channel Flow",.11th Congress, IAHR, Leningrad, 1965 Vol. 1. 37.
25. UPPAL, H., GULATI, T., KOTWAL, A., and SINGH, T., "Studies of the Phenomenon of Air Entrainment", 11th Congress, IAHR, Leningrad, 1965, vol. 1-49.
26. VOINITCH-SIANOZHENTSKIN, "Conjunction of High-Velocity Aerated Streams with Tail-Water in Form of an Hydraulic Jump" 11th Congress, IAHR, Leningrad 1965 Vol. 1-42.
27. CHANSHVILI, A., "Experimental Researches on the Influence of Aeration on the Intensity of Kinetic Energy Dissipation, 11th Congress IAHR, Leningrad 1965, Vol. 1-43.
28. HAMID, M., FARAT, R., and AHMAD, M., "Air-Entraining Devices and their Use in correcting Flow Conditions at Weirs and Canal Outfalls", 5th Congress, IAHR, Minnesota, 1953.
29. HANKO, Z., Energy Losses due to the Surface Roller at Hydraulic Jumps, 11th Congress IAHR Leningrad, 1965 Vol. 1-40.
30 JEVDJEVICH, V., and LEVIN, L., "Entrainment of Air in Flowing Water and Technical Problems associated with it", 5th Congress, IAHR, Minnesota, 1953.
31. STRAUB, L., KILIAN, J., and LAMB, 0., "Velocity Measurements of Air/Water Mixtures", Trans. ASCE, 119: 207; 1954.

V GRAPHS & TABULATED RESULTS

• =0
/
Ct-f GC, Z2 a d!1.; /I
044,* 14, r•
1-4t,tca,;e0;ws.- - t tit rta-404,
Z 0/9 7.21 ;`!-:A1,, a k
9/

8 9 40 II I? ea 7
NF, L 3 44
!S -
14
I
■-adKa-1,m
D p z
/
tips fr.e dare? r.34Acie /
0 I-) re'SS re , Sin 00/-11 6,T -cz e Z(A)
A ti4a.c.“ - - - 4-1,7)4L-4-b.4-4- A /-4.! 2-C
t

u,-%f..• /0 ml•caNI•cmlicr•OAMIMMWear......0
D .1:›th Rc4.74AD / ps etc?. r rip 4-k de. ivo •
.Y=/
4:21-rf7asyshe,e;c Arcssure oof-A 6--..41) b/ 2n) /A/Ft
- A— 0%).C.4.4 44 4)1 - A r e-sr.-444-4a_ be.4. 742-6/c 2474— --
i5
- -0
I Air 1 4,-,...;., ,,,A,.... 2 ila e ie Ore Al "
if 'le: Cldtiv eet -t
' zN-014 ex.:" - -f -- --
46. -
' )
a 'C Ira t 3 S 16
0

0 aft?, herIe Arossure , 00/11 )7a Zile 2IN
VaCIA u err Pre SS el r-0 beet ) le 2(6)
3
0
urc /0 _710
Dcpit-h ,ec,.74-,/cipstetTeur, ia-rneActe No•

Flow Ara-a. Iffrstrect/-4
IVF,
F Urr0e4 C.7"
ed'iet:17,.c it.) A c r;c
A va.c 6.2 Op Ot rctbie 2(h)

„ 61,2. ...ZS) vo_cet f-f
F c,f rc If Flow Forc-a Rca-17c...% 625_cfrece c-14-2 r-
F2 IF, 05. A/F,
Cs.tres. p fteriC frees-g ur-c ?6°,1 6 %?,, r
-7 2-
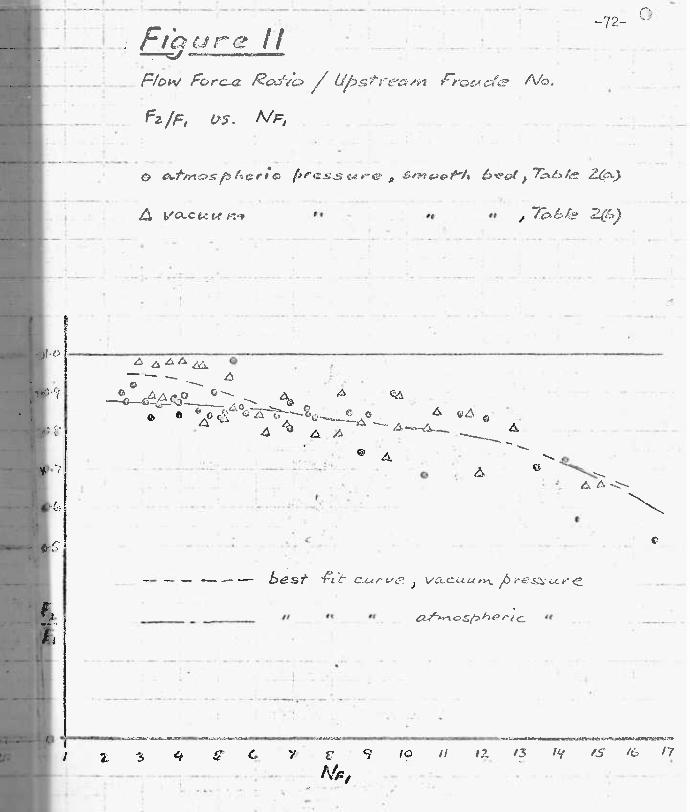
6
6 0 4 0 0
4 4
(.6
••••■••••■ — best
If f t rr
(; 1 .0 E:
11/41F
/3 It 45- /0";? /7
..7.0.,^44.1214-51,114
soc.,-enntossfararametataltr.
10 11 I Z
eirc lI Flow Forc-a
Fz/F, 1 V Fl
-72-
u t Yea an Fr0)4,.".! "3
0 13 A., pec-c-s e4 6tv. e,-)o tit 6 ,01, Tex6 ie
vo_ce,„cm. pp* 00 al 7,n 6 ks, )

-73-,
zs
250 /Yo - ;77 e 17 5 IC", CA rirl-e...9rrAteCe
rCe Fkc,44,4-e 14/ 4"
/ A
r . r /2
2zo to At/nos/Vier-lc_ sekico-rs'S &c( rct 6 /e-
2t o
Zoo
14 0
3
110
lb 0
400
90
•
• $ •••••• *4:1' 1.• $
r•lk:
• • •
•
IC) •
• • • 6916- ogbe- • 4 c
'a 4
lo 13 14 /5 /(
ICo
/Go
ISO
gest-Fit • • cshr-ve_
17
z7
ZIA

ges fit chArve
2.70 -7
zco ri u / 2 /Vo - ) n 5 . 1-QPI ( r.-1-1-e5e—cAte ce
-Cheer or -c ' 6-2'c,dckc-&-
zs
22tD I 0 AtrktosAher-ic. pres,s7c-frc Sr-,097M becl, Tab /e,
_ • _
2.5o
2to
20o
"0
180
no
160
16o
14 0
13o
Ito
110
too
90
80
•
• • - . .214- ••■■•
6-• • *A sr • 41 3 4 g 7 8 9 so n It 13 14- /5 /4

-73-7)
49 CA re /
Non - D /rn sionct I j rzt•P c( •P Shear rcer-ce si-r.eciek, Fre,.cc-fe A/G
E
AterrosAAer-ic. presscerc , Ws 6 /c-
160
'so 8e-s4-At Cctrve
o
12.o
/I o •
400
90
• •
• •
•••• • .• • .34" •
•rno • •
I 11. 11 4 C. G 7 8 4 Ib N 12 /3 iw a
2.7o
Z60
25
2w
2to
Zoo
190
flt 0
13*

7
110
Fc 1 r.p /3
He cd ss/ap.s a'rc'efz rea PoptiS vs-, Cy) s1rC Cw-7 Frc44--ai /VO -
A • .5 Ai
• tniospher-ic 5re5-st.4 7;;;(6k
6 cte-1.4.€4.rr: pr-a-sse.tezz "tooth
t_.
k'..),/e
Go
4 11
_ _ - • - --!-
3 7 S 10 ii 12 (3 tif

-
Fis t_t rc> /3 lea 5./61/5 .s its, Gt/t) 5->r rn Fr-0 ctaiz No • LINA/ u-s
..■ • 0-fnlospher-ic pressurkr, Sertacre-1) bcam, 74 6k 4
va pr-crs 5°,4 r‘z swiocee-A 6e•st "Zixbie 2(6)
■■•••••••••ia
7 8 9 to if 11 13 14
/1/pi
64,r-we 6y t 4.71 k ?
. -4 •

F 5 r e /3 //eat Lo ap .s74 rc-a rel ptA
. GCP sir m F 44-a IZ 4/0 • zliq/yi 11.5 A/ c,
k 4 es Y0. c_ 44. k nr) r-¢- S s e4. rez , S.st o ,o-t-A 6 , 7ea-6 ie Z(6 )
s p er-ic pressures , srnocrt-h
A

re v ax €.444/19 fi
— 1■• 4- • ; •
:
mios her 1a. -.:,_1"4,;;:4-.s, 1.4 r 5117 Mblz. 2(11)
rcal3 le 2 II?) , _
-75-
Pc: cl 4-) I to.5-frecten ileac"' v5. Pr-auck Af0
G. gEli d OS At
8 AlF,
5' .10 1/ (Z a i44- 157;
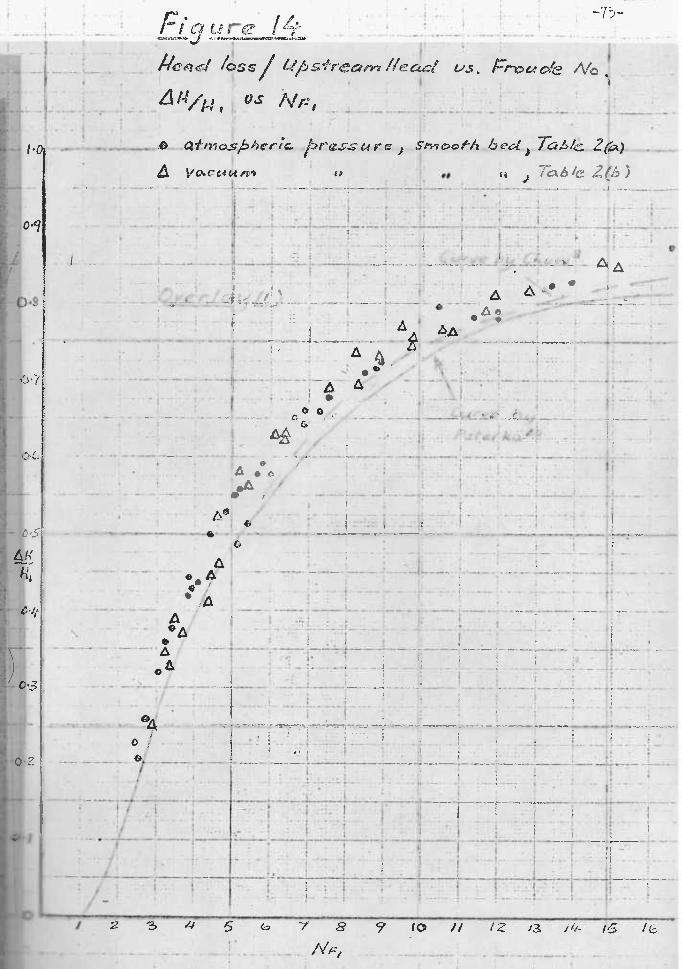
- - • - ! •
_ o o . - — •
• c
is6 -
-75- F
c•:,,no•ixonwowasifeemaxnett,swier.,•••,..••
Pc a el los s 11A s°1 re m Headd.c . a de. NO
i1//4 1 Os Alp,
• atniosfrberfc. prcts-.4.-(4fec sivic.0/-11 bed a Ta,s/e. 2) • v C4 14 "Sit o f
I ; . ,
•
•
! - ! ! • ; , • $ i! ‘-$ A 1 __11 2' ; ,,,..., , , .
1: : - zi $ 4, • .
A , -
04, • cb. I. - 1 i : • - H . a 0 .,
! -
: • I ,: : '• .
. I t•
. :
•
T• A 6 le 2 (6 )
•
4
gh,
U
5 7 8 ? 10 1/ / Z

NF,
• S.
• - -
F I 3 Lt
Ni / 1/15-5,̀ : rem
111444 VS Alf:,
• Citmosfrheric, prassure Stvt oef-/a 6 eci Ta
Vacts“ /PI a, ap. Tca8 2(b )
_ • •
7 ' I
1 : - - ! - - ' - • . - - • - -- ,' - : - i - ' - • •
is & .. ..._. .._
TTi A- - • • - - !, •
tt .
• .', .
.
. . . . ,
A ic- L . , . . • ____ .
i
i f i
; - • ; 7 - • - !
.4—
7 8 .10 1/ IZ 13 14, /6 /
Froct ale. No
; - •
0 a
• • ••Le Aa. • • .

ure 15 No - Dimens;orsca Vetcc;& Pro-Files t.tjtr .
NI/ e
sect, c;„ G e = 350 pviirt
s.,...fiLn 0 t = 850
sec...0-ft;,14) c = /360 til‘ot
043
0.s a.6 0.7 t .3 0 ,9 1:2

Ve I oci(y P fifes
Sec.te4r) D C 350 trtrii . , 4/ct = 119-7
Sectrc;e: 1:9 e = s5c) . tic! 44o.*
Sacf-ria., Q, e s. f350.ww,„. e/a = 644.2
0.5 0.6, 0.7 0.$ 0-q ,.O 1.1 1-2.
C.1.//v.

Table 2
Results from main experiments on hydraulic jumps at atmospheric and vacuum pressures
• (a) Atmospheric
-78-
Yl Y2 Y2/yi Q V1 *
V2
NFl P1 M2 N/ m I&
F2 1/m
F2/F1 - F2
NA
E
-
PH
m
6H/Y1 Adi/H1
mm mm - m3/s x lo 3 m/s m/s - NA • 4rj 1441 19 300 15.8 13.59 7.15 0.45 16.57 1.77 '972 .,l' 61.6 974 503 0.516 471 266 2.317 122.8 0.875 19 310 16.3 11.61 6.11 0.37 14.14 1.77 LI41.7 709 43.5 711 515 0.724 196 111 1.604 84.2 0.826 19 290 15.3 11.04 5.81 0.38 13.46 1.77 413' 642 42.1 644 455 0.706 189 107 1.443 75.7 0.826 19 285 15.o 9.91 5.22 0.35 12.08 1.77 398,.'. 517 34.5 519 433 0.834 85.8 48.5 1.115 58.3 0.785 19 270 14.2 9.34 4.92 0.35 11.39 1.77 3 7; . 46o 32.3 461 390 0.845 71.4 40.3 0.976 51.0 0.781 19 235 12.4 7.93 4.17 0.34 9.67 1.77 27C 330 26.8 333 298 0.895 35.0 19.8 0.666 34.7 0.729 19 210 11.1 7.36 3.87 0.35 8.98 1.77 214' 285 25.8 287 242 0.843 44.9 25.4 0.568 29.6 0.725 19 173 9.10 6.17 3.25 0.36 7.53 1.77 C47, 201 22.0 202 169 0.834 33.5 18.9 0.378 19.6 0.680 19 163 8.52 5.66 2.98 0.35 6.90 1.77 1,* 169 19.8 171 149 0.871 22.1 12.5 0.303 15.7 0.646 27 162 6.00 6.80 2.52 0.42 4.89 3.58 :I. 171 28.5 174 157 0.90o 17.4 4.9 0.179 6.5 0.514 27 191 7.07 7.5o 2.78 0.39 5.40 3.58 'I 209 29.5 212 208 0.983 3.7 1.0 0.222 8.1 0.530 27 240 8.89 10.01 3.72 0.42 7.23 3.58 2 374 42.1 378 325 0.859 53.2 14.9 0.485 17.8 0.662 27 282 10.4 11.78 4.36 0.42 8.48 3.58 . 'P' 514 49.2 518 439 0.849 78.2 21.8 0.706 26.o 0.712 27 310 11.5 14.53 5.38 0.47 10.45 3.58 . , - 782 6.81 785 539 0.687 246 68.7 1.181 43.7 0.797 32 32o lox 15.69 4.90 0.49 8.75 5.02 3 4 769 76.9 774 579 0.748 195 38.8 0.925 28.9 0.732 32 290 9.06 13.30 4.16 0.46 7.42 5.02 4.-12 554 61.1 559 474 0.848 85.0 16,9 0.613 19.1 0.677 32 220 6.88 10.30 3.22 0.47 5.75 5.02 37:', 332 48.3 337 286 o.848 51.3 10.2 0.329 10.3 0.592 32 179 5.59 8.61 2.69 0.48 4.80 5.02 I5 232 41.4 237 199 0.839 38.0 7.6 0.210 6.5 0.530 -32 158 4.94 7.36 2.30 0.47 4.10 5.02 j:4 169 34.3 174 157 0.899 17.7 3.5 0.132 4.1 0.441 38 150 3.95 8.01 2.11 0.53 3.45 7.08 li.49 169 42.8 176 153 0.870 22.9 3.2 0.100 2.7 0.378 38 175 4.61 9.11 2.40 0.52 3.93 7.07 I.,4,.219 47.5 226 198 0.875 28.1 4.0 0.143 3.8 0.432 38 233 6.13 12.00 3.16 0.52 5.17 7.08 20,:. 379 61.9 386 328 0.849 58.3 8.2 0.300 7.9 0.551 38 305 8.03 15.43 4.06 0.51 6.65 7.08 45,6':' 627 78.1 634 534 0.843 99.5 14.o 0.561 14.8 0.650 38 310 8.16 16.08 4.73 0.52 6.93 7.08 4152i 681 83.5. 688 555 0.807 133 18.8 0.627 16.5 0.662 44 300 , 6.81 16.28 3.70 0.54 5.63 9.50 442,:- . 603 88.4 612 530 0.867 82.2 8.66 0.427 9.76 0.580 44 26o 5.91 14.64 3.33 0.56 5.06 9.50 334,- 487 82.4 397 414 0.833 82.6 8.70 0.332 7.63 0.550 44 200 4.54 11.19 2.54 0.56 3.87 9.50 la 284 62.6 294 259 0.881 35.1 3.69 0.157 3.66 0.424 44 150 3.41 8.77 2.00 0.59 3.03 9.50 114, 175 51.4 185 162 0.876 22.9 2.41 0.079 1.92 0.319 44 139 3.16 7.93 1.80 0.57 2.74 9.5o , 143 45.2 152 140 0.919 12.4 1.30 0.054 1.32 0.259 52 120 2.31 8.38 1.61 0.70 2.57 13.26 .-• 135 58.5 148 129 0.871 19.2 1.45 0.040 1.00 0.207 52 140 - 2.69 9.15 1.76 0.65 2.46 13.26 161 59.8 174 156 0.895 18.2 1.38 0.048 1.10 0.228 52 180 3.46 11.89 2.29 0.66 3.2o 13.26 154,r,f 272 78.6 285 238 0.832 47.8 3.60 0.116 2.43 0.366 52 232 4.46 14.61 2.81 0.63 3.93 13.26 26,4:':411 92.0 424 356 0.840 67.8 5.11 0.202 4.04 0.445 52 270 5.19 16.51 3.17 .0.61 4.45 13.26 354.524 100.9 537 459 0.853 78.9 5.94 0.277 5.45 0.500

IF
0.93§-7 10.5 N/m
0.781 77.2 0.820 , 86.5
0.810 111.5 o.8o8 1131.9 0.685 1276.7 0.652 !314.0
0.653 295.0 0.809 1125.0 0.847 ' 81.3 0.851 1 68.5
0.892 40.8 0.899 127.1
0.887 20.7
0.814 36.3
0.830 40.6
0.793 74.5 0.820 . 75.9 0.790 i125.8
0.733 212.8 0.855 ; 93.8
0.841 1 94.1 0.862 ! 63.8
0.881 44.3
0.883 24.o
0.888 119.4
0.969 16.6
0,972 ! 13.8
0.989 4.5,
0.981 6.5 0.968 , 9.4 0.981 I 4.3
m 3. 0.196 7.7 0.532
25.2 0.508 20.2 0.689
28,2 0.724, 28.8 0.728
36.4 0.914;36.4 0.758
43.0 1.092;43.5 0.767
90.2 1.466 58.6 0.813
1160.0 1.977 98.7 0.848
150.4 1.853 92.5 0.851
63.7 1.358 67.6 i 0.813
41.4 1.070;53.2 0.784
34.9 0.911, 45.2 0.772
20.8 0.721;35.7 0.744
13.8 0.484 23.9 0.696
10.6 0.307 15.1 0.637
8.2 0.184 6.1 0.522
9.2 0.237 7.9 0.558
16.9 0.404 13.4 0.642
17.2 0.483 16.0 0.657
28.5 0.741 24.6 0.735
48.2 1.044 34.8 0.771
12.0 0.532 13.3 0.624
12.0 0.479'12.0 0.613 ' 0.350 8.8 0.259 6.5 0.112 2.9 0.087: 2.2 0.269' 5.4 0.244 4.9 0.184 3.7 0.144 2.9 0.109 2.3 0.0661 1.4
F1 - iAll/y1 AH/H1
8.1 5.6 3.1 2.5 1.4 1.1 0.4 0.5 0.8 0.3
0.562; 0.514 0.387 0.347 0.467 0.448 i 0.4041 0.366 0.325 0.2483
-79-
Table 2 (continued)
Results from main experiments on hydraulic jumps at atmospheric and vacuum pressures
(b) Vacuum
Yl Y2 Y2/y 1 Q V1 V2 NFt P1 P2 1 Pre Ssure
mm mm - m 3/s x l0 m/s m/s - Dyi N/- g 14)33
25 167 6.68 6.51 2.6o 0.39 5.26 3.06 137 25 219 8.76 9.34 3.74 0.43 7.55 3.06 235 25 267 10.68 10.93 4.37 0.41 8.83 3.06 350 25 295 11.80 12.09 4.84 0.41 9.77 3.06 427 25 320 12.80 13.08 5.23 0.41 10.57 3.06 502 25 330 13.20 14.78 5.91 0.45 11.94 3.06 534 20 330 16.50 13.42 6.71 0.41 15.15 1.96 534 20 320 16.00 13.02 6.51 0.41 14.70 1.96 502 . 20 315 15.75 11.41 5.71 0.36 12.88 1.96 487 20 290 14.50 10.28 5.14 0.35 11.60 1.96 413 20 270 13.50 9.57 4.79 0.35 10.80 1.96 358 20 250 12.50 8.67 4.33 0.35 9.78 1.96 307 20 210 10.50 7.31 3.65 0.35 8.25 1.96 216 20 170 8.50 6.03 3.02 0.35 6.81 1.96 142 30 158 5.27 7.56 2.52 o.48 4.65 4.41 122 30 180 6.00 8.38 2.79 0.47 5.15 4.41 159 3o 220 7.33 10.34 3.45 0.47 6.35 4.41 237 3o 245 8.17 11.19 3.73 0.46 6.87 4.41 294 3o 290 9.67 13.37 4.46 0.46 8.21 4.41 413 30 323 10.77 15.43 5.14 0.48 9.48 4.41 512 4o 310 7.75 16.00 4.00 0.51 6.39 7.85 471 61 40 292 7.30 15.29 3.82 0.52 6.10 7.85 418 40 260 6.50 13.54 3.38 0.52 5.40 7.85 332 40 233 5.83 12.09 3.02 0.52 4.82 7.85 266 4o 165 4.13 8.89 2.22 0.54 3.55 7.85 134 40 150 3.75 8.16 2.04 0.54 3.25 7.85 110 50 295 5.90 16.11 3.22 0.55 4.6o 12.26 427 50 285 5.70 15.57 3.11 0.55 4.45 12.26 398 5o 260 5.20 14.16 2.83 0.54 4.04 12.26 332 5o 236 4.72 13.03 2.61 0.55 3.72 12.26 273 50 210 4.20 11.84 2.37 0..56 3.38 12.26 216 50 180 3.60 10.22 2.04 0.,7 2.92 12.26 159
M1 N/rn
F1 1F
NATI! N/rn 170 25.4 173 162 349 39.9 352 275 478 44.7 481 394 585 49.6 588 476 685 : 53.5 688 556 874 ;66.2 .877 600 901 54.6 903 ! 589 848 53.0 , 850 ! 555 651 41.3 653 528 528 36.4 1 530 449 458 33.9 460 392 375 30.0 377 337 267 25.4 269 242 182 ' 21.4 184 163 191 36.2 195 159 234 39.0 239 ! 198 356 48.6 361 286 417 51.1 421 345 595 ,61.6 600 ; 474 794 73.7 798 585 64o 82.6 648 554 585 80.1 592 498 485 , 70.4 466 402 366 62.7 373 329 198 47.9 205 181 166 43.3 174 155 519 , 88.o 531 515 485 85.1 497 484 401 77.1 413 409 339 .71.9 352 345 28o 66.7 292 283 208 58.1 '221 217

mm 20 20 20! 20 20 20 30 30 30 30 30 35 35 35. 36
MM
150 172 220 277 285 275 315 285 245 215 157 151 200 252 313
- F2 i E A H
- -
4.2 2.1 0.195 1 10.1
28.3 14.4 0.336 17.1
71.1 36.2 0.652; 33.0
191.4 97.5 1.288; 64.9 276.9 141.1 1.571 : 79.0 70.9 j 36.2 0.942 1 47.4
197.0 44.6 0.979: 105.5 1 23.9 0.6831
48.7 11.0 0.431] 28.1 1 6.4 0.30o 13.3 , 3.o 0.135! 13.1 : 2.2 0.0971
34.8 5.8 0.220 1
48.5 7.8 0.363 112.1 ' 19.2 0.664
12 168 268 42o 449 403 558 457 342 267 152 148 244 37o 558
0.968 0.855 0.790 0.687 0.618 0.850 0.739 0.813 0.875 0.905 0.919 0.918 0.875 0.884 0.820
0.554 0.657 0.744 0.820 Pre-entraine 0.840 Pre-entraine 0.780
33.0 0.752 Pre-entraine 23.1 0.702 14.7 0.630 10.3 0.572 4.9 0.447 3.1 0.375 6.6 0.512 10.6 0.579 18.8 0.674
Table 3
-80-
Results from experiments using ROUGH BED at atmospheric pressure
Y2/y2 Q V1 NF P1 P2
- mVs x 103 m/s 2.55 3.11 4.11 5.52 6.02 4.86 5.00 4.31 3.59 3.11 2.31 2.10 2.79 3.41 4.33
0.34 0.36 0.37 0.40 0.42 0.35 0.48 0.45 0.44 0.43 0.44 0.49 0.49 0.48 0.50
5.75 7.03 9.27 12.47 13.58 10.96 9.22 7.95 6.61 5.74 4.26 3.59 4.76 5.77 7.28
N/m 1.96 1.96 1.96 1.96 1.96 1.96 4.41 4.41 4.41 4.41 4.41 6.01 6.01 6.18 6.36
N/m 110 145 237 376 398 368 487 398 294 227 121 112 196 311 481
m N/Im 7.50 8.6o 11.00 13.85 14.25 13.70 10.50 9.50 8.17 7.17 5.23 4.31 5.71 7.10 8.69
5.10 6.23 8.21 11.04 12.03 9.71 15.01 12.94 10.76 9.34 6.94 7.36 9.77 12.09 15.57
-130 194 337 610 724 472 751 558 386 291 160 155 273 412 674
17.3 22.6 30.7 44.o 50.8 34.4 71.5 58.8 47.3 40.6 30.7 35.9 47.7 58.0 77.5
132 196 339 612 726 474 755 563 390 295 165 161 279 418 680j
Table 4
Drop in Flow Force F per unit width over length of flume obtained by establishing uniform flow throughout
Y Q V NF Bed Slope Hyd Mean Depth F mm 01Ax403 m/s - - m N/m 52 11.35 2.20 3.1 1 : 23 0.039 30- 52 11.94 2.30 3.2 1 : 21 0.039 32 52 9.10 1.75 2.4 1 : 35 0.039 19 44 8.85 2.00 3.0 1 : 25 0.043 25 44 11.30 2.57 3.9 1 : 20 0.043 31 38 9.50 2.50 4.1 1 : 20 Q.046 38

-81-
Table 5
Velocity Profiles of Fast Flow
(a) Run N Q=0.0142 m3/s
-Section 1 y =21.5 mm
(b) Run N Section 3 ys 21.5 mm
hp Y YYY u/Vi u2 ; u3
mm ' mm - m/s - sl' m m ,r 3/s3 1330 0.8 0.038 5.07 0.81 25.71130 1500' 1.3 0.062 5.42 0.87 24.2 1160 1600 1.8 0.086 5.60 0.89 31.3 1175 1740 , 2.3 0.115 5.83 "0.93 34.o 120o 1805: 2.8 0.133 5.95 0.95 35.3 1211 1899: 3.3 0.157 6.09 0.97 37.1 1225 1950 3.8 0.181 6.19 0.99 38.2 1237 1990' 4.3 0.205 6.24 1.00 38.9 !243 2040 4.8 0.229 6.32 1.01 39.8 1252 2060 5.3 0.252 6.36 1.02 40.4 1258 2080 5.8 0.276 6.39 1.03 40.7 262 2100 6.3 0.300 6.41 1.03 41.0 264 2130'.6.8 0.328 6.46 1.03 41.6 3 27o 2140 7.3 0.348 6.48 1.04 42.o 272 2155' 7.8 0.371 6.5o 1.04 42.2 ,275 2165 8.8 0.419 6.51 1.04 42.3 1276 2170'10.8 0.515 6.52 1.04 42.2 1278 2180 15.8 0.753 6.54 1.05 42.7 1280
1140 1.0 0.047 4.46 0.77 1170 1.5 0.070 4.8o 0.82 1280. 2.0 0.093 5.01 0.86 1340 2.5 0.116 5.13 0.88 1410 3.o 0.14o 5.25 0.90 1450 3.5 0.163 5.33 0.92 1500. 4.o 0.186 5.43 0.93 1540: 4.5 0.209 5.5o 0.94 16o5 5.5 0.256 5.60 0.96 1643 6.o 0.280 5.68 0.98 1680 6.5 0.302 5.73 0.98 1725 7.0 0.325 5.82 1.00 1745 7.5 0.350 5.87 1.01 1800 8.5 0.395 5.94 1.02 1845 9.5 0.442 6.01 1.03 1890 10.5 0.488 6.07 1.05 1945 12.5 0.582 6.16 1.06 1970 14.5 0.675 6.21 1.07 1995 16.5 0.767 6.24 1.07
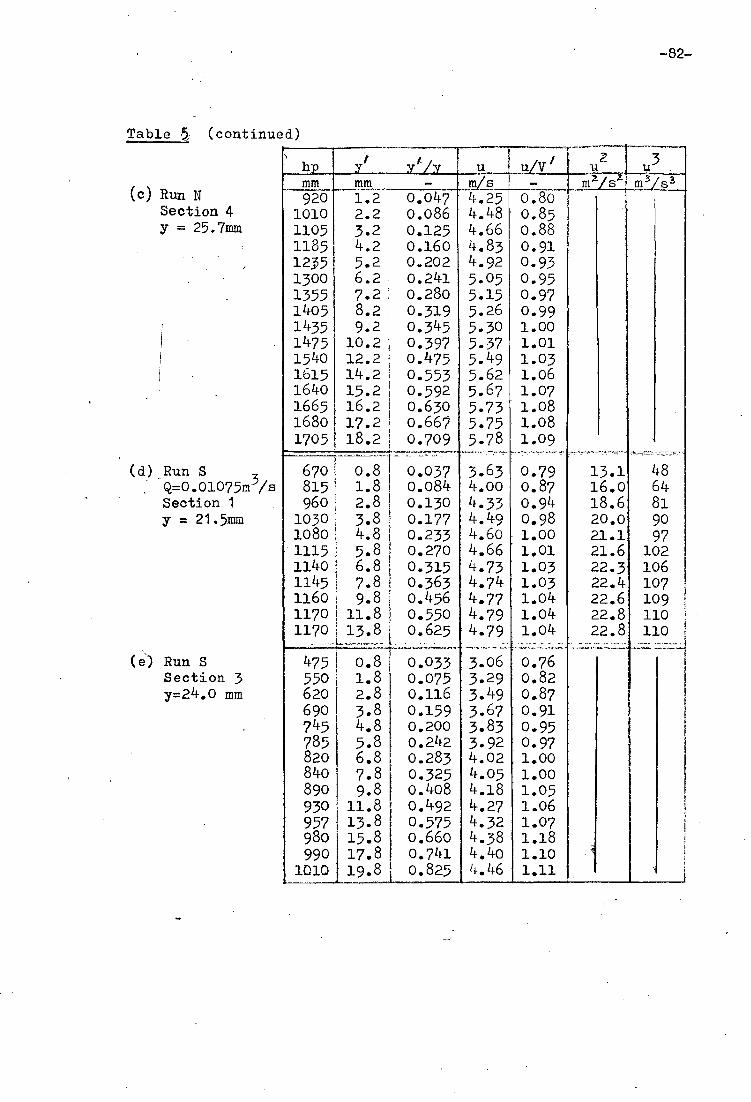
Table (continued)
h• i r u uV / u 2 u3 mm mm - m/s - m 2 s a
920 1.2 0.047 4.25 0.80 1010 2.2 0.086 4.48 0.85 1105 3.2 0.125 4.66 0.88 1185 4.2 0.160 4.83 0.91 1235 5.2 0.202 4.92 0.93 1300 6.2 0.241 5.05 0.95 1355 7.2 0.280 5.15 0.97 1405 8.2 0.319 5.26 0.99 1435 9.2 0.345 5.3o 1.00 1475 10.2, 0.397 5.37 1.01 1540 12.2; 0.475 5.49 1.03 1615 14.2! 0.553 5.62 1.06 1640 15.2 0.592 5.67 1.07 1665 16.2! 0.630 5.73 1.08 1680 17.2 0.667 5.75 1.08 1705 18.2 0.709 5.78 1.09
670 0.81 0.037 3.63 0.79 13.1 48 815 1.8 0.084 4.00 0.87 16.0 64 960 2.8 0.130 4.33 0.94 18.6 81
1030 3.8 0.177 4.49 0.98 20.0 90 1080 4.8 0.233 4.6o 1.00 21.1 97 1115 5.8 0.270 4.66 1.01 21.6 102 1140 6.8 0.315 4.73 1.03 22.3 106 1145 7.8 0.363 4.74 1.03 22.4 107 1160 9.8 0.456 4.77 1.04 22.6 109 1170 11.8 0.550 4.79 1.04 22.8. 110 1170' 13.8 0.625 4.79 1.04 22.8, 110
475 0.8 0.033 3.06 0.76 550 1.8 0.075 3.29 0.82 620 2.8 0.116 3.49 0.87 690 3.8 0.159 3.67 0.91 745 4.8 0.200 3.83 0.95 785 5.8 0.242 3.92 0.97 820 6.8 0.283 4.02 1.00 84o 7.8 0.325 4.05 1.00 890 9.8 0.408 4.18 1.05 930 11.8 0.492 4.27 1.06 957 13.8 0.575 4.32 1.07 980 15.8 0.660 4.38 1.18 ggo 17.8 0.741 4.40 1.10
1010 19.8 0.825 4.46 1.11
(c) Run N Section 4 y = 25.7mm
(d)_Run S Q=0.01075m3/s Section 1 y = 21.5mm
) Run S Section 3 y=24.0 mm
-82-

-83-
Table 5 (continued)
(f) Run S Section 4 y=25 mm
(g) Run U Q.0.o1295m3/s Section 1 y=21.5 mm
(h) Run V Q=0.00869m3/s Section 1 y=21.0 mm
(i) Run W Q=0.01560m3/s Section 1 Y=35.3 mm
illo yi Y I/Ir u u/V/ i u2 n3 mm mm - m/s - 2. msms m 3 3 90 1.2 0.0 ; 3.10 0.7; 570 2.2 0.088 3.34 0.85 620 3.2 0.128 3.49 0.88 65o 4.2 0.168 3.6o 0.91 705 6.2 0.248 3.68 0.93 760 8.2 0.328 3.89 0.98 795 10.2 0.408 3.97 1.00 84o 12.2 0.488 4.08 1.03 865 14.2 0.568 4.13 1.04 890 16.2 0.648 4.20 1.06 925 18.2 0.728 4.3o 1.09
985 0.8 4.38 19.2 84 1240 1.8 4.93 24.2 120 1420 2.8 5.29 27.8 146 157o 3.8 5.64 30.8 180 1650 4.8 5.7o 32.3 185 1710 5.8 5.80 33.5 195 1740 6.8 5.85 34.0 200 1780 8.8 5.92 34.8 209 1780 10.8 5.92 34.8 209 1780 14.8 5.92 34.8 209
425 0.8 2.89 8.41 24.0 515 1.8 3.18 10.1 34.o 590 2.8 3.4o 11.6 39.3 64o 3.8 3.54 12.5 44.4 700 5.8 3.71 13.7 51.3 720 7.8 3.75 14.1 52.4 730 9.8 3.79 14.3 54.2 733 14.8 3.8o 14.4 54.7
555 0.8 3.3o 10.8 36.o 66o 1.8 3.6o 12.9 47.0 720 2.8 3.75 14.1 52.4 84o 4.8 4.05 16.3 66.5 900 6.8 4.2o 17.6 74.o 924 8.8 4.26 18.1 77.5 933 10.8 4.28 18.2 78.2 95o 14.8 4.32 18.6 80.2 95o 18.8 4.32 18.6 80.2

-84-
Table 5 (continued)
hp mm
102 0.8 I 1.41
127 1.8 1.58
143 2.8 1.68
158 3.8 1.76
166 4.8 1.81
178 6.8 1.87
181 8.8 1.90
187 10.8 1.91
189 14.8 1.93
189 18.8 1.93
189 28.8 1.93
1 zl 2. 3 3 - , M / S M- 1/ 1s
1.99 2.82! 2.50
2.81 3.09
1 3.27 3.49 3.60 3.65 3.71
3.71
3.71
3.97, 4.75 5.46!
5.951
6.57 6.84
7.00
7.20:
7.20
7.20
y y u u/V I ! u2. u3 mm _
Run X: Q=0.00922m3/s Section 1 y=44 mm
(k) Run Y Q=0.01530m3/s
793 0.8
964 1.8
1068 2.8
1208 3.8
1268 4.8
1318 5.8
1368 6.8
1408 8.8
1440 10.8
1458 14.8
1458 18.8
1458 22.8
4.0
4.35
4.58
4.87
5.00
5.10
5.19
5.27 5.32
5.37 5.37
5.37
16.0 64
18.9 82
20.9 96
23.6 116
25.0 125
25.9 134
26.7 139
27.5 145
28.3 152
28.6 154
28.6 154
28.6 154
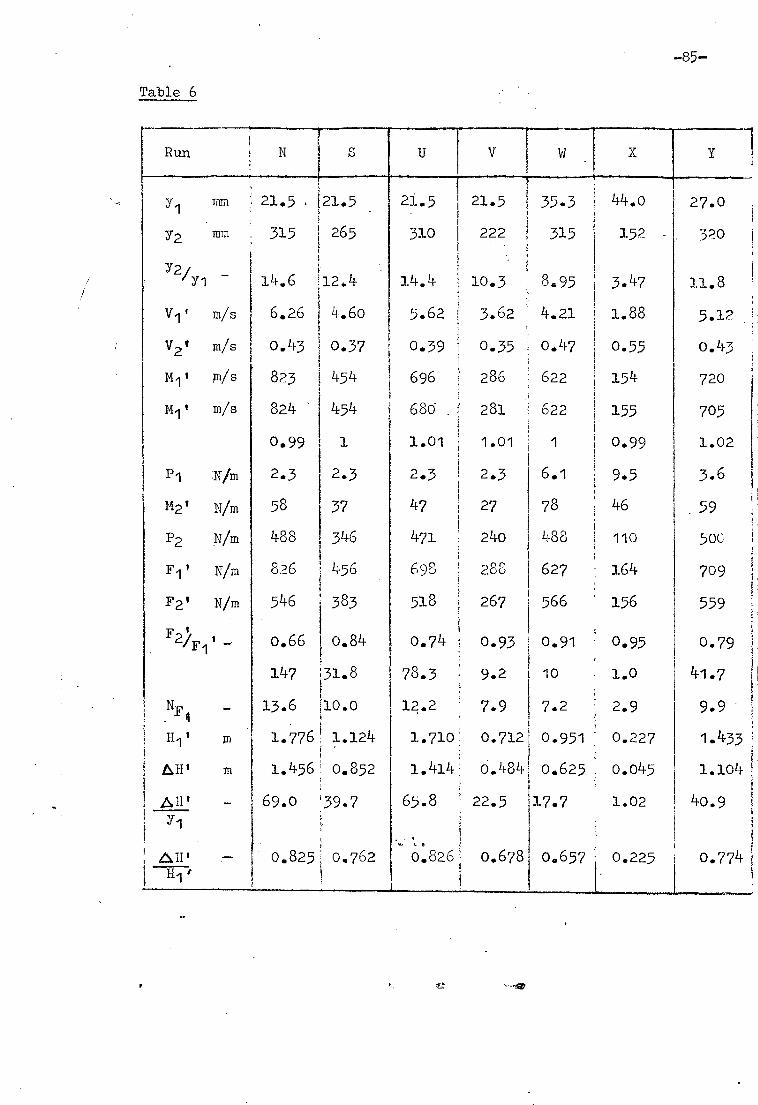
V Y X
mm
mm
Yi Y2
Y2/yi
0.99 1
2.3
37
346
456
383
9.2
7.9
0.712
o.484
22.5
78.3
12.2
1.710
1.414
65.8
0.826 0.678
Vi' m/s
V2' m/s
M1' /11/s
M1' m/s
Pi Nim
M2' Nim
P2 Wm
F1' N/m
F21 N/m
F2,41t _
21.521.5
315 265
14.6 12.4
6.26 4.60
0.43 0.37
8?3 454
824 ' 454
0.66 0.84
147 31.8
13.6 10.0
1.776 1.124
1.456 0.852
69.0 39.7
o.825 0.762
10.3
3.62
0.35
696 286
68o 281
1.01 1.01
2.3 2.3
47 27
471 24o
698 288
518 267
0.74 0.93
11.8
5.12
0.43
720
705
1.02
3.6
59
500
709
559
0.79
41.7
9.9
1.433
1.104
40.9
0.774
0.91
10
7.2
0.951
0.625
17.7
8.95
4.21
o.47
622 154
1
622 155
1 0.99
6.1 9.5
78 46
488 . ho
627 164
566 156
0.657 0.225
3.47
1.88
0.55
0.95
1.0
2.9
0.227
0.045
1.02
58
488
2.3
546
826
27.0
320
Table 6
-85-

-86-
Table 7
Time Intervals between-Still Prints of High-Speed Films.
Plate No. t secs
16 0.018
17 0.020
18 0.016
19 0.015
20 0.028
21 0.018
22
23 0.015
24 0
25 0.019
26 0.020
27 0.014
28 0.020
29
30 0.046
31 0.027
32 o. 050
33 0.040
34 0.026
35 0.057
36
Plate No. t secs
37
No details
recorded
38
39
40
41 0.017
42 0.012
43 0.013
44 0.017
45 0.031
46 0.044
47 0.044
48
74 0.030
75
Notes
(a) These times are based on the assumption that the film ran at 1000 frames a second throughout.
All the films were run at notation 35V except those relating to Plates 37-40 which were at 45V
(b) Plates 24 and 25 are the same. Two prints of the same frame were inadvertantly made and reproduced.

-87-
VI APPENDIX

0001 091 9007 005 00-4 00f • u.i CA./ 'lot
LI aan61-ry c'ty ;Su/0CD ,e? —121..pkti X JZ1/' X
OCYJ 06 02 OZ. 01 05 017 Or 0? 01 •
co co
1
194 os
f
70
*0
50
r7.0
10
3 o
Z00.0
1700.0
SAW "o0- o
800.0
010.0
Z10.0
17/0.0
`110.0
810.0
1.10/4 tr7.1cm c...? a 71 J./JO
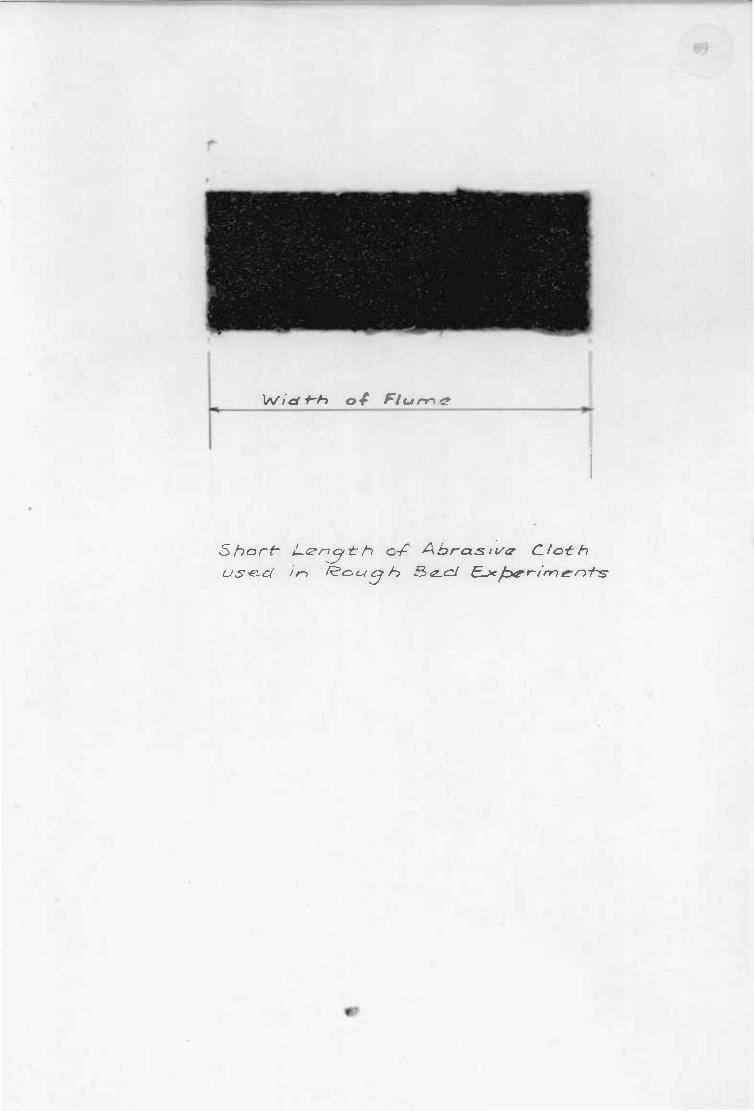
Width 0; F
Shore- 1-e-r-7..5t 1-) cic A bt-as va. Cloth
U,5'.ۥLi ire leen c-I h) PCP P-1./P1 Ir /771-S
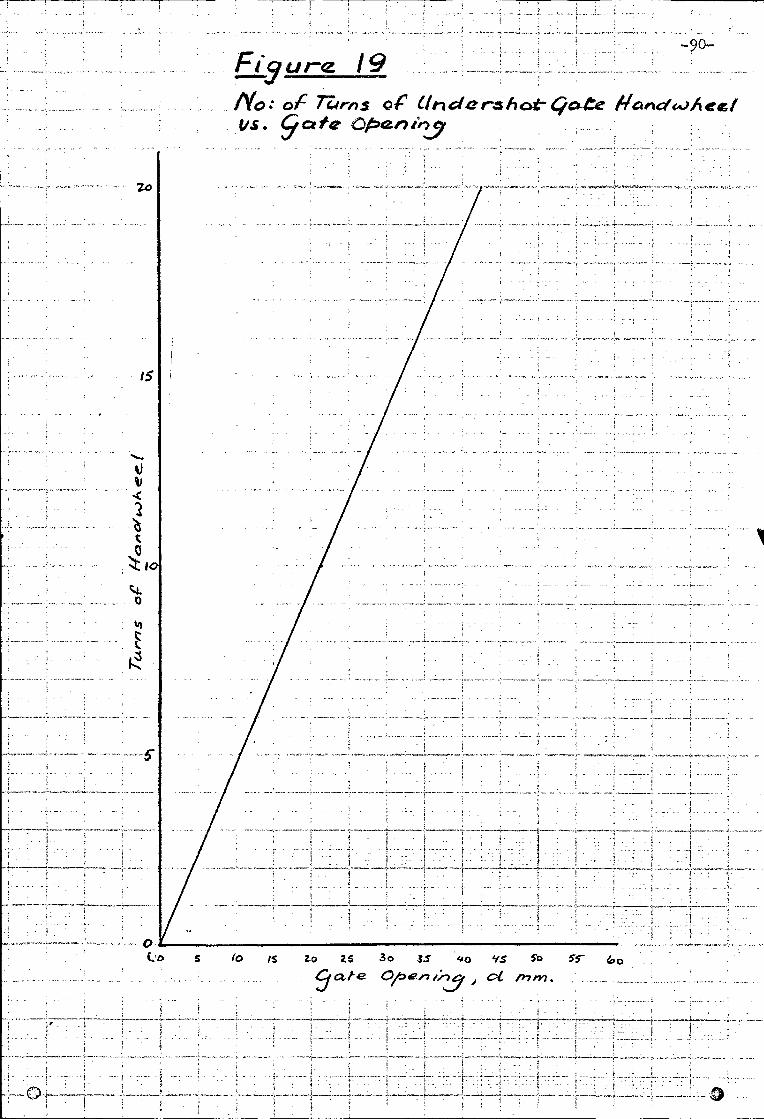
-90- Fiyu r-e 19 No: of 77,rrns of tiricter-sh at- Qate HarunewAeci
9atte OPanir,,
Zo ZS 30 3S go Cate 4/42,7,;19. d
sc 4,,S So
a /77m .

!32
I"
342. •
ti)
-91-
Det ea4 of Tap/S;#7.9
• cit rer6e rem birri‘ G-rt s ton s
!igu rQ 18

-92-
Calculation of typical error due to Bed Tappings
Reference Graph by White11
(Figure 20). Nearest hole diameter
researched by White is 1.02 mm in duralumin.
If it is assumed that shear force is 10N/m run then 2 is 100N/m2
and v = is 0.316m/s. Taking 1) as 1 x 10⁻⁶m2/s,
v dt 0.316 x 0.8 x 10-3
1 x 10 6
=253
Extrapolating from graph, = 3 (approx)
.'. at) . 100 x 3 = 300N/m2
L?:1,?.. = 0.03m (approx)
= 30jmm
This is consonant with errors found during this research (see page 18)
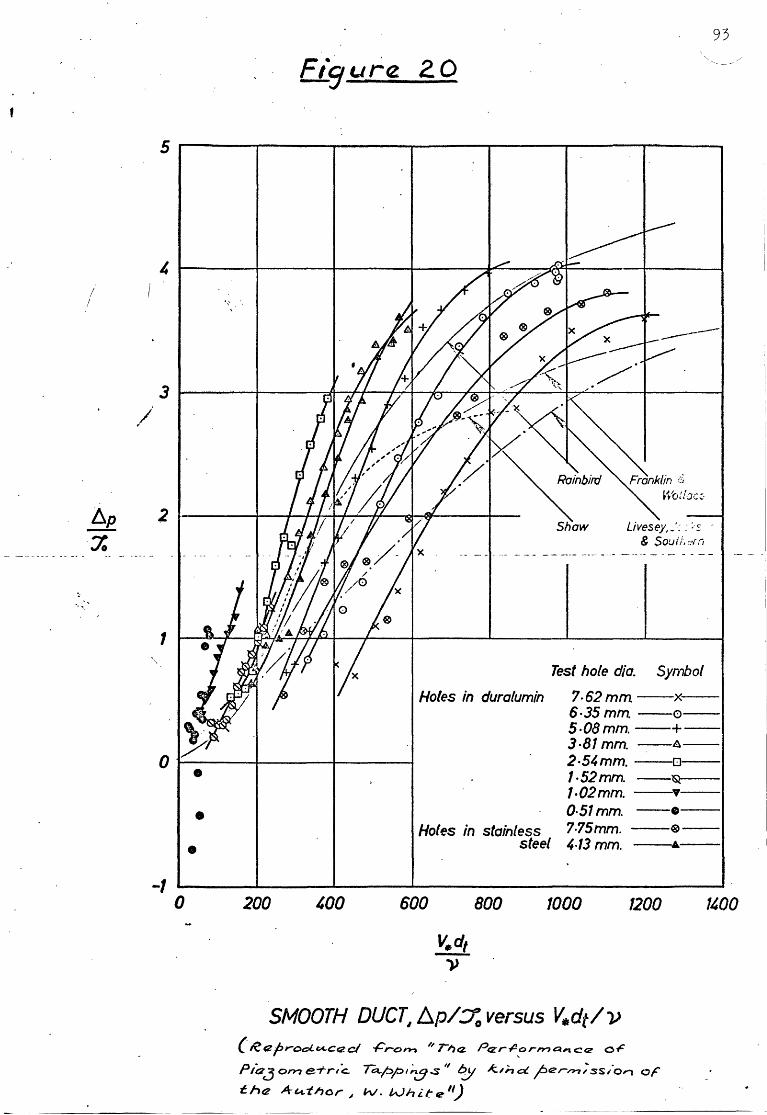
93
5,..-----.----------r----..------r----.,.------,
Livesey, ~'.~ ~ >~
& Soutl.err:
Test hole dia. Symbol
Holes in duralumin 7·62 mm --x--6·35 mm. --0-5·08mm.--+-3·81 mm. --A-
2·54mm. --0-1·52mm. --~1.02mm. --'f(--0·51 mm. --e--
Holes in stainless 7·75mm. --~--steel '·13 mm. --~--
.";'. "
••
•
4 1-----+----+----~--~oG...--~~--.-i_--__t
1
o l-------f-----f------i
2
31----.--.----=:II~~--J~~r.r-~~..;......:.......;--__:..t~--_+---__I
/"
/!
-1o 200 600 800 1000 1200 1400
SMOOTH DUCT1 f.::,.p/Yo versus V.dt/v(le{Zproo/..lA.c<zcI .prom I..TI)cz. P<Zrl1,orW7 Q "t C cz of
P/tZc3 om e-rr/c. ra...pp/~S'I ~ k.,;., d j:Jerrnl'ss/o" of'
t..ht2 A-l-i-thor ~ W. Whit-e'l)


![TEE Certification Process v1 - GlobalPlatform · [TEE EM] GPD_TEN_045 : GlobalPlatform TEE Security Target Template . Public [TEE ST] GPD_SPE_050 : GlobalPlatform TEE Common Automated](https://img.pdfslide.us/doc/110x75/6027a08e90016542ee50485b/tee-certification-process-v1-globalplatform-tee-em-gpdten045-globalplatform.jpg)


![Hydraulic Jumps[1]1](https://img.pdfslide.us/doc/110x75/56d6bfac1a28ab301697316c/hydraulic-jumps11.jpg)