Embed Size (px)
Citation preview

Tectonics of the
Keweenawan Basin, Western
Lake Superior Region
GEOLOGICAL SURVEY PROFESSIONAL PAPER 524-E


Tectonics of the
Keweenawan Basin, Western
Lake Superior Region By WALTER S. WHITE
SHORTER CONTRIBUTIONS TO GENERAL GEOLOGY
GEOLOGICAL SURVEY PROFESSIONAL PAPER 524-E
Analysis of geological and geophysical data indicates
divergence between trends of ancient Keweenawan
troughs and the trend of the present structural
depression
UNITED STATES GOVERNMENT PRINTING OFFICE, WASHINGTON 1966

UNITED STATES DEPARTMENT OF THE INTERIOR
STEWART L. UDALL, Secretary
GEOLOGICAL SURVEY
William T. Pecora, Director
For sale by the Superintendent of Documents, U.S. Government Printing Office Washington, D.C. 20402 - Price 25 cents (paper cover)

CONTENTS
Page
Abstract------------------------------------------- E1 Subsurface structure of Keweenawan rocks ____________ _ Situation A: Gravity anomalies due entirely to
Introduction _____________ _ ..: _ _ _ _ _ _ _ _ _ _ _ _ _ _ _ _ _ _ _ _ _ _ _ _ 1 Keweenawan rocks ____ -------------------_----
Acknowledgments __ ---------- ______________________ : 2 Analysis of geophysical data ___________ ~_-_-_
Step 1---------------------------------Step2 ________________________________ _
Geologic data ______________ ----------_______________ 2 Step3 ________________________________ _
Middle and upper Keweenawan stratified rocks_____ 2 Discussion of interpretation derived from Intrusive rocks ____________ ~-___________________ 4 geophysical data _____ ------ _____ ------Relation of Keweenawan to pre-Keweenawan rocks__ 5 Geologic evidence for interpretation __________ _
Relation of Keweenawan to Paleozoic rocks________ 5 Negative gravity anomaly-- ____ -- ___ ------ __
Regional structure__ _ _ _ _ _ _ _ _ _ _ _ _ _ _ _ _ _ _ _ _ _ _ _ _ _ _ _ _ 5 Positive gravity anomaly over Duluth Gabbro CompleX---------------------------------
Geophysical data___________________________________ 5
Gravity measurements ______________ ------------ 5
Conclusions ________________ --- _______ ------Situation B: Gravity anomalies due in part to pre-
Keweenawan rocks ___ -------------------------Aeromagnetic investigations __________ ----_------- 7 Summary of tectonic features------------------------Paleomagnetic measurements ____ ----------------- 12 References cited _________________ ---_--- ______ ------
ILLUSTRATIONS
Page
E12
12 12 13 14 15
16 18 18
19 19
20 20 22
Page
FIGURE 1. Generalized geologic map __ ----- _______ ------------ _______________________________________ - _________ -- E3 2. Bouguer gravity anomaly map _________ -------------------- _____________ ----- __ ----------------------- 6 3. Aeromagnetic profiles and generalized geologic sections _______ --- _____ ------------------------------------ 8 4. Generalized aeromagnetic map __________________________________________________________ - _____ -------- 10
5. Gravity anomaly map with inferred gravitational component due to upper Keweenawan sedimentary rock sepa-rated from that of other rock types_--------- _________________________________________ --- __ ---------- 13
6. Gravity and aeromagnetic profiles, north of Bayfield Peninsula-------------------------------------------- 17 7. Major tectonic elements __________ ------------------------ ____________________________ -_---_---------- 21
m


SHORTER CONTRIBUTIONS TO GENERAL GEOLOGY
TECTONICS OF THE KEWEENAWAN BASIN, WESTERN LAKE SUPERIOR REGION
By WALTERs. WHITE
ABSTRACT
The subsurface structure of the western Lake Superior region iJ3 analyzed by combining information on surface geology with fl,eromagnetic, gravity, and paleomagnetic data. Surface attitudes and the map pattern suggest that the upper Keweenawan sedimentary rocks (Bayfield and Oronto Groups) have the general form of a lens, thickening southeastward from a featheredge close to the Minnesota shore of Lake Superior.
1 The gravitational effect of such a lens can be calculated if
various assumptions are made about its maximum thickness. If the component of gravity that is due to the sedimentary rocks iJs subtracted from the Bouguer anomaly, the residual anomaly reflects, for the most part, the thickness of the underlying mid<J.le Keweenawan extrusive and intrusive mafic rocks. This subtraction can be performed graphically if the calculated gravi~ational effect of the sedimentary lens is expressed by contours on a map at the same scale as the Bouguer anomaly map; the resulting contour map of the residual anomaly gives the general configuration of the anomaly that is due to the older rocks, primarily middle Keweenawan mafic rocks. If residual anomaly J!llaps for various assumed thicknesses of the sedimentary rocks ~re compared with the aeromagnetic map, the patterns almost eoincide when the assumed thickness of sedimentary rocks under the Bayfield Peninsula is at least 25,000 feet.
The residual maps show a conspicuous gravity low crossing the present synclinal structure of the Keweenawan rocks almost at right angles. This gravity low is interpreted as a positive area in which the middle Keweenawan lavas are thin; ' the low separates basins to the east and west in which the lavas are thick. The positive area coincides with places where the lava series, as exposed at the surface, seems to be exceptionally thin; the thickness and lithofacies of two upper Keweenawan formations likewise suggest a positive area.
If the Duluth Gabbro Complex is a sheetlike intrusion of fairly uniform thickness dipping to the southeast under Lake Superior, the combined thickness of gabbro plus lava should attain a maximum somewhere under the lake. The gravity maximum is actually about 10 miles northwest of the Minnesota shore of the lake, and its position indicates that the gabbro pinches out beneath the lava series somewhere near the shore.
Three stages in the tectonic evolution are (1) accumulation during middle Keweenawan time of a thick series of lava :flows and mafic intrusives in two basins or troughs separated by a positive area trending almost north-south, (2) evolution of the present Lake Superior basin, having an axis trending northeast, during late Keweenawan time, and (3) evolution of the Ashland syncline and the major faults (Douglas, Keweenaw, and Lake Owen) of the region still later in Keweenawan time.
INTRODUCTION
The Keweenawan rocks that give rise to the midcontinent gravity high and flanking lows are covered by Paleozoic rocks southeast of the general vicinity of Minneapolis-St. Paul, Minn. In this area of Paleozoic cover, interpretation of the geologic structure and stratigraphy of the Keweenawan rock sequence is based on geophysical data, a miniscule amount of drill-hole information, and extrapolation from the Lake Superior region where locally, at least, the relationships of the anomaly-generating rocks can be studied at the surface. Even in the Lake Superior region, however, enormous areas are covered by the lake itself, by surficial deposits, or by flat-lying sandstone of lU~te Keweenawan age, and geophysical data are of great value in filling out the rather skeletal picture obtained from surface and nearsurface observations alone. In the Lake Superior region the surface observations help considerably by narrowing the choice of interpretations that geophysical measurements permit.
This paper is a review of geologic features that seem to have a significant bearing on geophysical interpretations, and it includes examples of some of the geologic questions that geophysical data pose and can help answer. It is primarily a synthesis from existing information rather than a presentation of new facts. Craddock, Thiel, and Gross ( 1963) provided a similar review of information on the area immediately to the southwest.
The exposures of Keweenawan rocks in Michigan and the Canadian shore of Lake Superior represent less than 20 percent of .the area of the central and eastern Lake Superior region that is probably underlain by Keweenawan rocks; the remainder of the area is covered by water. These exposures are relatively narrow belts of lava and sedimentary rock that generally dip toward the central axis of the lake. The belts suggest, according to the simplest possible rnterpretation, that the axis of the lake generally follows the axis of a broad syncline and has a configuration something like that portrayed
El

E2 SHORTER CONTRIBUTIONS TO GENERAL GEOLOGY
by Irving (1883, pl. 28). This simple picture may well be illusory, however, because of scanty information, and the more complicated geologic structure revealed by the better exposures and more abundant geophysical data at the western end of the Lake Superior region probably is a far more reliable indication of the kinds of geologic structure and stratigraphic relation to be found along the buried midcontinent gravity high farther southwest. The geologic structure of the western Lake Superior region may also give clues to the structure beneath Lake Superior farther east.
ACKNOWLEDGMENTS
I am particularly indebted to my colleagues Isidore Zietz, Myrl Beck, and W. B. Joyner, U.S. Geological Survey, for discussion and suggestions concerning the geophysical interpretations, and to J. C. Wright and R. B. Taylor, U.S. Geological Survey, for their thoughtful comments· on the geological interpretations. The generosity of the Bear Creek Mining Co. in permitting the use of data from their exploration of the upper Keweenawan rocks of the region is gratefully acknowledged. Finally, I wish to thank Gerald L. Zandle, U.S. Geological Survey, for his conversion of the aeromagnetic profiles to the proportions used herein.
GEOLOGIC DATA
Figure 1 is a highly generalized geologic map of the Keweenawan and contiguous rocks in the western Lake Superior region. Gross surface distribution of these rocks is based on outcrops and has been known for many years. Published sources used for the compilation include Irving ( 1883) ; Leith, Lund, and Leith ( 1935) ; Thwaites (1912, 1935) ; Tyler, Marsden, Grout, and Thiel (1940); .Aldrich (1929); Leighton (1954); Grant (1901); Taylor (1964); Sandberg (1938); Grout and Schwartz (1939); and Grout, Sharp, and Schwartz ( 1959). For parts of northern Wisconsin, geologists of the Bear Creek Mining Co. have added to this fund of information, in part by restudying known outcrop areas using unpublished open-file maps of the Wisconsin Geological Survey and in part by ground magnetic surveys and diamond drilling (Moerlein, 1963). Elements of the map compiled by the author from unpublished information made available by the Bear Creek Mining Co. include ( 1) modifications of earlier maps in the vicinity of Mellen, Wis., (2) revisions of the upper boundary of the lava series on both sides of the syncline extending southwest from Ashland, Wis., (3) the position of the dashed trend line labeled con the map (base of Nonesuch Shale) and the dips of sedimentary rocks in the vicinity of this line, all of which are based on projections from drill-hole informa:tion, and ( 4) dips
of the sedimentary rocks south and southeast of Ashland, Wis. (Prof. W. F. Read, unpub. data).
The only other significant difference from earlier geologic maps is in an area of poor exposures east of Mellen. The location of the Keweenaw fault(~) and the belt of sedimentary rock just south of the fault is based primarily on a continuous· aeromagnetic low, similar to the one that marks the belt of sedimentary rock south of Aldrich's ( 1929) Lake Owen fault west of Mellen. The Bouguer gravity anomaly over the belt east of Mellen, likewise, is appreciably lower than would be expected unless the belt contains abundant lighter-than-average rock.
A fault shown within the mafic lava series 20 miles south to southeast of Duluth is based solely on an interpretaJtion of the gravity data in the vicinity.
MIDDLE AND UPPER KEWEENAWAN STRATIFIED ROCKS
Geologic units differentiated on the map include lava flows of middle Keweenawan age, overlain by sedimentary rocks, predominantly sandstone, of late Keweenawan age. The typical flows are :Hood-basalt sheets that in Michigan average about 43 feet in thickness. The total thickness of the lava series seems to be as much as 30,000 feet in some parts of the Lake Superior region; so locally, at least, there may be as many as 700 individual sheets. In composition, most of the flows are basalt and andesite. The amygdaloidal tops of the flows tend to be moderately altered and contain secondary minerals of low-grade metamorphic origin (Stoiber and Davidson, 1959), but generally the lava of the flows is remarkably unaltered for their age.
Rhyolite flows are fairly common in some areas and scarce or absent in others. They make up about 10 percent of the section of lava flows and diabase sills measured by Sandberg (1938, p. 806) along the Minnesota shore northeast of Duluth but are far less abundant in most areas that have been studied in detail in Michigan. A few of the individual flows are separated by beds of sandstone or rhyolite conglomerate; these sedimentary layers generally make up 1-5 percent of the total stratigraphic sequence of middle Keweenawan rocks, and only locally make up as much as 10 percent.
It has long been recognized that the upper Keweenawan sedimentary rocks fall naturally into lower and upper groups, which Thwait.es (1912) called the Oronto and Bayfield Groups, respectively. The formations of the Oronto Group are far more arkosic and contain more abundant conglomerate and shale than those of the overlying Bayfield Group, which are generally more quartzose and mature (Thwaites, 1912; Tyler and others, 1940; Hamblin, 1961, p. 2-8). The lowermost

~ -~{ ~1
(5
8 ,_ ~ l!l.~ ~~
~
~
8
~ lj ~ ~ ~
~ i{ d:; ~ ~
~
<::" -.:~§
!~ ~ "' <:l "' "' ~ :g~ ~
EXPLANATION
LAYERED ROCKS
S t Croixan Series
Bayfield Group
~ Oronto Group
Lava flows and diabase sills
Metamorphic rocks undivided
INTRUSIVE ROCKS
Granite
Gabbro-granophyre complex Includes Duluth Gabbro Complex
z
}I u
z ~ c:: a:> ::< <( u w c:: a_
z <(
c:: Ill ::< <( u w c:: a_
.., l';j 0 .., 0 z ...... 0 Ul
0 l'2j
~ l';j
~ ~ l';j
~ b:j
> Ul
~z
~ ~ ~ z t"'
8 Ul
10 0 lOMILES ~
46° ~.:.:.:.:.:.:.:.:.:.:.:.:.:.:.:.:;::::::::.T:;:.-ctillill.\i
FIGURE !.-Generalized geologic map showing locations of geologic sections shown in figure 3. Thin dashed lines are reference horizons within map units and are identified by letter symbols as follows: a, a sequence of ophitic flows, persistent along strike (Sandberg, 1938, :fig. 4); b, base of Devils Island Sandstone (Thwaites, 1912) of Bayfield Group; c, base of Nonesuch Shale (Bear Creek Mining Co., unpub. data) of Oxonto Group; d, base of Nonesuch Shale
l';j
~ ~
~ l';j 0 ......
~
(Irving, 1883). Southern part of area is underlain by mafic lava flows that in Minnesota contain about 10 percent rhyolite flows and 17 percent diabase tr:1 sills with associated granophyre (Sandberg, 1938, p. 806) ; proportions not known farther north. O.j

E4 SHORTER CONTRIBUTIONS TO GENERAL GEOLOGY
forma,tion of the Oronto Group, the Copper Harbor Conglomerate, interfingers with the underlying lava series and seems to be conformable with it (White and Wright, 1960). In contrast, rocks that are probably equivalent to the Bayfield Group farther east in Michigan overlie an irregular erosional surface cut on the lavas (Hamblin, 1958, p. 46-49). Although there is no direct evidence of angular unconformity between the Bayfield and Oronto Groups, the differing regional stratigraphic relations just noted and the striking difference in heavy-mineral suites described by Tyler, Marsden, Grout, and Thiel (1940, p. 1469- 1483) suggest a significant change in the pattern of sedimentation (see also Hamblin, 1961, p. 7). It is not unreasonable, therefore, to postulate the existence of an angular unconformity between the Bayfield Group and the older rocks anywhere in the region of the midcontinent gravity high should geophysical or other evidence suggest it.
The gross distribution of these two groups as shown in figure 1 is well established for much, but not all, of the area. The rocks in the trough of the Ashland syncline belong exclusively to the Oronto Group, at least as far east as long 91 °22' W. The rocks immediately overlying the lava series in the southeastern part of the area of figure !likewise belong to this group. The area north of the Douglas fault and the area of the Bayfield Peninsula are underlain by rocks of the Bayfield Group that gently dip except where they are dragged up along the north side of the Douglas fault. At one point, this drag brings rocks of the underlying Oronto Group to the surface ( 17 miles southeast of Duluth; see Thwaites, 1912, p. 66- 69; Tyler and others, 1940, p. 1478- 1479). This exposure is important because it shows tha,t rocks of the Oronto Group do occur beneath the Bayfield Group north of the Douglas fault.
The separation of the two groups on the map in the vicinity of Ashland is arbitrary and is based on the assumption, following Thwaites (1935), that east of the point where the lava series ceases to form the south side of the Douglas fault, the fault continues as the boundary between rocks of the Oronto and Bayfield Groups. Most outcrops of the sedimentary rocks south of the fault, as shown in figure 1, belong to the Oronto Group as redefined by Tyler, Marsden, Grout, and Thiel (1940, p. 147(}-1479). The outcrops in an area 6 miles southwest of Ashland are an exception; although they lie a mile or so south of the fault as shown, their heavymineral suite is typical of the Bayfield Group (Tyler and others, 1940, p. 1470-1471). The mean orientation of their remanent magnetism differs appreciably from that of either the upper part of the Oronto Group or the lower part of the Bayfield (DuBois, 1962, p. 3(}-37, ta:ble 18, and fig. 29). In the field the relations of the
outcrops in this vicinity permit several interpretations of the local structure (see Tyler and others, 1940, fig. 5), and no attempt has been made in figure 1 to portray the local situation.
The eastward extrapolation of the Douglas fault in figure 1 is supported by the known distribution of outcrops (except as noted) , by the occurrence of steep dips suggesting drag on a fault in the area 4-6 miles southwest of Ashland, and by a local steepening of the gravity gradient where a detailed gravity profile crosses the inferred position of the Douglas fault (Thiel, 1956, pl. 3, profile A) . It should be emphasized, however, that outcrops are extremely sparse in this region. Even if the position of the Douglas fault is correctly shown, there is ample room for large inliers of Bayfield Group rocks in the area south and southeast of Ashland. The wide range of attitudes displayed by the strike and dip symbols of figure 1 show that major folds and possibly faults are present.
INTRUSIVE ROCKS
Intrusive rocks of Keweenawan age include diabase and gabbro-granophyre complexes and granite. The Duluth Gabbro Complex (Grout, 1918; Schwartz, 1949; Taylor, 1964; Goldich and others, 1961, p. 82-90, 98-99) is a sheetlike or lenticular multiple intrusion that seems to dip southeast beneath the middle Keweenawan lava series of the Minnesota shore of Lake Superior. The Beaver Bay complex (Grout and Schwartz, 1939, p. 32-63; Goldich and others, 1961, p. 91) is a network of dikelike and sill-like bodies in which diabase predominates. The gabbro-granophyre complex near Mellen, Wis. (Aldrich, 1929; Leighton, 1954), is apparently similar to the Beaver Bay complex. These mafic intrusives commonly have granophyre ("red-rock") facies along their upper contacts. The mafic intrusives have metamorphosed the lava with which they are in contact and, with the possible exception of the Duluth Gabbro Complex, can be no older than late middle Keweenawan. The gabbro near Mellen cuts conglomerate above the lavas if Aldrich's (1929, p. 125-126) interpretation of the structure and stratigraphy west of Mellen is correct. Leighton (1954, p. 410- 411) presented evidence suggesting that the gabbro-granophyre complex west of Mellen was intruded after some faulting and tilting of the lava flows, but before tilting was completed. On the other hand, in Michigan, granophyre pebbles resembling the siliceous facies of the gabbro-granophyre complexes are abundant in conglomerate beds in the middle Keweenawan lava series, as well as in the overlying Copper Harbor Conglomerate; therefore, considerable intrusion and partial unroofing of one or more gabbro bodies actually took place well before the end of middle Keweenawan time.

TECTONICS OF THE KEWEENAWAN BASIN, WESTERN LAKE SUPERIOR REGION E5
These apparently conflicting relationships can only be reconciled by an explanation involving intrusion of gabbro at intervals throughout the general time span that is represented by the mafic lava flows, namely, all of middle Keweenawan time and the beginning of upper Keweenawan time. Paleomagnetic data should ultimately be helpful in solving this and other problems concerning the intrusive rocks.
Many similar sill-like bodies of diabase, not distinguished in figure 1 from the lava flows they intrude, are exposed along the Minnesota shore between the Beaver Bay complex and Duluth.
The granite at Mellen contains numerous inclusions of gabbro as well as of mafic lava, so it is presumably the youngest intrusive rock of the area. Its contact relations with the upper Keweenawan sedimentary rocks are not known. Similar granite that has intruded the pre-Keweenawan rocks south of Mellen (Tyler and others, 1940, p. 1468-1469) may be of Keweenawan age.
RELATION OF KEWEENAW AN TO PRE
KEWEENAWAN ROCKS
In the southeastern part of the. area of figure 1, the Keweenawan lava flows overlie the older Precambrian rocks with slight angular unconformity. A sandstone or conglomerate formation 100 feet or more in thickness, called lower Keweenawan by Van Rise and Leith (1911, p. 393-394) and Aldrich (1929, p. 109-110), separates the two groups of rocks. A similar formation, the Puckwunge Conglomerate of Winchell ( 1897), overlies a major angular unconformity between the Keweenawan and older rocks in Minnesota (Grout and others, 1951; Goldich and others, 1961, p. 79-81, 96-97). Upper Keweenawan sandstones directly overlie the pre-Keweenawan basement at many places in Michigan, Wisconsin, and Minnesota.
RELATION OF KEWEENAWAN TO PALEOZOIC ROCKS
Paleozoic rocks occur locally in the southwestern part of the area of figure 1. Hamblin (19611 p. 8-9) summarized the unconformable relationship of the Upper Cambrian to the Keweenawan and older rocks of the Lake Superior region.
Thwaites' (1940, fig. 1) contour map of the buried Precambrian of Wisconsin indicates that the rock units of Paleozoic age are thin in the area of figure 1, but thicken westward. He showed this westward-dipping wedge terminating abruptly at a line on the projected strike of the Lake Owen fault. The relations shown by Thwaites strongly suggest minor movement on the Lake Owen fault in Cambrian or post-Cambrian time.
7~7-873--66----2
REGIONAL STRUCTURE
Some elements of the regional structure, such as the Ashland syncline and the Douglas fault, can be described in general terms on the basis of surface geologic evidence but other elements are obscure or completely hidden. Inferences concerning these cryptic structural elements depend partly or wholly on geophysical evidence; for this reason, a brief discussion of the geophysical data used herein precedes the section on the major structural features of the region.
GEOPHYSICAL DATA
GRAVITY MEASUREMENTS
Figure 2 is a generalized Bouguer gravity map of the western Lake Superior region based on the data of the Bouguer gravity map of the United States (Am. Geophys. Union, Spec. Comm. for Geophys. and Geol. Study Continents, 1964) and of Thiel (1956). Though the density of the station network permits some flexibility in contouring, particularly for the contours interpolated in the area under Lake Superior, the main elements of the map are well defined. These elements include gravity highs in all the areas where lava or gabbro is exposed at the surface and an extraordinarily large low under the Bayfield Peninsula. In the ·area covered by Lake Superior, for which there are no observations, the configuration of gravity contours was chosen to provide a fit with the aeromagnetic data.
Some of the conclusions of this paper are based on the results of matching the observed values for gravity with values computed for various geologic models as viewed in geologic profiles. Where profiles cross the strike of formations, gravity changes in a direction normal to the profiles are typically gradual, and calculations for two-dimensional models should approximate those for three dimensions. Measurements on the profiles were made by use of a template divided into small compartments, each representing a vertical gravitational attraction of 1 milligal for a density difference of 1.0.
The calculated values are based on the following assumed densities (Thiel, 1956, p.1086-1090, and fig. 4) : mafic lava flows and gabbro, 2.90; Bayfield Group, 2.30; Oronto Group, 2.44; pre-Keweenawan rocks, 2.67. The average density of the mafic lava should, ideally, be reduced to compensate for the rhyolite flows and sedimentary rocks locally interbedded with the basalt flows. Within the area of figure 1, however, the ratios of rhyolite and sedimentary rock to mafic lava are only known along the Minnesota shoreline; so no meaningful correc-

E6 SHORTER CONTRIBUTIONS TO GENERAL GEOLOGY
tion can be made for most of the area. Along the Minnesota shoreline, there are about 2,500 feet of rhyolite and 250 feet of sandstone and conglomerate (Sandberg, 1938, p. 806). Assigning a density of 2.90 to these lighter rocks introduces an error into the thickness of the complete lava sequence (including rhyolite and sandstone as calculated from the gravity data; the calculated thickness is probably about 3,000 feet less than
10 0
the actual thickness. This may be an extreme error for the region as a whole, because the deficiency for most of the Michigan copper district, which lies east of the area of figure 1, would he less than 1,000 feet if calculated on the same basis.
The datum assumed for matching calculated with observed Bouguer values is -40 milligals .(Thiel, 1956, p. 1088).
10 20 MILES
FIGURE 2.-Bouguer gravity anomaly map of western Lake Superior region (modified from Am. Geophys. Union, Spec. CoiDJ:q. for Geophys. and Geol. Study Continents, 1964, and Thiel, 1956). Contour interval is 10 milligals.

TECTONICS OF THE KEWEENAWAN BASIN, WESTERN LAKE SUPERIOR REGION E7
AEROMAGNETIC INVESTIGATIONS
The U.S. Geological Survey has made 11 aeromagnetic profiles across the central and southern parts of the area of Keweenawan rocks (Kirby and Petty, 1966). The profiles, much reduced (fig. 3), are located on figure 4, which is an aeromagnetic map generalized from the data of the profiles. The magnetic contours for St. Louis County and the southernmost townships of Lake County, Minn., are based on north-south aeromagnetic traverses spaced at 1-mile intervals (Henderson and Meuschke, 1952a, b; Bath and others, 1964). Similar aeromagnetic surveys of the Michigan copper district (Balsley and others, 1963) have provided useful guidance in the interpretation of the magnetic data from the western Lake Superior region.
Comparison of the generalized aeromagnetic and geologic maps (figs. 1, 4) shows a close correlation between narrow elongate magnetic highs and the northwarddipping lava flows northeast and southwest of Mellen. The southward-dipping lava flows on the northwest limb of the Ashland syncline are expressed by the same type of narrow elongate magnetic anomalies, but here they are negative rather than positive. The granite north of Mellen is magnetically low; the elongate magnetic high just south of the lavas south and east of Mellen is caused by the magnetic iron-formation and associated rocks of the Gogebic iron range.
Bath (1960) analyzed the magnetic anomalies along two profiles that correspond roughly to the profiles
I J-J' and K-K' of figure 3. Calculated and observed values for the magnetic profiles correspond only if the remanent magnetism is assumed to be greater than the induced. The remanent magnetism in the lava was imposed as cooling progressed, so where the lava flows have been tilted, the present direction of the remanent magnetism differs from its original orientation. If the present attitude of the flows is known, the original orientation of the remanent magnetism can be easily determined by calculating the effect of tilting the flows back to a horizontal attitude. Dubois (1962, p. 23-27, and table 18) found that the average direction of remanent magnetism in the Keweenawan lava flows of Michigan, after corrections for the present dip of the layering, is inclined at 44° below horizontal in a direction N. 78° W. Using a similar value for the original direction of the remanent magnetism, and assuming that remanent mao-netism is five times as intense as induced, Bath 0
(1960, p. B213) obtained good correspondence between calculated and measured magnetic profiles. Because the present direction of remanent magnetism is ne~rly horizontal on the north limb of the Ashland synclme, owing to the southward dip of that limb, the south pole of the remanent magnetism exerts a strong influence
and causes negative anomalies on the north side of the lava mass.
The magnitude and sign of the magnetic anomalies, therefore are notably affected by the amount of dip of
' 1 . the lava flows; the anomalies range from strong y posi-tive where the flows dip moderately to steeply northwestward to strono-ly negative where the dips are
' b • steeply southeastward. Empirically, the magnetic highs tend to lie in the range of 2,500-3,000 gammas above the arbitrary d3Jtum of figure 2 where the flows dip more than 10° mv., and in the range of 2,000-2,500 gammas where the flows dip 10°-20° SE.; values less than 1,500 gammas are common where southeasterly dips exceed 40°. These correlations apply to profiles flown at heights roughly 1,000 feet above the flows. A thick cover of nonmagnetic rock overlying the flows would increase the distance between anomaly source and magnetometer and tend to subdue both positive and negative magnetic anomalies. . .
The aeromagnetic profiles are too widely spaced m Lake and Cook Counties, Minn., to make reliable contouring in this area possible. Where the traverses are spaced at 1-mile intervals in St. Louis County, the published aeromagnetic maps (Henderson and Meuschke, 1952a, b; B3ith and others, 1964) and even the generalized data of figure 4 show that both the Duluth Gabbro Complex and the gently dipping middle Keweenawan lava flows generate a very hummocky magnetic "topography." This "topography" has round or irregular highs and lows rather than the. c~ntinuous magnetic crests and troughs so char.actenstiC. o~ the more steeply dipping lavas in Wisconsm and MIChigan. Contours have been drawn to connect highs and lows, respectively, in adjoining aeromagnetic profil~s in Lake County, but these connections may not be vahd. .
Although it is not known whether the magnetic "topoo-raphy" in Lake County is hummocky, like that farth:r southwest or composed of magnetic ridges and troughs, as in wisconsin, it is clear that t!lls area is characterized by positive rather than negative anomalies. A small part of this change from dominantly negative anomalies near Duluth to positive anomalies farther northeast may be due to a gradual northeasterly decrease in the dip of the rocks, combined with a change in strike from roughly north at Duluth to northeast in Cook County. R. B. Taylor (oral commun., Feb.1965) suggested the possibility that the change is related to the higher iron content of the Beaver Bay complex.
A broad aeromagnetic anomaly, U-shaped in plan, crosses the Bayfield Peninsula north-northwest of Ashland and curves to the northeast where it extends northward into the area covered by Lake Superior. Some of the conclusions reached in this paper depend on the

E8
w (f)
SHORTER CONTRIBUTIONS TO GENERAL GEOLOGY

NW SE
F
G I
IJ I'
J
I
~ ... ;;!
~~ ~
EXPLANATION
LAYERED ROCKS
Bayfield Group
-Oronto Group
~ ~~ .., ~ :;l., ::!::1 ~ .~
Lava flows and diabase sills
~ ~{ ~;;! ~ ~ Metamorphic rocks
;;;--'i ~~ ~ ~ "' ., tl .,
~~ ~
~
INTRUSIVE ROCKS
Granite
Gabbro-granophyre complex Includes Duluth Gabbro Complez
• Point at which calculated value of
gravity anomaly is approximately equal to values read from Bouguer gravity map.
GAMMAS 2000
1000
Vertical scale (gam mas) for aeromagnet ic profi les. Ticks along sides of diagram are 2000 gammas above
0 arbitrary datum
10 0 10 20 MILES
FIGURE a.-Aeromagnetic profiles and generalized geologic sections. Location of aeromagnetic profiles shown on figure 4; for geologic sections, fig. 1. Geologic sections along profiles A-A', 0-0', E-JJJ', H-H', and J-J' have been constructed to be consistent with the gravity values of fig. 5. These sections are reduced from originals at 1:250,000 on which separate gravity calculations were made for sedimentary and mafic rocks. Values calculated at each of the points indicated by black dots agree with the values read from figs. 2 and 5 to within about 3 milligals.
8 t;j
~ ~ ..... 0 rJl
0 "':1
~ t;j
~ ~ t;j
~ t:l:j > rJl
~!Z
~ ~ ~ z t"
e ~ ~ ::0
~ t;j
~
~

ElO SHORTER CONTRIBUTIONS· TO GENERAL GEOLOGY
w
10 0 10 20 MILES
EXPLANATION
Contour interval (solid lines) is 500 gammas. Supplementary half
-interval contours, wher~ shown, are dashed. Datum arbitrary
Less than 1500
FIGURE 4.-Generalized aeromagnetic map. Line X-X' is line of cross section in figure 6. Contours in area of flight lines generalized from Kirby and Petty (1966). Contours in St. Louis County and adjacent parts of Lake County, Minn., from Henderson and Meuschke (1952a, b), Bath, Schwartz, and Gilbert (1964), and unpublished U.S. Geol. Survey maps.
following inferences about the source of this magnetic anomaly.
In the vicinity of the Bayfield Peninsula, the magnetic anomaly trends virtually at right angles to : the strike of formations of the upper Keweenawan Bayfield Group exposed at the surface. The anomaly is clearly due, therefore, to rocks that underlie the Bayfield Group.
The width and amplitude of the anomaly are rela-
tively uniform within the area of figure 1; this fact suggests that the source is a single geologic body. Only a most remarkable coincidence could lead to abutment of two or more discrete geologic bodies in such a way as to leave no obvious junction where the magnetic expression of one leaves off and that of the other begins; therefore, I shall not consider alternatives to the assumption that a single geologic body is involved.
The elongate character of the anomaly suggests the

TECTONICS OF THE KEWEENAWAN BASIN, WESTE-RN LAKE SUPERIO:R REGION
trace of a sheetlike mass, and the U-shape suggests that the sheet is involved in a fold. The northwestern part (>f the anomaly is approximately parallel to the strike bf the southeastward-dipping middle Keweenawan rocks in Minnesota, and the part of the anomaly extending east from Ashland is approximately parallel to the northward-dipping middle Keweenawan rocks south pf Ashland. The fold suggested by the U-shape, therefore, seems to be the Lake Superior syncline, and the anomaly follows the trace of a magnetic formation that wraps around the eastward-plunging nose of this syncline. . It is considered unlikely that the magnetic formation is everywhere separated from the ·exposed middle Keweenawan lava series by an arcuate fault or synclinal axis; therefore, the geometry of the syncline requires that this magnetic formation overlie the exposed middle Keweenawan lava flows. As noted previously, the magnetic formation must underlie the rocks of the upper Keweenawan Bayfield Group. These various geologic relationships could be satisfied by one of the following possibilities : 1. The magnetic formation is a unit at the top of the
middle Keweenawan lava series. It either lenses out along a line parallel to the outer edge of the U-shaped anomaly or is cut off along this line by
I
an unconformity at the base of the upper Keweenawan rocks.
~· The magnetic formation is a unit within the Oronto Group. It either lenses out or is cut off by an unconformity at the base of the Bayfield Group.
The problem of discriminating between these possibilities cannot be settled with the available data. Inasmuch as the basic conclusions of this paper are not materially affected by the comparatively minor differences between these alternatives, from a geophysical point of view, the problem need not be pursued, except to call attention to the choice implied by the geologic sections of figure 3. The outer edge of the area underlain by the magnetic formation is the outer margin of the U-shaped anomaly; so the magnetic formation causing the high wedges out or is cut off at the northwest side of the magnetic high just southeast of the Minnesota shore. The base of the magnetic formation lies about 10,000 feet above the base of the mafic lava series as drawn in the northwestern parts of sections A-.A' and 0-0'. Section E-E' lies along the outer margin of the U-shaped anomaly (fig. 4) and, therefore, repreiSents a line along which the magnetic formation is abisent, or at most very thin. The sections of figure 3, rtherefore, imply that the magnetic formation is part of the middle Keweenawan lava series. If it were part of the Oronto Group, the base of the Oronto would have
to be shown as lying about 10,000 feet above the base of the middle Keweenawan lava series in the northwestern parts of sections A-.A' and 0-0', instead of much higher as it is now shown.
The cross sections do not show bedding planes and therefore beg the question of whether the magnetic formation lenses out or wedges out against an unconformity.
The magnetic expression of the magnetic formation indicates that the bedding in this formation dips very gently, probably less than 15° throughout most of the area. Assuming a direction of remanent magnetism similar to that of the exposed middle and upper Keweenawan lavas (DuBois, 1962, p. 57), steep dips would cause negative magnetic anomalies on the west and north side of the U similar to the negative anomalies along the north west flank of the Ashland syncline. Gentle dips of bedding are consistent with the location of the magnetic formation near the central, flatter part of the Lake Superior syncline.
The preceding paragraphs discuss the stratigraphic position and physical location of the magnetic formation but not its lithologic character. The size of the anomaly indicates that the rocks causing the anomaly are highly magnetic. Mafic igneous rock is the principal constituent of the middle Keweenawan lava series and is locally abundant in the lowermost part. of the upper l{eweenawan section. The only evidence for igneous activity after deposition of the Copper Harbor Conglomerate is a single small plug of alkalic rhyolite near Hancock (Cornwall and Wright, 1956). Other types of highly magnetic rock, such as magnetic slate or iron-formation, are not known to be present in the Keweenawan rocks. Is seems most reasonable to assume, therefore, that the U-shaped anomaly is caused by mafic rock. According to the interpretation discussed above, the base of the magnetic formation lies some 10,000 feet above the base of the lava series near the Minnesota shore along the lines of sections A -.A' and 0-0', figure 3. This interpretation implies a significant difference in the average intensity of magnetism in the upper and lower parts, respectively, of the lava series in that area. Noteworthy contrasts, in the range of 500-1,000 gammas, can be seen on aeromagnetic maps of the Michigan copper district (Balsley and others, 1963) in areas where the stratigraphic section is known, from drilling, to consist almost entirely of mafic lava; therefore, a difference between the magnetic intensity of different groups of flows is not an unreasonable assumption. It should be noted, however, that such a contrast between upper and lower parts of the lava series is not apparent in the western part of the area shown in figure 1, and it is necessary to assume that the U -shaped anom-

El2 SRORTER CONTRIBUTIONS TO GENERAL GEOLOGY
aly outlines the principal area in which this relationship exists.
PALEOMAGNETIC MEASUREMENTS
The pioneer paleomagnetic work of DuBois (1962) illustrated the large potential value of such studies to problems of correlating Keweenawan geologic units. More recently, Books, Beck, and White (unpub. data) used the attitude of the direction of remanent magnetism to set limits to the time at which the gabbro bodies at Duluth and Mellen were emplaced. The directions of remanent magnetism and their secular changes are not yet known with sufficient precision and detail to solve this type of problem unequivocally, but the spans of time in which intrusion might conceivably have taken place are very much narrowed by the sma;ll amount of paleomagnetic data already published. Books, Beck, and White ( unpub. data) conclude that the gabbro at Duluth was intruded during the time interval represented by the middle Keweenawan lava flows and the Copper Harbor Conglomerate and probably before tilting of the underlying lava flows was completed; available data do not permit a more precise chronology. The gabbro near Mellen was probably intruded during Copper Harbor time, when the lava flows into which it was intruded already had dips close to 50° ; this sequence of events implies a more profound unconformity within the Oronto Group, at the top of the Copper Harbor Conglomerate, than is suggested by any known field relationship.
SUBSURFACE STRUCTURE OF KEWEENAWAN ROCKS
The following paragraphs review the present status of knowledge and inference concerning the subsurface structure of the Keweenawan rocks in the western Lake Superior region.
The structure of the Ashland syncline in the southwestern ninth of the area of figure 1 seems fairly simple. Profiles across the syncline constructed by projection of surface attitudes (fig. 3) suggest that near the west edge of the area of figure 1 the lava mass is roughly 40,000 feet thick and that in the center of the syncline, farther northeast, the rocks of the Oronto Group are 7,000-9,000 feet thick. These thicknesses are consistent with the gravity data (fig. 2).
Lava does not reach the surface on the north limb of the Ashland syncline east of long. 91 °22' W. Because of poor exposures, the eastward continuation of the Douglas fault and the configuration of the Ashland syncline south and southeast of Ashland are not known. Near the Wisconsin-Michigan State line, all the exposed upper Keweenawan strata dip northward, for the most part steeply, for a distance of at least 7 miles away from the top of the underlying lava series. These strata could represent a single unbroken homoclinal
sequence 35,000 feet· or more in thickness, or a thinner sequence that includes one or more folds or faults. Sections A-A', 0-0', and E-E' (fig. 3) suggest, following Thwaites (1912, map), that the section has been folded, but a variety of other interpretations is possible.
The interpretation of subsurface geology in the remainder of the western Lake Superior region, north of the Douglas fault, depends heavily on geophysical data because so much of the area is covered either by Lake Superior or by the gently dipping sandstone of the Bayfield Group, a sandstone that may overlap the older formations unconformably. We may consider two general situations: (A) the pre-Keweenawan basement rock has a uniform density, and all the large gravity anomalies within the area of the Keweenawan rocks are caused by the Keweenawan rocks themselves, or (B) some of the large gravity anomalies are due to the character of the pre-Keweenawan rocks.
SITUATION A: GRAVITY ANOMALIES DUE ENTIRELY TO KEWEENAWAN ROCKS
ANALYSIS OF GEOPHYSICAL DATA
The assumption that gravity anomalies are due entirely to Keweenawan rocks is most readily explored by working from the gravity map (fig. 2). In general, the value of the Bouguer gravity anomaly at any point can be explained by a range of paired values for the gravitational effect of mafic rock and of overlying sedimentary rock, respectively. Because the density of mafic rock is greater and that of sedimentary rock is smaller than the value assumed for the pre-Keweenawan rocks ( 2.67) in the analysis of a given value of the Bouguer anomaly, the larger the thickness assumed for the sedimentary rock, the larger the thickness of mafic rock required to compensate it. Where both rock types are present, therefore, any value read from 1figure 2 can be thought of as the algebraic sum of two components, one positive, caused by the mafic rock, and the other negative, caused by the overlying sedimentary rock. Separate maps of these two components reveal the shapes and rude dimensions of the geologic bodies and are a device for comparing alternative geologic structures. Figure 5 is a map exemplifying the separation of these two components of gravity ; the solid -line contours represent the inferred negative gravity effect due to an upper prism of sedimentary rock-derivation of the shape of this prism is described in the following paragraphs'-and the dashed-line contours represent the complementary positive gravity effect due to the underlying mafic rock; algebraic addition of these two components at any point will yield the value shown in figure 2. The following steps were taken in analyzing the subsurface structure by means of diagrams similar to figure 5.

TECTONICS OF THE KEWEENAWAt~ BASIN, WESTERN LAKE SUPERIOR REGION El3
"'(
I "'(
"'(
I
10 0 10
0 .," ,.
Mellen __ .J. - - _ - ::..--"'
I ------ I ---- / ) t -- ..... /
_.8----L--""l~..,-~~ IRON/ -------50 / ,"' ~-T- I / ;
1'... ,.._, ~...,...,.,., ,..,... ,"
y ,-------, -,.. .,.
>-" ~SHLAND -- 1'" ",.. _ ... _ ........ / ... - L-,., / .,.,.,. ......... ,
....... ___ __../ "".,. ,., I -- ..,-"'/ ,"" ----20 MILES
FIGURE 5.-Gravity map with inferred gravitational component due to upper Keweenawan sedimentary rock separated from that of other rocks. Solid lines represent inferred negative anomaly due to upper Keweenawan sedimentary rock. Subtracting this negative anomaly from the Bouguer anomaly (fig. 2) yields the anomaly represented by the dashed lines. Contour intervallO milligals.
STEP 1
The first step is to estimate the configuration of the base of the sedimentary sequence using all available geologic data. As shown in figure 1, the Bayfield Group north of the Douglas fault dips very gently southeast. The base of the Devils Island Sandstone (line b, fig. 1) as mapped by Thwaites (1912, map) is
approximately parallel to the Minnesota shoreline 25 miles to the northwest. The regularity of that shoreline has long invited speculation that it is due to a fault. Thiel (1956, p. 1096-1098) presented a brief history of this idea together with geophysical evidence against it. Where the "fault" should cross the shoreline at the west end of Lake Superior, just south of Duluth, Thiel found

E14 SHORTER CONTRIBUTIONS TO GENERAL GEOLOGY
no inflection in the gravity profile such as would be caused by a thick section of sandstone faulted against lava. Schwartz (1949, p. 69) pointed out that a fault trace parallel to the shoreline would not pass between lava and sandstone outcrops. The northwestern boundary of the upper Keweenawan sandstone at Duluth, therefore, appears to be the trace of an angular unconformity that cuts across the beveled edges of the flows and intrusions that underlie the sandstone (fig. 1). Because sandstone of the Bayfield Group overlies preKeweenawan rocks at many places in Michigan, Wisconsin, and Minnesota, there is ample reason to postulate the existence of such an unconformity. An extrapolation is made from the relation at Duluth, therefore, and the regularity of the Minnesota shoreline as a whole is here attributed to exhumation of an angular unconformity of relatively low relief cut on a surface of middle Keweenawan lavas and associated rocks and overlain by upper Keweenawan sandstone or conglomerate. Comparatively rapid erosion and removal of the softer rocks above the unconformity and less effective dissection of the harder lavas below would tend to make the shoreline fairly close to the beveled surface of the unconformity; the shoreline would, therefore, be fairly straight, overall, where the unconformity is not deformed.
This interpretation of the Minnesota shoreline gives the approximate location of the contact surface between the sedimentary rock sequence and the lava series at lake level. We need to know, next, th~ dip of this contact surface. The general parallelism of the Minnesota shoreline and the base of the Devils Island Sandstone on the Bayfield Peninsula (line b, fig. 1) suggests that the sedimentary sequence above the unconformity contains no marked discordance and that the typical dips of 3°-6° on the north shore of Bayfield Peninsula (Thwaites, 1912, map) give the order of magnitude of the dip of the unconformity in that area. The topography of the Minnesota coast provides an additional clue. If we draw a smoothly arcuate line skirting the promontories of the Minnesota shore and measure the vertical angle to points on the skyline as they might be measured with a theodolite from a small boat on the line, we find that the maximum vertical angle is commonly about 8%0
• Actual measurements were made on large-scale topographic maps, and the points selected were 1-2 miles inland from the shore. Sculpture of the present topography of this coastal strip involves so many factors, some tending to steepen and some to lower gradients, that no great significance can be attached to the precise value of 8% 0 for the angle, but this physiographic evidence does suggest, as a reasonable starting
point, the inference that an unconformity between sandstone and lava has a lakeward dip of 8°-10°.
This model of a sedimentary wedge or prism overlying an angular unconformity cut on the lava is at least qualitatively supported by the aeromagnetic data (figs. 3, 4) . The aeromagnetic anomalies are far more subdued than they would be if the lava cropped out on the lake bottom a few miles out from the Minnesota shore; this fact strongly suggests that the lava is overlain by an appreciable thickness of nonmagnetic rock as well as water. The anomalies on the profiles of figure 3 are not suitable for very reliable estimates of the depth to lava, but estimates based on width of the anomalies at half maximum are at least consistent with a dip of 10° or less for the base of sedimentary rock overlying the lava.
These fragments of geologic information- the attitude of bedding on Bayfield Peninsula, the regularity of the Minnesota shoreline and the slope of the hillsides facing it, and the general parallelism of the Minnesota shoreline with the strike of the Devils Island Sandstone-all suggest that the sedimentary rock is a prism-shaped mass thickening southeastward from a featheredge at the Minnesota shoreline. Dips in the range of 8°-10° are reasonable for the attitude of the unconformity at this northwestern edge, and gentler dips are likely under the Bayfield Peninsula.
The shape assumed for the prism is very similar to the figure that would be represented by the solid lines of figure 5 if these lines were structure contours instead of gravity contours. The prism shape was derived by drawing generalized structure sections of the sedimentary rocks in the conventional manner, using all available surface dips. The dips are flattest in the vicinity of the bay northeast of Ashland; therefore, this location was assumed to be the deepest part of the trough.
STEP 2
The second step in the analysis of subsurface structure was to compute very roughly the gravity deficiency due to the sedimentary rocks alone for three different assumptions concerning the maximum thickness of a sedimentary prism having the general configuration suggested by the solid lines of figure 5. The gravity deficiency is based on the difference between the densities of the sedimentary rock and the value of 2.67 assumed for the pre-Keweenawan rocks. For purposes of computation, the proportion and distribution of Bayfield and Oronto Group rocks, respectively, was assumed to be that shown in figure 3, sections A-A' and 0-0', for the northeastern part of the area shown in figure 5, where greatest doubt exists. The assumed angular unconformity at the base of the sedimentary rocks at the

TECTONICS OF THE KEWEENAWAN BASIN, WESTERN LAKE SUPERIOR REGION E15
~innesota shore is most compatible with known rela
onships elsewhere if the strata above the unconformity long to the Bayfield Group, and this overlap requires
al northwestward pinchout of the Oronto Group. Actually, raising or lowering the Bayfield-Oronto boundary as much as 5,000 feet has only a small effect on the ihterpretations that follow.
I The negative gravitational effect of the sedimentary rocks was calculated for numerous points, and the values vfiere then contoured. The solid -line contours of figure ~ give the gravity deficiency for the sedimentary rocks allone if the dip at the Minnesota shore is assumed to be 9° and the maximum thickness of the sedimentary ~rism is 25,000 feet.
i The gravity map for each possible model of the sedi$entary rock has a complementary map that represents tpe gravitational effect of the underlying mafic rock. these gravity maps for the mafic rock are very simply constructed by graphic subtraction of the values on the gravity maps of the sedimentary rocks from the values $the Bouguer anomaly map (fig. 2). The dashedline contours of figure 5 represent the anomaly that re$ains when the values represented by the solid-line cpntours are subtracted algebraically from the values ~epresented by the Bouguer anomaly map (fig. 2).
I Pertinent data for each of the three models are given ih the following table :
I Model
A B c
Dip of unconformity, Minnesota lakeshore ______________________ Maximum thickness of sedimentary
6~0 go 13°
· prism _________________________ 15,000 25,000 40,000 4-verage thickness of mafic rock be-
1 low deepest part of sedimentary 1 prism where Bouguer anomaly ex-ceeds -80 milligals _____________ 10,000 20,000 30,000
, The situation described in column B of the table is represented by figure 5. A dip of 4° gives a thickness of 10,000 feet for the sedimentary rock sequence, and a thickness of lava close to zero; these thickness relations astablish 4° as a minimum dip. ' The various assumptions made for the area north of
·the Douglas fault do not affect the southwestern quarter df figure 1, where the structure is fairly well established, but they do change the gravity gradients in the area douth and east of Ashland, where, as noted previously~ the surface geologic structure is most uncertain because of poor exposures.
The gravity rna ps of the mafic rock obtained by subtraction prima.rily represent the thickness of the mafic rock. Some minor gravity irregularities due to struc-
ture are apparent, as along the Douglas fault and in the vicinity of the Michigan-Wisconsin State line, where the surfaces separating light and heavy rocks dip steeply at shallow depth; the largest departures from infinite-sheet models are to be expected in these places. Elsewhere, the positive gravity anomaly is roughly proportional to the thickness of mafic rock; for sheets of infinite extent, 30 milligals is roughly equivalent to 10,000 feet of lava. This correspondence is not close enough to permit an isopach map to be drawn directly from a gravity map, but it is close enough to show the shapes and general size of large bodies of rock with considerable fidelity. Although sharp ridges or troughs appear more subdued on the gravity map than .they would on a corresponding isopach map, this modification is not important where position and general shape are the principal concern, as described in the next step.
STEP 3
The third step in the analysis is a comparison of the various configurations for the mafic rock obtained by step 2 to see which are geologically reasonable and agree best with the aeromagnetic data. Before exploring the effect of assuming larger or smaller thicknesses for the sandstone, however, it is desirable to consider the geologic meaning of the residual gravity anomalies represented by the dashed -line contours of figure 5. The large positive gravity anomalies in Wisconsin and Minnesota correlate perfectly with areas where abundant mafic rock is known to exist below the surface. The magnitudes of these anomalies correspond, generally, to what can be inferred from the dip of strata with respect to the thickness of the mafic rocks in these areas. The gravity high off the tip of the Bayfield Peninsula is to be expected if the lavas that rim the Lake Superior basin have any continuity under the lake. The most striking and puzzling feature of the map is the gravity trough, extending west-northwest across Bayfield County; this trough seems to separate the high off the tip of the Bayfield Peninsula from the high in the western half of the map area. The northward extension of this gravity low across Lake Superior, as shown in figures 2 and 5, is hypothetical. It was drawn to make the gravity anomaly due to the mafic rocks parallel the magnetic anomalies under the lake (fig. 4) and to connect the gravity trough of the Ashland area (fig. 5) with the gravity saddle at long 91 oW. in Minnesota. If actual Bouguer anomalies in the area of the lake are found to correspond to the values inferred in figure 2, they will tend to confirm the structure derived here. In accordance with the present assumption that all the gravity anomalies within the area of Keweenawan rocks are due to those rocks, the gravity trough

E16 SHORTER CONTRIBUTIONS TO GENERAL GEOLOGY
represents an area where the lavas are thin or absent. Structure contours on the base of the Keweenawan lava series would roughly follow the gravity contours to outline a ridge or anticline of pre-Keweenawan rocks trending west-northwest, cutting directly across the projected strike of the Wisconsin part of the midcontinent gravity high.
The effect of increasing or decreasing the assumed thickness of sandstone can now be explored with these implications of the gravity trough in mind, and using figure 5 as the point of departure. As might be expected, changing the thickness of the sedimentary rock changes the amplitude of the gravity anomaly representing the sedimentary prism but does not change the general shape or position of that anomaly. Changing the assumed thickness -of the sedimentary rock, however, has an exceedingly important effect on the shape and position, as well as amplitude, of the gravity anomalies representing the mafic rock. Decreasing the assumed thickness of the sandstone brings the gravity contours for the mafic rock closer to congruency with the contours of the Bouguer anomaly map (fig. 2). The gravity trough becomes wider, deeper, and more rounded, and its axis is displaced toward the northeast. The changes neither increase nor decrease the geologic credibility of the structure of the mafic rock implied by figure 5. The changes do, however, affect profoundly the degree of concordance between aeromagnetic and gravity anomalies.
The large positive magnetic anomaly, U-shaped in plan, that trends generally northwestward across the Bayfield Peninsula and curves around to the northeast under Lake Superior (fig. 4) crosses the center of the large negative Bouguer anomaly north of Ashland (fig. 2). The positive character, size, geographic position, and shape suggest that this high is due to mafic rocks in the upper part of the middle Keweenawan lava series, as described earlier, which means that there should be some correspondence between the aeromagnetic map and a map showing the gravitational effect of the mafic rock. Such a correspondence does exist between the anomalies of figures 4 and 5 ; so the thickness of the sedimentary rock assumed in the construction of figure 6 is reasonably consistent with the aeromagnetic data. If a smaller thickness of sedimentary rock is assumed, however, the gravity trough becomes more rounded and its axis is displaced northeastward, as noted previously, and the correlation of magnetic and gravity contours is destroyed. The thickness of sedimentary rock assumed in figure 5 is about the minimum thickness that will produce a fit between aeromagnetic and gravity data. Concordance between aeromagnetic and gravity data, therefore, requires that the prism of sedimentary rock
have a minimum thickness of roughly 25,000 feet where it is presumed to be thickest under the bay northeast of Ashland.
The dimensions used for figure 5 were actually determined by reversing the procedure described in step 2. Gravity contours for the mafic rock were dra.wn more or less parallel to the aeromagnetic contours, and these values, when graphically subtracted from the Bouguer anomaly (fig. 2) gave an approximate figure for the gravity gradient and, indirectly, for the maximum negative anomaly due to the sedimentary rock.
Increasing the assumed thickness of the sedimentary prism above the amount for figure 5 increases the gravity gradient on the east side of the gravity trough, but even an increase to 40,000 feet of sedimentary rock under the bay northeast of Ashland does not materially affect the configuration and location of the trough, or the concordance between aeromagnetic and gravity map. The test of geologic reasonableness, therefore, does not suggest any well-defined limit for the maxiInurn thickness for the sedimentary prism, and it would be difficult to prove, with available evidence, that 40,000 feet is more or less probable than 25,000 feet.
DISCUSSION OF INTERPRETATION DERIVED FROM GEOPHYSICAL DATA
A section parallel to the north shore of the Bayfield Peninsula (X -X', fig. 6) is helpful for visualizing what the manipulations actually mean, both geologically and mechanically. This seotion intersects each of the sections of figure 3, and the thickness of the various .geologic units at each intersection was therefore taken from figure 3 to construct figure 6. Curve M is an aeromagnetic profile, and curves R, S, and Tare gravity profiles. R shows values of the Bouguer anomaly, and S is a profile of the gravity surface defined by the dashed lines of figure 5. T shows the effect of assuming a ·thicker prism of sedimentary rock than is assumed in the construction of figure 5 ; the construction represented by curve T is based on an assumed thickness of 40,000 feet for the maximum thickness of the sedimentary prism northeast of Ashland.
The difference between curves R and S represents the gravity deficiency due to the sedimentary rock. The difference between 8 and T shows how an increase in the assumed thickness of the sedimentary sequence tends to narrow the gravity trough and shift its axis toward the west.
The geologic section, X-X', is governed by the gravi~ty profile S-values of gravity are the basis for estimating the thickness of the mafic rocks-so the base of the layer of mafic rock is virtually a mirror image of gravity profileS. The high~ and lows of the aero-

TECTONICS OF THE KEWEENAWAN BASIN, WESTERN LAKE SUPERIOR REGION E17
w E
.... T
~-- /;;;?s MILLIGALS
+50
0
J-J' H-H' E-E'
10 0 10M ILES
C-C'
-50
GAMMAS 2500
2000
1500
A-A'
FIGURE 6.-Gravity and aeromagnetic profiles, north of Bayfield Peninsula. For locution of section X-X', see figures 1, 4, or 5. Lithologic symbols are the same as those in :figure 3. Aeromagnetic profile, M, is drawn from :figure 4, and does not represent an actual flight line. Similarly, gravity profile R, representing values of the Bouguer anomaly, is drawn from :figure 2, and gravity profile S is drawn from the values represented by dashed lines in figure 5. Profile T is derived in the same way as profile S, but represents a situation in which the upper Keweenawan sedimentary sequence is assumed to be thicker.
:p1agnetic profile do not show a one-to-one correlation with those of the gravity profile S, although the correspondence is better than with the original Bouguer profile R. It is desirable, therefore, to see if the features of the aeromagnetic profile are compatible with the relations shown in the geologic section.
The eastern aeromagnetic high, representing the U-shaped anomaly of figure 4, lies above the area where the layer of mafic rock thins rapidly on the flank of the fidge of pre-Keweenawan rock. The western slope of the high, therefore, appears to be due to change in thickness of the mafic layer and the more gentle eastern ~lope to change in the depth to the top of the mafic layer. As suggested earlier, the location of the crest of this U-shaped anomaly seems to indicate that the rocks /Well above the base of the mafic layer have a greater p1agnetic effect than those near the base. The proximrty of the western magnetic high to the center of the western lava trough suggests the possibility of a similar relation west of the ridge of pre-l(eweenawan rock.
Some elements of the aeromagnetic profile may be a response to the attitude of the rocks. As discussed earlier, areas in which the middle Keweenawan lava flows dip steeply toward the east or southeast are characterized by negative anomalies, due, presumably, to a nearly horizontal attitude of the direction of remanent magnetization in these places. This dip is suggested as the explanation for the negative character of the west end of the profile, near Duluth. Along the rest of the profile, neither the actual attitude of the mafic rocks nor their composition (basalt flows versus gabbro intrusions) is known ; so no strong inference can be drawn.
Thus, although the aeromagnetic highs and lows do not show a simple one-to-one correlation with individual features of the geologic profile of figure 6, which was derived from the gravity data, there is a general correspondence, and departures are capable of reasonable explanation. Comparison of profiles S and T (fig. 6) shows that the degree of correspondence between aero-

El8 SHORTER CONTRIBUTIONS TO GENERAL GEOLOGY
magnetic and gravity profiles is only slightly improved by very large increases in the thickness assumed for the sedimentary rocks.
GEOLOGIC EVIDENCE FOR INTERPRETATION
The existence of a positive area has been deduced from evidence that is primarily geophysical. In addition, there is some independent geologic evidence to support this conclusion.
Although the unusual narrowing of the outcrop belts of the lava in the vicinity of Mellen may be attributable to faults (the Lake Owen and Keweenaw(~) faults) that cut out more and more of the stratigraphic section as they approach Mellen, the coincidence between the gravity low and the pinching down of the lava is remarkable. The comparable narrowing of the width of the lava belt on the north limb of the Ashland syncline is likewise accompanied by a decrease in the gravity, suggesting that here, too, the narrowing of the outcrop belt represents real thinning of the whole lava section rather than the nearsurface thinning of a fault slice cut from a thicker sheet at depth. If one calculates the thickness of the lavas directly from breadth of outcrop and connects points of equal thickness on the north and south limbs of the Ashland syncline, the isopachs are almost parallel to the Bouguer gravity contours of figure 2.
Other supporting evidence comes from work on the upper Keweenawan sedimentary rocks. The Bear Creek Mining Co. drilled a number of holes in the upper Keweenawan rocks of the Ashland syncline in an area ranging from 15 miles south to 60 miles southwest of Ashland. These holes revealed that the Copper Harbor Conglomerate, immediately above the lava flows, grades from a coarse conglomerate in the more northerly and northeasterly holes to fine-grained sandstone, siltstone, and shale to the southwest and that theN onesuch Shale, immediately above the Copper Harbor (base of this formation shown by dashed line o on fig. 1), thickens southward (Moerlein, 1963). East of Mellen, northeastward thickening of the Nonesuch Shale was first recognized by Irving ( 1883), as was the conglomeratic character of the Copper Harbor Conglomerate in that area. Farther east in Michigan, the Nonesuch Shale thickens in a direction away from its ancient shorelines and in the same direction the Copper Harbor Conglomer~te changes rapidly from conglomerate to sandstone. Geologic observations in the Ashland-Mellen region, therefore, confirm a positive area in the general vicinity of the present gravity low at the beginning of hite Keweenawan time. These observations thus, indirectly, support the assumption that the gravity features are due primarily to the Keweenawan rocks themselves.
NEGATIVE GRA. VITY ANOMALY
This analysis points to a double rather than a single cause for the large nega,tive Bouguer anomaly north of Ashland: the anomaly marks the high-angle intersection of the axis of a thick prism of upper Keweenawan sedimentary rock with a ridge of pre-Keweenawan rock-an area in which the middle Keweenawan lavas are thin or absent. This dualistic hypothesis may seem more complex and therefore inherently less attractive than some of the single causes .that might be suggested; therefore, the adequacy of possible single causes needs to be at least briefly reviewed.
The most likely single causes are an exceptionally thick prism of sedimentary rock (see Thiel, 1956, p. 1090-1093), exceptional abundance of rhyolite within the normally mafic lava sequence, and low-density rocks in the pre-I{eweenawan basement. The last possibility is discussed in the next section and is not considered here.
A thick sedimentary sequence alone will not explain the negative. anomaly north of Ashland. Southwest of the anomaly, the value of Bouguer gravity decreases steadily from a high of more than + 30 milligals to a low exceeding - 80 milligals over a distance of 25-30 miles. Lava is at or near the surface for approximately two-thirds of this distance on the north flank of the Ashland syncline; therefore, in the area of this long gradient, an appreciable fraction of the large negative Bouguer anomaly, perhaps as much as half, is due to something other than sedimentary cover.
If a thick sedimentary sequence is the sole cause of the negative Bouguer anomaly, the shape of the anomaly suggests that the sedimentary mass has the general form of a basin. Surface trends, however, do not lend any support to this interpretation of the structure. The base of the Devils Island Sandstone (line b, fig. 1) crops out on a line that cuts directly across the anomaly. Aeromagnetic trends, representing rocks deeper in the stratigraphic section, lend equally little support to the interpretation; the large U-shaped aeromagnetic high of figure 4 crosses the lowest part of the negative gravity anomaly.
The possibility that the middle Keweenawan lava series contains exceptionally large amounts of rhyolite in the vicinity of the large gravity low is less readily dismissed than the preceding hypothesis. Rhyolite flows make up about 10 percent of the section measured by Sandburg (1938, p. 806) near Duluth, but are extremely rare in the Michigan copper district. They do not appear to be a conspicuous element of the lava sequence in the outcrop areas close to the gravity low (Aldrich, 1929; Grant, 1901; Moerlein, 1963). In addition, the Bouguer gravity anomaly maP· of the United

TECTONICS OF THE KEWEENAWAN BASIN, WESTERN LAKE SUPERIOR REGION E19
States (Am. Geophys. Union, Spec. Comm. for Geophys. ~d Geol. Study Continents, 1964) shows almost no expression of a large volume of rhyolite in the Porcupine Mountains and adjoining areas, 7-25 miles east of the area of fig. 1. Rhyolite flows cannot be ruled out as a possible cause of at least part of the large gravity low, but there is no positive reason to suggest that they are the sole cause.
No single simple cause, therefore, seems wholly adequate to explain all the features associated with the large negative Bouguer anomaly north of Ashland, and a dual cause involving both a thick prism of sedimentary rock and a ridge in the pre-Keweenawan basement rock is favored.
;E"OSITIVE GRAVITY ANOMALY OVER DULUTH GABBRO COMPLEX
Up to this point, the analysis of geophysical and geologic data has been concerned primarily with the subsurface structure of the Wisconsin part of the western Lake Superior region. In the Minnesota part of the region, the shape of the positive gravity anomaly over the Duluth Gabbro Complex has important implications if the gravity anomalies within the area of Ke;weenawan rocks are due primarily to the distribution bf these rocks. The crest of this anomaly lies about 10 miles northwest of La:me Superior (figs. 2, 5). The size of the anomaly suggests that the gabbro is 20,000-30,000 feet thick in the area of the maximum anomaly.
The mafic lavas overlying the gabbro appear to have a homoelinal dip toward the southeast. The actual thickness of the lava series is not known. Sandberg (1938, p. 806) gave a thickness of more than 20,000 feet for the sequence of mafic and rhyolite flows exposed along the shore northeast of Duluth, and Grout, Sharp, and Schwartz (1959, p. 35-40) obtained a thickness of 17,500-25,000 feet for the flows exposed along the shore in Cook County. These measurements, made by adding thicknesses in traverses almost parallel to the strike of the rocks are subject to large error-it would be easy, for example, to overlook faults at right angles to the shore and theneby fail to recognize repetitions within the section. Despite this possibility, the large area underlain by southeastward-dipping lava in Minnesota is evidence for a large volume of lava. The thickness of this lava increases southeastward and probably reaches a maximum southeast of the shoreline ·at most places.
The thickness of lava to be added to the thickness of gabbro, therefore, increases lakeward from the crest of the gravity anomaly and sh~uld make an increasingly large positive contribution to the value for the gravity. The fact that the value of gravity decreases in this direction is clearly anomalous if, as many geologists have
assumed, the gabbro is a sheetlike mass extending downdip to the southeast for some distance.
Two alternative explanations of the observed decrease · in gravity are geologically reasonable : ( 1) the gabbro thinning southeastward faster than the lava series thickens, pinches out close to the lakeshore, or ( 2) a thick section of sandstone is downfaulted against the lava beneath the lake just offshore, and the decrease in gravity toward the lake is due to the mass deficiency caused by this sandstone. This latter effect is quantitatively inadequate to explain the observed gravity profile if the downfaulting is taken as an alternative to thinning of the gabbro (that is, if the gabbro is not thinned drastically). If it is assumed that the combined thick-. ness of lava and· gabbro on both sides of the fault is on the order of 25,000 feet (which, in itself, implies appreciable lake ward thinning of either gabbro or lava), rough calculations indicate that the observed values for gravity at the lakeshore would require vertical displacements on the fault (and sandstone thicknesses) of the order of 10 miles or more. These difficulties concerning the fault hypothesis can be reduced or eliminated by assuming that the fault dips gently northwest and that the lavas are thrust far out over sandstone; however, such a fault would not be consistent with what is known of geologic structure anywhere else in the Lake Superior region.
For these reasons, the better explanation for the lakeward decrease of gravity along the Minnesota shore appears to require that the gabbro thin rapidly downdip beneath the lava flows, pinching out entirely somewhere near the line of the lakeshore.
CONCLUSIONS
In summary, the following principal conclusions result from the assumption that the gravity anomalies within the area of l{eweenawan rocks are due primarily to the distribution of mass within these rocks: 1. A rna p showing the general configuration of the
masses of Keweenawan mafic rocks can be prepared by subtracting the estimated gravitational effect of overlying sedimentary rock from the Bouguer anomaly map. ·
2. Mafic rocks are thin or absent over a ridge or upwarp of pre-Keweenawan rock that crosses the Bayfield Peninsula southwest of Ashland. This upwarp may connect with a gravity saddle at long N. 91° W. on the Minnesota shore to effect a separation of major lava basins-the thick section of mafic lavas in the Ashland syncline continues north into Minnesota, and thins in the vicinity of the Beaver Bay complex (fig. 1); the thick section of lavas above the Duluth Gabbro Complex northeast of the Beaver Bay complex is probably part of an-

E20 SHORTER CONTRIBUTIONS TO GENERAL GEOLOGY
other lava basin extending eastward beneath Lake Superior. It may be significant that the Beaver Bay complex itself adjoins the ridge of preKeweenawan rock, as do the intrusions near Mellen.
3. Distributions of sedimentary and mafic rock that produce maximum compatibility of surface geology, gravity data, and magnetic data suggest a thickness of 25,000-30,000 feet for the thickest part of the sedimentary wedge, under the bay northeast of Ashland.
4. The Duluth Gabbro Complex thins downdip beneath the middle Keweenawan lavas and may pinch out entirely in the vicinity of the Minnesota shore of Lake Superior.
SITUATION B: GRAVITY ANOMALIES DUE IN PART TO PRE-KEWEENAWAN ROCKS
In Situation A the differences in the Bouguer anomaly from place to place within the area of l{eweena wan rocks were assumed to be due entirely to the distribution of Keweenawan mafic and sedimentary rocks. Large positive Bouguer anomalies coincide with areas where the thickness of mafic rock is known to be large and prove that the assumption is rut least partly correct; however, the interpretation of some gravity features, particularly the negative anomalies, might be quite different if the pre-Keweenawan basement rock is not assumed to have a uniform density of 2.t>7. In general, removing the constraint of a uniform basement density opens the door to such a wide range of speculative possibilities that discussion is not constructive without more information than is now available. It is worthwhile, however, to consider briefly the suggestion that the major negative anomaly of the area is due, in part, to differences of gravity in the pre-Keweenawan basement complex.
A large negative gravity anomaly, elongate eastnortheast, lies within the a.rea of pre-l{eweenawan rocks in the southeastern part of the area of figure 2. This gravity low is clearly unrelated to anything in the Keweenawan sequence, except possibly Keweenawan granite, and proves the existence of important density contrasts in the basement rocks. Casual inspection of figure 2 suggests the possibility that this gravity low and the one north of Ashland are caused by the same large mass of low-density rock in the pre-Keweenawan basement; in other words, the two anomalies are parts of the same large anomaly, and the gravity high that separates them near Mellen on figure 2 is due solely to the local gravitational effect of the Keweenawan mafic rocks that reach the surface in that area. The station density of figure 2 is not high enough to rule out this possibility completely, but the details of the shape of the anomaly southeast of Mellen do not support it. Specifically, the
axis of the negative anomaly southeast of Mellen should lie much closer to the steeply dipping southeastern margin of the Keweenawan rocks; it is at least 9-10 miles south of that margin. The gentle gradient southeast of Mellen suggests that the rocks immediately below the Keweenawan rocks do not have exceptionally low density, so that even after subtraction of the positive influence of the l{eweenawan rocks, a positive area. would remain in the vicinity of Mellen separating the gravity low in the pre-l{eweenawan basement from the low north of Ashland. A gravity profile of the negative anomaly southeast of Mellen cannot be duplicated or even approximated by a gravity profile calculated using the following restrictions: All the observed gravity effects are due to the distribution of rocks within 60,000 feet of the surface; the boundary between the Keweenawan and older rocks dips steeply northward; the rocks underlying the bottom of the gravity low have the same density as the rocks between the bottom of the low and the base of the Keweenawan rocks; this last· condition is necessary if the negative anomaly southeast of Mellen is part of a single broad anomaly that also includes the low north of Ashland.
For the foregoing reasons, the low southeast of Mellen is useful as an indication that important gravity contrasts do exist in the basement, but it does not provide direct evidence for a connection between lowdensity basement rocks and the anomaly north . of Ashland. The correlation of density contrasts in the pre-l{eweenawan basement with specific Bouguer anomalies, therefore, must remain in the realm of speculation until other types of geophysical ·and geologic evidence specifically support it. For the present, it is clear that most of the gravity features of the area are readily explained by gravity contrasts within the I\::eweenawan sequence, and there is no positive reason for looking to a more complex origin involving the pre-l{eweenawan basement.
SUMMARY OF TECTONIC FEATURES
Figure 7 is a sketch showing the main tectonic features of the western Lake Superior region as derived above. These features belong to three genera.tions, and the high-angle intersections of some of them are a principal cause of structural complexity in the region.
Features of the youngest generation dominate the geologic map. They include the Ashland syncline and the faults parallel to it (Douglas fault, including its eastward projection, and the Lake Owen-Keweenaw( n fault). Because the faults dip toward the axis of the syncline, the block containing the syncline has the form of a keystone. In the latest movement, at least, the block has risen with respect to adjacent blocks. Craddock, Thiel, and Gross (1963, p. 6030) have called this

TECTONICS OF THE KEWEENAWAN BASIN, WESTERN LAKE SUPERIOR REGION E21
0 r:r m m <( (!)
STLOUIS
E S 0 T
10 0 10 20 MILES
LAVAS THICK?
1 0
I IRON L __ _,
I
ASHLAND I I
I I
FIGURE 7.-Major tectonic elements. Bedrock of shaded areas is middle Keweenawan lava. Hachured-dashed lines suggest general trend of isopachs of middle Keweenawan lavas; hachures point toward areas in which lava series is thick.
particular block the "St. Croix horst." From its synclinal structure and the fact that the Keweenawan rocks within the block are depressed with respect to the older Precambrian rocks outside the Keweenawan basin, one would expect the inward-dipping boundary faults of this "horst'' to have the movement sense of a graben. If these faults came into being as the boundary faults of grabens or rift valleys in which the Ke-
weenawan lava flows accumulated, the latest movements on them were opposite to the principal sense. As is shown by the following, however, these youngest faults locally lie athwart the trend of the troughs in which the lava series accumulated; therefore, it is more likely that they do not necessarily coincide with structural features that existed in middle Keweenawan time.
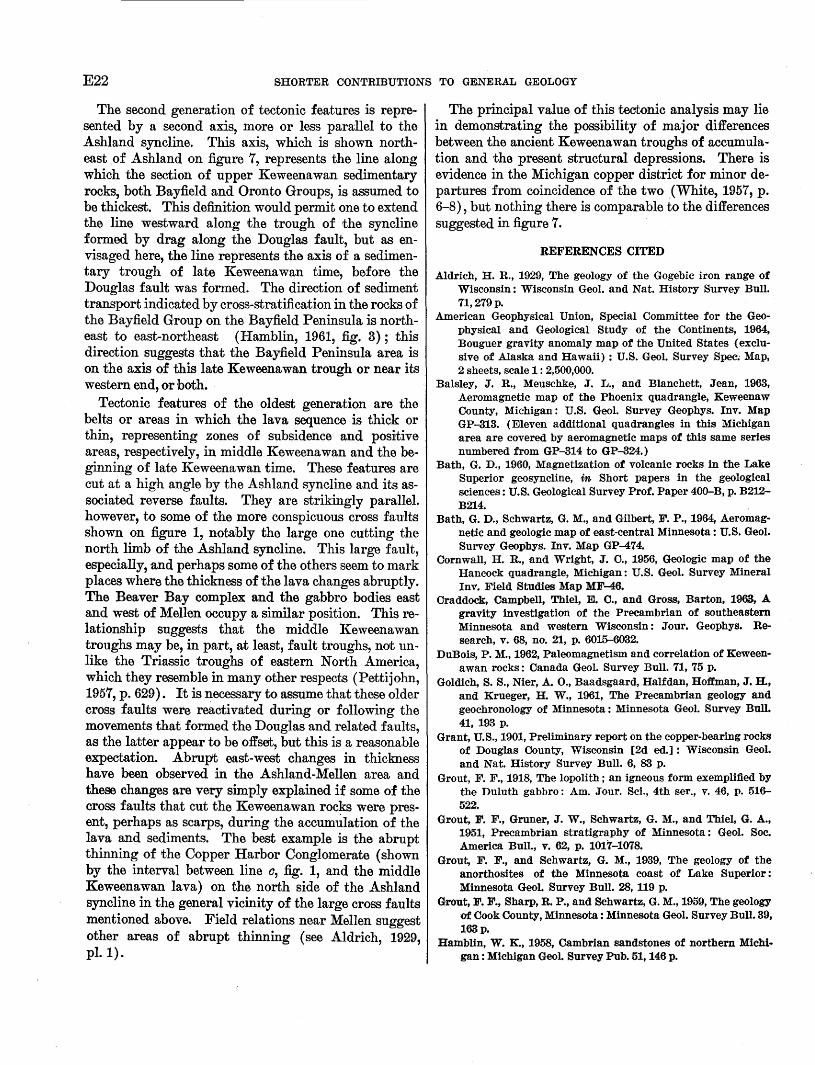
E22 SHORTER CONTRIBUTIONS TO GENERAL GEOLOGY
The second generation of tectonic features is represented by a second axis, more or less parallel to the Ashland syncline. This axis, which is shown northeast of Ashland on figure 7, represents the line along which the section of upper Keweenawan sedimentary rocks, both Bayfield and Oronto Groups, is assumed to be thickest. This definition would permit one to extend the line westward along the trough of the syncline formed by drag along the Douglas fault, but as envisaged here, the line represents the axis of a sedimentary trough of late Keweenawan time, before the Douglas fault was formed. The direction of sediment transport indicated by cross-stratification in the rocks of the Bayfield Group on the Bayfield Peninsula is northeast to east-northeast (Hamblin, 1961, fig. 3); this direction suggests that the Bayfield Peninsula area is on the axis of this late Keweenawan trough or near its western end, or both.
Tectonic features of the oldest generation are the belts or areas in which the lava sequence is thick or thin, representing zones of subsidence and positive areas, respectively, in middle Keweenawan and the beginning of late Keweenawan time. These features are cut at a high angle by the Ashland syncline and its associated reverse faults. They are strikingly parallel. however, to some of the more conspicuous cross faults shown on figure 1, notably the large one cuUing the north limb of the Ashland syncline. This large fault, especially, and perhaps some of the others seem to mark places where the thickness of the lava changes abruptly. The Beaver Bay complex and the gabbro bodies east and west of Mellen occupy a similar position. This relationship suggests that the middle Keweenawan troughs may be, in part, at least, fault troughs, not unlike the Triassic troughs of eastern North America, which they resemble in many other respects (Pettijohn, 1957, p. 629). It is necessary to assume that these older cross faults were reactivated during or following the movements that formed the Douglas and related faults, as the latter appear to be offset, but this is a reasonable expectation. Abrupt east-west changes in thickness have been observed in the Ashland-Mellen area and these changes ·are very simply explained if some of the cross faults that cut the Keweenawan rocks were present, perhaps as scarps, during the accumulation of the lava and sediments. The best example is the abrupt thinning of the Copper Harbor Conglomerate (shown by the interval between line a, fig. 1, and the middle Keweenawan lava) on the north side of the Ashland syncline in the general vicinity of the large cross faults mentioned above. Field relations near Mellen suggest other areas of abrupt thinning (see Aldrich, 1929, pl. 1).
The principal value of this tectonic analysis may lie in demonstrating the possibility of major differences between the ancient Keweenawan troughs of accumulation and the present structural depressions. There is evidence in the Michigan copper district for minor departures from coincidence of the two (White, 1957, p. 6-8) , but nothing there is comparable to the differences suggested in figure 7.
REFERENCES CITED
Aldrich, H. R., 1929, The geology of the Gogebic iron range of Wisconsin: Wisconsin Geol. and Nat. History Survey Bull. 71,279p.
American Geophysical Union, Special Committee for the Geophysical and Geological Study of the Continents, 1964, Bouguer gravity anomaly map of the United States ( exclusive of Alaska and Hawaii): U.S. Geol. Survey Spec~ Map, 2 sheets, scale 1 : 2,500,000.
Balsley, J. R., Meuschke, J. L., and Blanchett, Jean, 1963, Aeromagnetic map of the Phoenix quadrangle, Keweenaw County, Michigan: U.S. Geol. Survey Geophys. Inv. Map GP-313. (Eleven additional quadrangles in this Michigan area are covered by aeromagnetic maps of this same series numbered from GP-314 to GP-324.)
Bath, G. D., 1960, Magnetization of volcanic rocks in the Lake Superior geosyncline, in Short papers in the geological sciences: U.S. Geological Survey Prof. Paper 400-B, p. B212-B214.
Bath, G. D., Schwartz, G. M., and Gilbert, F. P., 1964, Aeromagnetic and geologic map of east-central Minnesota: U.S. Geol. Survey Geophys. Inv. Map GP-474.
Cornwall, H. R., and Wright, J. C., 1956, Geologic map of the Hancock quadrangle, Michigan: U.S. Geol. Survey Mineral Inv. Field Studies Map MF-46.
Craddock, Campbell, Thiel, E. C., and Gross, Barton, 1968, A gravity investigation of the Precambrian of southeastern Minnesota and western Wisconsin: Jour. Geophys. Research, v. 68, no. 21, p. 6015-6032.
DuBois, P. M., 1962, Paleomagnetism and correlation of Keweenawan rocks: Canada Geol. Survey Bull. 71, 75 p.
Goldich, S. S., Nier, A. 0., Baadsgaard, Halfdan, Hoffman, J. H., and Krueger, H. W., 1961, The Precambrian geology and geochronology of Minnesota : Minnesota Geol. Survey Bull. 41, 193 p.
Grant, U.S., 1901, Preliminary report on the copper-bearing rocks of Douglas County, Wisconsin [2d ed.] : Wisconsin Geol. and Nat. History Survey Bull. 6, 83 p.
Grout, F. F., 1918, The lopolith; an igneous form exemplified by the Duluth gabbro: Am. Jour. Sci., 4th ser., v. 46, p. 516-522.
Grout, F. F., Gruner, J. W., Schwartz, G. M., and Thiel, G. A., 1951, Precambrian stratigraphy of Minnesota : Geol. Soc. America Bull., v. 62, p. 1017-1078.
Grout, F. F., and Schwartz, G. M., 1939, The geology of the anorthosites of the Minnesota coast of Lake Superior: Minnesota Geol. Survey Bull. 28, 119 p.
Grout, F. F., Sharp, R. P., and Schwartz, G. M., 1959, The geology of Cook County, Minnesota: Minnesota Geol. Survey Bull. 39, 163p.
Hamblin, W. K., 1958, Cambrian sandstones of northern Michigan: Michigan Geol. Survey Pub. 51, 146 p.

TECTONICS OF THE KEWEENAWAN BASIN, WESTE.RN LAKE SUPERIOR REGION E23
Hamblin, W. K., 1961, Paleogeographic evolution of the Lake Superior region from Late Keweenawan to Late Cambrian time: Geol. Soc. America Bull., v. 72, p. 1-18.
Henderson, J. R., and Meuschke, J. L., 1952a, Total intensity aeromagnetic and geologic map of part of southeastern St. Louis County, Minnesota: U.S. Geol. Survey Geophys. Inv. MapGP-91.
---1952b, Total intensity aeromagnetic and geologic map of east-central St. Louis County, Minnesota: U.S. Geol. Survey Geophys. Inv. Map GP-92.
ljrving, R.D., 1883, the copper-bearing rocks of Lake Superior: U.S. Geol. Survey Mon. 5, 464 p.
Kirby, J. R., and P~tty, A. J., 1966, Regional aeromagnetic map of western Lake Superior and a4jacent parts of Minnesota, Michigan, and Wisconsin: U.S. Geol. Survey Geophys. Inv. Map. GP-556.
ieighton, M. W., 19. 54, Petrogenesis of a gabbro-granophyre complex in northern Wisconsin : Geol. Soc. America Bull.,
1 V, 65, p. 401-442. Jl.eith, C. K., Lund, R. J., and Leith, Andrew, 1935, Pre-Cam
brian rocks of the Lake Superior region: U.S. Geol. Survey Prof. Paper 184, 34 p.
Moerlein, G. A., 1963, Structure and stratigraphy of the upper Keweenawan rocks in northwestern Wisconsin [abs.]: Duluth, Inst. Lake Superior Geology, 1963, p. 11.
J?ettijohn, F. J., 1957, Sedimentary rocks [2d ed.] : New York, Harper & Bros., 718 p.
Sandberg, A. E., 1938, Section across Keweenawan lavas at Duluth, Minnesota: Geol. Soc. America Bull., v. 49, p. 795-830.
Schwartz, G. M., 1949, The geology of the Duluth metropolitan area: Minnesota Geol. Survey Bull. 33,136 p.
Stoiber, R. E., and Davidson, E. S., 1959, Amygdule mineral zoning in the Portage Lake lava series, Michigan copper district: Econ. Geology, v. 54, p. 1250-1277, 1444-1460.
Taylor, R. B, 1964, Geology of the Duluth Gabbro complex near Duluth, Minnesota : Minnesota Geol. Survey Bull. 44, 68 p.
Thiel, Edward, 1956, Correlation of gravity anomalies with the Keweenawan geology of Wisconsin and Minnesota : Geol. Soc. America Bull., v. 67, p.1079-1104.
Thwaites, F. T., 1912, Sandstones of the Wisconsin coast of Lake Superior: Wisconsin Geol. and Nat. History Survey Bull. 25, 1i7 p.
---1935, Introduction to road log for field trip from Duluth, Minnesota, to Ironwood, Michigan : Kansas Geol. Soc. Guidebook, 9th Ann. Field Conf., p. 221-228.
---1940, Bur~ed pre-Cambrian of Wisconsin : Wisconsin Acad. Sci., Arts, and Letters Trans., v. 32, p. 233-242.
Tyler, S. A., Marsden, R. W., Grout, F. F., and Thiel, G. A., 1940, Studies of the Lake Superior pre-Cambrian by accessorymineral methods: Geol. Soc. America Bull., v. 51, p. 1429-1537.
1
Van Hise, C. R., and Leith, C. K., 1911, The geology of the Lake Superior region: U.S. Geol. Survey Mon. 52, 641 p.
White, W. S., 1957, Regional structural setting of the Michigan native copper district, in Sn~lgrove, A. K., ed., Geological exploration-Institute on Lake Superior geology: Houghton, Michigan Coli. Mining and Technology Press, p. 3-16.
White, W. S., and Wright, J. C., 1960, Lithofacies of the Copper Harbor conglomerate, northern Michigan: U.S. Geol. Survey Prof. Paper 400-B, p. B5-B8.
Winchell, N. H., 1897, Some new features in the geology of northeastern Minnesota: Am. Geologist, v. 20, p. 41-51.
11.5. GIOVERNMENT PRINTINi OFFICEoltll&