Embed Size (px)
Citation preview
Tectonic Influences on Ground Water Quality:Insight from Complementary Methodsby Sam Earman1,2, Brian J.O.L. McPherson2,3, Fred M. Phillips4, Steve Ralser2,5, James M. Herrin6,7 and James Broska8
AbstractA study using multiple techniques provided insight into tectonic influences on ground water systems; the re-
sults can help to understand ground water systems in the tectonically active western United States and other partsof the world. Ground water in the San Bernardino Valley (Arizona, United States and Sonora, Mexico) is the mainsource of water for domestic use, cattle ranching (the primary industry), and the preservation of threatened andendangered species. To improve the understanding of ground water occurrence, movement, and sustainability, aninvestigation was conducted using a number of complementary methods, including major ion geochemistry, iso-tope hydrology, analysis of gases dissolved in ground water, aquifer testing, geophysics, and an examination ofsurface and subsurface geology. By combining information from multiple lines of investigation, a more completepicture of the basin hydrogeology was assembled than would have been possible using fewer methods. The resultsshow that the hydrogeology of the San Bernardino Valley is markedly different than that of its four neighboringbasins in the United States. The differences include water quality, chemical evolution, storage, and residence time.The differences result from the locally unique geology of the San Bernardino Valley, which is due to the presenceof a magmatically active accommodation zone (a zone separating two regions of normal faults with oppositedips). The geological differences and the resultant hydrological differences between the San Bernardino Valleyand its neighboring basins may serve as a model for the distinctive nature of chemical evolution of ground waterin other basins with locally distinct tectonic histories.
IntroductionRecent work (Newell et al. 2005; Earman et al. 2005)
shows that tectonic activity can impact ground water sys-tems, including the chemical composition of the water.Because many basins in the western United States andother parts of the world are located in tectonically activeareas, understanding the role of tectonics in shapingground water systems is important.
The San Bernardino Valley, in southeastern Arizona,United States, and northern Sonora, Mexico (Figure 1) islocated in the Basin and Range physiographic province.Ground water in the basin is the only source for domesticsupply and is critical to cattle ranching (the main revenuesource for valley residents). Ground water is also used tomaintain artificial streams and ponds in the San Bernardi-no National Wildlife Refuge (SBNWR; Figure 2A) thatprovide habitat for several species of endangered andthreatened fishes. Ground water in the San BernardinoValley is obtained almost exclusively from alluvial basin
1Corresponding author: Division of Hydrologic Sciences,Desert Research Institute, Reno, NV 89512; (775) 673-7415; fax:(775) 673-7363; [email protected]
2Formerly at: Earth and Environmental Science Department,New Mexico Institute of Mining and Technology, Socorro, NM87801.
3Department of Civil & Environmental Engineering, Universityof Utah, Salt Lake City, UT 84112.
4Earth and Environmental Science Department, New MexicoInstitute of Mining and Technology, Socorro, NM 87801.
5Department of Geology & Geophysics, University of Wisconsin-Madison, Madison, WI 53716.
6Chesapeake Energy Corporation, Oklahoma City, OK 73154.7Formerly at: Petroleum Engineering Department, New Mexico
Institute of Mining and Technology, Socorro, NM 87801.8Branch of Water Resources, U.S. Fish and Wildlife Service,
Albuquerque, NM 87103.Received September 2007, accepted October 2007.Copyright ª 2008 The Author(s)Journal compilationª2008National GroundWaterAssociation.doi: 10.1111/j.1745-6584.2007.00402.x
GROUND WATER—2008 1
fill; only two wells used for water production are knownto penetrate consolidated rock beneath the alluvium. Anynew pumping to supply the nearby towns of Douglas, Ari-zona and Agua Prieta, Sonora (1980 population ~29,000;2005 population ~200,000) has the potential to affectwater availability. To gain a better understanding ofground water supply and its sustainability, especially withregard to maintaining endangered species habitat at theSBNWR, an investigation using a number of complemen-tary methods (including major ion geochemistry, isotopehydrology, aquifer testing, geophysics, and an examina-tion of surface and subsurface geology) was conducted;the results are discussed in the first part of this article.
An examination of the San Bernardino Valley’shydrogeology revealed that the basin’s ground watercharacteristics (most notably water chemistry) differedmarkedly from those of water in the neighboring basins.Because the San Bernardino Valley and its four neighbor-ing basins in the United States derive their fill frommountains of similar mineralogy, it seems unusual thatwater chemistry would vary so much between the SanBernardino Valley and its neighbors. Newell et al. (2005)and Earman et al. (2005) show that tectonic processes can
influence water quality in the tectonically active westernUnited States. Because lithologic differences between thesource areas for basin fill cannot explain the difference inwater chemistry, it was hypothesized that tectonic factorswere the cause of the unique water chemistry in the SanBernardino Valley. An examination of this hypothesis isgiven in the second half of the article.
Although the water resources assessment and theexamination of water chemistry are somewhat disparatetopics, our work suggests that tectonic forces can affectboth water chemistry and water supply. In addition, oneof the goals of the special issue for which this article wasprepared is to facilitate management and manipulation ofarid basins to satisfy competing water quantity and waterquality demands. As such, we present information onboth water supply and water quality issues.
Materials and MethodsWater samples were collected from a number of
wells and springs in the basin and from springs andstreams in the surrounding highlands (Figure 2B; TableS1 and Table 1). Samples were analyzed for one or more
200 400 6000Scale, km
N
SBVDG
WCX
SS
ANI
50 100 1500Scale, km
J
T
Granite orRhyolite
Basalt
Sedimentary
DG
WCX
SS
SBB
ANIQuaternaryalluvium
20 40 600Scale, km
N
A
B
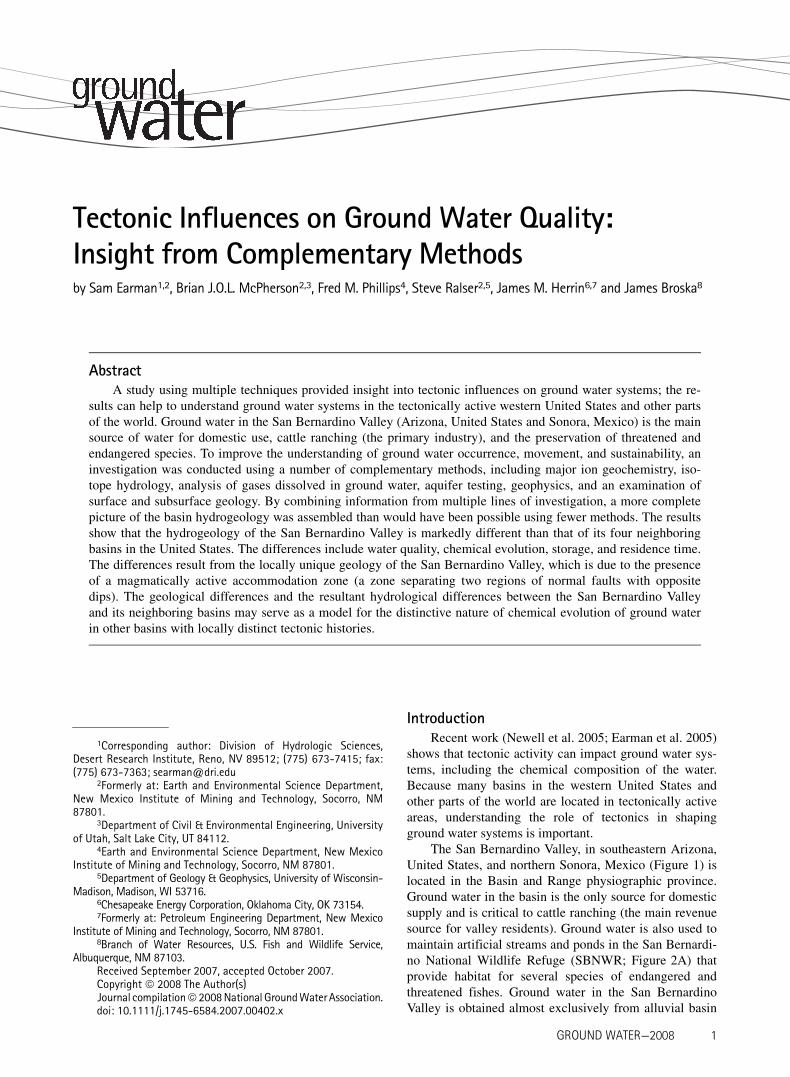
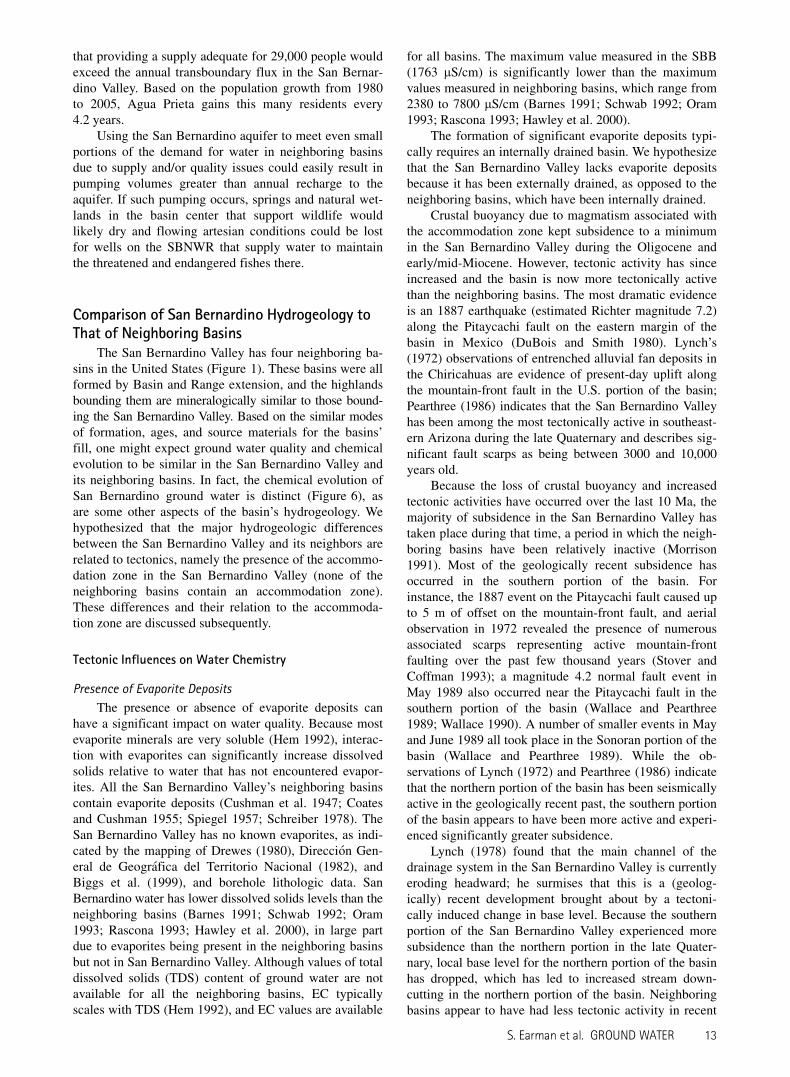
Figure 1. (A) Location of the San Bernardino Valley (SBV) and its neighboring basins. Left: map of Arizona and NewMexico showing areas of significant Cenozoic volcanism (after Aldrich and Laughlin 1984); gray bands indicate locations ofregional structural lineaments (J: Jemez lineament, T: Texas lineament belt; lineament locations after Aldrich and Laugh-lin [1984] and Wertz [1970]). Right: zoom map showing basin boundaries SBV and its neighboring basins (DG ¼ DouglasBasin, WCX ¼ Willcox Basin, SS ¼ San Simon subbasin of the Gila Basin, ANI ¼ Animas Basin). (B) Generalized geologicmap showing lithology of the San Bernardino Basin, its neighboring basins, and their bounding ranges (after Anderson etal. 1997; Hirschberg and Pitts 2000). The area covered by the map is bounded by latitudes 31�409N and 33�N and longitudes108�309Wand 111�W.
2 S. Earman et al. GROUND WATER
of the following: d18O and dD, major ion chemistry, dis-solved gas content, 14C activity, d13C, and 3H activity. Inaddition, parameters such as pH, electrical conductivity(EC), and temperature were measured in the field at the
time of sampling. Samples for 14C activity and d13C werecollected from a set of wells picked to best approximatea flowpath from the Chiricahua mountains to the basincenter (Figures 2B and 2C). d18O and dD (relative toVienna Standard Mean Ocean Water [VSMOW] valuesreported here are expressed in & relative to VSMOWsuch that the dD value of Standard Light Antarctic Pre-cipitation is 2428&) were determined via gas sourcemass spectrometry. All d18O results were obtained viaanalysis of CO2 gas that had been equilibrated with a sam-ple aliquot (Socki et al. 1992; Clark and Fritz 1997). AlldD values were obtained by analyzing hydrogen gasformed during an oxidation-reduction reaction (Clark andFritz 1997). During the initial portion of the study, asample aliquot was reacted with zinc shavings at 450 �Cfor 30 min (Coleman et al. 1982); later, sample aliquotswere reacted with powdered chromium at 750 �C for 60 s(Nelson and Dettman 2001). The change in methodologycoincided with the transition to a new mass spectrometer.Multiple samples run using the old instrument and meth-odology were rerun for both d18O and dD on the newinstrument to ensure that values measured with the newinstrument and methodology were identical within analyt-ical error. Major ion chemistry samples were collected inclean, field-rinsed containers; one sample was collectedin a 1-L container and left unpreserved, and a secondsample (for metals analysis) of 250 mL was preserved inthe field by addition of trace metal-grade nitric acid suchthat the pH was less than 2. Radiocarbon samples werecollected via field precipiation (Clark and Fritz 1997), withapproximately 75 L of water collected at each site. The pHof each sample was raised above 10 by addition of NaOH,carbon was precipitated by addition of BaCO3, and floc-culation of the precipitate was enhanced by addition ofPercol 156. After being allowed to settle for at least 24 h,the precipitate was collected and submitted for determina-tion of 14C activity by scintillation counting and d13C bymass spectrometry (Clark and Fritz 1997). Dissolved gassamples were collected using passive diffusion samplersthat were exposed to flowing source water for a minimumof 48 h, allowing collection of duplicate gas samples incopper tubing that was sealed on site using a cold-weldtool. Precautions were taken to avoid atmospheric con-tamination during sample collection. Samples were ana-lyzed via quadrupole mass spectrometer at the DissolvedGas Lab of the University of Utah (for further descriptionof sample collection and analysis procedures, see Manning[2002]). Bouguer gravity anomaly was measured witha Worden-type gravimeter, with compensation made fordrift and influences from surrounding terrain. The data col-lected for this study were incorporated with data fromLynch (1972) and R. Keller (personal communication,2001).
Background
ClimateIn the San Bernardino Valley, average daily tem-
perature ranges from about 14 �C to 16.5 �C, dependingon altitude (Biggs et al. 1999; Hawley et al. 2000).
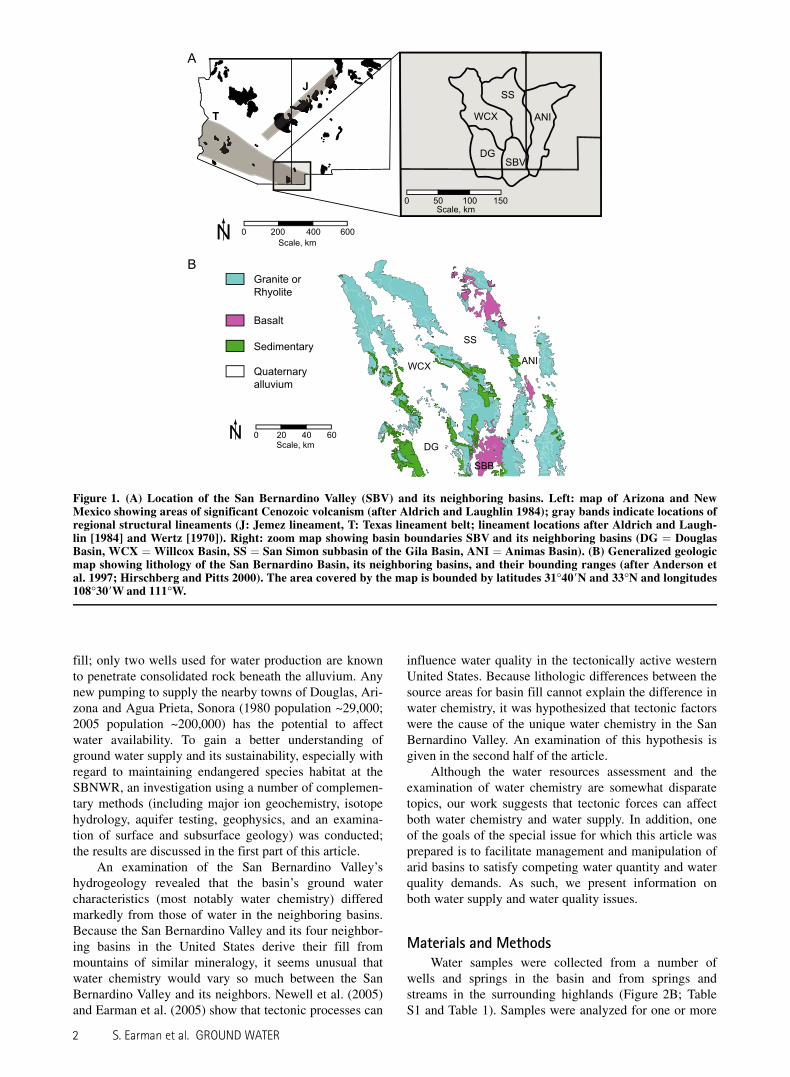
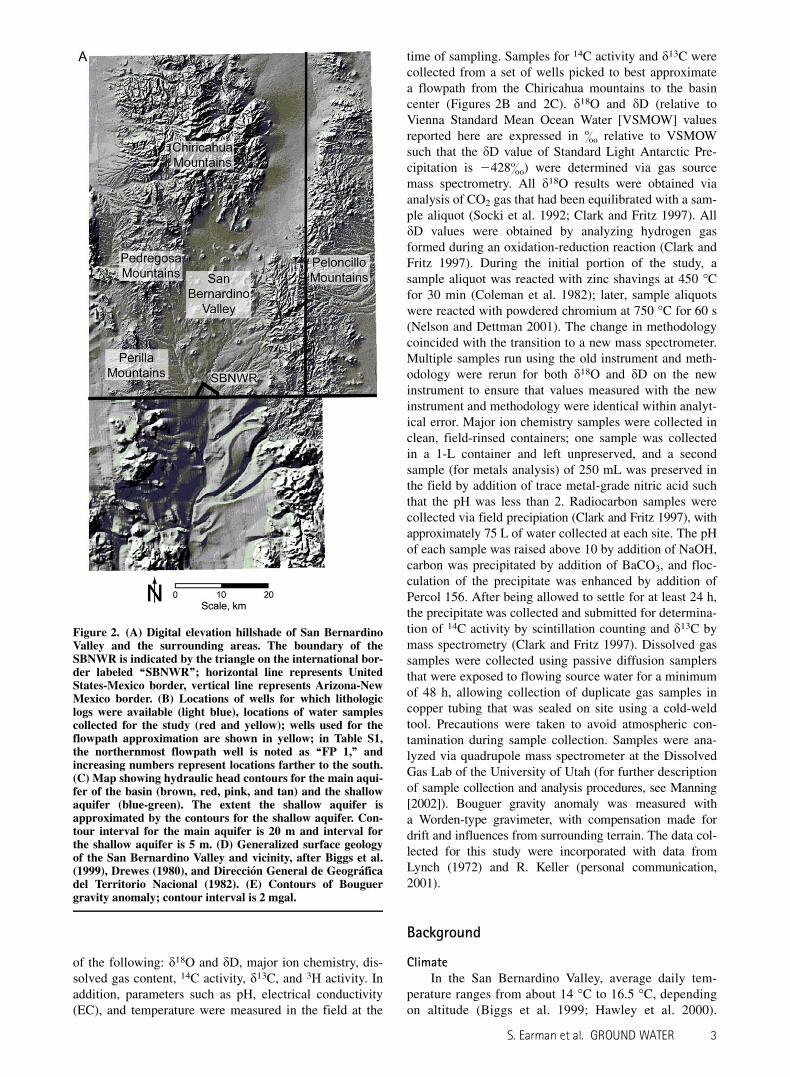
Figure 2. (A) Digital elevation hillshade of San BernardinoValley and the surrounding areas. The boundary of theSBNWR is indicated by the triangle on the international bor-der labeled ‘‘SBNWR’’; horizontal line represents UnitedStates-Mexico border, vertical line represents Arizona-NewMexico border. (B) Locations of wells for which lithologiclogs were available (light blue), locations of water samplescollected for the study (red and yellow); wells used for theflowpath approximation are shown in yellow; in Table S1,the northernmost flowpath well is noted as ‘‘FP 1,’’ andincreasing numbers represent locations farther to the south.(C) Map showing hydraulic head contours for the main aqui-fer of the basin (brown, red, pink, and tan) and the shallowaquifer (blue-green). The extent the shallow aquifer isapproximated by the contours for the shallow aquifer. Con-tour interval for the main aquifer is 20 m and interval forthe shallow aquifer is 5 m. (D) Generalized surface geologyof the San Bernardino Valley and vicinity, after Biggs et al.(1999), Drewes (1980), and Direccion General de Geograficadel Territorio Nacional (1982). (E) Contours of Bouguergravity anomaly; contour interval is 2 mgal.
S. Earman et al. GROUND WATER 3
According to the Western Regional Climate Center(http://wrcc.dri.edu), average annual precipitation variesfrom 200 to 410 mm depending on location. In themountain ranges bounding the valley, precipitation canbe as low as that observed in the basin (Perilla Moun-tains) to above 910 mm/year in the Chiricahua Moun-tains.
Likely Importance of Mountain Precipitation and Snowto Ground Water Recharge
As described previously, the mountains bounding thevalley receive significantly more precipitation than thevalley floors. Because valley floors have low precipitationrates, high temperatures, and are inhabited by water-
efficient desert plants, mountain precipitation providesmuch of the water for ground water recharge in many partsof the western United States. Although the majority (~70%)of mountain precipitation falls in the form of rain in theranges surrounding the San Bernardino Valley, Wilson et al.(1980) provide a summary of rain and snow processes inwestern mountains and conclude that snow can be moreimportant to recharge than suggested by its contributionto average annual precipitation. Most rain in this areafalls in relatively brief but intense monsoonal stormsduring the summer, while infiltration from snowmelt oc-curs as a fairly uniform pulse in the spring. This allowswetting of the soil to be followed by further infiltrationin the case of snowmelt, while the soil will dry between
Figure 2. Continued.
4 S. Earman et al. GROUND WATER
rain events. In addition, the input of water from snowmeltoccurs when potential evapotranspiration is low becausetemperatures are cool and vegetation is dormant; rainfall
more typically occurs when temperatures are high andvegetation is active, leading to high potential evapotrans-piration.
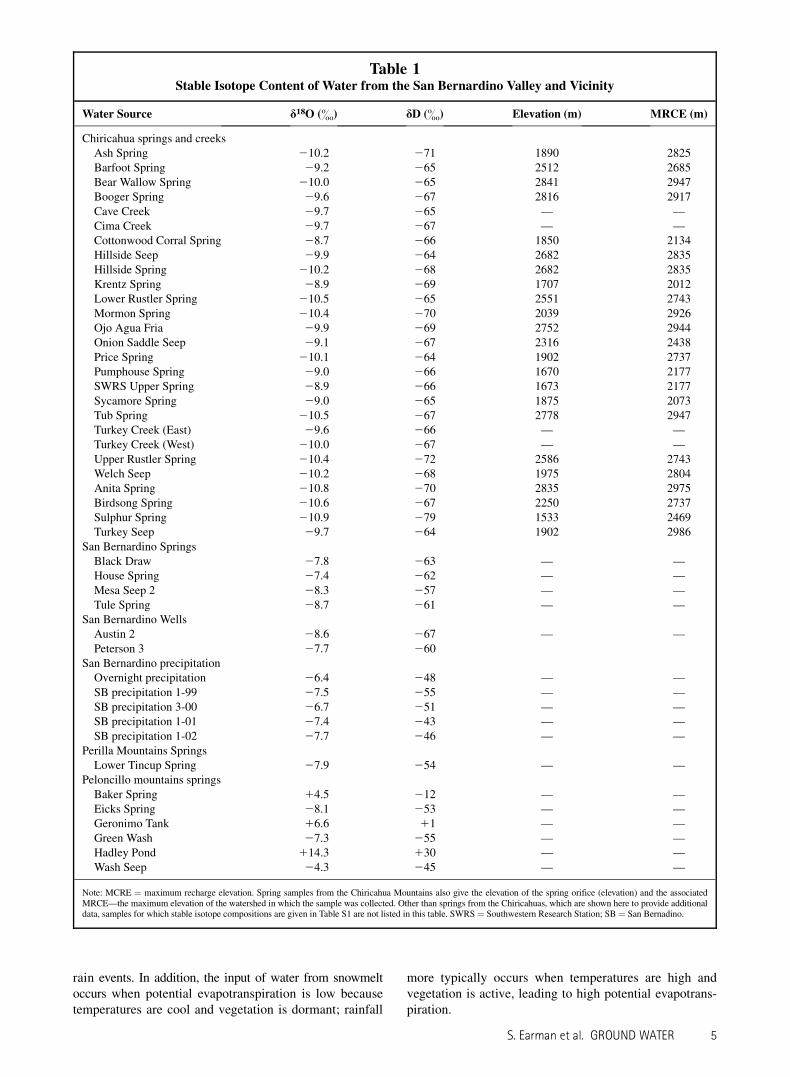
Table 1Stable Isotope Content of Water from the San Bernardino Valley and Vicinity
Water Source d18O (&) dD (&) Elevation (m) MRCE (m)
Chiricahua springs and creeksAsh Spring 210.2 271 1890 2825Barfoot Spring 29.2 265 2512 2685Bear Wallow Spring 210.0 265 2841 2947Booger Spring 29.6 267 2816 2917Cave Creek 29.7 265 — —Cima Creek 29.7 267 — —Cottonwood Corral Spring 28.7 266 1850 2134Hillside Seep 29.9 264 2682 2835Hillside Spring 210.2 268 2682 2835Krentz Spring 28.9 269 1707 2012Lower Rustler Spring 210.5 265 2551 2743Mormon Spring 210.4 270 2039 2926Ojo Agua Fria 29.9 269 2752 2944Onion Saddle Seep 29.1 267 2316 2438Price Spring 210.1 264 1902 2737Pumphouse Spring 29.0 266 1670 2177SWRS Upper Spring 28.9 266 1673 2177Sycamore Spring 29.0 265 1875 2073Tub Spring 210.5 267 2778 2947Turkey Creek (East) 29.6 266 — —Turkey Creek (West) 210.0 267 — —Upper Rustler Spring 210.4 272 2586 2743Welch Seep 210.2 268 1975 2804Anita Spring 210.8 270 2835 2975Birdsong Spring 210.6 267 2250 2737Sulphur Spring 210.9 279 1533 2469Turkey Seep 29.7 264 1902 2986
San Bernardino SpringsBlack Draw 27.8 263 — —House Spring 27.4 262 — —Mesa Seep 2 28.3 257 — —Tule Spring 28.7 261 — —
San Bernardino WellsAustin 2 28.6 267 — —Peterson 3 27.7 260
San Bernardino precipitationOvernight precipitation 26.4 248 — —SB precipitation 1-99 27.5 255 — —SB precipitation 3-00 26.7 251 — —SB precipitation 1-01 27.4 243 — —SB precipitation 1-02 27.7 246 — —
Perilla Mountains SpringsLower Tincup Spring 27.9 254 — —
Peloncillo mountains springsBaker Spring 14.5 212 — —Eicks Spring 28.1 253 — —Geronimo Tank 16.6 11 — —Green Wash 27.3 255 — —Hadley Pond 114.3 130 — —Wash Seep 24.3 245 — —
Note: MCRE ¼ maximum recharge elevation. Spring samples from the Chiricahua Mountains also give the elevation of the spring orifice (elevation) and the associatedMRCE—the maximum elevation of the watershed in which the sample was collected. Other than springs from the Chiricahuas, which are shown here to provide additionaldata, samples for which stable isotope compositions are given in Table S1 are not listed in this table. SWRS ¼ Southwestern Research Station; SB ¼ San Bernadino.
S. Earman et al. GROUND WATER 5
Geology
Surrounding Mountain Ranges
The ranges bounding the San Bernardino Valley arepredominantly rhyolitic in composition; rhyolitic tuff andrhyolite are the most common units found in these ranges(Figure 2D). In addition to the igneous rocks, there area number of Cretaceous and Paleozoic sedimentary unitspresent; these rocks are primarily carbonates, predomi-nantly limestone (Drewes 1980).
San Bernardino Valley
The San Bernardino Valley’s formation is the result ofBasin and Range tectonic activity from the early Oligocenethrough the present (Lynch 1972; Drewes 1981). The fillmaterial in the basin is primarily composed of alluvial mate-rial, but the southern two-thirds of the northern portion ofthe basin (we define the ‘‘northern portion’’ of the basin asextending from the northern boundary of the basin to ~8 kmsouth of the international border) contains significantbasalts, as shown both by lithologic logs (Figure 2B) andsurface mapping (Drewes 1980; Direccion General deGeografica del Territorio Nacional 1982; Biggs et al. 1999).
Nearly all the alluvial material in the basin fill isderived from the mountains bounding the basin; reflectingthe composition of these ranges, it is predominantly rhyo-litic, but some zones received sediment from montane sedi-mentary units and thus contain significant proportions ofcarbonate minerals (Drewes 1980; du Bray et al. 1997;Biggs et al. 1999). Numerous clay deposits derived fromweathering of the basaltic or rhyolitic sediments are presentin the basin fill. In addition to small deposits from localweathering, a lacustrine clay unit is present in the subsurfacenear the basin center (Longsworth 1991; Davis et al. 1997).
The valley floor basalts range in age from 3.6 to0.26 million years (Ma) (there are older basalts on theflanks of bounding mountain ranges as old as 9 Ma); theycover an area of approximately 850 km2 at the surface,but most individual flows cover less than 5 km2. Theyounger basalt flows are typically less than 3 m thick, butthe older basalts tend to be present in thicker deposits(Lynch 1972). Well logs show that basalts are common asinterbeds in the basin fill in the southern two-thirds of thenorthern portion of the basin.
In the majority of the San Bernardino Valley, themain aquifer of the basin is a single, unconfined basin-fillaquifer. The lacustrine clay near the basin center servesas a confining unit for a small portion of the main aquifer(a number of flowing artesian wells are present in the areanear the international border) and also forms the base ofa shallower, unconfined aquifer. In the remainder of thisarticle, unless specific mention to the contrary is made,all mentions of ground water or an aquifer will be refer-ring to the main aquifer and/or the water it contains.
Hydrogeology
Basin StructureThe structure of the basin was analyzed by examin-
ing the surficial geology (Figure 2D, based on Drewes
1980; Direccion General de Geografica del TerritorioNacional 1982; Biggs et al. 1999); subsurface lithology(using well logs obtained from the Arizona Department ofWater Resources and the Arizona Oil and Gas Conserva-tion Commission, Figure 2B); descriptions of basin struc-ture (from Drewes 1980, 1981; Biggs et al. 1999); theBouguer gravity anomaly (Figure 2E); and hillshades ofdigital elevation models.
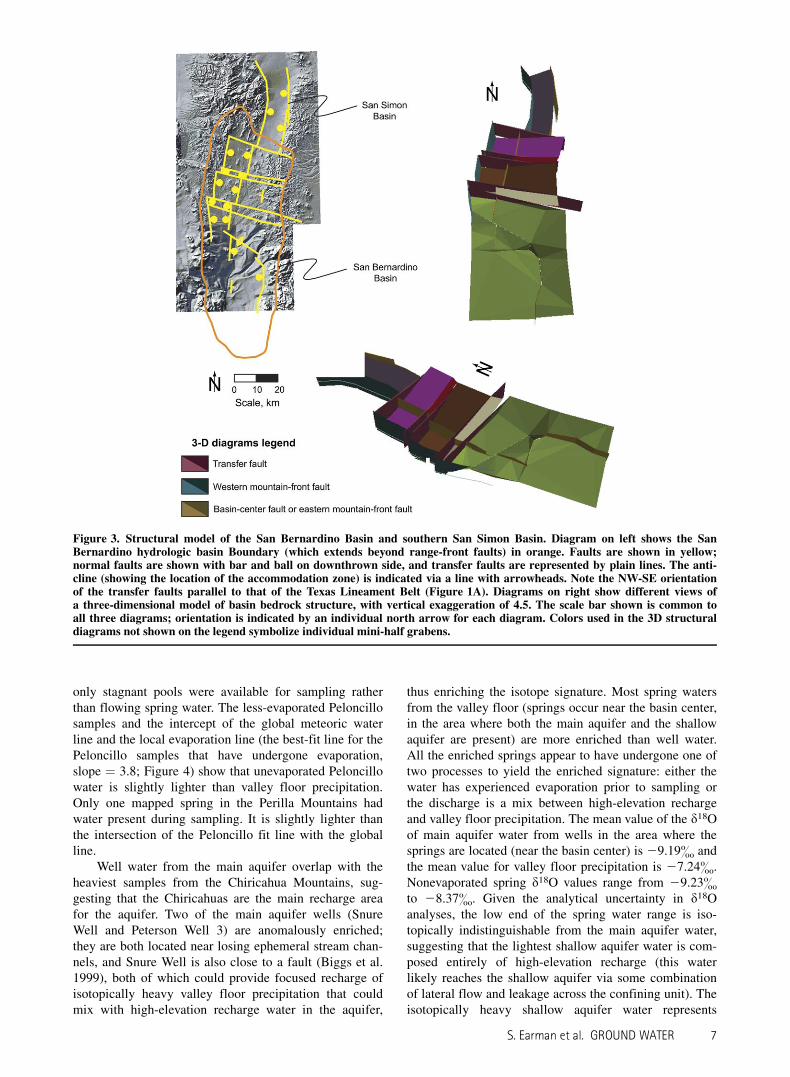
Based on our interpretation of these data, the north-ern portion of the basin is a half graben dipping to thewest, while the southern portion is a half graben dipping tothe east (Figure 3). Our analysis shows the San BernardinoBasin is offset from the San Simon Basin to the north bya transfer fault (a strike-slip fault that facilitates the trans-fer of strain between two extended domains that sharea common strike but are offset), and the west-dipping halfgraben in the northern portion of San Bernardino Valleyis split into ‘‘mini-half grabens’’ by four other transferfaults. All five transfer faults strike NW-SE, aligned withthe regional structural lineament intersecting the basin(Figure 1A). The area separating the northern and southernportions of the basin is a boundary in three senses: itseparates two bedrock dip domains, it separates an areathat experienced significant basaltic volcanism in theCenozoic from an area that has experienced minimalbasaltic volcanism, and it separates an area with distinctNW-SE transfer faults from an area lacking such features.
This boundary is an accommodation zone, definedby Faulds and Varga (1998) as a belt ‘‘of overlapping faultterminations [that] can separate either systems of uni-formly dipping normal faults or adjacent domains ofoppositely dipping normal faults.’’ Based on the geometryof the San Bernardino accommodation zone, it is classifiedas an oblique antithetic anticlinal accommodation zoneusing Faulds and Varga’s (1998) terminology. Stewart et al.(1998) identify more than 60 accommodation zones in thewestern United States; more than two-thirds of the accom-modation zones identified in the Basin and Range Provinceare associated with major volcanic fields (Faulds andVarga 1998). The fact that the San Bernardino accommo-dation zone marks the southern boundary of widespreadbasaltic volcanism suggests that the basalts are related tothe accommodation zone; therefore, the accommodationzone is described as ‘‘magmatically active.’’
Ground Water Source Areas
Contribution of Bounding Ranges and Valley FloorPrecipitation
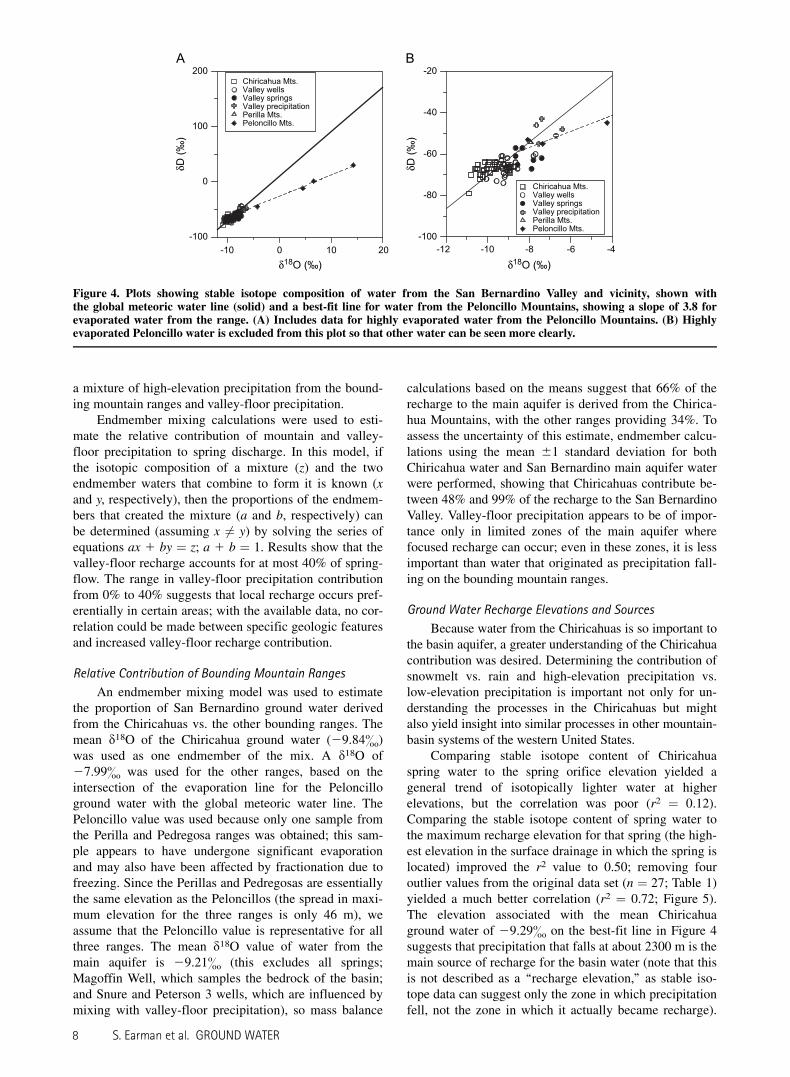
Stable isotope data from the mountain ranges surround-ing the San Bernardino Valley, valley floor precipitation,and wells and springs located on the San BernardinoValley floor are shown in Figure 4. Water from the Chiri-cahua Mountains is the most isotopically depleted, asexpected based on their high elevation (maximum of2975 m above sea level [asl]) compared to the other ranges(maximum elevations of 1966, 1993, and 1947 m asl forthe Peloncillo, Pedregosa, and Perilla ranges, respectively).
Some Peloncillo waters have undergone significantevaporation, likely due to the fact that some of the sam-ples were collected during a drought, and, as a result,
6 S. Earman et al. GROUND WATER
only stagnant pools were available for sampling ratherthan flowing spring water. The less-evaporated Peloncillosamples and the intercept of the global meteoric waterline and the local evaporation line (the best-fit line for thePeloncillo samples that have undergone evaporation,slope ¼ 3.8; Figure 4) show that unevaporated Peloncillowater is slightly lighter than valley floor precipitation.Only one mapped spring in the Perilla Mountains hadwater present during sampling. It is slightly lighter thanthe intersection of the Peloncillo fit line with the globalline.
Well water from the main aquifer overlap with theheaviest samples from the Chiricahua Mountains, sug-gesting that the Chiricahuas are the main recharge areafor the aquifer. Two of the main aquifer wells (SnureWell and Peterson Well 3) are anomalously enriched;they are both located near losing ephemeral stream chan-nels, and Snure Well is also close to a fault (Biggs et al.1999), both of which could provide focused recharge ofisotopically heavy valley floor precipitation that couldmix with high-elevation recharge water in the aquifer,
thus enriching the isotope signature. Most spring watersfrom the valley floor (springs occur near the basin center,in the area where both the main aquifer and the shallowaquifer are present) are more enriched than well water.All the enriched springs appear to have undergone one oftwo processes to yield the enriched signature: either thewater has experienced evaporation prior to sampling orthe discharge is a mix between high-elevation rechargeand valley floor precipitation. The mean value of the d18Oof main aquifer water from wells in the area where thesprings are located (near the basin center) is 29.19& andthe mean value for valley floor precipitation is 27.24&.Nonevaporated spring d18O values range from 29.23&to 28.37&. Given the analytical uncertainty in d18Oanalyses, the low end of the spring water range is iso-topically indistinguishable from the main aquifer water,suggesting that the lightest shallow aquifer water is com-posed entirely of high-elevation recharge (this waterlikely reaches the shallow aquifer via some combinationof lateral flow and leakage across the confining unit). Theisotopically heavy shallow aquifer water represents
Figure 3. Structural model of the San Bernardino Basin and southern San Simon Basin. Diagram on left shows the SanBernardino hydrologic basin Boundary (which extends beyond range-front faults) in orange. Faults are shown in yellow;normal faults are shown with bar and ball on downthrown side, and transfer faults are represented by plain lines. The anti-cline (showing the location of the accommodation zone) is indicated via a line with arrowheads. Note the NW-SE orientationof the transfer faults parallel to that of the Texas Lineament Belt (Figure 1A). Diagrams on right show different views ofa three-dimensional model of basin bedrock structure, with vertical exaggeration of 4.5. The scale bar shown is common toall three diagrams; orientation is indicated by an individual north arrow for each diagram. Colors used in the 3D structuraldiagrams not shown on the legend symbolize individual mini-half grabens.
S. Earman et al. GROUND WATER 7
a mixture of high-elevation precipitation from the bound-ing mountain ranges and valley-floor precipitation.
Endmember mixing calculations were used to esti-mate the relative contribution of mountain and valley-floor precipitation to spring discharge. In this model, ifthe isotopic composition of a mixture (z) and the twoendmember waters that combine to form it is known (xand y, respectively), then the proportions of the endmem-bers that created the mixture (a and b, respectively) canbe determined (assuming x 6¼ y) by solving the series ofequations ax 1 by ¼ z; a 1 b ¼ 1. Results show that thevalley-floor recharge accounts for at most 40% of spring-flow. The range in valley-floor precipitation contributionfrom 0% to 40% suggests that local recharge occurs pref-erentially in certain areas; with the available data, no cor-relation could be made between specific geologic featuresand increased valley-floor recharge contribution.
Relative Contribution of Bounding Mountain Ranges
An endmember mixing model was used to estimatethe proportion of San Bernardino ground water derivedfrom the Chiricahuas vs. the other bounding ranges. Themean d18O of the Chiricahua ground water (29.84&)was used as one endmember of the mix. A d18O of27.99& was used for the other ranges, based on theintersection of the evaporation line for the Peloncilloground water with the global meteoric water line. ThePeloncillo value was used because only one sample fromthe Perilla and Pedregosa ranges was obtained; this sam-ple appears to have undergone significant evaporationand may also have been affected by fractionation due tofreezing. Since the Perillas and Pedregosas are essentiallythe same elevation as the Peloncillos (the spread in maxi-mum elevation for the three ranges is only 46 m), weassume that the Peloncillo value is representative for allthree ranges. The mean d18O value of water from themain aquifer is 29.21& (this excludes all springs;Magoffin Well, which samples the bedrock of the basin;and Snure and Peterson 3 wells, which are influenced bymixing with valley-floor precipitation), so mass balance
calculations based on the means suggest that 66% of therecharge to the main aquifer is derived from the Chirica-hua Mountains, with the other ranges providing 34%. Toassess the uncertainty of this estimate, endmember calcu-lations using the mean 61 standard deviation for bothChiricahua water and San Bernardino main aquifer waterwere performed, showing that Chiricahuas contribute be-tween 48% and 99% of the recharge to the San BernardinoValley. Valley-floor precipitation appears to be of impor-tance only in limited zones of the main aquifer wherefocused recharge can occur; even in these zones, it is lessimportant than water that originated as precipitation fall-ing on the bounding mountain ranges.
Ground Water Recharge Elevations and Sources
Because water from the Chiricahuas is so important tothe basin aquifer, a greater understanding of the Chiricahuacontribution was desired. Determining the contribution ofsnowmelt vs. rain and high-elevation precipitation vs.low-elevation precipitation is important not only for un-derstanding the processes in the Chiricahuas but mightalso yield insight into similar processes in other mountain-basin systems of the western United States.
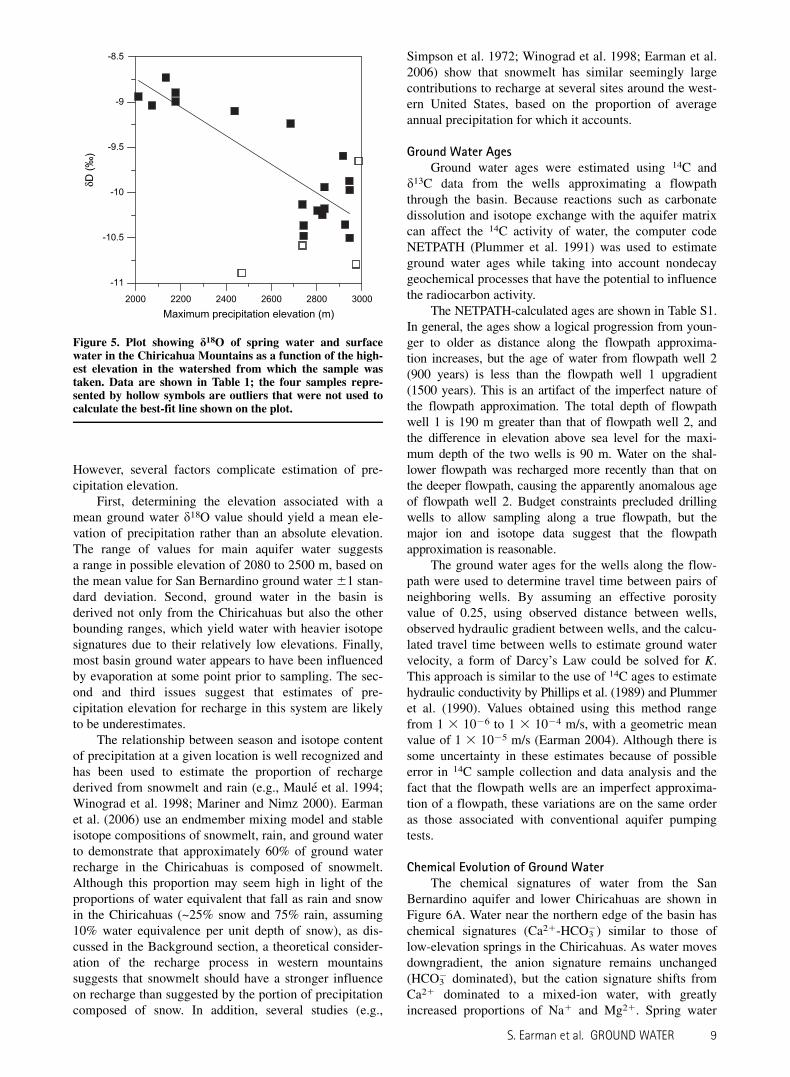
Comparing stable isotope content of Chiricahuaspring water to the spring orifice elevation yielded ageneral trend of isotopically lighter water at higherelevations, but the correlation was poor (r2 ¼ 0.12).Comparing the stable isotope content of spring water tothe maximum recharge elevation for that spring (the high-est elevation in the surface drainage in which the spring islocated) improved the r2 value to 0.50; removing fouroutlier values from the original data set (n ¼ 27; Table 1)yielded a much better correlation (r2 ¼ 0.72; Figure 5).The elevation associated with the mean Chiricahuaground water of 29.29& on the best-fit line in Figure 4suggests that precipitation that falls at about 2300 m is themain source of recharge for the basin water (note that thisis not described as a ‘‘recharge elevation,’’ as stable iso-tope data can suggest only the zone in which precipitationfell, not the zone in which it actually became recharge).
-10 0 10 20-100
0
100
200A B
-12 -10 -8 -6 -4-100
-80
-60
-40
-20
δ18O (‰) δ18O (‰)
δD (‰
)
δD (‰
)
Chiricahua Mts.Valley wellsValley springsValley precipitationPerilla Mts.Peloncillo Mts.
Chiricahua Mts.Valley wellsValley springsValley precipitationPerilla Mts.Peloncillo Mts.
Figure 4. Plots showing stable isotope composition of water from the San Bernardino Valley and vicinity, shown withthe global meteoric water line (solid) and a best-fit line for water from the Peloncillo Mountains, showing a slope of 3.8 forevaporated water from the range. (A) Includes data for highly evaporated water from the Peloncillo Mountains. (B) Highlyevaporated Peloncillo water is excluded from this plot so that other water can be seen more clearly.
8 S. Earman et al. GROUND WATER
However, several factors complicate estimation of pre-cipitation elevation.
First, determining the elevation associated with amean ground water d18O value should yield a mean ele-vation of precipitation rather than an absolute elevation.The range of values for main aquifer water suggestsa range in possible elevation of 2080 to 2500 m, based onthe mean value for San Bernardino ground water 61 stan-dard deviation. Second, ground water in the basin isderived not only from the Chiricahuas but also the otherbounding ranges, which yield water with heavier isotopesignatures due to their relatively low elevations. Finally,most basin ground water appears to have been influencedby evaporation at some point prior to sampling. The sec-ond and third issues suggest that estimates of pre-cipitation elevation for recharge in this system are likelyto be underestimates.
The relationship between season and isotope contentof precipitation at a given location is well recognized andhas been used to estimate the proportion of rechargederived from snowmelt and rain (e.g., Maule et al. 1994;Winograd et al. 1998; Mariner and Nimz 2000). Earmanet al. (2006) use an endmember mixing model and stableisotope compositions of snowmelt, rain, and ground waterto demonstrate that approximately 60% of ground waterrecharge in the Chiricahuas is composed of snowmelt.Although this proportion may seem high in light of theproportions of water equivalent that fall as rain and snowin the Chiricahuas (~25% snow and 75% rain, assuming10% water equivalence per unit depth of snow), as dis-cussed in the Background section, a theoretical consider-ation of the recharge process in western mountainssuggests that snowmelt should have a stronger influenceon recharge than suggested by the portion of precipitationcomposed of snow. In addition, several studies (e.g.,
Simpson et al. 1972; Winograd et al. 1998; Earman et al.2006) show that snowmelt has similar seemingly largecontributions to recharge at several sites around the west-ern United States, based on the proportion of averageannual precipitation for which it accounts.
Ground Water AgesGround water ages were estimated using 14C and
d13C data from the wells approximating a flowpaththrough the basin. Because reactions such as carbonatedissolution and isotope exchange with the aquifer matrixcan affect the 14C activity of water, the computer codeNETPATH (Plummer et al. 1991) was used to estimateground water ages while taking into account nondecaygeochemical processes that have the potential to influencethe radiocarbon activity.
The NETPATH-calculated ages are shown in Table S1.In general, the ages show a logical progression from youn-ger to older as distance along the flowpath approxima-tion increases, but the age of water from flowpath well 2(900 years) is less than the flowpath well 1 upgradient(1500 years). This is an artifact of the imperfect nature ofthe flowpath approximation. The total depth of flowpathwell 1 is 190 m greater than that of flowpath well 2, andthe difference in elevation above sea level for the maxi-mum depth of the two wells is 90 m. Water on the shal-lower flowpath was recharged more recently than that onthe deeper flowpath, causing the apparently anomalous ageof flowpath well 2. Budget constraints precluded drillingwells to allow sampling along a true flowpath, but themajor ion and isotope data suggest that the flowpathapproximation is reasonable.
The ground water ages for the wells along the flow-path were used to determine travel time between pairs ofneighboring wells. By assuming an effective porosityvalue of 0.25, using observed distance between wells,observed hydraulic gradient between wells, and the calcu-lated travel time between wells to estimate ground watervelocity, a form of Darcy’s Law could be solved for K.This approach is similar to the use of 14C ages to estimatehydraulic conductivity by Phillips et al. (1989) and Plummeret al. (1990). Values obtained using this method rangefrom 1 3 1026 to 1 3 1024 m/s, with a geometric meanvalue of 1 3 1025 m/s (Earman 2004). Although there issome uncertainty in these estimates because of possibleerror in 14C sample collection and data analysis and thefact that the flowpath wells are an imperfect approxima-tion of a flowpath, these variations are on the same orderas those associated with conventional aquifer pumpingtests.
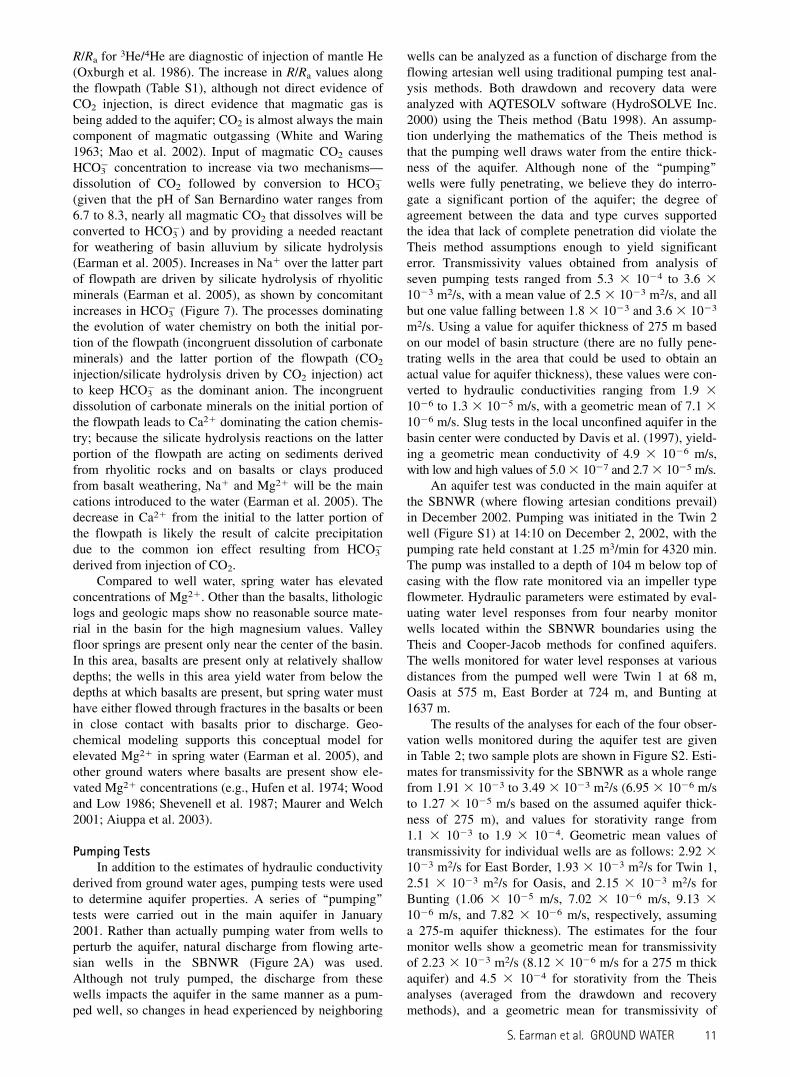
Chemical Evolution of Ground WaterThe chemical signatures of water from the San
Bernardino aquifer and lower Chiricahuas are shown inFigure 6A. Water near the northern edge of the basin haschemical signatures (Ca21-HCO3
2) similar to those oflow-elevation springs in the Chiricahuas. As water movesdowngradient, the anion signature remains unchanged(HCO3
2 dominated), but the cation signature shifts fromCa21 dominated to a mixed-ion water, with greatlyincreased proportions of Na1 and Mg21. Spring water
2000 2200 2400 2600 2800 3000
-11
-10.5
-10
-9.5
-9
-8.5
Maximum precipitation elevation (m)
δD (‰
)
Figure 5. Plot showing d18O of spring water and surfacewater in the Chiricahua Mountains as a function of the high-est elevation in the watershed from which the sample wastaken. Data are shown in Table 1; the four samples repre-sented by hollow symbols are outliers that were not used tocalculate the best-fit line shown on the plot.
S. Earman et al. GROUND WATER 9
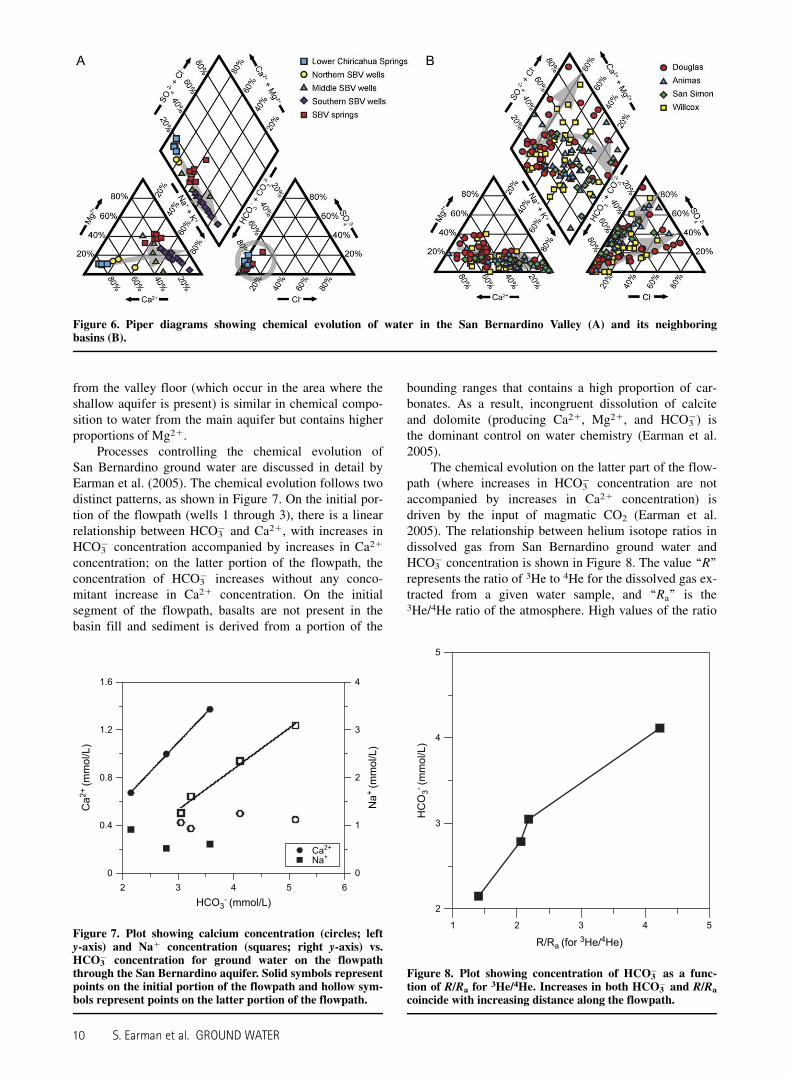
from the valley floor (which occur in the area where theshallow aquifer is present) is similar in chemical compo-sition to water from the main aquifer but contains higherproportions of Mg21.
Processes controlling the chemical evolution ofSan Bernardino ground water are discussed in detail byEarman et al. (2005). The chemical evolution follows twodistinct patterns, as shown in Figure 7. On the initial por-tion of the flowpath (wells 1 through 3), there is a linearrelationship between HCO3
2 and Ca21, with increases inHCO3
2 concentration accompanied by increases in Ca21
concentration; on the latter portion of the flowpath, theconcentration of HCO3
2 increases without any conco-mitant increase in Ca21 concentration. On the initialsegment of the flowpath, basalts are not present in thebasin fill and sediment is derived from a portion of the
bounding ranges that contains a high proportion of car-bonates. As a result, incongruent dissolution of calciteand dolomite (producing Ca21, Mg21, and HCO3
2) isthe dominant control on water chemistry (Earman et al.2005).
The chemical evolution on the latter part of the flow-path (where increases in HCO3
2 concentration are notaccompanied by increases in Ca21 concentration) isdriven by the input of magmatic CO2 (Earman et al.2005). The relationship between helium isotope ratios indissolved gas from San Bernardino ground water andHCO3
2 concentration is shown in Figure 8. The value ‘‘R’’represents the ratio of 3He to 4He for the dissolved gas ex-tracted from a given water sample, and ‘‘Ra’’ is the3He/4He ratio of the atmosphere. High values of the ratio
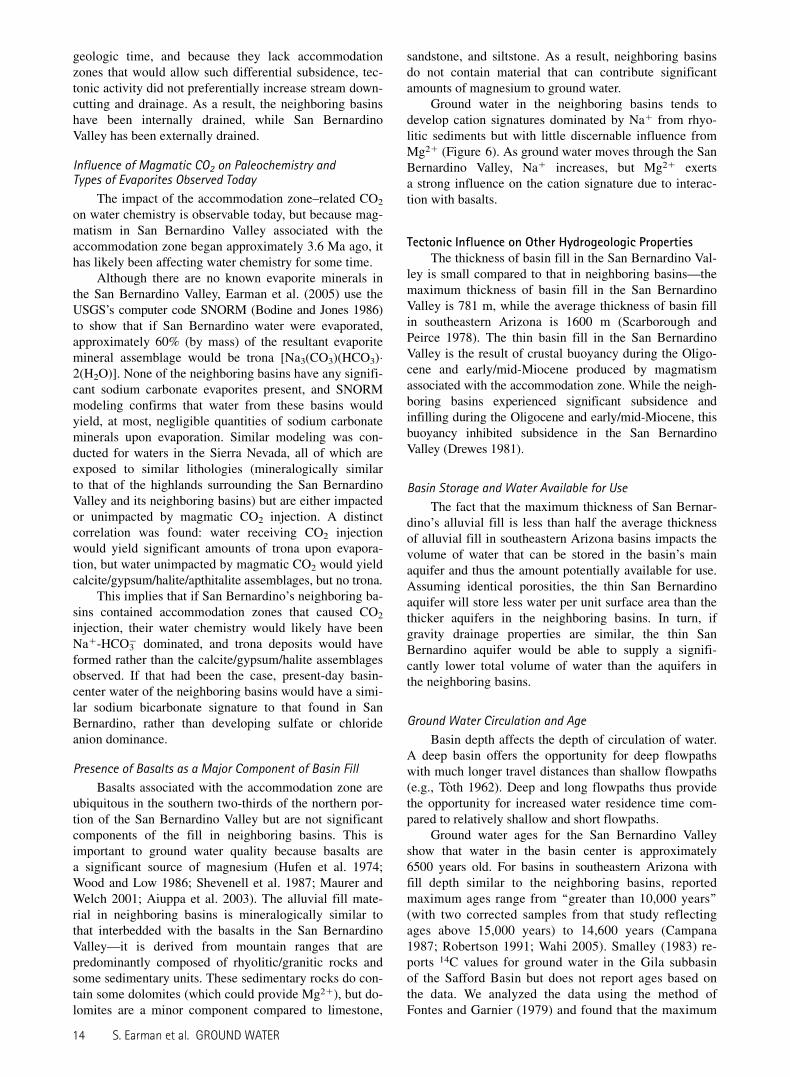
Figure 6. Piper diagrams showing chemical evolution of water in the San Bernardino Valley (A) and its neighboringbasins (B).
2 3 4 5 60
0.4
0.8
1.2
1.6
0
1
2
3
4
HCO3- (mmol/L)
Ca2+
(mm
ol/L
)
Na+
(mm
ol/L
)
Na+Ca2+
Figure 7. Plot showing calcium concentration (circles; lefty-axis) and Na1 concentration (squares; right y-axis) vs.HCO3
2 concentration for ground water on the flowpaththrough the San Bernardino aquifer. Solid symbols representpoints on the initial portion of the flowpath and hollow sym-bols represent points on the latter portion of the flowpath.
1 2 3 4 5
R/Ra (for 3He/4He)
2
3
4
5
HC
O3- (
mm
ol/L
)
Figure 8. Plot showing concentration of HCO32 as a func-
tion of R/Ra for 3He/4He. Increases in both HCO32 and R/Ra
coincide with increasing distance along the flowpath.
10 S. Earman et al. GROUND WATER
R/Ra for 3He/4He are diagnostic of injection of mantle He(Oxburgh et al. 1986). The increase in R/Ra values alongthe flowpath (Table S1), although not direct evidence ofCO2 injection, is direct evidence that magmatic gas isbeing added to the aquifer; CO2 is almost always the maincomponent of magmatic outgassing (White and Waring1963; Mao et al. 2002). Input of magmatic CO2 causesHCO3
2 concentration to increase via two mechanisms—dissolution of CO2 followed by conversion to HCO3
2
(given that the pH of San Bernardino water ranges from6.7 to 8.3, nearly all magmatic CO2 that dissolves will beconverted to HCO3
2) and by providing a needed reactantfor weathering of basin alluvium by silicate hydrolysis(Earman et al. 2005). Increases in Na1 over the latter partof flowpath are driven by silicate hydrolysis of rhyoliticminerals (Earman et al. 2005), as shown by concomitantincreases in HCO3
2 (Figure 7). The processes dominatingthe evolution of water chemistry on both the initial por-tion of the flowpath (incongruent dissolution of carbonateminerals) and the latter portion of the flowpath (CO2
injection/silicate hydrolysis driven by CO2 injection) actto keep HCO3
2 as the dominant anion. The incongruentdissolution of carbonate minerals on the initial portion ofthe flowpath leads to Ca21 dominating the cation chemis-try; because the silicate hydrolysis reactions on the latterportion of the flowpath are acting on sediments derivedfrom rhyolitic rocks and on basalts or clays producedfrom basalt weathering, Na1 and Mg21 will be the maincations introduced to the water (Earman et al. 2005). Thedecrease in Ca21 from the initial to the latter portion ofthe flowpath is likely the result of calcite precipitationdue to the common ion effect resulting from HCO3
2
derived from injection of CO2.Compared to well water, spring water has elevated
concentrations of Mg21. Other than the basalts, lithologiclogs and geologic maps show no reasonable source mate-rial in the basin for the high magnesium values. Valleyfloor springs are present only near the center of the basin.In this area, basalts are present only at relatively shallowdepths; the wells in this area yield water from below thedepths at which basalts are present, but spring water musthave either flowed through fractures in the basalts or beenin close contact with basalts prior to discharge. Geo-chemical modeling supports this conceptual model forelevated Mg21 in spring water (Earman et al. 2005), andother ground waters where basalts are present show ele-vated Mg21 concentrations (e.g., Hufen et al. 1974; Woodand Low 1986; Shevenell et al. 1987; Maurer and Welch2001; Aiuppa et al. 2003).
Pumping TestsIn addition to the estimates of hydraulic conductivity
derived from ground water ages, pumping tests were usedto determine aquifer properties. A series of ‘‘pumping’’tests were carried out in the main aquifer in January2001. Rather than actually pumping water from wells toperturb the aquifer, natural discharge from flowing arte-sian wells in the SBNWR (Figure 2A) was used.Although not truly pumped, the discharge from thesewells impacts the aquifer in the same manner as a pum-ped well, so changes in head experienced by neighboring
wells can be analyzed as a function of discharge from theflowing artesian well using traditional pumping test anal-ysis methods. Both drawdown and recovery data wereanalyzed with AQTESOLV software (HydroSOLVE Inc.2000) using the Theis method (Batu 1998). An assump-tion underlying the mathematics of the Theis method isthat the pumping well draws water from the entire thick-ness of the aquifer. Although none of the ‘‘pumping’’wells were fully penetrating, we believe they do interro-gate a significant portion of the aquifer; the degree ofagreement between the data and type curves supportedthe idea that lack of complete penetration did violate theTheis method assumptions enough to yield significanterror. Transmissivity values obtained from analysis ofseven pumping tests ranged from 5.3 3 1024 to 3.6 3
1023 m2/s, with a mean value of 2.5 3 1023 m2/s, and allbut one value falling between 1.8 3 1023 and 3.6 3 1023
m2/s. Using a value for aquifer thickness of 275 m basedon our model of basin structure (there are no fully pene-trating wells in the area that could be used to obtain anactual value for aquifer thickness), these values were con-verted to hydraulic conductivities ranging from 1.9 3
1026 to 1.3 3 1025 m/s, with a geometric mean of 7.1 3
1026 m/s. Slug tests in the local unconfined aquifer in thebasin center were conducted by Davis et al. (1997), yield-ing a geometric mean conductivity of 4.9 3 1026 m/s,with low and high values of 5.03 1027 and 2.73 1025 m/s.
An aquifer test was conducted in the main aquifer atthe SBNWR (where flowing artesian conditions prevail)in December 2002. Pumping was initiated in the Twin 2well (Figure S1) at 14:10 on December 2, 2002, with thepumping rate held constant at 1.25 m3/min for 4320 min.The pump was installed to a depth of 104 m below top ofcasing with the flow rate monitored via an impeller typeflowmeter. Hydraulic parameters were estimated by eval-uating water level responses from four nearby monitorwells located within the SBNWR boundaries using theTheis and Cooper-Jacob methods for confined aquifers.The wells monitored for water level responses at variousdistances from the pumped well were Twin 1 at 68 m,Oasis at 575 m, East Border at 724 m, and Bunting at1637 m.
The results of the analyses for each of the four obser-vation wells monitored during the aquifer test are givenin Table 2; two sample plots are shown in Figure S2. Esti-mates for transmissivity for the SBNWR as a whole rangefrom 1.91 3 1023 to 3.49 3 1023 m2/s (6.95 3 1026 m/sto 1.27 3 1025 m/s based on the assumed aquifer thick-ness of 275 m), and values for storativity range from1.1 3 1023 to 1.9 3 1024. Geometric mean values oftransmissivity for individual wells are as follows: 2.92 3
1023 m2/s for East Border, 1.93 3 1023 m2/s for Twin 1,2.51 3 1023 m2/s for Oasis, and 2.15 3 1023 m2/s forBunting (1.06 3 1025 m/s, 7.02 3 1026 m/s, 9.13 3
1026 m/s, and 7.82 3 1026 m/s, respectively, assuminga 275-m aquifer thickness). The estimates for the fourmonitor wells show a geometric mean for transmissivityof 2.23 3 1023 m2/s (8.12 3 1026 m/s for a 275 m thickaquifer) and 4.5 3 1024 for storativity from the Theisanalyses (averaged from the drawdown and recoverymethods), and a geometric mean for transmissivity of
S. Earman et al. GROUND WATER 11
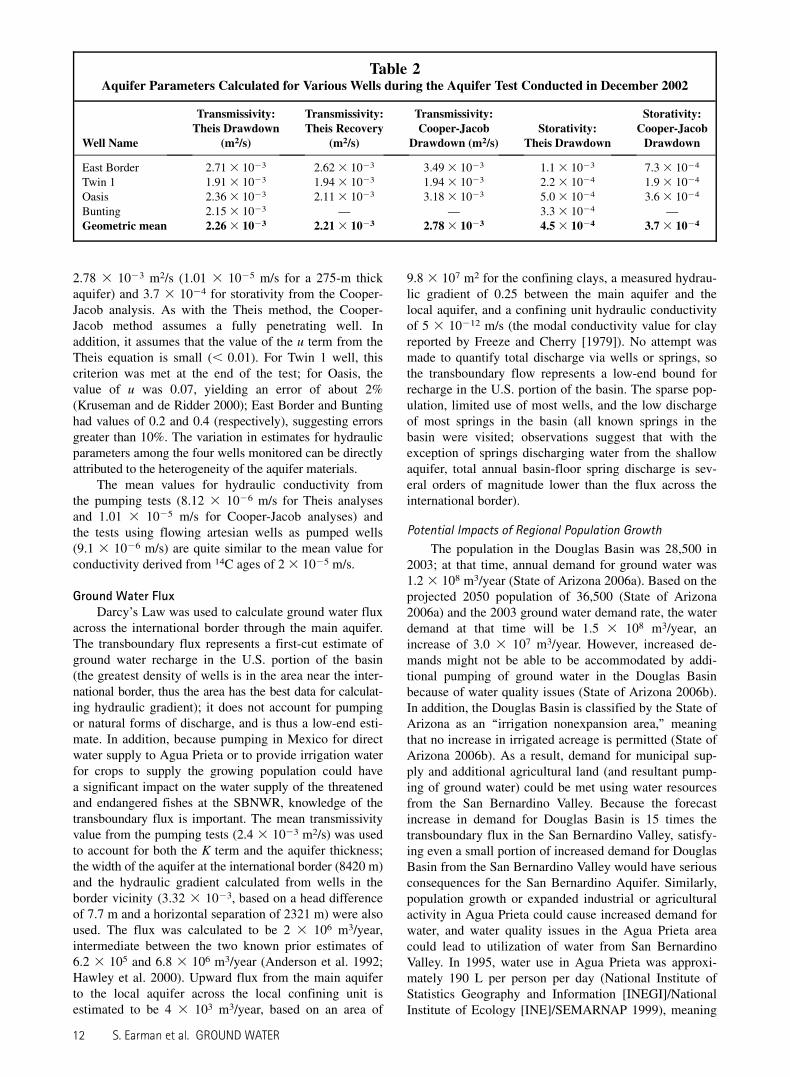
2.78 3 1023 m2/s (1.01 3 1025 m/s for a 275-m thickaquifer) and 3.7 3 1024 for storativity from the Cooper-Jacob analysis. As with the Theis method, the Cooper-Jacob method assumes a fully penetrating well. Inaddition, it assumes that the value of the u term from theTheis equation is small (, 0.01). For Twin 1 well, thiscriterion was met at the end of the test; for Oasis, thevalue of u was 0.07, yielding an error of about 2%(Kruseman and de Ridder 2000); East Border and Buntinghad values of 0.2 and 0.4 (respectively), suggesting errorsgreater than 10%. The variation in estimates for hydraulicparameters among the four wells monitored can be directlyattributed to the heterogeneity of the aquifer materials.
The mean values for hydraulic conductivity fromthe pumping tests (8.12 3 1026 m/s for Theis analysesand 1.01 3 1025 m/s for Cooper-Jacob analyses) andthe tests using flowing artesian wells as pumped wells(9.1 3 1026 m/s) are quite similar to the mean value forconductivity derived from 14C ages of 2 3 1025 m/s.
Ground Water FluxDarcy’s Law was used to calculate ground water flux
across the international border through the main aquifer.The transboundary flux represents a first-cut estimate ofground water recharge in the U.S. portion of the basin(the greatest density of wells is in the area near the inter-national border, thus the area has the best data for calculat-ing hydraulic gradient); it does not account for pumpingor natural forms of discharge, and is thus a low-end esti-mate. In addition, because pumping in Mexico for directwater supply to Agua Prieta or to provide irrigation waterfor crops to supply the growing population could havea significant impact on the water supply of the threatenedand endangered fishes at the SBNWR, knowledge of thetransboundary flux is important. The mean transmissivityvalue from the pumping tests (2.4 3 1023 m2/s) was usedto account for both the K term and the aquifer thickness;the width of the aquifer at the international border (8420 m)and the hydraulic gradient calculated from wells in theborder vicinity (3.32 3 1023, based on a head differenceof 7.7 m and a horizontal separation of 2321 m) were alsoused. The flux was calculated to be 2 3 106 m3/year,intermediate between the two known prior estimates of6.2 3 105 and 6.8 3 106 m3/year (Anderson et al. 1992;Hawley et al. 2000). Upward flux from the main aquiferto the local aquifer across the local confining unit isestimated to be 4 3 103 m3/year, based on an area of
9.8 3 107 m2 for the confining clays, a measured hydrau-lic gradient of 0.25 between the main aquifer and thelocal aquifer, and a confining unit hydraulic conductivityof 5 3 10212 m/s (the modal conductivity value for clayreported by Freeze and Cherry [1979]). No attempt wasmade to quantify total discharge via wells or springs, sothe transboundary flow represents a low-end bound forrecharge in the U.S. portion of the basin. The sparse pop-ulation, limited use of most wells, and the low dischargeof most springs in the basin (all known springs in thebasin were visited; observations suggest that with theexception of springs discharging water from the shallowaquifer, total annual basin-floor spring discharge is sev-eral orders of magnitude lower than the flux across theinternational border).
Potential Impacts of Regional Population Growth
The population in the Douglas Basin was 28,500 in2003; at that time, annual demand for ground water was1.2 3 108 m3/year (State of Arizona 2006a). Based on theprojected 2050 population of 36,500 (State of Arizona2006a) and the 2003 ground water demand rate, the waterdemand at that time will be 1.5 3 108 m3/year, anincrease of 3.0 3 107 m3/year. However, increased de-mands might not be able to be accommodated by addi-tional pumping of ground water in the Douglas Basinbecause of water quality issues (State of Arizona 2006b).In addition, the Douglas Basin is classified by the State ofArizona as an ‘‘irrigation nonexpansion area,’’ meaningthat no increase in irrigated acreage is permitted (State ofArizona 2006b). As a result, demand for municipal sup-ply and additional agricultural land (and resultant pump-ing of ground water) could be met using water resourcesfrom the San Bernardino Valley. Because the forecastincrease in demand for Douglas Basin is 15 times thetransboundary flux in the San Bernardino Valley, satisfy-ing even a small portion of increased demand for DouglasBasin from the San Bernardino Valley would have seriousconsequences for the San Bernardino Aquifer. Similarly,population growth or expanded industrial or agriculturalactivity in Agua Prieta could cause increased demand forwater, and water quality issues in the Agua Prieta areacould lead to utilization of water from San BernardinoValley. In 1995, water use in Agua Prieta was approxi-mately 190 L per person per day (National Institute ofStatistics Geography and Information [INEGI]/NationalInstitute of Ecology [INE]/SEMARNAP 1999), meaning
Table 2Aquifer Parameters Calculated for Various Wells during the Aquifer Test Conducted in December 2002
Well Name
Transmissivity:Theis Drawdown
(m2/s)
Transmissivity:Theis Recovery
(m2/s)
Transmissivity:Cooper-Jacob
Drawdown (m2/s)Storativity:
Theis Drawdown
Storativity:Cooper-JacobDrawdown
East Border 2.713 1023 2.623 1023 3.493 1023 1.13 1023 7.33 1024
Twin 1 1.913 1023 1.943 1023 1.943 1023 2.23 1024 1.93 1024
Oasis 2.363 1023 2.113 1023 3.183 1023 5.03 1024 3.63 1024
Bunting 2.153 1023 — — 3.33 1024 —Geometric mean 2.263 1023 2.213 1023 2.783 1023 4.53 1024 3.73 1024
12 S. Earman et al. GROUND WATER
that providing a supply adequate for 29,000 people wouldexceed the annual transboundary flux in the San Bernar-dino Valley. Based on the population growth from 1980to 2005, Agua Prieta gains this many residents every4.2 years.
Using the San Bernardino aquifer to meet even smallportions of the demand for water in neighboring basinsdue to supply and/or quality issues could easily result inpumping volumes greater than annual recharge to theaquifer. If such pumping occurs, springs and natural wet-lands in the basin center that support wildlife wouldlikely dry and flowing artesian conditions could be lostfor wells on the SBNWR that supply water to maintainthe threatened and endangered fishes there.
Comparison of San Bernardino Hydrogeology toThat of Neighboring Basins
The San Bernardino Valley has four neighboring ba-sins in the United States (Figure 1). These basins were allformed by Basin and Range extension, and the highlandsbounding them are mineralogically similar to those bound-ing the San Bernardino Valley. Based on the similar modesof formation, ages, and source materials for the basins’fill, one might expect ground water quality and chemicalevolution to be similar in the San Bernardino Valley andits neighboring basins. In fact, the chemical evolution ofSan Bernardino ground water is distinct (Figure 6), asare some other aspects of the basin’s hydrogeology. Wehypothesized that the major hydrogeologic differencesbetween the San Bernardino Valley and its neighbors arerelated to tectonics, namely the presence of the accommo-dation zone in the San Bernardino Valley (none of theneighboring basins contain an accommodation zone).These differences and their relation to the accommoda-tion zone are discussed subsequently.
Tectonic Influences on Water Chemistry
Presence of Evaporite Deposits
The presence or absence of evaporite deposits canhave a significant impact on water quality. Because mostevaporite minerals are very soluble (Hem 1992), interac-tion with evaporites can significantly increase dissolvedsolids relative to water that has not encountered evapor-ites. All the San Bernardino Valley’s neighboring basinscontain evaporite deposits (Cushman et al. 1947; Coatesand Cushman 1955; Spiegel 1957; Schreiber 1978). TheSan Bernardino Valley has no known evaporites, as indi-cated by the mapping of Drewes (1980), Direccion Gen-eral de Geografica del Territorio Nacional (1982), andBiggs et al. (1999), and borehole lithologic data. SanBernardino water has lower dissolved solids levels than theneighboring basins (Barnes 1991; Schwab 1992; Oram1993; Rascona 1993; Hawley et al. 2000), in large partdue to evaporites being present in the neighboring basinsbut not in San Bernardino Valley. Although values of totaldissolved solids (TDS) content of ground water are notavailable for all the neighboring basins, EC typicallyscales with TDS (Hem 1992), and EC values are available
for all basins. The maximum value measured in the SBB(1763 lS/cm) is significantly lower than the maximumvalues measured in neighboring basins, which range from2380 to 7800 lS/cm (Barnes 1991; Schwab 1992; Oram1993; Rascona 1993; Hawley et al. 2000).
The formation of significant evaporite deposits typi-cally requires an internally drained basin. We hypothesizethat the San Bernardino Valley lacks evaporite depositsbecause it has been externally drained, as opposed to theneighboring basins, which have been internally drained.
Crustal buoyancy due to magmatism associated withthe accommodation zone kept subsidence to a minimumin the San Bernardino Valley during the Oligocene andearly/mid-Miocene. However, tectonic activity has sinceincreased and the basin is now more tectonically activethan the neighboring basins. The most dramatic evidenceis an 1887 earthquake (estimated Richter magnitude 7.2)along the Pitaycachi fault on the eastern margin of thebasin in Mexico (DuBois and Smith 1980). Lynch’s(1972) observations of entrenched alluvial fan deposits inthe Chiricahuas are evidence of present-day uplift alongthe mountain-front fault in the U.S. portion of the basin;Pearthree (1986) indicates that the San Bernardino Valleyhas been among the most tectonically active in southeast-ern Arizona during the late Quaternary and describes sig-nificant fault scarps as being between 3000 and 10,000years old.
Because the loss of crustal buoyancy and increasedtectonic activities have occurred over the last 10 Ma, themajority of subsidence in the San Bernardino Valley hastaken place during that time, a period in which the neigh-boring basins have been relatively inactive (Morrison1991). Most of the geologically recent subsidence hasoccurred in the southern portion of the basin. Forinstance, the 1887 event on the Pitaycachi fault caused upto 5 m of offset on the mountain-front fault, and aerialobservation in 1972 revealed the presence of numerousassociated scarps representing active mountain-frontfaulting over the past few thousand years (Stover andCoffman 1993); a magnitude 4.2 normal fault event inMay 1989 also occurred near the Pitaycachi fault in thesouthern portion of the basin (Wallace and Pearthree1989; Wallace 1990). A number of smaller events in Mayand June 1989 all took place in the Sonoran portion of thebasin (Wallace and Pearthree 1989). While the ob-servations of Lynch (1972) and Pearthree (1986) indicatethat the northern portion of the basin has been seismicallyactive in the geologically recent past, the southern portionof the basin appears to have been more active and experi-enced significantly greater subsidence.
Lynch (1978) found that the main channel of thedrainage system in the San Bernardino Valley is currentlyeroding headward; he surmises that this is a (geolog-ically) recent development brought about by a tectoni-cally induced change in base level. Because the southernportion of the San Bernardino Valley experienced moresubsidence than the northern portion in the late Quater-nary, local base level for the northern portion of the basinhas dropped, which has led to increased stream down-cutting in the northern portion of the basin. Neighboringbasins appear to have had less tectonic activity in recent
S. Earman et al. GROUND WATER 13
geologic time, and because they lack accommodationzones that would allow such differential subsidence, tec-tonic activity did not preferentially increase stream down-cutting and drainage. As a result, the neighboring basinshave been internally drained, while San BernardinoValley has been externally drained.
Influence of Magmatic CO2 on Paleochemistry andTypes of Evaporites Observed Today
The impact of the accommodation zone–related CO2
on water chemistry is observable today, but because mag-matism in San Bernardino Valley associated with theaccommodation zone began approximately 3.6 Ma ago, ithas likely been affecting water chemistry for some time.
Although there are no known evaporite minerals inthe San Bernardino Valley, Earman et al. (2005) use theUSGS’s computer code SNORM (Bodine and Jones 1986)to show that if San Bernardino water were evaporated,approximately 60% (by mass) of the resultant evaporitemineral assemblage would be trona [Na3(CO3)(HCO3)�2(H2O)]. None of the neighboring basins have any signifi-cant sodium carbonate evaporites present, and SNORMmodeling confirms that water from these basins wouldyield, at most, negligible quantities of sodium carbonateminerals upon evaporation. Similar modeling was con-ducted for waters in the Sierra Nevada, all of which areexposed to similar lithologies (mineralogically similarto that of the highlands surrounding the San BernardinoValley and its neighboring basins) but are either impactedor unimpacted by magmatic CO2 injection. A distinctcorrelation was found: water receiving CO2 injectionwould yield significant amounts of trona upon evapora-tion, but water unimpacted by magmatic CO2 would yieldcalcite/gypsum/halite/apthitalite assemblages, but no trona.
This implies that if San Bernardino’s neighboring ba-sins contained accommodation zones that caused CO2
injection, their water chemistry would likely have beenNa1-HCO3
2 dominated, and trona deposits would haveformed rather than the calcite/gypsum/halite assemblagesobserved. If that had been the case, present-day basin-center water of the neighboring basins would have a simi-lar sodium bicarbonate signature to that found in SanBernardino, rather than developing sulfate or chlorideanion dominance.
Presence of Basalts as a Major Component of Basin Fill
Basalts associated with the accommodation zone areubiquitous in the southern two-thirds of the northern por-tion of the San Bernardino Valley but are not significantcomponents of the fill in neighboring basins. This isimportant to ground water quality because basalts area significant source of magnesium (Hufen et al. 1974;Wood and Low 1986; Shevenell et al. 1987; Maurer andWelch 2001; Aiuppa et al. 2003). The alluvial fill mate-rial in neighboring basins is mineralogically similar tothat interbedded with the basalts in the San BernardinoValley—it is derived from mountain ranges that arepredominantly composed of rhyolitic/granitic rocks andsome sedimentary units. These sedimentary rocks do con-tain some dolomites (which could provide Mg21), but do-lomites are a minor component compared to limestone,
sandstone, and siltstone. As a result, neighboring basinsdo not contain material that can contribute significantamounts of magnesium to ground water.
Ground water in the neighboring basins tends todevelop cation signatures dominated by Na1 from rhyo-litic sediments but with little discernable influence fromMg21 (Figure 6). As ground water moves through the SanBernardino Valley, Na1 increases, but Mg21 exertsa strong influence on the cation signature due to interac-tion with basalts.
Tectonic Influence on Other Hydrogeologic PropertiesThe thickness of basin fill in the San Bernardino Val-
ley is small compared to that in neighboring basins—themaximum thickness of basin fill in the San BernardinoValley is 781 m, while the average thickness of basin fillin southeastern Arizona is 1600 m (Scarborough andPeirce 1978). The thin basin fill in the San BernardinoValley is the result of crustal buoyancy during the Oligo-cene and early/mid-Miocene produced by magmatismassociated with the accommodation zone. While the neigh-boring basins experienced significant subsidence andinfilling during the Oligocene and early/mid-Miocene, thisbuoyancy inhibited subsidence in the San BernardinoValley (Drewes 1981).
Basin Storage and Water Available for Use
The fact that the maximum thickness of San Bernar-dino’s alluvial fill is less than half the average thicknessof alluvial fill in southeastern Arizona basins impacts thevolume of water that can be stored in the basin’s mainaquifer and thus the amount potentially available for use.Assuming identical porosities, the thin San Bernardinoaquifer will store less water per unit surface area than thethicker aquifers in the neighboring basins. In turn, ifgravity drainage properties are similar, the thin SanBernardino aquifer would be able to supply a signifi-cantly lower total volume of water than the aquifers inthe neighboring basins.
Ground Water Circulation and Age
Basin depth affects the depth of circulation of water.A deep basin offers the opportunity for deep flowpathswith much longer travel distances than shallow flowpaths(e.g., Toth 1962). Deep and long flowpaths thus providethe opportunity for increased water residence time com-pared to relatively shallow and short flowpaths.
Ground water ages for the San Bernardino Valleyshow that water in the basin center is approximately6500 years old. For basins in southeastern Arizona withfill depth similar to the neighboring basins, reportedmaximum ages range from ‘‘greater than 10,000 years’’(with two corrected samples from that study reflectingages above 15,000 years) to 14,600 years (Campana1987; Robertson 1991; Wahi 2005). Smalley (1983) re-ports 14C values for ground water in the Gila subbasinof the Safford Basin but does not report ages based onthe data. We analyzed the data using the method ofFontes and Garnier (1979) and found that the maximum
14 S. Earman et al. GROUND WATER
ground water age was more than 20,000 years. In gen-eral, ground water in alluvial aquifers of southeasternArizona basins is of the same age range seen in the SanBernardino Valley if the water has experienced onlyshallow circulation; water that has experienced deep circu-lation is older (e.g., Wahi 2005).
ConclusionsBased on the results of a study using multiple com-
plementary methods of investigation, several majorhydrologic properties (including chemical evolution ofwater, dissolved ion concentration, volume of waterstored per unit area of aquifer, and water residence time)of the San Bernardino Valley aquifer differ markedlyfrom those of its neighboring basins, even though all thebasins have common ages and modes of formation andare bounded by highlands of similar lithology. The SanBernardino Valley has hydrologic properties distinct fromthose of its neighboring basins because its geology isunique when compared to that of the neighboring basins;all the major geologic differences are due to the presenceof a magmatically active accommodation zone. Importantinfluences associated with the accommodation zoneinclude extensive basaltic volcanism, thin basin fill dueto crustal buoyancy, and recent tectonic activity increas-ing stream downcutting. These facts lead us to proposethat other basins with magmatically active regional seg-mentation boundaries or other similar tectonic featuresmay likewise have similarly distinctive hydrologic prop-erties, especially water chemistry, in terms of both chemicalsignature and TDS. This is similar to the hypotheses ofNewell et al. (2005) and Earman et al. (2005) regardingthe potential impacts of mantle fluids on aquifer chemis-try. The geological differences and the resultant chemicaldifferences between the San Bernardino Valley and itsneighboring basins may serve as a model for how chem-ical evolution of ground water in other magmaticallyactive accommodation-zone basins (more than 60 ofwhich are identified in the western United States) differsfrom that of their neighbors.
Aside from limited zones where focused rechargefrom valley floor precipitation occurs, the main aquiferof the San Bernardino Valley receives its recharge fromthe bounding mountain ranges. Approximately two-thirds of the recharge appears to be derived from theChiricahua Mountains, which are the highest boundingrange. Precipitation falling at or above 2300 m appearsto account for the majority of recharge from the Chirica-huas, and snowmelt is responsible for the majority ofrecharge. Mean values for hydraulic conductivity for theaquifer from pumping tests and a method using 14C agesrange from 8.18 3 1026 to 2 3 1025 m/s. The flux ofwater across the international border, calculated to be2 3 105 m3/year, gives a low-end estimate for annualrecharge in the U.S. portion of the basin. Because groundwater in adjacent basins is of poorer quality than that inSan Bernardino Valley, San Bernardino ground watermay be viewed as a desirable source of supply for nearbycities. It appears that providing even a small portion ofthe water demand for surrounding areas would cause
ground water mining, with potential negative con-sequences for the viability of springs and wetlands, andthe water supply that provides habitat for threatened andendangered species.
The level of insight into the hydrogeology of the SanBernardino Valley is related to the application of anumber of complementary methods, including hydro-chemistry, isotope hydrology, aquifer testing, geophysics,and analysis of geologic maps and lithologic logs. Eachmethod provides some information on its own, but bycombining many approaches, a much better understand-ing of basin hydrogeology was developed than wouldhave been possible using fewer methods.
Supplementary materialThe following supplementary material is available for
this article:
Figure S1. Locations of selected wells on the SBNWR(Figure 2A in the main article).
Figure S2. Sample plots showing results of aquiferpumping test at the SBNWR. Observed values are shownas black crosses; aquifer test type curves are shown ingray. A: Drawdown in Twin 1 from pumping Twin 2. B.Recovery of East Border after cessation of pumping atTwin 2. The parameter t/t9 represents the total time elapsedsince pumping was initiated (t) divided by the time elapsedsince pumping ceased and recovery began (t9).
Table S1. Data for Water Chemistry in the San Ber-nardino Valley and Vicinity.
This material is available as part of the on-line articlefrom: http://www.blackwell-synergy.com/doi/abs/10.1111/j.1745-6584.2007.00320.x
(This link will take you to the article abstract.)Please note: Blackwell Publishing is not responsible
for the content or functionality of any supplementary ma-terials supplied by the authors. Any queries (other thanmissing material) should be directed to the correspondingauthor for the article.
AcknowledgmentsMajor funding for this research was provided by the
U.S. Fish and Wildlife Service. The dissolved gas sam-pling and analysis were funded by the Sustainability ofsemi-arid Hydrology and Riparian Areas (SAHRA) Sci-ence and Technology Center of the National ScienceFoundation (NSF agreement No. EAR-9876800). Logisti-cal and scientific assistance was provided by numerousU.S. Fish and Wildlife Service personnel, especially SteveCullinan, Nina King, Matt Magoffin, Gary Shellhorn, PaulTashjian, and Tony Velasco. We appreciate the assistanceof the USDA Forest Service, especially Louie Pope; theArizona Geological Survey, especially Tom Biggs, PhilPearthree, and Steve Skotnicki, and the numerous land-owners/leaseholders who allowed us to sample from wellson land they own or manage. We appreciate commentsfrom Alan Fryar, James Mayer, and two anonymous re-viewers, which led to major improvements in the manu-script. Figures 1 and 7 reprinted from Earman, S., F.M.
S. Earman et al. GROUND WATER 15
Phillips, and B.J.O.L. McPherson. The role of ‘‘excess’’CO2 in the formation of trona deposits. Applied Geo-chemistry 20, 2217–2232, Copyright 2005, with permis-sion from Elsevier.
ReferencesAiuppa, A., S. Bellomo, L. Brusca, W. D’Alessandro, and C.
Federico. 2003. Natural and anthropogenic factors affectinggroundwater quality of an active volcano (Mt. Etna, Italy).Applied Geochemistry 18, no. 6: 863–882.
Aldrich, M.J. Jr., and W.A. Laughlin. 1984. A model for the tec-tonic development of the southeastern Colorado Plateauboundary. Journal of Geophysical Research 89, no. B12:10207–10218.
Anderson, O.J., G.E. Jones, and G.N. Green. 1997. Geologicmap of New Mexico. USGS Open-File Report 97-52.Reston, Virginia: USGS.
Anderson, T.W., G.W. Freethey, and P. Tucci. 1992. Geo-hydrology and water resources of alluvial basins insouth-central Arizona and parts of adjacent states. USGSProfessional Paper 1406-B. Reston, Virginia: USGS.
Barnes, R.L. 1991. Map showing groundwater conditions in theSan Simon sub-basin of the Safford Basin, Graham andCochise counties, Arizona, Hidalgo County, New Mexico—1987. Hydrologic Map Series Report Number 19. Phoenix,Arizona: Arizona Department of Water Resources.
Batu, V. 1998. Aquifer Hydraulics: A Comprehensive Guide toHydrogeologic Data Analysis. New York: John Wiley &Sons Inc.
Biggs, T.H., R.S. Leighty, S.J. Skotnicki, and P.A. Pearthree.1999. Geology and geomorphology of the San BernardinoValley, southeastern Arizona. Open-File Report 99-19.Tucson, Arizona: Arizona Geological Survey.
Bodine, M.W. Jr., and B.F. Jones. 1986. THE SALT NORM: Aquantitative chemical-mineralogical characterization ofnatural waters. USGS Water Resources InvestigationsReport 86-4086. Reston, Virginia: USGS.
Campana, M.E. 1987. Generation of ground-water age dis-tributions. Ground Water 25, no. 1: 51–58.
Clark, I., and P. Fritz. 1997. Environmental Isotopes in Hydro-geology. Boca Raton, Florida: Lewis Publishers.
Coates, D.R., and R.L. Cushman. 1955. Geology and ground-water resources of the Douglas Basin, Arizona. USGSWater-Supply Paper 1354. Reston, Virginia: USGS.
Coleman, M.L., T.J. Shepherd, J.J. Durham, J.E. Rouse, andG.R. Moore. 1982. Reduction of water with zinc forhydrogen isotope analysis. Analytical Chemistry 54, no. 7:993–995.
Cushman, R.L., R.S. Jones, and J.D. Hem. 1947. Geology andground-water resources of the San Simon Basin, Cochiseand Graham counties, Arizona. USGS Open-File Report(unnumbered). Reston, Virginia: USGS.
Davis, L.A., I. Thomas Maddock, and R.M. Nish. 1997.Ground-water flow and interaction with surface water inSan Bernardino Valley, Cochise County, Arizona andSonora, Mexico. Report No. 97-030. Phoenix, Arizona:University of Arizona Department of Hydrology and WaterResources.
Direccion General de Geografica del Territorio Nacional. 1982.Agua Prieta H12–3, Carta Geological. Escala 1:250,000.Direccion General de Geografica del Territorio Nacional.
Drewes, H.A. 1981. Tectonics of southeastern Arizona. USGSProfessional Paper 1144. Reston, Virginia: USGS.
Drewes, H. 1980. Tectonic map of southeast Arizona. USGSMiscellaneous Investigations Series Map I-1109. Reston,Virginia: USGS.
DuBois, S.M., and A.W. Smith. 1980. The 1887 earthquake inSan Bernardino Valley, Sonora: Historic accounts andintensity patterns in Arizona. Special Paper No. 3. Phoenix,Arizona: State of Arizona Bureau of Geology and MineralTechnology.
du Bray, E.A., J.S. Pallister, and D.B. Yager. 1997. Geologicmap of the Turkey Creek caldera, Chiricahua Mountains,Cochise County, Arizona. USGS Miscellaneous Inves-tigations Series Map I-2544. Reston, Virginia: USGS.
Earman, S. 2004. Groundwater recharge and movement throughmountain-basin systems of the Southwest: A case study inthe Chiricahua Mountains-San Bernardino Valley system,Arizona and Sonora. Ph.D. diss., New Mexico Institute ofMining and Technology, Socorro, New Mexico.
Earman, S., A.R. Campbell, B.D. Newman, and F.M. Phillips.2006. Isotopic exchange between snow and atmosphericwater vapor: Estimation of the snowmelt component ofgroundwater recharge in the southwestern United States.Journal of Geophysical Research 111, D9: D09302, doi:10.1029/2005JD006470.
Earman, S., F.M. Phillips, and B.J.O.L. McPherson. 2005. Therole of ‘‘excess’’ CO2 in the formation of trona deposits.Applied Geochemistry 20, no. 12: 2217–2232, doi:10.1016/j.apgeochem.2005.08.007.
Faulds, J.E., and R.J. Varga. 1998. The role of accommodationzones and transfer zones in the regional segmentation ofextended terranes. In Accommodation Zones and TransferZones: The Regional Segmentation of the Basin and RangeProvince, ed. J.E. Faulds and J.H. Stewart, 1–45. SpecialPaper 323. Boulder, Colorado: Geological Society ofAmerica.
Fontes, J.-C., and J.-M. Garnier. 1979. Determination of the ini-tial 14C activity of the total dissolved carbon: A review ofthe existing models and a new approach. Water ResourcesResearch 15, no. 2: 399–413.
Hawley, J.W., B.J. Hibbs, J.F. Kennedy, B.J. Creel, M.D.Remmenga, M. Johnson, M.M. Lee, and P. Dinterman.2000. Trans-international boundary aquifers in southwesternNew Mexico. Technical Completion Report. Las Cruces,New Mexico: New Mexico Water Resources ResearchInstitute.
Hem, J.D. 1992. Study and interpretation of the chemical char-acteristics of natural water. USGS Water-Supply Paper2254. Reston, Virginia: USGS.
Hirschberg, D.M., and G.S. Pitts. 2000. Digital geologic map ofArizona. USGS Open-File Report 00-409. Reston, Virginia:USGS.
Hufen, T.H., R.W. Buddemeier, and L.S. Lau. 1974. Isotopicand chemical characteristics of high-level groundwaters onOahu, Hawaii.Water Resources Research 10, no. 2: 366–370.
HydroSOLVE Inc. 2000. AQTESOLV for Windows Users Guide.Reston, Virginia: HydroSOLVE Inc.
Kruseman, G.P., and N.A. de Ridder. 2000. Analysis andEvaluation of Pumping Test Data, 2nd ed. Publication 47.Wageningen, The Netherlands: International Institute forLand Reclamation and Improvement (ILRI).
Longsworth, S.A. 1991. Geohydrology and chemical quality ofground water. San Bernardino National Wildlife Refuge,Arizona.USGS Water-Resources Investigations Report 90-4190.
Lynch, D.J. 1978. The San Bernardino volcanic field of south-eastern Arizona. In Land of Cochise, SoutheasternArizona, Twenty-Ninth Field Conference Guidebook, ed.J.F. Callender, J.C. Wilt, and R.E. Clemons, 261–268.Socorro, New Mexico: New Mexico Geological Society.
Lynch, D.J. 1972. Reconnaissance geology of the Bernardinovolcanic field, Cochise County, Arizona. M.S. thesis, Uni-versity of Arizona, Tucson, Arizona.
Manning, A.H. 2002. Using noble gas tracers to investigatemountain-block recharge to an intermountain basin. Ph.D.diss., University of Utah, Salt Lake City, Utah.
Mao, J., R. Kerrich, H. Li, and Y. Li. 2002. High 3He/4He ratiosin the Wangu gold deposit, Hunan Province, China: Im-plications for mantle fluids along the Tanlu deep fault zone.Geochemical Journal 36, no. 3: 197–208.
Mariner, R.H., J.B. Lowenstern, and G. Nimz. 2000. Isotopiccomposition of snow at Medicine Lake volcano, CA (USA)and implications for recharge to the 37 m3 s21 Fall River
16 S. Earman et al. GROUND WATER
Springs. Geological Society of America Abstracts with Pro-grams 32, no. 7.
Maule, C.P., D.S. Chanasyk, and K. Muelenbachs. 1994. Iso-topic determination of snow-water contribution to soilwater and groundwater. Journal of Hydrology 155, no. 1–2:73–91.
Maurer, D.K., and A.H. Welch. 2001. Hydrogeology and geo-chemistry of the Fallon Basalt and adjacent aquifers, andpotential sources of basalt recharge, in Churchill County,Nevada. USGS Water-Resources Investigations Report 01-4130. Reston, Virginia: USGS.
Morrison, R.B. 1991. Quaternary geology of the southern Basinand Range province. In Quaternary Nonglacial Geology:Conterminous U.S. Geology of North America, vol. K-2,ed. R.B. Morrison, 353–371. Boulder, Colorado: Geo-logical Society of America.
National Institute of Statistics Geography and Information(INEGI)/National Institute of Ecology (INE)/SEMARNAP.1999. Sustainable development indicators of Mexico. http://www.onlinelearning.unu.edu/ayuquila/e-archive/18.pdf(accessed November 14, 2007).
Nelson, S.T., and D. Dettman. 2001. Improving hydrogen iso-tope ratio measurements for on-line chromium reductionsystems. Rapid Communications in Mass Spectrometry 15,no. 23: 2301–2306.
Newell, D.L., L.J. Crossey, K.E. Karlstrom, T.P. Fischer, andD.R. Hilton. 2005. Continental-scale links between themantle and groundwater systems of the western UnitedStates: Evidence from travertine springs and regional Heisotope data. GSA Today 15, no. 12: 4–10.
Oram, P. III. 1993. Maps showing groundwater conditionsin the Willcox Basin, Graham and Cochise counties,Arizona-1990. Hydrologic Map Series Report no. 25, 2sheets with text. Phoenix, Arizona: Department of WaterResources.
Oxburgh, E.R., R.K. O’Nions, and R.I. Hill. 1986. Helium iso-topes in sedimentary basins. Nature 324, 18/25 December:632–635.
Pearthree, P.A. 1986. Late Quaternary faulting and seismichazard in southeastern Arizona and adjacent portions ofNew Mexico and Sonora, Mexico. Open File Report 86-8.Tucson, Arizona: Arizona Geological Survey.
Phillips, F.M., M.K. Tansey, L.A. Peeters, S. Cheng, and A.Long. 1989. An isotopic investigation of groundwater inthe central San Juan Basin, New Mexico: Carbon 14 datingas a basis for numerical flow modeling. Water ResourcesResearch 25, no. 10: 2259–2273.
Plummer, L.N., E.C. Prestemon, and D.L. Parkhurst. 1991. Aninteractive code (NETPATH) for modeling net geochemicalreactions along a flow path. USGS Water-Resources Inves-tigations Report 91-4078. Reston, Virginia: USGS.
Plummer, L.N., J.F. Busby, R.W. Lee, and B.B. Hanshaw. 1990.Geochemical modeling of the Madison Aquifer in parts ofMontana, Wyoming, and South Dakota. Water ResourcesResearch 26, no. 9: 1981–2014.
Rascona, S.J. 1993. Maps showing groundwater conditions inthe Douglas Basin, Cochise County, Arizona-1990. Hydro-logic Map Series Report no. 26, 2 sheets with text. Phoenix,Arizona: Department of Water Resources.
Robertson, F.N. 1991. Radiocarbon dating in the San Pedro Val-ley, southeastern Arizona. Radiocarbon 33, no. 2: 236–237.
Scarborough, R.B., and H.W. Peirce. 1978. Late Cenozoicbasins of Arizona, In Land of Cochise, Southeastern Ari-zona, New Mexico Geological Society Twenty-Ninth FieldConference Guidebook, ed. J.F. Callender, J.C. Wilt, andR.E. Clemons, 253–259. Socorro, New Mexico: NewMexico Geological Society.
Schreiber, J.F. Jr. 1978. Geology of the Willcox Playa, CochiseCounty, Arizona. In Land of Cochise, SoutheasternArizona, ed. J.F. Callender, J.C. Wilt, and R.E. Clemons,277–282. Socorro, New Mexico: New Mexico GeologicalSociety.
Schwab, K.J. 1992. Maps showing groundwater conditions inthe San Bernardino Valley Basin, Cochise County, Arizo-na, and Hidalgo County, New Mexico—1991. Phoenix,Arizona: Department of Water Resources, 1 sheet withtext.
Shevenell, L., F. Goff, F. Vuataz, P.E. Trujillo Jr., D. Counce,C.J. Janik, and W. Evans. 1987. Hydrogeochemical datafor thermal and nonthermal waters and gases of the VallesCaldera-Southern Jemez Mountains region, New Mexico.Report LA-10923-OBES. Los Alamos, New Mexico: LosAlamos National Laboratory.
Simpson, E.S., D.B. Thorud, and I. Friedman. 1972. Disting-uishing seasonal recharge to groundwater by deuteriumanalysis in southern Arizona. In World Water Balance: Pro-ceedings of the Reading Symposium, July 1970, Volume 3,International Association of Scientific Hydrology-UNESCO-WMO Studies and Reports in Hydrology, vol.11; Publication No 94 of the International Association ofScientific Hydrology, pp. 623–633.
Smalley, R.C. 1983. An isotopic and geochemical investigationof the hydrogeologic and geothermal systems in the SaffordBasin, Arizona. M.S. thesis, University of Arizona, Tucson,Arizona.
Socki, R.A., H.R. Karlsson, and E.K. Gibson Jr. 1992. Extrac-tion technique for the determination of oxygen-18 in waterusing preevacuated glass vials. Analytical Chemistry 64,no. 7: 829–831.
Spiegel, Z. 1957. Geology: New Mexico State Engineer OfficeTechnical Report No. 11. In Ground Water in Animas Val-ley, Hidalgo County, New Mexico, ed. H.O. Reeder, 9–12.Santa Fe, New Mexico: New Mexico State EngineerOffice.
State of Arizona. 2006a. Arizona Water Resources and Issues(Report to the Border Governors Conference). http://www.tceq.state.tx.us/assets/public/compliance/R15_Harlingen/US-MX%20BGC%20Water%20table%20documents/US%20States/Arizona/bgc_resources_and_issues_presentation_final.ppt (accessed November 14, 2007).
State of Arizona. 2006b. Border Governor’s Conference WaterTable Summary of Water Management in Arizona. http://www.tceq.state.tx.us/assets/public/compliance/R15_Harlingen/US-MX%20BGC%20Water%20table%20documents/US%20States/Arizona/bcgwater_admin_overview.doc (accessedNovember 14, 2007).
Stewart, J.H., R.E. Anderson, J.J. Aranda-Gomez, L.S. Beard,G.H. Billingsley, S.M. Cather, J.H. Dilles, R.K. Dokka, J.E.Faulds, L. Ferrari, T.L.T. Grose, C.D. Henry, S.U. Janecke,D.M. Miller, S.M. Richard, P.D. Rowley, J. Roldan-Quintana,R.B. Scott, J.W. Sears, and V.S. Williams. 1998. Mapshowing Cenozoic tilt domains and associated structuralfeatures, western North America. In Accommodation Zonesand Transfer Zones: The Regional Segmentation of the Basinand Range Province, ed. J.E. Faulds and J.H. Stewart.Boulder, Colorado: Geological Society of America, SpecialPaper 323.
Stover, C.W., and J.L. Coffman. 1993. Seismicity of the UnitedStates, 1568–1989 (Revised). USGS Professional Paper1527. Reston, Virginia: USGS.
Toth, J. 1962. A theory of groundwater motion in small drainagebasins in central Alberta. Journal of Geophysical Research67, no. 11: 4375–4387.
Wahi, A.K. 2005. Quantifying mountain system recharge in theUpper San Pedro Basin, Arizona, using geochemicaltracers. M.S. thesis, University of Arizona, Tucson,Arizona.
Wallace, T.C. 1990. Summary of earthquake activity in Arizonafor 1989; southern Arizona. Arizona Geology 20, no. 1: 6–7.
Wallace, T.C., and P.A. Pearthree. 1989. Recent earthquakes innorthern Sonora. Arizona Geology 19, no. 3: 6–7.
Wertz, J.B. 1970. The Texas lineament and its economic signifi-cance in southeast Arizona. Economic Geology 65, no. 2: 166–181.
S. Earman et al. GROUND WATER 17
White, D.E., and G.A. Waring. 1963. Volcanic emanations.USGS Professional Paper 440-K. In Data of Geochemistry,Chap. K, 6th ed, M. Fleischer. USGS Professional Paper440. Reston, Virginia: USGS.
Wilson, L.G., K.J. DeCook, and S.P. Neuman. 1980. Regionalrecharge research for Southwest alluvial basins. Unnum-bered Report. Tucson, Arizona: Arizona Water ResourcesResearch Center.
Winograd, I.J., A.C. Riggs, and T.B. Coplen, 1998. The relativecontributions of summer and cool-season precipitation togroundwater recharge, Spring Mountains, Nevada, USA.Hydrogeology Journal 6, no. 1: 77–93.
Wood, W.W., and W.H. Low. 1986. Aqueous geochemistryand diagenesis in the eastern Snake River Plain aquifer sys-tem Idaho. Geological Society of America Bulletin 97, no.12: 1456–1466.
18 S. Earman et al. GROUND WATER