Embed Size (px)
Citation preview
1
Author version: J. Asian Earth Sci., vol.56; 2012; 42-53 Tectonic and volcanic implications of a cratered seamount off Nicobar Island, Andaman Sea K. A. Kamesh Raju1*, Durbar Ray1, Abhay Mudholkar1, G. P. S. Murty1, V. K. Gahalaut2, Kiranmai
Samudrala1, A. L. Paropkari1, Ratheesh Ramachandran1, L. Surya Prakash1 1CSIR-National Institute of Oceanography, Dona Paula, Goa - 403004, India
2CSIR-National Geophysical Research Institute, Hyderabad – 507007, India.
Abstract
The region of the Nicobar earthquake swarm of January 2005 has been explored during a recent cruise
using multibeam swath bathymetry, seafloor imaging and TV-guided sampling to decipher the seafloor
morphology, nature and tectonic frame work. A seamount with well-developed crater at the summit was
discovered near to the center of the Nicobar swarm. Rock samples collected by TV- guided grab from
the seamount crater are dacite, rhyolite and andesite type with a veneer of ferromanganese oxide
coating. The aggregates recovered from the slope consisted of manganese globules. The
geochemistry of the globules suggests 66 to 97% Mn-oxide indicative of hydrothermal origin. The
morphology of the seamount, seafloor video footage and geochemistry of the seabed samples suggest
that the cratered seamount has erupted in the recent geological past and is dormant at present. This is
the first documented report of submarine arc-volcanism in the Andaman Sea. This finding substantiates
the prediction of a submarine volcano east of Nicobar Island. Study of the seismicity and the stress
pattern in the region suggest that the earthquake swarm in the region occurred due to 2004 Sumatra-
Andaman megathrust earthquake. The derived stress pattern suggests that the 2004 earthquake
greatly reduced the normal stress in the region of West Andaman fault from the planes or unclamped
them. Thus unclamping of the region by the 2004 Sumatra Andaman earthquake led to the initiation of
the swarm through predominantly strike slip faulting. The newly discovered dormant submarine volcano
indicates the volcanic nature of the region. We suggest that this submarine volcano is a link between
sub-aerial volcanoes of Barren-Narcondam Islands of the Andaman Sea and the volcanoes of Sumatra.
Keywords: Andaman; Seamount; seismicity; multibeam bathymetry; volcano; geochemistry; petrology
* Corresponding author: K. A. Kamesh Raju,
Geological Oceanography Division,
National Institute of Oceanography, Dona Paula, Goa – 403004, India
Tel.: +91-832-2450332; fax: +91-832-2450602; E-mail address: [email protected]

2
1. Introduction
The most energetic earthquake swarm that has ever been recorded globally (Lay et al., 2005)
nucleated east of Nicobar Island in the Andaman Sea during January 2005. This swarm is considered
as an aftershock effect of the tsunamigenic Great Sumatra-Andaman earthquake of 26 December,
2004 of magnitude Mw 9.3 that ruptured a 1600 kilometer-long stretch of the megathrust zone, the
longest rupture zone of any recorded earthquake (Fig. 1). The swarm consisted of more than 120
individual events, all of greater than Mw 5.0 magnitude, in a time span of ~ 48 hours (Fig. 2).
Earthquake swarms occur as a result of two broad tectonic processes (Hill et al., 2002), as an
aftershock event of a great earthquake and as a consequence of or in precedence of a spurt in volcanic
activity. For example, volcanic activity and lateral dike injection was found to be associated with 1998
axial seamount swarm (Dziak and Fox, 1999). Stress transfer due to crustal deformation was
suggested as the likely cause of an Izu island swarm (Toda et al., 2002). The 1996 swarm of Loihi
seamount was preceded by at least one eruption and accompanied by the formation of summit crater,
the Pele’s pit (Garcia et al., 1998). The periodically triggered seismicity and renewed volcanism at
Mount Wrangell, Alaska, a place as far as 11,000 km away from Sumatra was attributed to the
aftershocks following the great Sumatra-Andaman earthquake (West et al., 2005). Based on numerical
model studies, Walter and Amelung (2007) predicted that maximum sub-seafloor volumetric
deformation occurred during the megathrust earthquake in December 2004 to the east of Nicobar
Island and suggested possible submarine volcanic activity in the region.
We conducted multidisciplinary investigations in November 2007, using multibeam bathymetry,
underwater video and seabed sampling with a TV-guided grab over the Nicobar swarm region onboard
RV Sonne, chartered by the National Institute of Oceanography, Goa, India, to decipher the nature of
the seafloor and tectonic frame work of the swarm area. We also analyzed the seismicity and the stress
pattern in the region to investigate the mechanism of the earthquake swarm and to find out probable
reasons for the occurrence of the swarm at this preferred location.
2. Geodynamic setting
The general physiographic features of the Andaman Basin were well described by Rudolfo (1969). The
convergence between the Indian and Southeast Asian plates in the Andaman Sea is characterized by
varying degree of obliquity and rate of subduction (Sieh and Natawidjaja, 2000). Oblique subduction,
the initiation of Andaman back arc spreading (Kamesh Raju et al., 2004; Curray, 2005), and the
volcanic arc consisting of Barren-Narcondam Island volcanoes are the important tectonic elements in
the Andaman Sea (Fig. 1). Furthermore, the major fault systems connecting the Sagaing Fault in

3
Myanmar to the Sumatra fault (e.g., Sieh and Natawidjaja, 2000; Vigny et al., 2003; Kamesh Raju et al.,
2004, Kamesh Raju et al., 2007), the joining of Sumatra Fault (SF) with the West Andaman Fault
(WAF) are also influencing the geodynamics, and modulate the stress regime (Fig. 1) in this area. The
motion along the major fault-systems (viz. Sagaing Fault, Sumatra Fault and West Andaman Fault) is
predominantly strike-slip. The principal stress directions are in general consistent with the coseismic
displacement of the two recent major earthquake events of December 2004 and March 2005 and the
direction of convergence derived from the GPS measurements in the interseismic period (Gahalaut and
Gahalaut, 2007).
Barren Island is the only known active volcano in the northern Andaman Sea (Sheth et al., 2009; 2010
and 2011). Based on the known volcanoes in the region, there is a distinct gap in active volcanoes from
06oN to 12oN. Subduction of the base of the Ninety-east Ridge was suggested as one of the possible
reasons for this gap in volcanic activity (Subrahmanyam et al., 2008). It is interesting to note the occurrence of several earthquake swarms (S1 - S7, Fig. 1) at frequent intervals in different parts of the
Andaman Sea. These swarms have occurred along the back arc spreading center (S2 in 1984), near
the Nicobar Island (S1, S3, S4 and S7 during 1982, 1986, 1998 and 2005 respectively), along the off-
shore extension of the Sumatra fault (S5 in 2001) and near Simeulue Island (S6 in 2002). All the
earthquake swarms documented so far appear as minor events compared to the January, 2005 swarm
located off Nicobar Island. About 120 major (Mw>5.0) and more than 570 minor earthquakes
(1.0<Mw<5.0) were associated with the Nicobar earthquake swarm (S-7, Fig.1)
[http://earthquake.usgs.gov/regional/neic/]. The highest rate of occurrence of earthquake swarms is
located around Nicobar Island (Fig. 2).
3. Multibeam bathymetry: Morphology of the seamount
Multibeam bathymetry data were acquired by SIMRAD EM120 system operated at 12 kHz. In addition
to bathymetry, the EM120 acquires backscatter amplitude data that are used to produce seafloor
acoustic imagery. The swath bathymetry survey of the region discovered closely spaced twin
seamounts near the center of Nicobar swarm. One of the seamounts was characterized by the
presence of a crater; we carried out sampling with TV guided grab at this cratered seamount (CSM)
(Fig. 3). The CSM is 1500 m high and has a near-circular base of maximum diameter of 7.0 km. The
south-western flank of the CSM has prominent mounds while ridge-trough or gulley like feature is seen
on the north-western flank that can be traced down-slope from the crater (Fig. 3A). The mounds might
have been formed due to flank eruptions and troughs forming the gulley pattern are the result of lava
flow. The high backscatter zones with darker tones suggest seafloor devoid of sediment cover, this type
of tonal character is prominent on the crest and flanks of the seamount (Fig. 3B). This observation has

4
been made taking into consideration the possible artifacts seen as straight boundary lines between high
and low backscatter arising out of different contrast settings of the data. Flanks of the CSM have
distinct steep-sided concave slope (Fig. 3C), resembling conical stratovolcanoes (e.g., Rumble
volcanoes of of Kermadec arc, Wright, 1996) but distinctly differ from large gently sloping shield
volcanoes (e.g. Axial, Henderson, Emperor, Loihi seamounts). The crater has a near circular rim and
has a width of 576 m in the East –West direction and a maximum depth of ~160 m from the rim top
(Fig. 3C). The crater is breached on the north-western side as seen in the 3-D rendered seafloor image
(Fig. 4) with an impression of lava flows through this breach (Fig. 4). The well-defined morphology
observed on the swath bathymetry image depicting the crater suggests volcanic eruptions in the recent
geological past.
The slump feature observed at the base of the southern flank (Fig. 3A) resembles volcano-clastic
debris that resulted from the eruptions and /or talus-scree due to slumping. The unconsolidated
aggregates or globules recovered from (TVG-09, Fig. 3C) the flank also suggest volcanoclastic
material. A similar volcanoclastic deposits around submarine arc-stratovolcanoes (e.g. Rumble
volcanoes of the Kermadec arc) were reported by Wright (1996). The adjacent seamount to the south
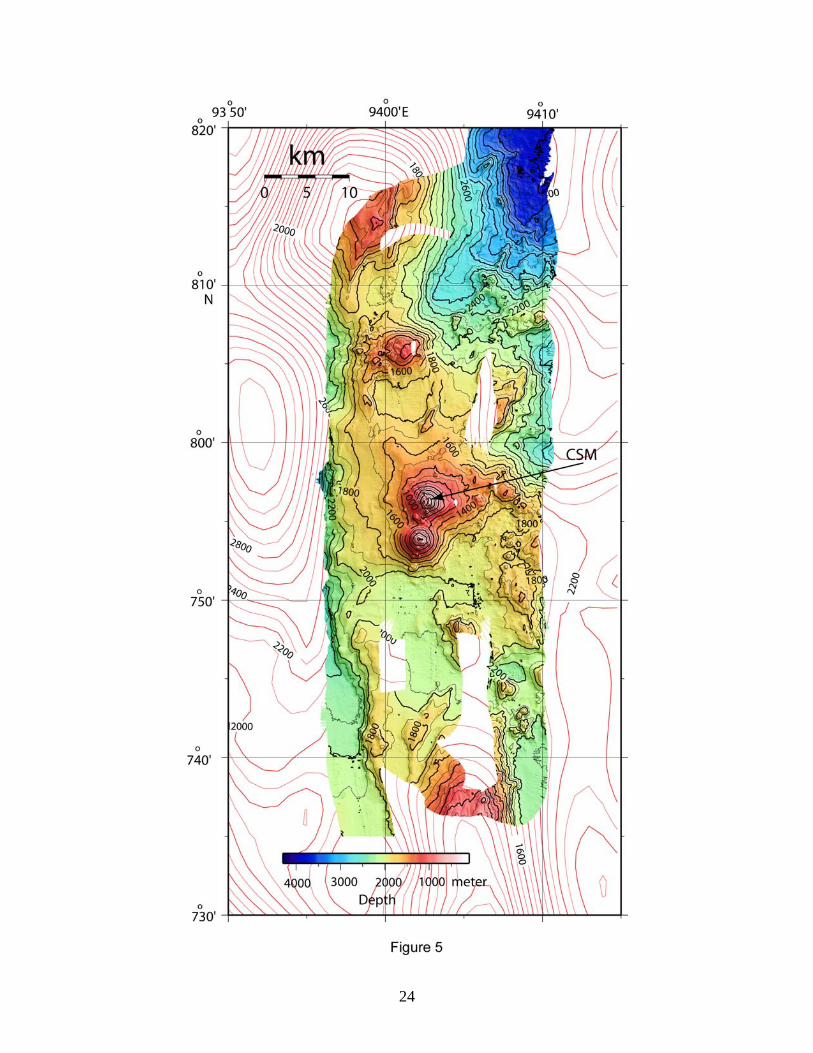
of CSM has a conical summit and rises to about 600 m water depth. Besides the twin seamounts at
07o55’N, there are four prominent seamounts between 07o35’N and 08o15’N to the north and south that
are partially mapped by the multibeam survey (Fig. 5). This chain of seamounts (Fig. 5) defines the
submarine volcanic arc east of Andaman Island arc on the eastern bounding wall of the WAF (Curray et
al., 1979; Kamesh Raju et al., 2007). The reported chain of volcanoes are closely spaced and smaller
in size compared to the typical subduction zone volcanoes. We measured the distances between the
volcanoes reported in the published figures appeared in the literature. Volcanoes in the Mariana arc,
Izu-Bonin arc regions (Usui and Nishimura, 1992), Tonga-Karmadec arc (de Ronde et al., 2001), and
Java-Sumatra arc region all in a normal subduction direction are spaced at an average distance of 60
to 120 km. Whereas the volcanoes in the region of oblique subduction such as Kuril arc (DeMets, 1992
and Glasby et al., 2006), Lesser-Antilles arc in Caribbean Sea (Calais et al., 2002) and the Andaman-
Sumatra arc (present study) are spaced closer at about 18-30 km distance. It appears that the closely
spaced volcanoes are dominant in the zones with oblique subduction, this observation, however,
requires further validation with the actual data.
4. Seabed sampling and analysis
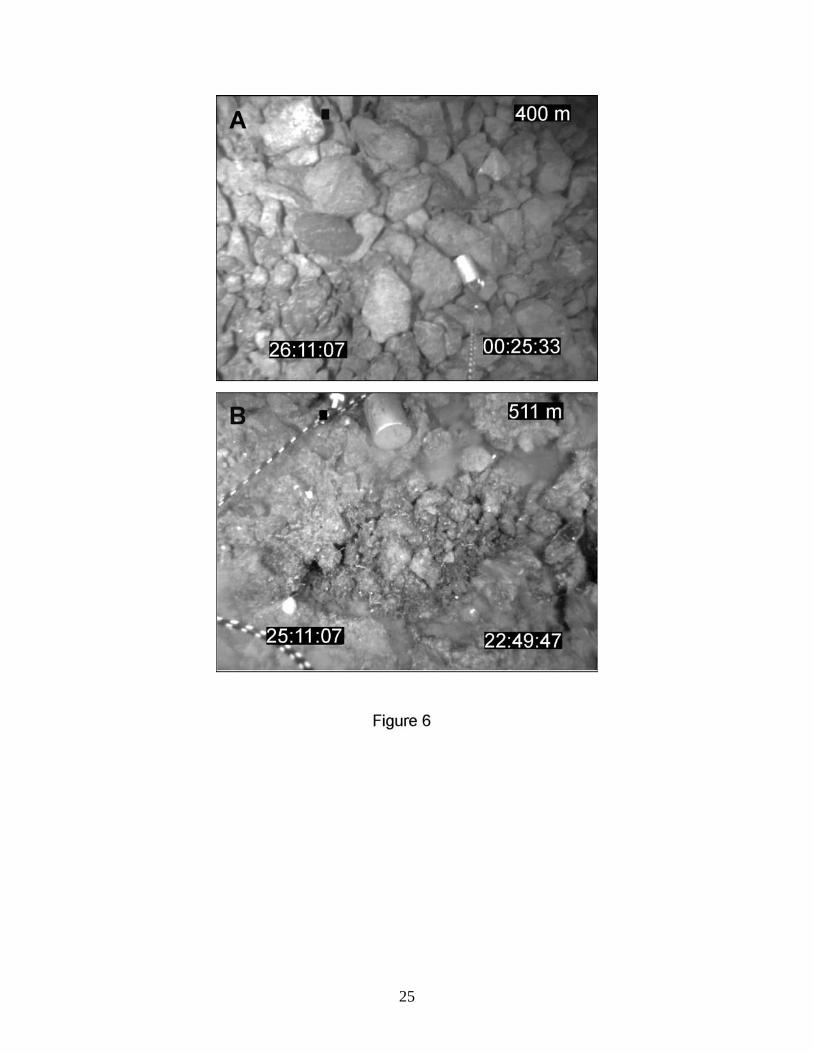
Rock samples were collected from the flank (TVG-09, depth 398 m, Fig. 3C) and within the crater
(TVG-10, depth 511 m, Fig. 3C) using a TV-guided grab along with video footage. The crater floor is
devoid of sediments and unconsolidated aggregates are seen on the flank (Figs. 6A and 6B). Dacites
5
recovered from the crater have aphanitic dark grey colored glassy ground mass with white specs of
plagioclase phenocrysts (Fig. 7A). Thin sections of the rocks were gold coated for SEM-EDS analyses
(semi-quantitative) to determine the mineral composition. The EDS data was run through an MS Excel
Visual Basic application (Brandelik, 2009) to identify the mineral phases.
Rock samples from TVG -09 and 10 are partly weathered, some of them with a veneer of Fe-Mn oxide
coating. The fresh portion was powdered for the major element oxide determination. Borate glass
beads of the rock powder were prepared using Spectromelt® A12 of Merck. These beads were
analyzed for major element composition by XRF (Axios, PANalytical, The Netherlands), at NIO, Goa.
The XRF was calibrated with international rock standards from Geological Survey of Japan (JA-1, JR-3)
(Table 1) with accuracy ± 3.0 – 4.0%.
Unconsolidated aggregates that are recovered from the flanks (TVG-09) consisted of Mn oxide globules
varying from few mm to cm in size. The oxide coatings are scrapped from the rock surface (TVG 10)
and powdered. Fine powdered samples were analyzed for mineralogy with an X-ray diffractometer
using Cu-Kα radiation over 2θ range from 05º to 60º. The globules were examined under a Scanning
Electron Microscope (SEM) and analysed using Energy Dispersive Spectrum (EDS) for semi-
quantitative chemical composition. The oxide samples were digested with acid mixture
(HF:HNO3:HClO4::7:3:1) and the final solutions were prepared with Mill-Q water. Trace and rare earth
element concentrations were measured with an ICP-MS using 20 ng/ml 103Rh solution as internal
standard (Balaram and Gnaneshwar Rao, 2003). An analytical accuracy of ±3.0% was achieved
against the marine reference standard material MAG-1 (from USGS). Elemental compositions are
presented in Tables 2 and 3. Fe-isotope composition of the globule was analyzed with a Multicollector-
ICP-MS (Nu plasma–HR from M/s. Nu Instruments, UK) following Albarede and Beard, (2004). Total Fe
was separated from 50 mg of digested samples using AG-MP1 anion exchange resin column eluted
with 10 ml of 2.0 N HCl and 0.001% H2O2 mixture. Iron recovery of > 97 % was achieved. The eluted
fractions were evaporated and re-dissolved in 2.0 % HNO3.
Isotopic analysis was carried out with standard-sample-bracketing mode using IRMM-014 as standard
reference material. Seventy six measurements of IRMM-014 were analyzed over a period of more than
three months yielded an average δ56Fe value 0.003 ±0.12 (2σ) ‰. The errors on 56/54Fe measurement
in all the analytical sessions varied between 0.02 to 0.08 ‰ (1σ) and 57/54Fe vary between 0.04 to 0.16
‰ (1σ). The IRMM-014 values in a single session analysis also show variations of about ±0.1 ‰ (2σ).
Therefore a precision of ±0.1 ‰ (2σ) is applicable to the compositions of samples as well. Analysis of

6
BCR-2 and IF-G standards yielded a δ56Fe value of 0.04 ±0.11 (2σ) and 0.71 ±0.14 (2σ) against
reported values of 0.039 ±0.055 (2σ) and 0.631 ±0.019 (2σ) (Dauphas and Rouxel, 2006), respectively.
5. Petrology and geochemistry of rocks
Rocks recovered from the CSM flank (TVG-09) and within the crater (TVG-10) are vesicular with vitric
groundmass containing phenocrysts of plagioclase (a dominant mineral phase), green to pink
pleochroic ortho-pyroxene, and opaque minerals like, magnetite or ilmenite (Fig. 7B). Clino-pyroxenes
are observed which are volumetrically less compared to ortho-pyroxene. Other mineral phase, feldspar,
is present as large phenocrysts and small thin acicular laths in groundmass (Fig. 7C). These feldspars
have high Na2O content (~4%). The major element composition of these rocks (Table 1) was plotted on
the rock classification diagram (Fig. 8), based on the SiO2 and total alkali (Na2O + K2O) content (Le Bas
et al., 1986). Rocks from the flanks are mostly dacite and few plot on the border of andesite-dacite field
while rocks recovered from within the crater comprise of rhyolite to dacite to andesite a sort of whole
spectrum of back-arc volcanism (Fig. 8). This type of rock assemblages are commonly found at arc-
volcanoes erupting silicic viscous magma (Feeley and Dungan, 1996). We have plotted the reported
volcanics data of Barren Island (Luhr and Haldar, 2006; Chandrasekharam et al., 2009 and Sheth et al.,
2011) and Narcondam Island volcanoes (Pal et al., 2007). The composite data on the rock classification
TAS diagram (Fig. 8) show geochemical continuity from basalt to basaltic andesite to andesite of
Barren Island volcanics, while andesites from Narcondam Island volcano show affinity to the rocks
recovered from the CSM. The andesite and dacite type of rocks of CSM resemble rocks of
stratovolcanoes of Indonesia (Rittmann, 1953).
6. Geochemistry of Fe-Mn-oxides
6.1. SEM observation and mineralogy
The Scanning Electron Microscopic (SEM) images show that oxide globules are attached to each other
and form aggregates (Fig. 9A). Typical honeycomb-like features on the globule surfaces (Figs 9B and
9C) resemble other submarine hydrothermal oxide deposits (e.g., Usui and Nishimura, 1992; Buatier et
al., 2004; Fitzgerald and Gillis, 2006). The internal structure of the globule (Fig. 9D) is devoid of any
growth layers, suggesting instantaneous precipitation of metal rich fluid. Energy dispersive spectrum
(EDS) analysis shows that these globules are mostly composed of manganese oxide (66 to 97% of
total, Auxiliary material 1 and 2) along with oxides of Al, K, Na, Fe and Ca in varying percentages. X-ray
diffraction data demonstrate the presence of 10Å manganate (Todorokite) as a major mineral. A similar
suite of minerals in hemispheroidal globules formed by low temperature hydrothermal fluid-sediment

7
interaction has been reported on a seamount flank (Usui and Nishimura, 1992). Besides manganate,
oxide coatings also have considerable amount of pyrolusite (β-MnO2) and goethite. Within the globule-
aggregates (Fig. 9A) several silicic (SiO2 > 65% in EDS analyses, Figs. 9F and 9H) volcanoclastic rock
fragments (pyroclasts) were found (Figs. 9E and 9G). SEM images of these pyroclasts shows distinct
fluid or gas emission features on their surface.
6.2. Bulk geochemistry and Fe–isotopic composition
Geochemical analysis of ferromanganese coatings and globules showed higher concentration of Mn
(24 to 35%) relative to Fe (0.3 to 6.0%) and thus high Mn to Fe ratio (Mn/Fe = 04 to 126, Table 2)
resembling typical hydrothermal deposits (Eckhardt et al. 1997, Fitzgerald and Gillis 2006, Frank et al.
2006). Low concentrations (<1000 ppm) of Cu, Co and Zn (Table 2) accompanied with considerable
enrichment of fluid-mobile Li (60 - 475 ppm), Ba (570 - 4800 ppm) and Mo (80 - 420 ppm) also suggest
a hydrothermal origin. Moreover, low concentration of other trace elements (e.g., Zr < 50 ppm, Y < 60
ppm, Nb < 2.0 ppm, Hf < 0.7 ppm and total REE < 100 ppm) (Tables 2 and 3), immobile in hydrous
subduction melts (Kuhn et al., 2003), is indicative of back arc hydrothermalism.
Total REE concentrations of these deposits are extremely low with ΣREE ranging between 45 to 92
ppm. The shale (PAAS) normalized REE patterns are characterised by minor positive Eu anomalies
(Eu/Eu* = 1.2 - 1.9), negative Ce anomalies (Ce/Ce* = 0.2 - 0.9) and heavy rare earths (HREE)
enrichment (Ndn/Ybn = 0.25 - 0.3) (Table 3), and resemble typical hydrothermal deposits reported from
other back-arc basins (Frank et al., 2006, Takahashi et al., 2007) (Fig. 9). Significantly negative Ce
anomalies of globules (Ce/Ce* = 0.22) may have resulted from limited fluid-sea water interaction while
enhanced anomalies (Ce/Ce* = 0.51 - 0.98) in coatings imply oxidative scavenging of Ce(IV) on
hydrothermal particulates prior to their settling. Relative enrichment of HREE in PAAS normalized REE
pattern is likely due to the low temperature hydrothermal activity as in the case of Lesser Antilles (Frank
et al., 2006) and TAG field (Mills et al., 2001). Increasing solubility of Eu+2 with temperature makes
positive Eu-anomaly in hydrothermal fluid. Thus slightly positive Eu anomalies of these ferromanganese
oxides indicate precipitation of hydrothermal fluid.
Analysis of Fe-isotope composition in Mn-rich globules revealed significant enrichment of heavy
isotopes (δ56Fe = +0.213 ± 0.031‰ and δ57Fe = +0.599 ± 0.063‰) relative to IRMM-014 standard.
Such isotopic composition is similar to typical low temperature hydrothermal Fe-Mn oxides having
characteristic range of δ56Fe (-1.6 to +0.3‰) and δ57Fe (-3.0 to +0.8‰) values (Rouxel et al., 2003;
Dauphas and Rouxel; 2006).
8
7. Mechanism of the swarm
The 2005 earthquake swarm, the largest ever on the globe, appears to have occurred on the NWN-
SES oriented WAF. The swarm initiated in predominantly strike slip manner with one of the nodal plane
consistent with the strike of the WAF. However, after a day of the initiation of the swarm, the
predominant slip during the earthquakes became normal in displacement (Fig. 11) along the NE-SW
oriented planes. It probably implies that in the region of the swarm the dextral strike slip on WAF takes
a small right step to form a releasing bend wherein these normal earthquakes occurred. The majority of
the earthquakes occurred at depths ranging from 15 to 25 km (EHB catalogue from ISC). We calculate
the stress change caused by the 2004 Sumatra-Andaman earthquake on the dextral strike slip planes
whose strike, dip, and rake is consistent with that of the initial focal mechanism solutions of the swarm
and the WAF. We find that the 2004 Sumatra-Andaman earthquake greatly influenced the region of
swarm by strongly increasing the Coulomb stress (Fig. 12). In fact the 2004 earthquake greatly reduced
the normal stress from the planes or unclamped them. The delay of about a month in triggering the
swarm could be because of transfer of stresses through redistribution of the fluids in the region. Thus
unclamping of the region by the 2004 Sumatra Andaman earthquake led to the initiation of the swarm
through predominantly strike slip faulting.
8. Discussion
Our recent survey in the region of the Nicobar earthquake swarm found two steep-sided seamounts
near the center of the earthquake swarm. The volcanic nature of the cratered seamount (CSM) is
inferred from morphology, geochemistry of the samples from the crater floor and flanks, and the
seafloor images. The dacites recovered from the CSM flanks and the crater floor along with andesite
and rhyolite show a geochemical continuity with dacites-andesites from the Narcondam Island volcano.
Major and trace element geochemistry of Mn rich globules occurring as unconsolidated aggregates on
the flank of the CSM indicates that these are low-temperature hydrothermal manganese oxide deposits.
The positive Eu and negative Ce anomalies in shale normalized rare earth patterns also substantiate
the hydrothermal nature of these samples. This chemical composition is similar to other hydrothermal
ferromanganese crusts reported on the Kaikata seamount of the Izu-Bonin arc (Usui and Nishimura,
1992), Franklin seamount of the Woodlark basin, SW Pacific (Bogdanov et al. 1997), Enarete and
Palinuro seamounts in the Tyrrhenian sea (Eckhardt et al. 1997).
The Fe isotopic composition of globules, TVG-9G (56Fe = +0.21 and 57Fe = +0.59) is similar to that
observed in buoyant hydrothermal plume particulates having unoxidised Fe+2(aqu) (Severmann et al.,
2004). So Fe-isotopic fractionation in globule can be explained in terms of incomplete oxidation of

9
dissolved Fe+2 to Fe+3 in hydrothermal fluid prior to oxide formation, as mentioned by Welch et al.
(2003). The relative enrichment of heavier Fe-isotopes indicates that the globules are formed at the rate
faster than the residence time of dissolved Fe+2 in seawater and thus confirm the hydrothermal origin of
these oxide globules.
A recent satellite based study on the eruptions of two Javanese volcanoes, Merapi and Semeru,
suggested enhanced output in response to the earthquake (Mw = 6.4) occurred in Java on 26 May 2006
[Harris and Ripepe, 2007]. During the past decade the Barren Island volcano had four major eruption
episodes during 1991, 1994-95, 2004-06, and 2008-ongoing, as documented by Sheth et al., 2009,
2010 and 2011. Increased eruptions of the Barren Island volcano in the Andaman Sea during May
2005 to mid March 2006, as documented by visual and thermal anomalies from the MODIS/MODVOLC
satellite observations (http://www.volcano.si.edu), can be attributed to the delayed response of the
great Sumatra-Andaman earthquake. Volcanic eruptions at Talang in April 2005 are also probably
linked to the aftershock effects of Mw = 9.3 and Mw = 8.7 earthquakes of the Andaman Sumatra region
(Walter and Amelung, 2007). It is generally agreed that more than one mechanism is involved in the
complex interaction of earthquakes and volcanoes (Hill et al., 2002; McNutt, 2005; Eggert and Walter,
2009). Eruptions have occurred following the large earthquake due to a change in static stress along
the same subduction zone resulting in induced volcanic activity (Hill et al., 2002; Walter and Amelung,
2007). Earthquakes are triggered due to passing waves resulting in induced seismicity at distant places
(e.g., Wrangel earthquake), (Gomberg et al., 2001; West et al., 2005). Intense earthquake swarms
have also resulted from dike injection (Toda et al., 2002).
The swarm region is close to the dynamic tectonic setting greatly influenced by the confluence of the
WAF and the Sumatra fault. In terms of energy release the Nicobar earthquake swarm is the most
intense swarm ever documented (Lay et al., 2005) and the earthquake that triggered the swarm was a
mega event that excited the Earth’s free oscillations (Park et al., 2005). The Nicobar earthquake swarm
was characterized by both strike slip and normal fault earthquakes (Lay et al., 2005). Model studies of
Walter and Amelung [2007] show that the slip motion of plates at the subduction area cause volumetric
expansion in the far-trench region and increase the magmatic pressure underneath the back-arc
volcanoes, leading to eruptions. However, there is no real time evidence of revived submarine volcanic
activity at the CSM linked to the earthquake swarm following the megathrust earthquake of December
2004. The swarm activity is manifested over a wide zone of about 140 X 110 km and the intense swarm
trends in SW-NE direction (Fig. 2A), the wide spatial distribution perhaps indicate magmatic activity at
depth. It is interesting to note that the SW-NE trend observed here is parallel to the active back arc
spreading center (Kamesh Raju et al., 2004). The location of the cratered seamount coincides with the

10
first major earthquake (26th January 2005/033813 UTC/Mw4.8) that initiated the swarm. Dyking at
depth leading to the magmatic activity at depth that did not reach the surface could be one of the
reasons for the formation of the swarm.
The 2004 Sumatra-Andaman earthquake rupture zone (Fig. 1) is close to the Nicobar Islands and the
slip on the earthquake rupture was the largest (Lay et al., 2005; Gahalaut et al., 2006; Banerjee et al.,
2007) at this location. Thus due to large slip on the rupture and less distance between the rupture zone
and the WAF that was considered as a lithospheric boundary (Kamesh Raju et al., 2007), we expect
stress change to be larger than anywhere else in this region. Therefore it can be surmised that a
combination of stress change, structural and volcanic elements have contributed to the occurrence of
largest ever swarm in this region. These observations also imply that the occurrence of swarm is a
consequence of the stress changes triggered by the 2004 Sumatra Andaman earthquake.
Narcondam Island has been classified as an extinct volcano (Curray et al., 1979). Many workers have
suggested that the Narcondam and Barren Island volcanoes are the expressions of the Andaman
volcanic arc (Kamesh Raju et al., 2004; Curray, 2005). The cratered volcano reported in the present
investigation together with the seamounts to the north and south, form a chain of mounts defining the
submarine portion of the volcanic arc. This study provides evidence of a well-defined submarine
volcanic arc in the Andaman Sea and bridges the gap between the subaerial volcanoes of Sumatra in
the south and the Barren-Narcondam Island volcanoes in the north.
9. Conclusions
Twin seamounts at the center of the Nicobar earthquake swarm area in the Andaman Sea have been
mapped for the first time. The northern summit of these twin seamounts has a well developed crater.
The morphology of this cratered seamount and geochemical analysis of the seabed samples
particularly the ferromanganese oxides from the crater-floor and the flank suggests past volcanic
activity. The dacite-andesite type siliceous rocks of this seamount are similar to the rocks found at
typical stratovolcanoes along the volcanic arcs. These observations of the present investigation
suggest that the cratered seamount is a dormant submarine stratovolcano.
The 2004 earthquake greatly reduced the normal stress in the region of WAF from the planes or
unclamped them. Thus unclamping of the region by the 2004 Sumatra Andaman earthquake led to the
initiation of the swarm through predominantly strike slip faulting. The 2004 Sumatra-Andaman
earthquake rupture zone is close to the Nicobar Islands and the slip on the earthquake rupture was the
largest at the place of occurrence of the earthquake swarm. A combination of stress changes, and the

11
tectonics have contributed to the occurrence of largest ever swarm in this region. These observations
also imply that the swarm was initiated by the stress changes triggered by the 2004 Sumatra Andaman
earthquake.
This study for the first time presents evidence of active submarine volcanic arc in the Andaman Sea
and thus provides a link between Barren- Narcondam Island volcanoes in the north and Sumatran
volcanoes in the south.
Acknowledgements
We thank Dr. S. R. Shetye, Director, CSIR-NIO for encouragement and support. Thanks to Prof. D.
Chandrasekharam, IIT, Mumbai for XRD analysis. Thanks to Dr. Y. J. Bahskara Rao, Dr. B. Sreenivas
and MC-ICPMS group of CSIR-NGRI, Hyderabad for isotopic analysis. Mr. Bhaskar Kundu and Mr. P.
Mahesh of CSIR-NGRI are thanked for help in stress pattern analysis. Shri V.D. Khedekar is thanked
for the support of SEM-EDS analyses. We thank Dr. Hetu Sheth for critical review that has improved
the MS and Dr. Alba Santo for constructive review. The study was carried out under the CSIR (India),
Network program and the MoES funded Hydrothermal Sulphide exploration program. LSP thanks CSIR
for providing Senior Research Fellowship support. Master and crew of RV Sonne are thanked for their
support during the cruise. This is NIO contribution no. XXXX.
References
Albarede, F., Beard, B. L., 2004. Analytical methods for nontraditional isotopes. In: Johnson, C.M., Beard, B., L. and Albarede, F. (Eds.), Geochemistry of Nontraditional Stable Isotopes. Reviews in Mineralogy and Geochemistry, vol. 55, pp. 113-152.
Ammon, C. J., Ji, C., Thio, H. K., Robinson, D., Ni, S., Hjorleifsdottir, V., Kanamori, H., Lay, T., Das, S., Helmberger, D., Ichinose, G., Polet, J., and Wald, D., 2005. Rupture process of the 2004 Sumatra-Andaman earthquake. Science, 308, 1133-1139.
http://www.volcano.si.edu. available at: Global Volcanism Program data, Smithsonian National Museum of Natural History, Washington, USA.
http://earthquake.usgs.gov/regional/neic/. available at: Global Search data, National Earthquake Information Center, United States Geological Survey, USA.
Balaram, V., Gnaneshwar Rao, T., 2003. Rapid determination of REEs and other trace elements in geological samples by microwave acid digestion and ICP-MS. Atom. Spectro., 24, 206-212.
Banerjee, P., Pollitz, F., Nagarajan, B., Burgmann, R., 2007. Coseismic Slip Distributions of the 26 December 2004 Sumatra–Andaman and 28 March 2005 Nias Earthquakes from GPS Static Offsets. Bull. Seism. Soc. Am., 97, S86–S102, doi: 10.1785/0120050609.
Bogdanov, Y. A., Lisitzin, A. P., Binns, R. A., Gorshkov, A. I., Gurvich, E. G., Dritz, V. A., Dubinina, G. A., Bogdonova, O. Y., Sivkov, A. V., Kuptsov, V. M., 1997. Low temperature hydrothermal deposits of Franklin Seamount, Woodlark Basin, Papua New Guinea. Mar. Geol., 142, 99-117.

12
Brandelik, A., 2009. CALCMIN –an EXCELTM Visual Basic application for calculating mineral structural formulae from electron microprobe analyses. Comp. Geosci., 35 (2009) 1540–1551.
Buatier, M. D., Guillaume, D., Wheat, C. G., Herve, L., Adatte, T., 2004. Mineralogical characterization and genesis of hydrothermal Mn oxides from the flank of the Juan the Fuca Ridge. Am. Mineral., 89, 1807-1815.
Calais, E., Mazabraud, Y., Mercier de Lepinay, B., Mann, P., Mattioli, G. S., Jansma, P. E., 2002. Strain partitioning and fault slip rates in the northeastern Caribbean from GPS measurements. Geophys. Res. Lett., 29, 1856, doi:10.1029/2002GL015397.
Chandrasekharam, D., Santo, A. P., Capaccioni, B., Vaselli, O., Alam, M. A., Manetti, P., Tassi, F., 2009. Volcanological and petrological evolution of Barren Island (Andaman Sea, Indian Ocean), J. Asian Earth Sci., 35, 469 –487.
Curray, J. R., Moore, D. G., Lawver, L. A., Emmel, F. J., Raitt, R. W., Henry, M., Kieckhefer, R., 1979. Tectonics of the Andaman Sea and Burma. Am. Assoc. Petrol. Geol. Mem., 29, 189-198.
Curray, J. R., 2005. Tectonics and history of Andaman sea region. J. Asian Earth Sci., 25, 187-232.
Dauphas, N., and O., Rouxel, 2006. Mass spectrometry and natural variations of iron isotopes. Mass Spectro. Rev., 25, 515-550.
DeMets, C., 1992. Oblique convergence and deformation along the Kuril and Japan Trances. J. Geophys. Res., 97, 17615-17625.
de Ronde C. E.J. de, E. T. Baker, G. J. Massoth, J. E. Lupton, I.C. Wright, R. A. Feely, and R.R. Greene (2001) Intra-oceanic subduction-related hydrothermal venting, Kermadec volcanic arc, New Zealand. Earth Planet. Sci. Lett., 193, 359-369.
Dziak, R. P., Fox, C.G., 1999. The January 1998 Earthquake swarm at Axial Volcano, Juan de Fuca Ridge: Hydroacoustic evidence of seafloor volcanic activity. Geophys. Res. Lett., 26, 3429-3432, doi:10.1029/1999GL002332.
Eckhardt, J.D., Glasby, G.P., Puchelt, H., Berner, Z., 1997. Hydrothermal manganese crusts from Enarete and Palinuro seamounts in the Tyrrhenian sea. Mar. Geore. & Goetech., 15, 175-208.
Eggert, S., Walter, T. R., 2009. Volcanic activity before and after large tectonic earthquakes: Observations and statistical significance. Technophysics, 471, 14-26.
Feeley, T.C., Dungan, M.A., 1996. Compositional and dynamic controls on mafic- silicic magma interactions at continental arc volcanoes: Evidence from Cordon El Guadal, Tatara-San Pedro complex, Chile. J. Petrol., 37, 1547-1577.
Fitzgerald, C. E., Gillis, K. M., 2006. Hydrothermal manganese oxide deposits from Baby Bare seamount in the Northeast Pacific Ocean. Mar. Geol., 225, 145-156.
Frank, M., Marbler, H., Koschinsky, A., van de Flierdt, T., Klemm, V., Gutjahr, M., Halliday, A.N., Kubik, P.W., Halbach, P., 2006. Submarine hydrothermal venting related to volcanism in the Lesser Antilles: Evidence from ferromanganese precipitates. Geochem. Geophys. Geosys., 7, Q04010, doi:10.1029/2005GC001140.
Gahalaut, V.K. and K. Gahalaut (2007), Burma plate motion. J. Geophys. Res., 112, B10402, doi:10.1029/2007JB004928.
Gahalaut, V.K., Nagarajan, B., Catherine, J.K., Kumar, S., 2006. Constraints on 2004 Sumatra–Andaman earthquake rupture from GPS measurements in Andaman–Nicobar Islands. Earth Planet. Sci. Lett., 242, 365– 374.

13
Garcia, M.O., Graham, D.W., Muenow, D.W., Spencer, K., Rubin, K. H., Norman, M. D., Rhodes, J. M., 1998. Petrology and geochronology of basalt breccia from the 1996 earthquake swarm at Loihi Seamount, Hawaii: magmatic history of its 1996 eruption. Bull. Volc., 59, 577–592.
Glasby, G.P., Cherkashov, G.A., Gavrilenko, G.M., Rashidov, V.A., Slovtsov, I.B., 2006. Submarine hydrothermal activity and mineralization on the Kurile and western Aleutian island arcs, N.W. Pacific. Mar. Geol., 231,163-180.
Gomberg, J., Reasneberg, P. A., Bodin, P., Harris, R. A., 2001. Earthquake triggering by seismic waves following the Landers and Hector Mine earthquakes. Nature, 411, 462-466.
Hill, D. P., Pollitz, F., Newhall, C., 2002. Earthquake-volcano interactions. Physics Today 55 (11), 41-47.
Harris, A. J. L., Ripepe, M., 2007. Regional earthquake as a trigger for enhanced volcanic activity: Evidence from MODIS thermal data. Geophys. Res. Lett., 34, L02304, doi:10.1029/2006GL028251.
Kamesh Raju, K. A., Ramprasad, T., Rao, P. S., Rao, B. R., Varghese, J., 2004. New insights into the tectonic evolution of the Andaman Basin, northeast Indian Ocean. Earth Planet. Sci. Lett. 221, 145-162.
Kamesh Raju, K. A., Murty, G. P. S., Amarnath, D., Mohan Kumar, M. L., 2007. The West Andaman Fault and its influence on the aftershock pattern of the recent megathrust earthquakes in the Andaman-Sumatra region. Geophys. Res. Lett., 34, L03305, doi:10.1029/2006GLO28730.
Kuhn, T., Bostick, B. C., Koschinsky, A., Halbach, P., Fendorf, S., 2003. Enrichment of Mo in hydrothermal Mn precipitates: possible Mo sources, formation process and phase associations. Chem. Geol., 199, 29-43.
Lay, T., Kanamori, H., Ammon, C. J., Nettles, M., Ward, S. N., Aster, R. C., Beck, S. L., Bilek, S. L., Brudzinski, M. R., Butler, R., DeShon, H. R., Ekstrom, G., Satake, K., Sipkin, S., 2005. The great Sumatra-Andaman earthquake of 26 December 2004. Science 308, 1127-1132.
Le Bas M. J., Maitre, R. W. Le., Streckeisen, A., Zanettin, B., 1986. A chemical classification of volcanic rocks based on the total alkali-silica diagram. J. Petrol., 27, 745–750.
Luhr, J.F. and Haldar, D. 2006. Barren Island volcano (NE Indian Ocean): Island arc high alumina basalts produced by troctolite contamination. Jour. Volc. Geotherm. Res., 149, 177-212.
McNutt, S. R., 2005. Volcanic Seismology: Annual Review of Earth and Planetary Science, 32, 461-491.
Mills R. A., Wells, D. M., Roberts, S., 2001. Genesis of ferromanganese crusts from TAG hydrothermal field. Chem. Geol., 176, 283-293.
Pal T., Mitra, S.K., Sengupta, S., Katari, A., Bandopadhyay, P.C., Bhattacharya, A.K., 2007. Dacite-andesites of Narcondam volcano in the Andaman Sea : An imprint of magma mixing in the inner arc of the Andaman-Java subduction system. J. Volc. Geotherm. Res., 168, 93-113.
Park J. T A Song, J Tromp, E Okal, S Stein, G Roult, E Clevede, G Laske, H Kanamori, P Davis, J Berger, C Braitenberg, M V Camp, X Lei, H Sun, H Xu, and S. Rosat (2005). Earth’s Free Oscillations Excited by the 26 December 2004 Sumatra-Andaman Earthquake. Science, 308, 1139.
Rudolfo, K. S., 1969. Bathymetry and marine geology of the Andaman Basin and tectonic implications for SE Asia. Geol. Soc. Am. Bull., 80, 1203-1230.
Rittmann A., (1953) Magmatic character and tectonic position of Indonesian volcanoes. Bull. Volc., 14, 45-58.
Rouxel O., Dobbek, N., Ludden J., Fouquet, Y., 2003. Iron isotope fractionation during oceanic crust alteration. Chem. Geol., 202, 155-182.
14
Severmann, S., Johnson, C.M., Beard, B.L., German, C.R., Edmonds, H.N., Chiba, H., Green D.R.H., 2004. The effect of plume processes on the Fe isotope composition of hydrothermally derived Fe in the deep ocean as inferred from the Rainbow vent site, Mid-Atlantic Ridge, 36o14’. Earth Planet. Sci. Lett., 225, 63-76.
Sheth, H.C., Ray, J.S., Bhutani, R., Kumar, A., Smitha, R.S., 2009. Volcanology and eruptive styles of Barren Island: an active mafic stratovolcano in the Andaman Sea, NE Indian Ocean. Bull. Volc., 71, 1021–1039.
Sheth, H. C., Ray, J. S., Bhutani, R., Kumar, A., Awasthi, N., 2010. The latest (2008-09) eruption of Barren Island volcano, and some thoughts on its hazards, logistics and geotourism aspects. Curr. Sci., 98, 620-626.
Sheth, H. C., Ray, J. S., Kumar, A., Bhutani, R., Awasthi, N., 2011. Toothpaste lava from the Barren Island volcano (Andaman Sea). J. Volcanol. Geotherm. Res., 202, 73-82.
Sieh, K., Natawidjaja, D., 2000. Neotectonics of the Sumatra fault, Indonesia. J. Geophys. Res., 105(B12), 28,295-28,326.
Smith, W. H. F., Sandwell, D.T., 1997. Global Sea Floor Topography from Satellite Altimetry and Ship Depth Soundings. Science, 277, 1956- 1962.
Subrahmanyam, C., Gireesh, R., Shyam Chand, Kamesh Raju, K. A., Gopala Rao, D., 2008. Geophysical characteristics of the Ninetyeast Ridge-Andaman island arc/trench convergent zone. Earth Planet. Sci. Lett., 266, 29-45.
Takahashi Y., Manceau, A., Geoffroy, N., Marcus, M. A., Usui, A., 2007. Chemical and structural control of the partitioning of Co, Ce, and Pb in marine ferromanganese oxides. Geochim. Cosmochim. Acta, 71, 984-1008.
Toda, S., Stein, R. S., Sagiya, T., 2002. Evidence from AD 2000 Izu islands earthquake swarm that stressing rate governs seismicity. Nature, 419, 58-61.
Usui, A., Nishimura, A., 1992. Submersible observations of hydrothermal manganese deposits on the Kaikata Seamount, Izu-Ogasawara (Bonin) Arc. Mar. Geol., 106, 203-210.
Vigny, C., Socquet, A., Rangin, C., Chamot-Rooke, N., Pubellier, M., Bouin, M., Bertrand, G., Becker, M., 2003. Present-day crustal deformation around Sagaing fault, Myanmar. J. Geophys. Res., 108(B11), 2533, doi:10.1029/2002JB001999.
Walter, T. R., Amelung, F., 2007. Volcanic eruptions following M ≥ 9 megathrust earthquakes: Implications for the Sumatra-Andaman volcanoes. Geology, 36, 539-542. doi: 10.1130/G23429A.
Welch S. A., Beard, B. L., Johnson C. M., Braterman, P. S., 2003. Kinetic and equilibrium Fe isotope fractionation between aqueous Fe(II) and Fe(III). Geochim. Cosmochim. Acta, 67, 4231-4250.
West, M., Sanchez J.J., McNutt, S. R., 2005. Periodically triggered seismicity at Mount Wrangell, Alaska, after the Sumatra earthquake. Science, 308, 1144-1146.
Wright I.C., 1996. Volcaniclastic processes on modern submarine arc stratovolcanoes: sidescan and photographic evidence from the Rumble IV and V volcanoes, southern Kermadec Arc (SW Pacific). Mar. Geol. 136, 21-39.

15
Figure captions
Fig. 1 Tectonic map of the study area along with seismicity data from the NEIC. The tectonic elements
in the Andaman sea depict major features (Ammon et al., 2005; Sieh and Natawidjaja, 2000; Kamesh
Raju et al., 2004; Kamesh Raju et al., 2007). The documented earthquake swarms, S1 to S7, and the
volcanoes represented by triangles (http://www.ngdc.noaa.gov/) are shown, SF denotes the Sumatra
Fault. The red and green dashed boxes represent the rupture zones of 2004 Sumatra-Andaman
earthquake and the Nias earthquake of 2005 respectively.
Fig. 2 (A) Map showing the Nicobar earthquake swarms. The red circles indicate ≥ 5.0 and brown < 5.0
magnitude events occurred during the peak swarm period of 27th and 28th January 2005. Green circles
indicate the < 5.0 events during December 2004 to March 2005. The location of the cratered seamount
is indicated by white triangle. (B) Distribution of earthquake in terms of number of earthquakes per day
and their magnitudes during December 2004 to March 2005.
Fig. 3 (A) Swath bathymetry map of the cratered seamount, contour interval 100 m. Red squares
denote the location TV-guided grabs. (B) Backscatter image derived from EM120 swath bathymetry
data. (C) The E-W and N-S cross section profiles of the cratered seamount depicted in A.
Fig. 4 (A) 3-D rendered image of the cratered seamount. (B) Top view of the crater. Note the breach in
crater rim.
Fig. 5 Bathymetric map depicting the chain of seamounts in the off Nicobar region. Contours in the
background are from the world topographic data [Smith and Sandwell, 1997]. The cratered seamount
(CSM) and the other seamounts are part of Andaman volcanic arc.
Fig. 6 Seafloor images captured moments before collecting the sample during (A) TVG-10 and (B)
TVG-09 operations, respectively.
Fig. 7 (A) Hand specimen of dacite from the TVG-9 from the crater flank. Dacite shows the presence
of mostly white tabular lath shaped plagioclase in the dark grey colored glassy groundmass. (B) Ophitic
texture exhibited by ortho-pyroxene (OPx) surrounded by plagioclase laths. An isolated and elongated
brown colored OPx crystal is associated with dark brown colored opaques as ilmenites. (C) Large
phenocryst of plagioclase (Plag) having sieve texture with glass inclusions in a microcrystalline
vesicular groundmass. Microcrystalline plagioclase laths exhibit flow texture around the plagioclase
crystal. Vesicles (Ves) are of different shapes.

16
Fig. 8 Whole rock geochemical data of the samples from the cratered seamount (TVG-09 and TVG-10)
along with data from Barren Island volcano (Luhr and Haldar, 2006; Chandrasekharam et al., 2009 and
Sheth et al., 2011) and Narcondam Island volcano ( Pal et al., 2007) are plotted on Total Alkali versus
SiO2 diagram (TAS) (Le Bas et al., 1986).
Fig. 9 SEM images of the globules and the sliced globule recovered from the unconsolidated
aggregates of TVG-09. (A) Aggregate of Mn-oxide globules, (B) and (C) globules with honeycomb like
surficial features representing typical hydrothermal todorokite at 100 μm and 30 μm magnification, (D) internal surface of the sliced globule, note absence of growth layers. (E & G) Scanning Electron
Microscopic image of Pyroclasts in globule aggregates. (F & H) Energy Dispersive Spectrum of point
analysis.
Fig. 10 Results of REE analysis of the globules and the Mn oxide coatings scrapped from the rock
surfaces. TVG-09 and TVG-09G shows the REE variations in ferromanganese oxide coatings and the
globules, respectively. TVG-10 shows the REE variations in the scrapped-off Mn- oxide coating
recovered from the summit of the seamount. NW Pacific-D-11-X9 and NW Pacific-D-21-103 are the
REE data from Pacific back-arc basins (Takahashi et al., 2007). REE data from TAG field of Mid
Atlantic Ridge (Mills et al., 2001) is represented by TAG-1-3423, TAG-21244-1c and TAG-1247-2D.
Fig. 11 Temporal variations of the swarm magnitudes. Focal mechanism of the largest magnitude
earthquakes is also shown. Note the predominance of the strike slip faulting in the beginning.
Fig. 12 Cross sectional view of the Coulomb stress change (in bar) on the WAF due to the 2004
Sumatra Andaman earthquake. A slip of about 20 m was assumed on this part of the 2004 Sumatra
Andaman earthquake rupture (Gahalaut et al., 2006; Banerjee et al., 2007). Large increase in stress
(5-10 bars) in the earthquake swarm region is largely due to unclamping of the steep planes. Swarm
earthquakes are shown by the open circles, scaled as per their magnitude.

17
Table 1. Whole rock composition (major elements) of the rocks recovered from the CSM and Reference standards (JA-1 and JR-3)
from Geological Survey of Japan.
Sample No. 9/1 9/2 9/3 9/3a 9/3b 9/4 10/1 10/2 10/3 10/4 10/5 10/6 10/7 JA-1
MeasJA-1
RecomJR-3 Meas
JR-3 Recom
SiO2 63.86 65.20 65.45 63.42 64.16 64.54 71.15 69.15 69.98 70.22 74.80 62.10 60.46 63.72 63.97 72.37 72.76 TiO2 0.82 0.80 0.77 0.84 0.81 0.81 0.49 0.50 0.56 0.51 0.42 0.92 0.99 0.86 0.85 0.22 0.21 Al2O3 15.71 15.24 14.97 15.84 15.68 15.70 14.73 14.98 17.34 15.22 12.91 17.71 16.19 15.37 15.22 12.11 11.90
Fe2O3(T) 6.35 6.22 5.99 6.54 6.38 6.36 3.00 4.19 0.70 3.34 2.43 4.96 8.33 7.31 7.07 5.06 4.72 MnO 0.30 0.21 0.19 0.26 0.20 0.23 0.21 0.32 0.25 0.33 0.17 0.34 0.43 0.16 0.16 0.09 0.08 MgO 1.57 1.50 1.41 1.61 1.57 1.52 0.61 0.67 0.22 0.68 0.62 1.48 6.02 1.53 1.57 0.09 0.05 CaO 5.06 4.92 4.78 5.20 5.02 5.06 3.35 3.47 3.75 3.49 3.97 5.37 3.82 5.62 5.70 0.09 0.09 Na2O 4.16 4.11 4.02 4.23 4.19 4.23 4.55 4.75 5.25 4.77 3.47 4.15 2.83 3.80 3.84 4.60 4.69 K2O 0.85 0.80 0.79 0.82 0.87 0.83 0.85 0.82 0.53 0.83 0.15 0.75 0.17 0.77 0.77 4.26 4.29 P2O5 0.20 0.19 0.19 0.21 0.20 0.20 0.16 0.14 0.14 0.14 0.11 0.31 0.18 0.15 0.17 0.02 0.02 Total 99.11 99.37 98.76 99.16 99.30 99.69 99.20 99.14 98.74 99.64 99.13 98.25 100.0 99.31 99.31 98.92 98.81 Fe2O3 2.12 2.07 2.00 2.18 2.13 2.12 1.00 1.40 0.23 1.11 0.81 1.65 2.88 - - - - FeO 4.45 4.36 4.19 4.58 4.47 4.45 2.10 2.94 0.49 2.34 1.70 3.47 6.04 - - - -
Na2O+K2O 5.01 4.91 4.81 5.05 5.06 5.06 5.40 5.57 5.78 5.60 3.62 4.90 2.89 - - - - Alkali Index 0.04 0.04 0.04 0.04 0.04 0.04 0.03 0.04 0.04 0.03 0.02 0.04 0.03 - - - -
Meas = Measured; Recom = Recommended 9 = TVG sample from CSM flank, 10 = TVG sample within crater of CSM, JA-1 = Andesite; JR-3 = Rhyolite.
18
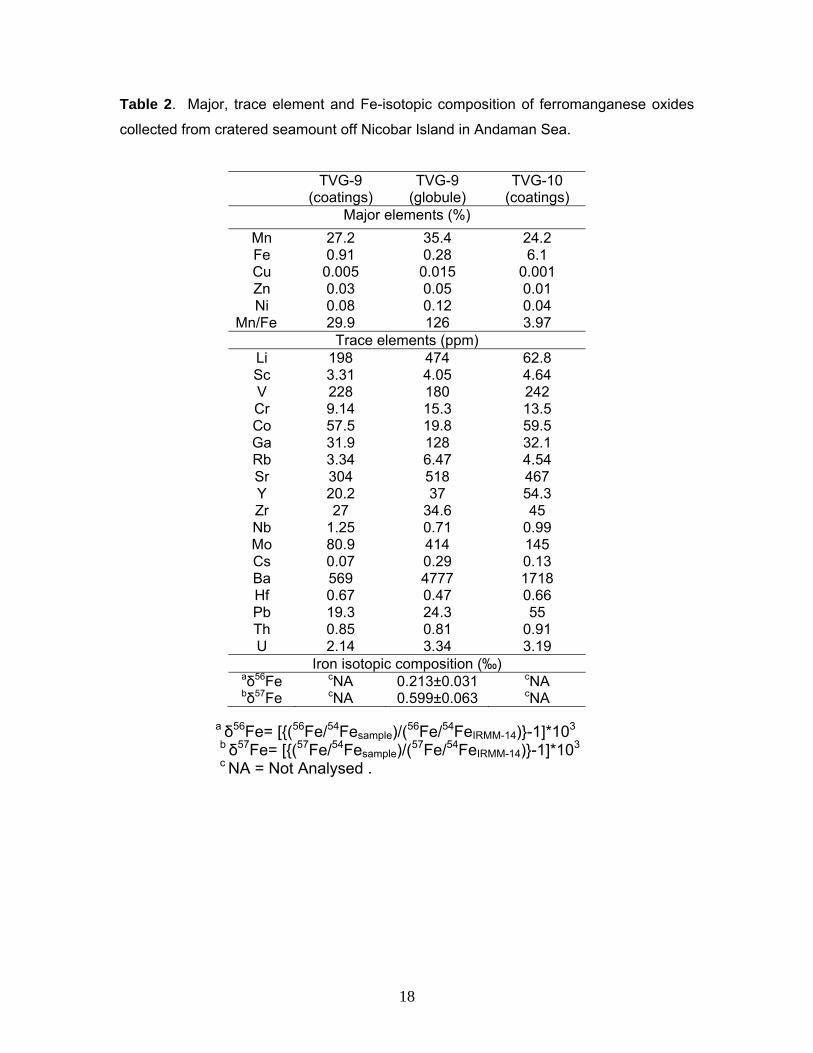
Table 2. Major, trace element and Fe-isotopic composition of ferromanganese oxides
collected from cratered seamount off Nicobar Island in Andaman Sea.
TVG-9 (coatings)
TVG-9 (globule)
TVG-10 (coatings)
Major elements (%) Mn 27.2 35.4 24.2 Fe 0.91 0.28 6.1 Cu 0.005 0.015 0.001 Zn 0.03 0.05 0.01 Ni 0.08 0.12 0.04
Mn/Fe 29.9 126 3.97 Trace elements (ppm)
Li 198 474 62.8 Sc 3.31 4.05 4.64 V 228 180 242 Cr 9.14 15.3 13.5 Co 57.5 19.8 59.5 Ga 31.9 128 32.1 Rb 3.34 6.47 4.54 Sr 304 518 467 Y 20.2 37 54.3 Zr 27 34.6 45 Nb 1.25 0.71 0.99 Mo 80.9 414 145 Cs 0.07 0.29 0.13 Ba 569 4777 1718 Hf 0.67 0.47 0.66 Pb 19.3 24.3 55 Th 0.85 0.81 0.91 U 2.14 3.34 3.19
Iron isotopic composition (‰) aδ56Fe cNA 0.213±0.031 cNA bδ57Fe cNA 0.599±0.063 cNA
a δ56Fe= [{(56Fe/54Fesample)/(56Fe/54FeIRMM-14)}-1]*103
b δ57Fe= [{(57Fe/54Fesample)/(57Fe/54FeIRMM-14)}-1]*103 c NA = Not Analysed .

19
Table 3. Concentration of rare earth elements in ferromanganese oxides collected from
cratered seamount off Nicobar Island in Andaman Sea.
REE (ppm)
TVG-9 (coatings)
TVG-9 (globule)
TVG-10 (coatings)
La 7.35 15.8 19.5 Ce 15.1 6.57 19 Pr 1.7 2.86 3.76 Nd 8.11 14.64 17.7 Sm 1.95 2.64 5.4 Eu 0.49 0.96 1.78 Gd 1.80 2.68 3.65 Tb 0.43 0.76 0.87 Dy 3.16 5.83 6.71 Ho 0.74 1.5 1.61 Er 2.23 4.64 4.71 Tm 0.36 0.79 0.79 Yb 2.25 4.65 4.78 Lu 0.34 0.74 0.82
ΣREE 46 65 91 a Ce/Ce* 0.98 0.22 0.51 b Eu/Eu* 1.2 1.7 1.9 Ndn/Ybn 0.30 0.26 0.31
a Ce/Ce* = 2Cen/(Lan +Prn), PAAS normalised Cerium anomaly b Eu/Eu*=2Eun/(Smn +Gdn), PAAS normalised Europium anomaly

20

21

22

23
24
25

26

27

28

29

30