Embed Size (px)
Citation preview
Tecplot, Inc.
Scripting Guide
Release 2
Bellevue, WA 2008
COPYRIGHT NOTICE
Tecplot 360TM Scripting Guide is for use with Tecplot 360TM Version 2008 R2.
Copyright © 1988-2008 Tecplot, Inc. All rights reserved worldwide. Except for personal use, this manual may not be reproduced, transmitted, transcribed, stored in a retrieval system, or translated in any form, in whole or in part, without the expresswritten permission of Tecplot, Inc., 3535 Factoria Blvd, Ste. 550; Bellevue, WA 98006 U.S.A.
The software discussed in this documentation and the documentation itself are furnished under license for utilization and duplication only according to the license terms. The copyright for the software is held by Tecplot, Inc. Documentation is providedfor information only. It is subject to change without notice. It should not be interpreted as a commitment by Tecplot, Inc. Tecplot, Inc. assumes no liability or responsibility for documentation errors or inaccuracies.
Tecplot, Inc.Post Office Box 52708Bellevue, WA 98015-2708 U.S.A.Tel:1.800.763.7005 (within the U.S. or Canada), 00 1 (425) 653-1200 (internationally)email: [email protected], [email protected], comments or concerns regarding this document: [email protected] more information, visit http://www.tecplot.com
THIRD PARTY SOFTWARE COPYRIGHT NOTICES
SciPy 2001-2002 Enthought. Inc. All Rights Reserved. NumPy 2005 NumPy Developers. All Rights Reserved. VisTools and VdmTools 1992-2007 Visual Kinematics, Inc. All Rights Reserved. NCSA HDF & HDF5 (Hierarchical Data Format) SoftwareLibrary and Utilities Contributors: National Center for Supercomputing Applications (NCSA) at the University of Illinois at Urbana-Champaign (UIUC), Lawrence Livermore National Laboratory (LLNL), Sandia National Laboratories (SNL), Los Ala-mos National Laboratory (LANL), Jean-loup Gailly and Mark Adler (gzip library). Copyright © 1998-2006 The Board of Trustees of the University of Illinois, Copyright © 2006-2008 The HDF Group (THG). All Rights Reserved. PNG ReferenceLibrary Copyright © 1995, 1996 Guy Eric Schalnat, Group 42, Inc., Copyright © 1996, 1997 Andreas Dilger, Copyright © 1998, 1999 Glenn Randers-Pehrson. All Rights Reserved. Tcl 1989-1994 The Regents of the University of California. Copyright© 1994 The Australian National University. Copyright © 1994-1998 Sun Microsystems, Inc. Copyright © 1998-1999 Scriptics Corporation. All Rights Reserved. bmptopnm 1992 David W. Sanderson. All Rights Reserved. Netpbm 1988 Jef Poskanzer. All Rights Reserved. Mesa 1999-2003 Brian Paul. All Rights Reserved. W3C IPR 1995-1998 World Wide Web Consortium, (Massachusetts Institute of Technology, Institut National de Recherche en Informatique et en Automatique, Keio University).All Rights Reserved. Ppmtopict 1990 Ken Yap. All Rights Reserved. JPEG 1991-1998 Thomas G. Lane. All Rights Reserved.
TRADEMARKS
Tecplot®, Tecplot 360TM, the Tecplot 360TM logo, PreplotTM, Enjoy the ViewTM, and FramerTM are registered trademarks or trademarks of Tecplot, Inc. in the United States and other countries.
3D Systems is a registered trademark or trademark of 3D Systems Corporation in the U.S. and/or other countries. Macintosh OS is a registered trademark or trademark of Apple, Incorporated in the U.S. and/or other countries. Reflection-X is a registeredtrademark or trademark of Attachmate Corporation in the U.S. and/or other countries. EnSight is a registered trademark or trademark of Computation Engineering Internation (CEI), Incorporated in the U.S. and/or other countries. EDEM is a registeredtrademark or trademark of DEM Solutions Ltd in the U.S. and/or other countries. Exceed 3D, Hummingbird, and Exceed are registered trademarks or trademarks of Hummingbird Limited in the U.S. and/or other countries. Konqueror is a registeredtrademark or trademark of KDE e.V. in the U.S. and/or other countries. VIP and VDB are registered trademarks or trademarks of Halliburton in the U.S. and/or other countries. ECLIPSE FrontSim is a registered trademark or trademark of SchlumbergerInformation Solutions (SIS) in the U.S. and/or other countries. Debian is a registered trademark or trademark of Software in the Public Interest, Incorporated in the U.S. and/or other countries. X3D is a registered trademark or trademark of Web3D Con-sortium in the U.S. and/or other countries. X Window System is a registered trademark or trademark of X Consortium, Incorporated in the U.S. and/or other countries. ANSYS, Fluent and any and all ANSYS, Inc. brand, product, service and featurenames, logos and slogans are registered trademarks or trademarks of ANSYS Incorporated or its subsidiaries in the U.S. and/or other countries. PAM-CRASH is a registered trademark or trademark of ESI Group in the U.S. and/or other countries. LS-DYNA is a registered trademark or trademark of Livermore Software Technology Coroporation in the U.S. and/or other countries. MSC/NASTRAN is a registered trademark or trademark of MSC.Software Corporation in the U.S. and/or other countries.NASTRAN is a registered trademark or trademark of National Aeronautics Space Administration in the U.S. and/or other countries. 3DSL is a registered trademark or trademark of StreamSim Technologies, Incorporated in the U.S. and/or other coun-tries. SDRC/IDEAS Universal is a registered trademark or trademark of UGS PLM Solutions Incorporated or its subsidiaries in the U.S. and/or other countries. Star-CCM+ is a registered trademark or trademark of CD-adapco in the U.S. and/or othercountries. FLEXnet is a registered trademark or trademark of Macrovision Corporation and/or Macrovision Europe Ltd in the U.S. and/or other countries. Python is a registered trademark or trademark of Python Software Foundation in the U.S. and/orother countries. Abaqus, the 3DS logo, SIMULIA and CATIA are registered trademarks or trademarks of Dassault Systèmes in the U.S. and/or other countries. The Abaqus runtime libraries are a product of Dassault Systèmes Simulia Corp., Provi-dence, RI, USA. FLOW-3D is a registered trademark or trademark of Flow Science, Incorporated in the U.S. and/or other countries. Adobe, Flash, Flash Player, Premier and PostScript are registered trademarks or trademarks of Adobe Systems, Incor-porated in the U.S. and/or other countries. AutoCAD and DXF are registered trademarks or trademarks of Autodesk, Incorporated in the U.S. and/or other countries. Ubuntu is a registered trademark or trademark of Canonical Limited in the U.S. and/orother countries. HP, LaserJet and PaintJet are registered trademarks or trademarks of Hewlett-Packard Development Company, Limited Partnership in the U.S. and/or other countries. IBM, RS/6000 and AIX are registered trademarks or trademarks ofInternational Business Machines Corporation in the U.S. and/or other countries. Helvetica Font Family and Times Font Family are registered trademarks or trademarks of Linotype GmbH in the U.S. and/or other countries. Linux is a registered trade-mark or trademark of Linus Torvalds in the U.S. and/or other countries. ActiveX, Excel, Microsoft, Visual C++, Visual Studio, Windows, Windows Metafile, Windows XP, Windows Vista, Windows 2000 and PowerPoint are registered trademarks ortrademarks of Microsoft Corporation in the U.S. and/or other countries. Firefox is a registered trademark or trademark of The Mozilla Foundation in the U.S. and/or other countries. Netscape is a registered trademark or trademark of Netscape Commu-nications Corporation in the U.S. and/or other countries. SUSE is a registered trademark or trademark of Novell, Incorporated in the U.S. and/or other countries. Red Hat is a registered trademark or trademark of Red Hat, Incorporated in the U.S. and/orother countries. SPARC is a registered trademark or trademark of SPARC International, Incorporated in the U.S. and/or other countries. Products bearing SPARC trademarks are based on an architecture developed by Sun Microsystems, Inc. Solaris, Sunand SunRaster are registered trademarks or trademarks of Sun MicroSystems, Incorporated in the U.S. and/or other countries. Courier is a registered trademark or trademark of Monotype Imaging Incorporated in the U.S. and/or other countries. UNIXand Motif are registered trademarks or trademarks of The Open Group in the U.S. and/or other countries. Qt is a registered trademark or trademark of Trolltech in the U.S. and/or other countries. Zlib is a registered trademark or trademark of Jean-loupGailly and Mark Adler in the U.S. and/or other countries. OpenGL is a registered trademark or trademark of Silicon Graphics, Incorporated in the U.S. and/or other countries. JPEG is a registered trademark or trademark of Thomas G. Lane in the U.S.and/or other countries. All other product names mentioned herein are trademarks or registered trademarks of their respective owners.
NOTICE TO U.S. GOVERNMENT END-USERS
Use, duplication, or disclosure by the U.S. Government is subject to restrictions as set forth in subparagraphs (a) through (d) of the Commercial Computer-Restricted Rights clause at FAR 52.227-19 when applicable, or in subparagraph (c)(1)(ii) of theRights in Technical Data and Computer Software clause at DFARS 252.227-7013, and/or in similar or successor clauses in the DOD or NASA FAR Supplement. Contractor/manufacturer is Tecplot, Inc., 3535 Factoria Blvd, Ste. 550; Bellevue, WA98006 U.S.A.
08-360-07-2
Rev 09/2008
Table of Contents
Tecplot 360 Macro Commands
Chapter 1 Introduction to Macro Commands ........................ 10
Chapter 2 Managing Macros .............................................................. 11
Macros vs. Macro Functions vs. Macro Commands..................... 11Running Macros from the Command Line ................................... 11Running Macros from the Tecplot 360 Interface .......................... 11Running Macros from the Quick Macro Panel ............................. 12
Chapter 3 Writing Forward Compatible Macros ................ 13
Chapter 4 Debugging Macros..................................... 15
Chapter 5 Macro Command Syntax ............................................... 17
Chapter 6 Macro Variables .................................................................. 19
Internal Variables........................................................................... 19Assigning Values to Macro Variables............................................ 23Assigning a String to a Macro Variable ........................................ 23Replacement Text Use................................................................... 24
3
Macro Function Variables ............................................................. 24Using Formats in Macro Variables................................................ 25
Chapter 7 Macro Command Summary ........................................ 27
Chapter 8 Macro Commands .............................................................. 63
Chapter 9 Macro Commands for the Analyze Menu ...... 251
Summary of Analyze Macro Commands.................................... 251Macro Command Description..................................................... 252Parameter Assignment Values..................................................... 272
Chapter 10 Parameter Subcommands .......................................... 275
Chapter 11 Parameter Assignment Values, Expressions, and Operators ................................................................... 299
Assignment Value Table.............................................................. 299Assignment Value Expressions ................................................... 310
Chapter 12 Raw Data ................................................................................ 315
Chapter 13 Macro Language Limitations ................................. 319
Python Scripting
Chapter 14 Using Tecplot 360’s Python Interpreter ......... 322
Using Python Scripts with Tecplot 360....................................... 322
4
Installation and Setup .................................................................. 322
Chapter 15 Python Syntax Rules ...................................................... 323
Import Modules ........................................................................... 323Basic Syntax Rules...................................................................... 324Input Types .................................................................................. 325Output Types ............................................................................... 331Exceptions to the Rules ............................................................... 332Convenience Functions ............................................................... 332Tecplot 360 Macro Commands for Python Modules .................. 337Notes for Novice Python Users................................................... 338
Index ........................................................................................................... 341
5
6
Introduction
Tecplot 360 is a powerful tool for visualizing a wide range of technical data. It offers line plotting,2D and 3D surface plots in a variety of formats, and 3D volumetric visualization. The user docu-mentation for Tecplot 360 is divided into nine books:
• Scripting Guide (this document) - Provides Macro and Python command syntax and information on working with Macro and Python files and commands.
• User’s Manual - Provides a complete description of working with Tecplot 360 features. • Getting Started Manual - New Tecplot 360 users are encouraged to work through the
tutorials provided in the Getting Started Manual. The tutorials highlight working with key features in Tecplot 360.
• Quick Reference Guide - Provides syntax for zone header files, macro variables, keyboard shortcuts, and more.
• Data Format Guide - Provides information on outputting your simulator data into Tecplot 360 file format.
• Add-on Developer’s Kit - User’s Manual - Provides instructions and examples for creating add-ons for Tecplot 360.
• Add-on Developer’s Kit - Reference Manual - Provides the syntax for the functions included in the kit.
• Installation Instructions - Provides detailed instructions on how to install Tecplot 360 on your machine.
• Release Notes - Provides information about new and/or updated Tecplot 360 features.
7
Introduction
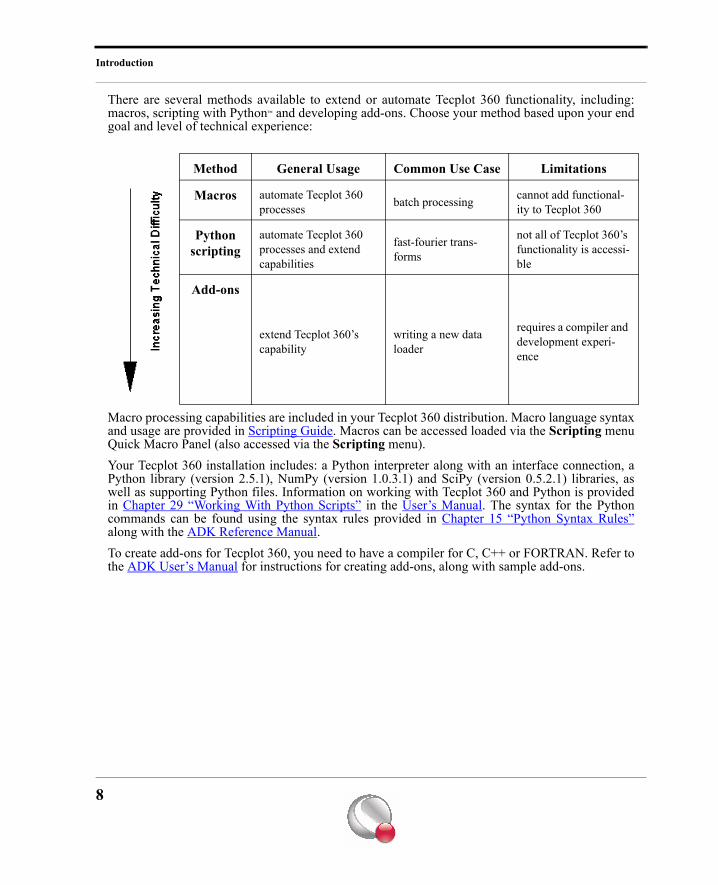
There are several methods available to extend or automate Tecplot 360 functionality, including:macros, scripting with Python™ and developing add-ons. Choose your method based upon your endgoal and level of technical experience:
Macro processing capabilities are included in your Tecplot 360 distribution. Macro language syntaxand usage are provided in Scripting Guide. Macros can be accessed loaded via the Scripting menuQuick Macro Panel (also accessed via the Scripting menu).Your Tecplot 360 installation includes: a Python interpreter along with an interface connection, aPython library (version 2.5.1), NumPy (version 1.0.3.1) and SciPy (version 0.5.2.1) libraries, aswell as supporting Python files. Information on working with Tecplot 360 and Python is providedin Chapter 29 “Working With Python Scripts” in the User’s Manual. The syntax for the Pythoncommands can be found using the syntax rules provided in Chapter 15 “Python Syntax Rules”along with the ADK Reference Manual.To create add-ons for Tecplot 360, you need to have a compiler for C, C++ or FORTRAN. Refer tothe ADK User’s Manual for instructions for creating add-ons, along with sample add-ons.
Method General Usage Common Use Case Limitations
Macros automate Tecplot 360 processes batch processing cannot add functional-
ity to Tecplot 360
Python scripting
automate Tecplot 360 processes and extend capabilities
fast-fourier trans-forms
not all of Tecplot 360’s functionality is accessi-ble
Add-ons
extend Tecplot 360’s capability
writing a new data loader
requires a compiler and development experi-ence
8
Part 1 Tecplot 360 Macro Commands
Chapter 1 Introduction to Macro Commands
A Tecplot 360 macro is a set of instructions, called macro commands, which perform actions inTecplot 360. Macro commands can be used to accomplish virtually any task that can be done viathe Tecplot 360 interface, offering an easy way to automate Tecplot 360 processes. The only thingsyou can do interactively that cannot be done with macro commands are those actions that have noeffect on a final, printed plot (such as resizing the Tecplot 360 process window). To augment thisability, there are macro commands which have no corresponding interactive control, such aslooping and conditional commands. These commands typically go hand in hand with the executionof a macro.You can create macros by recording them from the Tecplot 360 interface using the MacroRecorder (accessed via the Scripting>Record Macro menu), or create them from scratch usingany ASCII text editor. In most cases, the most effective approach to creating a macro is the follow-ing hybrid approach:
1. Run Tecplot 360 and choose to record a macro to a file. Perform tasks similar to those you are trying to capture in the final macro.
2. Close the recording session and examine the macro file. The commands generated by Tecplot 360 should be fairly readable and easy to understand.
3. Make minor modifications to the recorded macro. Typical modifications involve add-ing loops, adding variables, or adding commands that, for example, prompt the user to enter a file name.
One of the main reasons for using the approach above is the large number of commands and permu-tations of parameters. This manual provides an exhaustive listing of the available macro com-mands. However, it is often easier to have Tecplot 360 perform the action and record the relevantcommand than look up individual commands and their required parameters.An important feature of Tecplot 360’s macro command language is its Viewer/Debugger. Often,you will have a well-developed macro that needs some modification. You can use the Debugger tostep through the macro to the point where you want the change to be made and then start recordingto a new file. Using a text editor, you can insert macro commands from a new file into an existingmacro file.
10
Chapter 2 Managing Macros
Tecplot 360 macros are stored in files. These files are processed by loading them into Tecplot 360and running them.
2 - 1 Macros vs. Macro Functions vs. Macro CommandsA Tecplot 360 macro is a file containing one or more macro commands. These files start with thefollowing special comment line to notify Tecplot 360 that what follows is a Tecplot 360 macro:#!MC 1120
Any number of macro commands or comments may follow.Tecplot 360 macro functions are defined in Tecplot 360 macros by using the $!MACROFUNCTION-$!ENDMACROFUNCTION commands. Between the $!MACROFUNCTION and $!ENDMACROFUNCTION com-mands you may use any valid macro command (except $!MACROFUNCTION). When a Tecplot 360macro is loaded, all macro functions are extracted and the attached commands are not executeduntil a $!RUNMACROFUNCTION command is encountered. Macro functions may be retained if desired. A retained macro function remains defined in Tecplot360 even if the macro in which it was defined is replaced by another macro. Retained macro func-tions may be called by other macros that are loaded at a later time.
2 - 2 Running Macros from the Command LineA simple way to run a Tecplot 360 macro is to include it in the command line with the -p flag. Thefollowing command runs Tecplot 360 and plays a macro called a.mcr:tecplot -p a.mcr
If you use the .mcr extension for the macro file name, then the -p flag is optional. If you want todebug the macro, include the -z flag as well.
2 - 3 Running Macros from the Tecplot 360 InterfaceYou can run a macro file by going to Scripting>Play Macro/Script. A dialog appears; choose themacro to play.If you want to debug a macro file, go to the Scripting menu and select the "View/Debug Macro"option. The Macro Viewer dialog appears so you can load in a macro. When the macro is loaded,
11
Managing Macros
Tecplot 360 waits at the first macro command for you to step through the commands. See Section27 - 3 “Macro Debugging” in the User’s Manual for complete details on how to use the MacroViewer.
2 - 4 Running Macros from the Quick Macro PanelMacros that you use frequently or want rapid access to may be defined as macro functions within aspecial file called tecplot.mcr in either the current directory, your home directory, or the Tecplot360 home directory. When Tecplot 360 starts it looks for this file in each of those directories inturn. If Tecplot 360 finds the file, it loads the macro definitions and associates functions to buttonson the Quick Macro Panel dialog (in the Scripting menu). You can have Tecplot 360 load yourown macro function file by using the -qm flag on the command line. The following command runsTecplot 360 and installs the macro functions in the file myteccmd.mcr into the Quick Macro Panel: tec360 -qm myteccmd.mcr
You can have a macro function add a button to the Quick Macro Panel dialog. By default, allmacro functions defined in the tecplot.mcr file will add a button to the Quick Macro Panel, thosedefined elsewhere will not. See the $!MACROFUNCTION...$!ENDMACROFUNCTIONcommand for more information.
If you want Tecplot 360 to display the Quick Macro Panel at starting include the -showpanel flagon the command line.To see an example of a macro function file, look at the file tecplot.mcr located in the examples/mcrsub-directory below the Tecplot 360 home directory. If this file is moved to the Tecplot 360 homedirectory, the Quick Macro Panel will have options that include 3D Rotation Animation and ResetCenter of Rotation.
If the macro file does not contain any functiondefinitions, it will not be loaded into the QuickMacro Panel.
12
Chapter 3 Writing Forward Compatible Macros
In order to ensure forward compatibility of your macro commands, please keep the followingguidelines in mind. These guidelines will allow you to create macros that will work for years, onmany machines and platforms.
1. Begin your macro by opening a layout. This will ensure that the final plot is consistent between versions of Tecplot 360 (even if the default style settings for Tecplot 360 have changed).
If your macro will be used for more than one layout, you can ensure forward compat-ibility by:
• Using the $!PromptForFileName command. This will allow the user to interac-tively specify the layout file.
-or-
• Launching Tecplot 360 from the command line, specifying the layout and the macro: tecplot mylayout.lay mydatafile mymacro.mcr
2. Store associated files and graphics in the same folder as the macro file.If your macro loads files or inserts images without allowing the user to choose them, it is a good practice to store them in the same folder as the macro file that uses them. After recording, edit the macro, and replace the path to the file with the intrinsic macro variable |macrofilepath|. Example:
$!OpenLayout "|macrofilepath|\Density.lpk"
An alternative to using a layout is to loaddata and then paste a frame style file in eachframe.
13
Writing Forward Compatible Macros
This allows the macro to work without editing in any location as long as the entire folder of files was copied there.
3. Avoid using a $!Pick command in your macro. Changes to the aspect ratio can cause a recorded $!Pick command to fail when the macro is run on another machine or in another version of Tecplot 360.
• In a plot with multiple frames, don’t use $!Pick to change the current frame. Instead, give each frame a meaningful name such as “Full View” and “Zoom Frame” in the layout. Then use the command:
$!Framecontrol PopbyName Name = “Full View” to access the frame you want. This will also simplify later changes to the macro.
• If you must pick an item, make the pick as precise as possible. For example, clicking on the center, not the edge, of a zone or slice will increase the chances that the pick will be successful when the macro is replayed. When selecting text or geometries while recording a macro, click and drag in the widest possible area around the objects to select. The command will be recorded as
$!PICK ADDALLINRECT SELECTTEXT = YES X1 = 1.56075949367 X2 = 3.97088607595 Y1 = 2.29556962025 Y2 = 3.91582278481
The x and y ranges can be expanded if needed.4. Use plenty of comments in your macro.
14
Chapter 4 Debugging Macros
In general, the best way to debug a macro is to use the Macro Viewer, and find which command iscausing the problem. Here are some tips for specific problems:
To fix the problem in an existing macro, follow these steps to make the coordinates more precise:1. Run the macro on the machine where the error message is generated.
Problem: The macro was created with a previous version of Tecplot 360 to make the plot needed. With a newer version of Tecplot 360, the macro will run without error, but the plot looks different.
Solution: Run the macro with the old version of Tecplot 360, then save a frame style to a file.Begin your macro by loading the data, then pasting the frame style from a file. This will ensurethat the final plot will be consistent from one version of Tecplot 360 to the next, even if thedefault style settings for Tecplot 360 have been changed.
Problem: The macro gives you errors such as “File does not exist” or “Cannot open file”, but you can locate the file.
Solution: Copy the file to the same folder as the macro file that uses the file. Edit the macro, andreplace the path to the file with the intrinsic macro variable |macrofilepath|.
Example: $!Openlayout "|macrofilepath|\Density.lpk"
This allows the macro to work without editing in any location as long as the entire folder of fileswas copied there.
Problem: Running the macro causes unusual error messages, such as: “No objects to cut or theobjects selected not allowed to be cut” or “Not allowed to adjust zones or mappings when themouse mode is set to SELECTOR”. When you run the macro in the Macro Viewer, you see thatthe problem occurs with when a $!Pick command is run.Solution: Avoid using a $!Pick command in your macro. Changes to the aspect ratio can causea recorded $!Pick command to fail when the macro is run on another machine or in anotherversion of Tecplot 360.
15
Debugging Macros
2. Via the macro viewer or editor, identify the preceding $!PICK ADD or similar select type pick command. Note the X,Y coordinates of the command. A good way to do this is:
a. Run the macro until you get the “No Objects to Shift” error message.b. Click Ok on the dialog.c. Bring up the macro viewer: Scripting>View/Debug Macro.d. Find the nearest $!PICK ADD command above the current command and put a
break point on that command.e. Press “Reset” to reset the macro and then run the macro.
f. Insert a $!Pause command in your macro just before the $!Pick Add com-mand that precedes the offending command. Now run Tecplot 360 interac-tively from the macro viewer. You can then see the line number where youneed to put the break.
3. Back in Tecplot 360, select the zoom tool.4. Hold the shift key down and notice that the running coordinates in the lower right cor-
ner now show “PX = xxxxx PY = yyyyyy". xxxxxx and yyyyyy are the paper coor-dinates of the hot spot of the zoom tool. (If you see X and Y for grid coordinates, or FX and FY for frame coordinates, you need to hold down the Shift key. Pick com-mands always use paper coordinates.)
5. Move the zoom tool until xxxxx and yyyyy are close to the coordinates noted in step 2.
6. Note where the pick occurred. It is likely the pick occurred some distance away from the actual edge of the object to pick. Move the zoom tool to a “better” location for the pick and note the coordinates.
Edit the macro file and replace the old X,Y pick coordinates with those determined in step 6.
If the problem only occurs when runningin batch mode then try to determine themacro command by examining thebatch.log file.
16
Chapter 5 Macro Command Syntax
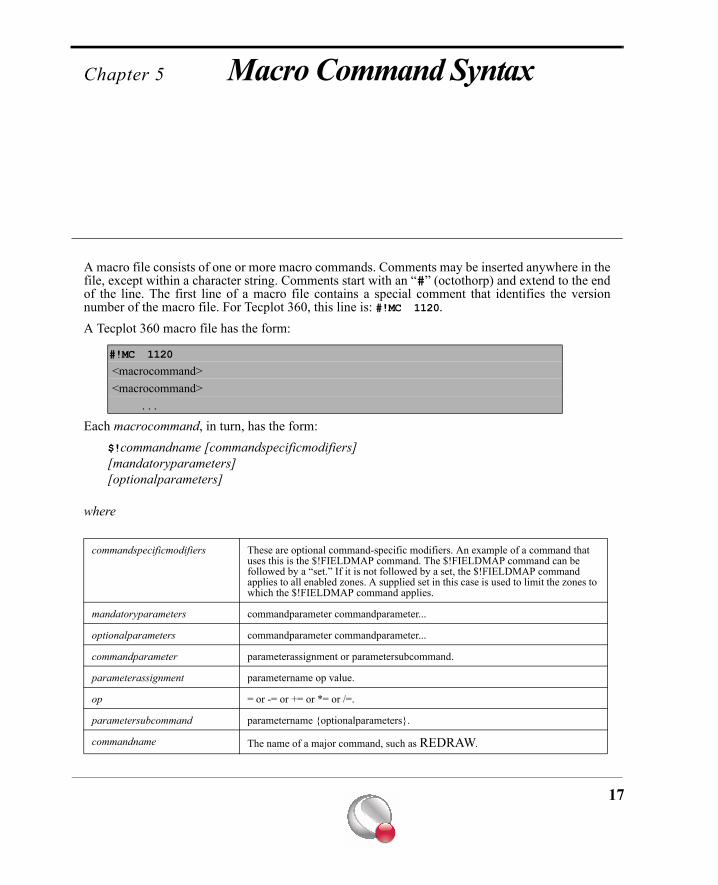
A macro file consists of one or more macro commands. Comments may be inserted anywhere in thefile, except within a character string. Comments start with an “#” (octothorp) and extend to the endof the line. The first line of a macro file contains a special comment that identifies the versionnumber of the macro file. For Tecplot 360, this line is: #!MC 1120.A Tecplot 360 macro file has the form:
Each macrocommand, in turn, has the form:$!commandname [commandspecificmodifiers] [mandatoryparameters][optionalparameters]
where
#!MC 1120
<macrocommand> <macrocommand> . . .
commandspecificmodifiers These are optional command-specific modifiers. An example of a command that uses this is the $!FIELDMAP command. The $!FIELDMAP command can be followed by a “set.” If it is not followed by a set, the $!FIELDMAP command applies to all enabled zones. A supplied set in this case is used to limit the zones to which the $!FIELDMAP command applies.
mandatoryparameters commandparameter commandparameter...
optionalparameters commandparameter commandparameter...
commandparameter parameterassignment or parametersubcommand.
parameterassignment parametername op value.
op = or -= or += or *= or /=.
parametersubcommand parametername {optionalparameters}.
commandname The name of a major command, such as REDRAW.
17
Macro Command Syntax
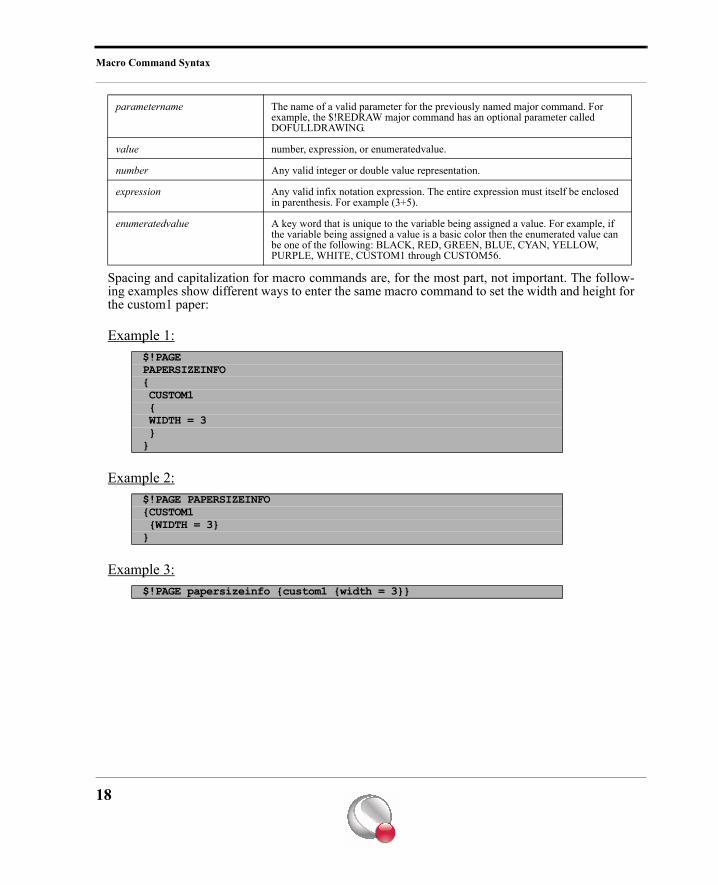
Spacing and capitalization for macro commands are, for the most part, not important. The follow-ing examples show different ways to enter the same macro command to set the width and height forthe custom1 paper:
Example 1:
Example 2:
Example 3:
parametername The name of a valid parameter for the previously named major command. For example, the $!REDRAW major command has an optional parameter called DOFULLDRAWING.
value number, expression, or enumeratedvalue.
number Any valid integer or double value representation.
expression Any valid infix notation expression. The entire expression must itself be enclosed in parenthesis. For example (3+5).
enumeratedvalue A key word that is unique to the variable being assigned a value. For example, if the variable being assigned a value is a basic color then the enumerated value can be one of the following: BLACK, RED, GREEN, BLUE, CYAN, YELLOW, PURPLE, WHITE, CUSTOM1 through CUSTOM56.
$!PAGE PAPERSIZEINFO{ CUSTOM1 { WIDTH = 3 }}
$!PAGE PAPERSIZEINFO{CUSTOM1 {WIDTH = 3}}
$!PAGE papersizeinfo {custom1 {width = 3}}
18
Chapter 6 Macro Variables
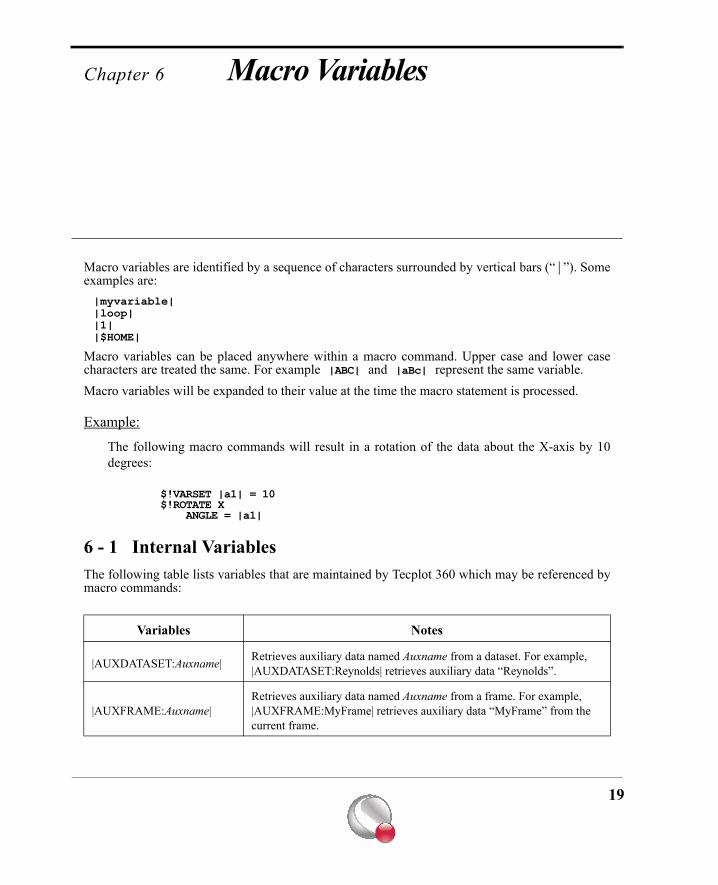
Macro variables are identified by a sequence of characters surrounded by vertical bars (“|”). Someexamples are:|myvariable||loop||1||$HOME|
Macro variables can be placed anywhere within a macro command. Upper case and lower casecharacters are treated the same. For example |ABC| and |aBc| represent the same variable.Macro variables will be expanded to their value at the time the macro statement is processed.
Example:
The following macro commands will result in a rotation of the data about the X-axis by 10degrees:
$!VARSET |a1| = 10$!ROTATE X ANGLE = |a1|
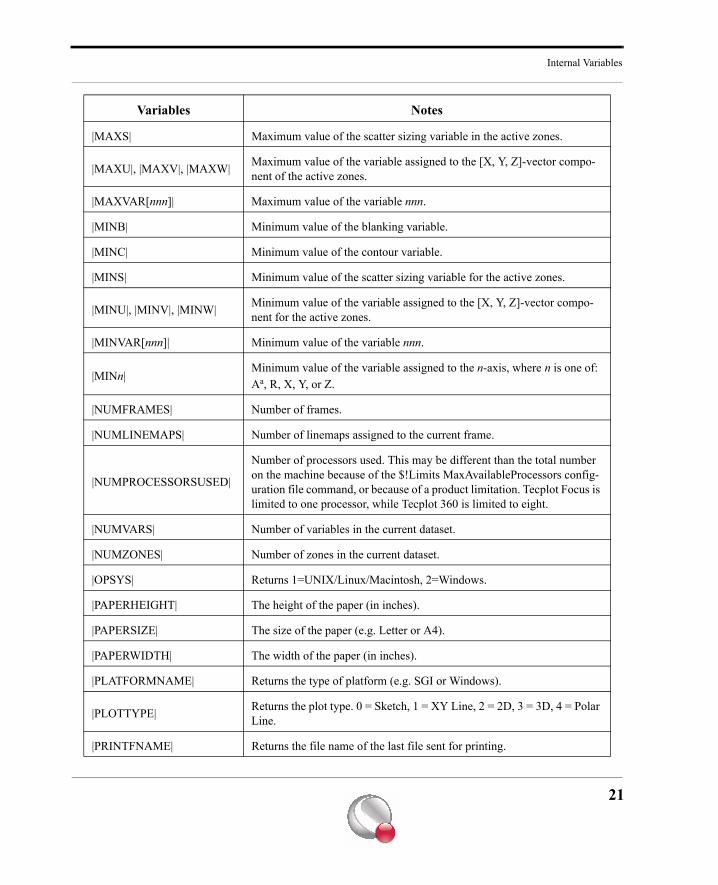
6 - 1 Internal VariablesThe following table lists variables that are maintained by Tecplot 360 which may be referenced bymacro commands:
Variables Notes
|AUXDATASET:Auxname| Retrieves auxiliary data named Auxname from a dataset. For example, |AUXDATASET:Reynolds| retrieves auxiliary data “Reynolds”.
|AUXFRAME:Auxname|Retrieves auxiliary data named Auxname from a frame. For example, |AUXFRAME:MyFrame| retrieves auxiliary data “MyFrame” from the current frame.
19
Macro Variables
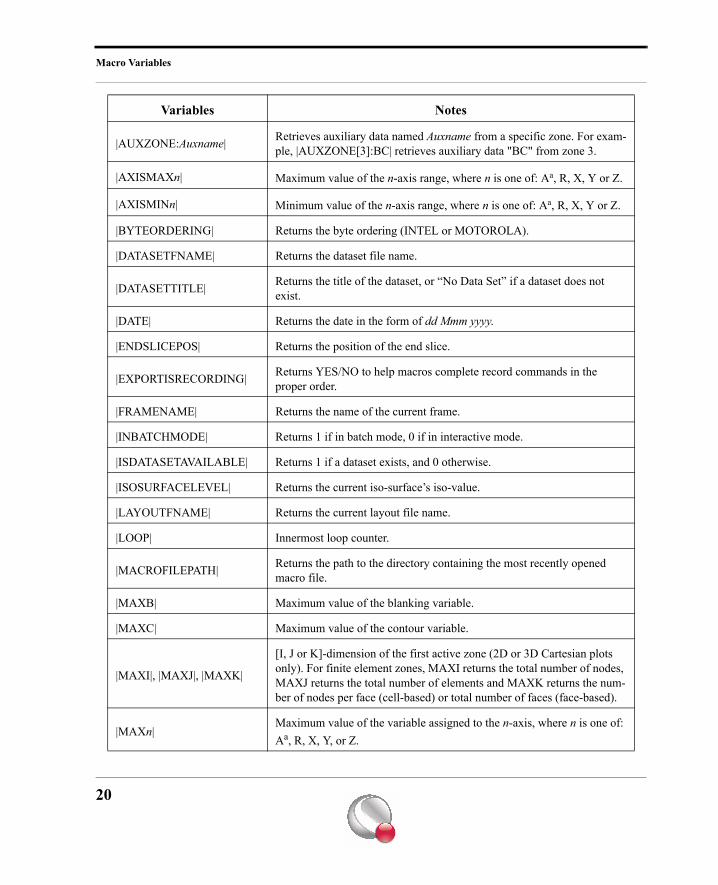
|AUXZONE:Auxname| Retrieves auxiliary data named Auxname from a specific zone. For exam-ple, |AUXZONE[3]:BC| retrieves auxiliary data "BC" from zone 3.
|AXISMAXn| Maximum value of the n-axis range, where n is one of: Aa, R, X, Y or Z.
|AXISMINn| Minimum value of the n-axis range, where n is one of: Aa, R, X, Y or Z.
|BYTEORDERING| Returns the byte ordering (INTEL or MOTOROLA).
|DATASETFNAME| Returns the dataset file name.
|DATASETTITLE| Returns the title of the dataset, or “No Data Set” if a dataset does not exist.
|DATE| Returns the date in the form of dd Mmm yyyy.
|ENDSLICEPOS| Returns the position of the end slice.
|EXPORTISRECORDING| Returns YES/NO to help macros complete record commands in the proper order.
|FRAMENAME| Returns the name of the current frame.
|INBATCHMODE| Returns 1 if in batch mode, 0 if in interactive mode.
|ISDATASETAVAILABLE| Returns 1 if a dataset exists, and 0 otherwise.
|ISOSURFACELEVEL| Returns the current iso-surface’s iso-value.
|LAYOUTFNAME| Returns the current layout file name.
|LOOP| Innermost loop counter.
|MACROFILEPATH| Returns the path to the directory containing the most recently opened macro file.
|MAXB| Maximum value of the blanking variable.
|MAXC| Maximum value of the contour variable.
|MAXI|, |MAXJ|, |MAXK|
[I, J or K]-dimension of the first active zone (2D or 3D Cartesian plots only). For finite element zones, MAXI returns the total number of nodes, MAXJ returns the total number of elements and MAXK returns the num-ber of nodes per face (cell-based) or total number of faces (face-based).
|MAXn|Maximum value of the variable assigned to the n-axis, where n is one of: Aa, R, X, Y, or Z.
Variables Notes
20
Internal Variables
|MAXS| Maximum value of the scatter sizing variable in the active zones.
|MAXU|, |MAXV|, |MAXW| Maximum value of the variable assigned to the [X, Y, Z]-vector compo-nent of the active zones.
|MAXVAR[nnn]| Maximum value of the variable nnn.
|MINB| Minimum value of the blanking variable.
|MINC| Minimum value of the contour variable.
|MINS| Minimum value of the scatter sizing variable for the active zones.
|MINU|, |MINV|, |MINW| Minimum value of the variable assigned to the [X, Y, Z]-vector compo-nent for the active zones.
|MINVAR[nnn]| Minimum value of the variable nnn.
|MINn|Minimum value of the variable assigned to the n-axis, where n is one of: Aa, R, X, Y, or Z.
|NUMFRAMES| Number of frames.
|NUMLINEMAPS| Number of linemaps assigned to the current frame.
|NUMPROCESSORSUSED|
Number of processors used. This may be different than the total number on the machine because of the $!Limits MaxAvailableProcessors config-uration file command, or because of a product limitation. Tecplot Focus is limited to one processor, while Tecplot 360 is limited to eight.
|NUMVARS| Number of variables in the current dataset.
|NUMZONES| Number of zones in the current dataset.
|OPSYS| Returns 1=UNIX/Linux/Macintosh, 2=Windows.
|PAPERHEIGHT| The height of the paper (in inches).
|PAPERSIZE| The size of the paper (e.g. Letter or A4).
|PAPERWIDTH| The width of the paper (in inches).
|PLATFORMNAME| Returns the type of platform (e.g. SGI or Windows).
|PLOTTYPE| Returns the plot type. 0 = Sketch, 1 = XY Line, 2 = 2D, 3 = 3D, 4 = Polar Line.
|PRINTFNAME| Returns the file name of the last file sent for printing.
Variables Notes
21
Macro Variables
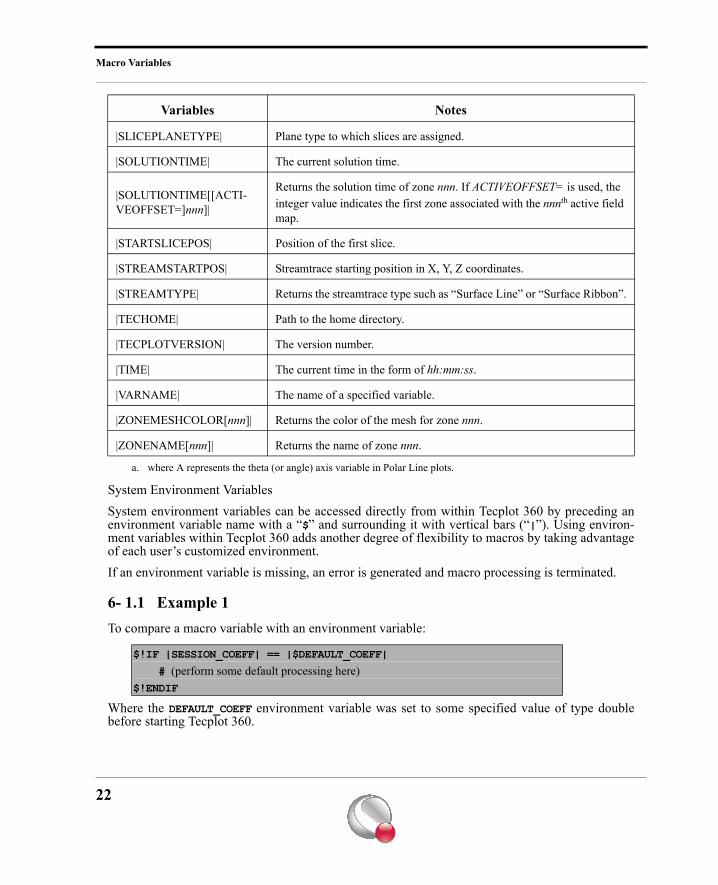
System Environment VariablesSystem environment variables can be accessed directly from within Tecplot 360 by preceding anenvironment variable name with a “$” and surrounding it with vertical bars (“|”). Using environ-ment variables within Tecplot 360 adds another degree of flexibility to macros by taking advantageof each user’s customized environment.If an environment variable is missing, an error is generated and macro processing is terminated.
6- 1.1 Example 1To compare a macro variable with an environment variable:
Where the DEFAULT_COEFF environment variable was set to some specified value of type doublebefore starting Tecplot 360.
|SLICEPLANETYPE| Plane type to which slices are assigned.
|SOLUTIONTIME| The current solution time.
|SOLUTIONTIME[[ACTI-VEOFFSET=]nnn]|
Returns the solution time of zone nnn. If ACTIVEOFFSET= is used, the integer value indicates the first zone associated with the nnnth active field map.
|STARTSLICEPOS| Position of the first slice.
|STREAMSTARTPOS| Streamtrace starting position in X, Y, Z coordinates.
|STREAMTYPE| Returns the streamtrace type such as “Surface Line” or “Surface Ribbon”.
|TECHOME| Path to the home directory.
|TECPLOTVERSION| The version number.
|TIME| The current time in the form of hh:mm:ss.
|VARNAME| The name of a specified variable.
|ZONEMESHCOLOR[nnn]| Returns the color of the mesh for zone nnn.
|ZONENAME[nnn]| Returns the name of zone nnn.
a. where A represents the theta (or angle) axis variable in Polar Line plots.
$!IF |SESSION_COEFF| == |$DEFAULT_COEFF|
# (perform some default processing here)$!ENDIF
Variables Notes
22
Assigning Values to Macro Variables
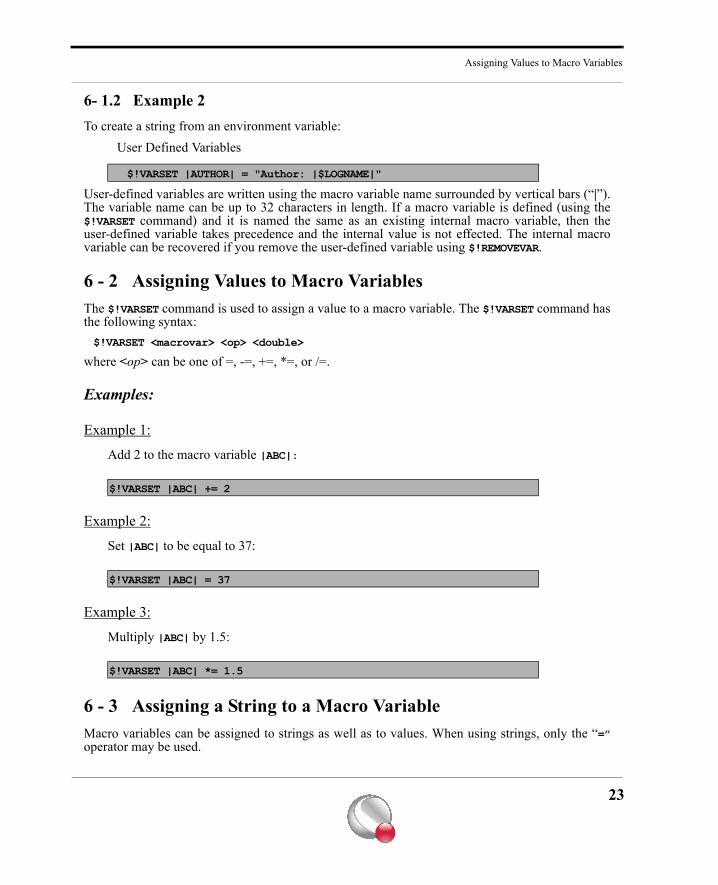
6- 1.2 Example 2To create a string from an environment variable: User Defined Variables
User-defined variables are written using the macro variable name surrounded by vertical bars (“|”).The variable name can be up to 32 characters in length. If a macro variable is defined (using the$!VARSET command) and it is named the same as an existing internal macro variable, then theuser-defined variable takes precedence and the internal value is not effected. The internal macrovariable can be recovered if you remove the user-defined variable using $!REMOVEVAR.
6 - 2 Assigning Values to Macro VariablesThe $!VARSET command is used to assign a value to a macro variable. The $!VARSET command hasthe following syntax:$!VARSET <macrovar> <op> <double>
where <op> can be one of =, -=, +=, *=, or /=.
Examples:
Example 1:
Add 2 to the macro variable |ABC|:
Example 2:
Set |ABC| to be equal to 37:
Example 3:
Multiply |ABC| by 1.5:
6 - 3 Assigning a String to a Macro VariableMacro variables can be assigned to strings as well as to values. When using strings, only the “=”operator may be used.
$!VARSET |AUTHOR| = "Author: |$LOGNAME|"
$!VARSET |ABC| += 2
$!VARSET |ABC| = 37
$!VARSET |ABC| *= 1.5
23
Macro Variables
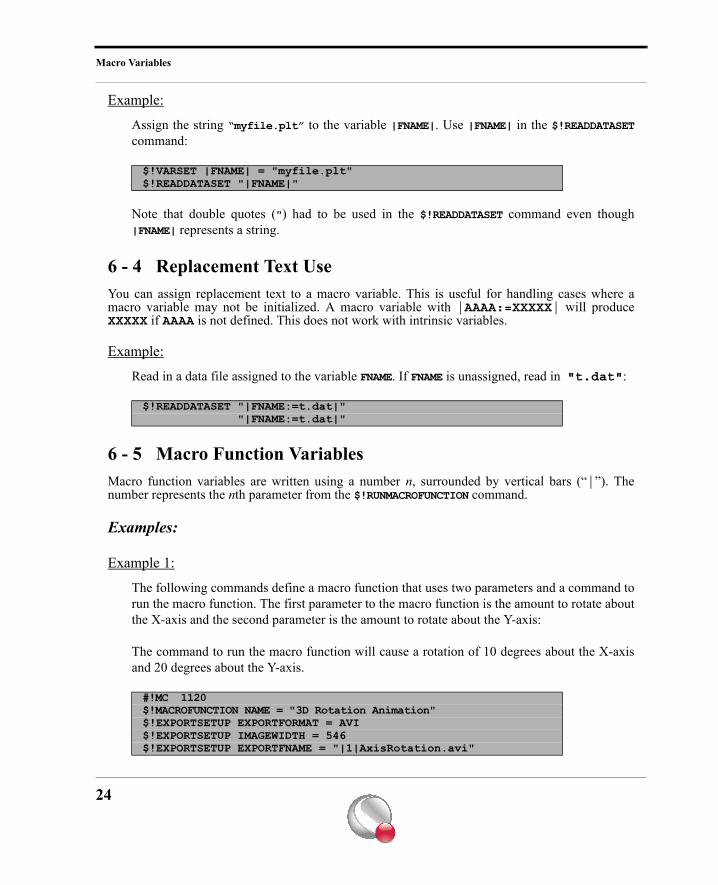
Example:
Assign the string “myfile.plt” to the variable |FNAME|. Use |FNAME| in the $!READDATASETcommand:
Note that double quotes (") had to be used in the $!READDATASET command even though|FNAME| represents a string.
6 - 4 Replacement Text UseYou can assign replacement text to a macro variable. This is useful for handling cases where amacro variable may not be initialized. A macro variable with |AAAA:=XXXXX| will produceXXXXX if AAAA is not defined. This does not work with intrinsic variables.
Example:
Read in a data file assigned to the variable FNAME. If FNAME is unassigned, read in "t.dat":
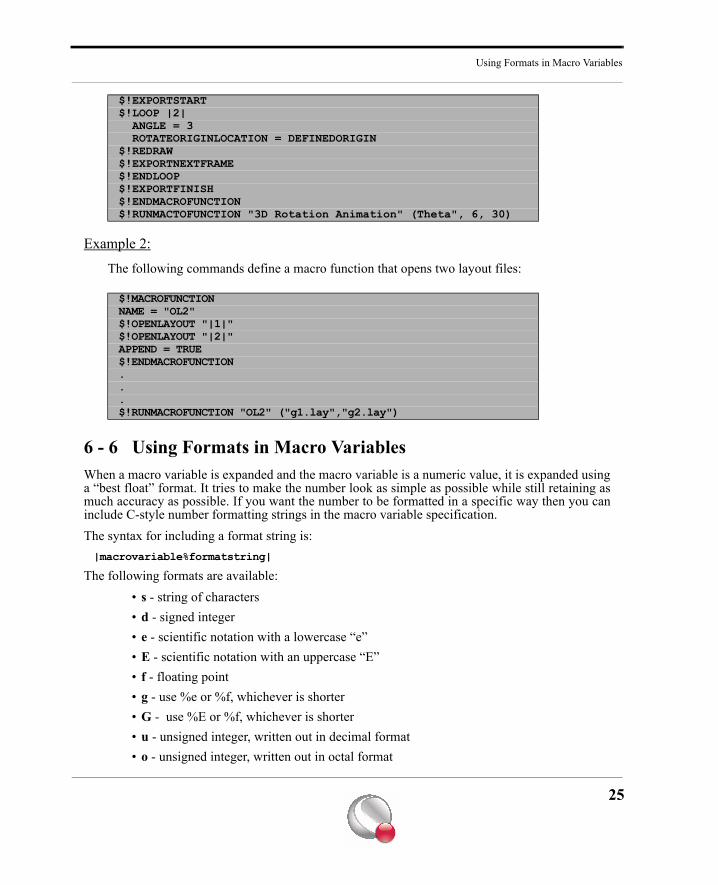
6 - 5 Macro Function VariablesMacro function variables are written using a number n, surrounded by vertical bars (“|”). Thenumber represents the nth parameter from the $!RUNMACROFUNCTION command.
Examples:
Example 1:
The following commands define a macro function that uses two parameters and a command torun the macro function. The first parameter to the macro function is the amount to rotate aboutthe X-axis and the second parameter is the amount to rotate about the Y-axis:
The command to run the macro function will cause a rotation of 10 degrees about the X-axisand 20 degrees about the Y-axis.
$!VARSET |FNAME| = "myfile.plt"$!READDATASET "|FNAME|"
$!READDATASET "|FNAME:=t.dat|" "|FNAME:=t.dat|"
#!MC 1120$!MACROFUNCTION NAME = "3D Rotation Animation"$!EXPORTSETUP EXPORTFORMAT = AVI$!EXPORTSETUP IMAGEWIDTH = 546$!EXPORTSETUP EXPORTFNAME = "|1|AxisRotation.avi"
24
Using Formats in Macro Variables
Example 2:
The following commands define a macro function that opens two layout files:
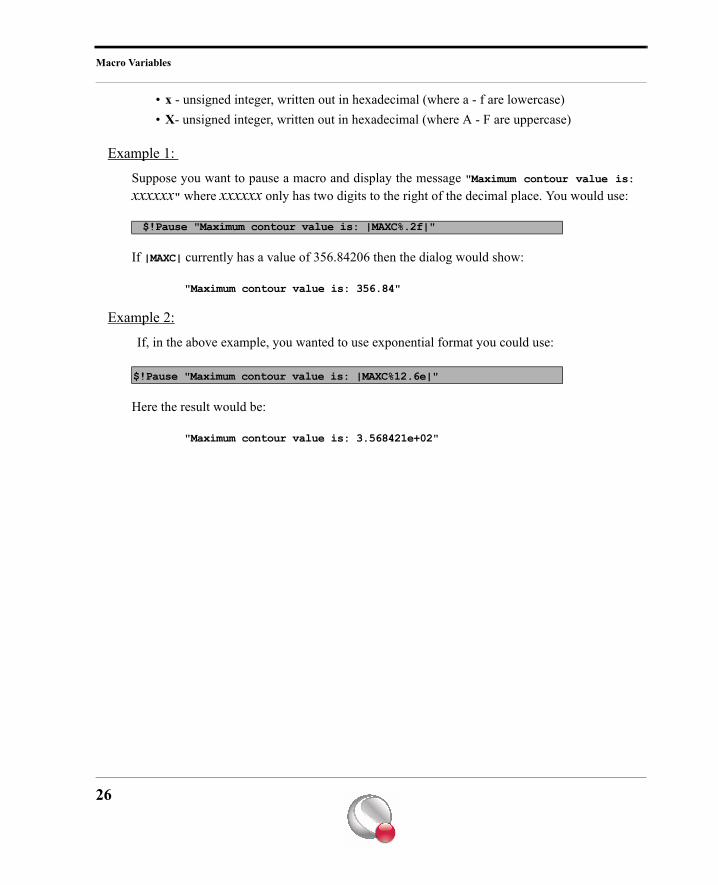
6 - 6 Using Formats in Macro VariablesWhen a macro variable is expanded and the macro variable is a numeric value, it is expanded usinga “best float” format. It tries to make the number look as simple as possible while still retaining asmuch accuracy as possible. If you want the number to be formatted in a specific way then you caninclude C-style number formatting strings in the macro variable specification.The syntax for including a format string is:|macrovariable%formatstring|
The following formats are available:• s - string of characters• d - signed integer• e - scientific notation with a lowercase “e”• E - scientific notation with an uppercase “E”• f - floating point• g - use %e or %f, whichever is shorter• G - use %E or %f, whichever is shorter• u - unsigned integer, written out in decimal format• o - unsigned integer, written out in octal format
$!EXPORTSTART$!LOOP |2| ANGLE = 3 ROTATEORIGINLOCATION = DEFINEDORIGIN$!REDRAW$!EXPORTNEXTFRAME$!ENDLOOP$!EXPORTFINISH$!ENDMACROFUNCTION$!RUNMACTOFUNCTION "3D Rotation Animation" (Theta", 6, 30)
$!MACROFUNCTIONNAME = "OL2"$!OPENLAYOUT "|1|"$!OPENLAYOUT "|2|"APPEND = TRUE$!ENDMACROFUNCTION...$!RUNMACROFUNCTION "OL2" ("g1.lay","g2.lay")
25
Macro Variables
• x - unsigned integer, written out in hexadecimal (where a - f are lowercase)• X- unsigned integer, written out in hexadecimal (where A - F are uppercase)
Example 1:
Suppose you want to pause a macro and display the message "Maximum contour value is:xxxxxx" where xxxxxx only has two digits to the right of the decimal place. You would use:
If |MAXC| currently has a value of 356.84206 then the dialog would show:
"Maximum contour value is: 356.84"
Example 2:
If, in the above example, you wanted to use exponential format you could use:
Here the result would be:
"Maximum contour value is: 3.568421e+02"
$!Pause "Maximum contour value is: |MAXC%.2f|"
$!Pause "Maximum contour value is: |MAXC%12.6e|"
26
Chapter 7 Macro Command Summary
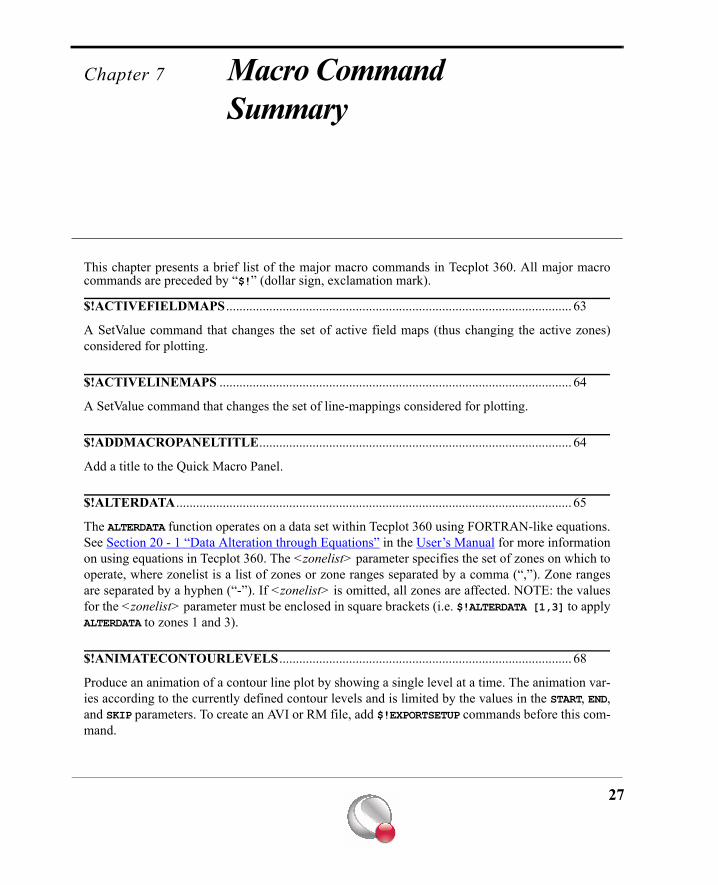
This chapter presents a brief list of the major macro commands in Tecplot 360. All major macrocommands are preceded by “$!” (dollar sign, exclamation mark).
$!ACTIVEFIELDMAPS ........................................................................................................ 63
A SetValue command that changes the set of active field maps (thus changing the active zones)considered for plotting.
$!ACTIVELINEMAPS .......................................................................................................... 64
A SetValue command that changes the set of line-mappings considered for plotting.
$!ADDMACROPANELTITLE.............................................................................................. 64
Add a title to the Quick Macro Panel.
$!ALTERDATA ....................................................................................................................... 65
The ALTERDATA function operates on a data set within Tecplot 360 using FORTRAN-like equations.See Section 20 - 1 “Data Alteration through Equations” in the User’s Manual for more informationon using equations in Tecplot 360. The <zonelist> parameter specifies the set of zones on which tooperate, where zonelist is a list of zones or zone ranges separated by a comma (“,”). Zone rangesare separated by a hyphen (“-”). If <zonelist> is omitted, all zones are affected. NOTE: the valuesfor the <zonelist> parameter must be enclosed in square brackets (i.e. $!ALTERDATA [1,3] to applyALTERDATA to zones 1 and 3).
$!ANIMATECONTOURLEVELS........................................................................................ 68
Produce an animation of a contour line plot by showing a single level at a time. The animation var-ies according to the currently defined contour levels and is limited by the values in the START, END,and SKIP parameters. To create an AVI or RM file, add $!EXPORTSETUP commands before this com-mand.
27
Macro Command Summary
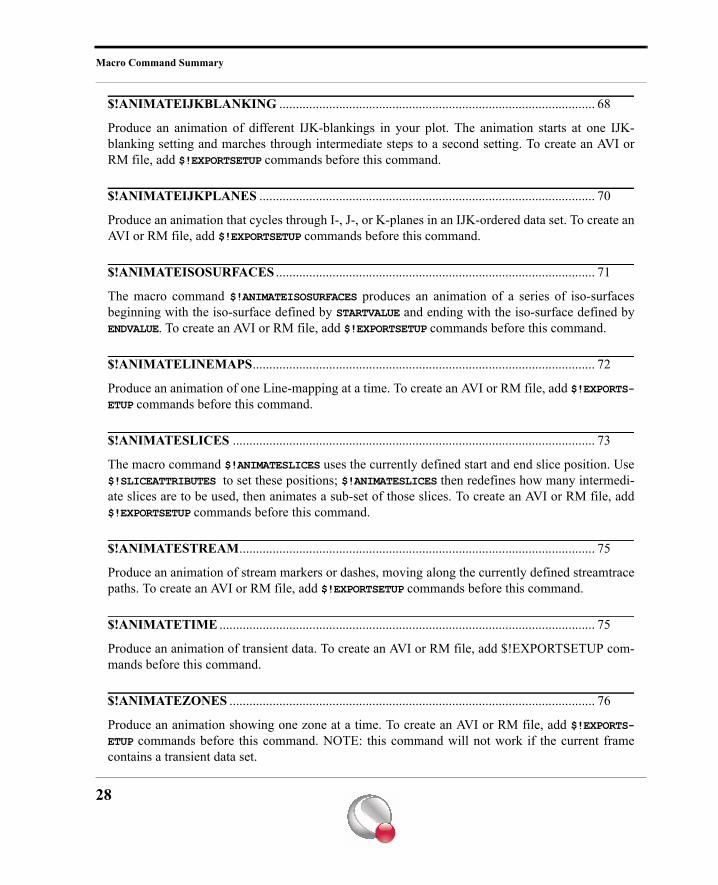
$!ANIMATEIJKBLANKING ............................................................................................... 68
Produce an animation of different IJK-blankings in your plot. The animation starts at one IJK-blanking setting and marches through intermediate steps to a second setting. To create an AVI orRM file, add $!EXPORTSETUP commands before this command.
$!ANIMATEIJKPLANES ..................................................................................................... 70
Produce an animation that cycles through I-, J-, or K-planes in an IJK-ordered data set. To create anAVI or RM file, add $!EXPORTSETUP commands before this command.
$!ANIMATEISOSURFACES ................................................................................................ 71
The macro command $!ANIMATEISOSURFACES produces an animation of a series of iso-surfacesbeginning with the iso-surface defined by STARTVALUE and ending with the iso-surface defined byENDVALUE. To create an AVI or RM file, add $!EXPORTSETUP commands before this command.
$!ANIMATELINEMAPS....................................................................................................... 72
Produce an animation of one Line-mapping at a time. To create an AVI or RM file, add $!EXPORTS-ETUP commands before this command.
$!ANIMATESLICES ............................................................................................................. 73
The macro command $!ANIMATESLICES uses the currently defined start and end slice position. Use$!SLICEATTRIBUTES to set these positions; $!ANIMATESLICES then redefines how many intermedi-ate slices are to be used, then animates a sub-set of those slices. To create an AVI or RM file, add$!EXPORTSETUP commands before this command.
$!ANIMATESTREAM........................................................................................................... 75
Produce an animation of stream markers or dashes, moving along the currently defined streamtracepaths. To create an AVI or RM file, add $!EXPORTSETUP commands before this command.
$!ANIMATETIME ................................................................................................................. 75
Produce an animation of transient data. To create an AVI or RM file, add $!EXPORTSETUP com-mands before this command.
$!ANIMATEZONES .............................................................................................................. 76
Produce an animation showing one zone at a time. To create an AVI or RM file, add $!EXPORTS-ETUP commands before this command. NOTE: this command will not work if the current framecontains a transient data set.
28
$!ATTACHDATASET ............................................................................................................ 77
Attach the current frame to the data set of another frame. Use PAGENUM, if the other frame is ona difference page. This command is usually found only in layout files generated by Tecplot 360.Note that the $!PLOTTYPE command automatically executes an $!ATTACHDATASET command if aframe mode is requested in a frame that does not have an attached data set. Tecplot 360 attaches thedata set from the closest frame (in drawing order) having an attached data set.
$!ATTACHGEOM.................................................................................................................. 78
Attach a geometry to the current frame.
$!ATTACHTEXT.................................................................................................................... 80
Attach text to the current frame.
$!BASICCOLOR .................................................................................................................... 82
A SetValue command that sets the red, green and blue components for any of the basic colors inTecplot 360.
$!BASICSIZE.......................................................................................................................... 83
A SetValue command that sets sizes of various objects like line thicknesses, line pattern length, fontheight, and so forth. Sizes can be assigned when interacting with Tecplot 360 by either entering anexact value or by choosing from a preset list of values. The $!BASICSIZE command allows you tochange the values in the preset lists.
$!BLANKING ......................................................................................................................... 84
A SetValue command that changes settings for IJK- or value-blanking.
$!BRANCHCONNECTIVITY .............................................................................................. 87
For zones where connectivity is shared, this command allows for branching of connectivity infor-mation from the specified zone.
$!BRANCHFIELDDATAVAR ............................................................................................... 87
Allows for branching of specified variable in the specified zone for zones that share variables.
$!BREAK................................................................................................................................. 88
Jump out of the current $!LOOP-ENDLOOP or $!WHILE-$!ENDWHILE.
29
Macro Command Summary
$!COLORMAPCONTROL [<groupnumber>] [Required-Control Option].................... 88
The different commands in the COLORMAPCONTROL compound function family are described sepa-rately in the following sections. Group number is an optional parameter ranging from 1 to 8, whichdefaults to 1 when omitted.
$!COLORMAPCONTROL [<groupnumber>] REDISTRIBUTECONTROLPOINTS 88
Redistribute the control points for the currently active color map so they are evenly spaced acrossthe color map. This is equivalent to clicking Redistribute Control Points in the Color Map dialog.Note that this does not change the RGB values assigned at each control point. Group number is anoptional parameter ranging from 1 to 8, which defaults to 1 when omitted.
$!COLORMAPCONTROL [<groupnumber>] COPYSTANDARD................................. 89
Preset either the user-defined color map or the raw user-defined color map to be a copy of one ofthe standard color maps. Tecplot 360 must currently be using either the user-defined color map orthe raw user-defined color map in order to use this function. Group number is an optional parameterranging from 1 to 8, which defaults to 1 when omitted.
$!COLORMAPCONTROL [<groupnumber>] RESETTOFACTORY............................ 89
Redistribute the control points and reset the RGB values for the currently active color map. This isequivalent to clicking Reset on the Color Map dialog. Group number is an optional parameter rang-ing from 1 to 8, which defaults to 1 when omitted.
$!COMPATIBILITY .............................................................................................................. 89
Allow datasharing access and setting, without warning.
$!CONTINUE ......................................................................................................................... 90
Transfer control back to nearest $!LOOP or $!WHILE.
$!CONTOURLABELS [Required-Control Option] ........................................................... 90
The different commands in the CONTOURLABELS compound function family are described separatelyin the following sections.
$!CONTOURLABELS ADD ................................................................................................. 90
Add contour labels to your plot.
30
$!CONTOURLABELS DELETEALL ................................................................................. 91
Delete all currently defined contour labels.
$!CONTOURLEVELS [Required-Control Option]............................................................ 92
The different commands in the CONTOURLEVELS compound function family are described separatelyin the following sections.
$!CONTOURLEVELS ADD ................................................................................................. 92
Add a new set of contour levels to the existing set of contour levels.
$!CONTOURLEVELS DELETENEAREST....................................................................... 93
Delete the contour level whose value is nearest the value supplied in the RANGEMIN parameter.
$!CONTOURLEVELS DELETERANGE ........................................................................... 93
Delete all contour levels between a minimum and maximum contour value (inclusive).
$!CONTOURLEVELS NEW ................................................................................................ 94
Replace the current set of contour levels with a new set.
$!CONTOURLEVELS RESET............................................................................................. 94
Reset the contour levels to a set of evenly distributed values spanning the entire range of the cur-rently selected contouring variable.
$!CONTOURLEVELS RESETTONICE ............................................................................. 95
Reset the contour levels to a set of evenly distributed, nice values spanning the entire range of thecurrently selected contouring variable, with a specified number of entries.
$!CREATECIRCULARZONE.............................................................................................. 96
Create a circular (or cylindrical) IJ- or IJK-ordered zone.
31
Macro Command Summary
$!CREATEBOUNDARYZONES .......................................................................................... 96
(StarCCM Loader ONLY)
If TRUE, boundary zones are created. Use this command when working with StarCCM data to pre-serve backward compatibility.
$!CREATECONTOURLINEZONES................................................................................... 97
Create zones from the currently-defined contour lines. One zone can be created from each contourlevel in that plot, or one zone for every polyline can be generated.
$!CREATEFEBOUNDARY .................................................................................................. 98
Zone edges for finite element data cannot be turned on or off using the edge plot layer in Tecplot360. You can, however, create a separate zone which is the boundary of a finite element zone. Thisnew zone can then be turned on or off.
$!CREATEFESURFACEFROMIORDERED ..................................................................... 98
A FE-Surface zone can be generated from two or more I-Ordered zones. To get the best possibleoutput, it is recommended that the source zones should have their nodes arranged in a similar man-ner so that the connecting lines between points are as straightforward as possible. For this reason,indices from source zones should increase in the same direction.
$!CREATEISOZONES .......................................................................................................... 99
Create zones from the currently defined iso-surfaces. One zone will be created from each definediso-surface. The iso-surfaces must be active and you must have at least one active volume zone.
$!CREATELINEMAP ........................................................................................................... 99
Create a new Line-mapping.
$!CREATEMIRRORZONES.............................................................................................. 100
Create new zones that are mirror images of the source zones
$!CREATENEWFRAME .................................................................................................... 100
Creates a new frame.
32
$!CREATERECTANGULARZONE .................................................................................. 101
Create a rectangular zone. If no data set exists when this command is executed, a data set is createdwith variables X, Y (and Z, if KMax > 1). If a data set exists prior to this command, the non-coordi-nate variables for the zone created are initialized to zero.
$!CREATESIMPLEZONE .................................................................................................. 102
Create a new zone by specifying only a list of XY-pairs of data. If other zones exist prior to usingthis function and there are more than 2 variables, then the additional variables are also created andset to zero.
$!CREATESLICEZONEFROMPLANE ........................................................................... 103
Create a new zone as a slice through existing 3D volume zones. Use $!GLOBALTHREED todefine the slicing plane orientation.
$!CREATESLICEZONES ................................................................................................... 104
Create a new zone for each slice defined on the Slice Details dialog. Only creates slices from vol-ume zones.
$!CREATESPHERICALZONE .......................................................................................... 104
Create a spherical IJK-ordered zone.
$!CREATESTREAMZONES .............................................................................................. 105
Create one or more zones out of the currently defined streamtraces. The new zones have the samenumber of variables per data point as the other zones in the data set with all non-coordinate vari-ables interpolated at the positions along the streamtrace.
$!DATASETUP ..................................................................................................................... 106
A SetValue command that sets miscellaneous parameters related to data.
$!DEFAULTGEOM .............................................................................................................. 107
A SetValue command that sets the attributes for the default geometry. When a geometry is createdinteractively, its color, line thickness, and so forth, are preset based on the default geometry. Thiscommand is usually used only in the Tecplot 360 configuration file.
33
Macro Command Summary
$!DEFAULTTEXT ............................................................................................................... 108
A SetValue command that sets the attributes for the default text. When text is added to a plot inter-actively, its font, color, size, and so forth, are based on the default text. This command is usuallyused only in the Tecplot 360 configuration file.
$!DELAY ............................................................................................................................... 108
Delay Tecplot 360 execution for <integer> seconds.
$!DELETEAUXDATA ......................................................................................................... 109
Delete Auxiliary Data in the form of name/value pairs from zones, frames or datasets.
$!DELETELINEMAPS ....................................................................................................... 109
Delete one or more Line-mappings. If <set> is omitted then all Line-mappings are deleted.
$!DELETEVARS .................................................................................................................. 110
Delete one or more variables.
$!DELETEZONES ............................................................................................................... 110
Delete one or more zones.
$!DOUBLEBUFFER [Required-Control Option]............................................................. 110
The different commands in the DOUBLEBUFFER compound function family are described separatelyin the following sections.
$!DOUBLEBUFFER OFF ................................................................................................... 110
Turn off double buffering; use this command once at the end of a sequence of using the doublebuffer.
$!DOUBLEBUFFER ON ..................................................................................................... 111
Turn on double buffering; use this command once at the beginning of a sequence of using the dou-ble buffer. While double buffering is turned on all drawing is sent to the back buffer.
$!DOUBLEBUFFER SWAP................................................................................................ 111
Swap the back buffer to the front. In other words, copy the image in the back buffer to the front.
34
$!DRAWGRAPHICS............................................................................................................ 111
Turn on or off all graphics drawing. Turning off all graphics during preliminary portions of a macrofile can greatly increase the efficiency of the macro.
$!DROPDIALOG ................................................................................................................. 112
Drop a Tecplot 360 interface dialog. This command is mainly useful for the Tecplot 360 demo. Tolaunch a dialog use $!LAUNCHDIALOG.
$!DUPLICATELINEMAP ................................................................................................... 112
Copy attributes from an existing Line-mapping to another.
$!DUPLICATEZONE .......................................................................................................... 113
Make a copy of an existing zone. You can assign index ranges to create a new zone which is a sub-set of the source zone.
$!ELSE................................................................................................................................... 114
Conditionally handle macro commands. Used when an $!IF statement is FALSE.
$!ELSEIF............................................................................................................................... 115
Conditionally handle macro commands. Used to create multiple options for statements should an$!IF statement be FALSE.
$!EXPORT ............................................................................................................................ 116
Export an image file from Tecplot 360. See the $!EXPORTSETUP command for details on settingup the exported image type. The $!EXPORT command is not valid for animation formats. (AVI andRaster Metafile.)
$!EXPORTCANCEL............................................................................................................ 116
Cancel out of the current export animation sequence. The animation file being generated isremoved.
$!EXPORTFINISH............................................................................................................... 116
Signals the completion of an animation sequence and causes the animation file to be created. Youmust call $!EXPORTSTART prior to using $!EXPORTFINISH. This command is only valid for anima-
35
Macro Command Summary
tion formats. (AVI and Raster Metafile.) You may use the |EXPORTISRECORDING| intrinsic variableto make sure that an animation sequence has been initiated.
$!EXPORTNEXTFRAME .................................................................................................. 117
Records the next frame of an animation. You must call $!EXPORTSTART prior to calling $!EXPORT-NEXTFRAME. This command is only valid for animation formats. (AVI and Raster Metafile. You mayuse the |EXPORTISRECORDING| intrinsic variable to make sure that an animation sequence has beeninitiated.)
$!EXPORTSETUP ............................................................................................................... 117
A SetValue command that sets the attributes for exporting image files from Tecplot 360. Exportingis usually intended as a means to transfer images from Tecplot 360 to be imported by other applica-tions. See $!PRINTSETUP and $!PRINT for generating output intended for printers and plotters.
$!EXPORTSTART ............................................................................................................... 118
Signals the start of an animation sequence and records the first frame of the animation. This com-mand is only valid for animation formats. (AVI and Raster Metafile.)
$!EXTENDEDCOMMAND ................................................................................................ 119
Send a command to an add-on. The add-on registers the name of a function that will be called whenan $!EXTENDEDCOMMAND is processed. Tecplot 360 knows which registered function to call based onthe COMMANDPROCESSORID string. See the function TecUtilMacroExtCommandCallback in the ADKReference Manual.
$!EXTRACTFROMGEOM ................................................................................................ 120
Extract data from a 2- or 3D field plot. The locations at which to extract the data come from apolyline geometry that must be picked prior to issuing this command.
$!EXTRACTFROMPOLYLINE ........................................................................................ 121
Extract data from a 2- or 3D field plot. The locations of where to extract the data from come from asupplied polyline in the form of <xyzrawdata>.
$!FIELDLAYERS................................................................................................................. 122
A SetValue command that turns field plot layers on or off, or sets the 2D draw order.
36
$!FIELDMAP........................................................................................................................ 123
A SetValue command that assigns zone attributes for field plots. The <set> parameter immediatelyfollowing the $!FIELDMAP command is optional. If <set> is omitted then the assignment is appliedto all zones. Otherwise the assignment is applied only to the zones specified in <set>.
$!FILECONFIG.................................................................................................................... 126
A SetValue command that sets file path information in Tecplot 360.
$!FONTADJUST................................................................................................................... 129
A SetValue command that sets character spacing and sizing for fonts in Tecplot 360. These param-eters are rarely changed.
$!FRAMECONTROL [Required-Control Option] ........................................................... 130
The different commands in the FRAMECONTROL compound function family are described separatelyin the following sections.
$!FRAMECONTROL DELETETOP................................................................................. 130
Delete the top (active) frame. If there is only one frame when this is called, a new empty frame isautomatically created after this command is executed. (Thus, you can never have a workspace with-out at least one frame.)
$!FRAMECONTROL FITALLTOPAPER ........................................................................ 131
Resize all frames so that they fit inside the hardclip limits of the paper.
$!FRAMECONTROL POP ................................................................................................. 131
Pop a frame to the top (make it the active frame).
$!FRAMECONTROL POPATPOSITION......................................................................... 131
Pop the top most frame at a specified position on the paper.
$!FRAMECONTROL POPBYNAME ............................................................................... 132
Pop the specified frame to the top of the view stack.
37
Macro Command Summary
$!FRAMECONTROL PUSH .............................................................................................. 132
Push a frame to the bottom of the frame stack (it is given the frame number 1 and therefore drawnfirst).
$!FRAMECONTROL PUSHBYNAME ............................................................................ 133
Push the specified frame to the bottom of the view stack.
$!FRAMECONTROL PUSHTOP ...................................................................................... 133
Push the top (active) frame to the bottom.
$!FRAMELAYOUT ............................................................................................................. 133
A SetValue command that sets the position, border, and background attributes for the current frame.Use the $!FRAMECONTROL action command to push and pop frames if you want to change the set-tings for a frame other than the current frame.
$!FRAMENAME .................................................................................................................. 134
Set the name for the current frame.
$!FRAMESETUP ................................................................................................................. 135
A SetValue command that sets parameters used to preset dynamic frame attributes when a frame isinitialized.
$!GETAUXDATA ................................................................................................................. 137
Retrieve Auxiliary Data in the form of name/value pairs and save it to the macro variable.
$!GETCONNECTIVITYREFCOUNT .............................................................................. 137
Fetch the count of how many zones share connectivity with the specified zone. Count includesspecified zone.
$!GETCURFRAMENAME................................................................................................. 138
Query Tecplot 360 for the name of the current frame. The <macrovar> represents the macro vari-able to receive the results.
38
$!GETFIELDVALUE........................................................................................................... 138
Fetch the field value (data set value) at the specified point index and assign the value to <macro-var>. If the zone referenced is IJ- or IJK-ordered, then the point index is calculated by treating the2- or 3Dimensional array as a 1-D array.
$!GETFIELDVALUEREFCOUNT .................................................................................... 139
Get the count of how many zones share the indicated variable with the specified zone. Countincludes the specified zone.
$!GETNODEINDEX ............................................................................................................ 140
This function only works for finite-element zones. Query for the node index in the specified loca-tion as described by the ZONE, ELEMENT, and CORNER parameters.
$!GETVARLOCATION ....................................................................................................... 140
Returns the location of the variable in the zone as either CELLCENTERED or NODAL and savesin the macro variable.
$!GETVARNUMBYNAME ................................................................................................. 141
Given a variable name, get the number for that variable. This variable number can then be used toassign attributes, such as what variable to use for contouring.
$!GETZONETYPE............................................................................................................... 141
Query for the zone type of the specified zone. The zone type will be assigned to <macrovar>.
$!GLOBALCOLORMAP .................................................................................................... 142
A SetValue command that changes the settings for the global contour color map and the global lightsource shading color map in Tecplot 360. Changes here affect all frames using these color maps.See $!GLOBALCONTOUR COLORMAPFILTER for additional settings that can be applied on aframe-by-frame basis.
$!GLOBALCONTOUR ....................................................................................................... 143
A SetValue command that changes global attributes associated with contour plots or contour levels.<contourgroup> refers to the defined contour groups, C1-C8, allowed in Tecplot 360, and takes aninteger value of one through eight. The <contourgroup> parameter is optional, and if omitted, C1will be treated as current. If you would like the settings in these commands to persist, add them to
39
Macro Command Summary
your tecplot.cfg file, located in your installation directory. The NUMBERFORMAT setting for LABELSalso controls the number format in the legend.
$!GLOBALEDGE ................................................................................................................ 146
A SetValue command that sets attributes which sets the minimum crease angle for edges. If youwould like the settings in this command to persist, add it to your tecplot.cfg file, located in yourinstallation directory.
$!GLOBALFRAME ............................................................................................................. 147
A SetValue command that sets attributes which apply to all frames. If you would like the settings inthis command to persist, add it to your tecplot.cfg file, located in your installation directory.
$!GLOBALLINEPLOT ....................................................................................................... 147
A SetValue command that changes global attributes associated with Line-plots. If you would likethe settings in these commands to persist, add it to your tecplot.cfg file, located in your installationdirectory.
$!GLOBALLINKING .......................................................................................................... 149
Set to true to tie all colormaps together. If you would like the settings in this command to persist,add it to your tecplot.cfg file, located in your installation directory.
$!GLOBALPAPER............................................................................................................... 149
A SetValue command that sets the paper size characteristics. If you would like the settings in thiscommand to persist, add it to your tecplot.cfg file, located in your installation directory.
$!GLOBALPOLAR.............................................................................................................. 150
Allows polar plots to have curved lines that are interpolated along the R-Axis between data points.
$!GLOBALRGB ................................................................................................................... 150
Allows RGB coloring for plots which have RGB values specified at each vertex. This coloringoption is valuable for plots with entities such as Gas, Oil and Water. RGB Coloring can be assignedto field plot objects such as zones, iso-surfaces and slices
$!GLOBALSCATTER ......................................................................................................... 152
A SetValue command that changes global attributes associated with scatter plots.
40
$!GLOBALTHREED ........................................................................................................... 154
A SetValue command that changes global attributes associated with 3D plots.
$!GLOBALTHREEDVECTOR .......................................................................................... 155
A SetValue command that changes global attributes associated with 3D vector plots.
$!GLOBALTIME.................................................................................................................. 157
A SetValue command for frames (2D and 3D ONLY). Different frames can have different valuesof $!GLOBALTIME. If you would like the settings in this command to persist, add them to your tec-plot.cfg file (located in your installation directory).
$!GLOBALTWODVECTOR .............................................................................................. 157
A SetValue command that changes global attributes associated with 2D vector plots.
$!IF...$!ENDIF....................................................................................................................... 158
Conditionally process macro commands.
$!INCLUDEMACRO ........................................................................................................... 159
Insert the commands from another macro file. Because the $!INCLUDEMACRO command is processedwhen the macro is loaded and not when the macro is executed, you are not allowed to referencemacro variables within the <string> parameter.
$!INTERFACE...................................................................................................................... 159
A SetValue command that sets attributes related to the Tecplot 360 interface.
$!INVERSEDISTINTERPOLATE ..................................................................................... 168
Interpolate selected variables from one or more zones onto a destination zone using the inverse dis-tance method.
$!ISOSURFACEATTRIBUTES .......................................................................................... 169
A SetValue command which changes attributes associated with iso-surfaces.The optional groupparameter can range from 1-8 and defaults to 1 when absent.
41
Macro Command Summary
$!ISOSURFACELAYERS ................................................................................................... 171
$!KRIG .................................................................................................................................. 171
Interpolate selected variables from a set of source zones to a destination zone using the krigingmethod.
$!LAUNCHDIALOG ........................................................................................................... 172
Launch a Tecplot 360 interface dialog; This command is mainly useful for the Tecplot 360 demo.
$!LIMITS .............................................................................................................................. 173
A SetValue command that sets some of the internal limits in Tecplot 360. See Appendix F “Limitsof Tecplot 360” in the User’s Manual for additional information. The $!LIMITS command can onlybe used in the Tecplot 360 configuration file.
$!LINEARINTERPOLATE ................................................................................................ 174
Interpolate selected variables from a set of source zones to a destination zone using linear interpola-tion. The source zones cannot be I-ordered. Values assigned to the destination zone are equivalentto the results of using the probe tool in Tecplot 360.
$!LINEMAP .......................................................................................................................... 174
A SetValue command that assigns attributes for individual Line-mappings. The <set> parameterimmediately following the $!LINEMAP command is optional. If <set> is omitted then the assignmentis applied to all Line-mappings, otherwise the assignment is applied only to the Line-mappingsspecified in <set>.
$!LINEPLOTLAYERS ........................................................................................................ 178
A SetValue command that turns on or off Line-plot layers.
$!LINKING ........................................................................................................................... 178
Link attributes in two or more frames so that changes to attributes of one frame effect all linkedframes.
$!LOADADDON................................................................................................................... 179
Load an add-on into Tecplot 360. The <string> is the name of the add-on to load. See Section 32 - 1“Add-on Loading” in the User’s Manual for instructions on how to specify the add-on.
42
$!LOADCOLORMAP.......................................................................................................... 180
Load a color map file. The <string> is the name of the file to load.
$!LOOP...$!ENDLOOP ........................................................................................................ 180
Process macro commands in a loop. Within the loop you may access the current loop counter usingthe internal macro variable |Loop|. Loops may be nested up to 10 levels deep.
$!MACROFUNCTION...$!ENDMACROFUNCTION .................................................... 180
Define a macro function. All commands between a $!MACROFUNCTION and the $!ENDMACROFUNCTIONare associated with the macro function NAME. These commands are not executed when they aredefined but are executed when a $!RUNMACROFUNCTION command is processed. Parameters can bepassed to a macro function. Use |n| to reference the nth parameter. (See $!RUNMACROFUNC-TION). In the user-interface, [Crtl]-M must be pressed, before using the keyboard shortcut speci-fied by the KEYSTROKE option. For example, if the KEYSTROKE option is set to "P", the user mustpress [CTRL]-M-P.
$!NEWLAYOUT................................................................................................................... 181
Clear the current layout and start again.
$!OPENLAYOUT ................................................................................................................. 182
Open and read in a new layout file. The <string> is the name of the file to open.
$!PAGE .................................................................................................................................. 183
A SetValue command that sets the paper characteristics.
$!PAGECONTROL [Required-Control Option]............................................................... 184
The different commands in the PAGECONTROL compound function family are described separately inthe following sections.
$!PAGECONTROL CREATE............................................................................................. 184
Create a new page. An initial frame is created in the page.
$!PAGECONTROL SETCURRENTTONEXT................................................................. 184
Set the next page to be the current page.
43
Macro Command Summary
$!PAGECONTROL SETCURRENTTOPREVIOUS ....................................................... 184
Set the previous page to be the current page.
$!PAGECONTROL SETCURRENTBYNAME................................................................ 185
Set the current page to the page specified.
$!PAGECONTROL DELETE ............................................................................................ 185
Delete the current page. If the command is operated on the only page, then an initial page is createdwith an initial frame.
$!PAGECONTROL CLEAR............................................................................................... 185
Clears all frames in the current page and creates a default initial frame.
$!PAGEGETNAME ............................................................................................................. 185
Action command to get the name of the current page.
$!PAGENAME...................................................................................................................... 185
Set the name of the page.
$!PAUSE ................................................................................................................................ 186
Stop execution of a macro and optionally display a dialog with a message. If <string> is set to ""then no dialog is displayed and the user must click in the work area to continue.
$!PICK [Required-Control Option].................................................................................... 186
The different commands in the PICK compound function family are described separately in the fol-lowing sections.
$!PICK ADD ......................................................................................................................... 186
Attempt to pick an object at a specific location on the paper.
$!PICK ADDALL ................................................................................................................. 187
Add all objects of a certain type to the list of picked objects.
44
$!PICK ADDALLINRECT.................................................................................................. 188
Add objects defined within a specified region to the list of picked objects. The region is defined interms of the paper coordinate system. Optional filters can be used to restrict the objects selected.The region is defined by the two corner points (X1, Y1) and (X2, Y2).
$!PICK CLEAR .................................................................................................................... 190
Delete all objects that are currently picked. (These objects cannot be retrieved.)
$!PICK COPY....................................................................................................................... 190
Copy all objects that are currently picked to the paste buffer.
$!PICK CUT.......................................................................................................................... 190
Copy all objects that are currently picked to the paste buffer and then delete them.
$!PICK EDIT ........................................................................................................................ 190
Perform a global edit operation on the currently picked objects. Only one edit operation is allowedper $!PICK EDIT command. Objects are edited only if the supplied parameter is relevant. Actionstaken using the Quick Edit dialog in Tecplot 360 generate these commands.
$!PICK MAGNIFY .............................................................................................................. 193
Magnify all picked objects. The objects will also be translated proportional to the distance betweentheir anchor position and the anchor position of the first object picked.
$!PICK PASTE ..................................................................................................................... 193
Paste the currently picked objects from the paste buffer to the work area.
$!PICK POP .......................................................................................................................... 194
Change the order in which objects are drawn by popping the currently picked objects to the front.Only frames, text, geometries, and the grid area for 2D plots are allowed.
$!PICK PUSH ....................................................................................................................... 194
Change the order in which objects are drawn by pushing the currently picked objects back. Onlyframes, text, geometries, and the grid area for 2D plots are allowed.
45
Macro Command Summary
$!PICK SETMOUSEMODE ............................................................................................... 194
Prepare to pick objects by setting the mouse mode to SELECT or ADJUST. This command also clearsthe list of picked objects (that is, unpicks all picked objects).
$!PICK SHIFT...................................................................................................................... 194
Shift the currently picked objects. Objects are shifted relative to their starting position. X and Yshift amounts are in paper units (inches). If snapping is in effect then it is applied after shifting in Xand Y. (See the SetValue commands $!GLOBALFRAME SNAPTOGRID and $!GLOBAL-FRAME SNAPTOPAPER.)
$!PLOTOPTIONS ................................................................................................................ 195
Change the plot option between subdividing all cells, or using a quicker algorithm.
$!PLOTTYPE ....................................................................................................................... 196
Changes plot types between valid Tecplot 360 modes such as XYLine and Cartesian2D. Validoptions shown below.
$!POLARAXIS ..................................................................................................................... 196
A SetValue command that assigns attributes for axes in a polar frame.
$!POLARTORECTANGULAR .......................................................................................... 197
Treat the variables currently assigned to X and Y as referring to R and q and convert them to X andY. In 3D, X, Y and Z refer to R, q, and y. Tecplot 360 has addition capabilities for transformingcoordinates, please see $!TRANSFORMCOORDINATES.
$!POLARVIEW .................................................................................................................... 197
Sets the viewing style for polar plots in a layout.
$!PRINT ................................................................................................................................ 197
Print the current layout to a printer or send the print instructions to a file. Use the $!PRINTSETUPSetValue command to configure printing.
46
$!PRINTSETUP.................................................................................................................... 198
A SetValue command that sets the attributes for printing. Use $!PRINT to do the actual printing. See$!EXPORTSETUP and $!EXPORT if you intend to create image files destined for desktop publish-ing programs.
$!PROMPTFORFILENAME.............................................................................................. 200
Instruct Tecplot 360 to launch a file selection dialog. The resulting file name will be placed in<macrovar>. If the user cancels out of the dialog then <macrovar> will be empty (see the examplebelow).
$!PROMPTFORTEXTSTRING ......................................................................................... 201
Instruct Tecplot 360 to launch a dialog containing a single line text field and optional instructions.The user enters text into the text field and the resulting string is assigned to <macrovar>.
$!PROMPTFORYESNO...................................................................................................... 201
Instruct Tecplot 360 to launch a dialog containing two buttons, one labeled Yes and the other No.The <macrovar> is assigned the string Yes or No depending on the selection.
$!PROPAGATELINKING................................................................................................... 202
Link multiple frames, either within frame or between frames.
$!PUBLISH ........................................................................................................................... 202
Create an HTML file displaying one or more images. A linked layout with packaged data may beincluded. You must provide the file name.
$!QUIT................................................................................................................................... 203
Terminate the execution of the Tecplot 360 program.
$!RAWCOLORMAP ............................................................................................................ 203
Assign the RGB values that define the Raw user-defined color map. This does not set the color mapto use the Raw user-defined color map. Use $!COLORMAP to set the current color map.
$!READDATASET ............................................................................................................... 204
The $!READDATASET macro command has two separate uses. The parameters available for thecommand are dependent upon the intended use. It may either be used to load data in Tecplot 360’s
47
Macro Command Summary
file format (*.plt or *.dat) or in a foreign data file format. To load data in Tecplot 360’s file format,use the parameters listed in Table 8 - 2. To load data in a foreign file format, use the parameterslisted in Table 8 - 1 along with a set of name/value pairs. The name/value pairs are specific to thedata loader and described in Chapter 4 “Data Loaders” in the User’s Manual.
$!READSTYLESHEET ....................................................................................................... 207
Read in a stylesheet file. The <string> is the name of the file to read.
$!REDRAW ........................................................................................................................... 207
Redraw the current frame.
$!REDRAWALL ................................................................................................................... 208
Redraw all frames.
$!REMOVEVAR................................................................................................................... 208
Remove a user-defined macro variable. This frees up space so another user-defined macro variablecan be defined.
$!RENAMEDATASETVAR................................................................................................. 208
Rename a data set variable in Tecplot 360.
$!RENAMEDATASETZONE ............................................................................................. 209
Rename a data set zone in Tecplot 360.
$!RESET3DAXES ................................................................................................................ 209
Reset the ranges on the 3D axes.
$!RESET3DORIGIN............................................................................................................ 210
Reposition the rotation origin in 3D to be at the specified location.
$!RESET3DSCALEFACTORS........................................................................................... 210
Recalculate the scale factors for the 3D axes. Aspect ratio limits are taken into account.
48
$!RESETVECTORLENGTH .............................................................................................. 210
Reset the length of the vectors. Tecplot 360 will find the vector with the largest magnitude and setthe scaling factor so it will appear on the screen using the length specified by $!FRAMESETUP VECT-DEFLEN.
$!ROTATE2DDATA ............................................................................................................. 211
Rotate field data in 2D about any point.
$!ROTATE3DVIEW............................................................................................................. 211
Do a 3D rotation about a given axis. The <rotateaxis> must be supplied.
$!RUNMACROFUNCTION ............................................................................................... 212
Execute commands defined in a macro function. The <string> references the name of the macrofunction to run. If the macro command requires parameters, then include them (within parentheses)after the macro command name.
$!SAVELAYOUT .................................................................................................................. 212
Save the current layout to a file. You must supply the file name.
$!SET3DEYEDISTANCE .................................................................................................... 213
Sets the distance from the viewer to the plane of the current center of rotation.
$!SETAUXDATA .................................................................................................................. 213
Add Auxiliary Data in the form of name/value pairs to zones, frames or datasets. The name mustbegin with an underscore or letter, and may be followed by one or more underscore, period, letter,or digit characters.
$!SETDATASETTITLE ....................................................................................................... 214
Set the title for the current data set.
$!SETFIELDVALUE............................................................................................................ 214
Specify a field value (data set value) at a specified point index. If the zone referenced is IJ- orIJK-ordered then the point index is calculated by treating the 2- or 3D array as a 1-D array.
49
Macro Command Summary
$!SETFRAMEBACKGROUNDCOLOR........................................................................... 215
Sets the frame background to the specified color and surveys all basic color assignments in Tecplot360, converting the all basic colors using the following rules to achieve the best contrast:
$!SETSTYLEBASE.............................................................................................................. 216
Instruct Tecplot 360 on how to initialize frame style values when a new frame is created. Duringnormal operation, Tecplot 360 bases the style of a new frame on the factory defaults plus anychanges assigned in the Tecplot 360 configuration file. Layout files and stylesheet files, however,rely on Tecplot 360 basing new frames only on the factory defaults. This command is typically notused by the casual user.
$!SHARECONNECTIVITY ............................................................................................... 216
Share the nodemap between the source and destination zones, presuming that the zones are FE andhave the same element type and number of nodes.
$!SHAREFIELDDATAVAR ................................................................................................ 216
Allows sharing of the specified variable from the source zone to the destination zone. Zone must beof the same type (ordered or FE) and dimensions. Cell centered variables in FE must have the samenumber of cells. Sharing is not allowed if either zone has global face neighbors.
$!SHIFTLINEMAPSTOBOTTOM .................................................................................... 217
Shift a list of Line-mappings to the bottom of the Line-mapping list. This in effect causes theselected Line-mappings to be drawn last.
$!SHIFTLINEMAPSTOTOP.............................................................................................. 217
Shift a list of Line-maps to the top of the Line-map list. This in effect causes the selected Line-mapsto be drawn first.
$!SHOWMOUSEPOINTER ............................................................................................... 218
The mouse icon may be deactivated within a macro to enhance the on-screen animation. It must bereactivated before exiting the macro.
$!SKETCHAXIS................................................................................................................... 218
A SetValue command that assigns attributes for axes in a sketch mode frame. Axes are rarely usedin sketch frames.
50
$!SLICEATTRIBUTES ....................................................................................................... 219
A SetValue command that changes global attributes associated with slices.
$!SLICELAYERS ................................................................................................................. 222
Turn slicing on or off.
$!SMOOTH ........................................................................................................................... 222
Smooth data (reduce the spikes) for selected variables in selected zones.
$!STREAMATTRIBUTES .................................................................................................. 223
A SetValue command that changes global attributes associated with streamtraces.
$!STREAMTRACE [Required-Control Option]............................................................... 225
The different commands in the STREAMTRACE compound function family are described sepa-rately in the following sections.
$!STREAMTRACE ADD .................................................................................................... 225
Add a single streamtrace or a rake of streamtraces to the current frame. The frame must be a 2D or3D field plot.
$!STREAMTRACE DELETEALL .................................................................................... 227
Deletes all streamtraces in the current frame. If the frame mode is 2D, all 2D streamtraces aredeleted. If the frame mode is 3D, all 3D streamtraces are deleted.
$!STREAMTRACE DELETERANGE .............................................................................. 227
Delete a range of streamtraces. Streamtraces are numbered sequentially in the order they were cre-ated.
$!STREAMTRACE RESETDELTATIME ........................................................................ 228
Reset the time delta for dashed streamtraces. The delta time is reset such that a stream dash in thevicinity of the maximum vector magnitude will have a length approximately equal to 10 percent ofthe frame width.
51
Macro Command Summary
$!STREAMTRACE SETTERMINATIONLINE .............................................................. 228
Set the position of the termination line for streamtraces.
$!STREAMTRACELAYERS.............................................................................................. 229
Turn streamtraces on or off.
$!SYSTEM ............................................................................................................................ 229
Instruct Tecplot 360 to submit a command to the operating system. For security reasons, executionof the $!SYSTEM command can be disabled to prevent unauthorized execution of system commandsvia macros. Use the OKTOEXECUTESYSTEMCOMMAND option to the $!INTERFACE macro command.
$!THREEDAXIS .................................................................................................................. 230
A SetValue command that assigns attributes for axes in a 3D frame.
$!THREEDVIEW................................................................................................................. 232
A SetValue command that changes global attributes associated with the 3D view.
$!TRANSFORMCOORDINATES ..................................................................................... 232
Transforms all points in one or more zones from one coordinate system to another.
$!TRIANGULATE ............................................................................................................... 234
Create a new zone by forming triangles from data points in existing zones.
$!TWODAXIS....................................................................................................................... 234
A SetValue command that assigns attributes for axes in a 2D frame.
$!VARSET ............................................................................................................................. 235
Assign a value to a macro variable. If the macro variable did not exist prior to this command, then itis defined here. A macro variable can be assigned a value or a string.
$!VIEW [Required-Control Option] .................................................................................. 236
The different commands in the VIEW compound function family are described separately in the fol-lowing sections.
52
$!VIEW AXISFIT................................................................................................................. 237
Reset the range on a specific axis so that it equals the minimum and maximum of the data beingplotted. If the axis dependency is not independent then this action may also affect the range onanother axis.
$!VIEW AXISMAKECURRENTAXISVALUESNICE .................................................... 237
Reset the axis-line label values such that all currently displayed values are set to have the smallestnumber of significant digits possible.
$!VIEW AXISNICEFIT....................................................................................................... 238
Reset the range on a specific axis so that it equals the minimum and maximum of the data beingplotted, but makes the axis values “nice” by setting labels to have the smallest number of signifi-cant digits possible. If the axis dependency is not independent then this action may also affect therange on another axis.
$!VIEW CENTER ................................................................................................................ 238
Center the data within the axis grid area.
$!VIEW COPY...................................................................................................................... 239
Copy the current view to the view paste buffer. See also $!VIEW PASTE.
$!VIEW DATAFIT ............................................................................................................... 239
Fit the current set of data zones or line mappings being plotted within the grid area. This does nottake into consideration text or geometries.
$!VIEW FIT .......................................................................................................................... 239
Fit the entire plot to the grid area. This also takes into consideration text and geometries that areplotted using the grid coordinate system. In 3D, this also includes the axes.
$!VIEW FITSURFACES ..................................................................................................... 239
Fits active plot surfaces to the grid area. 3D volume zones are excluded when surfaces to plot areset to none. See $!FIELDMAP for more information on setting surfaces to plot.
53
Macro Command Summary
$!VIEW LAST ...................................................................................................................... 239
Retrieve the previous view from the view stack. Each frame mode within each frame maintains itsown view stack. $!VIEW LAST will not reverse alterations to data.
$!VIEW MAKECURRENTVIEWNICE ........................................................................... 240
Shifts axis to make axis-line values nice without changing the extents of the window. Only works inSketch/XY/2D.
$!VIEW NICEFIT ................................................................................................................ 240
Change view to make the extents of the frame neatly hold the plot with integer values for axislabels. Only works in Sketch/XY/2D.
$!VIEW PASTE .................................................................................................................... 240
Retrieve the view from the view paste buffer and assign it to the current frame.
$!VIEW PUSH ...................................................................................................................... 240
Instruct Tecplot 360 to push the current view onto the view stack. A view will not be pushed if thecurrent view is the same as the top view on the stack. Note that commands VIEW AXISFIT, VIEWCENTER, VIEW DATAFIT, VIEW FIT, and VIEW ZOOM automatically push a view onto the stack. Tec-plot 360 automatically pushes the current view onto the stack when a $!REDRAW command is issuedand the current view is different from the top view on the view stack.
$!VIEW RESETTOENTIRECIRCLE ............................................................................... 240
Reset the Theta-R Axis to initial settings. For Polar plots only.
$!VIEW SETMAGNIFICATION ....................................................................................... 241
Set the magnification for the data being plotted. A magnification of 1 will size the plot so it can fitwithin the grid area.
$!VIEW TRANSLATE ........................................................................................................ 241
Shift the data being plotted in the X- and/or Y-direction. The amount translated is in frame units.
$!VIEW ZOOM .................................................................................................................... 242
Change the view by “zooming” into the data. In Sketch, XY, and 2D frame mode plots, Tecplot 360will adjust the ranges on the axis to view the region defined by the rectangle with corners at (X1,
54
Y1) and (X2, Y2). For 3D orthographic plots, the view is translated and scaled to fit the region. For3D perspective plots, the view is rotated about the viewer and scaled to fit the region. X1 and soforth are measured in grid coordinates.
$!WHILE...$!ENDWHILE .................................................................................................. 242
Continue to execute a set of commands until a conditional expression is false.
$!WORKSPACEVIEW [Required-Control Option]......................................................... 243
The different commands in the WORKSPACEVIEW compound function family are described separatelyin the following sections.
$!WORKSPACEVIEW FITALLFRAMES ....................................................................... 243
Change the view in the workspace so all frames are fit just inside the edges of the workspace.
$!WORKSPACEVIEW FITPAPER ................................................................................... 243
Change the view in the workspace so the entire paper is fit just inside the edges of the workspace.
$!WORKSPACEVIEW FITSELECTEDFRAMES .......................................................... 243
Change the view in the workspace so the currently selected frames (that is, the frames with pickhandles) are fit just inside the edges of the workspace.
$!WORKSPACEVIEW LASTVIEW ................................................................................. 244
Return to the previous workspace view.
$!WORKSPACEVIEW MAXIMIZE ................................................................................. 244
Temporarily expand the work area as large as possible. The maximized work area occupies theentire Tecplot 360 process window.
$!WORKSPACEVIEW TRANSLATE ............................................................................... 244
Shift the view of the workspace. This has no effect on the local view within any frame in your lay-out.
$!WORKSPACEVIEW UNMAXIMIZE ........................................................................... 245
Returns the workspace to its normal size after it has been expanded after $!WORKSPACE MAXIMIZEhas been used.
55
Macro Command Summary
$!WORKSPACEVIEW ZOOM .......................................................................................... 245
Change the view into the work area. This has no effect on the local view within any frame in yourlayout.
$!WRITECOLORMAP ....................................................................................................... 245
Write the current color map to a file. The <string> is the name of the file to write to.
$!WRITECURVEINFO ....................................................................................................... 246
Write out the curve details or the calculated data points for the equation(s) used to draw the curvefor a selected line mapping. The <string> is the name of the file to write to.
$!WRITEDATASET............................................................................................................. 246
Write the data set attached to the current frame to a file. The <string> is the name of the file to writeto.
$!WRITESTYLESHEET..................................................................................................... 247
Write the style for the current frame to a file. The <string> is the name of the file to write to.
$!XYLINEAXIS.................................................................................................................... 248
A SetValue command that assigns attributes for axes in an XY Line plot.
ANIMATESTREAKLINES................................................................................................. 253
Animates previously calculated streaklines to the screen or to a file.
ATTACHINTEGRATIONRESULTS ................................................................................. 253
Attach the text results of the previous integration as a text field in the current frame.
CALCPARTICLEPATH ...................................................................................................... 253
Calculate particle paths or streaklines, starting from existing Tecplot 360 streamtraces.
CALCTURBULENCEFUNCTION.................................................................................... 257
Calculate a turbulence-related function from two variables in the current data set. Add the result tothe data set as a new variable using the function’s name, or overwrite the variable if it alreadyexists.
56

CALCULATE ....................................................................................................................... 258
Calculate a Tecplot 360 variable using the specified function and add it to the current data set. If thevariable already exists in the current data set, it will be recalculated.
CALCULATEACCURACY ................................................................................................ 259
Calculate the order accuracy of the solution contained in the listed zones. Optionally, plot the over-all accuracy versus grid spacing and plot the accuracy at each grid node.
DISPLAYBOUNDARIES .................................................................................................... 260
Displays boundaries corresponding to a geometry and boundaries specification without actuallysetting the geometry and boundaries. This macro is generally not useful for those writing macrofiles, but is recorded when the user clicks the Display Boundaries button in the Geometry andBoundaries dialog in order to duplicate the actions of Tecplot 360 that happen in response to thataction. See Section “SETGEOMETRYANDBOUNDARIES” on page 268 for a description of theparameters for this macro.
EXTRACTFLOWFEATURE.............................................................................................. 261
Extract and display shock surfaces, vortex cores, or separation and attachment lines. Shock surfacesare displayed as iso-surfaces of a new variable, ShockSurface, while vortex cores and separationand attachment lines are displayed as new zones.
EXTRAPOLATESOLUTION ............................................................................................. 261
Perform Richardson extrapolation to estimate the true solution from three input solutions on gridsof successively finer resolution. Two new zones are added to the current data set. The first containsthe extrapolated solution, while the second contains the estimated error.
INTEGRATE......................................................................................................................... 262
Perform an integration over the specified zones. If <set> is not specified, the integration will be per-formed over all zones. If PLOTAS is set to TRUE, the integration results will be plotted in a newframe.
SAVEINTEGRATIONRESULTS........................................................................................ 265
Saves the most recently calculated integration results to a text file.
SETFIELDVARIABLES...................................................................................................... 265
Identifies variables in your data, such as velocity, pressure and temperature, for use in analysis.
57
Macro Command Summary
SETFLUIDPROPERTIES................................................................................................... 266
Set the fluid properties for use by other commands.
SETGEOMETRYANDBOUNDARIES .............................................................................. 268
Specify whether the data represent an axisymmetric flow solution (2D Cartesian plots only),whether adjacent zones should be considered to be connected at coincident faces, and specify zoneboundaries and their corresponding boundary conditions. Each line of the RAWDATA describes oneboundary, and appears in the same format as on the Geometry and Boundaries dialog. For allboundaries, list the boundary condition and the set of zones, separated by a comma. The indexrange-type boundary follows this with the boundary face, the first starting index, the first endingindex, the second starting index and the second ending index. All entries are separated by commas.The boundary condition is one of INFLOW, OUTFLOW, WALL, SLIPWALL, SYMMETRY, EXTRAPOLATED. Theboundary face is one of I=1, I=IMAX, J=1, J=JMAX, K=1, and K=KMAX. Refer to Section 21 - 4 “SettingGeometry and Boundary Options” in the User’s Manual for more information on boundaries.
SETREFERENCEVALUES ................................................................................................ 269
Specify the reference (free-stream) properties of the solution, identify two variables in the currentdata set for use with other commands.
SETUNSTEADYFLOWOPTIONS .................................................................................... 270
Identifies time levels for unsteady flow, or specifies that the solution is steady-state. If the flow isunsteady, the solution time levels are specified in the RAWDATA section. The first line of the RAWDATAsection must consist of a single integer indicating the number of solution time levels. This must befollowed by the time levels themselves. Each time level must be on a separate line and must consistof a floating-point number (the solution time), as well as one or more integers (the zone numbersfor that solution time).
<<anchorpos>> ..................................................................................................................... 275
Assign attributes for positioning of objects.
<<areastyle>>........................................................................................................................ 276
Change settings for the axis grid area.
<<axisdetail>>....................................................................................................................... 276
Assign attributes for axes.
58
<<axisline>> .......................................................................................................................... 277
Assign attributes for axis lines.
<<axistitle>> .......................................................................................................................... 278
Assign attributes for titles.
<<basicsizelist>> ................................................................................................................... 279
Assign basic sizes. The units for the values assigned here are dependent on the parent command.Assignments here do not affect the plot. These assignments are used only to configure drop-downmenus in the interface so the user can make quick selections.
<<colormapcontrolpoints>> ................................................................................................ 280
All contour color maps except the Raw user-defined color map make use of control points to deter-mine the color distribution. Each control point has a position and a left and right color. The <<col-ormapcontrolpoints>> subcommand can contain more than one CONTROLPOINT subcommand.
<<colormapoverride>>......................................................................................................... 280
Change settings for a color map override. Color map overrides are used to replace a specific band ina contour color map with one of the 16 basic colors.
<<continuouscolor>> ............................................................................................................ 281
Change settings for continuous color.
<<dialogplacement>> ........................................................................................................... 282
Describes the placement for a dialog.
<<gridarea>>......................................................................................................................... 283
Change settings for the axis grid area.
<<gridlinedetail>> ................................................................................................................ 283
Change settings for axis gridlines.
<<ijk>> .................................................................................................................................. 284
Set an I-, J-, or K-index.
59
Macro Command Summary
<<indexrange>> .................................................................................................................... 285
Set an index range.
<<numberformat>>.............................................................................................................. 285
Set the format used to draw a number.
<<papersize>>....................................................................................................................... 287
Change dimensions or hardclip offsets for LETTER, DOUBLE, A3, A4, CUSTOM1 and CUSTOM2 papersizes.
<<precisegrid>> .................................................................................................................... 287
Change settings for the precise dot grid.
<<rect>> ................................................................................................................................ 288
Change settings for a rectangle. The rectangle is defined using two points (X1,Y1) and (X2,Y2).
<<refscatsymbol>> ............................................................................................................... 289
Set the attributes for the reference scatter symbol.
<<renderconfig>> ................................................................................................................. 289
Set the attributes for OpenGL rendering.
<<rgb>> ................................................................................................................................. 291
Set a color value by assigning values to its red, green, and blue components.
<<shademap>>...................................................................................................................... 291
Map colors on the screen to shades of gray for monochrome hardcopy output.
<<symbolshape>> ................................................................................................................. 292
Set a symbol shape. Symbols can be a geometric shape (circle, square, and so forth) or an ASCIIcharacter.
60
<<textbox>>........................................................................................................................... 293
Change settings for the optional box around a text label.
<<textshape>> ....................................................................................................................... 294
Change settings related to text font and character height.
<<ticklabeldetail>> ............................................................................................................... 295
Change settings for the text used to label axis tick marks.
<<tickmarkdetail>> .............................................................................................................. 295
Assign attributes for axis tick marks.
<<volumeobjectstoplot>>..................................................................................................... 296
Specifies what volume objects are to be displayed.
<<xy>> ................................................................................................................................... 297
Change settings for an (X,Y) position.
<<xyz>> ................................................................................................................................. 297
Change settings for an (X, Y, Z) triplet.
<<zebrashade>> .................................................................................................................... 298
Change zebra shading attributes.
LOADPYFILE NAME ......................................................................................................... 337
Use this function to load a Python module via a macro file.
MODIFYPYPATH................................................................................................................ 338
Use this command to temporarily modify your PYTHONPATH variable. The variable will be setfor the duration of the Tecplot 360 session using the macro command/file.
61
Macro Command Summary
RUNPYFUNCTION............................................................................................................. 338
Use this command to execute a Python function via a macro file. NOTE: Before executing a Pythonfunction, you must first load the module that contains it via the LOADPYFILE NAME command.
62
Chapter 8 Macro Commands
This chapter lists Tecplot 360’s macro commands alphabetically. Items within double angle brack-ets (<< >>) represent parameter sub-commands that are listed and described in Chapter 10 “Param-eter Subcommands”.
A
$!ACTIVEFIELDMAPS
Syntax: $!ACTIVEFIELDMAPS <op> <set>[no parameters]
Description: A SetValue command that changes the set of active field maps (thus changing the active zones) considered for plotting.
Examples:
Example 1:
Make only field maps 1, 3, 4 and 5 active for plotting:
Example 2:
Add zones 33, 34, 35, and 36 to the set of active field maps:
$!ACTIVEFIELDMAPS = [1,3-5]
$!ACTIVEFIELDMAPS += [33-36]
63
$!ACTIVELINEMAPS
Example 3:
Remove zones 1, 2, 3, 9, 10 and 11 from the set of active field maps:
$!ACTIVELINEMAPS
Syntax: $!ACTIVELINEMAPS <op> <set>[no parameters]
Description: A SetValue command that changes the set of line-mappings considered for plotting.
Examples:
Example 1:
Make only line-mappings 1, 3, 4 and 5 active for plotting:
Example 2:
Add line-maps 33, 34, 35 and 36 to the set of active line-mappings:
Example 3:
Remove line-maps 1, 2, 3, 9, 10 and 11 from the set of active line-mappings:
$!ADDMACROPANELTITLE
Syntax: $!ADDMACROPANELTITLE <string>[no parameters]
Description: Add a title to the Quick Macro Panel.
Example::The following example adds the title “Bar Charts” to the Quick Macro Panel:$!ADDMACROPANELTITLE "Bar Charts"
$!ACTIVEFIELDMAPS -= [1-3,9-11]
$!ACTIVELINEMAPS = [1,3-5]
$!ACTIVELINEMAPS += [33-36]
$!ACTIVELINEMAPS -= [1-3,9-11]
64
$!ALTERDATA
$!ALTERDATA
Syntax: $!ALTERDATA [zonelist]EQUATION = <string>[optional parameters]
Description: The ALTERDATA function operates on a data set within Tecplot 360 using FORTRAN-like equations. See Section 20 - 1 “Data Alteration through Equations” in the User’s Manual for more information on using equations in Tecplot 360. The <zonelist> parameter specifies the set of zones on which to operate, where zonelist is a list of zones or zone ranges separated by a comma (“,”). Zone ranges are separated by a hyphen (“-”). If <zonelist> is omitted, all zones are affected. NOTE: the values for the <zonelist> parameter must be enclosed in square brackets (i.e. $!ALTERDATA [1,3] to apply ALTERDATA to zones 1 and 3).
65
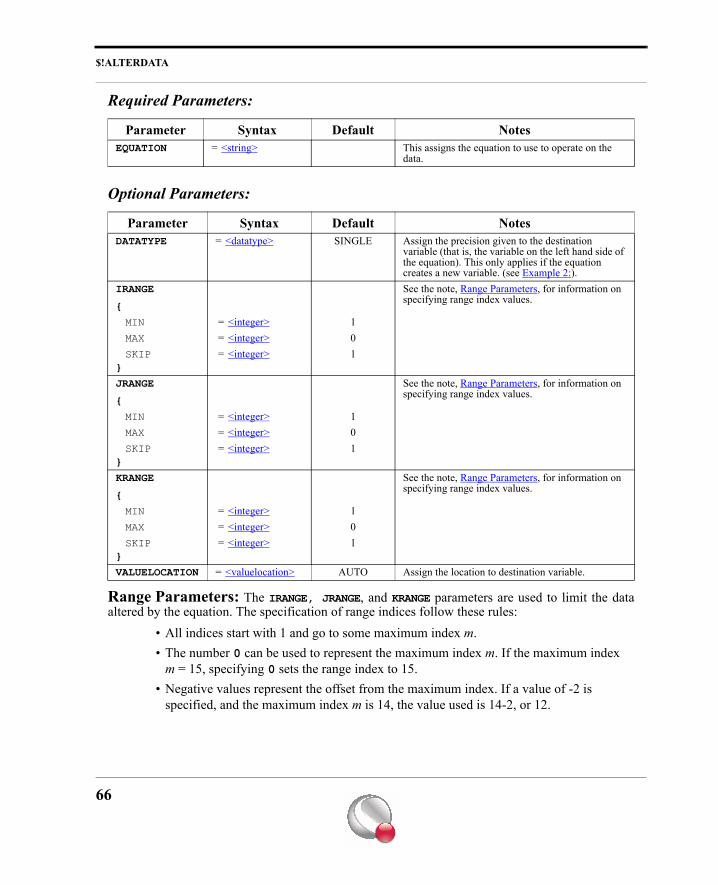
$!ALTERDATA
Required Parameters:
Optional Parameters:
Range Parameters: The IRANGE, JRANGE, and KRANGE parameters are used to limit the dataaltered by the equation. The specification of range indices follow these rules:
• All indices start with 1 and go to some maximum index m.• The number 0 can be used to represent the maximum index m. If the maximum index
m = 15, specifying 0 sets the range index to 15.• Negative values represent the offset from the maximum index. If a value of -2 is
specified, and the maximum index m is 14, the value used is 14-2, or 12.
Parameter Syntax Default NotesEQUATION = <string> This assigns the equation to use to operate on the
data.
Parameter Syntax Default NotesDATATYPE = <datatype> SINGLE Assign the precision given to the destination
variable (that is, the variable on the left hand side of the equation). This only applies if the equation creates a new variable. (see Example 2:).
IRANGE
{
See the note, Range Parameters, for information on specifying range index values.
MIN = <integer> 1MAX = <integer> 0SKIP
} = <integer> 1
JRANGE
{
See the note, Range Parameters, for information on specifying range index values.
MIN = <integer> 1MAX = <integer> 0SKIP
} = <integer> 1
KRANGE
{
See the note, Range Parameters, for information on specifying range index values.
MIN = <integer> 1MAX = <integer> 0SKIP
} = <integer> 1
VALUELOCATION = <valuelocation> AUTO Assign the location to destination variable.
66
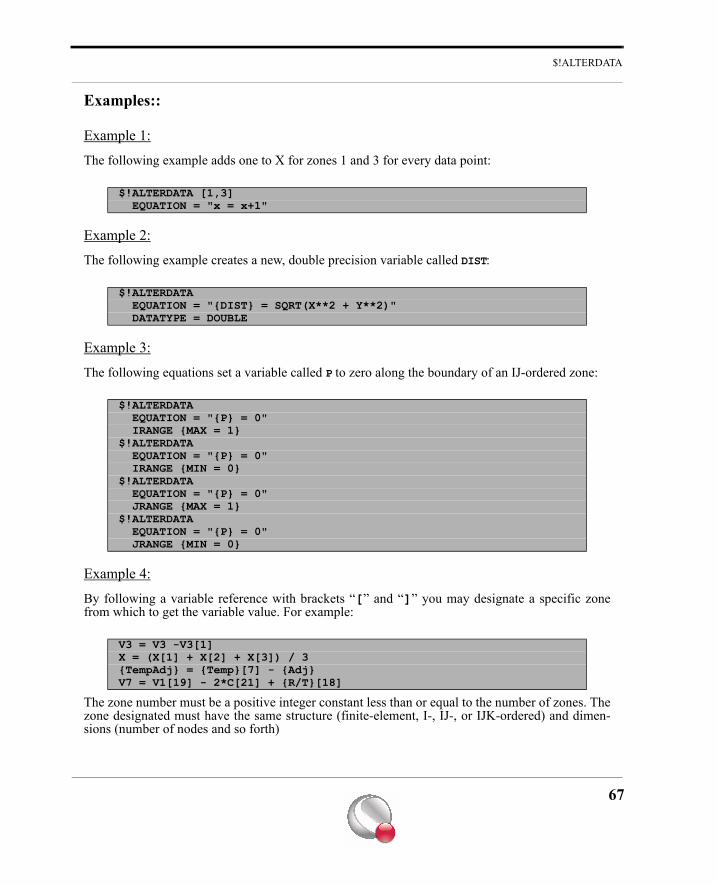
$!ALTERDATA
Examples::
Example 1:
The following example adds one to X for zones 1 and 3 for every data point:
Example 2:
The following example creates a new, double precision variable called DIST:
Example 3:
The following equations set a variable called P to zero along the boundary of an IJ-ordered zone:
Example 4:
By following a variable reference with brackets “[” and “]” you may designate a specific zonefrom which to get the variable value. For example:
The zone number must be a positive integer constant less than or equal to the number of zones. Thezone designated must have the same structure (finite-element, I-, IJ-, or IJK-ordered) and dimen-sions (number of nodes and so forth)
$!ALTERDATA [1,3] EQUATION = "x = x+1"
$!ALTERDATA EQUATION = "{DIST} = SQRT(X**2 + Y**2)" DATATYPE = DOUBLE
$!ALTERDATA EQUATION = "{P} = 0" IRANGE {MAX = 1}$!ALTERDATA EQUATION = "{P} = 0" IRANGE {MIN = 0}$!ALTERDATA EQUATION = "{P} = 0" JRANGE {MAX = 1}$!ALTERDATA EQUATION = "{P} = 0" JRANGE {MIN = 0}
V3 = V3 -V3[1]X = (X[1] + X[2] + X[3]) / 3{TempAdj} = {Temp}[7] - {Adj}V7 = V1[19] - 2*C[21] + {R/T}[18]
67
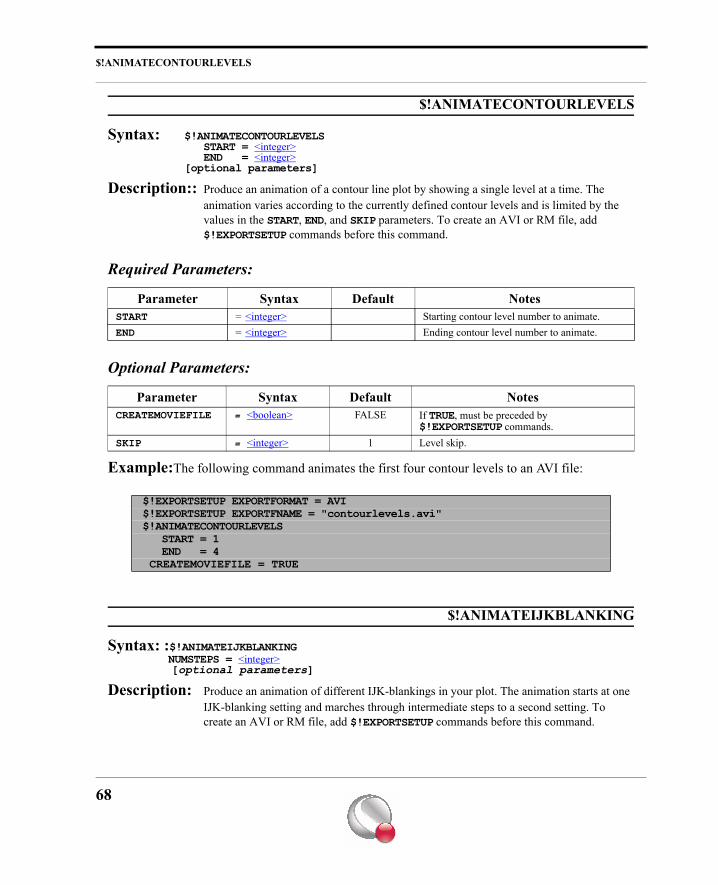
$!ANIMATECONTOURLEVELS
$!ANIMATECONTOURLEVELS
Syntax: $!ANIMATECONTOURLEVELSSTART = <integer>END = <integer>
[optional parameters]
Description:: Produce an animation of a contour line plot by showing a single level at a time. The animation varies according to the currently defined contour levels and is limited by the values in the START, END, and SKIP parameters. To create an AVI or RM file, add $!EXPORTSETUP commands before this command.
Required Parameters:
Optional Parameters:
Example:The following command animates the first four contour levels to an AVI file:
$!ANIMATEIJKBLANKING
Syntax: :$!ANIMATEIJKBLANKING NUMSTEPS = <integer> [optional parameters]
Description: Produce an animation of different IJK-blankings in your plot. The animation starts at one IJK-blanking setting and marches through intermediate steps to a second setting. To create an AVI or RM file, add $!EXPORTSETUP commands before this command.
Parameter Syntax Default NotesSTART = <integer> Starting contour level number to animate.END = <integer> Ending contour level number to animate.
Parameter Syntax Default NotesCREATEMOVIEFILE = <boolean> FALSE If TRUE, must be preceded by
$!EXPORTSETUP commands.SKIP = <integer> 1 Level skip.
$!EXPORTSETUP EXPORTFORMAT = AVI$!EXPORTSETUP EXPORTFNAME = "contourlevels.avi"$!ANIMATECONTOURLEVELS START = 1 END = 4 CREATEMOVIEFILE = TRUE
68
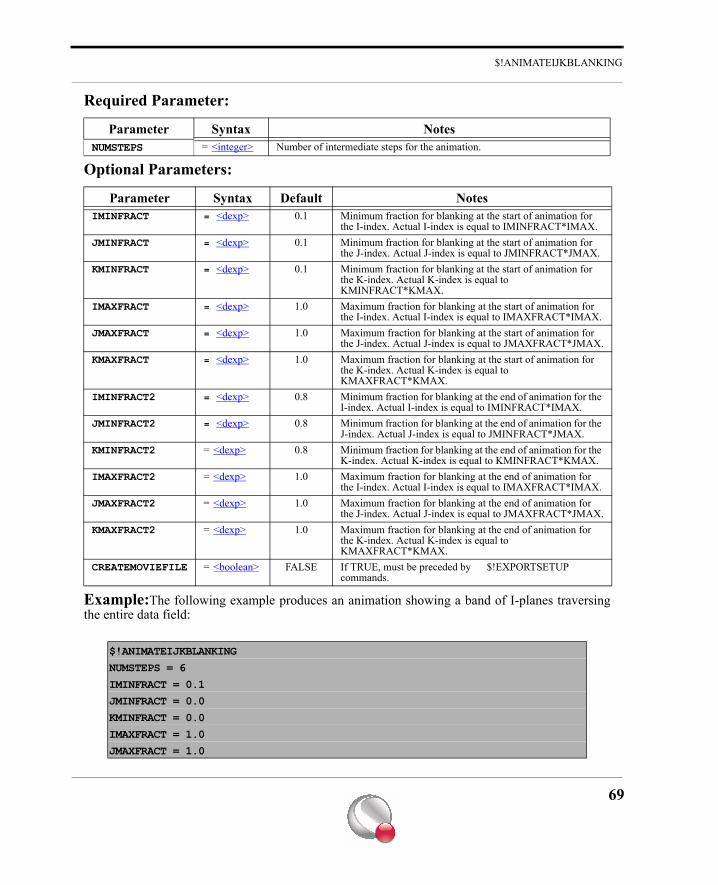
$!ANIMATEIJKBLANKING
Required Parameter:
Optional Parameters:
Example:The following example produces an animation showing a band of I-planes traversingthe entire data field:
Parameter Syntax NotesNUMSTEPS = <integer> Number of intermediate steps for the animation.
Parameter Syntax Default NotesIMINFRACT = <dexp> 0.1 Minimum fraction for blanking at the start of animation for
the I-index. Actual I-index is equal to IMINFRACT*IMAX.JMINFRACT = <dexp> 0.1 Minimum fraction for blanking at the start of animation for
the J-index. Actual J-index is equal to JMINFRACT*JMAX.KMINFRACT = <dexp> 0.1 Minimum fraction for blanking at the start of animation for
the K-index. Actual K-index is equal to KMINFRACT*KMAX.
IMAXFRACT = <dexp> 1.0 Maximum fraction for blanking at the start of animation for the I-index. Actual I-index is equal to IMAXFRACT*IMAX.
JMAXFRACT = <dexp> 1.0 Maximum fraction for blanking at the start of animation for the J-index. Actual J-index is equal to JMAXFRACT*JMAX.
KMAXFRACT = <dexp> 1.0 Maximum fraction for blanking at the start of animation for the K-index. Actual K-index is equal to KMAXFRACT*KMAX.
IMINFRACT2 = <dexp> 0.8 Minimum fraction for blanking at the end of animation for the I-index. Actual I-index is equal to IMINFRACT*IMAX.
JMINFRACT2 = <dexp> 0.8 Minimum fraction for blanking at the end of animation for the J-index. Actual J-index is equal to JMINFRACT*JMAX.
KMINFRACT2 = <dexp> 0.8 Minimum fraction for blanking at the end of animation for the K-index. Actual K-index is equal to KMINFRACT*KMAX.
IMAXFRACT2 = <dexp> 1.0 Maximum fraction for blanking at the end of animation for the I-index. Actual I-index is equal to IMAXFRACT*IMAX.
JMAXFRACT2 = <dexp> 1.0 Maximum fraction for blanking at the end of animation for the J-index. Actual J-index is equal to JMAXFRACT*JMAX.
KMAXFRACT2 = <dexp> 1.0 Maximum fraction for blanking at the end of animation for the K-index. Actual K-index is equal to KMAXFRACT*KMAX.
CREATEMOVIEFILE = <boolean> FALSE If TRUE, must be preceded by $!EXPORTSETUP commands.
$!ANIMATEIJKBLANKINGNUMSTEPS = 6IMINFRACT = 0.1JMINFRACT = 0.0KMINFRACT = 0.0IMAXFRACT = 1.0JMAXFRACT = 1.0
69
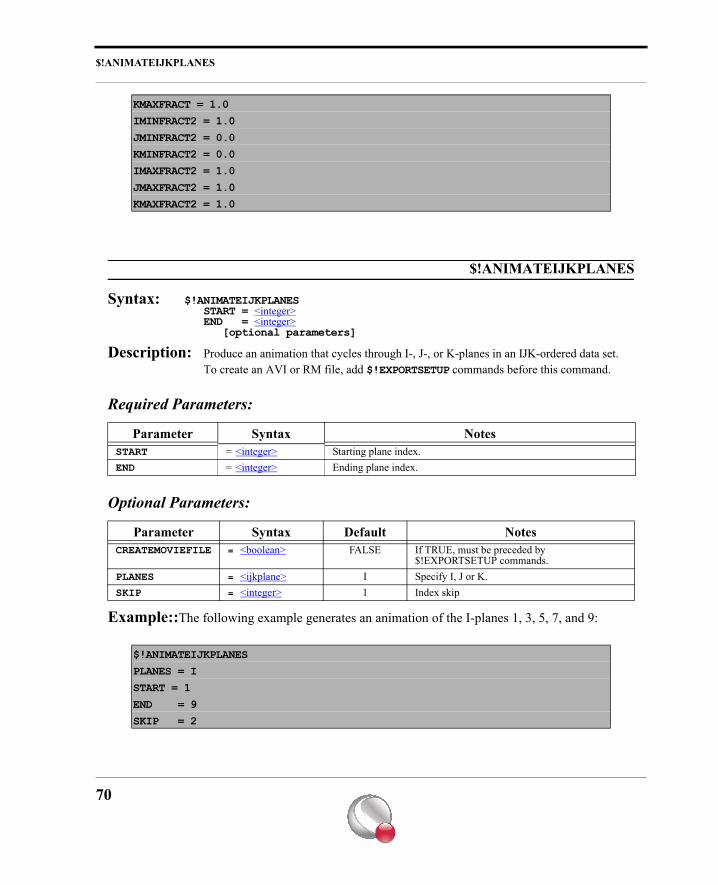
$!ANIMATEIJKPLANES
$!ANIMATEIJKPLANES
Syntax: $!ANIMATEIJKPLANESSTART = <integer>END = <integer>
[optional parameters]
Description: Produce an animation that cycles through I-, J-, or K-planes in an IJK-ordered data set. To create an AVI or RM file, add $!EXPORTSETUP commands before this command.
Required Parameters:
Optional Parameters:
Example::The following example generates an animation of the I-planes 1, 3, 5, 7, and 9:
KMAXFRACT = 1.0IMINFRACT2 = 1.0JMINFRACT2 = 0.0KMINFRACT2 = 0.0IMAXFRACT2 = 1.0JMAXFRACT2 = 1.0KMAXFRACT2 = 1.0
Parameter Syntax NotesSTART = <integer> Starting plane index.END = <integer> Ending plane index.
Parameter Syntax Default NotesCREATEMOVIEFILE = <boolean> FALSE If TRUE, must be preceded by
$!EXPORTSETUP commands.PLANES = <ijkplane> I Specify I, J or K.SKIP = <integer> 1 Index skip
$!ANIMATEIJKPLANESPLANES = ISTART = 1END = 9SKIP = 2
70
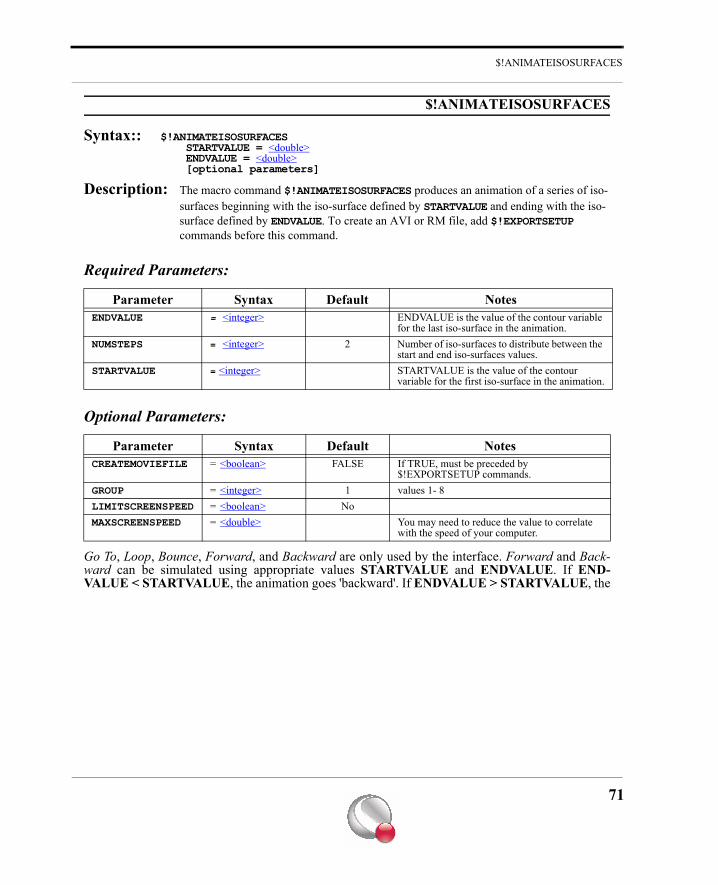
$!ANIMATEISOSURFACES
$!ANIMATEISOSURFACES
Syntax:: $!ANIMATEISOSURFACES STARTVALUE = <double> ENDVALUE = <double> [optional parameters]
Description: The macro command $!ANIMATEISOSURFACES produces an animation of a series of iso-surfaces beginning with the iso-surface defined by STARTVALUE and ending with the iso-surface defined by ENDVALUE. To create an AVI or RM file, add $!EXPORTSETUP commands before this command.
Required Parameters:
Optional Parameters:
Go To, Loop, Bounce, Forward, and Backward are only used by the interface. Forward and Back-ward can be simulated using appropriate values STARTVALUE and ENDVALUE. If END-VALUE < STARTVALUE, the animation goes 'backward'. If ENDVALUE > STARTVALUE, the
Parameter Syntax Default NotesENDVALUE = <integer> ENDVALUE is the value of the contour variable
for the last iso-surface in the animation.NUMSTEPS = <integer> 2 Number of iso-surfaces to distribute between the
start and end iso-surfaces values.STARTVALUE = <integer> STARTVALUE is the value of the contour
variable for the first iso-surface in the animation.
Parameter Syntax Default NotesCREATEMOVIEFILE = <boolean> FALSE If TRUE, must be preceded by
$!EXPORTSETUP commands.GROUP = <integer> 1 values 1- 8LIMITSCREENSPEED = <boolean> NoMAXSCREENSPEED = <double> You may need to reduce the value to correlate
with the speed of your computer.
71
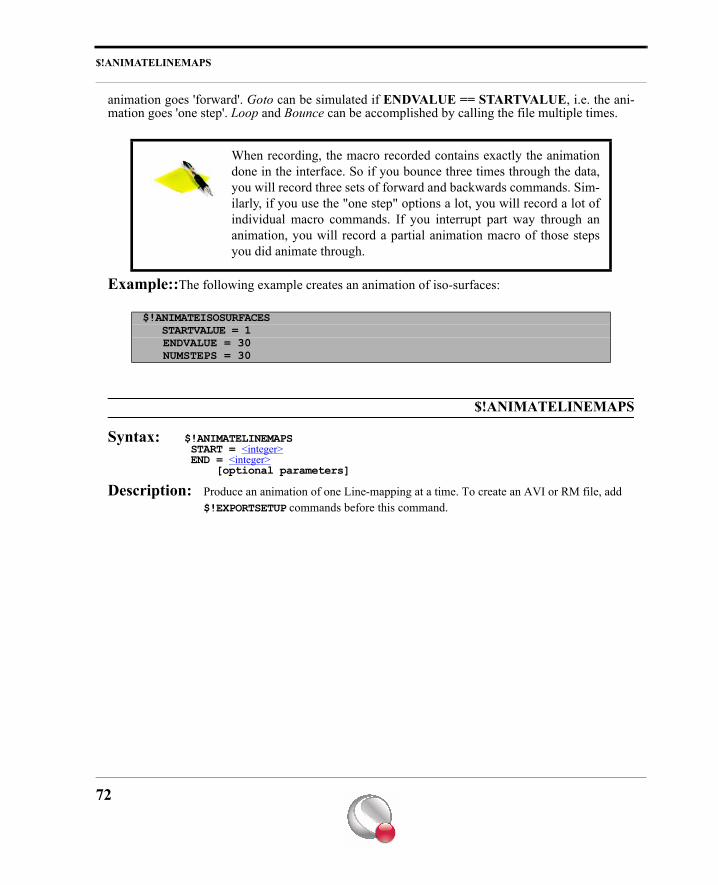
$!ANIMATELINEMAPS
animation goes 'forward'. Goto can be simulated if ENDVALUE == STARTVALUE, i.e. the ani-mation goes 'one step'. Loop and Bounce can be accomplished by calling the file multiple times.
Example::The following example creates an animation of iso-surfaces:
$!ANIMATELINEMAPS
Syntax: $!ANIMATELINEMAPS START = <integer> END = <integer> [optional parameters]
Description: Produce an animation of one Line-mapping at a time. To create an AVI or RM file, add $!EXPORTSETUP commands before this command.
When recording, the macro recorded contains exactly the animationdone in the interface. So if you bounce three times through the data,you will record three sets of forward and backwards commands. Sim-ilarly, if you use the "one step" options a lot, you will record a lot ofindividual macro commands. If you interrupt part way through ananimation, you will record a partial animation macro of those stepsyou did animate through.
$!ANIMATEISOSURFACES STARTVALUE = 1 ENDVALUE = 30 NUMSTEPS = 30
72
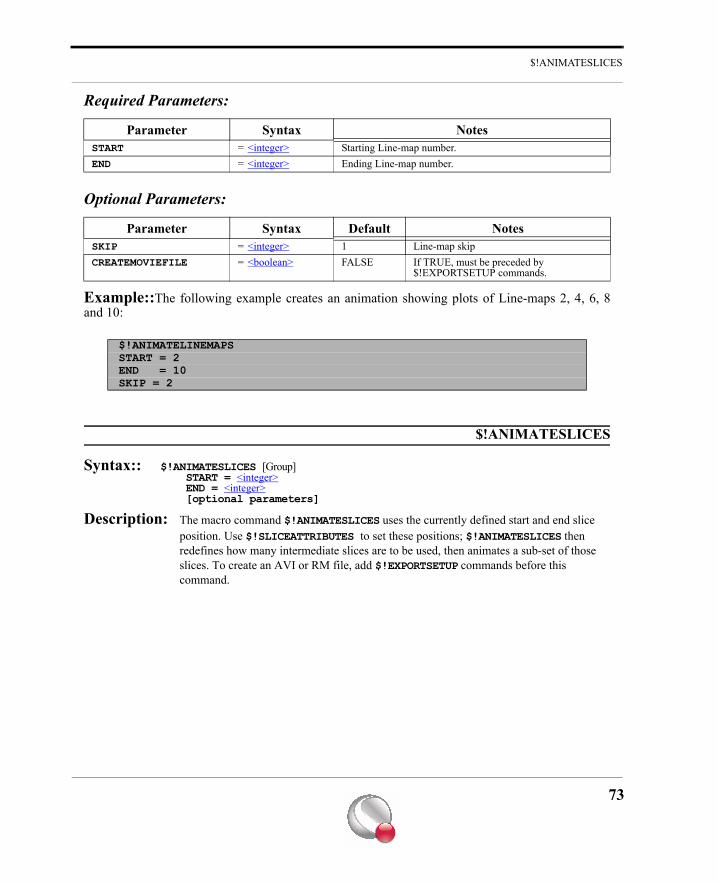
$!ANIMATESLICES
Required Parameters:
Optional Parameters:
Example::The following example creates an animation showing plots of Line-maps 2, 4, 6, 8and 10:
$!ANIMATESLICES
Syntax:: $!ANIMATESLICES [Group] START = <integer> END = <integer> [optional parameters]
Description: The macro command $!ANIMATESLICES uses the currently defined start and end slice position. Use $!SLICEATTRIBUTES to set these positions; $!ANIMATESLICES then redefines how many intermediate slices are to be used, then animates a sub-set of those slices. To create an AVI or RM file, add $!EXPORTSETUP commands before this command.
Parameter Syntax NotesSTART = <integer> Starting Line-map number.END = <integer> Ending Line-map number.
Parameter Syntax Default NotesSKIP = <integer> 1 Line-map skipCREATEMOVIEFILE = <boolean> FALSE If TRUE, must be preceded by
$!EXPORTSETUP commands.
$!ANIMATELINEMAPSSTART = 2END = 10SKIP = 2
73
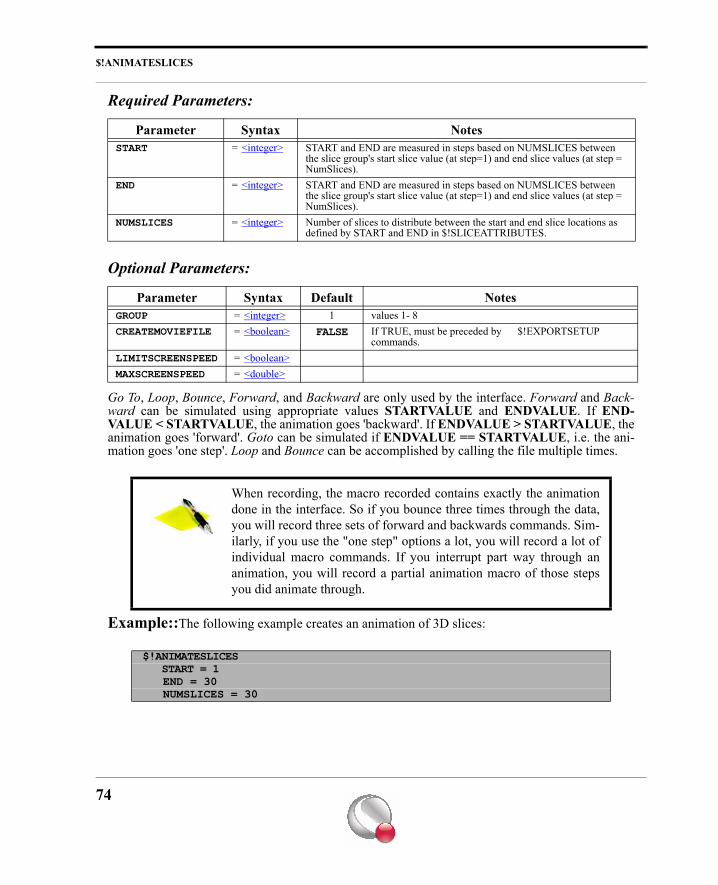
$!ANIMATESLICES
Required Parameters:
Optional Parameters:
Go To, Loop, Bounce, Forward, and Backward are only used by the interface. Forward and Back-ward can be simulated using appropriate values STARTVALUE and ENDVALUE. If END-VALUE < STARTVALUE, the animation goes 'backward'. If ENDVALUE > STARTVALUE, theanimation goes 'forward'. Goto can be simulated if ENDVALUE == STARTVALUE, i.e. the ani-mation goes 'one step'. Loop and Bounce can be accomplished by calling the file multiple times.
Example::The following example creates an animation of 3D slices:
Parameter Syntax NotesSTART = <integer> START and END are measured in steps based on NUMSLICES between
the slice group's start slice value (at step=1) and end slice values (at step = NumSlices).
END = <integer> START and END are measured in steps based on NUMSLICES between the slice group's start slice value (at step=1) and end slice values (at step = NumSlices).
NUMSLICES = <integer> Number of slices to distribute between the start and end slice locations as defined by START and END in $!SLICEATTRIBUTES.
Parameter Syntax Default NotesGROUP = <integer> 1 values 1- 8CREATEMOVIEFILE = <boolean> FALSE If TRUE, must be preceded by $!EXPORTSETUP
commands.LIMITSCREENSPEED = <boolean>MAXSCREENSPEED = <double>
When recording, the macro recorded contains exactly the animationdone in the interface. So if you bounce three times through the data,you will record three sets of forward and backwards commands. Sim-ilarly, if you use the "one step" options a lot, you will record a lot ofindividual macro commands. If you interrupt part way through ananimation, you will record a partial animation macro of those stepsyou did animate through.
$!ANIMATESLICES START = 1 END = 30 NUMSLICES = 30
74
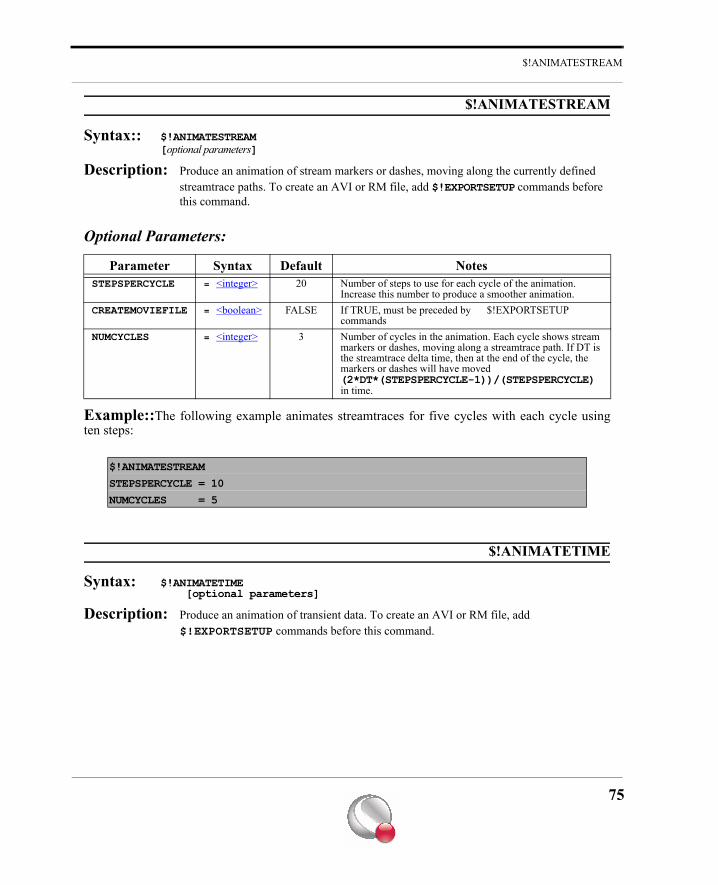
$!ANIMATESTREAM
$!ANIMATESTREAM
Syntax:: $!ANIMATESTREAM[optional parameters]
Description: Produce an animation of stream markers or dashes, moving along the currently defined streamtrace paths. To create an AVI or RM file, add $!EXPORTSETUP commands before this command.
Optional Parameters:
Example::The following example animates streamtraces for five cycles with each cycle usingten steps:
$!ANIMATETIME
Syntax: $!ANIMATETIME [optional parameters]
Description: Produce an animation of transient data. To create an AVI or RM file, add $!EXPORTSETUP commands before this command.
Parameter Syntax Default NotesSTEPSPERCYCLE = <integer> 20 Number of steps to use for each cycle of the animation.
Increase this number to produce a smoother animation.CREATEMOVIEFILE = <boolean> FALSE If TRUE, must be preceded by $!EXPORTSETUP
commandsNUMCYCLES = <integer> 3 Number of cycles in the animation. Each cycle shows stream
markers or dashes, moving along a streamtrace path. If DT is the streamtrace delta time, then at the end of the cycle, the markers or dashes will have moved (2*DT*(STEPSPERCYCLE-1))/(STEPSPERCYCLE) in time.
$!ANIMATESTREAMSTEPSPERCYCLE = 10NUMCYCLES = 5
75
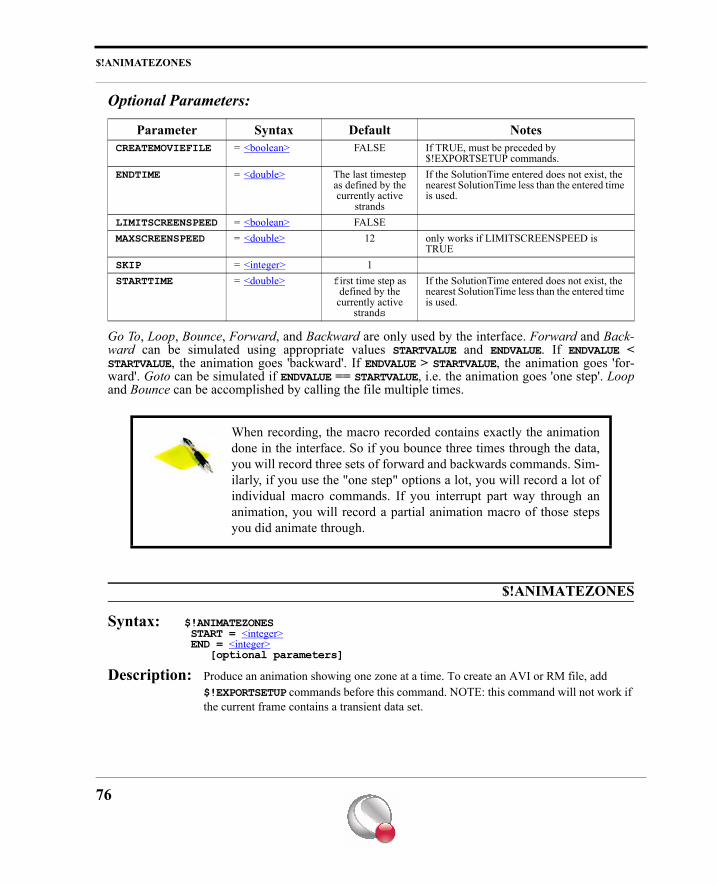
$!ANIMATEZONES
Optional Parameters:
Go To, Loop, Bounce, Forward, and Backward are only used by the interface. Forward and Back-ward can be simulated using appropriate values STARTVALUE and ENDVALUE. If ENDVALUE <STARTVALUE, the animation goes 'backward'. If ENDVALUE > STARTVALUE, the animation goes 'for-ward'. Goto can be simulated if ENDVALUE == STARTVALUE, i.e. the animation goes 'one step'. Loopand Bounce can be accomplished by calling the file multiple times.
$!ANIMATEZONES
Syntax: $!ANIMATEZONES START = <integer> END = <integer> [optional parameters]
Description: Produce an animation showing one zone at a time. To create an AVI or RM file, add $!EXPORTSETUP commands before this command. NOTE: this command will not work if the current frame contains a transient data set.
Parameter Syntax Default NotesCREATEMOVIEFILE = <boolean> FALSE If TRUE, must be preceded by
$!EXPORTSETUP commands.ENDTIME = <double> The last timestep
as defined by the currently active
strands
If the SolutionTime entered does not exist, the nearest SolutionTime less than the entered time is used.
LIMITSCREENSPEED = <boolean> FALSEMAXSCREENSPEED = <double> 12 only works if LIMITSCREENSPEED is
TRUESKIP = <integer> 1STARTTIME = <double> first time step as
defined by the currently active
strands
If the SolutionTime entered does not exist, the nearest SolutionTime less than the entered time is used.
When recording, the macro recorded contains exactly the animationdone in the interface. So if you bounce three times through the data,you will record three sets of forward and backwards commands. Sim-ilarly, if you use the "one step" options a lot, you will record a lot ofindividual macro commands. If you interrupt part way through ananimation, you will record a partial animation macro of those stepsyou did animate through.
76
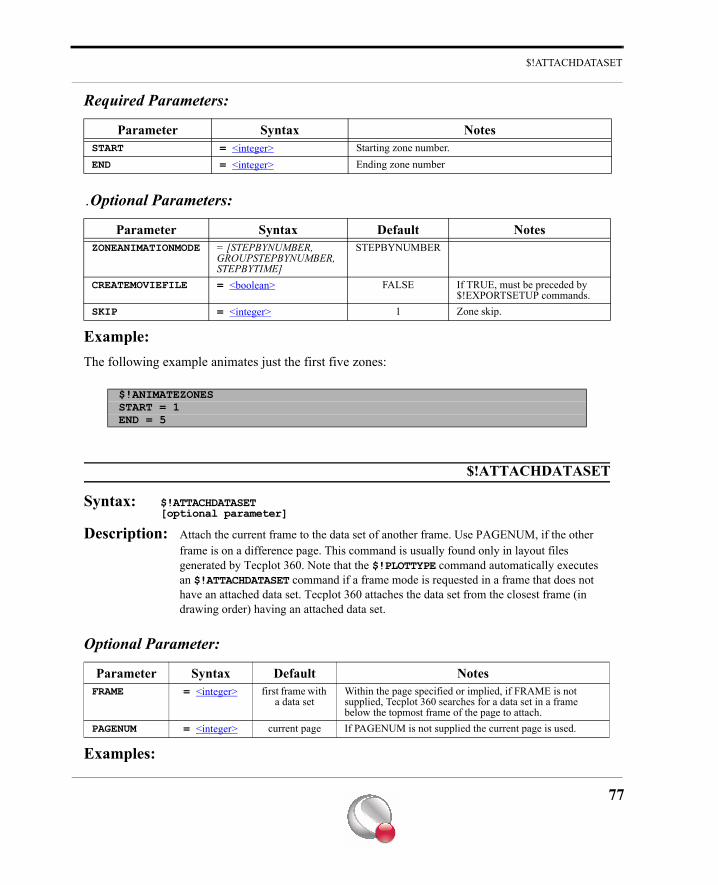
$!ATTACHDATASET
Required Parameters:
.Optional Parameters:
Example:The following example animates just the first five zones:
$!ATTACHDATASET
Syntax: $!ATTACHDATASET[optional parameter]
Description: Attach the current frame to the data set of another frame. Use PAGENUM, if the other frame is on a difference page. This command is usually found only in layout files generated by Tecplot 360. Note that the $!PLOTTYPE command automatically executes an $!ATTACHDATASET command if a frame mode is requested in a frame that does not have an attached data set. Tecplot 360 attaches the data set from the closest frame (in drawing order) having an attached data set.
Optional Parameter:
Examples:
Parameter Syntax NotesSTART = <integer> Starting zone number.END = <integer> Ending zone number
Parameter Syntax Default NotesZONEANIMATIONMODE = [STEPBYNUMBER,
GROUPSTEPBYNUMBER, STEPBYTIME]
STEPBYNUMBER
CREATEMOVIEFILE = <boolean> FALSE If TRUE, must be preceded by $!EXPORTSETUP commands.
SKIP = <integer> 1 Zone skip.
$!ANIMATEZONESSTART = 1END = 5
Parameter Syntax Default NotesFRAME = <integer> first frame with
a data setWithin the page specified or implied, if FRAME is not supplied, Tecplot 360 searches for a data set in a frame below the topmost frame of the page to attach.
PAGENUM = <integer> current page If PAGENUM is not supplied the current page is used.
77
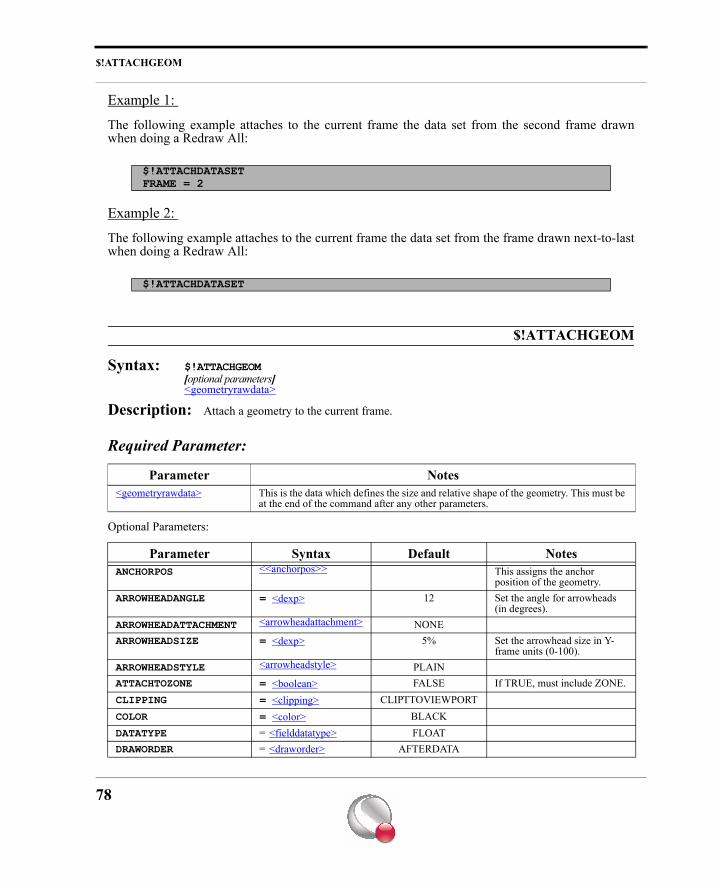
$!ATTACHGEOM
Example 1:
The following example attaches to the current frame the data set from the second frame drawnwhen doing a Redraw All:
Example 2:
The following example attaches to the current frame the data set from the frame drawn next-to-lastwhen doing a Redraw All:
$!ATTACHGEOM
Syntax: $!ATTACHGEOM[optional parameters]<geometryrawdata>
Description: Attach a geometry to the current frame.
Required Parameter:
Optional Parameters:
$!ATTACHDATASETFRAME = 2
$!ATTACHDATASET
Parameter Notes<geometryrawdata> This is the data which defines the size and relative shape of the geometry. This must be
at the end of the command after any other parameters.
Parameter Syntax Default NotesANCHORPOS <<anchorpos>> This assigns the anchor
position of the geometry.ARROWHEADANGLE = <dexp> 12 Set the angle for arrowheads
(in degrees).ARROWHEADATTACHMENT <arrowheadattachment> NONEARROWHEADSIZE = <dexp> 5% Set the arrowhead size in Y-
frame units (0-100).ARROWHEADSTYLE <arrowheadstyle> PLAINATTACHTOZONE = <boolean> FALSE If TRUE, must include ZONE.CLIPPING = <clipping> CLIPTTOVIEWPORTCOLOR = <color> BLACKDATATYPE = <fielddatatype> FLOATDRAWORDER = <draworder> AFTERDATA
78
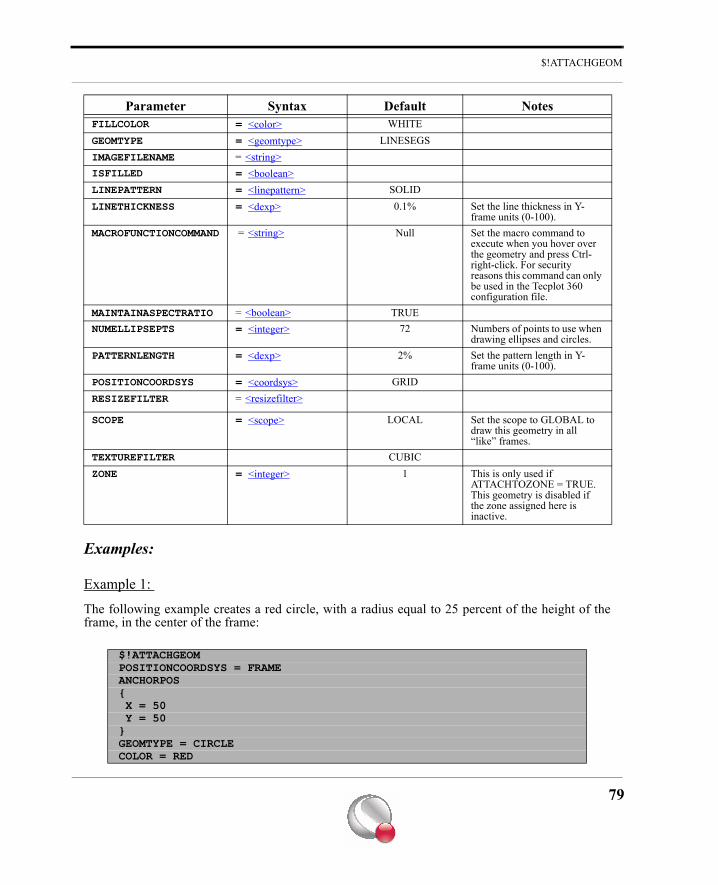
$!ATTACHGEOM
Examples:
Example 1:
The following example creates a red circle, with a radius equal to 25 percent of the height of theframe, in the center of the frame:
FILLCOLOR = <color> WHITEGEOMTYPE = <geomtype> LINESEGSIMAGEFILENAME = <string>ISFILLED = <boolean>LINEPATTERN = <linepattern> SOLIDLINETHICKNESS = <dexp> 0.1% Set the line thickness in Y-
frame units (0-100).MACROFUNCTIONCOMMAND = <string> Null Set the macro command to
execute when you hover over the geometry and press Ctrl-right-click. For security reasons this command can only be used in the Tecplot 360 configuration file.
MAINTAINASPECTRATIO = <boolean> TRUENUMELLIPSEPTS = <integer> 72 Numbers of points to use when
drawing ellipses and circles.PATTERNLENGTH = <dexp> 2% Set the pattern length in Y-
frame units (0-100).POSITIONCOORDSYS = <coordsys> GRIDRESIZEFILTER = <resizefilter>
SCOPE = <scope> LOCAL Set the scope to GLOBAL to draw this geometry in all “like” frames.
TEXTUREFILTER CUBICZONE = <integer> 1 This is only used if
ATTACHTOZONE = TRUE. This geometry is disabled if the zone assigned here is inactive.
$!ATTACHGEOM POSITIONCOORDSYS = FRAMEANCHORPOS{ X = 50 Y = 50}GEOMTYPE = CIRCLECOLOR = RED
Parameter Syntax Default Notes
79
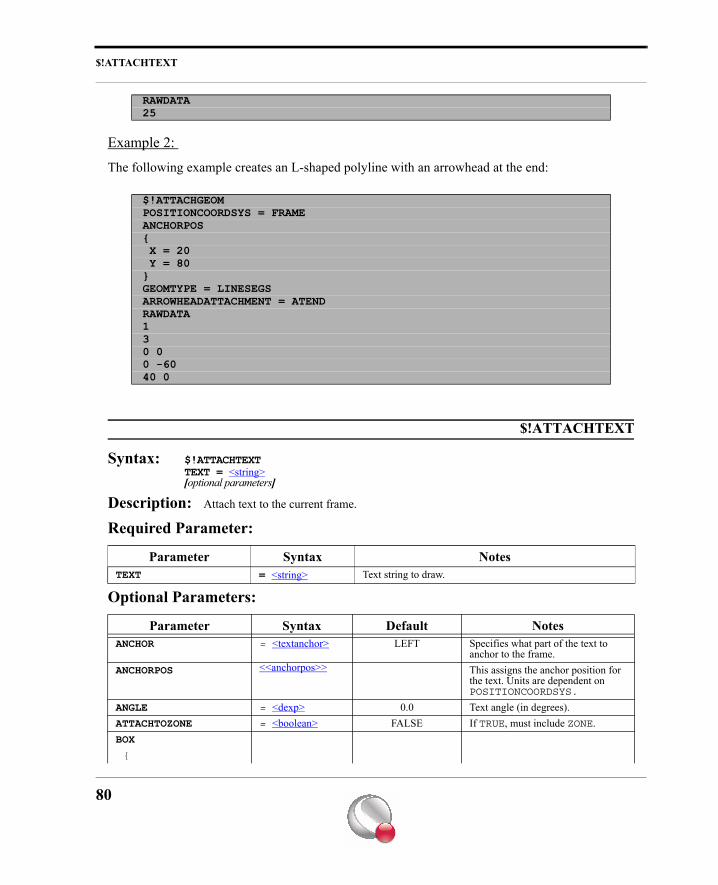
$!ATTACHTEXT
Example 2:
The following example creates an L-shaped polyline with an arrowhead at the end:
$!ATTACHTEXT
Syntax: $!ATTACHTEXTTEXT = <string>[optional parameters]
Description: Attach text to the current frame.
Required Parameter:
Optional Parameters:
RAWDATA 25
$!ATTACHGEOMPOSITIONCOORDSYS = FRAMEANCHORPOS{ X = 20 Y = 80}GEOMTYPE = LINESEGSARROWHEADATTACHMENT = ATENDRAWDATA130 00 -6040 0
Parameter Syntax NotesTEXT = <string> Text string to draw.
Parameter Syntax Default NotesANCHOR = <textanchor> LEFT Specifies what part of the text to
anchor to the frame.ANCHORPOS <<anchorpos>> This assigns the anchor position for
the text. Units are dependent on POSITIONCOORDSYS.
ANGLE = <dexp> 0.0 Text angle (in degrees).ATTACHTOZONE = <boolean> FALSE If TRUE, must include ZONE.BOX
{
80
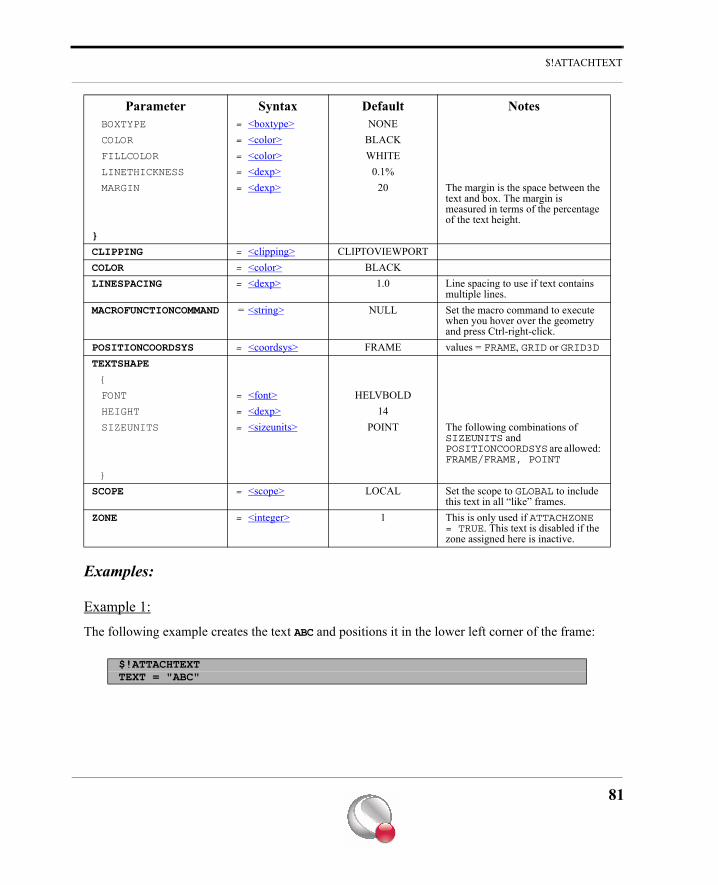
$!ATTACHTEXT
Examples:
Example 1:
The following example creates the text ABC and positions it in the lower left corner of the frame:
BOXTYPE = <boxtype> NONECOLOR = <color> BLACKFILLCOLOR = <color> WHITELINETHICKNESS = <dexp> 0.1%MARGIN = <dexp> 20 The margin is the space between the
text and box. The margin is measured in terms of the percentage of the text height.
}
CLIPPING = <clipping> CLIPTOVIEWPORTCOLOR = <color> BLACKLINESPACING = <dexp> 1.0 Line spacing to use if text contains
multiple lines.MACROFUNCTIONCOMMAND = <string> NULL Set the macro command to execute
when you hover over the geometry and press Ctrl-right-click.
POSITIONCOORDSYS = <coordsys> FRAME values = FRAME, GRID or GRID3DTEXTSHAPE
{
FONT = <font> HELVBOLDHEIGHT = <dexp> 14SIZEUNITS = <sizeunits> POINT The following combinations of
SIZEUNITS and POSITIONCOORDSYS are allowed: FRAME/FRAME, POINT
}
SCOPE = <scope> LOCAL Set the scope to GLOBAL to include this text in all “like” frames.
ZONE = <integer> 1 This is only used if ATTACHZONE = TRUE. This text is disabled if the zone assigned here is inactive.
$!ATTACHTEXT TEXT = "ABC"
Parameter Syntax Default Notes
81
$!BASICCOLOR
Example 2:
The following example creates the text TEXT AT AN ANGLE and places it in the center of theframe. The text is drawn at an angle of 45 degrees:
Example 3:
The following example creates the text TIMES-ROMAN using the Times Roman font. This textincludes a text box:
B
$!BASICCOLOR
Syntax: $!BASICCOLOR
[optional parameters]
Description: A SetValue command that sets the red, green and blue components for any of the basic colors in Tecplot 360.
$!ATTACHTEXTTEXT = "TEXT AT AN ANGLE"ANGLE = 45ANCHORPOS {X=50 Y=50}
$!ATTACHTEXT TEXT = "TIMES-ROMAN"FONT = TIMESBOX{ BOXTYPE = PLAIN MARGIN = 20}ANCHORPOS {X=20 Y=20}
82
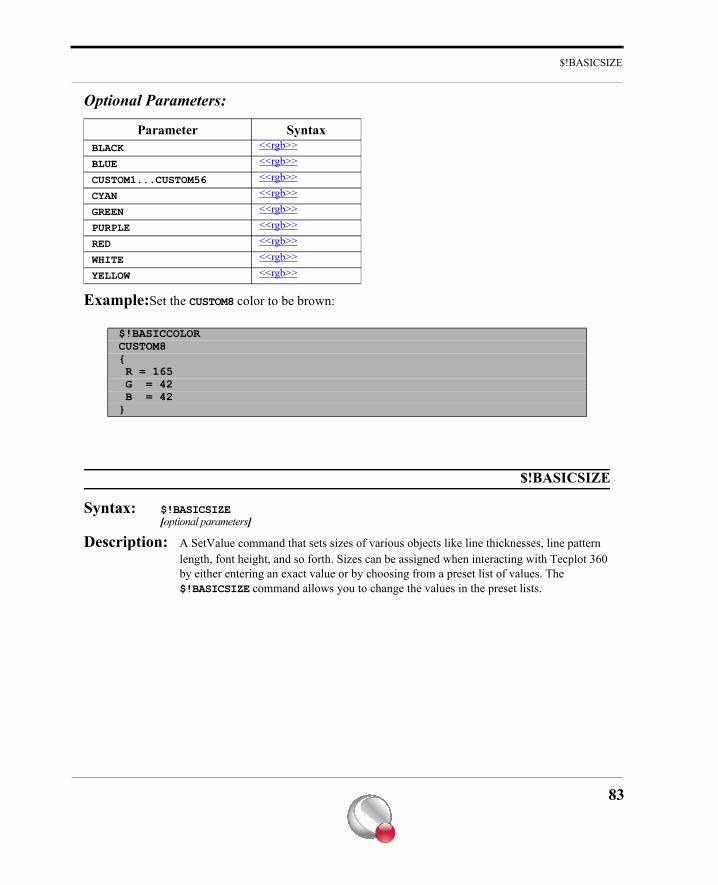
$!BASICSIZE
Optional Parameters:
Example:Set the CUSTOM8 color to be brown:
$!BASICSIZE
Syntax: $!BASICSIZE[optional parameters]
Description: A SetValue command that sets sizes of various objects like line thicknesses, line pattern length, font height, and so forth. Sizes can be assigned when interacting with Tecplot 360 by either entering an exact value or by choosing from a preset list of values. The $!BASICSIZE command allows you to change the values in the preset lists.
Parameter SyntaxBLACK <<rgb>>
BLUE <<rgb>>
CUSTOM1...CUSTOM56 <<rgb>>
CYAN <<rgb>>
GREEN <<rgb>>
PURPLE <<rgb>>
RED <<rgb>>
WHITE <<rgb>>
YELLOW <<rgb>>
$!BASICCOLORCUSTOM8{ R = 165 G = 42 B = 42}
83
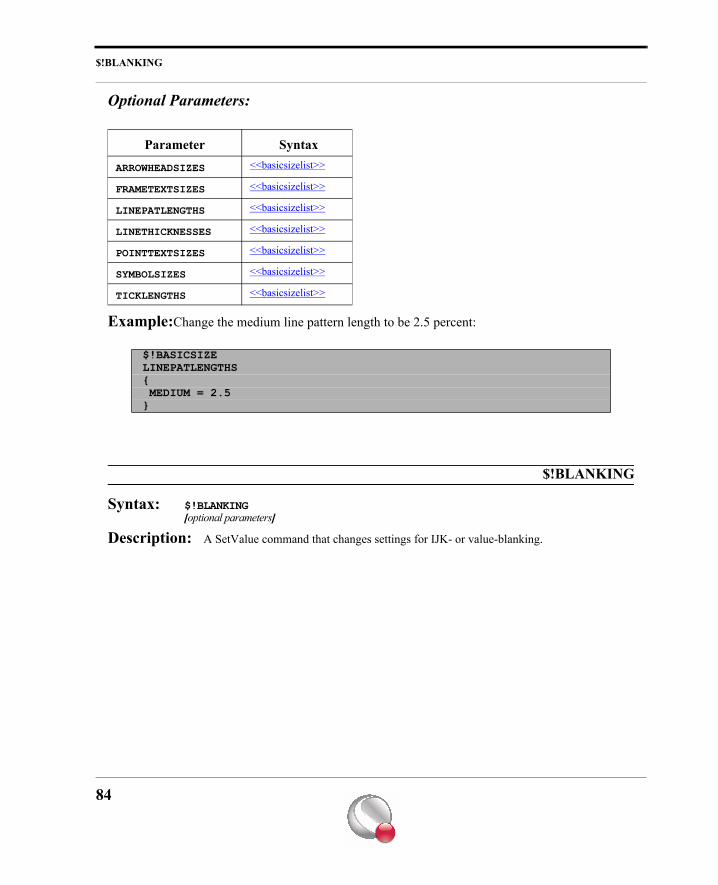
$!BLANKING
Optional Parameters:
Example:Change the medium line pattern length to be 2.5 percent:
$!BLANKING
Syntax: $!BLANKING[optional parameters]
Description: A SetValue command that changes settings for IJK- or value-blanking.
Parameter Syntax
ARROWHEADSIZES <<basicsizelist>>
FRAMETEXTSIZES <<basicsizelist>>
LINEPATLENGTHS <<basicsizelist>>
LINETHICKNESSES <<basicsizelist>>
POINTTEXTSIZES <<basicsizelist>>
SYMBOLSIZES <<basicsizelist>>
TICKLENGTHS <<basicsizelist>>
$!BASICSIZELINEPATLENGTHS{ MEDIUM = 2.5}
84
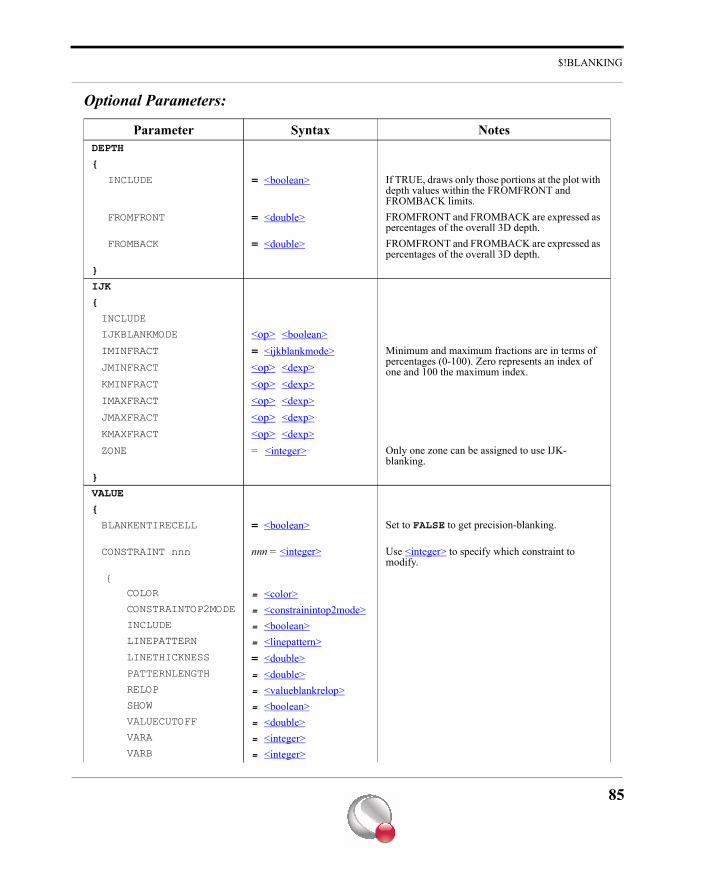
$!BLANKING
Optional Parameters:
Parameter Syntax NotesDEPTH
{
INCLUDE = <boolean> If TRUE, draws only those portions at the plot with depth values within the FROMFRONT and FROMBACK limits.
FROMFRONT = <double> FROMFRONT and FROMBACK are expressed as percentages of the overall 3D depth.
FROMBACK = <double> FROMFRONT and FROMBACK are expressed as percentages of the overall 3D depth.
}
IJK
{
INCLUDE
IJKBLANKMODE <op> <boolean>IMINFRACT = <ijkblankmode> Minimum and maximum fractions are in terms of
percentages (0-100). Zero represents an index of one and 100 the maximum index.JMINFRACT <op> <dexp>
KMINFRACT <op> <dexp>IMAXFRACT <op> <dexp>JMAXFRACT <op> <dexp>KMAXFRACT <op> <dexp>ZONE = <integer> Only one zone can be assigned to use IJK-
blanking.}
VALUE
{
BLANKENTIRECELL = <boolean> Set to FALSE to get precision-blanking.
CONSTRAINT nnn nnn = <integer> Use <integer> to specify which constraint to modify.
{ COLOR = <color> CONSTRAINTOP2MODE = <constrainintop2mode> INCLUDE = <boolean> LINEPATTERN = <linepattern> LINETHICKNESS = <double> PATTERNLENGTH = <double> RELOP = <valueblankrelop> SHOW = <boolean> VALUECUTOFF = <double> VARA = <integer> VARB = <integer>
85
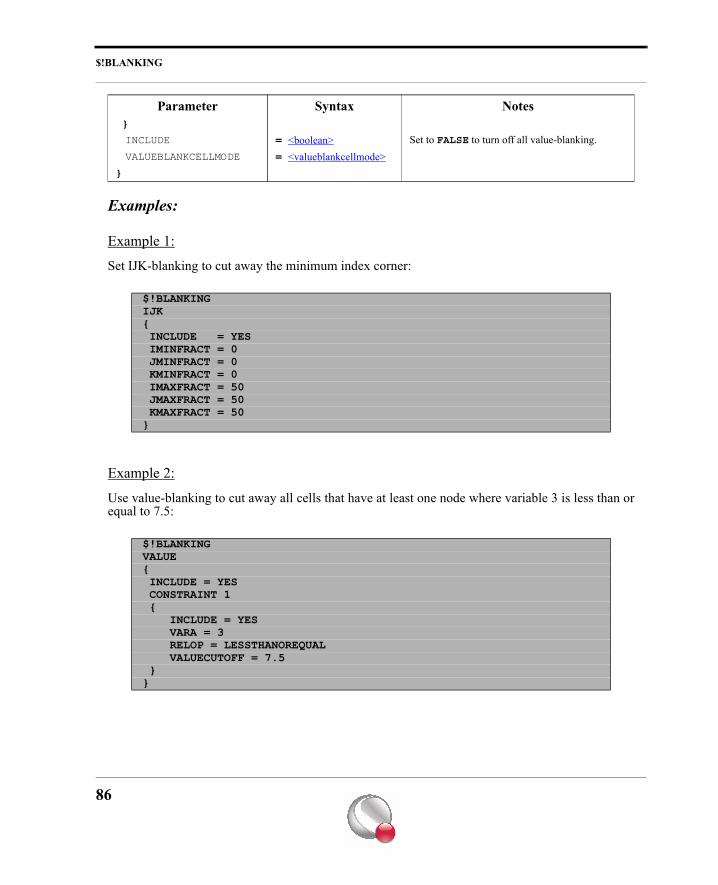
$!BLANKING
Examples:
Example 1:
Set IJK-blanking to cut away the minimum index corner:
Example 2:
Use value-blanking to cut away all cells that have at least one node where variable 3 is less than orequal to 7.5:
}
INCLUDE = <boolean> Set to FALSE to turn off all value-blanking.VALUEBLANKCELLMODE = <valueblankcellmode>
}
$!BLANKINGIJK{ INCLUDE = YES IMINFRACT = 0 JMINFRACT = 0 KMINFRACT = 0 IMAXFRACT = 50 JMAXFRACT = 50 KMAXFRACT = 50}
$!BLANKINGVALUE{ INCLUDE = YES CONSTRAINT 1 { INCLUDE = YES VARA = 3 RELOP = LESSTHANOREQUAL VALUECUTOFF = 7.5 }}
Parameter Syntax Notes
86
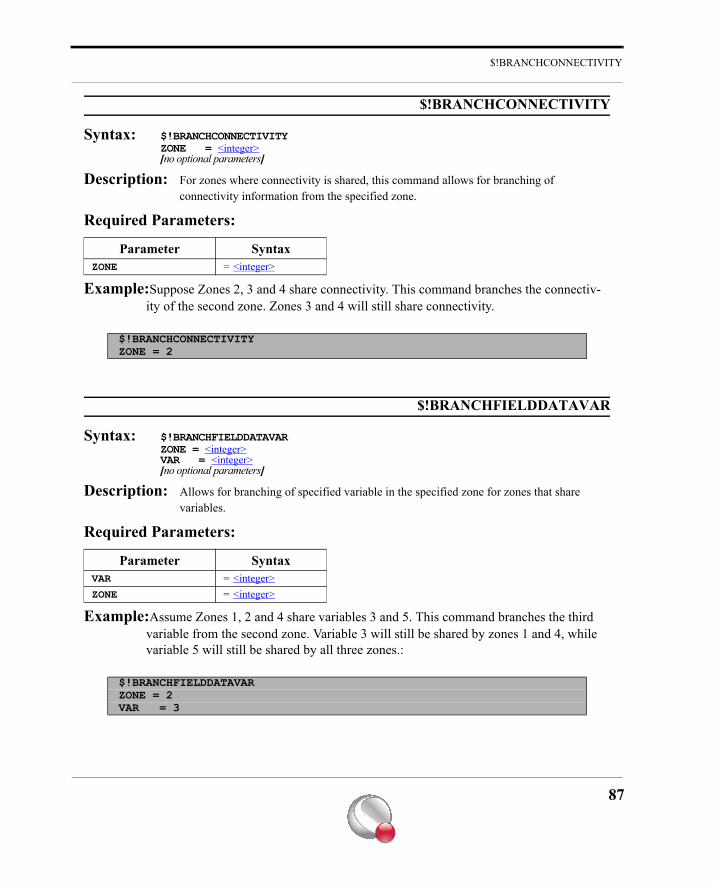
$!BRANCHCONNECTIVITY
$!BRANCHCONNECTIVITY
Syntax: $!BRANCHCONNECTIVITYZONE = <integer>[no optional parameters]
Description: For zones where connectivity is shared, this command allows for branching of connectivity information from the specified zone.
Required Parameters:
Example:Suppose Zones 2, 3 and 4 share connectivity. This command branches the connectiv-ity of the second zone. Zones 3 and 4 will still share connectivity.
$!BRANCHFIELDDATAVAR
Syntax: $!BRANCHFIELDDATAVARZONE = <integer>VAR = <integer>[no optional parameters]
Description: Allows for branching of specified variable in the specified zone for zones that share variables.
Required Parameters:
Example:Assume Zones 1, 2 and 4 share variables 3 and 5. This command branches the third variable from the second zone. Variable 3 will still be shared by zones 1 and 4, while variable 5 will still be shared by all three zones.:
Parameter SyntaxZONE = <integer>
$!BRANCHCONNECTIVITYZONE = 2
Parameter SyntaxVAR = <integer>ZONE = <integer>
$!BRANCHFIELDDATAVARZONE = 2VAR = 3
87
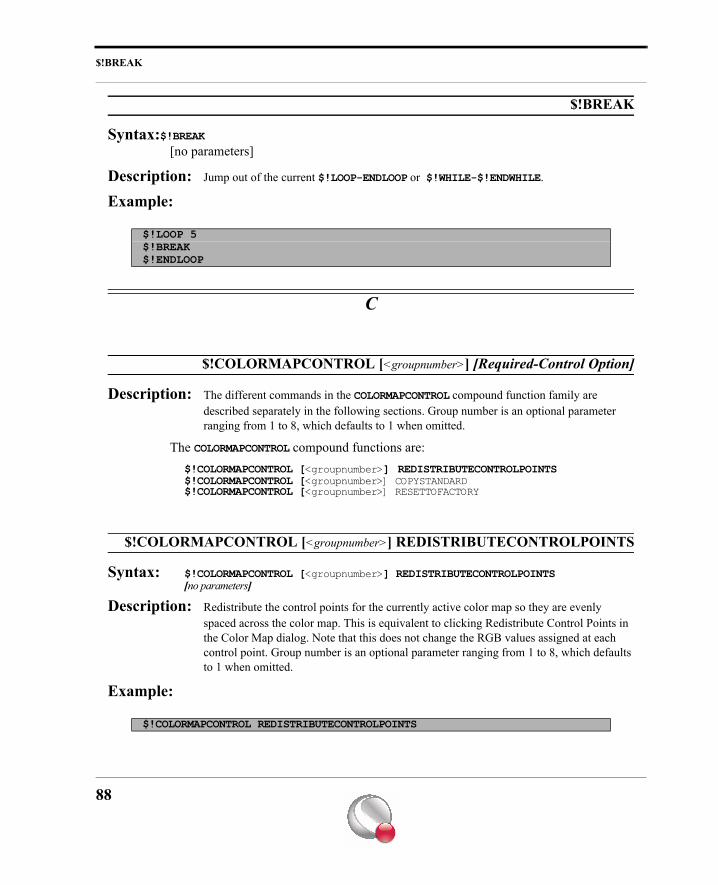
$!BREAK
$!BREAK
Syntax:$!BREAK[no parameters]
Description: Jump out of the current $!LOOP-ENDLOOP or $!WHILE-$!ENDWHILE.
Example:
C
$!COLORMAPCONTROL [<groupnumber>] [Required-Control Option]
Description: The different commands in the COLORMAPCONTROL compound function family are described separately in the following sections. Group number is an optional parameter ranging from 1 to 8, which defaults to 1 when omitted.
The COLORMAPCONTROL compound functions are:$!COLORMAPCONTROL [<groupnumber>] REDISTRIBUTECONTROLPOINTS$!COLORMAPCONTROL [<groupnumber>] COPYSTANDARD$!COLORMAPCONTROL [<groupnumber>] RESETTOFACTORY
$!COLORMAPCONTROL [<groupnumber>] REDISTRIBUTECONTROLPOINTS
Syntax: $!COLORMAPCONTROL [<groupnumber>] REDISTRIBUTECONTROLPOINTS[no parameters]
Description: Redistribute the control points for the currently active color map so they are evenly spaced across the color map. This is equivalent to clicking Redistribute Control Points in the Color Map dialog. Note that this does not change the RGB values assigned at each control point. Group number is an optional parameter ranging from 1 to 8, which defaults to 1 when omitted.
Example:
$!LOOP 5$!BREAK$!ENDLOOP
$!COLORMAPCONTROL REDISTRIBUTECONTROLPOINTS
88
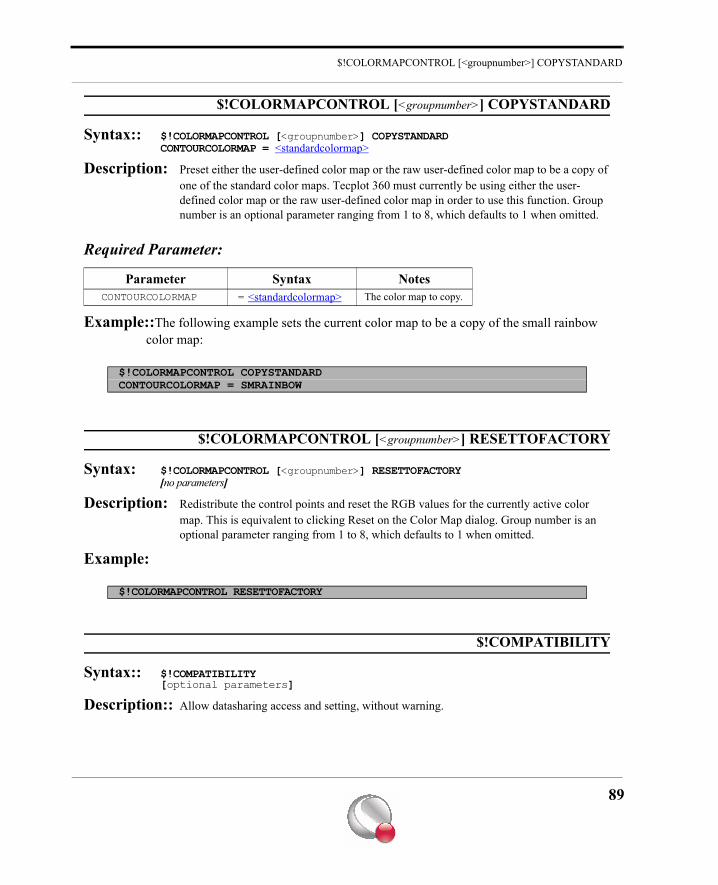
$!COLORMAPCONTROL [<groupnumber>] COPYSTANDARD
$!COLORMAPCONTROL [<groupnumber>] COPYSTANDARD
Syntax:: $!COLORMAPCONTROL [<groupnumber>] COPYSTANDARDCONTOURCOLORMAP = <standardcolormap>
Description: Preset either the user-defined color map or the raw user-defined color map to be a copy of one of the standard color maps. Tecplot 360 must currently be using either the user-defined color map or the raw user-defined color map in order to use this function. Group number is an optional parameter ranging from 1 to 8, which defaults to 1 when omitted.
Required Parameter:
Example::The following example sets the current color map to be a copy of the small rainbow color map:
$!COLORMAPCONTROL [<groupnumber>] RESETTOFACTORY
Syntax: $!COLORMAPCONTROL [<groupnumber>] RESETTOFACTORY[no parameters]
Description: Redistribute the control points and reset the RGB values for the currently active color map. This is equivalent to clicking Reset on the Color Map dialog. Group number is an optional parameter ranging from 1 to 8, which defaults to 1 when omitted.
Example:
$!COMPATIBILITY
Syntax:: $!COMPATIBILITY[optional parameters]
Description:: Allow datasharing access and setting, without warning.
Parameter Syntax NotesCONTOURCOLORMAP = <standardcolormap> The color map to copy.
$!COLORMAPCONTROL COPYSTANDARDCONTOURCOLORMAP = SMRAINBOW
$!COLORMAPCONTROL RESETTOFACTORY
89
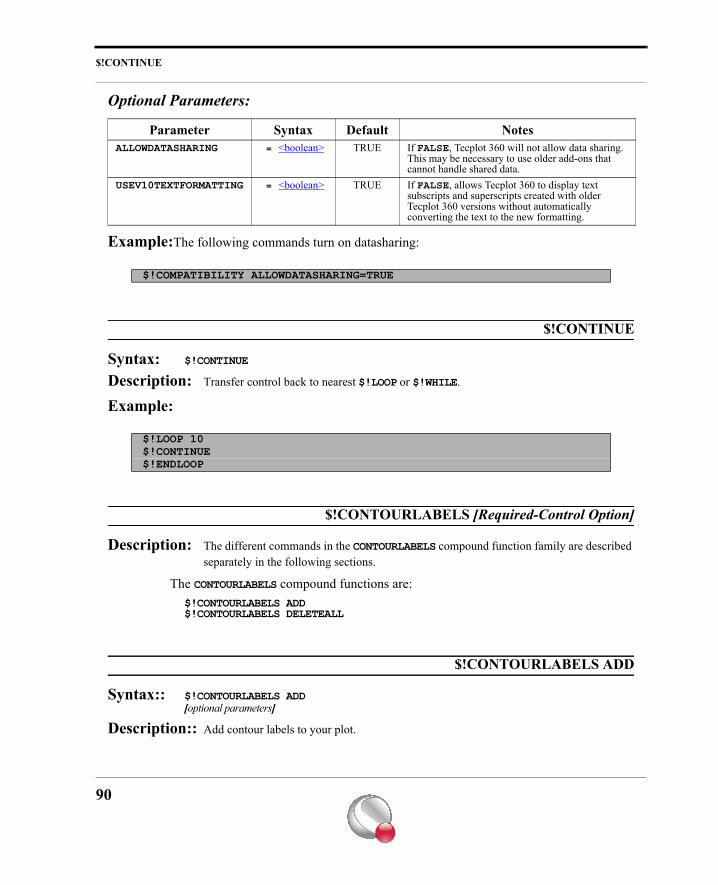
$!CONTINUE
Optional Parameters:
Example:The following commands turn on datasharing:
$!CONTINUE
Syntax: $!CONTINUE
Description: Transfer control back to nearest $!LOOP or $!WHILE.
Example:
$!CONTOURLABELS [Required-Control Option]
Description: The different commands in the CONTOURLABELS compound function family are described separately in the following sections.
The CONTOURLABELS compound functions are:$!CONTOURLABELS ADD$!CONTOURLABELS DELETEALL
$!CONTOURLABELS ADD
Syntax:: $!CONTOURLABELS ADD[optional parameters]
Description:: Add contour labels to your plot.
Parameter Syntax Default NotesALLOWDATASHARING = <boolean> TRUE If FALSE, Tecplot 360 will not allow data sharing.
This may be necessary to use older add-ons that cannot handle shared data.
USEV10TEXTFORMATTING = <boolean> TRUE If FALSE, allows Tecplot 360 to display text subscripts and superscripts created with older Tecplot 360 versions without automatically converting the text to the new formatting.
$!COMPATIBILITY ALLOWDATASHARING=TRUE
$!LOOP 10$!CONTINUE$!ENDLOOP
90
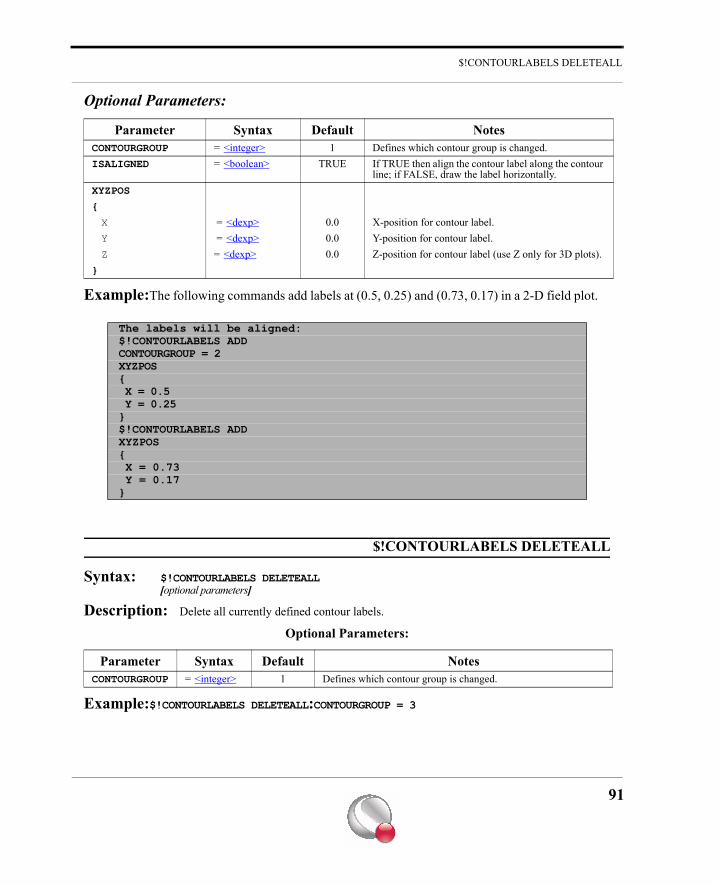
$!CONTOURLABELS DELETEALL
Optional Parameters:
Example:The following commands add labels at (0.5, 0.25) and (0.73, 0.17) in a 2-D field plot.
$!CONTOURLABELS DELETEALL
Syntax: $!CONTOURLABELS DELETEALL[optional parameters]
Description: Delete all currently defined contour labels.
Optional Parameters:
Example:$!CONTOURLABELS DELETEALL:CONTOURGROUP = 3
Parameter Syntax Default NotesCONTOURGROUP = <integer> 1 Defines which contour group is changed.ISALIGNED = <boolean> TRUE If TRUE then align the contour label along the contour
line; if FALSE, draw the label horizontally.XYZPOS
{
X = <dexp> 0.0 X-position for contour label.Y = <dexp> 0.0 Y-position for contour label.Z = <dexp> 0.0 Z-position for contour label (use Z only for 3D plots).
}
The labels will be aligned:$!CONTOURLABELS ADDCONTOURGROUP = 2XYZPOS{ X = 0.5 Y = 0.25}$!CONTOURLABELS ADDXYZPOS{ X = 0.73 Y = 0.17}
Parameter Syntax Default NotesCONTOURGROUP = <integer> 1 Defines which contour group is changed.
91
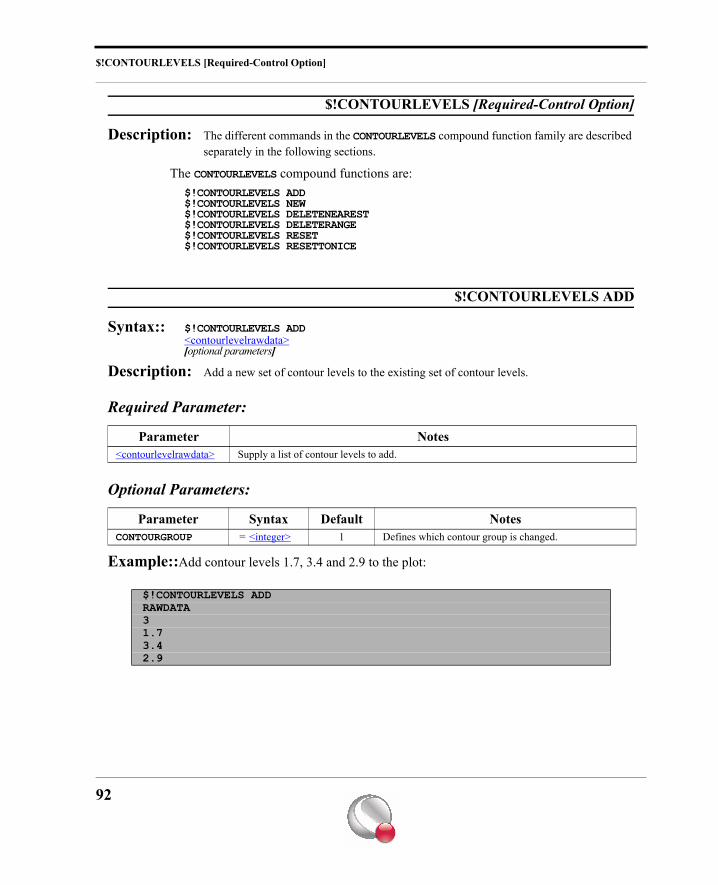
$!CONTOURLEVELS [Required-Control Option]
$!CONTOURLEVELS [Required-Control Option]
Description: The different commands in the CONTOURLEVELS compound function family are described separately in the following sections.
The CONTOURLEVELS compound functions are:$!CONTOURLEVELS ADD$!CONTOURLEVELS NEW$!CONTOURLEVELS DELETENEAREST$!CONTOURLEVELS DELETERANGE$!CONTOURLEVELS RESET $!CONTOURLEVELS RESETTONICE
$!CONTOURLEVELS ADD
Syntax:: $!CONTOURLEVELS ADD<contourlevelrawdata>[optional parameters]
Description: Add a new set of contour levels to the existing set of contour levels.
Required Parameter:
Optional Parameters:
Example::Add contour levels 1.7, 3.4 and 2.9 to the plot:
Parameter Notes<contourlevelrawdata> Supply a list of contour levels to add.
Parameter Syntax Default NotesCONTOURGROUP = <integer> 1 Defines which contour group is changed.
$!CONTOURLEVELS ADDRAWDATA31.73.42.9
92
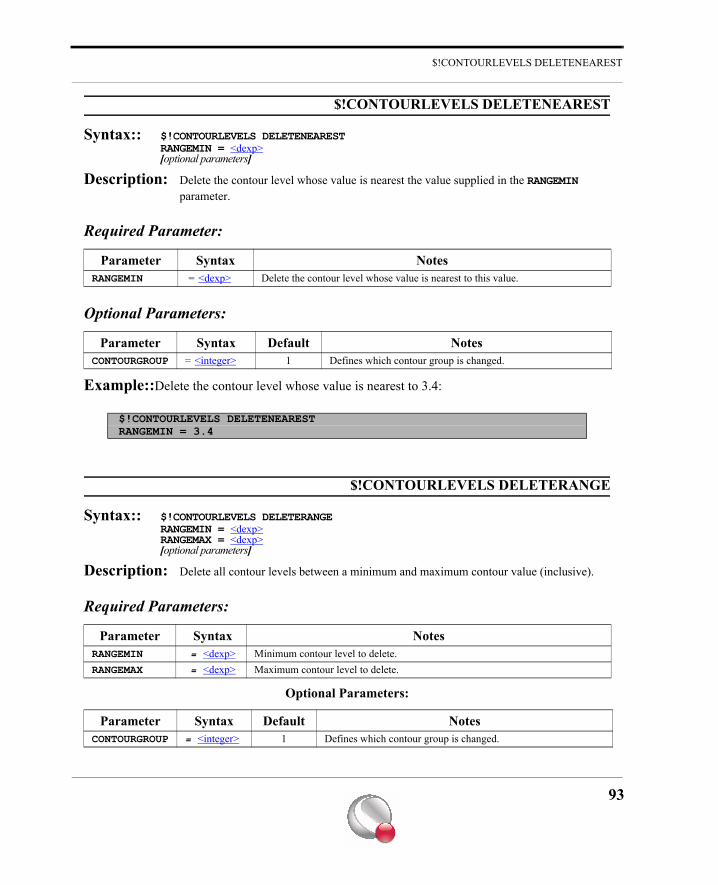
$!CONTOURLEVELS DELETENEAREST
$!CONTOURLEVELS DELETENEAREST
Syntax:: $!CONTOURLEVELS DELETENEARESTRANGEMIN = <dexp>[optional parameters]
Description: Delete the contour level whose value is nearest the value supplied in the RANGEMIN parameter.
Required Parameter:
Optional Parameters:
Example::Delete the contour level whose value is nearest to 3.4:
$!CONTOURLEVELS DELETERANGE
Syntax:: $!CONTOURLEVELS DELETERANGERANGEMIN = <dexp>RANGEMAX = <dexp>[optional parameters]
Description: Delete all contour levels between a minimum and maximum contour value (inclusive).
Required Parameters:
Optional Parameters:
Parameter Syntax NotesRANGEMIN = <dexp> Delete the contour level whose value is nearest to this value.
Parameter Syntax Default NotesCONTOURGROUP = <integer> 1 Defines which contour group is changed.
$!CONTOURLEVELS DELETENEARESTRANGEMIN = 3.4
Parameter Syntax NotesRANGEMIN = <dexp> Minimum contour level to delete.RANGEMAX = <dexp> Maximum contour level to delete.
Parameter Syntax Default NotesCONTOURGROUP = <integer> 1 Defines which contour group is changed.
93
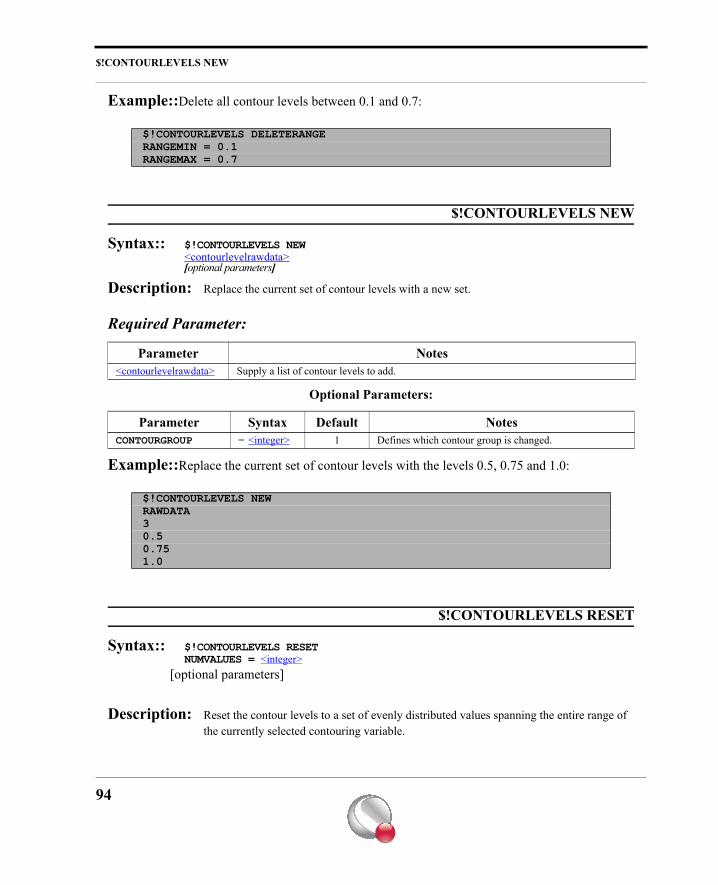
$!CONTOURLEVELS NEW
Example::Delete all contour levels between 0.1 and 0.7:
$!CONTOURLEVELS NEW
Syntax:: $!CONTOURLEVELS NEW<contourlevelrawdata>[optional parameters]
Description: Replace the current set of contour levels with a new set.
Required Parameter:
Optional Parameters:
Example::Replace the current set of contour levels with the levels 0.5, 0.75 and 1.0:
$!CONTOURLEVELS RESET
Syntax:: $!CONTOURLEVELS RESETNUMVALUES = <integer>
[optional parameters]
Description: Reset the contour levels to a set of evenly distributed values spanning the entire range of the currently selected contouring variable.
$!CONTOURLEVELS DELETERANGERANGEMIN = 0.1RANGEMAX = 0.7
Parameter Notes<contourlevelrawdata> Supply a list of contour levels to add.
Parameter Syntax Default NotesCONTOURGROUP = <integer> 1 Defines which contour group is changed.
$!CONTOURLEVELS NEWRAWDATA30.50.751.0
94
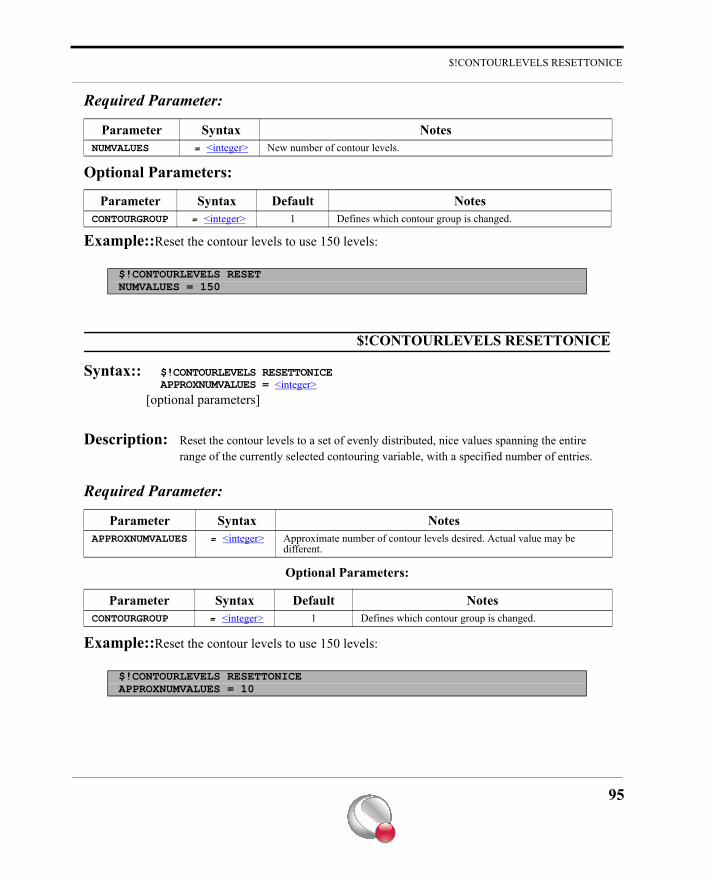
$!CONTOURLEVELS RESETTONICE
Required Parameter:
Optional Parameters:
Example::Reset the contour levels to use 150 levels:
$!CONTOURLEVELS RESETTONICE
Syntax:: $!CONTOURLEVELS RESETTONICEAPPROXNUMVALUES = <integer>
[optional parameters]
Description: Reset the contour levels to a set of evenly distributed, nice values spanning the entire range of the currently selected contouring variable, with a specified number of entries.
Required Parameter:
Optional Parameters:
Example::Reset the contour levels to use 150 levels:
Parameter Syntax NotesNUMVALUES = <integer> New number of contour levels.
Parameter Syntax Default NotesCONTOURGROUP = <integer> 1 Defines which contour group is changed.
$!CONTOURLEVELS RESETNUMVALUES = 150
Parameter Syntax NotesAPPROXNUMVALUES = <integer> Approximate number of contour levels desired. Actual value may be
different.
Parameter Syntax Default NotesCONTOURGROUP = <integer> 1 Defines which contour group is changed.
$!CONTOURLEVELS RESETTONICEAPPROXNUMVALUES = 10
95
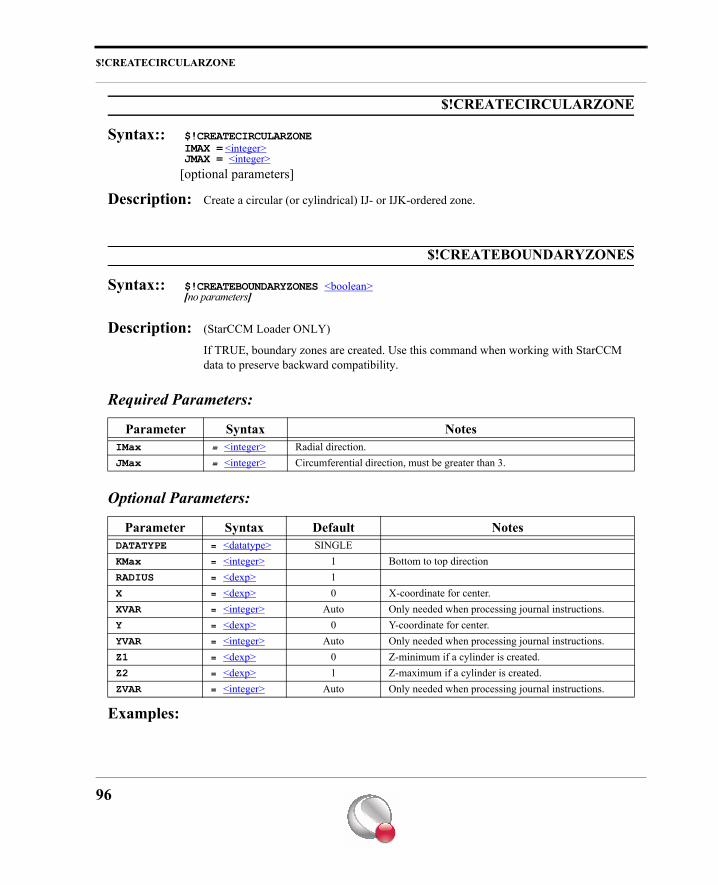
$!CREATECIRCULARZONE
$!CREATECIRCULARZONE
Syntax:: $!CREATECIRCULARZONEIMAX = <integer>JMAX = <integer>
[optional parameters]
Description: Create a circular (or cylindrical) IJ- or IJK-ordered zone.
$!CREATEBOUNDARYZONES
Syntax:: $!CREATEBOUNDARYZONES <boolean>[no parameters]
Description: (StarCCM Loader ONLY)
If TRUE, boundary zones are created. Use this command when working with StarCCM data to preserve backward compatibility.
Required Parameters:
Optional Parameters:
Examples:
Parameter Syntax NotesIMax = <integer> Radial direction.JMax = <integer> Circumferential direction, must be greater than 3.
Parameter Syntax Default NotesDATATYPE = <datatype> SINGLEKMax = <integer> 1 Bottom to top directionRADIUS = <dexp> 1X = <dexp> 0 X-coordinate for center.XVAR = <integer> Auto Only needed when processing journal instructions.Y = <dexp> 0 Y-coordinate for center.YVAR = <integer> Auto Only needed when processing journal instructions.Z1 = <dexp> 0 Z-minimum if a cylinder is created.Z2 = <dexp> 1 Z-maximum if a cylinder is created.ZVAR = <integer> Auto Only needed when processing journal instructions.
96
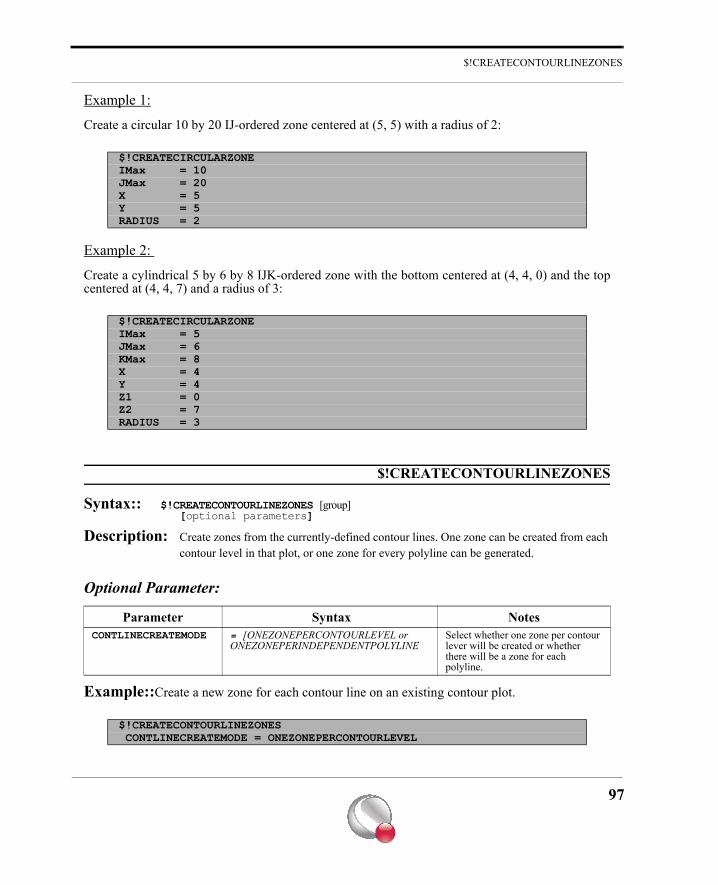
$!CREATECONTOURLINEZONES
Example 1:
Create a circular 10 by 20 IJ-ordered zone centered at (5, 5) with a radius of 2:
Example 2:
Create a cylindrical 5 by 6 by 8 IJK-ordered zone with the bottom centered at (4, 4, 0) and the topcentered at (4, 4, 7) and a radius of 3:
$!CREATECONTOURLINEZONES
Syntax:: $!CREATECONTOURLINEZONES [group][optional parameters]
Description: Create zones from the currently-defined contour lines. One zone can be created from each contour level in that plot, or one zone for every polyline can be generated.
Optional Parameter:
Example::Create a new zone for each contour line on an existing contour plot.
$!CREATECIRCULARZONEIMax = 10JMax = 20X = 5Y = 5RADIUS = 2
$!CREATECIRCULARZONEIMax = 5JMax = 6KMax = 8X = 4Y = 4Z1 = 0Z2 = 7RADIUS = 3
Parameter Syntax NotesCONTLINECREATEMODE = [ONEZONEPERCONTOURLEVEL or
ONEZONEPERINDEPENDENTPOLYLINESelect whether one zone per contour lever will be created or whether there will be a zone for each polyline.
$!CREATECONTOURLINEZONES CONTLINECREATEMODE = ONEZONEPERCONTOURLEVEL
97
$!CREATEFEBOUNDARY
$!CREATEFEBOUNDARY
Syntax:: $!CREATEFEBOUNDARYSOURCEZONE = <integer>[optional parameters]
Description: Zone edges for finite element data cannot be turned on or off using the edge plot layer in Tecplot 360. You can, however, create a separate zone which is the boundary of a finite element zone. This new zone can then be turned on or off.
Required Parameter:
Optional Parameter:
Example::Create an FE-boundary zone from zone 3:
$!CREATEFESURFACEFROMIORDERED
Syntax:: $!CREATEFESURFACEFROMIORDEREDSOURCEZONES = <set>[optional parameters]
Description: A FE-Surface zone can be generated from two or more I-Ordered zones. To get the best possible output, it is recommended that the source zones should have their nodes arranged in a similar manner so that the connecting lines between points are as straightforward as possible. For this reason, indices from source zones should increase in the same direction.
Parameter Syntax NotesSOURCEZONE = <integer> Zone to extract the boundary from.
Parameter Syntax Default NotesREMOVEBLANKEDSURFACES = <boolean> FALSE Set to TRUE if you want the resulting zone to
include only the boundary adjacent to non-blanked cells.
$!CREATEFEBOUNDARYSOURCEZONE = 3
98
$!CREATEISOZONES
Required Parameter:
Optional Parameter:
Example::Create an FE-Surface zone from zones 3 and 4:
$!CREATEISOZONES
Syntax:: $!CREATEISOZONES[no parameters]
Description: Create zones from the currently defined iso-surfaces. One zone will be created from each defined iso-surface. The iso-surfaces must be active and you must have at least one active volume zone.
Example::
$!CREATELINEMAP
Syntax:: $!CREATELINEMAP
[no parameters]
Description: Create a new Line-mapping.
Example::
Parameter Syntax NotesSOURCEZONES = <set> Zones whose points will be used to create the new surface.
Parameter Syntax Default NotesCONNECTSTARTTOEND = <boolean> FALSE TRUE allows for closed surfaces.
$!CREATEFESURFACEFROMIORDEREDSOURCEZONES = [3-4]
$!CREATEISOZONES
$!CREATELINEMAP
99
$!CREATEMIRRORZONES
$!CREATEMIRRORZONES
Syntax: $!CREATEMIRRORZONESSOURCEZONES = <set>[optional parameters]
Description: Create new zones that are mirror images of the source zones
Required Parameter:
Optional Parameter:
Example::Create a mirror of zones 2-4 across the Y-axis (that is, mirror the X-variable) in 2D frame mode:
$!CREATENEWFRAME
Syntax:: $!CREATENEWFRAME[optional parameters]
Description: Creates a new frame.
Parameter Syntax NotesSOURCEZONES = <set> Zone(s) to create mirror zone(s) from.
Parameter Syntax Default NotesMIRRORVAR = <mirrorvar> ‘X’ This variable in the new zone is multiplied by -1 after the
zone is copied.
$!CREATEMIRRORZONESSOURCEZONES = [2-4]MIRRORVAR = ’X’
100
$!CREATERECTANGULARZONE
Optional Parameters:
The default position and size of the initial frame created when Tecplot 360 starts up can be changedin the Tecplot 360 configuration file.
Example::The following example creates a 5- by 5-inch frame with the upper left hand corner of the frame positioned 2 inches from the left edge of the paper and 1 inch from the top:
$!CREATERECTANGULARZONE
Syntax:: $!CREATERECTANGULARZONE[optional parameters]
Description: Create a rectangular zone. If no data set exists when this command is executed, a data set is created with variables X, Y (and Z, if KMax > 1). If a data set exists prior to this command, the non-coordinate variables for the zone created are initialized to zero.
Parameter Syntax Default NotesHEIGHT = <dexp> 8 Units are in inches.XYPOS
{
X = <dexp> 1.0 X-position (inches) relative to the left edge of the paper.Y = <dexp> 0.25 Y-position (inches) relative to the top edge of the paper.
}
WIDTH = <dexp> 9 Units are in inches.
$!CREATENEWFRAMEXYPOS{ X = 2 Y = 1}WIDTH = 5HEIGHT = 5
101
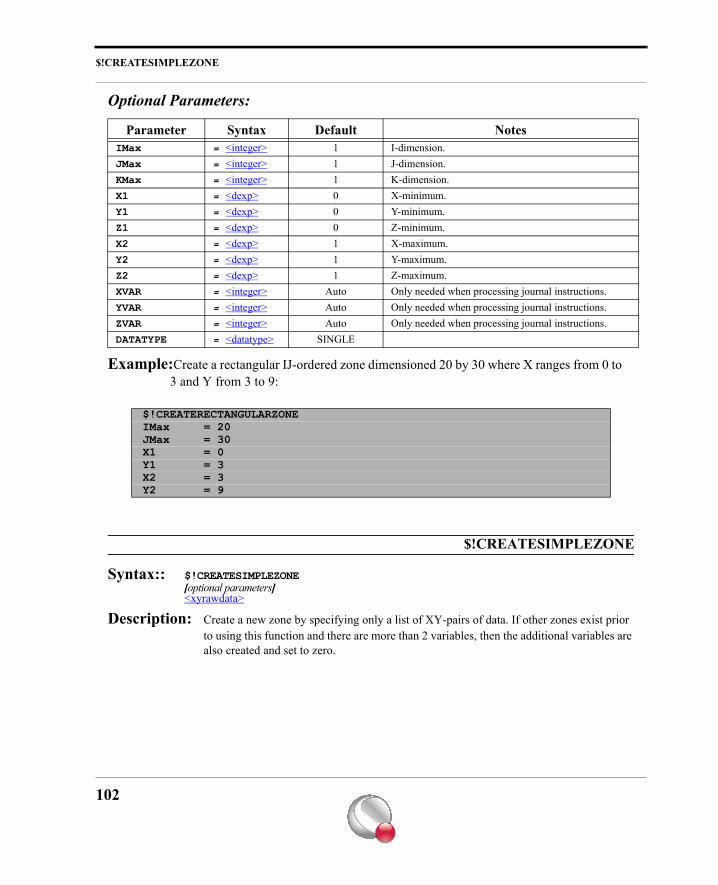
$!CREATESIMPLEZONE
Optional Parameters:
Example:Create a rectangular IJ-ordered zone dimensioned 20 by 30 where X ranges from 0 to 3 and Y from 3 to 9:
$!CREATESIMPLEZONE
Syntax:: $!CREATESIMPLEZONE[optional parameters]<xyrawdata>
Description: Create a new zone by specifying only a list of XY-pairs of data. If other zones exist prior to using this function and there are more than 2 variables, then the additional variables are also created and set to zero.
Parameter Syntax Default NotesIMax = <integer> 1 I-dimension.JMax = <integer> 1 J-dimension.KMax = <integer> 1 K-dimension.X1 = <dexp> 0 X-minimum.Y1 = <dexp> 0 Y-minimum.Z1 = <dexp> 0 Z-minimum.X2 = <dexp> 1 X-maximum.Y2 = <dexp> 1 Y-maximum.Z2 = <dexp> 1 Z-maximum.XVAR = <integer> Auto Only needed when processing journal instructions.YVAR = <integer> Auto Only needed when processing journal instructions.ZVAR = <integer> Auto Only needed when processing journal instructions.DATATYPE = <datatype> SINGLE
$!CREATERECTANGULARZONEIMax = 20JMax = 30X1 = 0Y1 = 3X2 = 3Y2 = 9
102
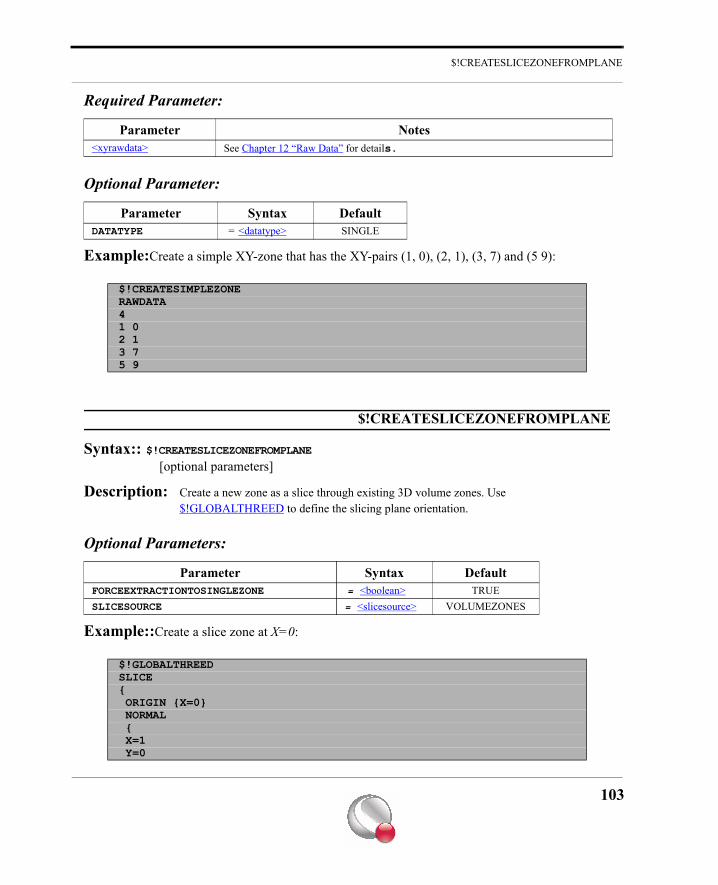
$!CREATESLICEZONEFROMPLANE
Required Parameter:
Optional Parameter:
Example:Create a simple XY-zone that has the XY-pairs (1, 0), (2, 1), (3, 7) and (5 9):
$!CREATESLICEZONEFROMPLANE
Syntax:: $!CREATESLICEZONEFROMPLANE
[optional parameters]
Description: Create a new zone as a slice through existing 3D volume zones. Use $!GLOBALTHREED to define the slicing plane orientation.
Optional Parameters:
Example::Create a slice zone at X=0:
Parameter Notes<xyrawdata> See Chapter 12 “Raw Data” for details.
Parameter Syntax DefaultDATATYPE = <datatype> SINGLE
$!CREATESIMPLEZONERAWDATA41 02 13 75 9
Parameter Syntax DefaultFORCEEXTRACTIONTOSINGLEZONE = <boolean> TRUESLICESOURCE = <slicesource> VOLUMEZONES
$!GLOBALTHREEDSLICE{ ORIGIN {X=0} NORMAL { X=1 Y=0
103
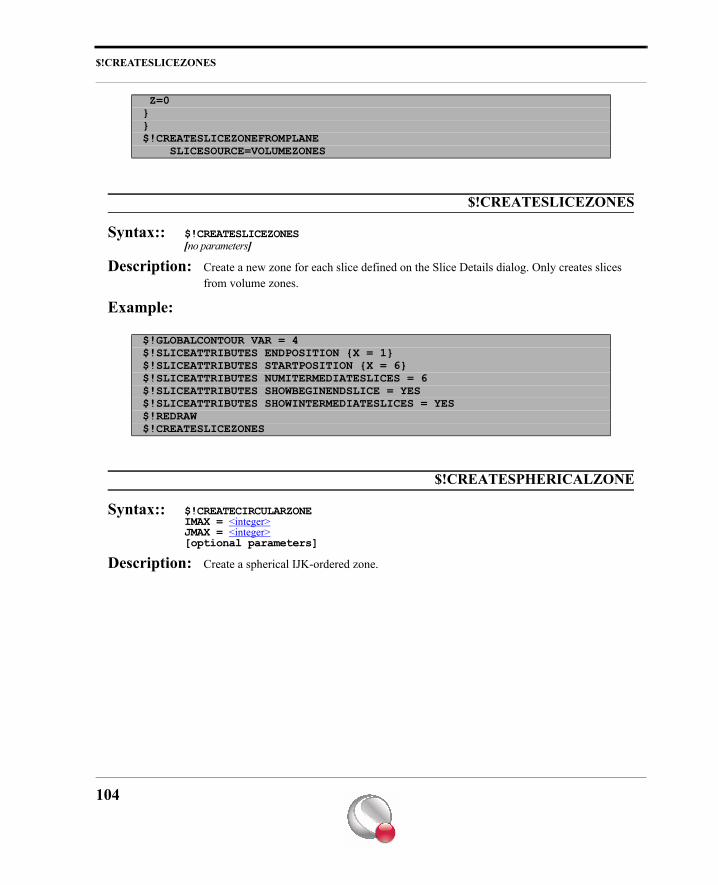
$!CREATESLICEZONES
$!CREATESLICEZONES
Syntax:: $!CREATESLICEZONES[no parameters]
Description: Create a new zone for each slice defined on the Slice Details dialog. Only creates slices from volume zones.
Example:
$!CREATESPHERICALZONE
Syntax:: $!CREATECIRCULARZONEIMAX = <integer>JMAX = <integer>[optional parameters]
Description: Create a spherical IJK-ordered zone.
Z=0}}$!CREATESLICEZONEFROMPLANE SLICESOURCE=VOLUMEZONES
$!GLOBALCONTOUR VAR = 4$!SLICEATTRIBUTES ENDPOSITION {X = 1}$!SLICEATTRIBUTES STARTPOSITION {X = 6}$!SLICEATTRIBUTES NUMITERMEDIATESLICES = 6$!SLICEATTRIBUTES SHOWBEGINENDSLICE = YES$!SLICEATTRIBUTES SHOWINTERMEDIATESLICES = YES$!REDRAW$!CREATESLICEZONES
104
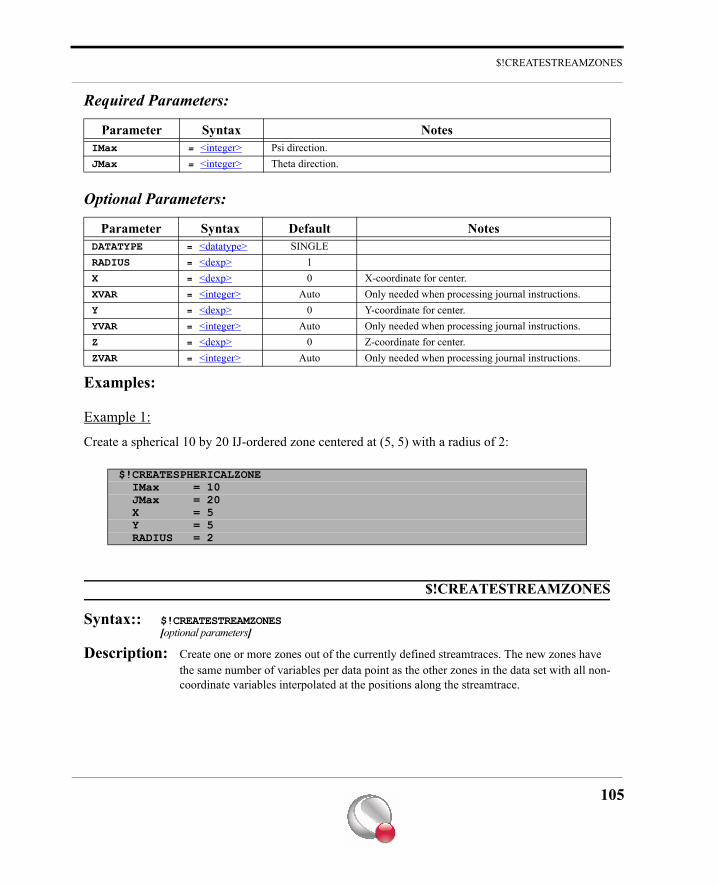
$!CREATESTREAMZONES
Required Parameters:
Optional Parameters:
Examples:
Example 1:
Create a spherical 10 by 20 IJ-ordered zone centered at (5, 5) with a radius of 2:
$!CREATESTREAMZONES
Syntax:: $!CREATESTREAMZONES[optional parameters]
Description: Create one or more zones out of the currently defined streamtraces. The new zones have the same number of variables per data point as the other zones in the data set with all non-coordinate variables interpolated at the positions along the streamtrace.
Parameter Syntax NotesIMax = <integer> Psi direction.JMax = <integer> Theta direction.
Parameter Syntax Default NotesDATATYPE = <datatype> SINGLERADIUS = <dexp> 1X = <dexp> 0 X-coordinate for center.XVAR = <integer> Auto Only needed when processing journal instructions.Y = <dexp> 0 Y-coordinate for center.YVAR = <integer> Auto Only needed when processing journal instructions.Z = <dexp> 0 Z-coordinate for center.ZVAR = <integer> Auto Only needed when processing journal instructions.
$!CREATESPHERICALZONE IMax = 10 JMax = 20 X = 5 Y = 5 RADIUS = 2
105
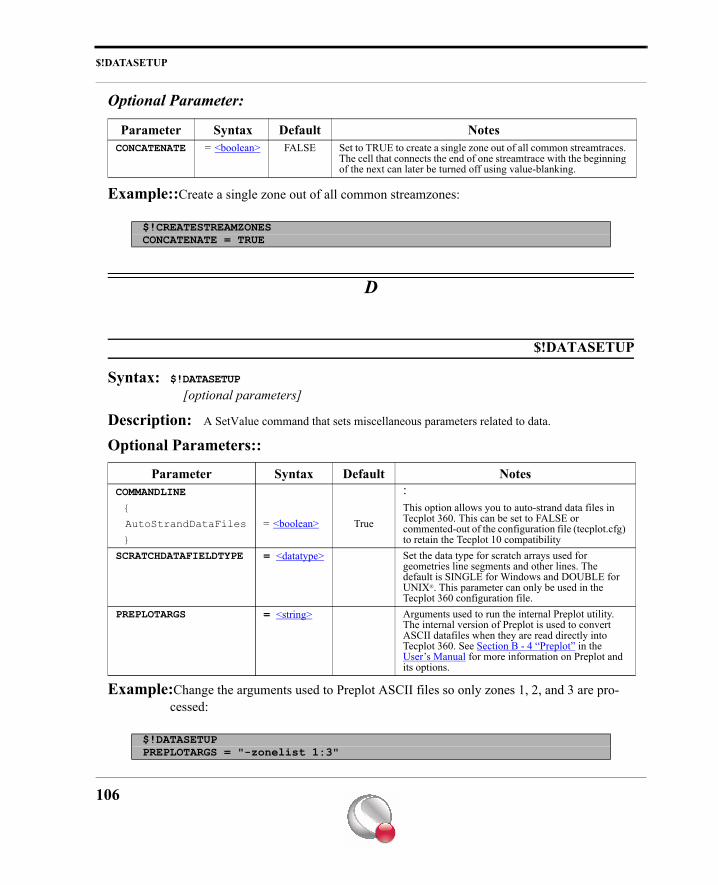
$!DATASETUP
Optional Parameter:
Example::Create a single zone out of all common streamzones:
D
$!DATASETUP
Syntax: $!DATASETUP
[optional parameters]
Description: A SetValue command that sets miscellaneous parameters related to data.
Optional Parameters::
Example:Change the arguments used to Preplot ASCII files so only zones 1, 2, and 3 are pro-cessed:
Parameter Syntax Default NotesCONCATENATE = <boolean> FALSE Set to TRUE to create a single zone out of all common streamtraces.
The cell that connects the end of one streamtrace with the beginning of the next can later be turned off using value-blanking.
$!CREATESTREAMZONESCONCATENATE = TRUE
Parameter Syntax Default NotesCOMMANDLINE :{ This option allows you to auto-strand data files in
Tecplot 360. This can be set to FALSE or commented-out of the configuration file (tecplot.cfg) to retain the Tecplot 10 compatibility
AutoStrandDataFiles = <boolean> True}
SCRATCHDATAFIELDTYPE = <datatype> Set the data type for scratch arrays used for geometries line segments and other lines. The default is SINGLE for Windows and DOUBLE for UNIX®. This parameter can only be used in the Tecplot 360 configuration file.
PREPLOTARGS = <string> Arguments used to run the internal Preplot utility. The internal version of Preplot is used to convert ASCII datafiles when they are read directly into Tecplot 360. See Section B - 4 “Preplot” in the User’s Manual for more information on Preplot and its options.
$!DATASETUPPREPLOTARGS = "-zonelist 1:3"
106
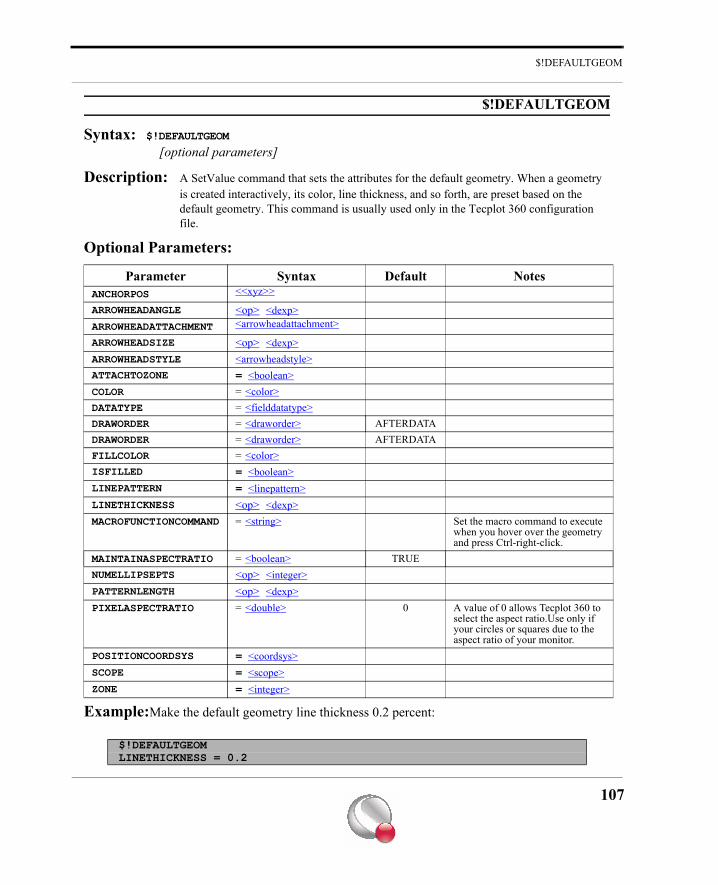
$!DEFAULTGEOM
$!DEFAULTGEOM
Syntax: $!DEFAULTGEOM
[optional parameters]
Description: A SetValue command that sets the attributes for the default geometry. When a geometry is created interactively, its color, line thickness, and so forth, are preset based on the default geometry. This command is usually used only in the Tecplot 360 configuration file.
Optional Parameters:
Example:Make the default geometry line thickness 0.2 percent:
Parameter Syntax Default NotesANCHORPOS <<xyz>>
ARROWHEADANGLE <op> <dexp>ARROWHEADATTACHMENT <arrowheadattachment>
ARROWHEADSIZE <op> <dexp>ARROWHEADSTYLE <arrowheadstyle>ATTACHTOZONE = <boolean>COLOR = <color>DATATYPE = <fielddatatype>DRAWORDER = <draworder> AFTERDATADRAWORDER = <draworder> AFTERDATAFILLCOLOR = <color>ISFILLED = <boolean>LINEPATTERN = <linepattern>LINETHICKNESS <op> <dexp>MACROFUNCTIONCOMMAND = <string> Set the macro command to execute
when you hover over the geometry and press Ctrl-right-click.
MAINTAINASPECTRATIO = <boolean> TRUENUMELLIPSEPTS <op> <integer>PATTERNLENGTH <op> <dexp>PIXELASPECTRATIO = <double> 0 A value of 0 allows Tecplot 360 to
select the aspect ratio.Use only if your circles or squares due to the aspect ratio of your monitor.
POSITIONCOORDSYS = <coordsys>SCOPE = <scope>ZONE = <integer>
$!DEFAULTGEOMLINETHICKNESS = 0.2
107
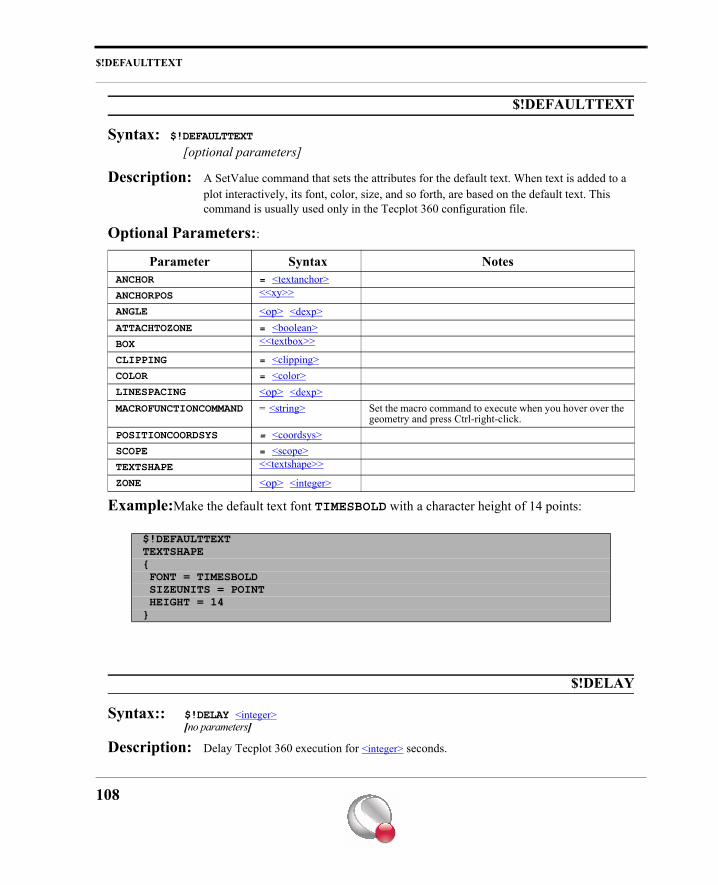
$!DEFAULTTEXT
$!DEFAULTTEXT
Syntax: $!DEFAULTTEXT
[optional parameters]
Description: A SetValue command that sets the attributes for the default text. When text is added to a plot interactively, its font, color, size, and so forth, are based on the default text. This command is usually used only in the Tecplot 360 configuration file.
Optional Parameters::
Example:Make the default text font TIMESBOLD with a character height of 14 points:
$!DELAY
Syntax:: $!DELAY <integer>[no parameters]
Description: Delay Tecplot 360 execution for <integer> seconds.
Parameter Syntax NotesANCHOR = <textanchor>ANCHORPOS <<xy>>
ANGLE <op> <dexp>ATTACHTOZONE = <boolean>BOX <<textbox>>
CLIPPING = <clipping>COLOR = <color>LINESPACING <op> <dexp>MACROFUNCTIONCOMMAND = <string> Set the macro command to execute when you hover over the
geometry and press Ctrl-right-click.POSITIONCOORDSYS = <coordsys>SCOPE = <scope>TEXTSHAPE <<textshape>>
ZONE <op> <integer>
$!DEFAULTTEXTTEXTSHAPE{ FONT = TIMESBOLD SIZEUNITS = POINT HEIGHT = 14}
108
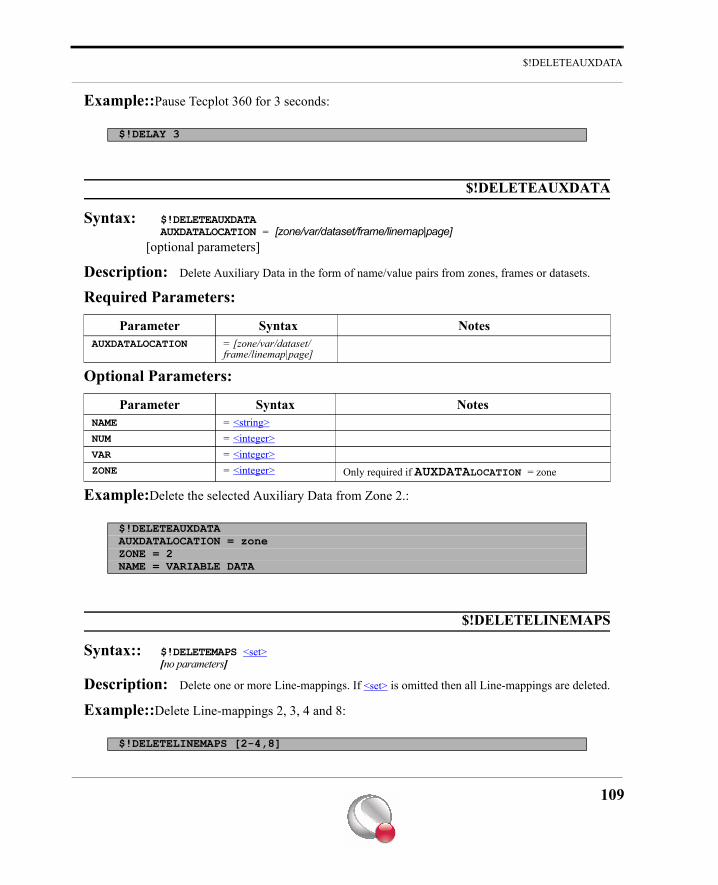
$!DELETEAUXDATA
Example::Pause Tecplot 360 for 3 seconds:
$!DELETEAUXDATA
Syntax: $!DELETEAUXDATAAUXDATALOCATION = [zone/var/dataset/frame/linemap|page]
[optional parameters]
Description: Delete Auxiliary Data in the form of name/value pairs from zones, frames or datasets.
Required Parameters:
Optional Parameters:
Example:Delete the selected Auxiliary Data from Zone 2.:
$!DELETELINEMAPS
Syntax:: $!DELETEMAPS <set>[no parameters]
Description: Delete one or more Line-mappings. If <set> is omitted then all Line-mappings are deleted.
Example::Delete Line-mappings 2, 3, 4 and 8:
$!DELAY 3
Parameter Syntax NotesAUXDATALOCATION = [zone/var/dataset/
frame/linemap|page]
Parameter Syntax NotesNAME = <string>NUM = <integer>VAR = <integer>ZONE = <integer> Only required if AUXDATALOCATION = zone
$!DELETEAUXDATAAUXDATALOCATION = zoneZONE = 2NAME = VARIABLE DATA
$!DELETELINEMAPS [2-4,8]
109
$!DELETEVARS
$!DELETEVARS
Syntax:: $!DELETEVARS <set>[no parameters]
Description: Delete one or more variables.
Example::Delete variables 4 and 10:
$!DELETEZONES
Syntax:: $!DELETEZONES <set>[no parameters]
Description: Delete one or more zones.
Example::Delete zones 3, 7, 8, 9 and 11:
$!DOUBLEBUFFER [Required-Control Option]
Description: The different commands in the DOUBLEBUFFER compound function family are described separately in the following sections.
The DOUBLEBUFFER compound functions are:
$!DOUBLEBUFFER OFF
Syntax:: $!DOUBLEBUFFER OFF[no parameters]
Description: Turn off double buffering; use this command once at the end of a sequence of using the
$!DELETEVARS [4,10]
$!DELETEZONES [3,7-9,11]
$!DOUBLEBUFFER OFF$!DOUBLEBUFFER ON$!DOUBLEBUFFER SWAP
110
$!DOUBLEBUFFER ON
double buffer.
Example:See $!DOUBLEBUFFER SWAP
$!DOUBLEBUFFER ON
Syntax:: $!DOUBLEBUFFER ON[no parameters]
Description: Turn on double buffering; use this command once at the beginning of a sequence of using the double buffer. While double buffering is turned on all drawing is sent to the back buffer.
Example:See $!DOUBLEBUFFER SWAP
$!DOUBLEBUFFER SWAP
Syntax:: $!DOUBLEBUFFER SWAP[no parameters]
Description: Swap the back buffer to the front. In other words, copy the image in the back buffer to the front.
Example:The following example uses the double buffer to show the rotation of a 3-D object:
$!DRAWGRAPHICS
Syntax:: $!DRAWGRAPHICS <boolean>[no parameters]
Description: Turn on or off all graphics drawing. Turning off all graphics during preliminary portions of a macro file can greatly increase the efficiency of the macro.
$!DOUBLEBUFFER ON$!LOOP 10$!ROTATE3DVIEW X ANGLE = 5$!REDRAW$!DOUBLEBUFFER SWAP$!ENDLOOP$!DOUBLEBUFFER OFF
111
$!DROPDIALOG
Example:Turn off all graphics drawing:
$!DROPDIALOG
Syntax:: $!DROPDIALOG <dialogname>[no parameters]
Description: Drop a Tecplot 360 interface dialog. This command is mainly useful for the Tecplot 360 demo. To launch a dialog use $!LAUNCHDIALOG.
Example:
$!DUPLICATELINEMAP
Syntax:: $!DUPLICATELINEMAPSOURCEMAP = <integer>DESTINATIONMAP = <integer>
Description: Copy attributes from an existing Line-mapping to another.
Required Parameters:
Example:Copy attributes of Line-mapping 3 to Line-mapping 7:
$!DRAWGRAPHICS NO
$!DROPDIALOG MACROVIEWER
Parameter Syntax NotesDESTINATIONMAP = <integer> The destination can either be the number of an existing map or 1
greater than the current number of maps. If you choose the latter, a new Line-mapping will be created.
SOURCEMAP = <integer> Line-mapping from which to copy.
$!DUPLICATELINEMAPSOURCEMAP = 3DESTINATIONMAP = 7
112
$!DUPLICATEZONE
$!DUPLICATEZONE
Syntax:: $!DUPLICATEZONESOURCEZONE = <integer>[optional parameters]
Description: Make a copy of an existing zone. You can assign index ranges to create a new zone which is a subset of the source zone.
Required Parameter:
Optional Parameters:
Examples:
Example 1:
Make a complete copy of zone 2:
Parameters Syntax NotesSOURCEZONE = <integer> Zone to duplicate (the source zone).
Parameters Syntax Default NotesIRANGE See notes Range Parameters for $!ALTERDATA
action command.{
MIN = <integer> 1MAX = <integer> 0SKIP = <integer> 1
}
JRANGE See notes Range Parameters for $!ALTERDATA action command.{
MIN = <integer> 1MAX = <integer> 0SKIP = <integer> 1
}
KRANGE See notes Range Parameters for $!ALTERDATA action command.{
MIN = <integer> 1MAX = <integer> 0SKIP = <integer> 1
}
$!DUPLICATEZONESOURCEZONE = 2
113
$!ELSE
Example 2:
Duplicate zone 3 creating a zone which uses only the I-index range from 2 to 7 from the sourcezone:
E
$!ELSE
Syntax:: $!ELSE [no parameters]
Description: Conditionally handle macro commands. Used when an $!IF statement is FALSE.
Example::
$!DUPLICATEZONESOURCEZONE = 3IRANGE{ MIN = 2 MAX = 7}
$!VARSET |C| = 2$!IF |C| == 5 $!CREATENEWFRAMEXYPOS { X = 2.5 Y = 1.5 } WIDTH = 4 HEIGHT = 4$!ELSE $!CREATENEWFRAME XYPOS { X = 3 Y = 2 } WIDTH = 3 HEIGHT = 3$!ENDIF
114
$!ELSEIF
$!ELSEIF
Syntax:: $!ELSEIF <conditionalexp>
Description: Conditionally handle macro commands. Used to create multiple options for statements should an $!IF statement be FALSE.
Example::
$!VARSET |A| = 2$!IF |A| < 5 $!CREATENEWFRAMEXYPOS{X = 1Y = 1}WIDTH = 3HEIGHT = 3$!ELSEIF |A| > 5 $!CREATENEWFRAMEXYPOS{X = 2Y = 1}WIDTH = 5HEIGHT = 5$!ELSE $!CREATENEWFRAMEXYPOS{X = 3Y = 3}WIDTH = 9HEIGHT = 9$!ENDIF
115
$!EXPORT
$!EXPORT
Syntax:: $!EXPORT[no parameters]
Description: Export an image file from Tecplot 360. See the $!EXPORTSETUP command for details on setting up the exported image type. The $!EXPORT command is not valid for animation formats. (AVI and Raster Metafile.)
Example::
$!EXPORTCANCEL
Syntax:: $!EXPORTCANCEL[no parameters]
Description: Cancel out of the current export animation sequence. The animation file being generated is removed.
Example::
$!EXPORTFINISH
Syntax:: $!EXPORTFINISH[no parameters]
Description: Signals the completion of an animation sequence and causes the animation file to be created. You must call $!EXPORTSTART prior to using $!EXPORTFINISH. This command is only valid for animation formats. (AVI and Raster Metafile.) You may use the |EXPORTISRECORDING| intrinsic variable to make sure that an animation sequence has been initiated.
Example::
$!EXPORTSETUP EXPORTFORMAT = PNG$!EXPORT
$!EXPORTCANCEL
$!EXPORTSETUP EXPORTFNAME="rotate.avi" EXPORTFORMAT=AVI$!EXPORTSTART$!LOOP 5$!ROTATE3DVIEW X
116
$!EXPORTNEXTFRAME
$!EXPORTNEXTFRAME
Syntax:: $!EXPORTNEXTFRAME[no parameters]
Description: Records the next frame of an animation. You must call $!EXPORTSTART prior to calling $!EXPORTNEXTFRAME. This command is only valid for animation formats. (AVI and Raster Metafile. You may use the |EXPORTISRECORDING| intrinsic variable to make sure that an animation sequence has been initiated.)
Example::
$!EXPORTSETUP
Syntax: $!EXPORTSETUP
[optional parameters]
Description: A SetValue command that sets the attributes for exporting image files from Tecplot 360. Exporting is usually intended as a means to transfer images from Tecplot 360 to be imported by other applications. See $!PRINTSETUP and $!PRINT for generating output intended for printers and plotters.
ANGLE=5$!EXPORTNEXTFRAME$!ENDLOOP$!IF "|EXPORTISRECORDING|" =="YES" $!EXPORTFINISH$!ENDIF
$!EXPORTSETUP EXPORTFNAME="rotate.avi" EXPORTFORMAT=AVI$!EXPORTSTART$!LOOP 5$!ROTATE3DVIEW X ANGLE=5$!EXPORTNEXTFRAME$!ENDLOOP$!EXPORTFINISH
117
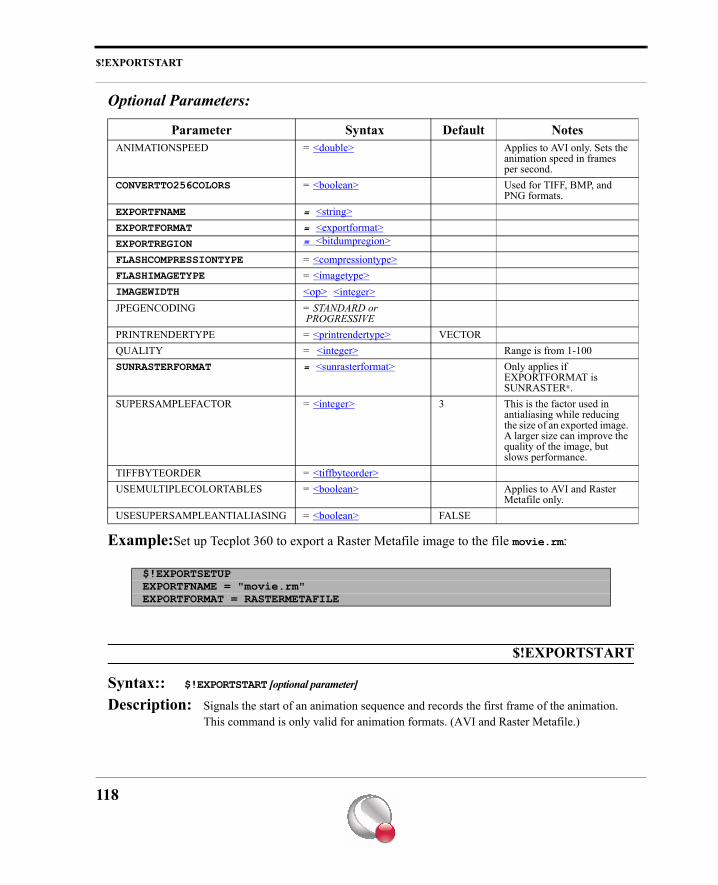
$!EXPORTSTART
Optional Parameters:
Example:Set up Tecplot 360 to export a Raster Metafile image to the file movie.rm:
$!EXPORTSTART
Syntax:: $!EXPORTSTART [optional parameter]
Description: Signals the start of an animation sequence and records the first frame of the animation. This command is only valid for animation formats. (AVI and Raster Metafile.)
Parameter Syntax Default NotesANIMATIONSPEED = <double> Applies to AVI only. Sets the
animation speed in frames per second.
CONVERTTO256COLORS = <boolean> Used for TIFF, BMP, and PNG formats.
EXPORTFNAME = <string>EXPORTFORMAT = <exportformat>EXPORTREGION = <bitdumpregion>
FLASHCOMPRESSIONTYPE = <compressiontype>FLASHIMAGETYPE = <imagetype>IMAGEWIDTH <op> <integer>JPEGENCODING = STANDARD or
PROGRESSIVEPRINTRENDERTYPE = <printrendertype> VECTORQUALITY = <integer> Range is from 1-100SUNRASTERFORMAT = <sunrasterformat> Only applies if
EXPORTFORMAT is SUNRASTER®.
SUPERSAMPLEFACTOR = <integer> 3 This is the factor used in antialiasing while reducing the size of an exported image. A larger size can improve the quality of the image, but slows performance.
TIFFBYTEORDER = <tiffbyteorder>USEMULTIPLECOLORTABLES = <boolean> Applies to AVI and Raster
Metafile only.USESUPERSAMPLEANTIALIASING = <boolean> FALSE
$!EXPORTSETUPEXPORTFNAME = "movie.rm"EXPORTFORMAT = RASTERMETAFILE
118
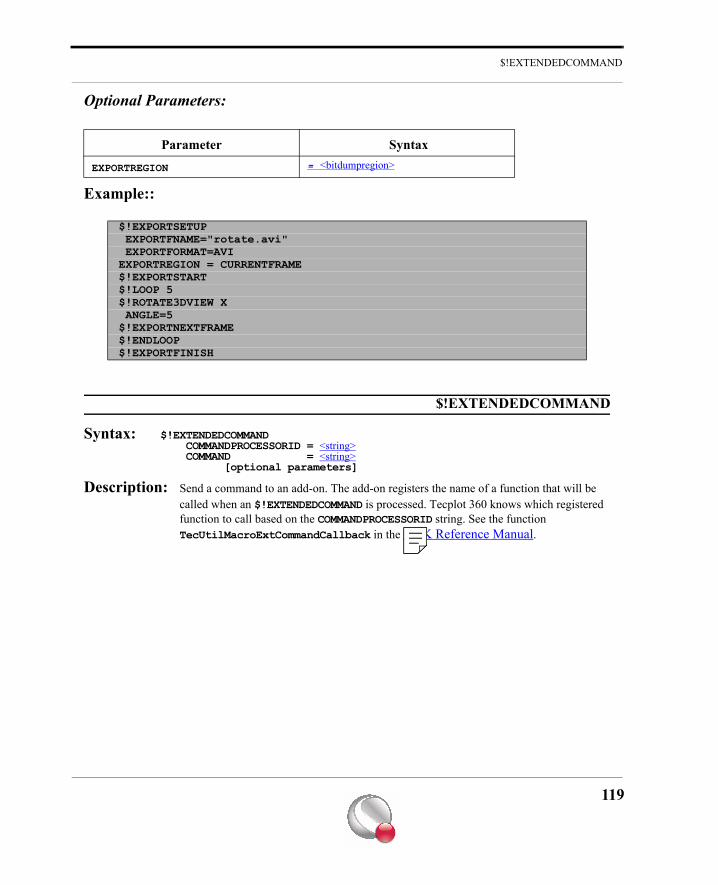
$!EXTENDEDCOMMAND
Optional Parameters:
Example::
$!EXTENDEDCOMMAND
Syntax: $!EXTENDEDCOMMAND COMMANDPROCESSORID = <string> COMMAND = <string> [optional parameters]
Description: Send a command to an add-on. The add-on registers the name of a function that will be called when an $!EXTENDEDCOMMAND is processed. Tecplot 360 knows which registered function to call based on the COMMANDPROCESSORID string. See the function TecUtilMacroExtCommandCallback in the ADK Reference Manual.
Parameter Syntax
EXPORTREGION = <bitdumpregion>
$!EXPORTSETUP EXPORTFNAME="rotate.avi" EXPORTFORMAT=AVIEXPORTREGION = CURRENTFRAME$!EXPORTSTART$!LOOP 5$!ROTATE3DVIEW X ANGLE=5$!EXPORTNEXTFRAME$!ENDLOOP$!EXPORTFINISH
119

$!EXTRACTFROMGEOM
Required Parameters:
Optional Parameters:
Example: Send the command GO to the add-on that has registered a command processor with an COMMANDPRO-CESSORID of XPROC:
$!EXTRACTFROMGEOM
Syntax:: $!EXTRACTFROMGEOM[optional parameters]
Description: Extract data from a 2- or 3D field plot. The locations at which to extract the data come from a polyline geometry that must be picked prior to issuing this command.
Parameter Syntax NotesCOMMANDPROCESSORID = <string> String that identifies the add-on. This must match the published ID string
for the add-on.COMMAND = <string> The command to be sent to the add-on.
Parameter Syntax Default Notes<extendedcommandrawdata>
NULL If the RAWDATA section is supplied then each line of the RAWDATA section is appended to the COMMAND string. A leading new line character is appended first, and each line in the RAWDATA section will also be terminated with a new line (except for the last line).
$!EXTENDEDCOMMAND COMMANDPROCESSORID = "XPROC" COMMAND = "GO"
120
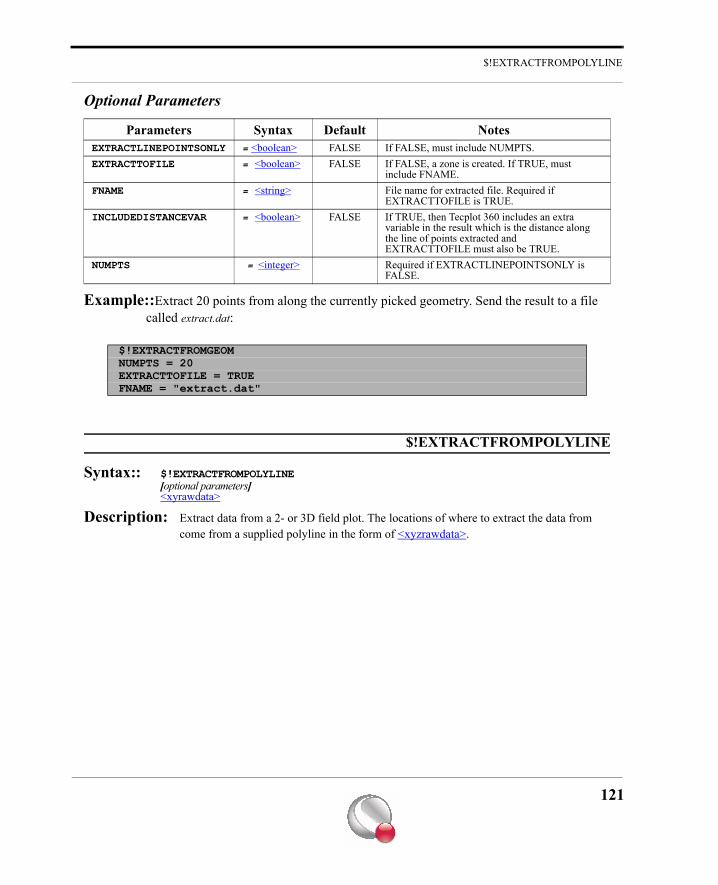
$!EXTRACTFROMPOLYLINE
Optional Parameters
Example::Extract 20 points from along the currently picked geometry. Send the result to a file called extract.dat:
$!EXTRACTFROMPOLYLINE
Syntax:: $!EXTRACTFROMPOLYLINE[optional parameters]<xyrawdata>
Description: Extract data from a 2- or 3D field plot. The locations of where to extract the data from come from a supplied polyline in the form of <xyzrawdata>.
Parameters Syntax Default NotesEXTRACTLINEPOINTSONLY = <boolean> FALSE If FALSE, must include NUMPTS.EXTRACTTOFILE = <boolean> FALSE If FALSE, a zone is created. If TRUE, must
include FNAME.FNAME = <string> File name for extracted file. Required if
EXTRACTTOFILE is TRUE.INCLUDEDISTANCEVAR = <boolean> FALSE If TRUE, then Tecplot 360 includes an extra
variable in the result which is the distance along the line of points extracted and EXTRACTTOFILE must also be TRUE.
NUMPTS = <integer> Required if EXTRACTLINEPOINTSONLY is FALSE.
$!EXTRACTFROMGEOMNUMPTS = 20EXTRACTTOFILE = TRUEFNAME = "extract.dat"
121
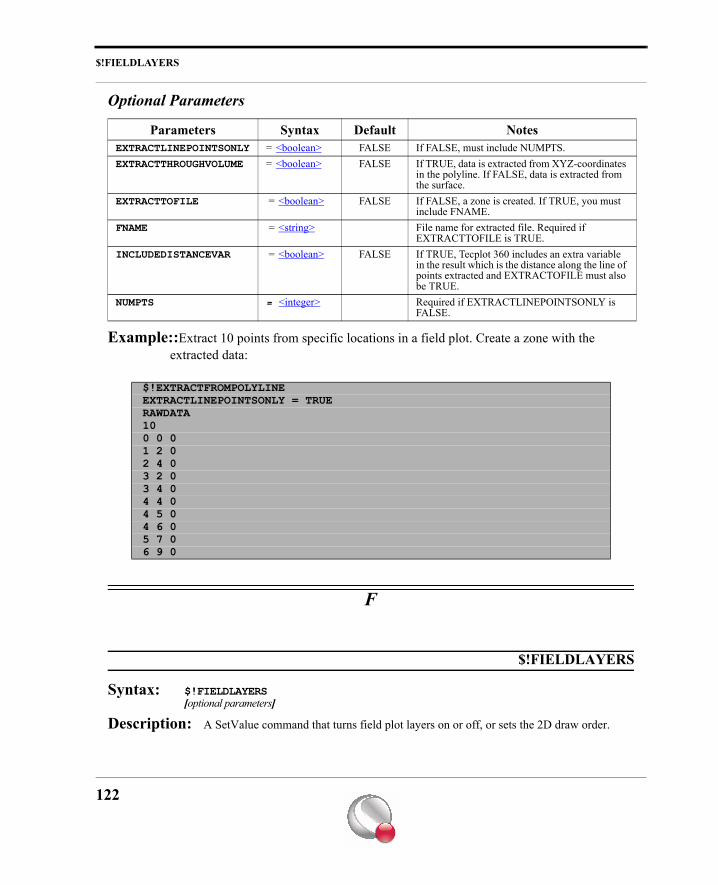
$!FIELDLAYERS
Optional Parameters
Example::Extract 10 points from specific locations in a field plot. Create a zone with the extracted data:
F
$!FIELDLAYERS
Syntax: $!FIELDLAYERS[optional parameters]
Description: A SetValue command that turns field plot layers on or off, or sets the 2D draw order.
Parameters Syntax Default NotesEXTRACTLINEPOINTSONLY = <boolean> FALSE If FALSE, must include NUMPTS.EXTRACTTHROUGHVOLUME = <boolean> FALSE If TRUE, data is extracted from XYZ-coordinates
in the polyline. If FALSE, data is extracted from the surface.
EXTRACTTOFILE = <boolean> FALSE If FALSE, a zone is created. If TRUE, you must include FNAME.
FNAME = <string> File name for extracted file. Required if EXTRACTTOFILE is TRUE.
INCLUDEDISTANCEVAR = <boolean> FALSE If TRUE, Tecplot 360 includes an extra variable in the result which is the distance along the line of points extracted and EXTRACTOFILE must also be TRUE.
NUMPTS = <integer> Required if EXTRACTLINEPOINTSONLY is FALSE.
$!EXTRACTFROMPOLYLINEEXTRACTLINEPOINTSONLY = TRUERAWDATA100 0 01 2 02 4 03 2 03 4 04 4 04 5 04 6 05 7 06 9 0
122
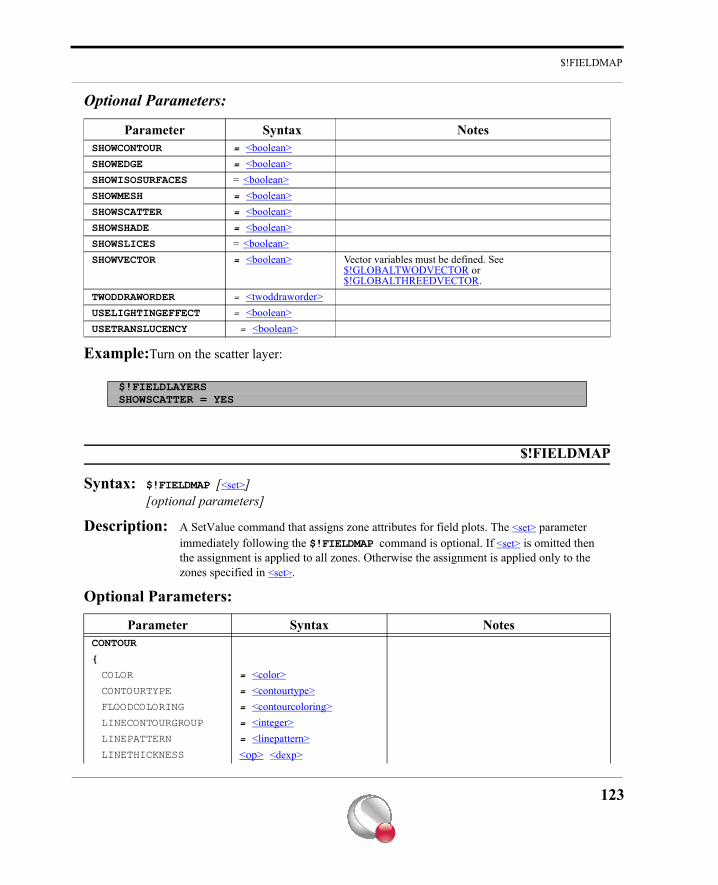
$!FIELDMAP
Optional Parameters:
Example:Turn on the scatter layer:
$!FIELDMAP
Syntax: $!FIELDMAP [<set>][optional parameters]
Description: A SetValue command that assigns zone attributes for field plots. The <set> parameter immediately following the $!FIELDMAP command is optional. If <set> is omitted then the assignment is applied to all zones. Otherwise the assignment is applied only to the zones specified in <set>.
Optional Parameters:
Parameter Syntax NotesSHOWCONTOUR = <boolean>SHOWEDGE = <boolean>SHOWISOSURFACES = <boolean>SHOWMESH = <boolean>SHOWSCATTER = <boolean>SHOWSHADE = <boolean>SHOWSLICES = <boolean>SHOWVECTOR = <boolean> Vector variables must be defined. See
$!GLOBALTWODVECTOR or $!GLOBALTHREEDVECTOR.
TWODDRAWORDER = <twoddraworder>USELIGHTINGEFFECT = <boolean>USETRANSLUCENCY = <boolean>
$!FIELDLAYERSSHOWSCATTER = YES
Parameter Syntax NotesCONTOUR
{
COLOR = <color>CONTOURTYPE = <contourtype>FLOODCOLORING = <contourcoloring>LINECONTOURGROUP = <integer>LINEPATTERN = <linepattern>LINETHICKNESS <op> <dexp>
123
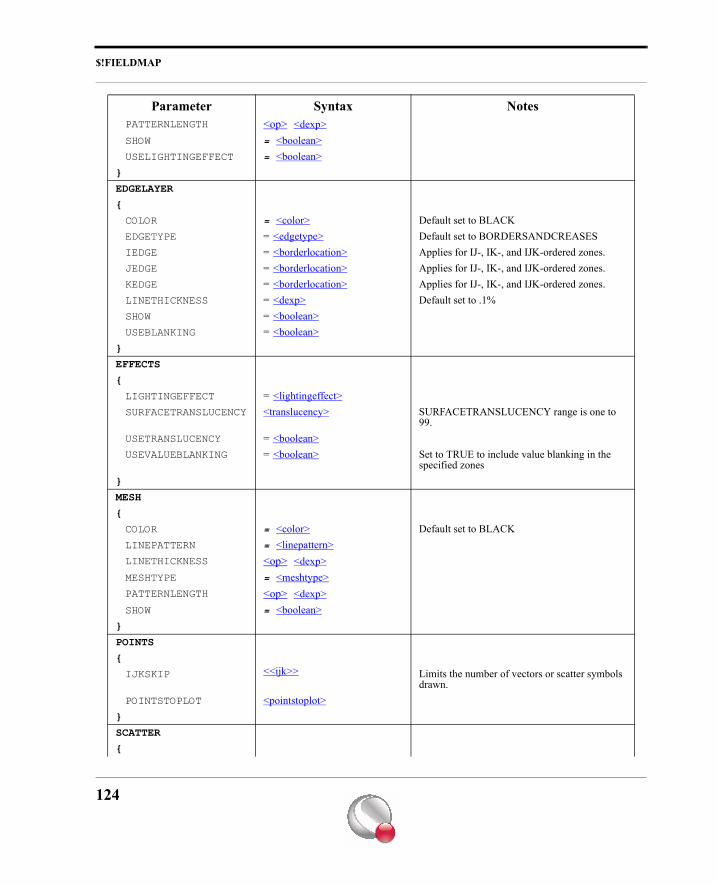
$!FIELDMAP
PATTERNLENGTH <op> <dexp>SHOW = <boolean>USELIGHTINGEFFECT = <boolean>
}
EDGELAYER
{
COLOR = <color> Default set to BLACKEDGETYPE = <edgetype> Default set to BORDERSANDCREASESIEDGE = <borderlocation> Applies for IJ-, IK-, and IJK-ordered zones.JEDGE = <borderlocation> Applies for IJ-, IK-, and IJK-ordered zones.KEDGE = <borderlocation> Applies for IJ-, IK-, and IJK-ordered zones.LINETHICKNESS = <dexp> Default set to .1%SHOW = <boolean>USEBLANKING = <boolean>
}
EFFECTS
{
LIGHTINGEFFECT = <lightingeffect>SURFACETRANSLUCENCY <translucency> SURFACETRANSLUCENCY range is one to
99.USETRANSLUCENCY = <boolean>USEVALUEBLANKING = <boolean> Set to TRUE to include value blanking in the
specified zones}
MESH
{
COLOR = <color> Default set to BLACKLINEPATTERN = <linepattern>LINETHICKNESS <op> <dexp>MESHTYPE = <meshtype>PATTERNLENGTH <op> <dexp>SHOW = <boolean>
}
POINTS
{
IJKSKIP <<ijk>> Limits the number of vectors or scatter symbols drawn.
POINTSTOPLOT <pointstoplot>}
SCATTER
{
Parameter Syntax Notes
124
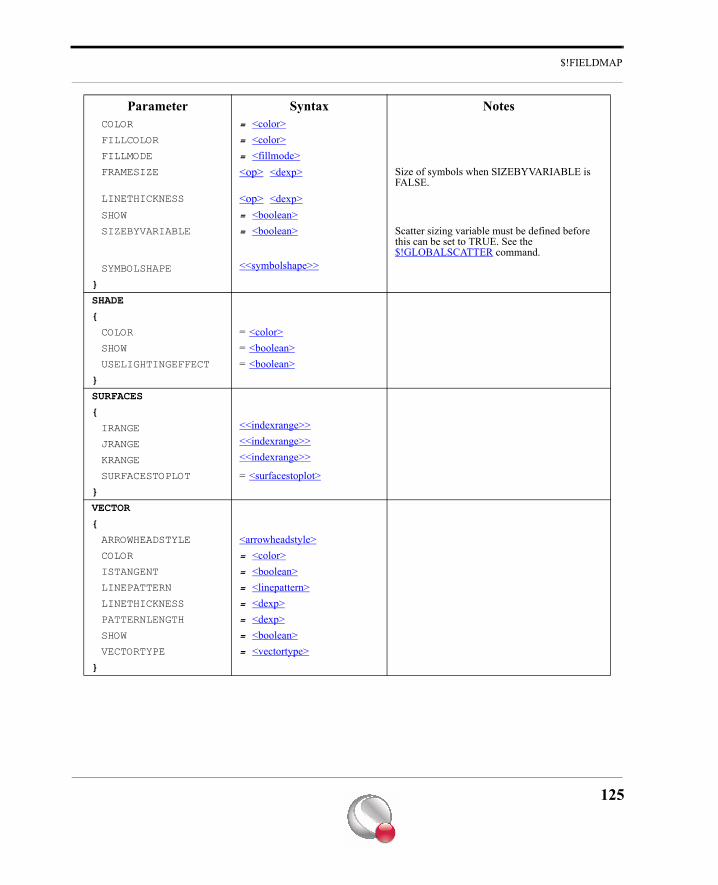
$!FIELDMAP
COLOR = <color>FILLCOLOR = <color>FILLMODE = <fillmode>FRAMESIZE <op> <dexp> Size of symbols when SIZEBYVARIABLE is
FALSE.LINETHICKNESS <op> <dexp>SHOW = <boolean>SIZEBYVARIABLE = <boolean> Scatter sizing variable must be defined before
this can be set to TRUE. See the $!GLOBALSCATTER command.
SYMBOLSHAPE <<symbolshape>>
}
SHADE
{
COLOR = <color>SHOW = <boolean>USELIGHTINGEFFECT = <boolean>
}
SURFACES
{
IRANGE <<indexrange>>
JRANGE <<indexrange>>
KRANGE <<indexrange>>
SURFACESTOPLOT = <surfacestoplot>}
VECTOR
{
ARROWHEADSTYLE <arrowheadstyle>COLOR = <color>ISTANGENT = <boolean>LINEPATTERN = <linepattern>LINETHICKNESS = <dexp>PATTERNLENGTH = <dexp>SHOW = <boolean>VECTORTYPE = <vectortype>
}
Parameter Syntax Notes
125
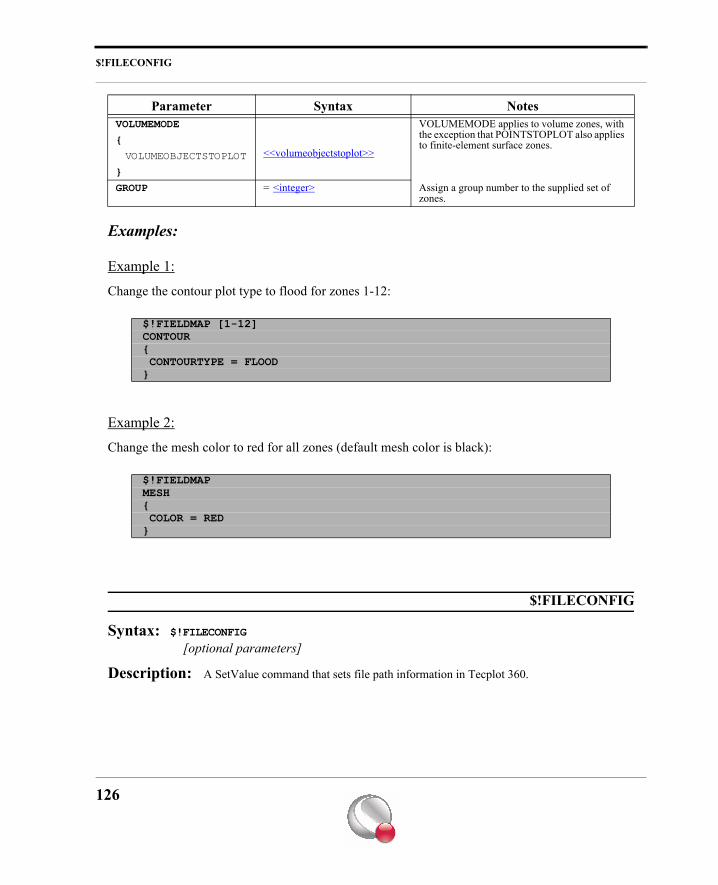
$!FILECONFIG
Examples:
Example 1:
Change the contour plot type to flood for zones 1-12:
Example 2:
Change the mesh color to red for all zones (default mesh color is black):
$!FILECONFIG
Syntax: $!FILECONFIG
[optional parameters]
Description: A SetValue command that sets file path information in Tecplot 360.
VOLUMEMODE VOLUMEMODE applies to volume zones, with the exception that POINTSTOPLOT also applies to finite-element surface zones.{
VOLUMEOBJECTSTOPLOT <<volumeobjectstoplot>>
}
GROUP = <integer> Assign a group number to the supplied set of zones.
$!FIELDMAP [1-12]CONTOUR{ CONTOURTYPE = FLOOD}
$!FIELDMAPMESH{ COLOR = RED}
Parameter Syntax Notes
126
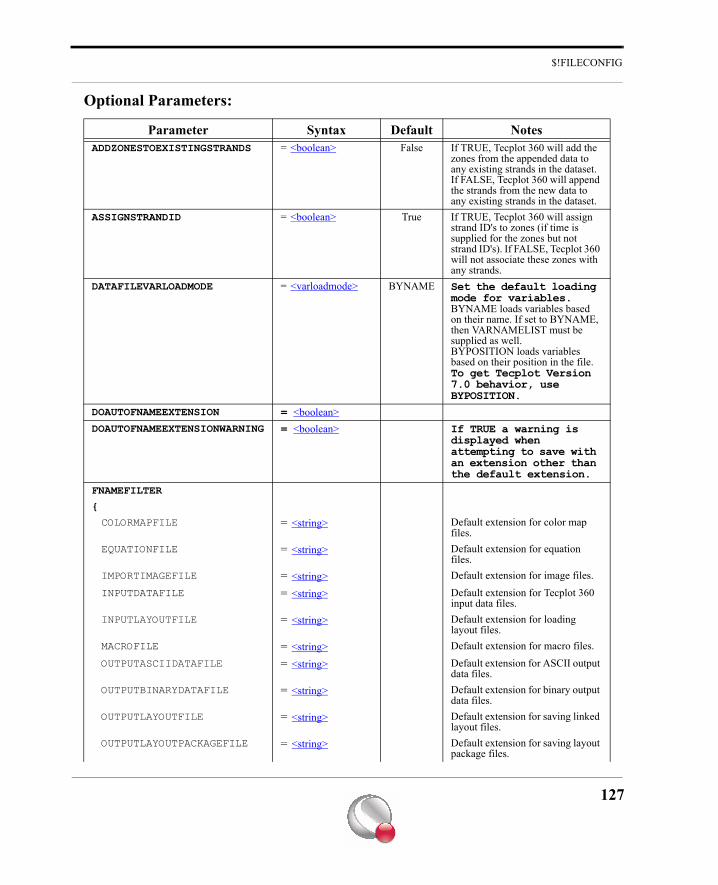
$!FILECONFIG
Optional Parameters:
Parameter Syntax Default NotesADDZONESTOEXISTINGSTRANDS = <boolean> False If TRUE, Tecplot 360 will add the
zones from the appended data to any existing strands in the dataset. If FALSE, Tecplot 360 will append the strands from the new data to any existing strands in the dataset.
ASSIGNSTRANDID = <boolean> True If TRUE, Tecplot 360 will assign strand ID's to zones (if time is supplied for the zones but not strand ID's). If FALSE, Tecplot 360 will not associate these zones with any strands.
DATAFILEVARLOADMODE = <varloadmode> BYNAME Set the default loading mode for variables. BYNAME loads variables based on their name. If set to BYNAME, then VARNAMELIST must be supplied as well.BYPOSITION loads variables based on their position in the file. To get Tecplot Version 7.0 behavior, use BYPOSITION.
DOAUTOFNAMEEXTENSION = <boolean> DOAUTOFNAMEEXTENSIONWARNING = <boolean> If TRUE a warning is
displayed when attempting to save with an extension other than the default extension.
FNAMEFILTER
{
COLORMAPFILE = <string> Default extension for color map files.
EQUATIONFILE = <string> Default extension for equation files.
IMPORTIMAGEFILE = <string> Default extension for image files.INPUTDATAFILE = <string> Default extension for Tecplot 360
input data files.INPUTLAYOUTFILE = <string> Default extension for loading
layout files.MACROFILE = <string> Default extension for macro files.OUTPUTASCIIDATAFILE = <string> Default extension for ASCII output
data files.OUTPUTBINARYDATAFILE = <string> Default extension for binary output
data files.OUTPUTLAYOUTFILE = <string> Default extension for saving linked
layout files.OUTPUTLAYOUTPACKAGEFILE = <string> Default extension for saving layout
package files.
127
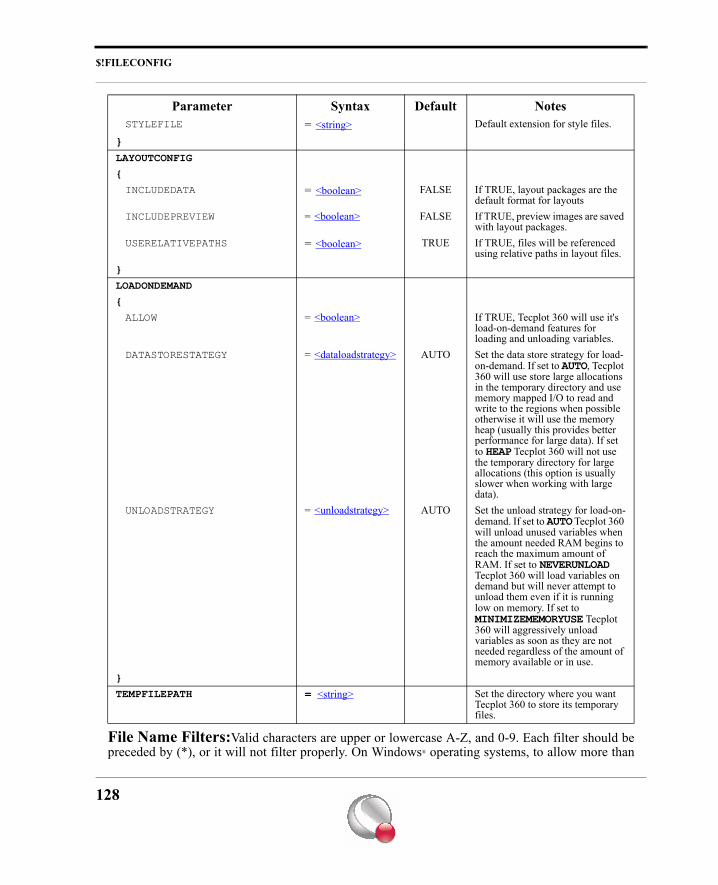
$!FILECONFIG
File Name Filters:Valid characters are upper or lowercase A-Z, and 0-9. Each filter should bepreceded by (*), or it will not filter properly. On Windows® operating systems, to allow more than
STYLEFILE = <string> Default extension for style files.
}LAYOUTCONFIG
{
INCLUDEDATA = <boolean> FALSE If TRUE, layout packages are the default format for layouts
INCLUDEPREVIEW = <boolean> FALSE If TRUE, preview images are saved with layout packages.
USERELATIVEPATHS = <boolean> TRUE If TRUE, files will be referenced using relative paths in layout files.
}
LOADONDEMAND
{
ALLOW = <boolean> If TRUE, Tecplot 360 will use it's load-on-demand features for loading and unloading variables.
DATASTORESTATEGY = <dataloadstrategy> AUTO Set the data store strategy for load-on-demand. If set to AUTO, Tecplot 360 will use store large allocations in the temporary directory and use memory mapped I/O to read and write to the regions when possible otherwise it will use the memory heap (usually this provides better performance for large data). If set to HEAP Tecplot 360 will not use the temporary directory for large allocations (this option is usually slower when working with large data).
UNLOADSTRATEGY = <unloadstrategy> AUTO Set the unload strategy for load-on-demand. If set to AUTO Tecplot 360 will unload unused variables when the amount needed RAM begins to reach the maximum amount of RAM. If set to NEVERUNLOAD Tecplot 360 will load variables on demand but will never attempt to unload them even if it is running low on memory. If set to MINIMIZEMEMORYUSE Tecplot 360 will aggressively unload variables as soon as they are not needed regardless of the amount of memory available or in use.
}
TEMPFILEPATH = <string> Set the directory where you want Tecplot 360 to store its temporary files.
Parameter Syntax Default Notes
128
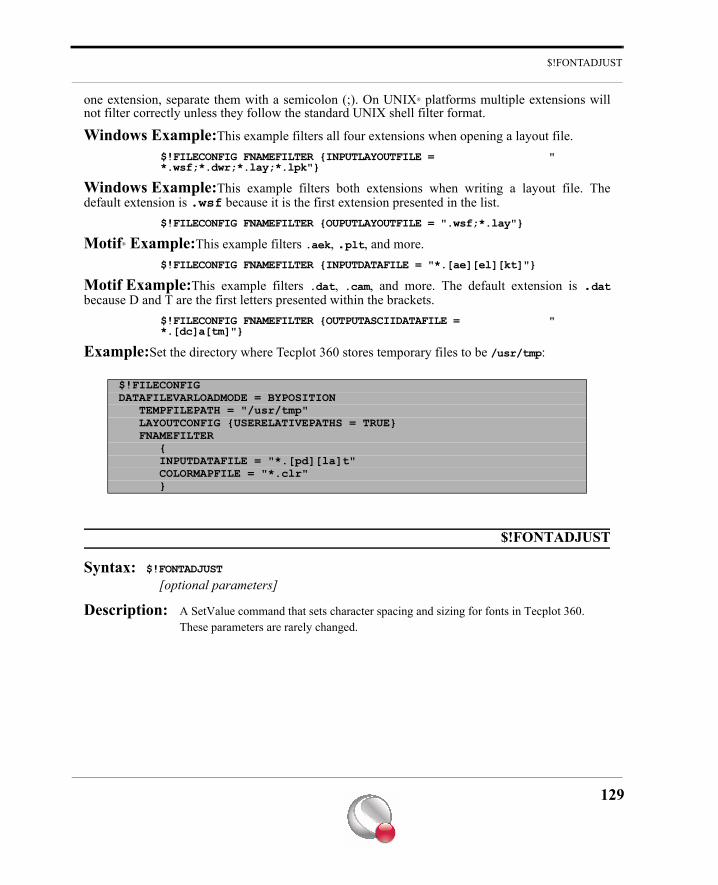
$!FONTADJUST
one extension, separate them with a semicolon (;). On UNIX® platforms multiple extensions willnot filter correctly unless they follow the standard UNIX shell filter format.
Windows Example:This example filters all four extensions when opening a layout file.$!FILECONFIG FNAMEFILTER {INPUTLAYOUTFILE = "*.wsf;*.dwr;*.lay;*.lpk"}
Windows Example:This example filters both extensions when writing a layout file. Thedefault extension is .wsf because it is the first extension presented in the list.
$!FILECONFIG FNAMEFILTER {OUPUTLAYOUTFILE = ".wsf;*.lay"}
Motif® Example:This example filters .aek, .plt, and more.$!FILECONFIG FNAMEFILTER {INPUTDATAFILE = "*.[ae][el][kt]"}
Motif Example:This example filters .dat, .cam, and more. The default extension is .datbecause D and T are the first letters presented within the brackets.
$!FILECONFIG FNAMEFILTER {OUTPUTASCIIDATAFILE = "*.[dc]a[tm]"}
Example:Set the directory where Tecplot 360 stores temporary files to be /usr/tmp:
$!FONTADJUST
Syntax: $!FONTADJUST
[optional parameters]
Description: A SetValue command that sets character spacing and sizing for fonts in Tecplot 360. These parameters are rarely changed.
$!FILECONFIGDATAFILEVARLOADMODE = BYPOSITION TEMPFILEPATH = "/usr/tmp" LAYOUTCONFIG {USERELATIVEPATHS = TRUE} FNAMEFILTER { INPUTDATAFILE = "*.[pd][la]t" COLORMAPFILE = "*.clr" }
129
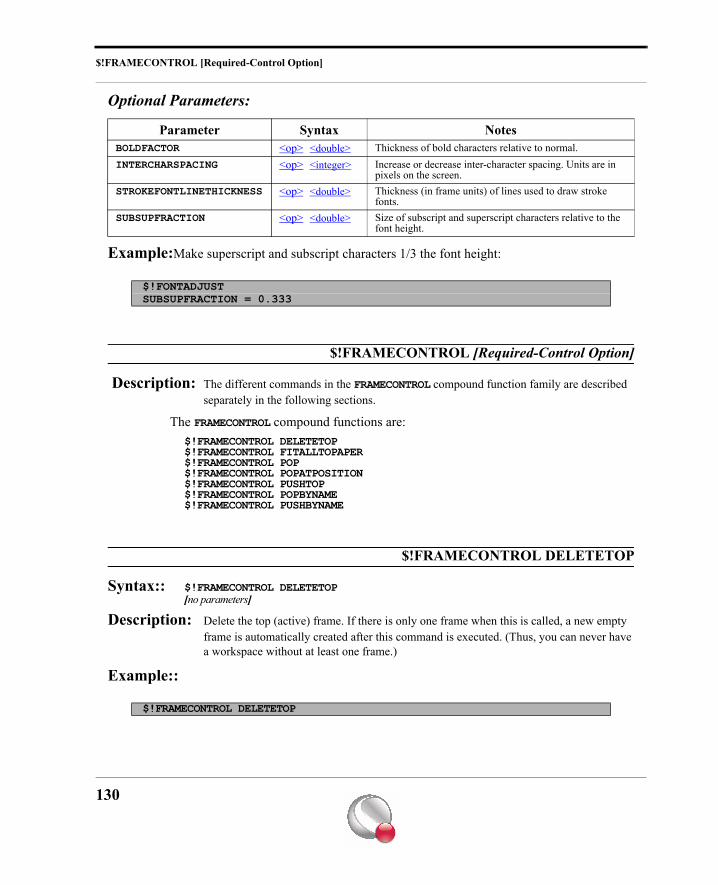
$!FRAMECONTROL [Required-Control Option]
Optional Parameters:
Example:Make superscript and subscript characters 1/3 the font height:
$!FRAMECONTROL [Required-Control Option]
Description: The different commands in the FRAMECONTROL compound function family are described separately in the following sections.
The FRAMECONTROL compound functions are:$!FRAMECONTROL DELETETOP$!FRAMECONTROL FITALLTOPAPER$!FRAMECONTROL POP$!FRAMECONTROL POPATPOSITION$!FRAMECONTROL PUSHTOP$!FRAMECONTROL POPBYNAME$!FRAMECONTROL PUSHBYNAME
$!FRAMECONTROL DELETETOP
Syntax:: $!FRAMECONTROL DELETETOP[no parameters]
Description: Delete the top (active) frame. If there is only one frame when this is called, a new empty frame is automatically created after this command is executed. (Thus, you can never have a workspace without at least one frame.)
Example::
Parameter Syntax NotesBOLDFACTOR <op> <double> Thickness of bold characters relative to normal.INTERCHARSPACING <op> <integer> Increase or decrease inter-character spacing. Units are in
pixels on the screen.STROKEFONTLINETHICKNESS <op> <double> Thickness (in frame units) of lines used to draw stroke
fonts.SUBSUPFRACTION <op> <double> Size of subscript and superscript characters relative to the
font height.
$!FONTADJUSTSUBSUPFRACTION = 0.333
$!FRAMECONTROL DELETETOP
130
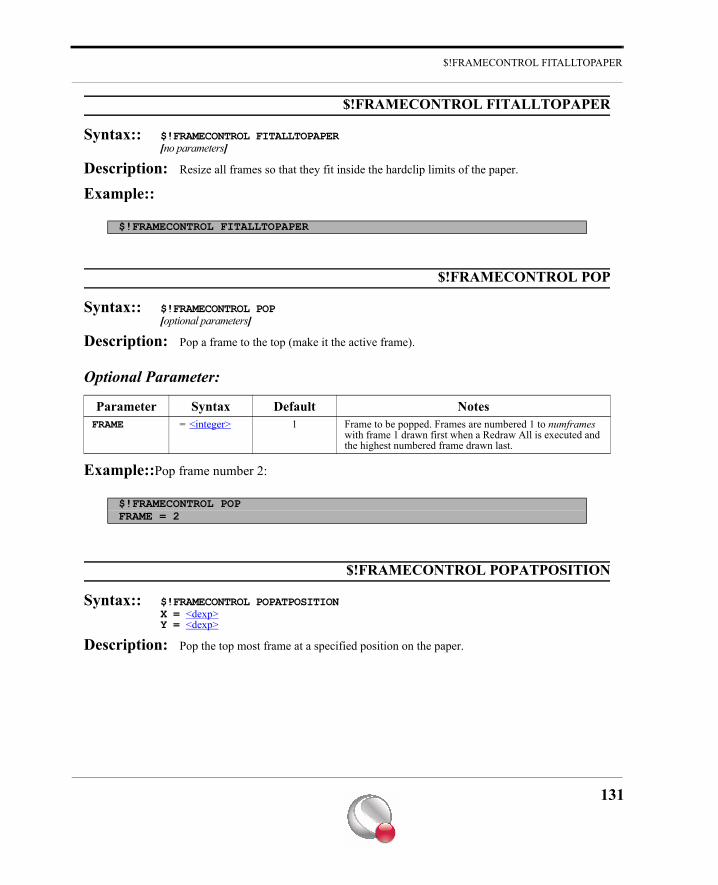
$!FRAMECONTROL FITALLTOPAPER
$!FRAMECONTROL FITALLTOPAPER
Syntax:: $!FRAMECONTROL FITALLTOPAPER[no parameters]
Description: Resize all frames so that they fit inside the hardclip limits of the paper.
Example::
$!FRAMECONTROL POP
Syntax:: $!FRAMECONTROL POP[optional parameters]
Description: Pop a frame to the top (make it the active frame).
Optional Parameter:
Example::Pop frame number 2:
$!FRAMECONTROL POPATPOSITION
Syntax:: $!FRAMECONTROL POPATPOSITIONX = <dexp>Y = <dexp>
Description: Pop the top most frame at a specified position on the paper.
$!FRAMECONTROL FITALLTOPAPER
Parameter Syntax Default NotesFRAME = <integer> 1 Frame to be popped. Frames are numbered 1 to numframes
with frame 1 drawn first when a Redraw All is executed and the highest numbered frame drawn last.
$!FRAMECONTROL POPFRAME = 2
131
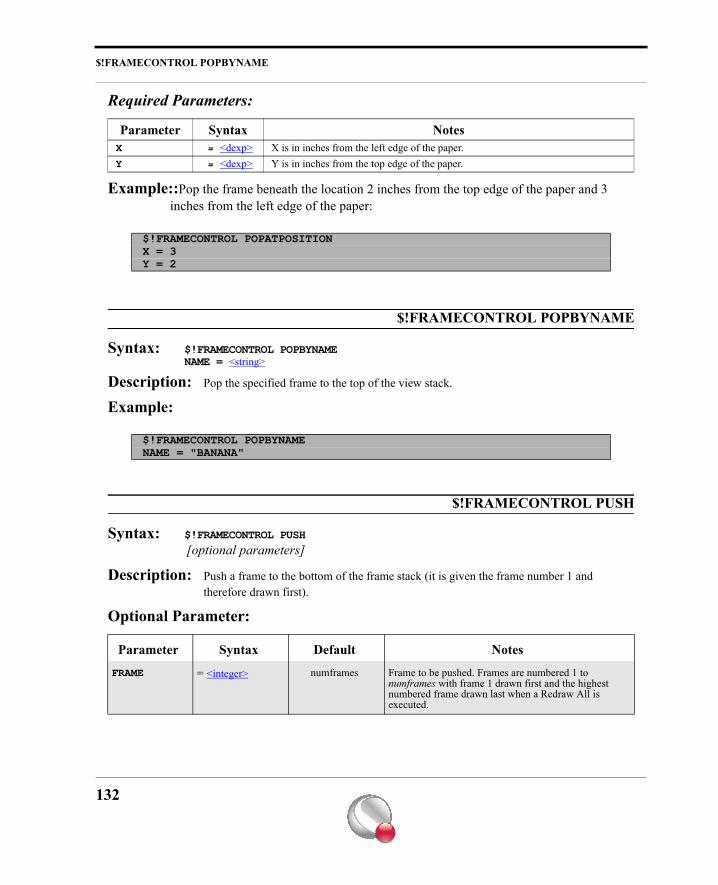
$!FRAMECONTROL POPBYNAME
Required Parameters:
Example::Pop the frame beneath the location 2 inches from the top edge of the paper and 3 inches from the left edge of the paper:
$!FRAMECONTROL POPBYNAME
Syntax: $!FRAMECONTROL POPBYNAMENAME = <string>
Description: Pop the specified frame to the top of the view stack.
Example:
$!FRAMECONTROL PUSH
Syntax: $!FRAMECONTROL PUSH [optional parameters]
Description: Push a frame to the bottom of the frame stack (it is given the frame number 1 and therefore drawn first).
Optional Parameter:
Parameter Syntax NotesX = <dexp> X is in inches from the left edge of the paper.Y = <dexp> Y is in inches from the top edge of the paper.
$!FRAMECONTROL POPATPOSITIONX = 3Y = 2
$!FRAMECONTROL POPBYNAMENAME = "BANANA"
Parameter Syntax Default Notes
FRAME = <integer> numframes Frame to be pushed. Frames are numbered 1 to numframes with frame 1 drawn first and the highest numbered frame drawn last when a Redraw All is executed.
132
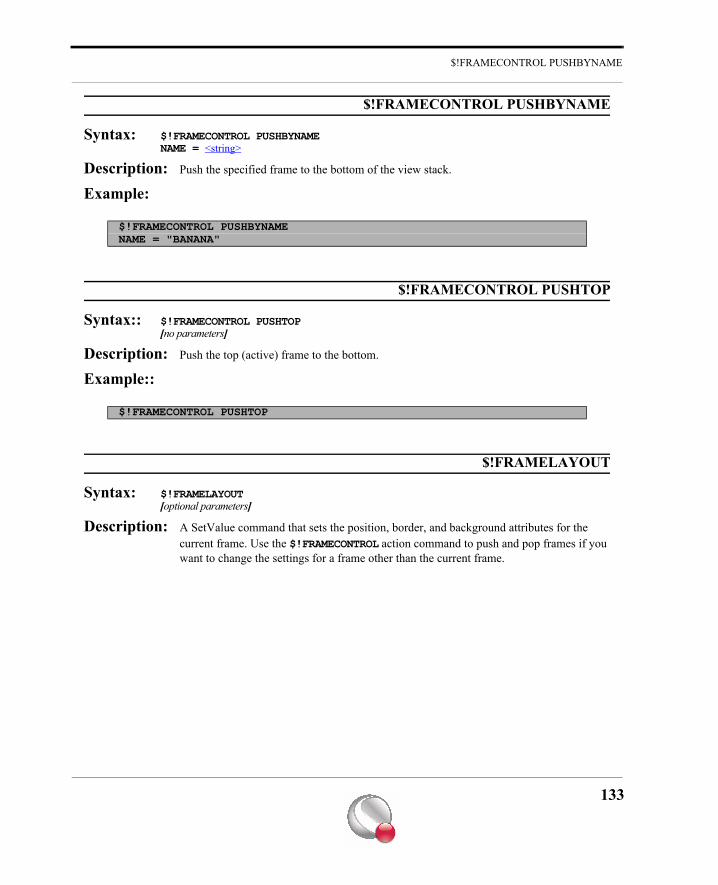
$!FRAMECONTROL PUSHBYNAME
$!FRAMECONTROL PUSHBYNAME
Syntax: $!FRAMECONTROL PUSHBYNAMENAME = <string>
Description: Push the specified frame to the bottom of the view stack.
Example:
$!FRAMECONTROL PUSHTOP
Syntax:: $!FRAMECONTROL PUSHTOP[no parameters]
Description: Push the top (active) frame to the bottom.
Example::
$!FRAMELAYOUT
Syntax: $!FRAMELAYOUT[optional parameters]
Description: A SetValue command that sets the position, border, and background attributes for the current frame. Use the $!FRAMECONTROL action command to push and pop frames if you want to change the settings for a frame other than the current frame.
$!FRAMECONTROL PUSHBYNAMENAME = "BANANA"
$!FRAMECONTROL PUSHTOP
133
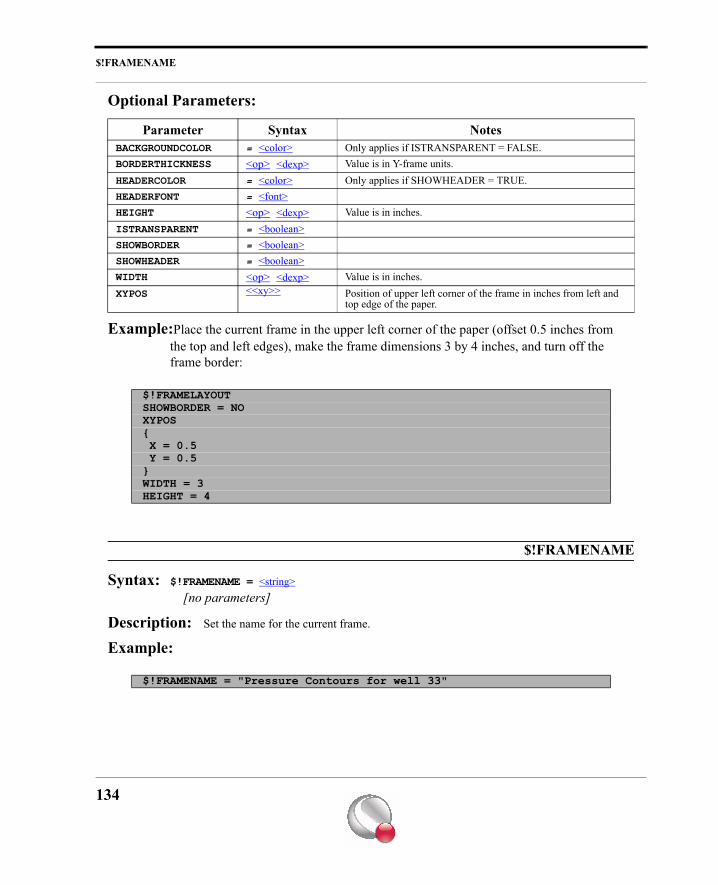
$!FRAMENAME
Optional Parameters:
Example:Place the current frame in the upper left corner of the paper (offset 0.5 inches from the top and left edges), make the frame dimensions 3 by 4 inches, and turn off the frame border:
$!FRAMENAME
Syntax: $!FRAMENAME = <string> [no parameters]
Description: Set the name for the current frame.
Example:
Parameter Syntax NotesBACKGROUNDCOLOR = <color> Only applies if ISTRANSPARENT = FALSE.BORDERTHICKNESS <op> <dexp> Value is in Y-frame units.HEADERCOLOR = <color> Only applies if SHOWHEADER = TRUE.HEADERFONT = <font>HEIGHT <op> <dexp> Value is in inches.ISTRANSPARENT = <boolean>SHOWBORDER = <boolean>SHOWHEADER = <boolean>WIDTH <op> <dexp> Value is in inches.XYPOS <<xy>> Position of upper left corner of the frame in inches from left and
top edge of the paper.
$!FRAMELAYOUTSHOWBORDER = NOXYPOS{ X = 0.5 Y = 0.5}WIDTH = 3 HEIGHT = 4
$!FRAMENAME = "Pressure Contours for well 33"
134
$!FRAMESETUP
$!FRAMESETUP
Syntax: $!FRAMESETUP
[optional parameters]
Description: A SetValue command that sets parameters used to preset dynamic frame attributes when a frame is initialized.
135
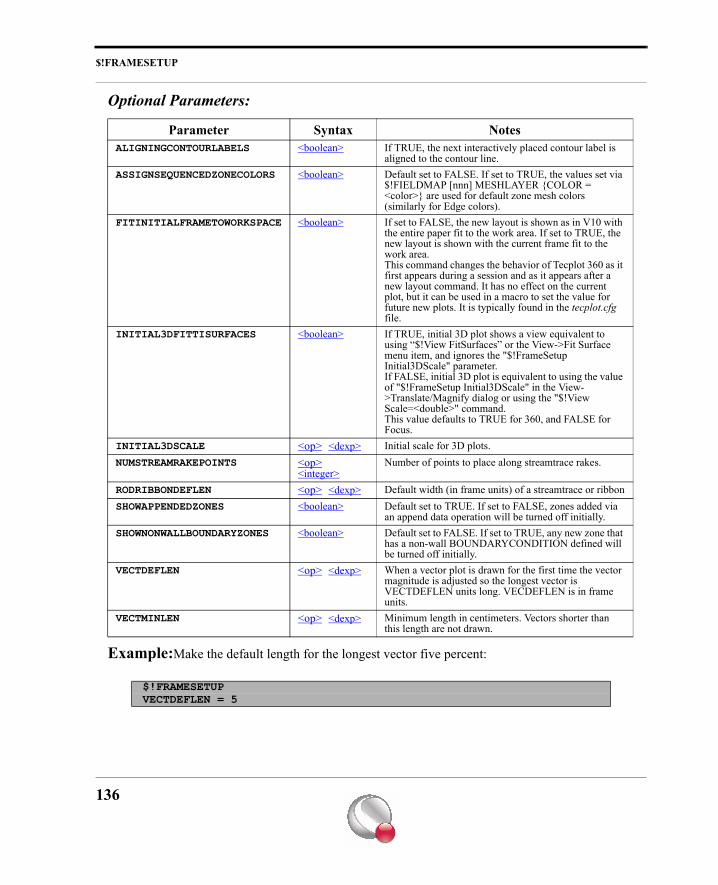
$!FRAMESETUP
Optional Parameters:
Example:Make the default length for the longest vector five percent:
Parameter Syntax NotesALIGNINGCONTOURLABELS <boolean> If TRUE, the next interactively placed contour label is
aligned to the contour line.ASSIGNSEQUENCEDZONECOLORS <boolean> Default set to FALSE. If set to TRUE, the values set via
$!FIELDMAP [nnn] MESHLAYER {COLOR = <color>} are used for default zone mesh colors (similarly for Edge colors).
FITINITIALFRAMETOWORKSPACE <boolean> If set to FALSE, the new layout is shown as in V10 with the entire paper fit to the work area. If set to TRUE, the new layout is shown with the current frame fit to the work area.This command changes the behavior of Tecplot 360 as it first appears during a session and as it appears after a new layout command. It has no effect on the current plot, but it can be used in a macro to set the value for future new plots. It is typically found in the tecplot.cfg file.
INITIAL3DFITTISURFACES <boolean> If TRUE, initial 3D plot shows a view equivalent to using “$!View FitSurfaces” or the View->Fit Surface menu item, and ignores the "$!FrameSetup Initial3DScale" parameter.If FALSE, initial 3D plot is equivalent to using the value of "$!FrameSetup Initial3DScale" in the View->Translate/Magnify dialog or using the "$!View Scale=<double>" command. This value defaults to TRUE for 360, and FALSE for Focus.
INITIAL3DSCALE <op> <dexp> Initial scale for 3D plots.NUMSTREAMRAKEPOINTS <op>
<integer>Number of points to place along streamtrace rakes.
RODRIBBONDEFLEN <op> <dexp> Default width (in frame units) of a streamtrace or ribbonSHOWAPPENDEDZONES <boolean> Default set to TRUE. If set to FALSE, zones added via
an append data operation will be turned off initially. SHOWNONWALLBOUNDARYZONES <boolean> Default set to FALSE. If set to TRUE, any new zone that
has a non-wall BOUNDARYCONDITION defined will be turned off initially.
VECTDEFLEN <op> <dexp> When a vector plot is drawn for the first time the vector magnitude is adjusted so the longest vector is VECTDEFLEN units long. VECDEFLEN is in frame units.
VECTMINLEN <op> <dexp> Minimum length in centimeters. Vectors shorter than this length are not drawn.
$!FRAMESETUPVECTDEFLEN = 5
136
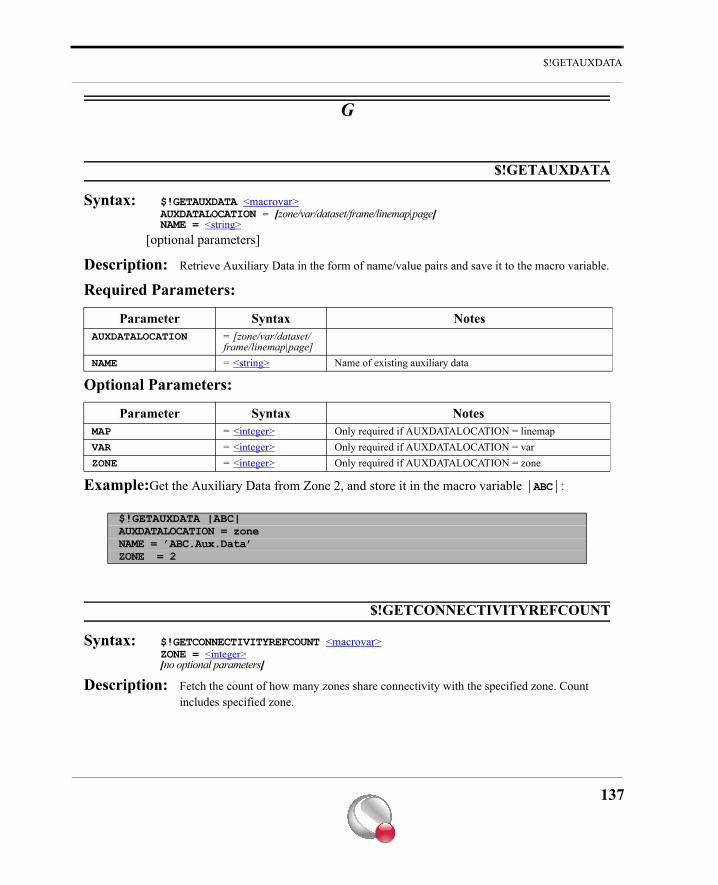
$!GETAUXDATA
G
$!GETAUXDATA
Syntax: $!GETAUXDATA <macrovar>AUXDATALOCATION = [zone/var/dataset/frame/linemap|page]NAME = <string>
[optional parameters]
Description: Retrieve Auxiliary Data in the form of name/value pairs and save it to the macro variable.
Required Parameters:
Optional Parameters:
Example:Get the Auxiliary Data from Zone 2, and store it in the macro variable |ABC|:
$!GETCONNECTIVITYREFCOUNT
Syntax: $!GETCONNECTIVITYREFCOUNT <macrovar>ZONE = <integer>[no optional parameters]
Description: Fetch the count of how many zones share connectivity with the specified zone. Count includes specified zone.
Parameter Syntax NotesAUXDATALOCATION = [zone/var/dataset/
frame/linemap|page]NAME = <string> Name of existing auxiliary data
Parameter Syntax NotesMAP = <integer> Only required if AUXDATALOCATION = linemapVAR = <integer> Only required if AUXDATALOCATION = varZONE = <integer> Only required if AUXDATALOCATION = zone
$!GETAUXDATA |ABC|AUXDATALOCATION = zoneNAME = ’ABC.Aux.Data’ZONE = 2
137
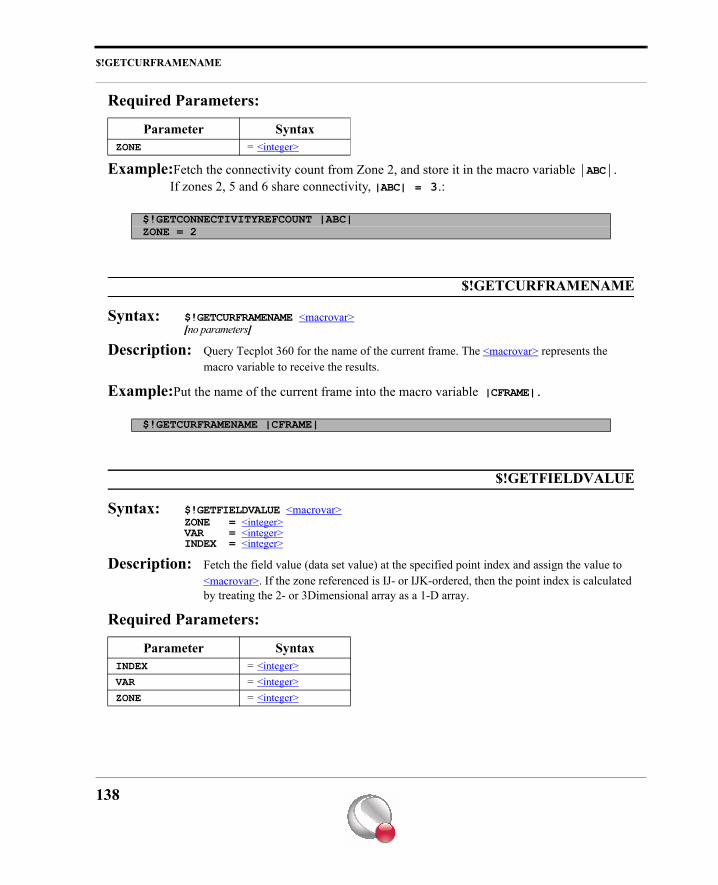
$!GETCURFRAMENAME
Required Parameters:
Example:Fetch the connectivity count from Zone 2, and store it in the macro variable |ABC|. If zones 2, 5 and 6 share connectivity, |ABC| = 3.:
$!GETCURFRAMENAME
Syntax: $!GETCURFRAMENAME <macrovar>[no parameters]
Description: Query Tecplot 360 for the name of the current frame. The <macrovar> represents the macro variable to receive the results.
Example:Put the name of the current frame into the macro variable |CFRAME|.
$!GETFIELDVALUE
Syntax: $!GETFIELDVALUE <macrovar>ZONE = <integer>VAR = <integer>INDEX = <integer>
Description: Fetch the field value (data set value) at the specified point index and assign the value to <macrovar>. If the zone referenced is IJ- or IJK-ordered, then the point index is calculated by treating the 2- or 3Dimensional array as a 1-D array.
Required Parameters:
Parameter SyntaxZONE = <integer>
$!GETCONNECTIVITYREFCOUNT |ABC|ZONE = 2
$!GETCURFRAMENAME |CFRAME|
Parameter SyntaxINDEX = <integer>VAR = <integer>ZONE = <integer>
138
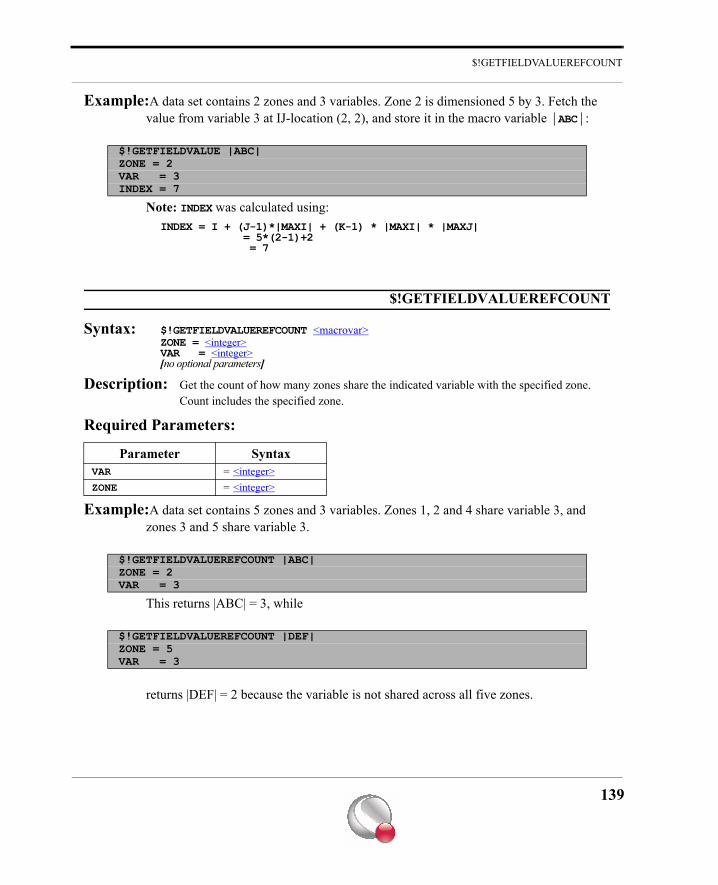
$!GETFIELDVALUEREFCOUNT
Example:A data set contains 2 zones and 3 variables. Zone 2 is dimensioned 5 by 3. Fetch the value from variable 3 at IJ-location (2, 2), and store it in the macro variable |ABC|:
Note: INDEX was calculated using:INDEX = I + (J-1)*|MAXI| + (K-1) * |MAXI| * |MAXJ| = 5*(2-1)+2 = 7
$!GETFIELDVALUEREFCOUNT
Syntax: $!GETFIELDVALUEREFCOUNT <macrovar>ZONE = <integer>VAR = <integer>[no optional parameters]
Description: Get the count of how many zones share the indicated variable with the specified zone. Count includes the specified zone.
Required Parameters:
Example:A data set contains 5 zones and 3 variables. Zones 1, 2 and 4 share variable 3, and zones 3 and 5 share variable 3.
This returns |ABC| = 3, while
returns |DEF| = 2 because the variable is not shared across all five zones.
$!GETFIELDVALUE |ABC|ZONE = 2VAR = 3INDEX = 7
Parameter SyntaxVAR = <integer>ZONE = <integer>
$!GETFIELDVALUEREFCOUNT |ABC|ZONE = 2VAR = 3
$!GETFIELDVALUEREFCOUNT |DEF|ZONE = 5VAR = 3
139
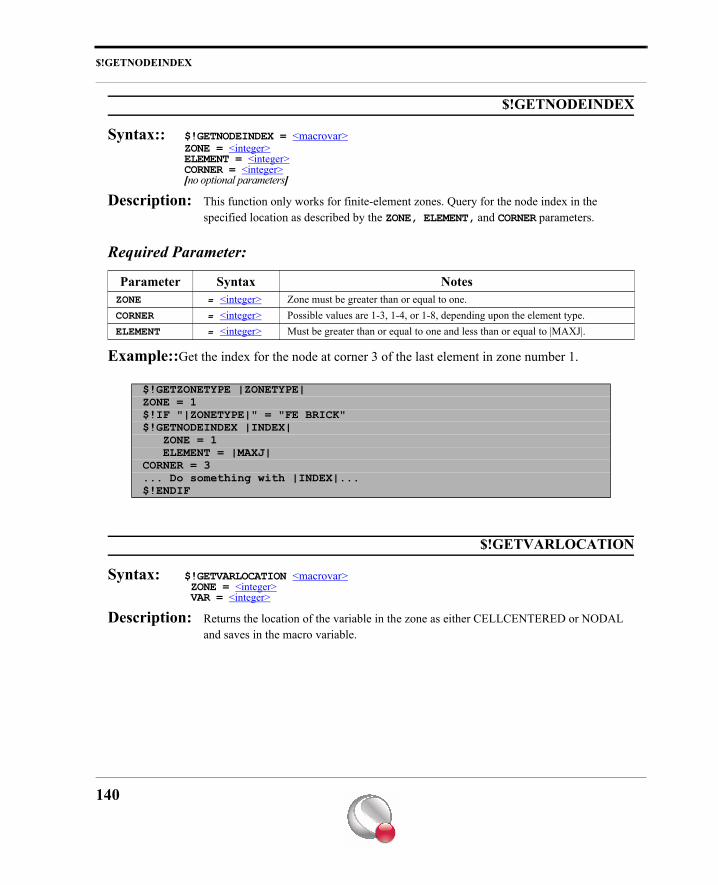
$!GETNODEINDEX
$!GETNODEINDEX
Syntax:: $!GETNODEINDEX = <macrovar>ZONE = <integer>ELEMENT = <integer>CORNER = <integer>[no optional parameters]
Description: This function only works for finite-element zones. Query for the node index in the specified location as described by the ZONE, ELEMENT, and CORNER parameters.
Required Parameter:
Example::Get the index for the node at corner 3 of the last element in zone number 1.
$!GETVARLOCATION
Syntax: $!GETVARLOCATION <macrovar> ZONE = <integer> VAR = <integer>
Description: Returns the location of the variable in the zone as either CELLCENTERED or NODAL and saves in the macro variable.
Parameter Syntax NotesZONE = <integer> Zone must be greater than or equal to one.CORNER = <integer> Possible values are 1-3, 1-4, or 1-8, depending upon the element type.ELEMENT = <integer> Must be greater than or equal to one and less than or equal to |MAXJ|.
$!GETZONETYPE |ZONETYPE|ZONE = 1$!IF "|ZONETYPE|" = "FE BRICK"$!GETNODEINDEX |INDEX| ZONE = 1 ELEMENT = |MAXJ|CORNER = 3... Do something with |INDEX|...$!ENDIF
140
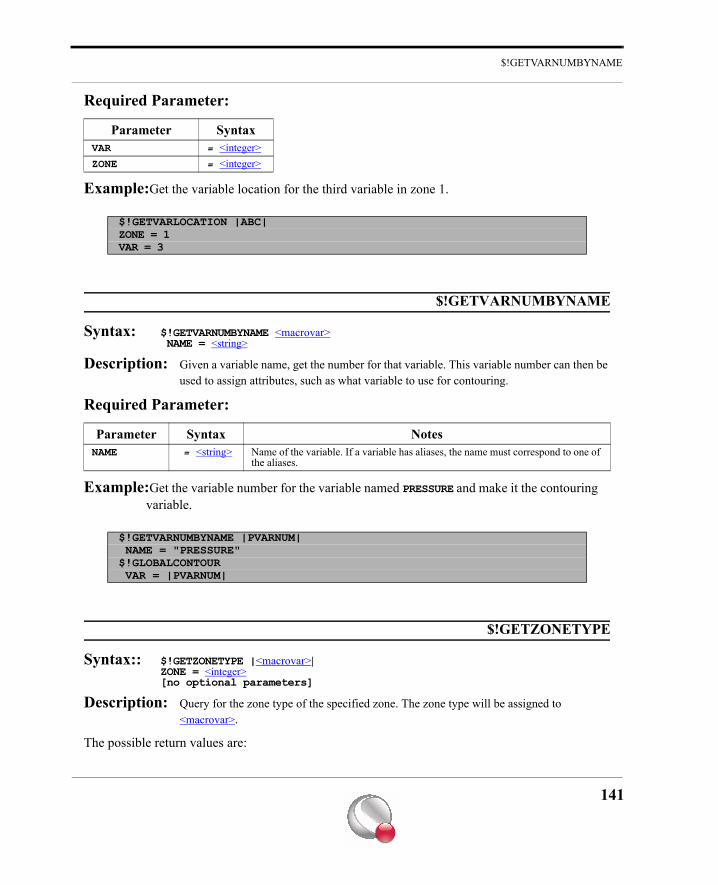
$!GETVARNUMBYNAME
Required Parameter:
Example:Get the variable location for the third variable in zone 1.
$!GETVARNUMBYNAME
Syntax: $!GETVARNUMBYNAME <macrovar> NAME = <string>
Description: Given a variable name, get the number for that variable. This variable number can then be used to assign attributes, such as what variable to use for contouring.
Required Parameter:
Example:Get the variable number for the variable named PRESSURE and make it the contouring variable.
$!GETZONETYPE
Syntax:: $!GETZONETYPE |<macrovar>|ZONE = <integer>[no optional parameters]
Description: Query for the zone type of the specified zone. The zone type will be assigned to <macrovar>.
The possible return values are:
Parameter SyntaxVAR = <integer>ZONE = <integer>
$!GETVARLOCATION |ABC|ZONE = 1VAR = 3
Parameter Syntax NotesNAME = <string> Name of the variable. If a variable has aliases, the name must correspond to one of
the aliases.
$!GETVARNUMBYNAME |PVARNUM| NAME = "PRESSURE"$!GLOBALCONTOUR VAR = |PVARNUM|
141
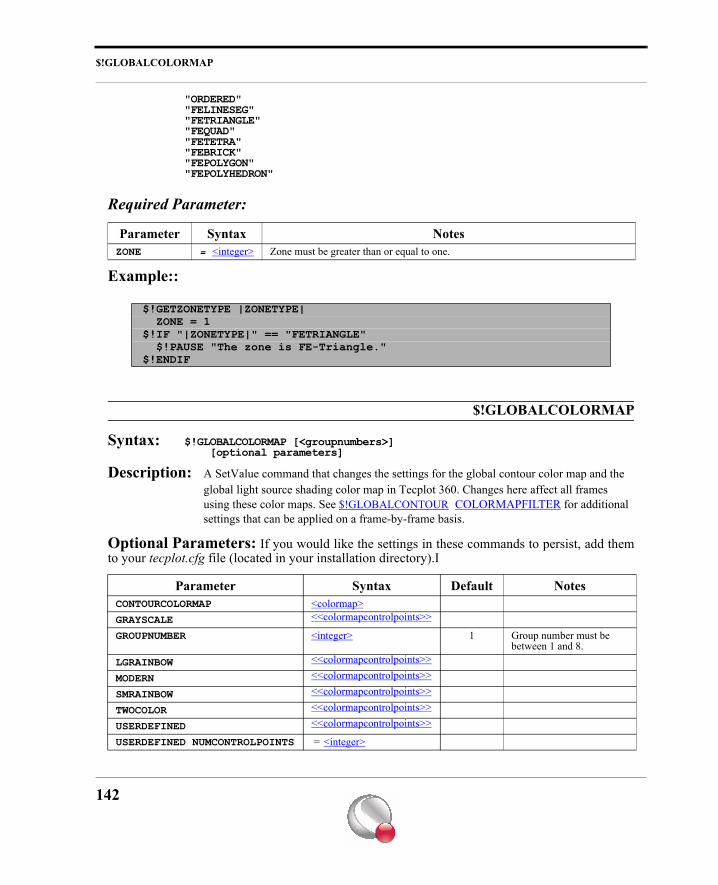
$!GLOBALCOLORMAP
"ORDERED""FELINESEG""FETRIANGLE""FEQUAD""FETETRA""FEBRICK""FEPOLYGON""FEPOLYHEDRON"
Required Parameter:
Example::
$!GLOBALCOLORMAP
Syntax: $!GLOBALCOLORMAP [<groupnumbers>] [optional parameters]
Description: A SetValue command that changes the settings for the global contour color map and the global light source shading color map in Tecplot 360. Changes here affect all frames using these color maps. See $!GLOBALCONTOUR COLORMAPFILTER for additional settings that can be applied on a frame-by-frame basis.
Optional Parameters: If you would like the settings in these commands to persist, add themto your tecplot.cfg file (located in your installation directory).I
Parameter Syntax NotesZONE = <integer> Zone must be greater than or equal to one.
$!GETZONETYPE |ZONETYPE| ZONE = 1$!IF "|ZONETYPE|" == "FETRIANGLE" $!PAUSE "The zone is FE-Triangle."$!ENDIF
Parameter Syntax Default NotesCONTOURCOLORMAP <colormap>GRAYSCALE <<colormapcontrolpoints>>
GROUPNUMBER <integer> 1 Group number must be between 1 and 8.
LGRAINBOW <<colormapcontrolpoints>>
MODERN <<colormapcontrolpoints>>
SMRAINBOW <<colormapcontrolpoints>>
TWOCOLOR <<colormapcontrolpoints>>
USERDEFINED <<colormapcontrolpoints>>
USERDEFINED NUMCONTROLPOINTS = <integer>
142
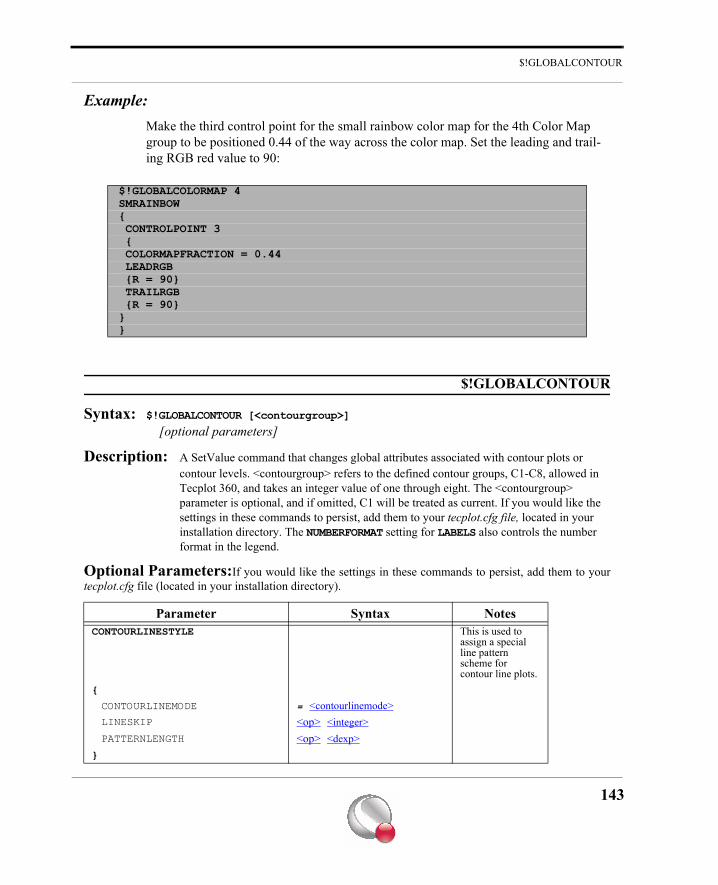
$!GLOBALCONTOUR
Example:Make the third control point for the small rainbow color map for the 4th Color Map group to be positioned 0.44 of the way across the color map. Set the leading and trail-ing RGB red value to 90:
$!GLOBALCONTOUR
Syntax: $!GLOBALCONTOUR [<contourgroup>]
[optional parameters]
Description: A SetValue command that changes global attributes associated with contour plots or contour levels. <contourgroup> refers to the defined contour groups, C1-C8, allowed in Tecplot 360, and takes an integer value of one through eight. The <contourgroup> parameter is optional, and if omitted, C1 will be treated as current. If you would like the settings in these commands to persist, add them to your tecplot.cfg file, located in your installation directory. The NUMBERFORMAT setting for LABELS also controls the number format in the legend.
Optional Parameters:If you would like the settings in these commands to persist, add them to yourtecplot.cfg file (located in your installation directory).
$!GLOBALCOLORMAP 4SMRAINBOW{ CONTROLPOINT 3 { COLORMAPFRACTION = 0.44 LEADRGB {R = 90} TRAILRGB {R = 90}}}
Parameter Syntax NotesCONTOURLINESTYLE This is used to
assign a special line pattern scheme for contour line plots.
{
CONTOURLINEMODE = <contourlinemode>LINESKIP <op> <integer>PATTERNLENGTH <op> <dexp>
}
143
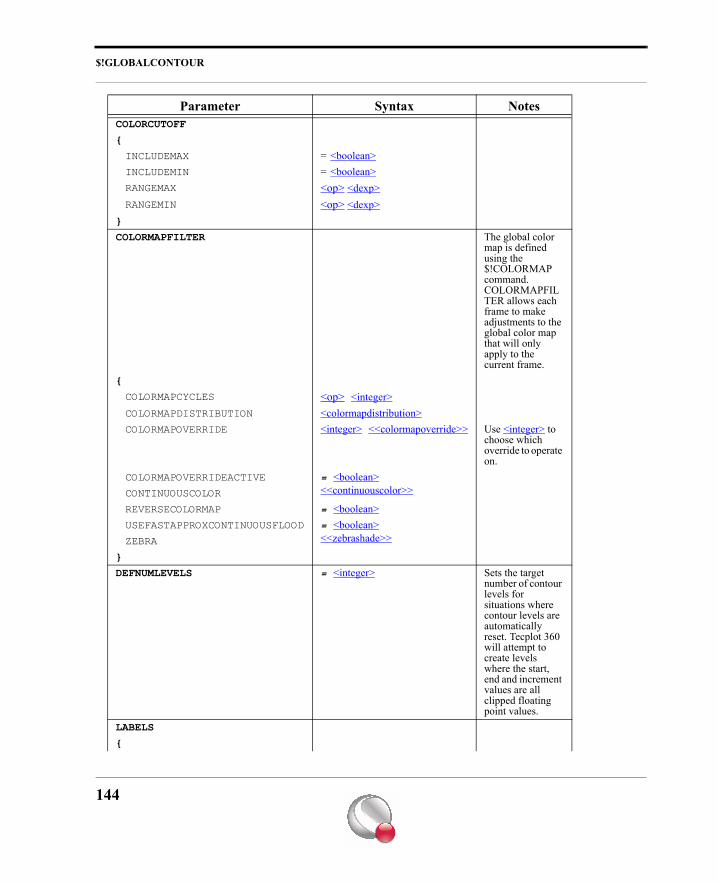
$!GLOBALCONTOUR
COLORCUTOFF
{
INCLUDEMAX = <boolean>INCLUDEMIN = <boolean>RANGEMAX <op> <dexp>RANGEMIN <op> <dexp>
}
COLORMAPFILTER The global color map is defined using the $!COLORMAP command. COLORMAPFILTER allows each frame to make adjustments to the global color map that will only apply to the current frame.
{
COLORMAPCYCLES <op> <integer>COLORMAPDISTRIBUTION <colormapdistribution>COLORMAPOVERRIDE <integer> <<colormapoverride>> Use <integer> to
choose which override to operate on.
COLORMAPOVERRIDEACTIVE = <boolean>CONTINUOUSCOLOR <<continuouscolor>>
REVERSECOLORMAP = <boolean>USEFASTAPPROXCONTINUOUSFLOOD = <boolean>ZEBRA <<zebrashade>>
}
DEFNUMLEVELS = <integer> Sets the target number of contour levels for situations where contour levels are automatically reset. Tecplot 360 will attempt to create levels where the start, end and increment values are all clipped floating point values.
LABELS
{
Parameter Syntax Notes
144
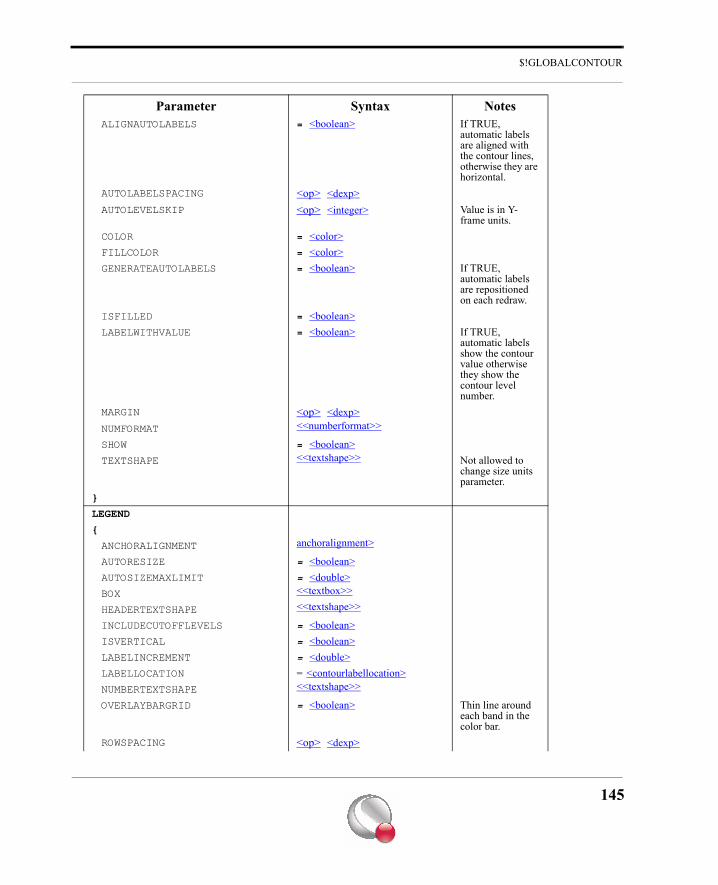
$!GLOBALCONTOUR
ALIGNAUTOLABELS = <boolean> If TRUE, automatic labels are aligned with the contour lines, otherwise they are horizontal.
AUTOLABELSPACING <op> <dexp>AUTOLEVELSKIP <op> <integer> Value is in Y-
frame units.COLOR = <color>FILLCOLOR = <color>GENERATEAUTOLABELS = <boolean> If TRUE,
automatic labels are repositioned on each redraw.
ISFILLED = <boolean>LABELWITHVALUE = <boolean> If TRUE,
automatic labels show the contour value otherwise they show the contour level number.
MARGIN <op> <dexp>NUMFORMAT <<numberformat>>
SHOW = <boolean>TEXTSHAPE <<textshape>> Not allowed to
change size units parameter.
}
LEGEND
{
ANCHORALIGNMENT anchoralignment>
AUTORESIZE = <boolean>AUTOSIZEMAXLIMIT = <double>BOX <<textbox>>
HEADERTEXTSHAPE <<textshape>>
INCLUDECUTOFFLEVELS = <boolean>ISVERTICAL = <boolean>LABELINCREMENT = <double>LABELLOCATION = <contourlabellocation>NUMBERTEXTSHAPE <<textshape>>
OVERLAYBARGRID = <boolean> Thin line around each band in the color bar.
ROWSPACING <op> <dexp>
Parameter Syntax Notes
145
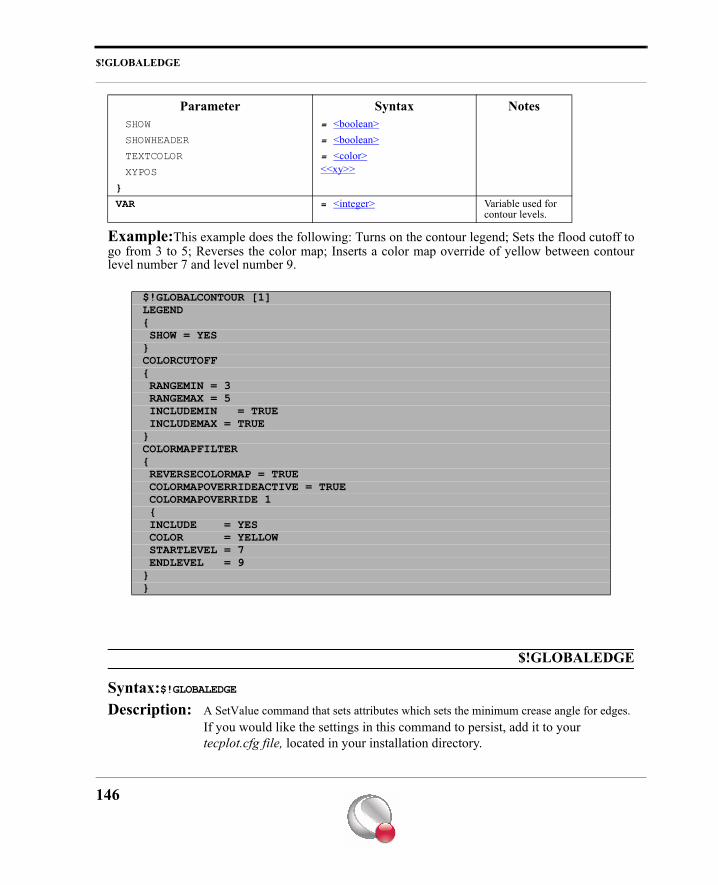
$!GLOBALEDGE
Example:This example does the following: Turns on the contour legend; Sets the flood cutoff togo from 3 to 5; Reverses the color map; Inserts a color map override of yellow between contourlevel number 7 and level number 9.
$!GLOBALEDGE
Syntax:$!GLOBALEDGEDescription: A SetValue command that sets attributes which sets the minimum crease angle for edges.
If you would like the settings in this command to persist, add it to your tecplot.cfg file, located in your installation directory.
SHOW = <boolean>SHOWHEADER = <boolean>TEXTCOLOR = <color>XYPOS <<xy>>
}
VAR = <integer> Variable used for contour levels.
$!GLOBALCONTOUR [1]LEGEND{ SHOW = YES}COLORCUTOFF{ RANGEMIN = 3 RANGEMAX = 5 INCLUDEMIN = TRUE INCLUDEMAX = TRUE}COLORMAPFILTER{ REVERSECOLORMAP = TRUE COLORMAPOVERRIDEACTIVE = TRUE COLORMAPOVERRIDE 1 { INCLUDE = YES COLOR = YELLOW STARTLEVEL = 7 ENDLEVEL = 9}}
Parameter Syntax Notes
146
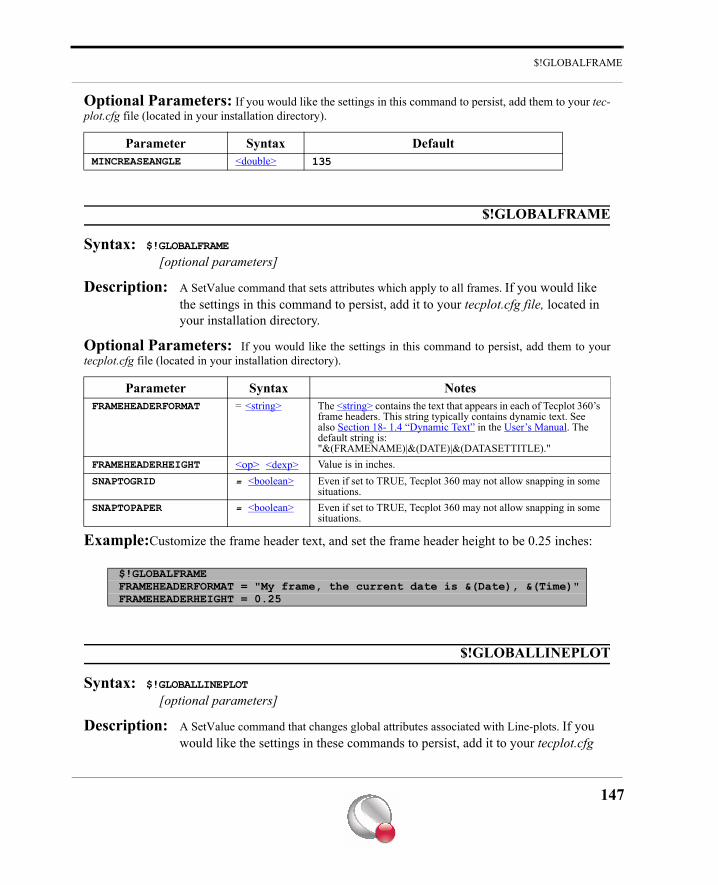
$!GLOBALFRAME
Optional Parameters: If you would like the settings in this command to persist, add them to your tec-plot.cfg file (located in your installation directory).
$!GLOBALFRAME
Syntax: $!GLOBALFRAME
[optional parameters]
Description: A SetValue command that sets attributes which apply to all frames. If you would like the settings in this command to persist, add it to your tecplot.cfg file, located in your installation directory.
Optional Parameters: If you would like the settings in this command to persist, add them to yourtecplot.cfg file (located in your installation directory).
Example:Customize the frame header text, and set the frame header height to be 0.25 inches:
$!GLOBALLINEPLOT
Syntax: $!GLOBALLINEPLOT
[optional parameters]
Description: A SetValue command that changes global attributes associated with Line-plots. If you would like the settings in these commands to persist, add it to your tecplot.cfg
Parameter Syntax DefaultMINCREASEANGLE <double> 135
Parameter Syntax NotesFRAMEHEADERFORMAT = <string> The <string> contains the text that appears in each of Tecplot 360’s
frame headers. This string typically contains dynamic text. See also Section 18- 1.4 “Dynamic Text” in the User’s Manual. The default string is:"&(FRAMENAME)|&(DATE)|&(DATASETTITLE)."
FRAMEHEADERHEIGHT <op> <dexp> Value is in inches.SNAPTOGRID = <boolean> Even if set to TRUE, Tecplot 360 may not allow snapping in some
situations.SNAPTOPAPER = <boolean> Even if set to TRUE, Tecplot 360 may not allow snapping in some
situations.
$!GLOBALFRAMEFRAMEHEADERFORMAT = "My frame, the current date is &(Date), &(Time)"FRAMEHEADERHEIGHT = 0.25
147
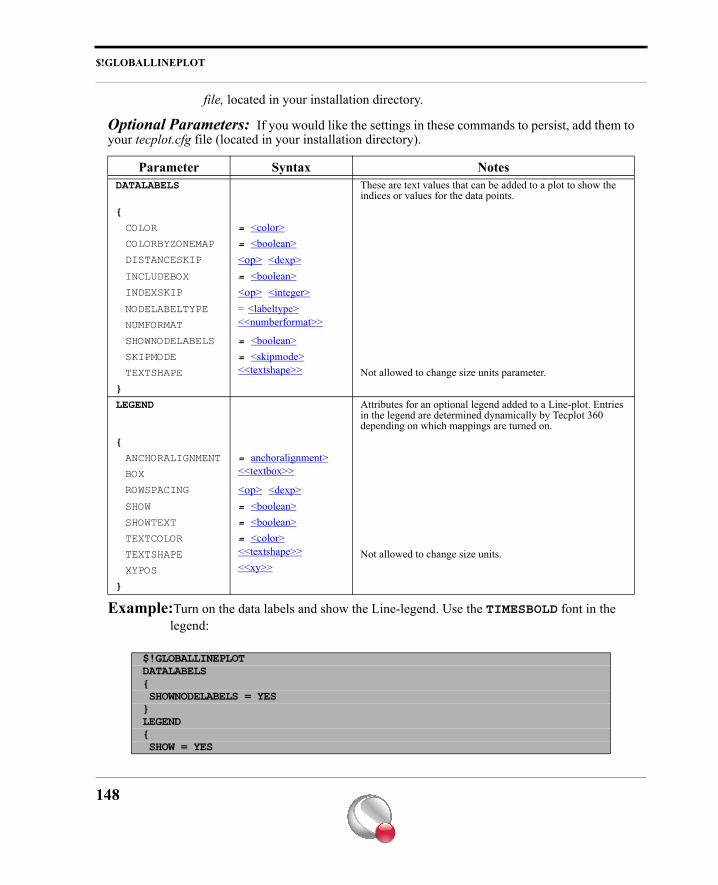
$!GLOBALLINEPLOT
file, located in your installation directory.
Optional Parameters: If you would like the settings in these commands to persist, add them toyour tecplot.cfg file (located in your installation directory).
Example:Turn on the data labels and show the Line-legend. Use the TIMESBOLD font in the legend:
Parameter Syntax NotesDATALABELS These are text values that can be added to a plot to show the
indices or values for the data points.{
COLOR = <color>COLORBYZONEMAP = <boolean>DISTANCESKIP <op> <dexp>INCLUDEBOX = <boolean>INDEXSKIP <op> <integer>NODELABELTYPE = <labeltype>NUMFORMAT <<numberformat>>
SHOWNODELABELS = <boolean>SKIPMODE = <skipmode>TEXTSHAPE <<textshape>> Not allowed to change size units parameter.
}
LEGEND Attributes for an optional legend added to a Line-plot. Entries in the legend are determined dynamically by Tecplot 360 depending on which mappings are turned on.
{
ANCHORALIGNMENT = anchoralignment>BOX <<textbox>>
ROWSPACING <op> <dexp>SHOW = <boolean>SHOWTEXT = <boolean>TEXTCOLOR = <color>TEXTSHAPE <<textshape>> Not allowed to change size units.XYPOS <<xy>>
}
$!GLOBALLINEPLOTDATALABELS{ SHOWNODELABELS = YES}LEGEND{ SHOW = YES
148
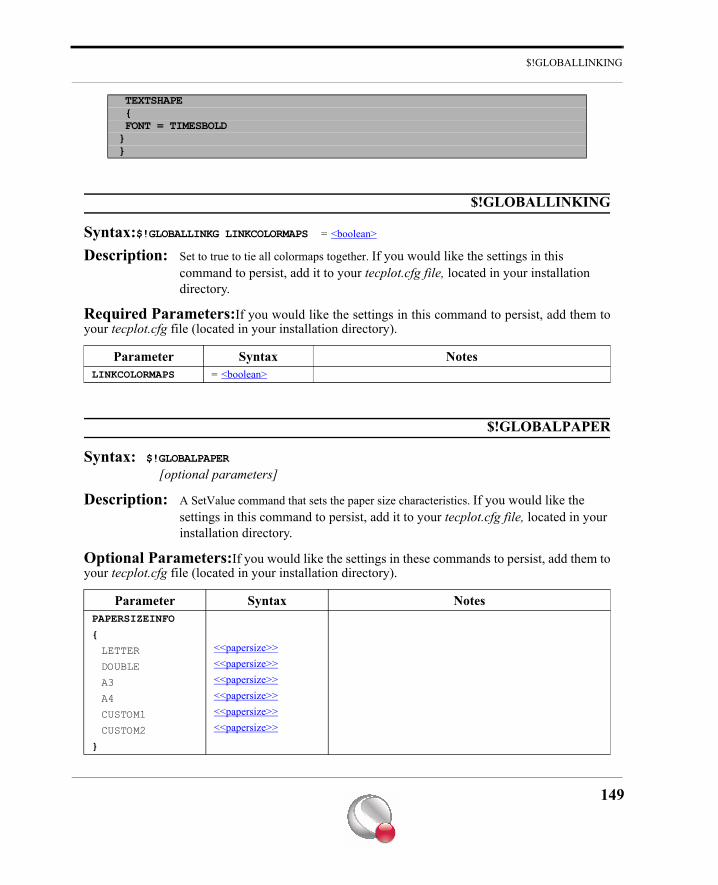
$!GLOBALLINKING
$!GLOBALLINKING
Syntax:$!GLOBALLINKG LINKCOLORMAPS = <boolean>
Description: Set to true to tie all colormaps together. If you would like the settings in this command to persist, add it to your tecplot.cfg file, located in your installation directory.
Required Parameters:If you would like the settings in this command to persist, add them toyour tecplot.cfg file (located in your installation directory).
$!GLOBALPAPER
Syntax: $!GLOBALPAPER
[optional parameters]
Description: A SetValue command that sets the paper size characteristics. If you would like the settings in this command to persist, add it to your tecplot.cfg file, located in your installation directory.
Optional Parameters:If you would like the settings in these commands to persist, add them toyour tecplot.cfg file (located in your installation directory).
TEXTSHAPE { FONT = TIMESBOLD}}
Parameter Syntax NotesLINKCOLORMAPS = <boolean>
Parameter Syntax NotesPAPERSIZEINFO
{
LETTER <<papersize>>
DOUBLE <<papersize>>
A3 <<papersize>>
A4 <<papersize>>
CUSTOM1 <<papersize>>
CUSTOM2 <<papersize>>
}
149
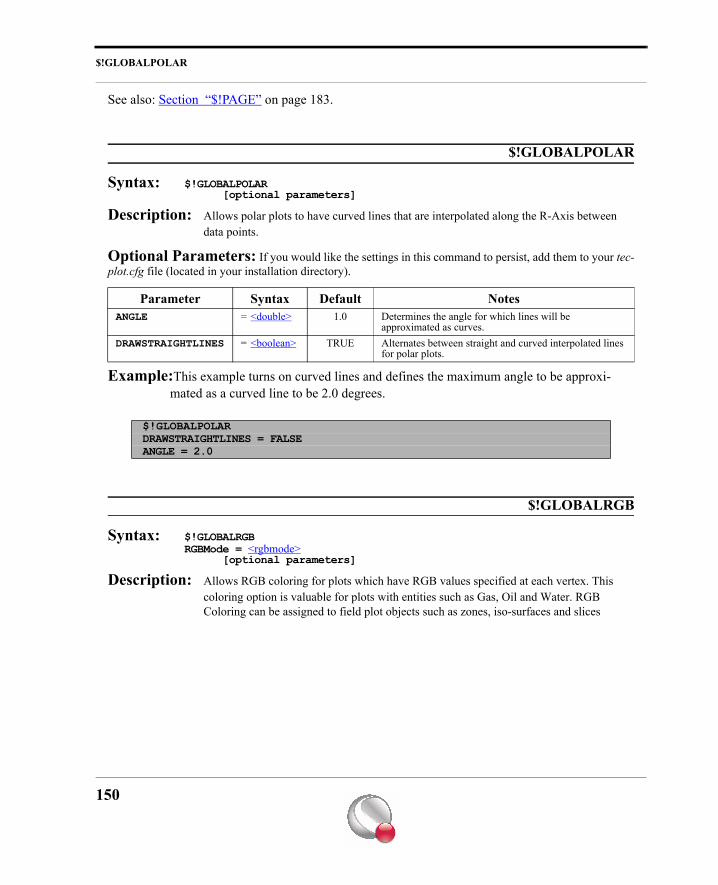
$!GLOBALPOLAR
See also: Section “$!PAGE” on page 183.
$!GLOBALPOLAR
Syntax: $!GLOBALPOLAR [optional parameters]
Description: Allows polar plots to have curved lines that are interpolated along the R-Axis between data points.
Optional Parameters: If you would like the settings in this command to persist, add them to your tec-plot.cfg file (located in your installation directory).
Example:This example turns on curved lines and defines the maximum angle to be approxi-mated as a curved line to be 2.0 degrees.
$!GLOBALRGB
Syntax: $!GLOBALRGBRGBMode = <rgbmode> [optional parameters]
Description: Allows RGB coloring for plots which have RGB values specified at each vertex. This coloring option is valuable for plots with entities such as Gas, Oil and Water. RGB Coloring can be assigned to field plot objects such as zones, iso-surfaces and slices
Parameter Syntax Default NotesANGLE = <double> 1.0 Determines the angle for which lines will be
approximated as curves.DRAWSTRAIGHTLINES = <boolean> TRUE Alternates between straight and curved interpolated lines
for polar plots.
$!GLOBALPOLARDRAWSTRAIGHTLINES = FALSEANGLE = 2.0
150
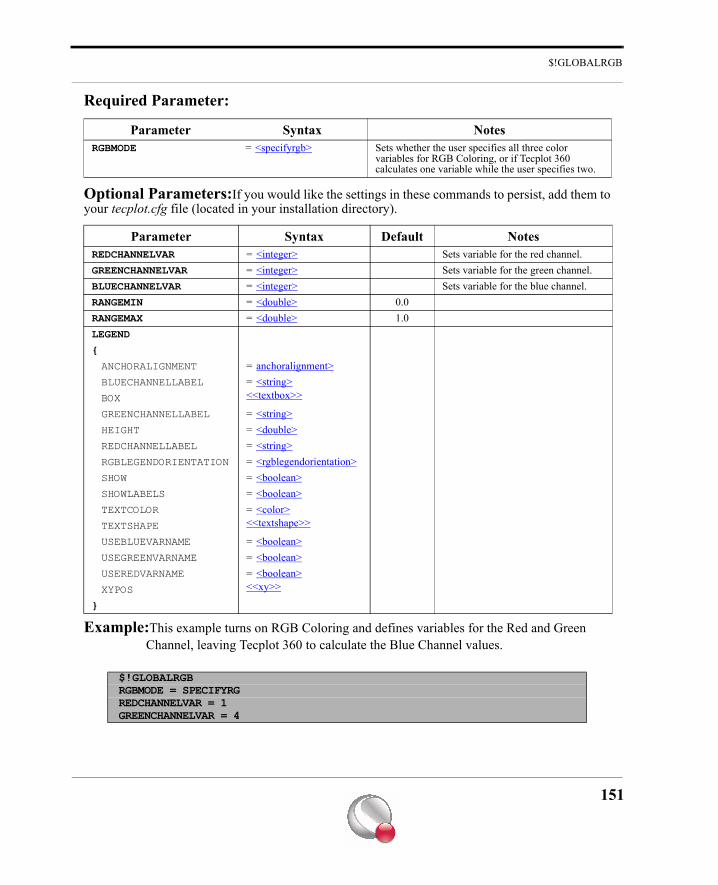
$!GLOBALRGB
Required Parameter:
Optional Parameters:If you would like the settings in these commands to persist, add them toyour tecplot.cfg file (located in your installation directory).
Example:This example turns on RGB Coloring and defines variables for the Red and Green Channel, leaving Tecplot 360 to calculate the Blue Channel values.
Parameter Syntax NotesRGBMODE = <specifyrgb> Sets whether the user specifies all three color
variables for RGB Coloring, or if Tecplot 360 calculates one variable while the user specifies two.
Parameter Syntax Default NotesREDCHANNELVAR = <integer> Sets variable for the red channel. GREENCHANNELVAR = <integer> Sets variable for the green channel. BLUECHANNELVAR = <integer> Sets variable for the blue channel. RANGEMIN = <double> 0.0RANGEMAX = <double> 1.0LEGEND
{
ANCHORALIGNMENT = anchoralignment>BLUECHANNELLABEL = <string>BOX <<textbox>>
GREENCHANNELLABEL = <string>HEIGHT = <double>REDCHANNELLABEL = <string>RGBLEGENDORIENTATION = <rgblegendorientation>SHOW = <boolean>SHOWLABELS = <boolean>TEXTCOLOR = <color>TEXTSHAPE <<textshape>>
USEBLUEVARNAME = <boolean>USEGREENVARNAME = <boolean>USEREDVARNAME = <boolean>XYPOS <<xy>>
}
$!GLOBALRGBRGBMODE = SPECIFYRGREDCHANNELVAR = 1GREENCHANNELVAR = 4
151
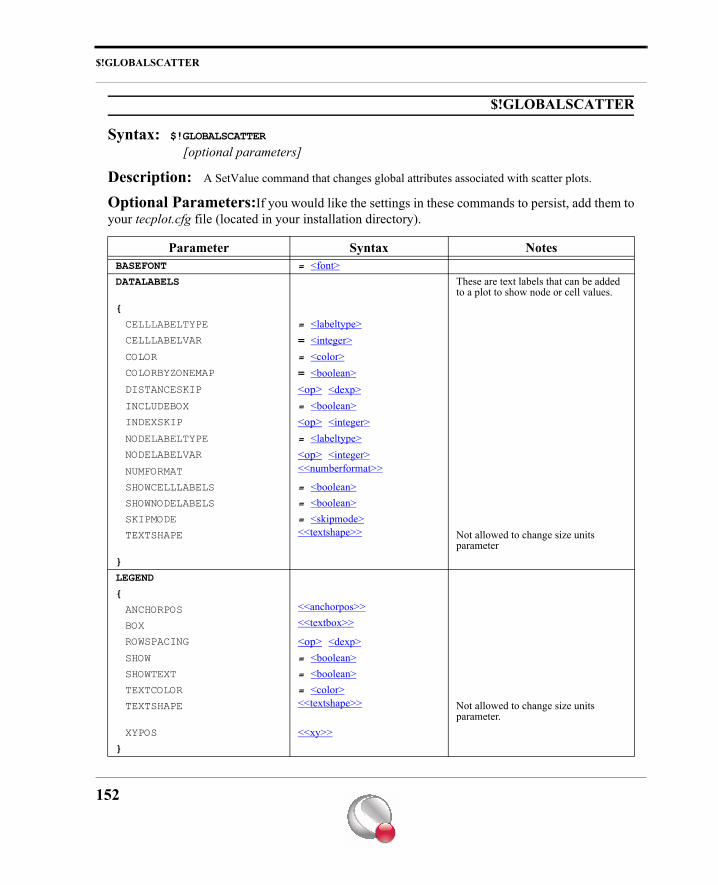
$!GLOBALSCATTER
$!GLOBALSCATTER
Syntax: $!GLOBALSCATTER
[optional parameters]
Description: A SetValue command that changes global attributes associated with scatter plots.
Optional Parameters:If you would like the settings in these commands to persist, add them toyour tecplot.cfg file (located in your installation directory).
Parameter Syntax NotesBASEFONT = <font>DATALABELS These are text labels that can be added
to a plot to show node or cell values.{
CELLLABELTYPE = <labeltype>CELLLABELVAR = <integer>COLOR = <color>COLORBYZONEMAP = <boolean>DISTANCESKIP <op> <dexp>INCLUDEBOX = <boolean>INDEXSKIP <op> <integer>NODELABELTYPE = <labeltype>NODELABELVAR <op> <integer>NUMFORMAT <<numberformat>>
SHOWCELLLABELS = <boolean>SHOWNODELABELS = <boolean>SKIPMODE = <skipmode>TEXTSHAPE <<textshape>> Not allowed to change size units
parameter}
LEGEND
{
ANCHORPOS <<anchorpos>>
BOX <<textbox>>
ROWSPACING <op> <dexp>SHOW = <boolean>SHOWTEXT = <boolean>TEXTCOLOR = <color>TEXTSHAPE <<textshape>> Not allowed to change size units
parameter.XYPOS <<xy>>
}
152
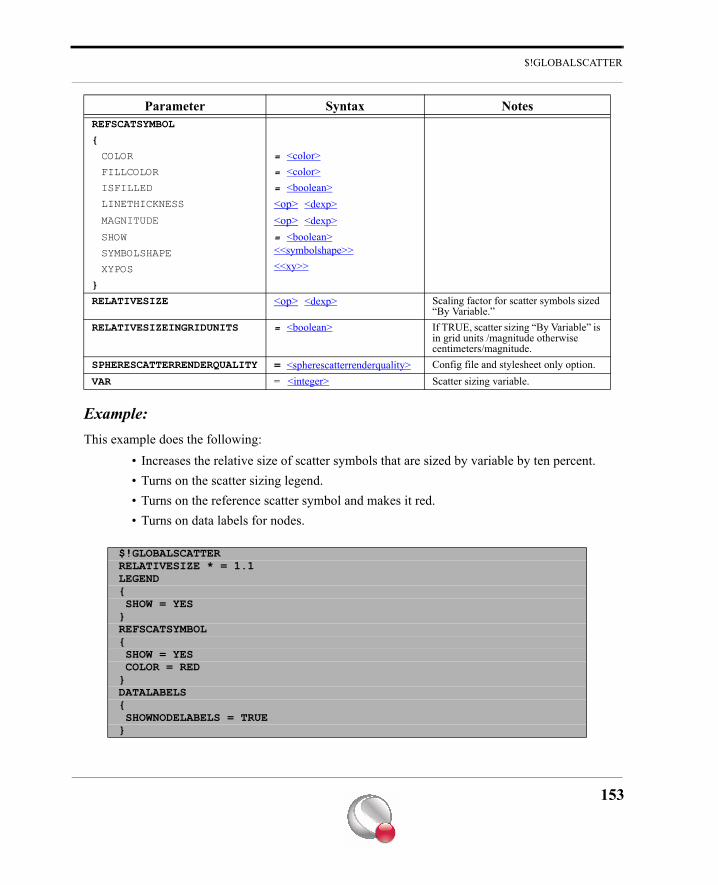
$!GLOBALSCATTER
Example:This example does the following:
• Increases the relative size of scatter symbols that are sized by variable by ten percent.• Turns on the scatter sizing legend.• Turns on the reference scatter symbol and makes it red.• Turns on data labels for nodes.
REFSCATSYMBOL
{
COLOR = <color>FILLCOLOR = <color>ISFILLED = <boolean>LINETHICKNESS <op> <dexp>MAGNITUDE <op> <dexp>SHOW = <boolean>SYMBOLSHAPE <<symbolshape>>
XYPOS <<xy>>
}
RELATIVESIZE <op> <dexp> Scaling factor for scatter symbols sized “By Variable.”
RELATIVESIZEINGRIDUNITS = <boolean> If TRUE, scatter sizing “By Variable” is in grid units /magnitude otherwise centimeters/magnitude.
SPHERESCATTERRENDERQUALITY = <spherescatterrenderquality> Config file and stylesheet only option.VAR = <integer> Scatter sizing variable.
$!GLOBALSCATTERRELATIVESIZE * = 1.1LEGEND{ SHOW = YES}REFSCATSYMBOL{ SHOW = YES COLOR = RED}DATALABELS{ SHOWNODELABELS = TRUE}
Parameter Syntax Notes
153
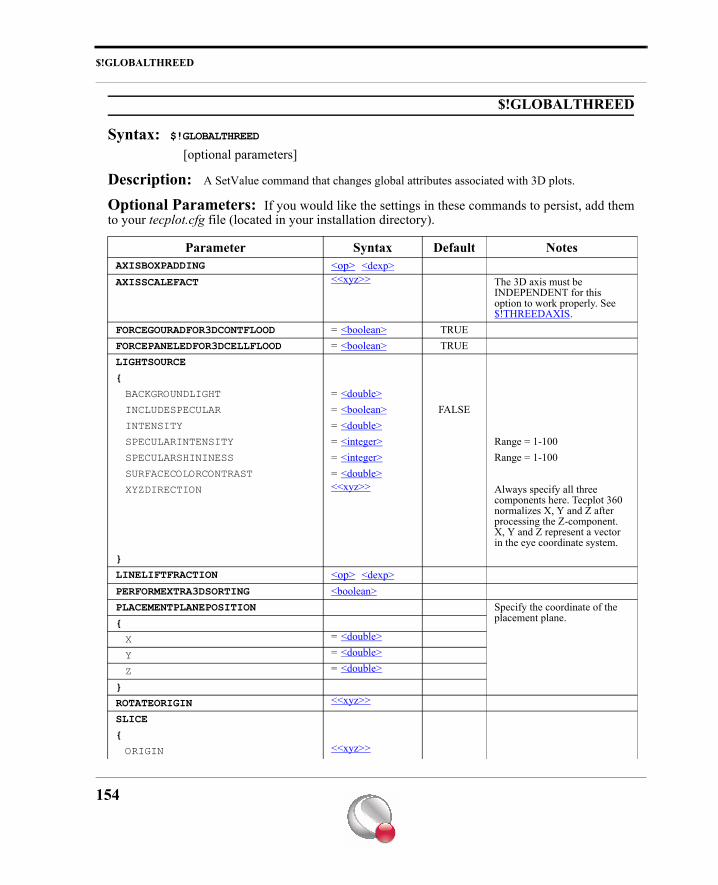
$!GLOBALTHREED
$!GLOBALTHREED
Syntax: $!GLOBALTHREED
[optional parameters]
Description: A SetValue command that changes global attributes associated with 3D plots.
Optional Parameters: If you would like the settings in these commands to persist, add themto your tecplot.cfg file (located in your installation directory).
Parameter Syntax Default NotesAXISBOXPADDING <op> <dexp>AXISSCALEFACT <<xyz>> The 3D axis must be
INDEPENDENT for this option to work properly. See $!THREEDAXIS.
FORCEGOURADFOR3DCONTFLOOD = <boolean> TRUEFORCEPANELEDFOR3DCELLFLOOD = <boolean> TRUELIGHTSOURCE
{
BACKGROUNDLIGHT = <double>INCLUDESPECULAR = <boolean> FALSEINTENSITY = <double>SPECULARINTENSITY = <integer> Range = 1-100SPECULARSHININESS = <integer> Range = 1-100SURFACECOLORCONTRAST = <double>XYZDIRECTION <<xyz>> Always specify all three
components here. Tecplot 360 normalizes X, Y and Z after processing the Z-component.X, Y and Z represent a vector in the eye coordinate system.
}
LINELIFTFRACTION <op> <dexp>PERFORMEXTRA3DSORTING <boolean>PLACEMENTPLANEPOSITION Specify the coordinate of the
placement plane.{
X = <double>
Y = <double>
Z = <double>
}
ROTATEORIGIN <<xyz>>
SLICE
{
ORIGIN <<xyz>>
154
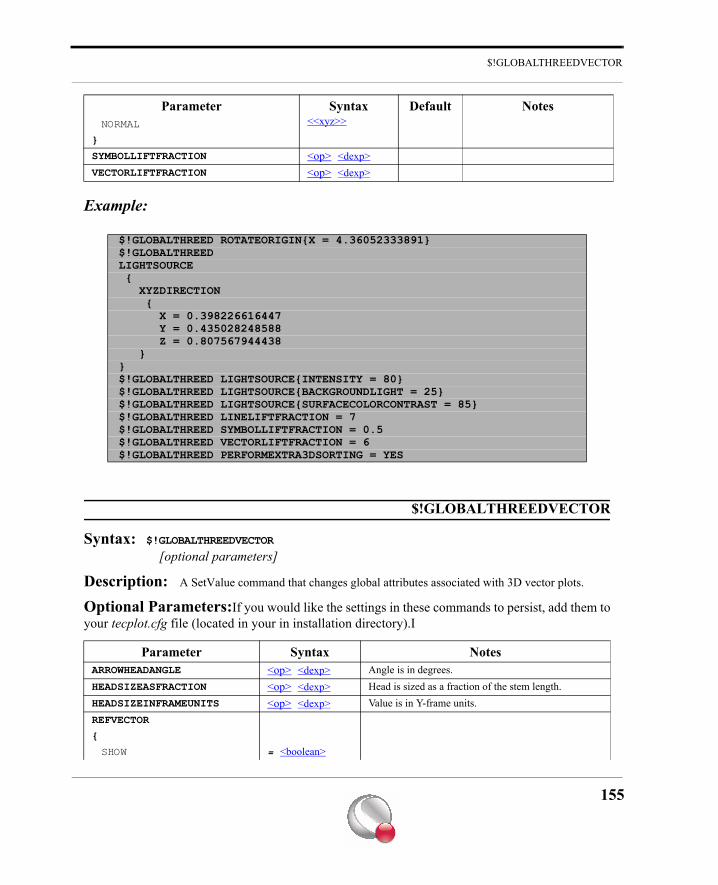
$!GLOBALTHREEDVECTOR
Example:
$!GLOBALTHREEDVECTOR
Syntax: $!GLOBALTHREEDVECTOR
[optional parameters]
Description: A SetValue command that changes global attributes associated with 3D vector plots.
Optional Parameters:If you would like the settings in these commands to persist, add them toyour tecplot.cfg file (located in your in installation directory).I
NORMAL <<xyz>>
}
SYMBOLLIFTFRACTION <op> <dexp>VECTORLIFTFRACTION <op> <dexp>
$!GLOBALTHREED ROTATEORIGIN{X = 4.36052333891}$!GLOBALTHREEDLIGHTSOURCE { XYZDIRECTION { X = 0.398226616447 Y = 0.435028248588 Z = 0.807567944438 }}$!GLOBALTHREED LIGHTSOURCE{INTENSITY = 80}$!GLOBALTHREED LIGHTSOURCE{BACKGROUNDLIGHT = 25}$!GLOBALTHREED LIGHTSOURCE{SURFACECOLORCONTRAST = 85}$!GLOBALTHREED LINELIFTFRACTION = 7$!GLOBALTHREED SYMBOLLIFTFRACTION = 0.5$!GLOBALTHREED VECTORLIFTFRACTION = 6$!GLOBALTHREED PERFORMEXTRA3DSORTING = YES
Parameter Syntax NotesARROWHEADANGLE <op> <dexp> Angle is in degrees.HEADSIZEASFRACTION <op> <dexp> Head is sized as a fraction of the stem length.HEADSIZEINFRAMEUNITS <op> <dexp> Value is in Y-frame units.REFVECTOR
{
SHOW = <boolean>
Parameter Syntax Default Notes
155
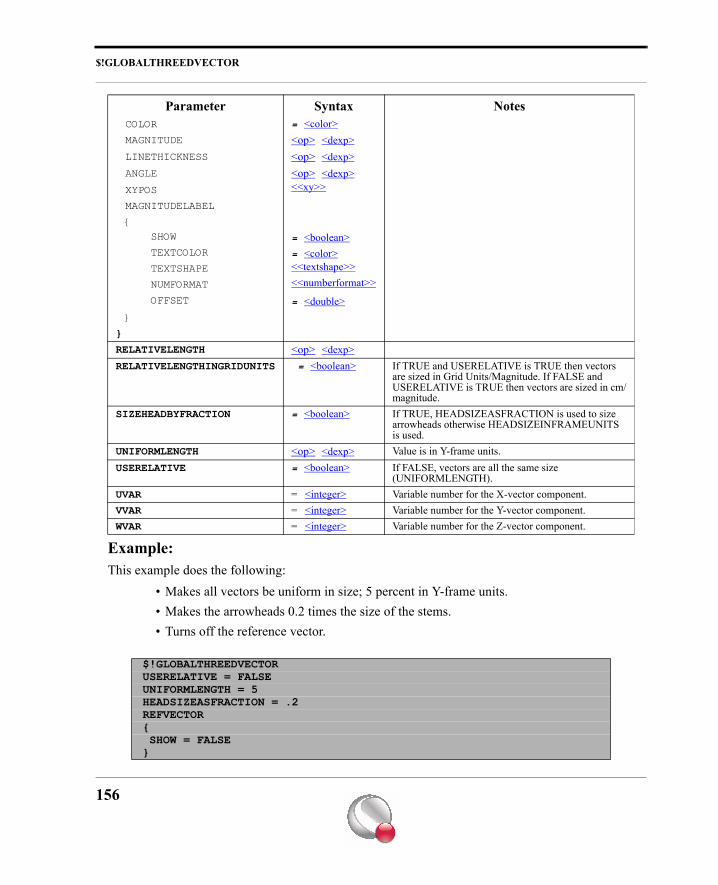
$!GLOBALTHREEDVECTOR
Example:This example does the following:
• Makes all vectors be uniform in size; 5 percent in Y-frame units.• Makes the arrowheads 0.2 times the size of the stems.• Turns off the reference vector.
COLOR = <color>MAGNITUDE <op> <dexp>LINETHICKNESS <op> <dexp>ANGLE <op> <dexp>XYPOS <<xy>>
MAGNITUDELABEL
{ SHOW = <boolean> TEXTCOLOR = <color> TEXTSHAPE <<textshape>> NUMFORMAT <<numberformat>> OFFSET = <double>}
}
RELATIVELENGTH <op> <dexp>RELATIVELENGTHINGRIDUNITS = <boolean> If TRUE and USERELATIVE is TRUE then vectors
are sized in Grid Units/Magnitude. If FALSE and USERELATIVE is TRUE then vectors are sized in cm/magnitude.
SIZEHEADBYFRACTION = <boolean> If TRUE, HEADSIZEASFRACTION is used to size arrowheads otherwise HEADSIZEINFRAMEUNITS is used.
UNIFORMLENGTH <op> <dexp> Value is in Y-frame units.USERELATIVE = <boolean> If FALSE, vectors are all the same size
(UNIFORMLENGTH).UVAR = <integer> Variable number for the X-vector component.VVAR = <integer> Variable number for the Y-vector component.WVAR = <integer> Variable number for the Z-vector component.
$!GLOBALTHREEDVECTORUSERELATIVE = FALSEUNIFORMLENGTH = 5HEADSIZEASFRACTION = .2REFVECTOR{ SHOW = FALSE}
Parameter Syntax Notes
156
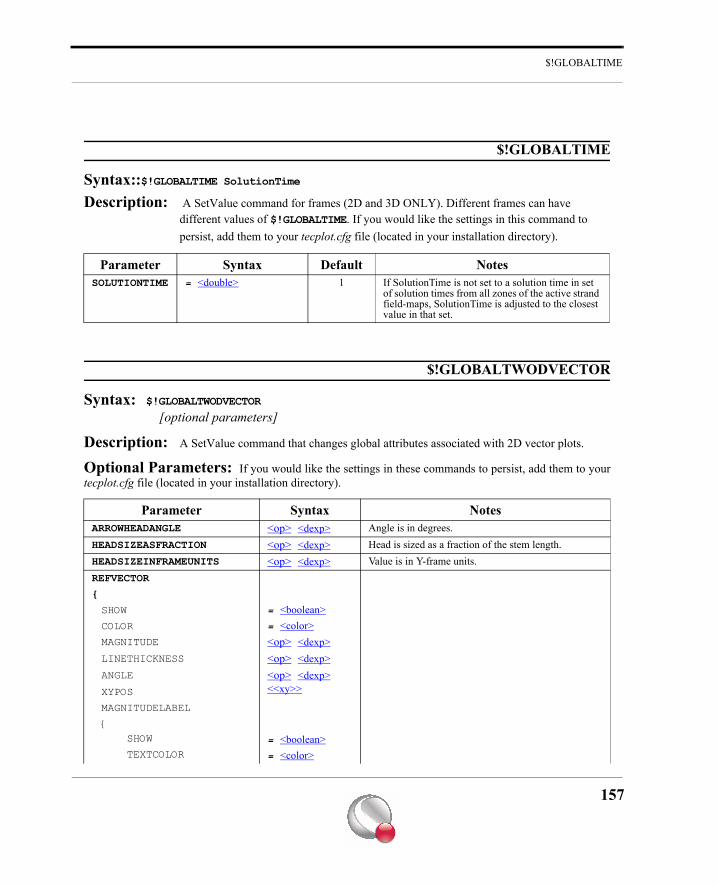
$!GLOBALTIME
$!GLOBALTIME
Syntax::$!GLOBALTIME SolutionTimeDescription: A SetValue command for frames (2D and 3D ONLY). Different frames can have
different values of $!GLOBALTIME. If you would like the settings in this command to persist, add them to your tecplot.cfg file (located in your installation directory).
$!GLOBALTWODVECTOR
Syntax: $!GLOBALTWODVECTOR
[optional parameters]
Description: A SetValue command that changes global attributes associated with 2D vector plots.
Optional Parameters: If you would like the settings in these commands to persist, add them to yourtecplot.cfg file (located in your installation directory).
Parameter Syntax Default NotesSOLUTIONTIME = <double> 1 If SolutionTime is not set to a solution time in set
of solution times from all zones of the active strand field-maps, SolutionTime is adjusted to the closest value in that set.
Parameter Syntax NotesARROWHEADANGLE <op> <dexp> Angle is in degrees.HEADSIZEASFRACTION <op> <dexp> Head is sized as a fraction of the stem length.HEADSIZEINFRAMEUNITS <op> <dexp> Value is in Y-frame units.REFVECTOR
{
SHOW = <boolean>COLOR = <color>MAGNITUDE <op> <dexp>LINETHICKNESS <op> <dexp>ANGLE <op> <dexp>XYPOS <<xy>>
MAGNITUDELABEL
{ SHOW = <boolean> TEXTCOLOR = <color>
157
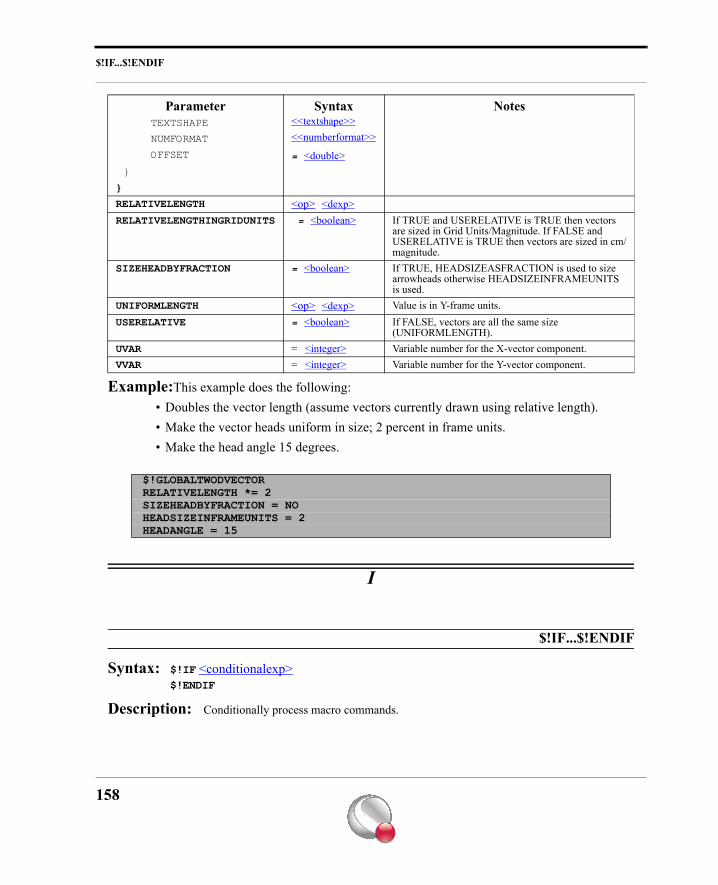
$!IF...$!ENDIF
Example:This example does the following:• Doubles the vector length (assume vectors currently drawn using relative length).• Make the vector heads uniform in size; 2 percent in frame units.• Make the head angle 15 degrees.
I
$!IF...$!ENDIF
Syntax: $!IF <conditionalexp>$!ENDIF
Description: Conditionally process macro commands.
TEXTSHAPE <<textshape>> NUMFORMAT <<numberformat>> OFFSET = <double>}
}
RELATIVELENGTH <op> <dexp>RELATIVELENGTHINGRIDUNITS = <boolean> If TRUE and USERELATIVE is TRUE then vectors
are sized in Grid Units/Magnitude. If FALSE and USERELATIVE is TRUE then vectors are sized in cm/magnitude.
SIZEHEADBYFRACTION = <boolean> If TRUE, HEADSIZEASFRACTION is used to size arrowheads otherwise HEADSIZEINFRAMEUNITS is used.
UNIFORMLENGTH <op> <dexp> Value is in Y-frame units.USERELATIVE = <boolean> If FALSE, vectors are all the same size
(UNIFORMLENGTH).UVAR = <integer> Variable number for the X-vector component.VVAR = <integer> Variable number for the Y-vector component.
$!GLOBALTWODVECTORRELATIVELENGTH *= 2SIZEHEADBYFRACTION = NOHEADSIZEINFRAMEUNITS = 2HEADANGLE = 15
Parameter Syntax Notes
158
$!INCLUDEMACRO
Examples
Example 1:
Process macro commands if the macro variable |myvar| is less than 73.2:
Example 2:
Process macro commands if the macro variable |response| is YES:
$!INCLUDEMACRO
Syntax: $!INCLUDEMACRO <string>
Description: Insert the commands from another macro file. Because the $!INCLUDEMACRO command is processed when the macro is loaded and not when the macro is executed, you are not allowed to reference macro variables within the <string> parameter.
Example:
Include the macro file m2.mcr:
$!INTERFACE
Syntax: $!INTERFACE
[optional parameters]
Description: A SetValue command that sets attributes related to the Tecplot 360 interface.
$!IF |myvar| < 73.2$!ENDIF
$!IF "|response|" == "YES" . . .$!ENDIF
$!INCLUDEMACRO "m2.mcr"
159
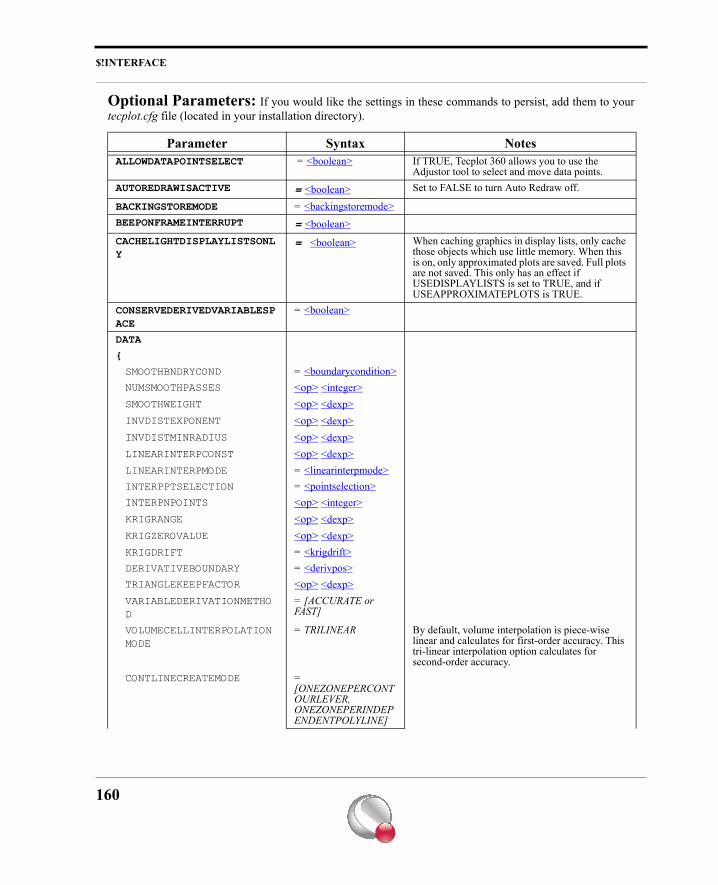
$!INTERFACE
Optional Parameters: If you would like the settings in these commands to persist, add them to yourtecplot.cfg file (located in your installation directory).
Parameter Syntax NotesALLOWDATAPOINTSELECT = <boolean> If TRUE, Tecplot 360 allows you to use the
Adjustor tool to select and move data points.AUTOREDRAWISACTIVE = <boolean> Set to FALSE to turn Auto Redraw off.
BACKINGSTOREMODE = <backingstoremode>BEEPONFRAMEINTERRUPT = <boolean>CACHELIGHTDISPLAYLISTSONLY
= <boolean> When caching graphics in display lists, only cache those objects which use little memory. When this is on, only approximated plots are saved. Full plots are not saved. This only has an effect if USEDISPLAYLISTS is set to TRUE, and if USEAPPROXIMATEPLOTS is TRUE.
CONSERVEDERIVEDVARIABLESPACE
= <boolean>
DATA
{
SMOOTHBNDRYCOND = <boundarycondition>NUMSMOOTHPASSES <op> <integer>SMOOTHWEIGHT <op> <dexp>INVDISTEXPONENT <op> <dexp>INVDISTMINRADIUS <op> <dexp>LINEARINTERPCONST <op> <dexp>LINEARINTERPMODE = <linearinterpmode>INTERPPTSELECTION = <pointselection>INTERPNPOINTS <op> <integer>KRIGRANGE <op> <dexp>KRIGZEROVALUE <op> <dexp>KRIGDRIFT = <krigdrift>DERIVATIVEBOUNDARY = <derivpos>TRIANGLEKEEPFACTOR <op> <dexp>VARIABLEDERIVATIONMETHOD
= [ACCURATE or FAST]
VOLUMECELLINTERPOLATIONMODE
= TRILINEAR By default, volume interpolation is piece-wise linear and calculates for first-order accuracy. This tri-linear interpolation option calculates for second-order accuracy.
CONTLINECREATEMODE = [ONEZONEPERCONTOURLEVER, ONEZONEPERINDEPENDENTPOLYLINE]
160
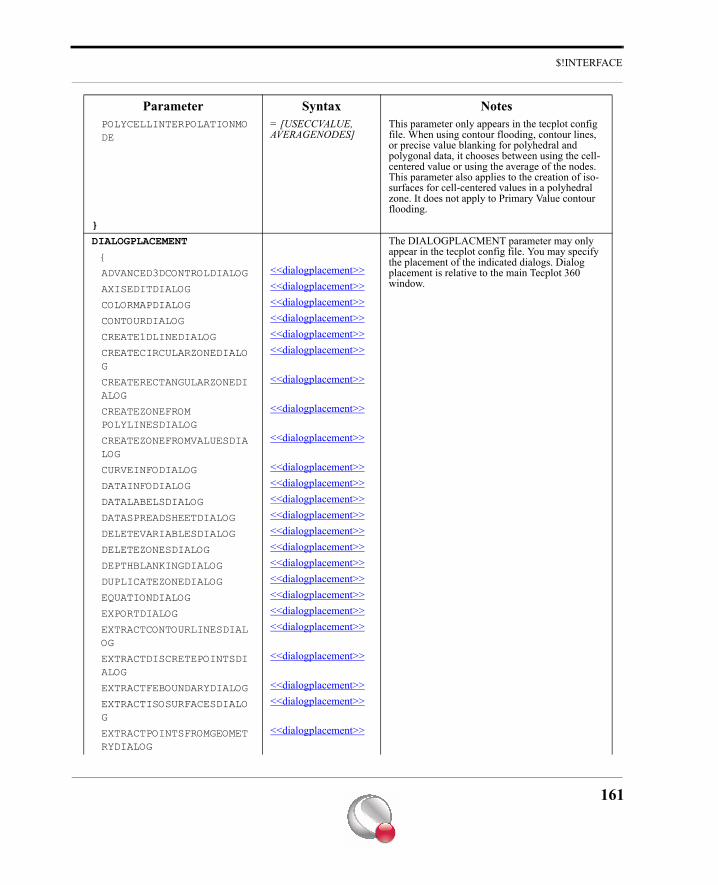
$!INTERFACE
POLYCELLINTERPOLATIONMODE
= [USECCVALUE, AVERAGENODES]
This parameter only appears in the tecplot config file. When using contour flooding, contour lines, or precise value blanking for polyhedral and polygonal data, it chooses between using the cell-centered value or using the average of the nodes. This parameter also applies to the creation of iso-surfaces for cell-centered values in a polyhedral zone. It does not apply to Primary Value contour flooding.
}
DIALOGPLACEMENT The DIALOGPLACMENT parameter may only appear in the tecplot config file. You may specify the placement of the indicated dialogs. Dialog placement is relative to the main Tecplot 360 window.
{
ADVANCED3DCONTROLDIALOG <<dialogplacement>>
AXISEDITDIALOG <<dialogplacement>>
COLORMAPDIALOG <<dialogplacement>>
CONTOURDIALOG <<dialogplacement>>
CREATE1DLINEDIALOG <<dialogplacement>>
CREATECIRCULARZONEDIALOG
<<dialogplacement>>
CREATERECTANGULARZONEDIALOG
<<dialogplacement>>
CREATEZONEFROM POLYLINESDIALOG
<<dialogplacement>>
CREATEZONEFROMVALUESDIALOG
<<dialogplacement>>
CURVEINFODIALOG <<dialogplacement>>
DATAINFODIALOG <<dialogplacement>>
DATALABELSDIALOG <<dialogplacement>>
DATASPREADSHEETDIALOG <<dialogplacement>>
DELETEVARIABLESDIALOG <<dialogplacement>>
DELETEZONESDIALOG <<dialogplacement>>
DEPTHBLANKINGDIALOG <<dialogplacement>>
DUPLICATEZONEDIALOG <<dialogplacement>>
EQUATIONDIALOG <<dialogplacement>>
EXPORTDIALOG <<dialogplacement>>
EXTRACTCONTOURLINESDIALOG
<<dialogplacement>>
EXTRACTDISCRETEPOINTSDIALOG
<<dialogplacement>>
EXTRACTFEBOUNDARYDIALOG <<dialogplacement>>
EXTRACTISOSURFACESDIALOG
<<dialogplacement>>
EXTRACTPOINTSFROMGEOMETRYDIALOG
<<dialogplacement>>
Parameter Syntax Notes
161
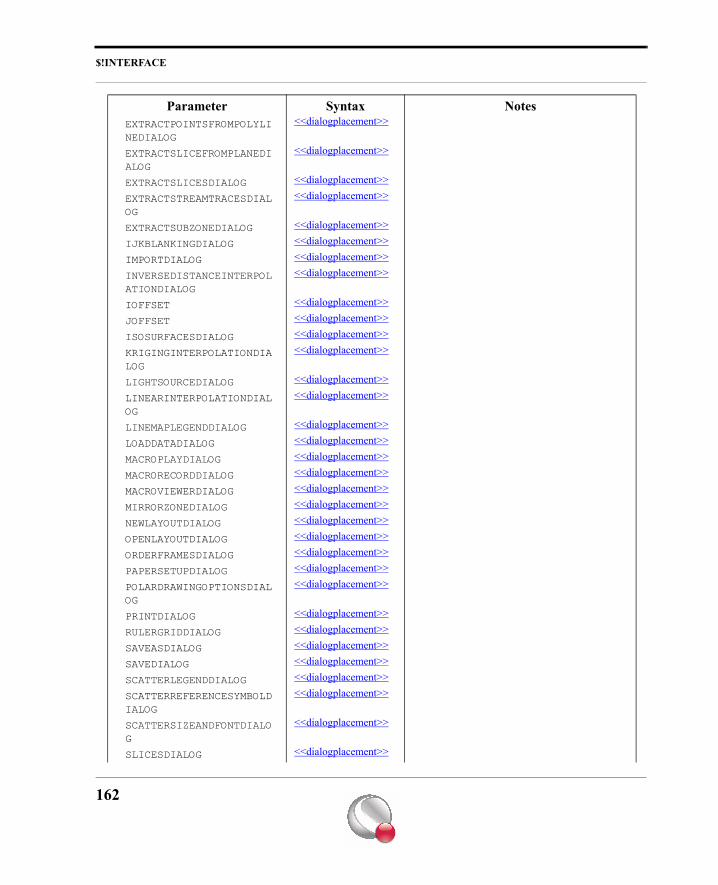
$!INTERFACE
EXTRACTPOINTSFROMPOLYLINEDIALOG
<<dialogplacement>>
EXTRACTSLICEFROMPLANEDIALOG
<<dialogplacement>>
EXTRACTSLICESDIALOG <<dialogplacement>>
EXTRACTSTREAMTRACESDIALOG
<<dialogplacement>>
EXTRACTSUBZONEDIALOG <<dialogplacement>>
IJKBLANKINGDIALOG <<dialogplacement>>
IMPORTDIALOG <<dialogplacement>>
INVERSEDISTANCEINTERPOLATIONDIALOG
<<dialogplacement>>
IOFFSET <<dialogplacement>>
JOFFSET <<dialogplacement>>
ISOSURFACESDIALOG <<dialogplacement>>
KRIGINGINTERPOLATIONDIALOG
<<dialogplacement>>
LIGHTSOURCEDIALOG <<dialogplacement>>
LINEARINTERPOLATIONDIALOG
<<dialogplacement>>
LINEMAPLEGENDDIALOG <<dialogplacement>>
LOADDATADIALOG <<dialogplacement>>
MACROPLAYDIALOG <<dialogplacement>>
MACRORECORDDIALOG <<dialogplacement>>
MACROVIEWERDIALOG <<dialogplacement>>
MIRRORZONEDIALOG <<dialogplacement>>
NEWLAYOUTDIALOG <<dialogplacement>>
OPENLAYOUTDIALOG <<dialogplacement>>
ORDERFRAMESDIALOG <<dialogplacement>>
PAPERSETUPDIALOG <<dialogplacement>>
POLARDRAWINGOPTIONSDIALOG
<<dialogplacement>>
PRINTDIALOG <<dialogplacement>>
RULERGRIDDIALOG <<dialogplacement>>
SAVEASDIALOG <<dialogplacement>>
SAVEDIALOG <<dialogplacement>>
SCATTERLEGENDDIALOG <<dialogplacement>>
SCATTERREFERENCESYMBOLDIALOG
<<dialogplacement>>
SCATTERSIZEANDFONTDIALOG
<<dialogplacement>>
SLICESDIALOG <<dialogplacement>>
Parameter Syntax Notes
162
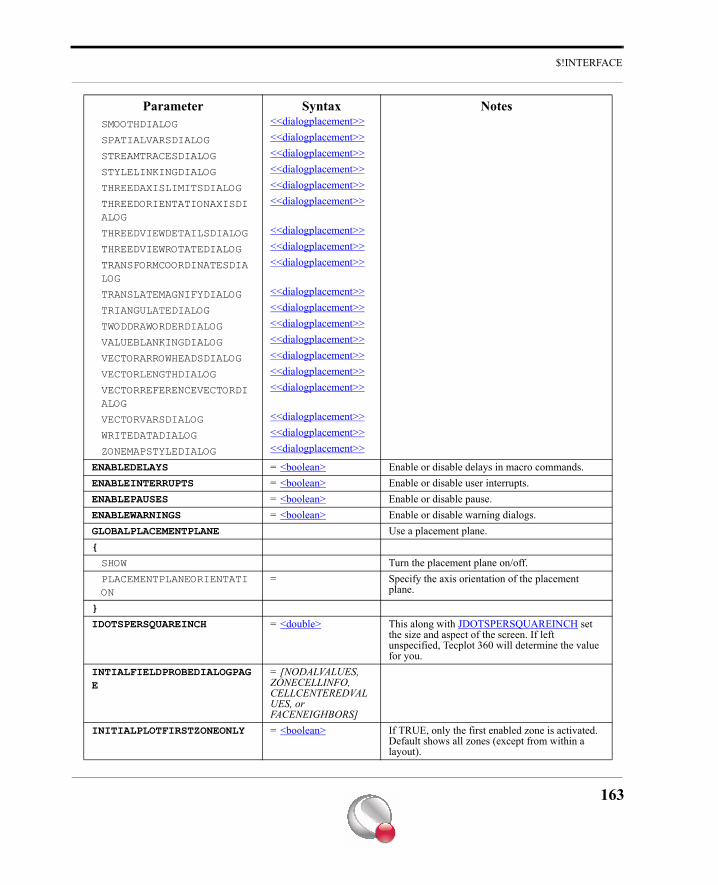
$!INTERFACE
SMOOTHDIALOG <<dialogplacement>>
SPATIALVARSDIALOG <<dialogplacement>>
STREAMTRACESDIALOG <<dialogplacement>>
STYLELINKINGDIALOG <<dialogplacement>>
THREEDAXISLIMITSDIALOG <<dialogplacement>>
THREEDORIENTATIONAXISDIALOG
<<dialogplacement>>
THREEDVIEWDETAILSDIALOG <<dialogplacement>>
THREEDVIEWROTATEDIALOG <<dialogplacement>>
TRANSFORMCOORDINATESDIALOG
<<dialogplacement>>
TRANSLATEMAGNIFYDIALOG <<dialogplacement>>
TRIANGULATEDIALOG <<dialogplacement>>
TWODDRAWORDERDIALOG <<dialogplacement>>
VALUEBLANKINGDIALOG <<dialogplacement>>
VECTORARROWHEADSDIALOG <<dialogplacement>>
VECTORLENGTHDIALOG <<dialogplacement>>
VECTORREFERENCEVECTORDIALOG
<<dialogplacement>>
VECTORVARSDIALOG <<dialogplacement>>
WRITEDATADIALOG <<dialogplacement>>
ZONEMAPSTYLEDIALOG <<dialogplacement>>
ENABLEDELAYS = <boolean> Enable or disable delays in macro commands.ENABLEINTERRUPTS = <boolean> Enable or disable user interrupts.ENABLEPAUSES = <boolean> Enable or disable pause.ENABLEWARNINGS = <boolean> Enable or disable warning dialogs.GLOBALPLACEMENTPLANE Use a placement plane.{
SHOW Turn the placement plane on/off.PLACEMENTPLANEORIENTATION
= Specify the axis orientation of the placement plane.
}
IDOTSPERSQUAREINCH = <double> This along with JDOTSPERSQUAREINCH set the size and aspect of the screen. If left unspecified, Tecplot 360 will determine the value for you.
INTIALFIELDPROBEDIALOGPAGE
= [NODALVALUES, ZONECELLINFO, CELLCENTEREDVALUES, or FACENEIGHBORS]
INITIALPLOTFIRSTZONEONLY = <boolean> If TRUE, only the first enabled zone is activated. Default shows all zones (except from within a layout).
Parameter Syntax Notes
163
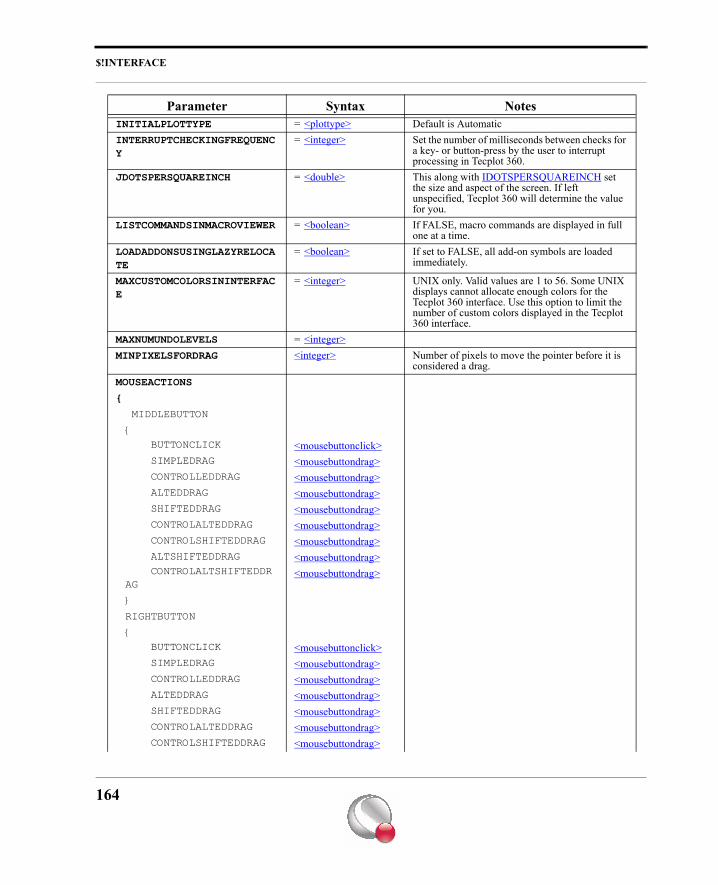
$!INTERFACE
INITIALPLOTTYPE = <plottype> Default is AutomaticINTERRUPTCHECKINGFREQUENCY
= <integer> Set the number of milliseconds between checks for a key- or button-press by the user to interrupt processing in Tecplot 360.
JDOTSPERSQUAREINCH = <double> This along with IDOTSPERSQUAREINCH set the size and aspect of the screen. If left unspecified, Tecplot 360 will determine the value for you.
LISTCOMMANDSINMACROVIEWER = <boolean> If FALSE, macro commands are displayed in full one at a time.
LOADADDONSUSINGLAZYRELOCATE
= <boolean> If set to FALSE, all add-on symbols are loaded immediately.
MAXCUSTOMCOLORSININTERFACE
= <integer> UNIX only. Valid values are 1 to 56. Some UNIX displays cannot allocate enough colors for the Tecplot 360 interface. Use this option to limit the number of custom colors displayed in the Tecplot 360 interface.
MAXNUMUNDOLEVELS = <integer>MINPIXELSFORDRAG <integer> Number of pixels to move the pointer before it is
considered a drag.MOUSEACTIONS
{
MIDDLEBUTTON
{ BUTTONCLICK <mousebuttonclick> SIMPLEDRAG <mousebuttondrag> CONTROLLEDDRAG <mousebuttondrag> ALTEDDRAG <mousebuttondrag> SHIFTEDDRAG <mousebuttondrag> CONTROLALTEDDRAG <mousebuttondrag> CONTROLSHIFTEDDRAG <mousebuttondrag> ALTSHIFTEDDRAG <mousebuttondrag> CONTROLALTSHIFTEDDRAG
<mousebuttondrag>
}
RIGHTBUTTON
{ BUTTONCLICK <mousebuttonclick> SIMPLEDRAG <mousebuttondrag> CONTROLLEDDRAG <mousebuttondrag> ALTEDDRAG <mousebuttondrag> SHIFTEDDRAG <mousebuttondrag> CONTROLALTEDDRAG <mousebuttondrag> CONTROLSHIFTEDDRAG <mousebuttondrag>
Parameter Syntax Notes
164
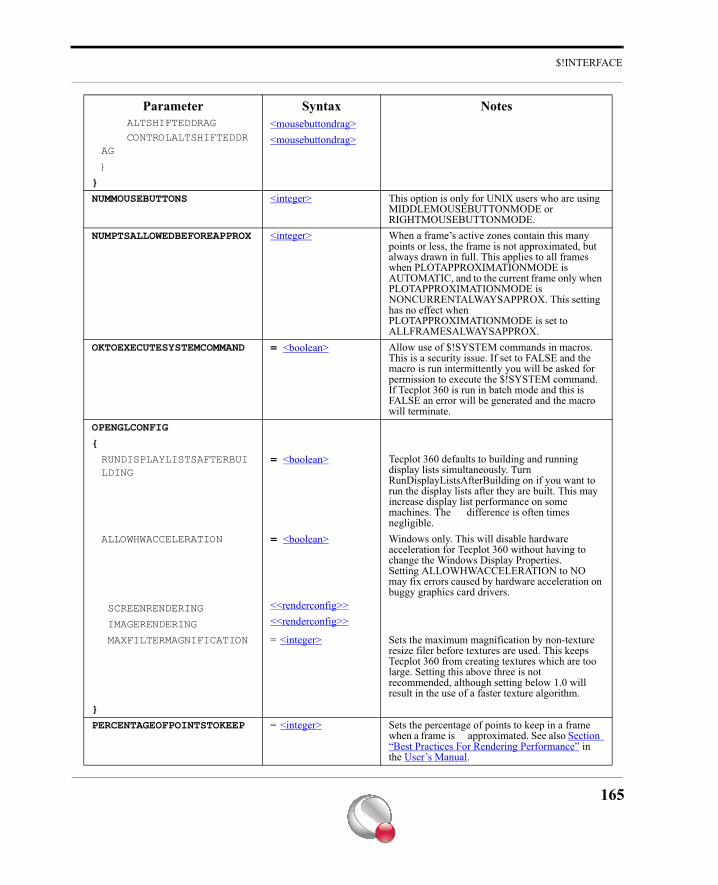
$!INTERFACE
ALTSHIFTEDDRAG <mousebuttondrag> CONTROLALTSHIFTEDDRAG
<mousebuttondrag>
}
}
NUMMOUSEBUTTONS <integer> This option is only for UNIX users who are using MIDDLEMOUSEBUTTONMODE or RIGHTMOUSEBUTTONMODE.
NUMPTSALLOWEDBEFOREAPPROX <integer> When a frame’s active zones contain this many points or less, the frame is not approximated, but always drawn in full. This applies to all frames when PLOTAPPROXIMATIONMODE is AUTOMATIC, and to the current frame only when PLOTAPPROXIMATIONMODE is NONCURRENTALWAYSAPPROX. This setting has no effect when PLOTAPPROXIMATIONMODE is set to ALLFRAMESALWAYSAPPROX.
OKTOEXECUTESYSTEMCOMMAND = <boolean> Allow use of $!SYSTEM commands in macros. This is a security issue. If set to FALSE and the macro is run intermittently you will be asked for permission to execute the $!SYSTEM command. If Tecplot 360 is run in batch mode and this is FALSE an error will be generated and the macro will terminate.
OPENGLCONFIG
{
RUNDISPLAYLISTSAFTERBUILDING
= <boolean> Tecplot 360 defaults to building and running display lists simultaneously. Turn RunDisplayListsAfterBuilding on if you want to run the display lists after they are built. This may increase display list performance on some machines. The difference is often times negligible.
ALLOWHWACCELERATION = <boolean> Windows only. This will disable hardware acceleration for Tecplot 360 without having to change the Windows Display Properties. Setting ALLOWHWACCELERATION to NO may fix errors caused by hardware acceleration on buggy graphics card drivers.
SCREENRENDERING <<renderconfig>>
IMAGERENDERING <<renderconfig>>
MAXFILTERMAGNIFICATION = <integer> Sets the maximum magnification by non-texture resize filer before textures are used. This keeps Tecplot 360 from creating textures which are too large. Setting this above three is not recommended, although setting below 1.0 will result in the use of a faster texture algorithm.
}
PERCENTAGEOFPOINTSTOKEEP = <integer> Sets the percentage of points to keep in a frame when a frame is approximated. See also Section “Best Practices For Rendering Performance” in the User’s Manual.
Parameter Syntax Notes
165
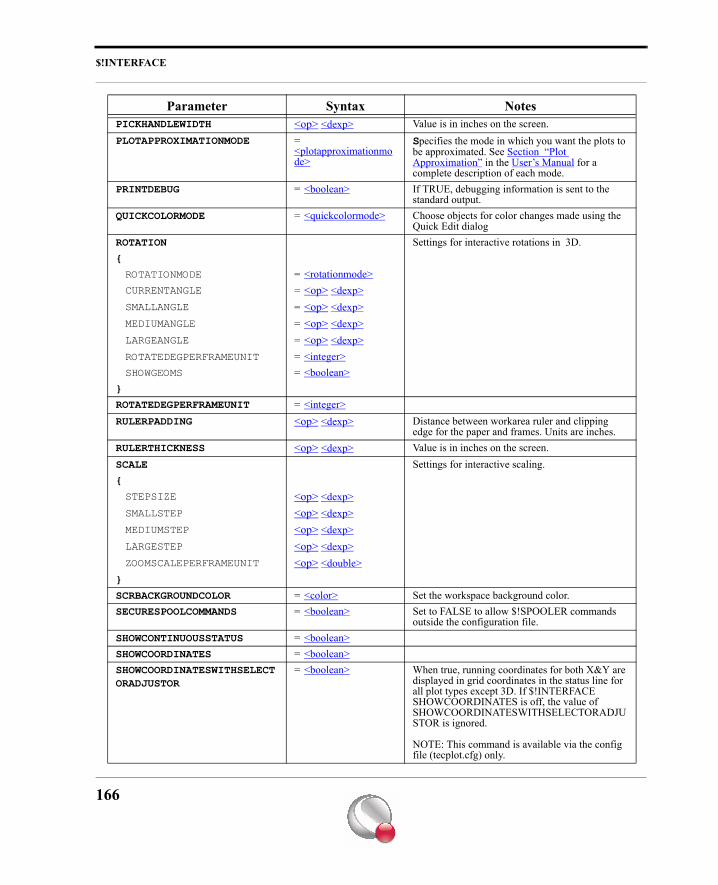
$!INTERFACE
PICKHANDLEWIDTH <op> <dexp> Value is in inches on the screen.PLOTAPPROXIMATIONMODE =
<plotapproximationmode>
Specifies the mode in which you want the plots to be approximated. See Section “Plot Approximation” in the User’s Manual for a complete description of each mode.
PRINTDEBUG = <boolean> If TRUE, debugging information is sent to the standard output.
QUICKCOLORMODE = <quickcolormode> Choose objects for color changes made using the Quick Edit dialog
ROTATION Settings for interactive rotations in 3D.{
ROTATIONMODE = <rotationmode>CURRENTANGLE = <op> <dexp>SMALLANGLE = <op> <dexp>MEDIUMANGLE = <op> <dexp>LARGEANGLE = <op> <dexp>ROTATEDEGPERFRAMEUNIT = <integer>SHOWGEOMS = <boolean>
}
ROTATEDEGPERFRAMEUNIT = <integer>RULERPADDING <op> <dexp> Distance between workarea ruler and clipping
edge for the paper and frames. Units are inches.RULERTHICKNESS <op> <dexp> Value is in inches on the screen.SCALE Settings for interactive scaling.{
STEPSIZE <op> <dexp>SMALLSTEP <op> <dexp>MEDIUMSTEP <op> <dexp>LARGESTEP <op> <dexp>ZOOMSCALEPERFRAMEUNIT <op> <double>
}
SCRBACKGROUNDCOLOR = <color> Set the workspace background color.SECURESPOOLCOMMANDS = <boolean> Set to FALSE to allow $!SPOOLER commands
outside the configuration file.SHOWCONTINUOUSSTATUS = <boolean>SHOWCOORDINATES = <boolean>SHOWCOORDINATESWITHSELECTORADJUSTOR
= <boolean> When true, running coordinates for both X&Y are displayed in grid coordinates in the status line for all plot types except 3D. If $!INTERFACE SHOWCOORDINATES is off, the value of SHOWCOORDINATESWITHSELECTORADJUSTOR is ignored.
NOTE: This command is available via the config file (tecplot.cfg) only.
Parameter Syntax Notes
166
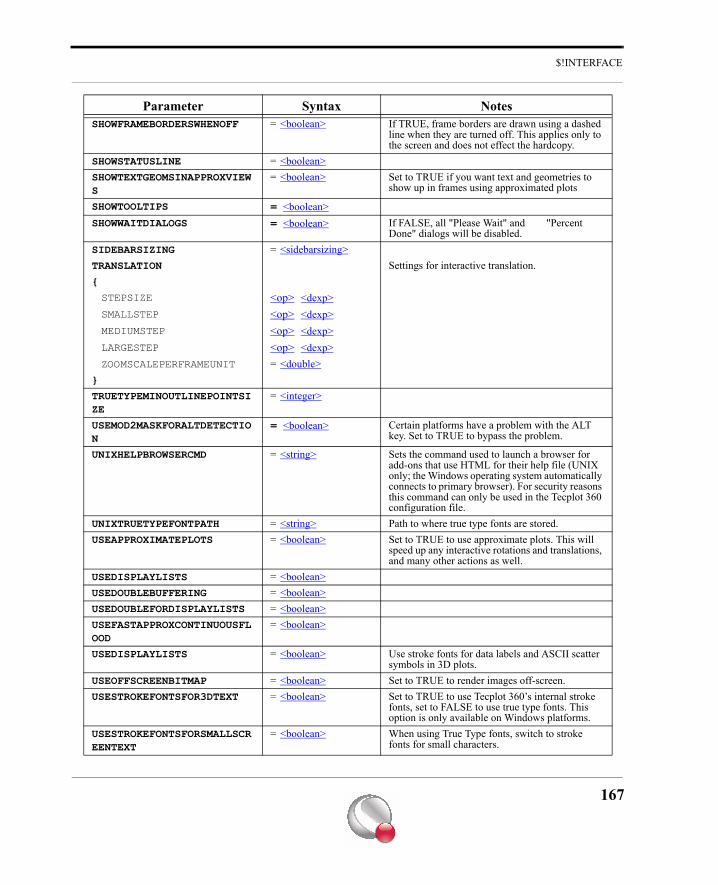
$!INTERFACE
SHOWFRAMEBORDERSWHENOFF = <boolean> If TRUE, frame borders are drawn using a dashed line when they are turned off. This applies only to the screen and does not effect the hardcopy.
SHOWSTATUSLINE = <boolean>SHOWTEXTGEOMSINAPPROXVIEWS
= <boolean> Set to TRUE if you want text and geometries to show up in frames using approximated plots
SHOWTOOLTIPS = <boolean>SHOWWAITDIALOGS = <boolean> If FALSE, all "Please Wait" and "Percent
Done" dialogs will be disabled.SIDEBARSIZING = <sidebarsizing>TRANSLATION Settings for interactive translation.{
STEPSIZE <op> <dexp>SMALLSTEP <op> <dexp>MEDIUMSTEP <op> <dexp>LARGESTEP <op> <dexp>ZOOMSCALEPERFRAMEUNIT = <double>
}
TRUETYPEMINOUTLINEPOINTSIZE
= <integer>
USEMOD2MASKFORALTDETECTION
= <boolean> Certain platforms have a problem with the ALT key. Set to TRUE to bypass the problem.
UNIXHELPBROWSERCMD = <string> Sets the command used to launch a browser for add-ons that use HTML for their help file (UNIX only; the Windows operating system automatically connects to primary browser). For security reasons this command can only be used in the Tecplot 360 configuration file.
UNIXTRUETYPEFONTPATH = <string> Path to where true type fonts are stored.USEAPPROXIMATEPLOTS = <boolean> Set to TRUE to use approximate plots. This will
speed up any interactive rotations and translations, and many other actions as well.
USEDISPLAYLISTS = <boolean>USEDOUBLEBUFFERING = <boolean>USEDOUBLEFORDISPLAYLISTS = <boolean>USEFASTAPPROXCONTINUOUSFLOOD
= <boolean>
USEDISPLAYLISTS = <boolean> Use stroke fonts for data labels and ASCII scatter symbols in 3D plots.
USEOFFSCREENBITMAP = <boolean> Set to TRUE to render images off-screen.USESTROKEFONTSFOR3DTEXT = <boolean> Set to TRUE to use Tecplot 360’s internal stroke
fonts, set to FALSE to use true type fonts. This option is only available on Windows platforms.
USESTROKEFONTSFORSMALLSCREENTEXT
= <boolean> When using True Type fonts, switch to stroke fonts for small characters.
Parameter Syntax Notes
167
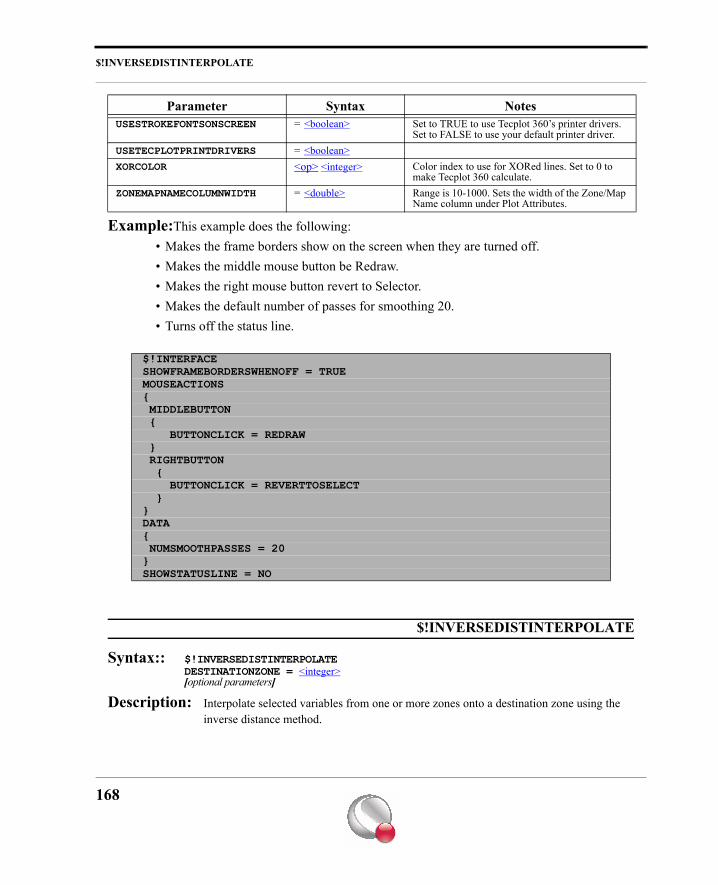
$!INVERSEDISTINTERPOLATE
Example:This example does the following:• Makes the frame borders show on the screen when they are turned off.• Makes the middle mouse button be Redraw.• Makes the right mouse button revert to Selector.• Makes the default number of passes for smoothing 20.• Turns off the status line.
$!INVERSEDISTINTERPOLATE
Syntax:: $!INVERSEDISTINTERPOLATEDESTINATIONZONE = <integer>[optional parameters]
Description: Interpolate selected variables from one or more zones onto a destination zone using the inverse distance method.
USESTROKEFONTSONSCREEN = <boolean> Set to TRUE to use Tecplot 360’s printer drivers. Set to FALSE to use your default printer driver.
USETECPLOTPRINTDRIVERS = <boolean>XORCOLOR <op> <integer> Color index to use for XORed lines. Set to 0 to
make Tecplot 360 calculate.ZONEMAPNAMECOLUMNWIDTH = <double> Range is 10-1000. Sets the width of the Zone/Map
Name column under Plot Attributes.
$!INTERFACESHOWFRAMEBORDERSWHENOFF = TRUEMOUSEACTIONS{ MIDDLEBUTTON { BUTTONCLICK = REDRAW } RIGHTBUTTON { BUTTONCLICK = REVERTTOSELECT }}DATA{ NUMSMOOTHPASSES = 20}SHOWSTATUSLINE = NO
Parameter Syntax Notes
168
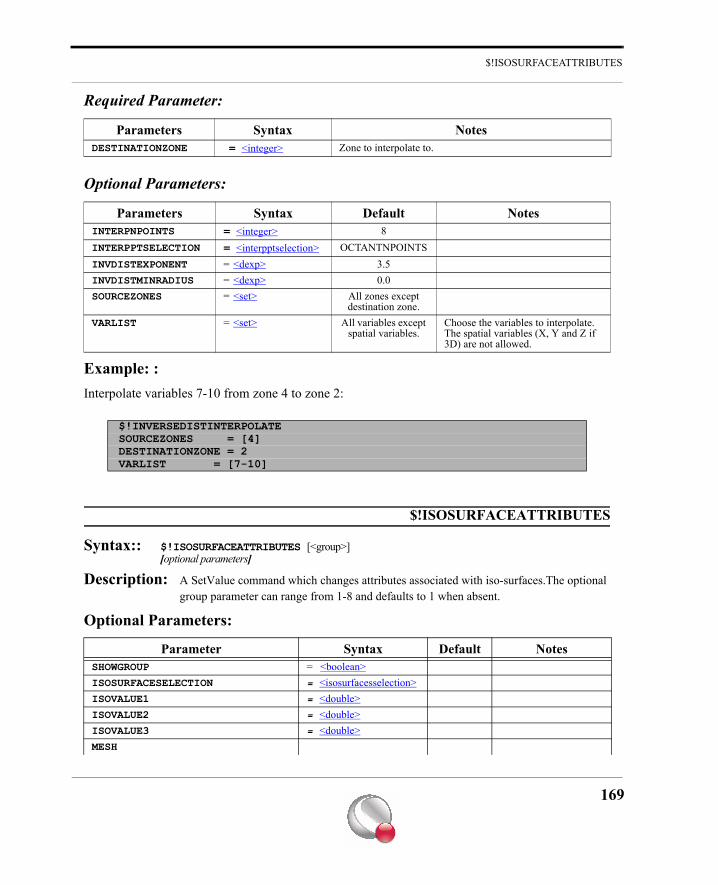
$!ISOSURFACEATTRIBUTES
Required Parameter:
Optional Parameters:
Example: :Interpolate variables 7-10 from zone 4 to zone 2:
$!ISOSURFACEATTRIBUTES
Syntax:: $!ISOSURFACEATTRIBUTES [<group>][optional parameters]
Description: A SetValue command which changes attributes associated with iso-surfaces.The optional group parameter can range from 1-8 and defaults to 1 when absent.
Optional Parameters:
Parameters Syntax NotesDESTINATIONZONE = <integer> Zone to interpolate to.
Parameters Syntax Default NotesINTERPNPOINTS = <integer> 8INTERPPTSELECTION = <interpptselection> OCTANTNPOINTSINVDISTEXPONENT = <dexp> 3.5INVDISTMINRADIUS = <dexp> 0.0SOURCEZONES = <set> All zones except
destination zone.VARLIST = <set> All variables except
spatial variables.Choose the variables to interpolate. The spatial variables (X, Y and Z if 3D) are not allowed.
$!INVERSEDISTINTERPOLATESOURCEZONES = [4]DESTINATIONZONE = 2 VARLIST = [7-10]
Parameter Syntax Default NotesSHOWGROUP = <boolean>ISOSURFACESELECTION = <isosurfacesselection>ISOVALUE1 = <double>ISOVALUE2 = <double>ISOVALUE3 = <double>MESH
169
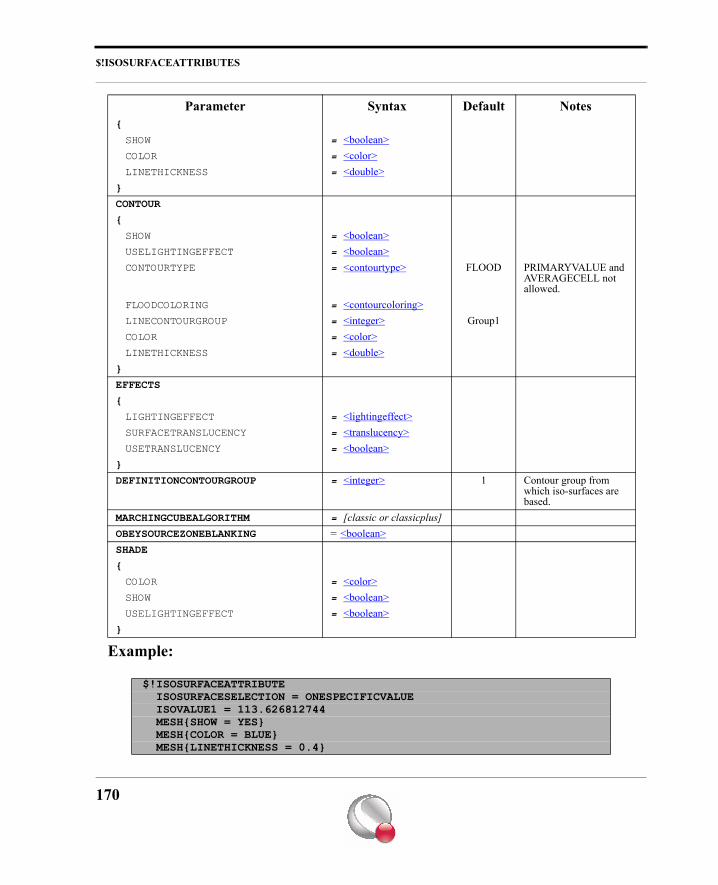
$!ISOSURFACEATTRIBUTES
Example:
{
SHOW = <boolean>COLOR = <color>LINETHICKNESS = <double>
}
CONTOUR
{
SHOW = <boolean>USELIGHTINGEFFECT = <boolean>CONTOURTYPE = <contourtype> FLOOD PRIMARYVALUE and
AVERAGECELL not allowed.
FLOODCOLORING = <contourcoloring>LINECONTOURGROUP = <integer> Group1COLOR = <color>LINETHICKNESS = <double>
}
EFFECTS
{
LIGHTINGEFFECT = <lightingeffect>SURFACETRANSLUCENCY = <translucency>USETRANSLUCENCY = <boolean>
}
DEFINITIONCONTOURGROUP = <integer> 1 Contour group from which iso-surfaces are based.
MARCHINGCUBEALGORITHM = [classic or classicplus]OBEYSOURCEZONEBLANKING = <boolean>SHADE
{
COLOR = <color>SHOW = <boolean>USELIGHTINGEFFECT = <boolean>
}
$!ISOSURFACEATTRIBUTE ISOSURFACESELECTION = ONESPECIFICVALUE ISOVALUE1 = 113.626812744 MESH{SHOW = YES} MESH{COLOR = BLUE} MESH{LINETHICKNESS = 0.4}
Parameter Syntax Default Notes
170
$!ISOSURFACELAYERS
$!ISOSURFACELAYERS
Syntax:$!ISOSURFACELAYERS SHOW = <boolean>
Description:Turn iso-surfaces on or off.
Required Parameters:
Note:When iso-surfaces are activated, they are colored using the contour variable by default. When youactivate iso-surfaces via the macro language you must perform one of the following steps in orderfor the iso-surfaces to be visible in your final plot:
• Set the contour variable by adding the following command to your macro file (prior to calling $!ISOSURFACELAYERS).
$!GLOBALCONTOUR n VAR=mwhere n is the contour group number and m is the number of the variable to use for contouring.
or• Set CONTOUR SHOW = NO via the $!ISOSURFACEATTRIBUTES command. If
you choose this option, you may want to turn on shading to improve the visibility of your slice.
K - O
$!KRIG
Syntax:: $!KRIGDESTINATIONZONE = <integer>[optional parameters]
Description: Interpolate selected variables from a set of source zones to a destination zone using the
CONTOUR{SHOW = YES} SURFACEEFFECTS{LIGHTINGEFFECT = PANELED} SURFACEEFFECTS{SURFACETRANSLUCENCY = 60}
Parameter SyntaxSHOW <boolean>
171
$!LAUNCHDIALOG
kriging method.
Required Parameter:
Optional Parameters:
Example::Krig from zones 3 and 4 onto zone 2. Only interpolate variable 7:
$!LAUNCHDIALOG
Syntax:: $!LAUNCHDIALOG <dialogname>[no parameters]
Description: Launch a Tecplot 360 interface dialog; This command is mainly useful for the Tecplot 360 demo.
Example::Launch Tecplot 360’s Macro Viewer dialog:
Parameters Syntax NotesDESTINATIONZONE = <integer> Zone to interpolate to.
Parameters Syntax Default NotesINTERPNPOINTS = <integer> 8INTERPPTSELECTION = <interpptselection> OCTANTNPOINTSKRIGDRIFT = <krigdrift> LINEARKRIGRANGE = <dexp> 0.3KRIGZEROVALUE = <dexp> 0.0SOURCEZONES = <set> All zones except the
destination zone.VARLIST = <set> All variables except
spatial variables.Choose the variables to interpolate. The spatial variables (X, Y and Z if 3D) are not allowed.
$!KRIGSOURCEZONES= [3, 4]DESTINATIONZONE= 2VARLIST= [7]
$!LAUNCHDIALOG MACROVIEWER
172
$!LIMITS
$!LIMITS
Syntax: $!LIMITS[optional parameters]
Description: A SetValue command that sets some of the internal limits in Tecplot 360. See Appendix F “Limits of Tecplot 360” in the User’s Manual for additional information. The $!LIMITS command can only be used in the Tecplot 360 configuration file.
Optional Parameters:
Example:Increase the maximum number of contour levels allowed to 1,000:
Parameter Syntax NotesLODTHRESHOLDMINFRACT <op> <double> When Load on demand is set to auto-unload, set the
minimum and maximum memory thresholds. The values may be from 0 to 1, where .5 corresponds to a threshold of 50%. If Tecplot 360’s memory usage exceeds the maximum threshold, it continues to unload variables until it either runs out of variables or reaches the minimum threshold. These values may also be set interactively via the Performance dialog. Refer to Section 31- 2.3 “Miscellaneous Preferences dialog” in the User’s Manual for additional information.
LODTHRESHOLDMAXFRACT <op> <double>
MAXAVAILABLEPROCESSORS <op> <integer> Sets the maximum number of processors used by Tecplot 360. Some tasks can be performed in parallel, so using all available processors greatly increases performance of those tasks. A value of zero instructs Tecplot 360 to use the maximum number of processors available on the machine up to the limit of 8 and provides the best performance in most cases. Values between 1 and 8 can be assigned to override what Tecplot 360 thinks is the maximum number or to limit the number of processors used by Tecplot 360.
MAXPTSINALINE <op> <integer> Maximum number of points for geometry polylines.MAXCHRSINTEXTLABELS <op> <integer> Maximum number of characters in text labels.MAXNUMCONTOURLEVELS <op> <integer> Maximum number of contour levels.MAXNUMPICKOBJECTS <op> <integer> Maximum number of objects to pick.MAXUSABLEMEMORY <op> <integer> Limit the amount of memory used by Tecplot 360 (units of
MB).PRELOADDATATIMETHRESHOLDINMS
<integer> Sets the maximum time in milliseconds to spend pre-loading data.
$!LIMITSMAXNUMCONTOURLEVELS = 1000
173
$!LINEARINTERPOLATE
$!LINEARINTERPOLATE
Syntax:: $!LINEARINTERPOLATEDESTINATIONZONE = <integer>[optional parameters]
Description: Interpolate selected variables from a set of source zones to a destination zone using linear interpolation. The source zones cannot be I-ordered. Values assigned to the destination zone are equivalent to the results of using the probe tool in Tecplot 360.
Required Parameter:
Optional Parameters:
Example::Do linear interpolation from zones 2, 3 and 4 onto zone 7. Interpolate only variables 3-7:
$!LINEMAP
Syntax: $!LINEMAP [<set>] [optional parameters]
Description: A SetValue command that assigns attributes for individual Line-mappings. The <set> parameter immediately following the $!LINEMAP command is optional. If <set> is omitted then the assignment is applied to all Line-mappings, otherwise the assignment is applied only to the Line-mappings specified in <set>.
Parameters Syntax NotesDESTINATIONZONE = <integer> Zone to interpolate to.
Parameters Syntax Default NotesSOURCEZONES = <set> All zones except
the destination zone.
VARLIST = <set> All variables except spatial variables.
Choose the variables to interpolate. The spatial variables (X, Y and Z if 3D) are not allowed.
$!LINEARINTERPOLATESOURCEZONES = [2-4]DESTINATIONZONE = 7VARLIST = [3-7]
174
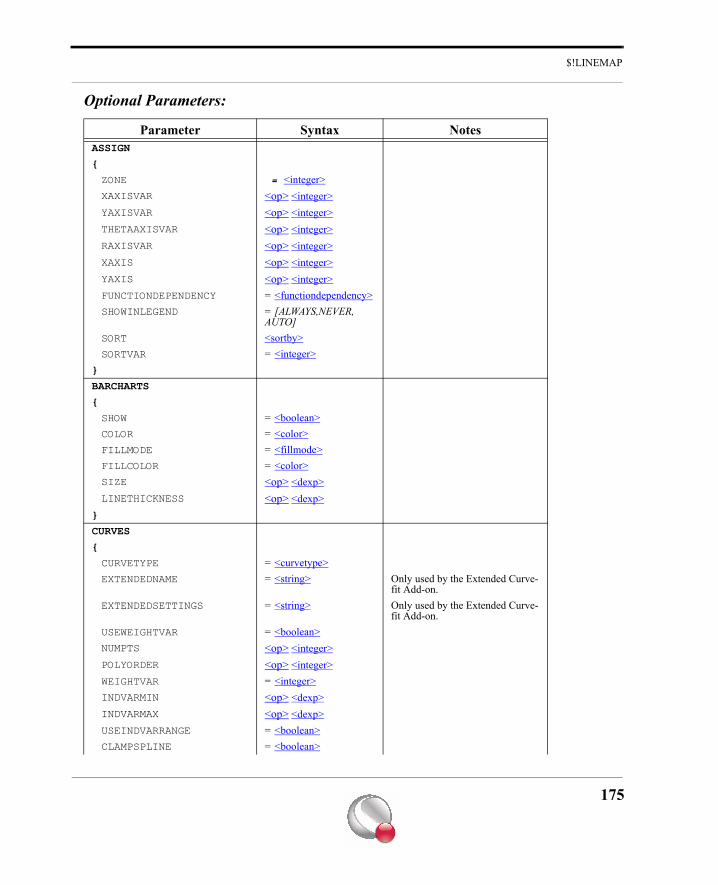
$!LINEMAP
Optional Parameters:
Parameter Syntax NotesASSIGN
{
ZONE = <integer>XAXISVAR <op> <integer>YAXISVAR <op> <integer>THETAAXISVAR <op> <integer>RAXISVAR <op> <integer>XAXIS <op> <integer>YAXIS <op> <integer>FUNCTIONDEPENDENCY = <functiondependency>SHOWINLEGEND = [ALWAYS,NEVER,
AUTO]SORT <sortby>SORTVAR = <integer>
}
BARCHARTS
{
SHOW = <boolean>COLOR = <color>FILLMODE = <fillmode>FILLCOLOR = <color>SIZE <op> <dexp>LINETHICKNESS <op> <dexp>
}
CURVES
{
CURVETYPE = <curvetype>EXTENDEDNAME = <string> Only used by the Extended Curve-
fit Add-on.EXTENDEDSETTINGS = <string> Only used by the Extended Curve-
fit Add-on.USEWEIGHTVAR = <boolean>NUMPTS <op> <integer>POLYORDER <op> <integer>WEIGHTVAR = <integer>INDVARMIN <op> <dexp>INDVARMAX <op> <dexp>USEINDVARRANGE = <boolean>CLAMPSPLINE = <boolean>
175
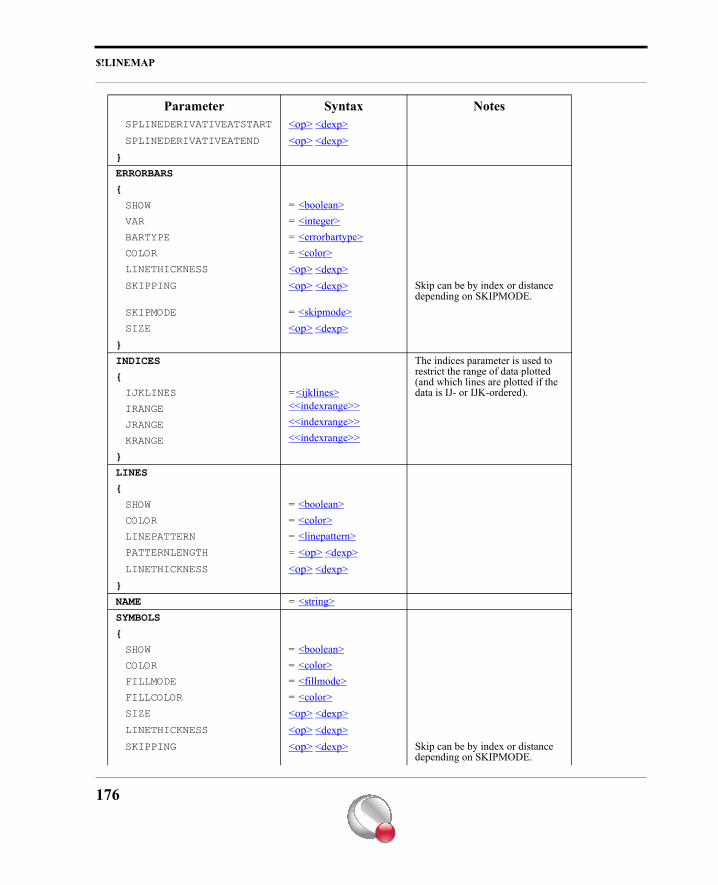
$!LINEMAP
SPLINEDERIVATIVEATSTART <op> <dexp>SPLINEDERIVATIVEATEND <op> <dexp>
}
ERRORBARS
{
SHOW = <boolean>VAR = <integer>BARTYPE = <errorbartype>COLOR = <color>LINETHICKNESS <op> <dexp>SKIPPING <op> <dexp> Skip can be by index or distance
depending on SKIPMODE.SKIPMODE = <skipmode>SIZE <op> <dexp>
}
INDICES The indices parameter is used to restrict the range of data plotted (and which lines are plotted if the data is IJ- or IJK-ordered).
{
IJKLINES =<ijklines>IRANGE <<indexrange>>
JRANGE <<indexrange>>
KRANGE <<indexrange>>
}
LINES
{
SHOW = <boolean>COLOR = <color>LINEPATTERN = <linepattern>PATTERNLENGTH = <op> <dexp>LINETHICKNESS <op> <dexp>
}
NAME = <string>SYMBOLS
{
SHOW = <boolean>COLOR = <color>FILLMODE = <fillmode>FILLCOLOR = <color>SIZE <op> <dexp>LINETHICKNESS <op> <dexp>SKIPPING <op> <dexp> Skip can be by index or distance
depending on SKIPMODE.
Parameter Syntax Notes
176
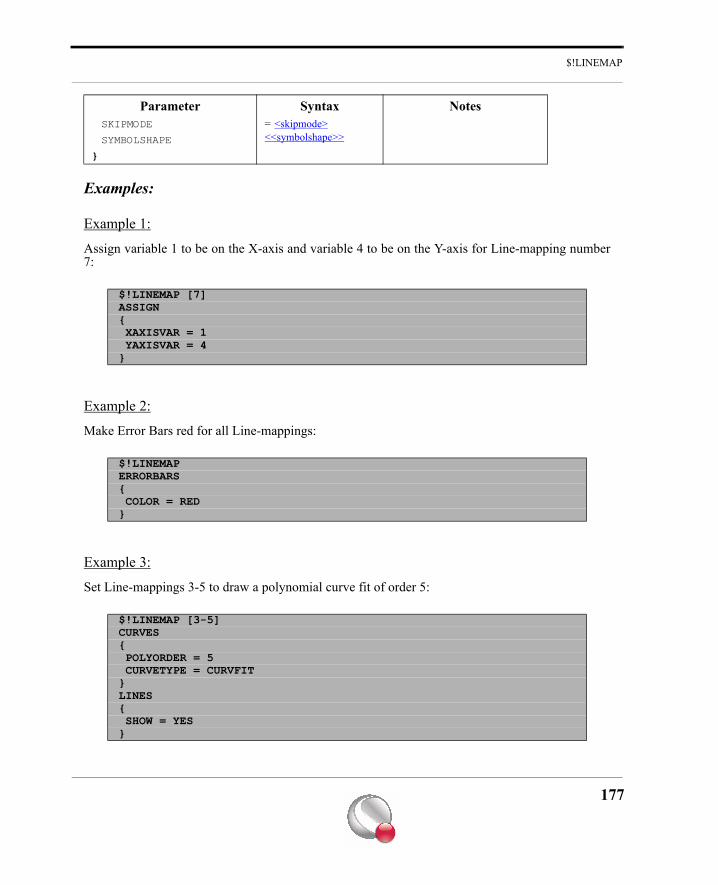
$!LINEMAP
Examples:
Example 1:
Assign variable 1 to be on the X-axis and variable 4 to be on the Y-axis for Line-mapping number7:
Example 2:
Make Error Bars red for all Line-mappings:
Example 3:
Set Line-mappings 3-5 to draw a polynomial curve fit of order 5:
SKIPMODE = <skipmode>SYMBOLSHAPE <<symbolshape>>
}
$!LINEMAP [7]ASSIGN{ XAXISVAR = 1 YAXISVAR = 4}
$!LINEMAPERRORBARS{ COLOR = RED}
$!LINEMAP [3-5]CURVES{ POLYORDER = 5 CURVETYPE = CURVFIT}LINES{ SHOW = YES}
Parameter Syntax Notes
177
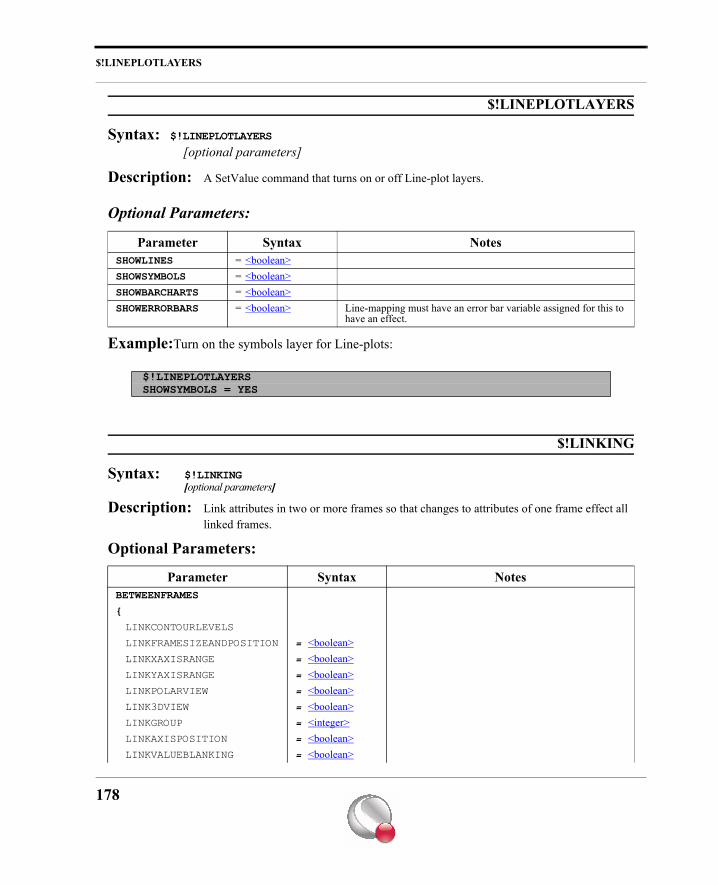
$!LINEPLOTLAYERS
$!LINEPLOTLAYERS
Syntax: $!LINEPLOTLAYERS
[optional parameters]
Description: A SetValue command that turns on or off Line-plot layers.
Optional Parameters:
Example:Turn on the symbols layer for Line-plots:
$!LINKING
Syntax: $!LINKING[optional parameters]
Description: Link attributes in two or more frames so that changes to attributes of one frame effect all linked frames.
Optional Parameters:
Parameter Syntax NotesSHOWLINES = <boolean>SHOWSYMBOLS = <boolean>SHOWBARCHARTS = <boolean>SHOWERRORBARS = <boolean> Line-mapping must have an error bar variable assigned for this to
have an effect.
$!LINEPLOTLAYERSSHOWSYMBOLS = YES
Parameter Syntax NotesBETWEENFRAMES
{
LINKCONTOURLEVELS
LINKFRAMESIZEANDPOSITION = <boolean>LINKXAXISRANGE = <boolean>LINKYAXISRANGE = <boolean>LINKPOLARVIEW = <boolean>LINK3DVIEW = <boolean>LINKGROUP = <integer>LINKAXISPOSITION = <boolean>LINKVALUEBLANKING = <boolean>
178
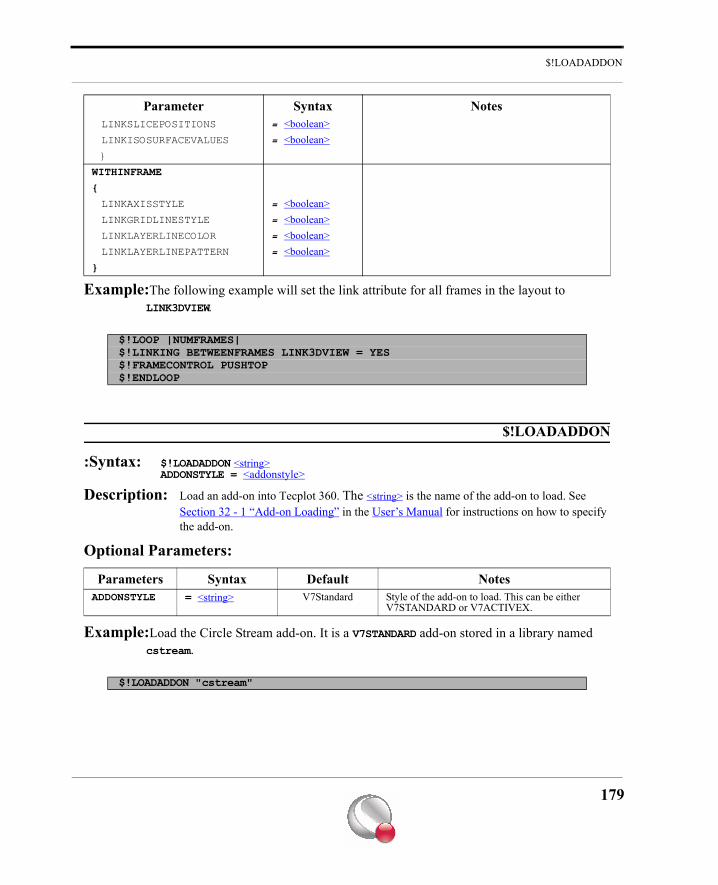
$!LOADADDON
Example:The following example will set the link attribute for all frames in the layout to LINK3DVIEW.
$!LOADADDON
:Syntax: $!LOADADDON <string>ADDONSTYLE = <addonstyle>
Description: Load an add-on into Tecplot 360. The <string> is the name of the add-on to load. See Section 32 - 1 “Add-on Loading” in the User’s Manual for instructions on how to specify the add-on.
Optional Parameters:
Example:Load the Circle Stream add-on. It is a V7STANDARD add-on stored in a library named cstream.
LINKSLICEPOSITIONS = <boolean>LINKISOSURFACEVALUES = <boolean>}
WITHINFRAME
{
LINKAXISSTYLE = <boolean>LINKGRIDLINESTYLE = <boolean>LINKLAYERLINECOLOR = <boolean>LINKLAYERLINEPATTERN = <boolean>
}
$!LOOP |NUMFRAMES|$!LINKING BETWEENFRAMES LINK3DVIEW = YES$!FRAMECONTROL PUSHTOP$!ENDLOOP
Parameters Syntax Default NotesADDONSTYLE = <string> V7Standard Style of the add-on to load. This can be either
V7STANDARD or V7ACTIVEX.
$!LOADADDON "cstream"
Parameter Syntax Notes
179
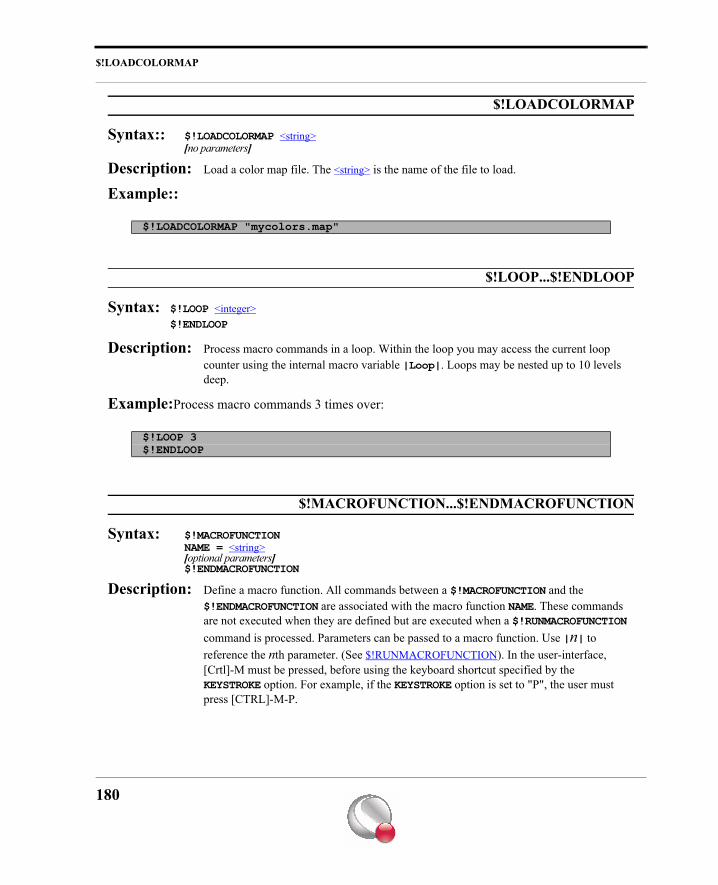
$!LOADCOLORMAP
$!LOADCOLORMAP
Syntax:: $!LOADCOLORMAP <string>[no parameters]
Description: Load a color map file. The <string> is the name of the file to load.
Example::
$!LOOP...$!ENDLOOP
Syntax: $!LOOP <integer>$!ENDLOOP
Description: Process macro commands in a loop. Within the loop you may access the current loop counter using the internal macro variable |Loop|. Loops may be nested up to 10 levels deep.
Example:Process macro commands 3 times over:
$!MACROFUNCTION...$!ENDMACROFUNCTION
Syntax: $!MACROFUNCTIONNAME = <string>[optional parameters]$!ENDMACROFUNCTION
Description: Define a macro function. All commands between a $!MACROFUNCTION and the $!ENDMACROFUNCTION are associated with the macro function NAME. These commands are not executed when they are defined but are executed when a $!RUNMACROFUNCTION command is processed. Parameters can be passed to a macro function. Use |n| to reference the nth parameter. (See $!RUNMACROFUNCTION). In the user-interface, [Crtl]-M must be pressed, before using the keyboard shortcut specified by the KEYSTROKE option. For example, if the KEYSTROKE option is set to "P", the user must press [CTRL]-M-P.
$!LOADCOLORMAP "mycolors.map"
$!LOOP 3$!ENDLOOP
180
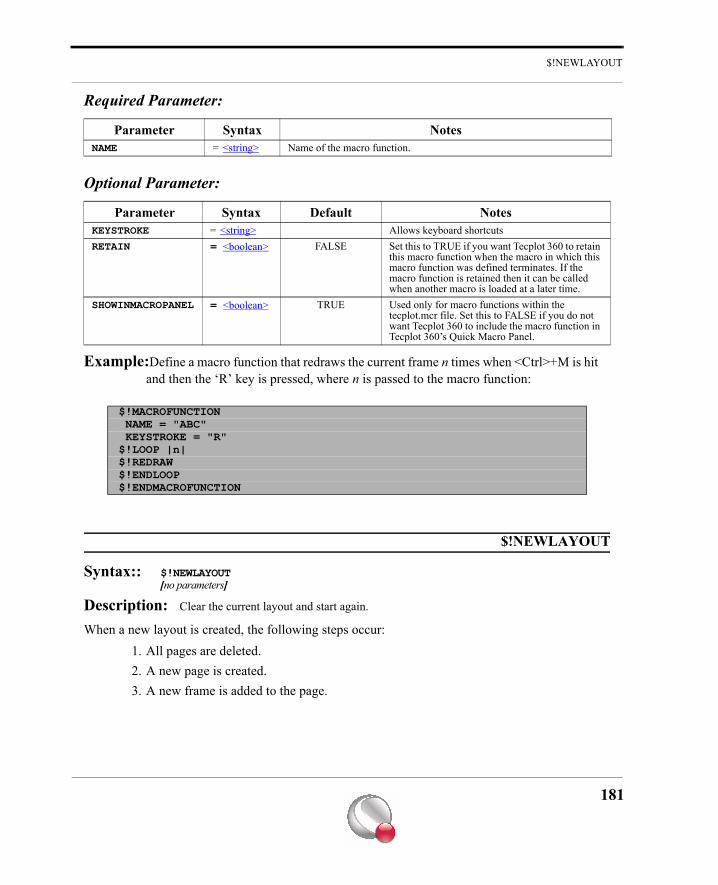
$!NEWLAYOUT
Required Parameter:
Optional Parameter:
Example:Define a macro function that redraws the current frame n times when <Ctrl>+M is hit and then the ‘R’ key is pressed, where n is passed to the macro function:
$!NEWLAYOUT
Syntax:: $!NEWLAYOUT[no parameters]
Description: Clear the current layout and start again.
When a new layout is created, the following steps occur:1. All pages are deleted.2. A new page is created.3. A new frame is added to the page.
Parameter Syntax NotesNAME = <string> Name of the macro function.
Parameter Syntax Default NotesKEYSTROKE = <string> Allows keyboard shortcutsRETAIN = <boolean> FALSE Set this to TRUE if you want Tecplot 360 to retain
this macro function when the macro in which this macro function was defined terminates. If the macro function is retained then it can be called when another macro is loaded at a later time.
SHOWINMACROPANEL = <boolean> TRUE Used only for macro functions within the tecplot.mcr file. Set this to FALSE if you do not want Tecplot 360 to include the macro function in Tecplot 360’s Quick Macro Panel.
$!MACROFUNCTION NAME = "ABC" KEYSTROKE = "R"$!LOOP |n|$!REDRAW$!ENDLOOP$!ENDMACROFUNCTION
181
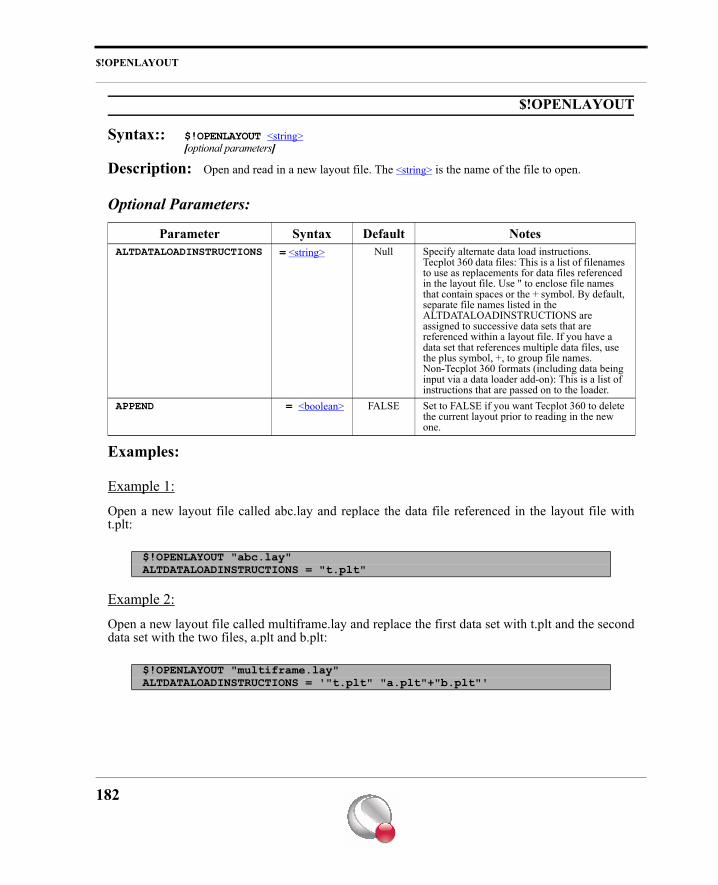
$!OPENLAYOUT
$!OPENLAYOUT
Syntax:: $!OPENLAYOUT <string>[optional parameters]
Description: Open and read in a new layout file. The <string> is the name of the file to open.
Optional Parameters:
Examples:
Example 1:
Open a new layout file called abc.lay and replace the data file referenced in the layout file witht.plt:
Example 2:
Open a new layout file called multiframe.lay and replace the first data set with t.plt and the seconddata set with the two files, a.plt and b.plt:
Parameter Syntax Default NotesALTDATALOADINSTRUCTIONS = <string> Null Specify alternate data load instructions.
Tecplot 360 data files: This is a list of filenames to use as replacements for data files referenced in the layout file. Use " to enclose file names that contain spaces or the + symbol. By default, separate file names listed in the ALTDATALOADINSTRUCTIONS are assigned to successive data sets that are referenced within a layout file. If you have a data set that references multiple data files, use the plus symbol, +, to group file names.Non-Tecplot 360 formats (including data being input via a data loader add-on): This is a list of instructions that are passed on to the loader.
APPEND = <boolean> FALSE Set to FALSE if you want Tecplot 360 to delete the current layout prior to reading in the new one.
$!OPENLAYOUT "abc.lay"ALTDATALOADINSTRUCTIONS = "t.plt"
$!OPENLAYOUT "multiframe.lay"ALTDATALOADINSTRUCTIONS = '"t.plt" "a.plt"+"b.plt"'
182
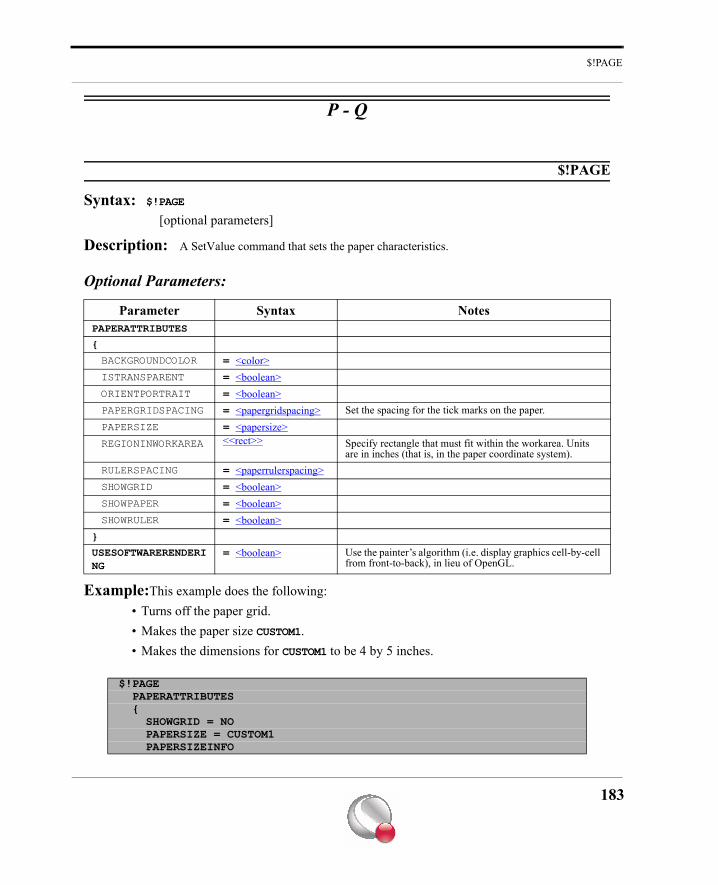
$!PAGE
P - Q
$!PAGE
Syntax: $!PAGE
[optional parameters]
Description: A SetValue command that sets the paper characteristics.
Optional Parameters:
Example:This example does the following:• Turns off the paper grid.• Makes the paper size CUSTOM1.• Makes the dimensions for CUSTOM1 to be 4 by 5 inches.
Parameter Syntax NotesPAPERATTRIBUTES
{
BACKGROUNDCOLOR = <color>ISTRANSPARENT = <boolean>ORIENTPORTRAIT = <boolean>PAPERGRIDSPACING = <papergridspacing> Set the spacing for the tick marks on the paper.PAPERSIZE = <papersize>REGIONINWORKAREA <<rect>> Specify rectangle that must fit within the workarea. Units
are in inches (that is, in the paper coordinate system).RULERSPACING = <paperrulerspacing>SHOWGRID = <boolean>SHOWPAPER = <boolean>SHOWRULER = <boolean>
}
USESOFTWARERENDERING
= <boolean> Use the painter’s algorithm (i.e. display graphics cell-by-cell from front-to-back), in lieu of OpenGL.
$!PAGE PAPERATTRIBUTES { SHOWGRID = NO PAPERSIZE = CUSTOM1 PAPERSIZEINFO
183
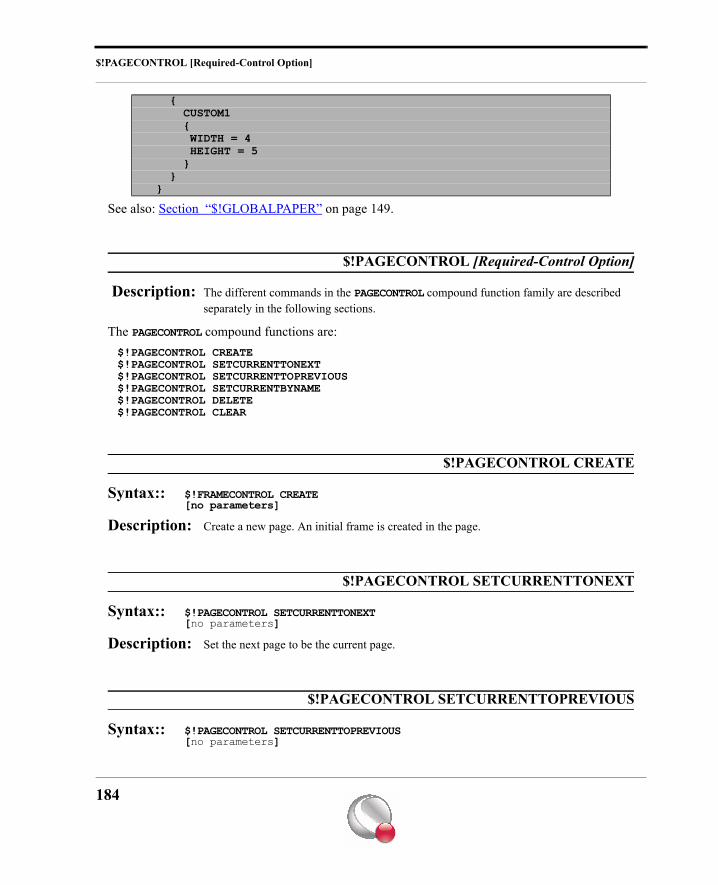
$!PAGECONTROL [Required-Control Option]
See also: Section “$!GLOBALPAPER” on page 149.
$!PAGECONTROL [Required-Control Option]
Description: The different commands in the PAGECONTROL compound function family are described separately in the following sections.
The PAGECONTROL compound functions are:$!PAGECONTROL CREATE$!PAGECONTROL SETCURRENTTONEXT$!PAGECONTROL SETCURRENTTOPREVIOUS$!PAGECONTROL SETCURRENTBYNAME$!PAGECONTROL DELETE$!PAGECONTROL CLEAR
$!PAGECONTROL CREATE
Syntax:: $!FRAMECONTROL CREATE[no parameters]
Description: Create a new page. An initial frame is created in the page.
$!PAGECONTROL SETCURRENTTONEXT
Syntax:: $!PAGECONTROL SETCURRENTTONEXT[no parameters]
Description: Set the next page to be the current page.
$!PAGECONTROL SETCURRENTTOPREVIOUS
Syntax:: $!PAGECONTROL SETCURRENTTOPREVIOUS[no parameters]
{ CUSTOM1 { WIDTH = 4 HEIGHT = 5 } } }
184
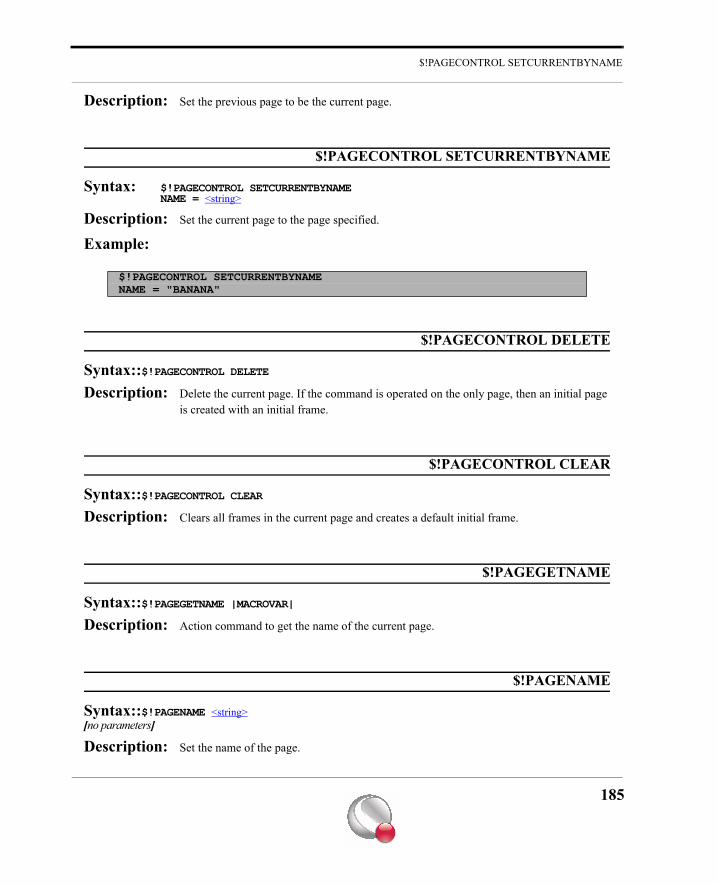
$!PAGECONTROL SETCURRENTBYNAME
Description: Set the previous page to be the current page.
$!PAGECONTROL SETCURRENTBYNAME
Syntax: $!PAGECONTROL SETCURRENTBYNAMENAME = <string>
Description: Set the current page to the page specified.
Example:
$!PAGECONTROL DELETE
Syntax::$!PAGECONTROL DELETEDescription: Delete the current page. If the command is operated on the only page, then an initial page
is created with an initial frame.
$!PAGECONTROL CLEAR
Syntax::$!PAGECONTROL CLEARDescription: Clears all frames in the current page and creates a default initial frame.
$!PAGEGETNAME
Syntax::$!PAGEGETNAME |MACROVAR|Description: Action command to get the name of the current page.
$!PAGENAME
Syntax::$!PAGENAME <string>[no parameters]
Description: Set the name of the page.
$!PAGECONTROL SETCURRENTBYNAMENAME = "BANANA"
185
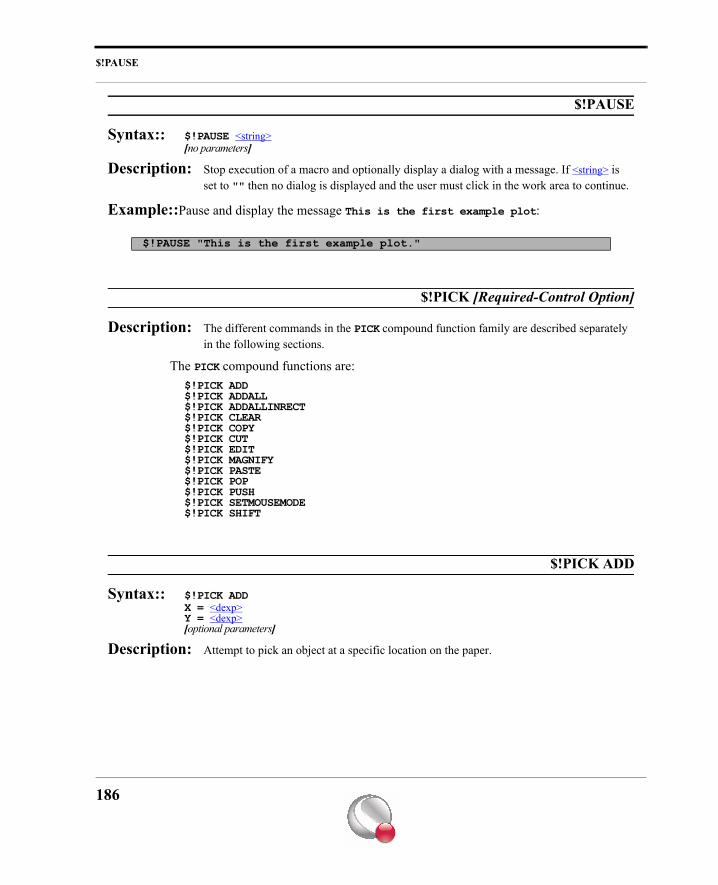
$!PAUSE
$!PAUSE
Syntax:: $!PAUSE <string>[no parameters]
Description: Stop execution of a macro and optionally display a dialog with a message. If <string> is set to "" then no dialog is displayed and the user must click in the work area to continue.
Example::Pause and display the message This is the first example plot:
$!PICK [Required-Control Option]
Description: The different commands in the PICK compound function family are described separately in the following sections.
The PICK compound functions are:$!PICK ADD$!PICK ADDALL$!PICK ADDALLINRECT$!PICK CLEAR$!PICK COPY$!PICK CUT$!PICK EDIT$!PICK MAGNIFY$!PICK PASTE$!PICK POP$!PICK PUSH$!PICK SETMOUSEMODE$!PICK SHIFT
$!PICK ADD
Syntax:: $!PICK ADDX = <dexp>Y = <dexp>[optional parameters]
Description: Attempt to pick an object at a specific location on the paper.
$!PAUSE "This is the first example plot."
186
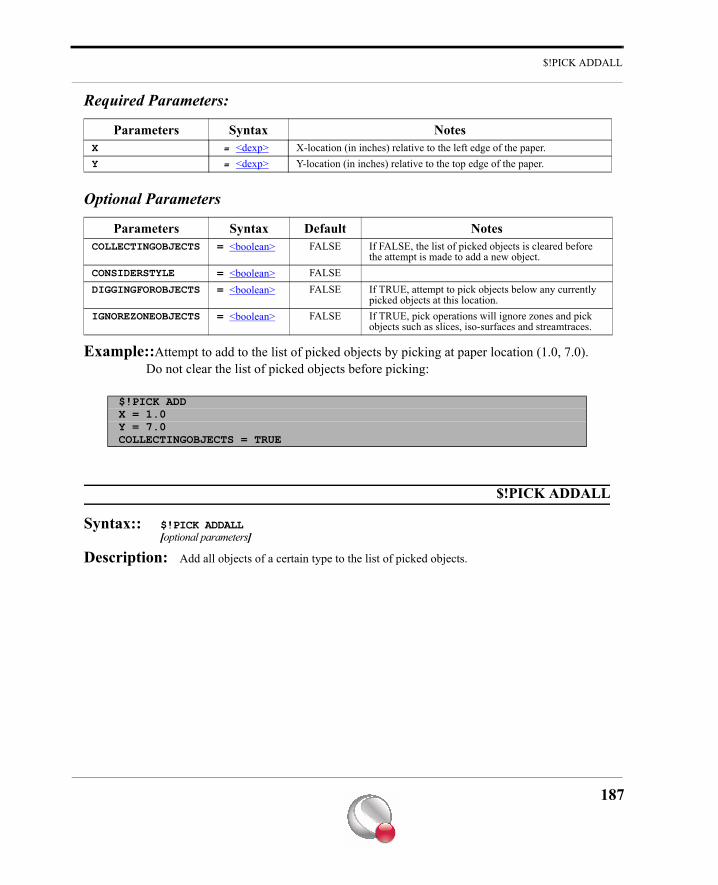
$!PICK ADDALL
Required Parameters:
Optional Parameters
Example::Attempt to add to the list of picked objects by picking at paper location (1.0, 7.0). Do not clear the list of picked objects before picking:
$!PICK ADDALL
Syntax:: $!PICK ADDALL[optional parameters]
Description: Add all objects of a certain type to the list of picked objects.
Parameters Syntax NotesX = <dexp> X-location (in inches) relative to the left edge of the paper.Y = <dexp> Y-location (in inches) relative to the top edge of the paper.
Parameters Syntax Default NotesCOLLECTINGOBJECTS = <boolean> FALSE If FALSE, the list of picked objects is cleared before
the attempt is made to add a new object.CONSIDERSTYLE = <boolean> FALSEDIGGINGFOROBJECTS = <boolean> FALSE If TRUE, attempt to pick objects below any currently
picked objects at this location.IGNOREZONEOBJECTS = <boolean> FALSE If TRUE, pick operations will ignore zones and pick
objects such as slices, iso-surfaces and streamtraces.
$!PICK ADDX = 1.0Y = 7.0COLLECTINGOBJECTS = TRUE
187
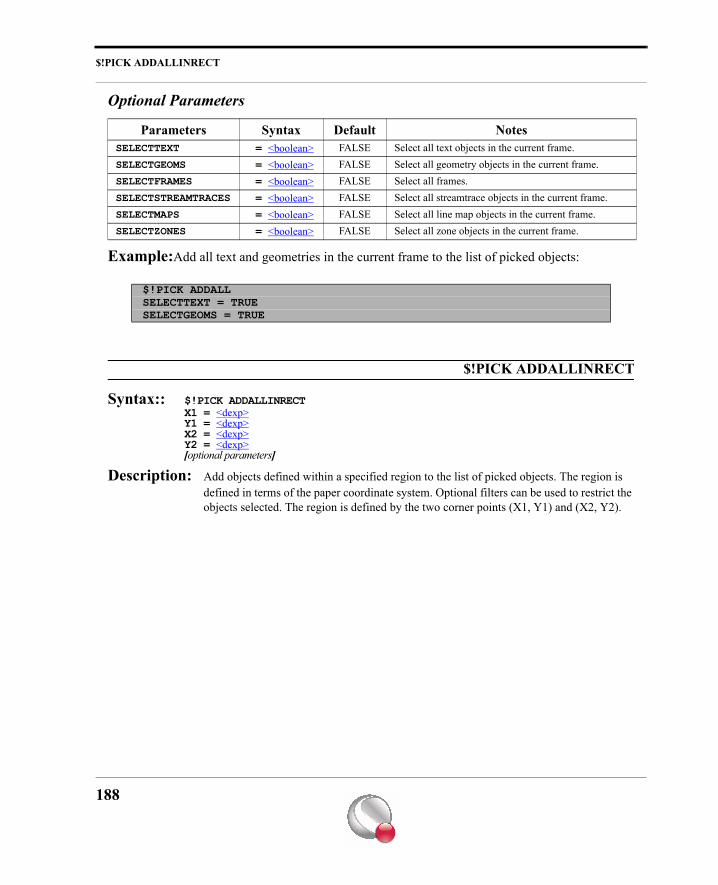
$!PICK ADDALLINRECT
Optional Parameters
Example:Add all text and geometries in the current frame to the list of picked objects:
$!PICK ADDALLINRECT
Syntax:: $!PICK ADDALLINRECTX1 = <dexp>Y1 = <dexp>X2 = <dexp>Y2 = <dexp>[optional parameters]
Description: Add objects defined within a specified region to the list of picked objects. The region is defined in terms of the paper coordinate system. Optional filters can be used to restrict the objects selected. The region is defined by the two corner points (X1, Y1) and (X2, Y2).
Parameters Syntax Default NotesSELECTTEXT = <boolean> FALSE Select all text objects in the current frame.SELECTGEOMS = <boolean> FALSE Select all geometry objects in the current frame.SELECTFRAMES = <boolean> FALSE Select all frames.SELECTSTREAMTRACES = <boolean> FALSE Select all streamtrace objects in the current frame.SELECTMAPS = <boolean> FALSE Select all line map objects in the current frame.SELECTZONES = <boolean> FALSE Select all zone objects in the current frame.
$!PICK ADDALLSELECTTEXT = TRUESELECTGEOMS = TRUE
188
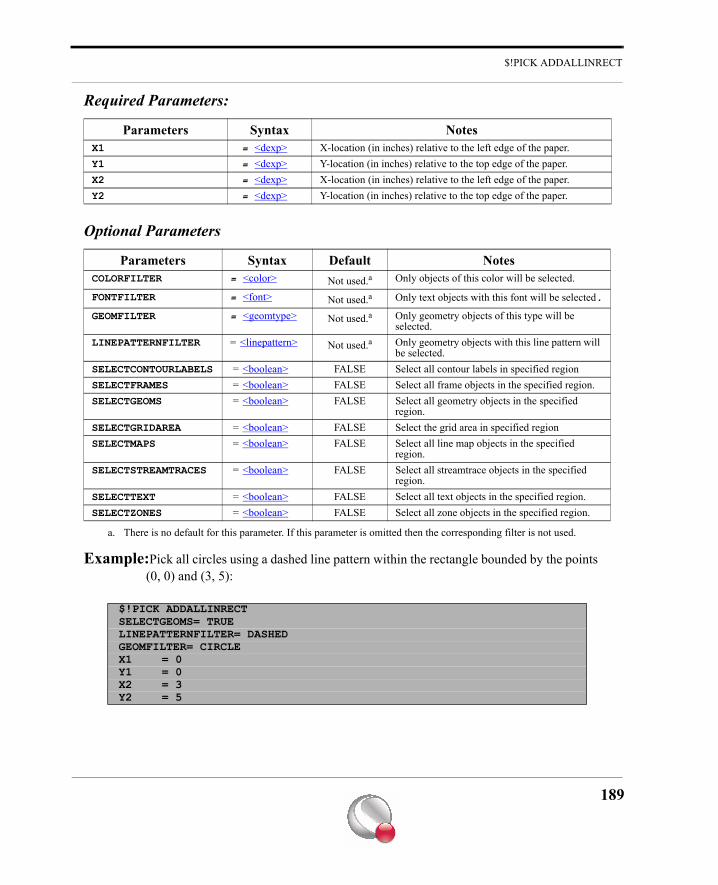
$!PICK ADDALLINRECT
Required Parameters:
Optional Parameters
Example:Pick all circles using a dashed line pattern within the rectangle bounded by the points (0, 0) and (3, 5):
Parameters Syntax NotesX1 = <dexp> X-location (in inches) relative to the left edge of the paper.Y1 = <dexp> Y-location (in inches) relative to the top edge of the paper.X2 = <dexp> X-location (in inches) relative to the left edge of the paper.Y2 = <dexp> Y-location (in inches) relative to the top edge of the paper.
Parameters Syntax Default NotesCOLORFILTER = <color> Not used.a
a. There is no default for this parameter. If this parameter is omitted then the corresponding filter is not used.
Only objects of this color will be selected.
FONTFILTER = <font> Not used.a Only text objects with this font will be selected.
GEOMFILTER = <geomtype> Not used.a Only geometry objects of this type will be selected.
LINEPATTERNFILTER = <linepattern> Not used.a Only geometry objects with this line pattern will be selected.
SELECTCONTOURLABELS = <boolean> FALSE Select all contour labels in specified regionSELECTFRAMES = <boolean> FALSE Select all frame objects in the specified region.SELECTGEOMS = <boolean> FALSE Select all geometry objects in the specified
region.SELECTGRIDAREA = <boolean> FALSE Select the grid area in specified regionSELECTMAPS = <boolean> FALSE Select all line map objects in the specified
region.SELECTSTREAMTRACES = <boolean> FALSE Select all streamtrace objects in the specified
region.SELECTTEXT = <boolean> FALSE Select all text objects in the specified region.SELECTZONES = <boolean> FALSE Select all zone objects in the specified region.
$!PICK ADDALLINRECTSELECTGEOMS= TRUELINEPATTERNFILTER= DASHEDGEOMFILTER= CIRCLEX1 = 0 Y1 = 0 X2 = 3 Y2 = 5
189
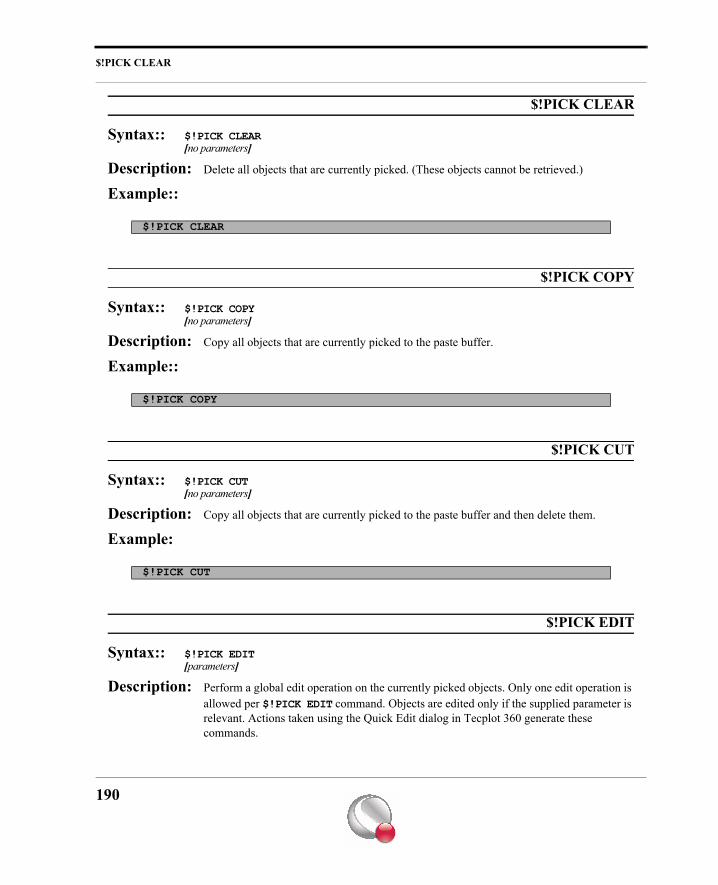
$!PICK CLEAR
$!PICK CLEAR
Syntax:: $!PICK CLEAR[no parameters]
Description: Delete all objects that are currently picked. (These objects cannot be retrieved.)
Example::
$!PICK COPY
Syntax:: $!PICK COPY[no parameters]
Description: Copy all objects that are currently picked to the paste buffer.
Example::
$!PICK CUT
Syntax:: $!PICK CUT[no parameters]
Description: Copy all objects that are currently picked to the paste buffer and then delete them.
Example:
$!PICK EDIT
Syntax:: $!PICK EDIT[parameters]
Description: Perform a global edit operation on the currently picked objects. Only one edit operation is allowed per $!PICK EDIT command. Objects are edited only if the supplied parameter is relevant. Actions taken using the Quick Edit dialog in Tecplot 360 generate these commands.
$!PICK CLEAR
$!PICK COPY
$!PICK CUT
190
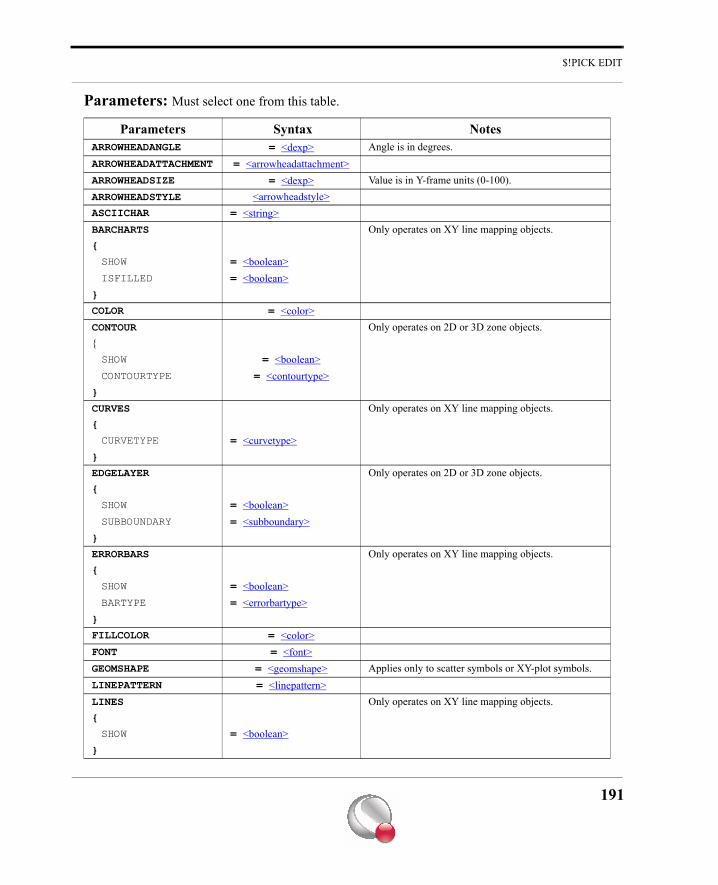
$!PICK EDIT
Parameters: Must select one from this table.
Parameters Syntax NotesARROWHEADANGLE = <dexp> Angle is in degrees.ARROWHEADATTACHMENT = <arrowheadattachment>ARROWHEADSIZE = <dexp> Value is in Y-frame units (0-100).ARROWHEADSTYLE <arrowheadstyle>ASCIICHAR = <string>BARCHARTS Only operates on XY line mapping objects.{
SHOW = <boolean>ISFILLED = <boolean>
}
COLOR = <color>CONTOUR Only operates on 2D or 3D zone objects.{SHOW = <boolean>CONTOURTYPE = <contourtype>
}
CURVES Only operates on XY line mapping objects.{
CURVETYPE = <curvetype>}
EDGELAYER Only operates on 2D or 3D zone objects.{
SHOW = <boolean>SUBBOUNDARY = <subboundary>
}
ERRORBARS Only operates on XY line mapping objects.{
SHOW = <boolean>BARTYPE = <errorbartype>
}
FILLCOLOR = <color>FONT = <font>GEOMSHAPE = <geomshape> Applies only to scatter symbols or XY-plot symbols.LINEPATTERN = <linepattern>LINES Only operates on XY line mapping objects.{
SHOW = <boolean>}
191
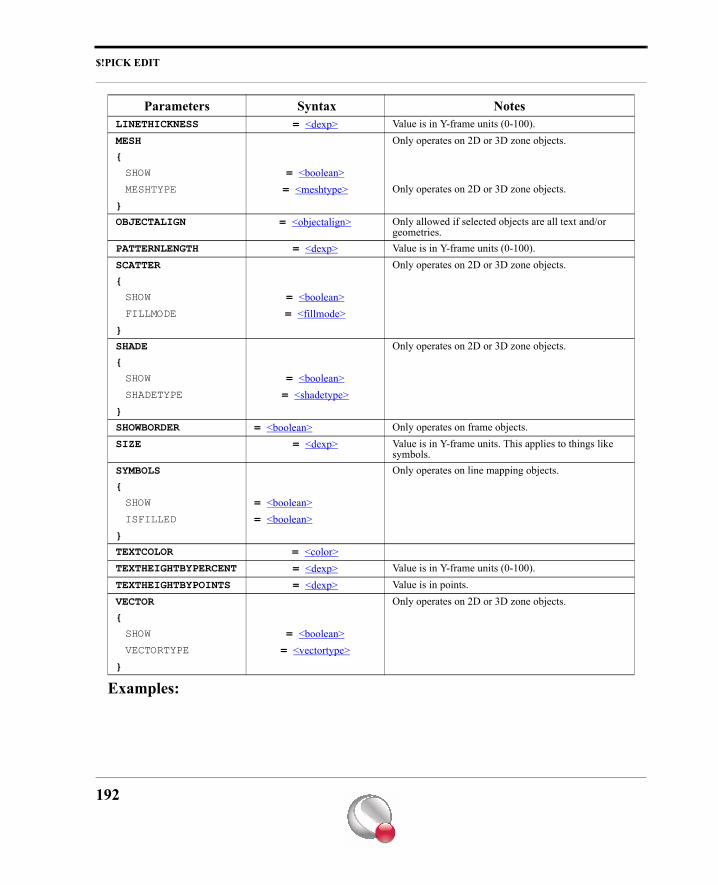
$!PICK EDIT
Examples:
LINETHICKNESS = <dexp> Value is in Y-frame units (0-100).MESH Only operates on 2D or 3D zone objects.{
SHOW = <boolean>MESHTYPE = <meshtype> Only operates on 2D or 3D zone objects.
}
OBJECTALIGN = <objectalign> Only allowed if selected objects are all text and/or geometries.
PATTERNLENGTH = <dexp> Value is in Y-frame units (0-100).SCATTER Only operates on 2D or 3D zone objects.{
SHOW = <boolean>FILLMODE = <fillmode>
}
SHADE Only operates on 2D or 3D zone objects.{
SHOW = <boolean>SHADETYPE = <shadetype>
}
SHOWBORDER = <boolean> Only operates on frame objects.SIZE = <dexp> Value is in Y-frame units. This applies to things like
symbols.SYMBOLS Only operates on line mapping objects.{
SHOW = <boolean>ISFILLED = <boolean>
}
TEXTCOLOR = <color>TEXTHEIGHTBYPERCENT = <dexp> Value is in Y-frame units (0-100).TEXTHEIGHTBYPOINTS = <dexp> Value is in points.VECTOR Only operates on 2D or 3D zone objects.{
SHOW = <boolean>VECTORTYPE = <vectortype>
}
Parameters Syntax Notes
192
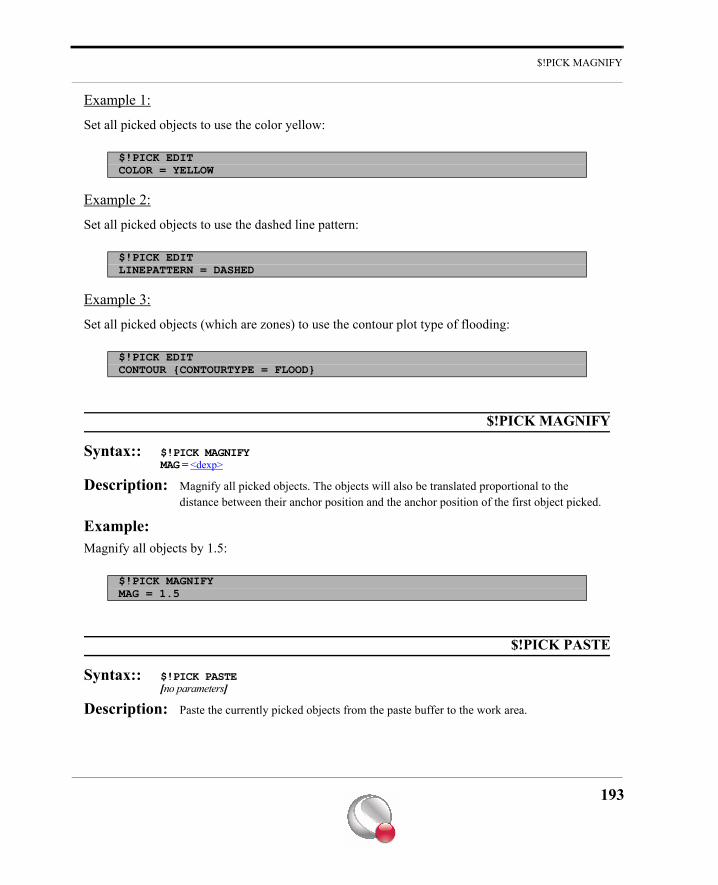
$!PICK MAGNIFY
Example 1:
Set all picked objects to use the color yellow:
Example 2:
Set all picked objects to use the dashed line pattern:
Example 3:
Set all picked objects (which are zones) to use the contour plot type of flooding:
$!PICK MAGNIFY
Syntax:: $!PICK MAGNIFYMAG = <dexp>
Description: Magnify all picked objects. The objects will also be translated proportional to the distance between their anchor position and the anchor position of the first object picked.
Example:Magnify all objects by 1.5:
$!PICK PASTE
Syntax:: $!PICK PASTE[no parameters]
Description: Paste the currently picked objects from the paste buffer to the work area.
$!PICK EDITCOLOR = YELLOW
$!PICK EDITLINEPATTERN = DASHED
$!PICK EDITCONTOUR {CONTOURTYPE = FLOOD}
$!PICK MAGNIFYMAG = 1.5
193
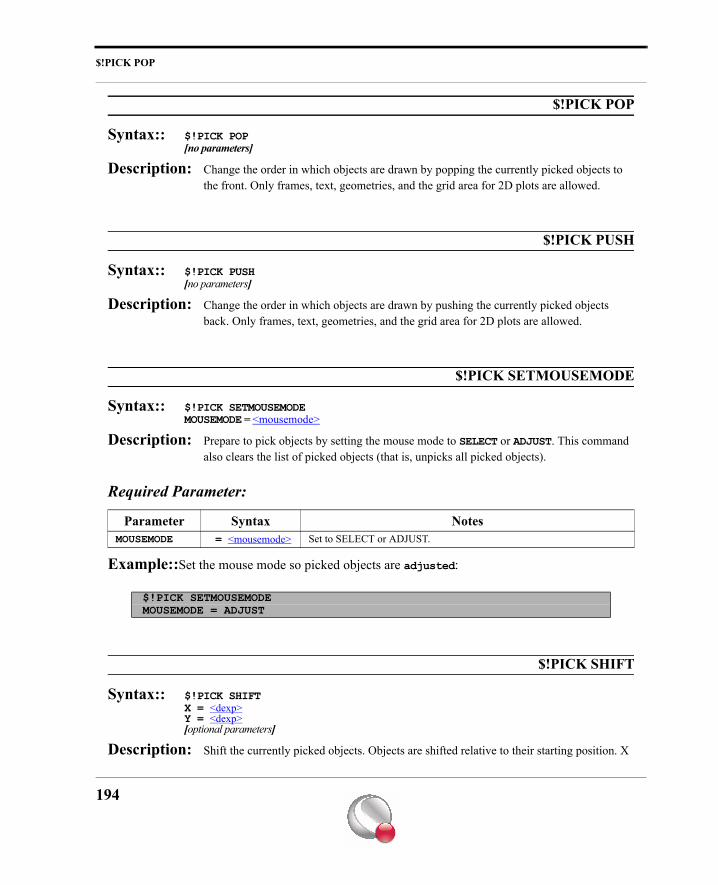
$!PICK POP
$!PICK POP
Syntax:: $!PICK POP[no parameters]
Description: Change the order in which objects are drawn by popping the currently picked objects to the front. Only frames, text, geometries, and the grid area for 2D plots are allowed.
$!PICK PUSH
Syntax:: $!PICK PUSH[no parameters]
Description: Change the order in which objects are drawn by pushing the currently picked objects back. Only frames, text, geometries, and the grid area for 2D plots are allowed.
$!PICK SETMOUSEMODE
Syntax:: $!PICK SETMOUSEMODEMOUSEMODE = <mousemode>
Description: Prepare to pick objects by setting the mouse mode to SELECT or ADJUST. This command also clears the list of picked objects (that is, unpicks all picked objects).
Required Parameter:
Example::Set the mouse mode so picked objects are adjusted:
$!PICK SHIFT
Syntax:: $!PICK SHIFTX = <dexp>Y = <dexp>[optional parameters]
Description: Shift the currently picked objects. Objects are shifted relative to their starting position. X
Parameter Syntax NotesMOUSEMODE = <mousemode> Set to SELECT or ADJUST.
$!PICK SETMOUSEMODEMOUSEMODE = ADJUST
194
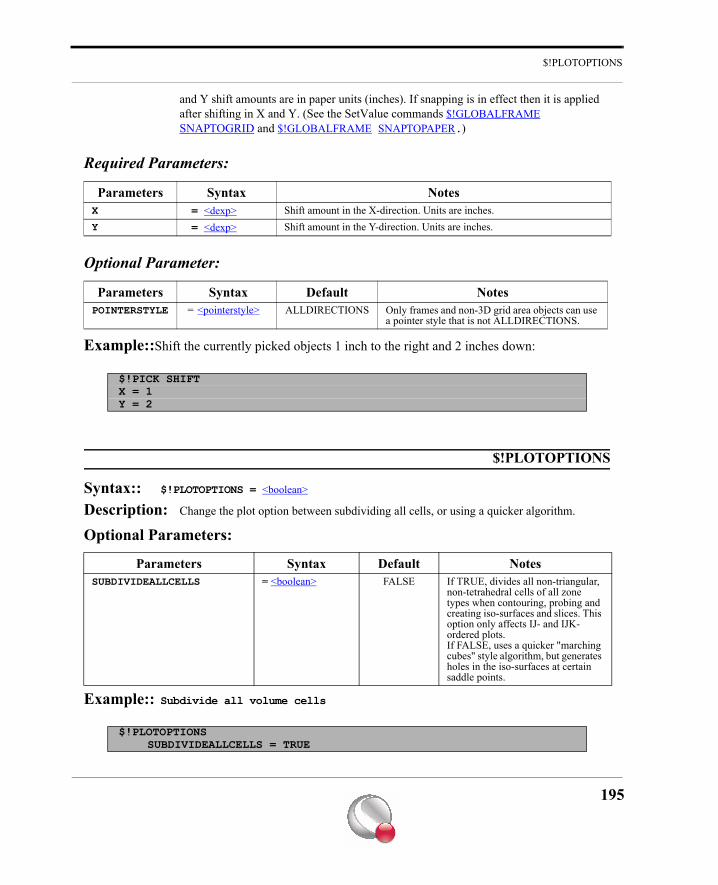
$!PLOTOPTIONS
and Y shift amounts are in paper units (inches). If snapping is in effect then it is applied after shifting in X and Y. (See the SetValue commands $!GLOBALFRAME SNAPTOGRID and $!GLOBALFRAME SNAPTOPAPER.)
Required Parameters:
Optional Parameter:
Example::Shift the currently picked objects 1 inch to the right and 2 inches down:
$!PLOTOPTIONS
Syntax:: $!PLOTOPTIONS = <boolean>
Description: Change the plot option between subdividing all cells, or using a quicker algorithm.
Optional Parameters:
Example:: Subdivide all volume cells
Parameters Syntax NotesX = <dexp> Shift amount in the X-direction. Units are inches.Y = <dexp> Shift amount in the Y-direction. Units are inches.
Parameters Syntax Default NotesPOINTERSTYLE = <pointerstyle> ALLDIRECTIONS Only frames and non-3D grid area objects can use
a pointer style that is not ALLDIRECTIONS.
$!PICK SHIFTX = 1Y = 2
Parameters Syntax Default NotesSUBDIVIDEALLCELLS = <boolean> FALSE If TRUE, divides all non-triangular,
non-tetrahedral cells of all zone types when contouring, probing and creating iso-surfaces and slices. This option only affects IJ- and IJK- ordered plots. If FALSE, uses a quicker "marching cubes" style algorithm, but generates holes in the iso-surfaces at certain saddle points.
$!PLOTOPTIONSSUBDIVIDEALLCELLS = TRUE
195
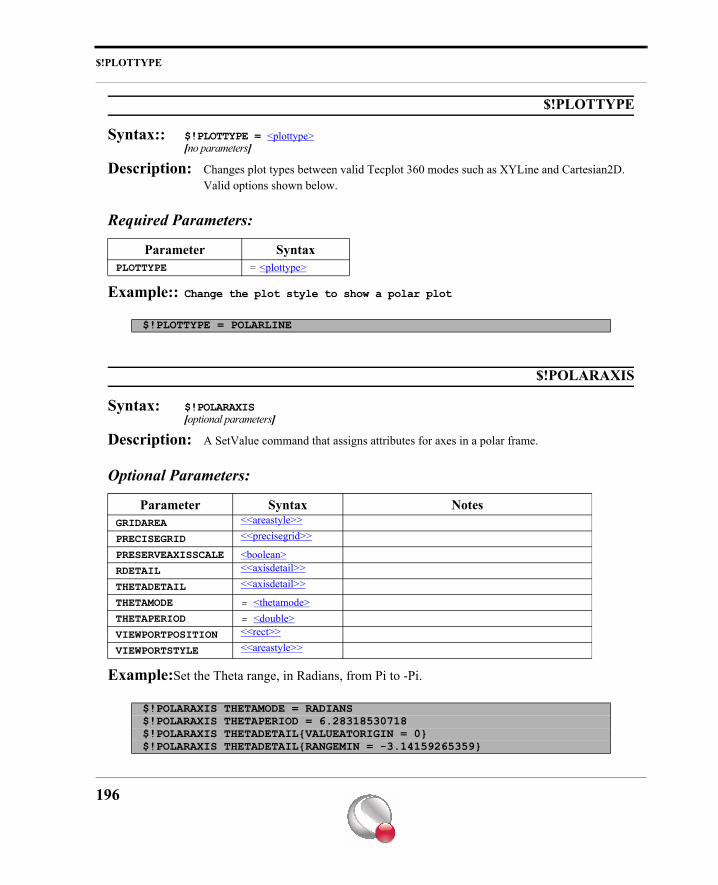
$!PLOTTYPE
$!PLOTTYPE
Syntax:: $!PLOTTYPE = <plottype>[no parameters]
Description: Changes plot types between valid Tecplot 360 modes such as XYLine and Cartesian2D. Valid options shown below.
Required Parameters:
Example:: Change the plot style to show a polar plot
$!POLARAXIS
Syntax: $!POLARAXIS[optional parameters]
Description: A SetValue command that assigns attributes for axes in a polar frame.
Optional Parameters:
Example:Set the Theta range, in Radians, from Pi to -Pi.
Parameter SyntaxPLOTTYPE = <plottype>
$!PLOTTYPE = POLARLINE
Parameter Syntax NotesGRIDAREA <<areastyle>>
PRECISEGRID <<precisegrid>>
PRESERVEAXISSCALE <boolean>RDETAIL <<axisdetail>>
THETADETAIL <<axisdetail>>
THETAMODE = <thetamode>THETAPERIOD = <double>VIEWPORTPOSITION <<rect>>
VIEWPORTSTYLE <<areastyle>>
$!POLARAXIS THETAMODE = RADIANS$!POLARAXIS THETAPERIOD = 6.28318530718$!POLARAXIS THETADETAIL{VALUEATORIGIN = 0}$!POLARAXIS THETADETAIL{RANGEMIN = -3.14159265359}
196
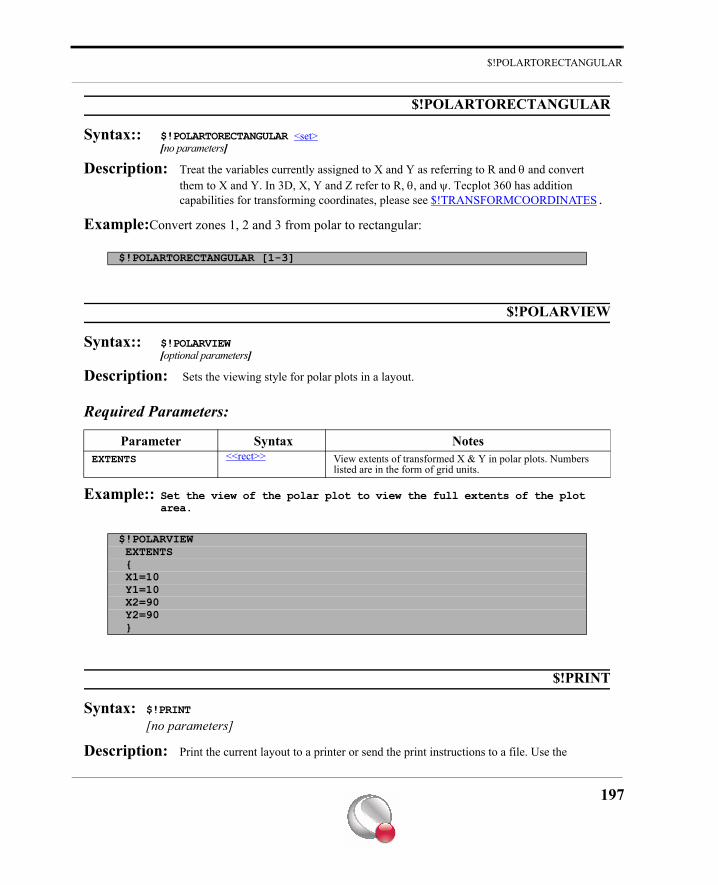
$!POLARTORECTANGULAR
$!POLARTORECTANGULAR
Syntax:: $!POLARTORECTANGULAR <set>[no parameters]
Description: Treat the variables currently assigned to X and Y as referring to R and θ and convert them to X and Y. In 3D, X, Y and Z refer to R, θ, and ψ. Tecplot 360 has addition capabilities for transforming coordinates, please see $!TRANSFORMCOORDINATES.
Example:Convert zones 1, 2 and 3 from polar to rectangular:
$!POLARVIEW
Syntax:: $!POLARVIEW[optional parameters]
Description: Sets the viewing style for polar plots in a layout.
Required Parameters:
Example:: Set the view of the polar plot to view the full extents of the plot area.
Syntax: $!PRINT
[no parameters]
Description: Print the current layout to a printer or send the print instructions to a file. Use the
$!POLARTORECTANGULAR [1-3]
Parameter Syntax NotesEXTENTS <<rect>> View extents of transformed X & Y in polar plots. Numbers
listed are in the form of grid units.
$!POLARVIEW EXTENTS { X1=10 Y1=10 X2=90 Y2=90 }
197
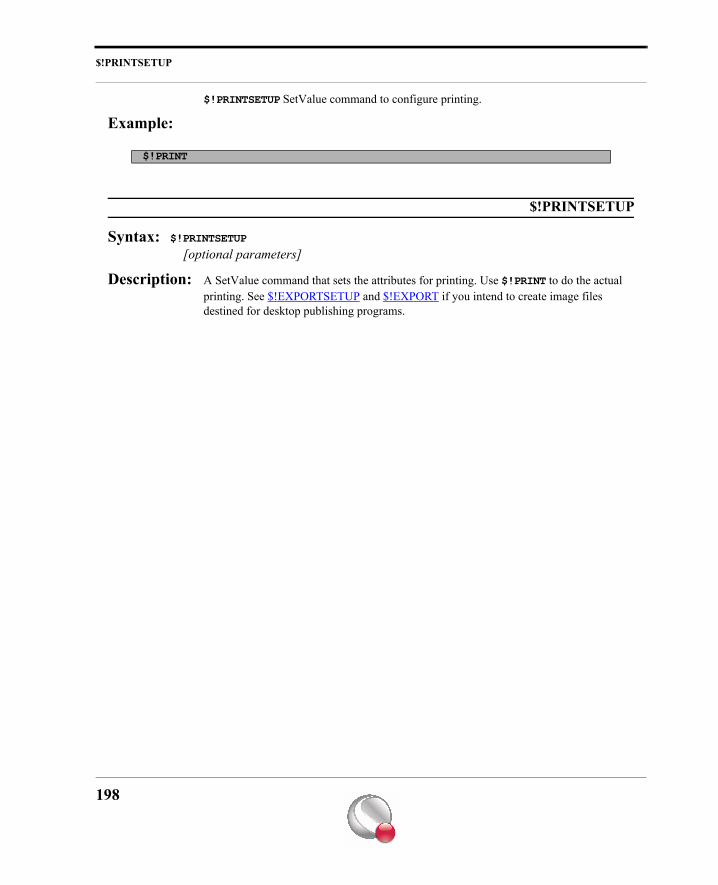
$!PRINTSETUP
$!PRINTSETUP SetValue command to configure printing.
Example:
$!PRINTSETUP
Syntax: $!PRINTSETUP
[optional parameters]
Description: A SetValue command that sets the attributes for printing. Use $!PRINT to do the actual printing. See $!EXPORTSETUP and $!EXPORT if you intend to create image files destined for desktop publishing programs.
198
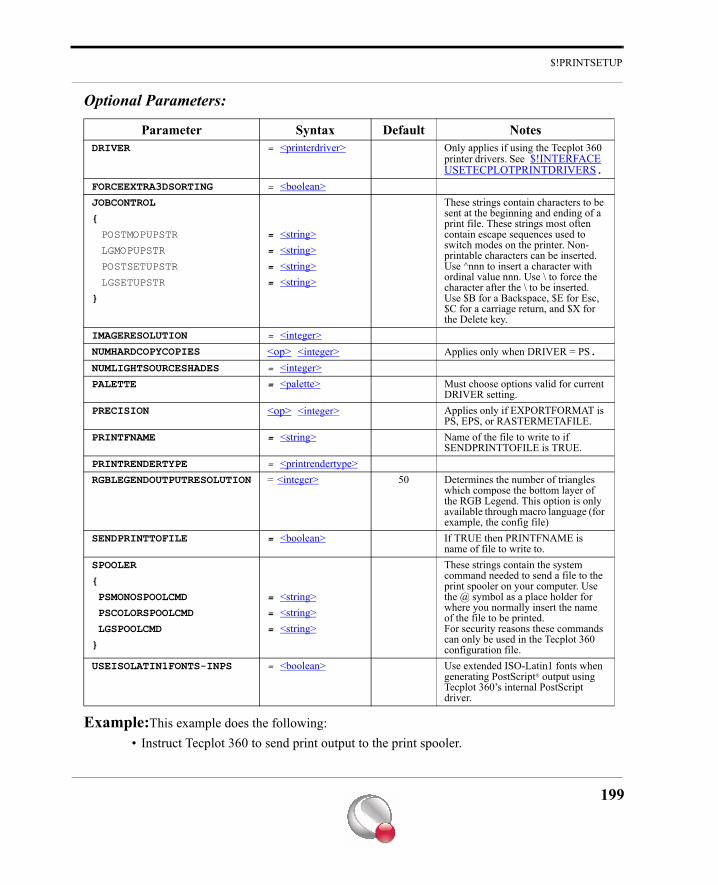
$!PRINTSETUP
Optional Parameters:
Example:This example does the following:• Instruct Tecplot 360 to send print output to the print spooler.
Parameter Syntax Default NotesDRIVER = <printerdriver> Only applies if using the Tecplot 360
printer drivers. See $!INTERFACE USETECPLOTPRINTDRIVERS.
FORCEEXTRA3DSORTING = <boolean>JOBCONTROL These strings contain characters to be
sent at the beginning and ending of a print file. These strings most often contain escape sequences used to switch modes on the printer. Non-printable characters can be inserted. Use ^nnn to insert a character with ordinal value nnn. Use \ to force the character after the \ to be inserted. Use $B for a Backspace, $E for Esc, $C for a carriage return, and $X for the Delete key.
{
POSTMOPUPSTR = <string>LGMOPUPSTR = <string>POSTSETUPSTR = <string>LGSETUPSTR = <string>
}
IMAGERESOLUTION = <integer>NUMHARDCOPYCOPIES <op> <integer> Applies only when DRIVER = PS.NUMLIGHTSOURCESHADES = <integer>PALETTE = <palette> Must choose options valid for current
DRIVER setting.PRECISION <op> <integer> Applies only if EXPORTFORMAT is
PS, EPS, or RASTERMETAFILE.PRINTFNAME = <string> Name of the file to write to if
SENDPRINTTOFILE is TRUE.PRINTRENDERTYPE = <printrendertype>RGBLEGENDOUTPUTRESOLUTION = <integer> 50 Determines the number of triangles
which compose the bottom layer of the RGB Legend. This option is only available through macro language (for example, the config file)
SENDPRINTTOFILE = <boolean> If TRUE then PRINTFNAME is name of file to write to.
SPOOLER These strings contain the system command needed to send a file to the print spooler on your computer. Use the @ symbol as a place holder for where you normally insert the name of the file to be printed.For security reasons these commands can only be used in the Tecplot 360 configuration file.
{
PSMONOSPOOLCMD = <string> PSCOLORSPOOLCMD = <string> LGSPOOLCMD = <string>}
USEISOLATIN1FONTS-INPS = <boolean> Use extended ISO-Latin1 fonts when generating PostScript® output using Tecplot 360’s internal PostScript driver.
199
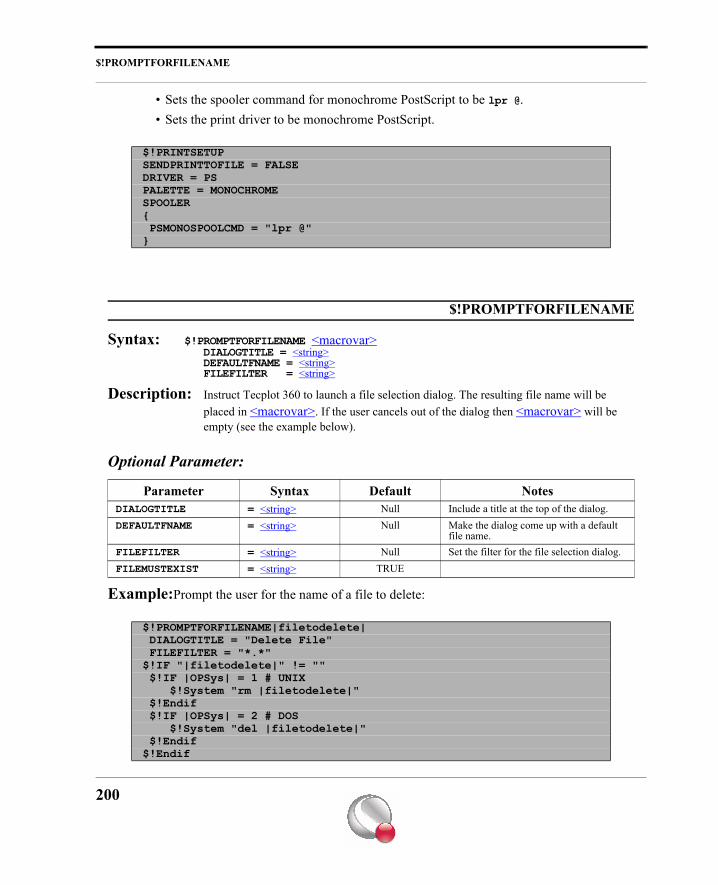
$!PROMPTFORFILENAME
• Sets the spooler command for monochrome PostScript to be lpr @.• Sets the print driver to be monochrome PostScript.
$!PROMPTFORFILENAME
Syntax: $!PROMPTFORFILENAME <macrovar> DIALOGTITLE = <string> DEFAULTFNAME = <string> FILEFILTER = <string>
Description: Instruct Tecplot 360 to launch a file selection dialog. The resulting file name will be placed in <macrovar>. If the user cancels out of the dialog then <macrovar> will be empty (see the example below).
Optional Parameter:
Example:Prompt the user for the name of a file to delete:
$!PRINTSETUPSENDPRINTTOFILE = FALSEDRIVER = PSPALETTE = MONOCHROMESPOOLER{ PSMONOSPOOLCMD = "lpr @"}
Parameter Syntax Default NotesDIALOGTITLE = <string> Null Include a title at the top of the dialog.DEFAULTFNAME = <string> Null Make the dialog come up with a default
file name.FILEFILTER = <string> Null Set the filter for the file selection dialog.FILEMUSTEXIST = <string> TRUE
$!PROMPTFORFILENAME|filetodelete| DIALOGTITLE = "Delete File" FILEFILTER = "*.*"$!IF "|filetodelete|" != "" $!IF |OPSys| = 1 # UNIX $!System "rm |filetodelete|" $!Endif $!IF |OPSys| = 2 # DOS $!System "del |filetodelete|" $!Endif$!Endif
200
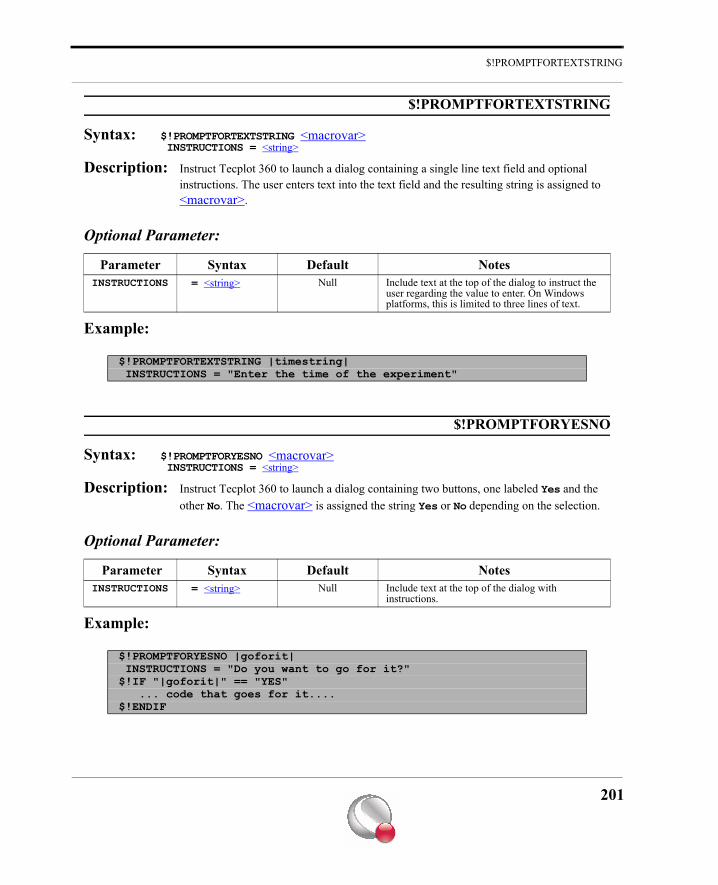
$!PROMPTFORTEXTSTRING
$!PROMPTFORTEXTSTRING
Syntax: $!PROMPTFORTEXTSTRING <macrovar> INSTRUCTIONS = <string>
Description: Instruct Tecplot 360 to launch a dialog containing a single line text field and optional instructions. The user enters text into the text field and the resulting string is assigned to <macrovar>.
Optional Parameter:
Example:
$!PROMPTFORYESNO
Syntax: $!PROMPTFORYESNO <macrovar> INSTRUCTIONS = <string>
Description: Instruct Tecplot 360 to launch a dialog containing two buttons, one labeled Yes and the other No. The <macrovar> is assigned the string Yes or No depending on the selection.
Optional Parameter:
Example:
Parameter Syntax Default NotesINSTRUCTIONS = <string> Null Include text at the top of the dialog to instruct the
user regarding the value to enter. On Windows platforms, this is limited to three lines of text.
$!PROMPTFORTEXTSTRING |timestring| INSTRUCTIONS = "Enter the time of the experiment"
Parameter Syntax Default NotesINSTRUCTIONS = <string> Null Include text at the top of the dialog with
instructions.
$!PROMPTFORYESNO |goforit| INSTRUCTIONS = "Do you want to go for it?"$!IF "|goforit|" == "YES" ... code that goes for it....$!ENDIF
201
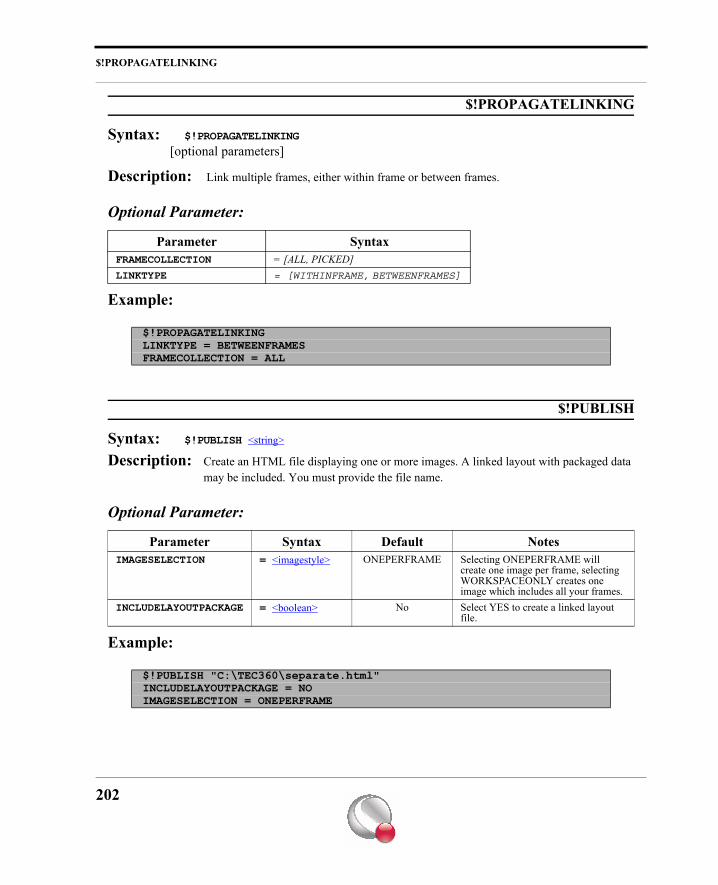
$!PROPAGATELINKING
$!PROPAGATELINKING
Syntax: $!PROPAGATELINKING [optional parameters]
Description: Link multiple frames, either within frame or between frames.
Optional Parameter:
Example:
$!PUBLISH
Syntax: $!PUBLISH <string>
Description: Create an HTML file displaying one or more images. A linked layout with packaged data may be included. You must provide the file name.
Optional Parameter:
Example:
Parameter SyntaxFRAMECOLLECTION = [ALL, PICKED]LINKTYPE = [WITHINFRAME, BETWEENFRAMES]
$!PROPAGATELINKINGLINKTYPE = BETWEENFRAMESFRAMECOLLECTION = ALL
Parameter Syntax Default NotesIMAGESELECTION = <imagestyle> ONEPERFRAME Selecting ONEPERFRAME will
create one image per frame, selecting WORKSPACEONLY creates one image which includes all your frames.
INCLUDELAYOUTPACKAGE = <boolean> No Select YES to create a linked layout file.
$!PUBLISH "C:\TEC360\separate.html"INCLUDELAYOUTPACKAGE = NOIMAGESELECTION = ONEPERFRAME
202
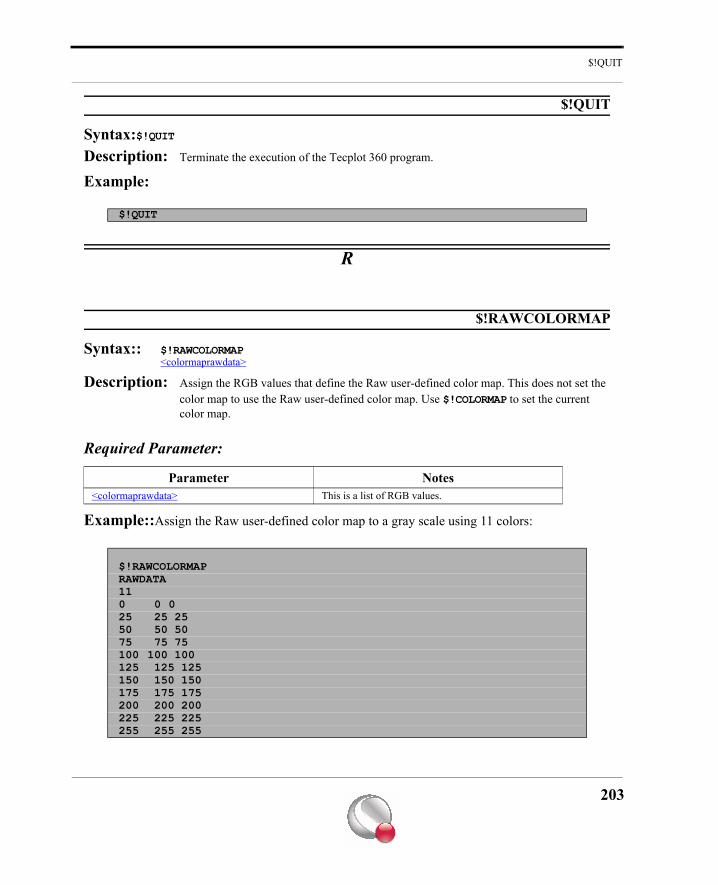
$!QUIT
$!QUIT
Syntax:$!QUITDescription: Terminate the execution of the Tecplot 360 program.
Example:
R
$!RAWCOLORMAP
Syntax:: $!RAWCOLORMAP<colormaprawdata>
Description: Assign the RGB values that define the Raw user-defined color map. This does not set the color map to use the Raw user-defined color map. Use $!COLORMAP to set the current color map.
Required Parameter:
Example::Assign the Raw user-defined color map to a gray scale using 11 colors:
$!QUIT
Parameter Notes<colormaprawdata> This is a list of RGB values.
$!RAWCOLORMAPRAWDATA110 0 025 25 2550 50 5075 75 75100 100 100125 125 125150 150 150175 175 175200 200 200225 225 225255 255 255
203
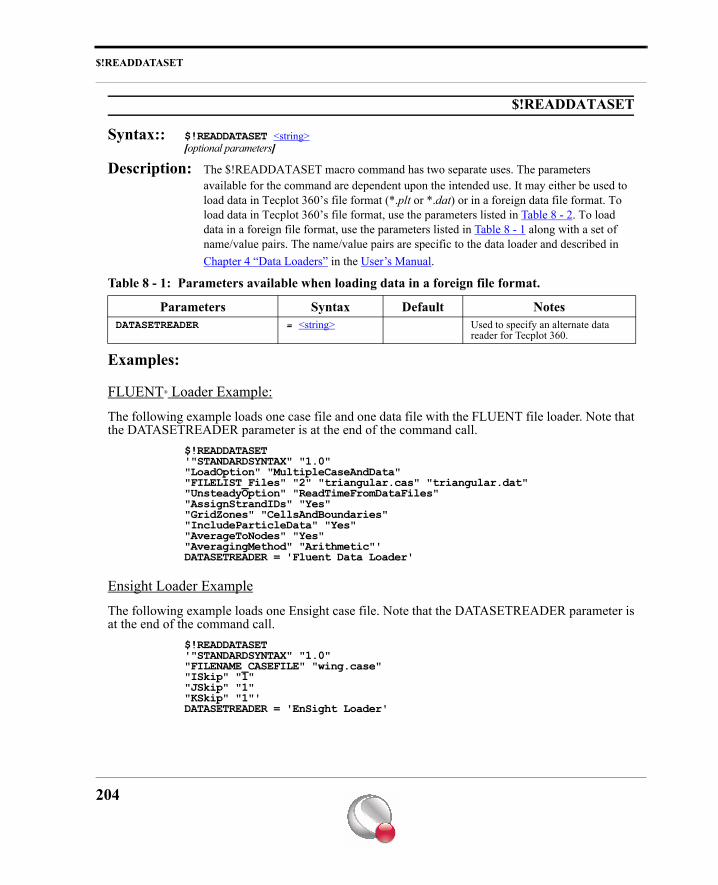
$!READDATASET
$!READDATASET
Syntax:: $!READDATASET <string>[optional parameters]
Description: The $!READDATASET macro command has two separate uses. The parameters available for the command are dependent upon the intended use. It may either be used to load data in Tecplot 360’s file format (*.plt or *.dat) or in a foreign data file format. To load data in Tecplot 360’s file format, use the parameters listed in Table 8 - 2. To load data in a foreign file format, use the parameters listed in Table 8 - 1 along with a set of name/value pairs. The name/value pairs are specific to the data loader and described in Chapter 4 “Data Loaders” in the User’s Manual.
Examples:
FLUENT® Loader Example:
The following example loads one case file and one data file with the FLUENT file loader. Note thatthe DATASETREADER parameter is at the end of the command call.
$!READDATASET'"STANDARDSYNTAX" "1.0""LoadOption" "MultipleCaseAndData""FILELIST_Files" "2" "triangular.cas" "triangular.dat""UnsteadyOption" "ReadTimeFromDataFiles""AssignStrandIDs" "Yes""GridZones" "CellsAndBoundaries" "IncludeParticleData" "Yes""AverageToNodes" "Yes""AveragingMethod" "Arithmetic"' DATASETREADER = 'Fluent Data Loader'
Ensight Loader Example
The following example loads one Ensight case file. Note that the DATASETREADER parameter isat the end of the command call.
$!READDATASET'"STANDARDSYNTAX" "1.0""FILENAME_CASEFILE" "wing.case""ISkip" "1""JSkip" "1""KSkip" "1"' DATASETREADER = 'EnSight Loader'
Table 8 - 1: Parameters available when loading data in a foreign file format.
Parameters Syntax Default NotesDATASETREADER = <string> Used to specify an alternate data
reader for Tecplot 360.
204
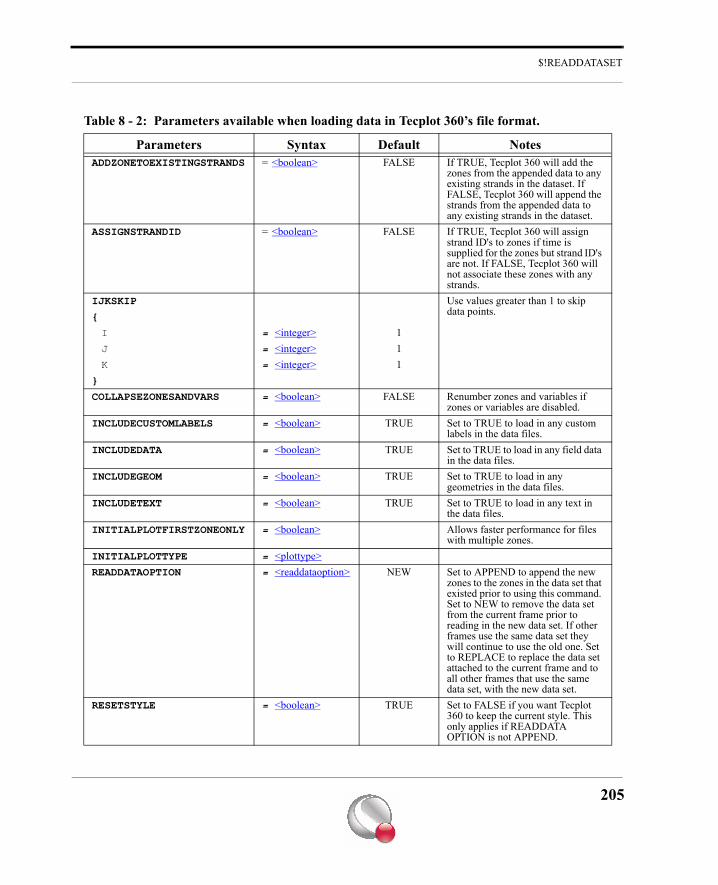
$!READDATASET
Table 8 - 2: Parameters available when loading data in Tecplot 360’s file format.
Parameters Syntax Default NotesADDZONETOEXISTINGSTRANDS = <boolean> FALSE If TRUE, Tecplot 360 will add the
zones from the appended data to any existing strands in the dataset. If FALSE, Tecplot 360 will append the strands from the appended data to any existing strands in the dataset.
ASSIGNSTRANDID = <boolean> FALSE If TRUE, Tecplot 360 will assign strand ID's to zones if time is supplied for the zones but strand ID's are not. If FALSE, Tecplot 360 will not associate these zones with any strands.
IJKSKIP Use values greater than 1 to skip data points.{
I = <integer> 1J = <integer> 1K = <integer> 1
}
COLLAPSEZONESANDVARS = <boolean> FALSE Renumber zones and variables if zones or variables are disabled.
INCLUDECUSTOMLABELS = <boolean> TRUE Set to TRUE to load in any custom labels in the data files.
INCLUDEDATA = <boolean> TRUE Set to TRUE to load in any field data in the data files.
INCLUDEGEOM = <boolean> TRUE Set to TRUE to load in any geometries in the data files.
INCLUDETEXT = <boolean> TRUE Set to TRUE to load in any text in the data files.
INITIALPLOTFIRSTZONEONLY = <boolean> Allows faster performance for files with multiple zones.
INITIALPLOTTYPE = <plottype>READDATAOPTION = <readdataoption> NEW Set to APPEND to append the new
zones to the zones in the data set that existed prior to using this command. Set to NEW to remove the data set from the current frame prior to reading in the new data set. If other frames use the same data set they will continue to use the old one. Set to REPLACE to replace the data set attached to the current frame and to all other frames that use the same data set, with the new data set.
RESETSTYLE = <boolean> TRUE Set to FALSE if you want Tecplot 360 to keep the current style. This only applies if READDATA OPTION is not APPEND.
205
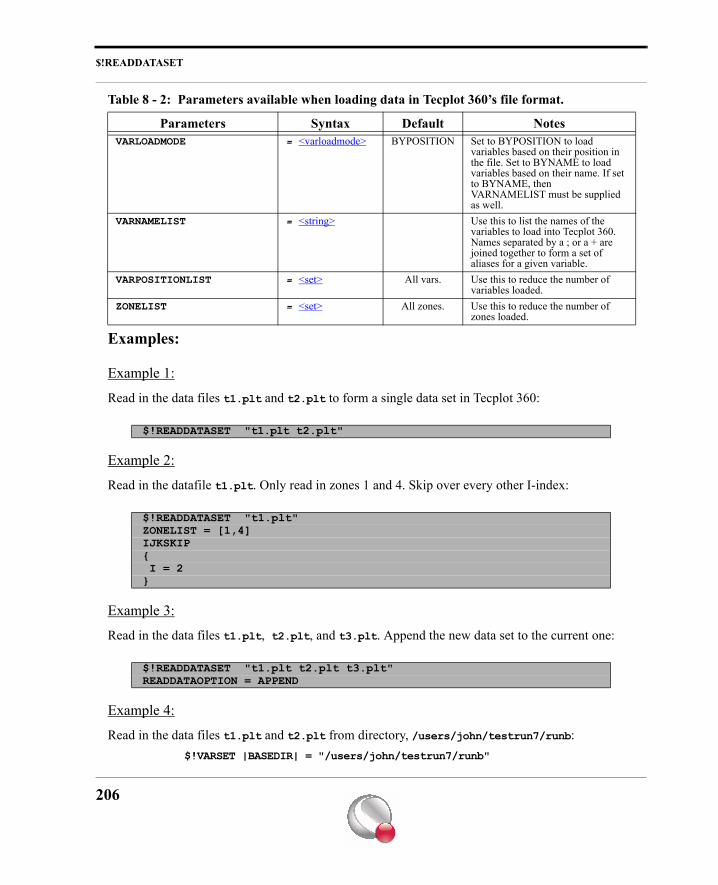
$!READDATASET
Examples:
Example 1:
Read in the data files t1.plt and t2.plt to form a single data set in Tecplot 360:
Example 2:
Read in the datafile t1.plt. Only read in zones 1 and 4. Skip over every other I-index:
Example 3:
Read in the data files t1.plt, t2.plt, and t3.plt. Append the new data set to the current one:
Example 4:
Read in the data files t1.plt and t2.plt from directory, /users/john/testrun7/runb:$!VARSET |BASEDIR| = "/users/john/testrun7/runb"
VARLOADMODE = <varloadmode> BYPOSITION Set to BYPOSITION to load variables based on their position in the file. Set to BYNAME to load variables based on their name. If set to BYNAME, then VARNAMELIST must be supplied as well.
VARNAMELIST = <string> Use this to list the names of the variables to load into Tecplot 360. Names separated by a ; or a + are joined together to form a set of aliases for a given variable.
VARPOSITIONLIST = <set> All vars. Use this to reduce the number of variables loaded.
ZONELIST = <set> All zones. Use this to reduce the number of zones loaded.
$!READDATASET "t1.plt t2.plt"
$!READDATASET "t1.plt"ZONELIST = [1,4]IJKSKIP{ I = 2}
$!READDATASET "t1.plt t2.plt t3.plt"READDATAOPTION = APPEND
Table 8 - 2: Parameters available when loading data in Tecplot 360’s file format.
Parameters Syntax Default Notes
206
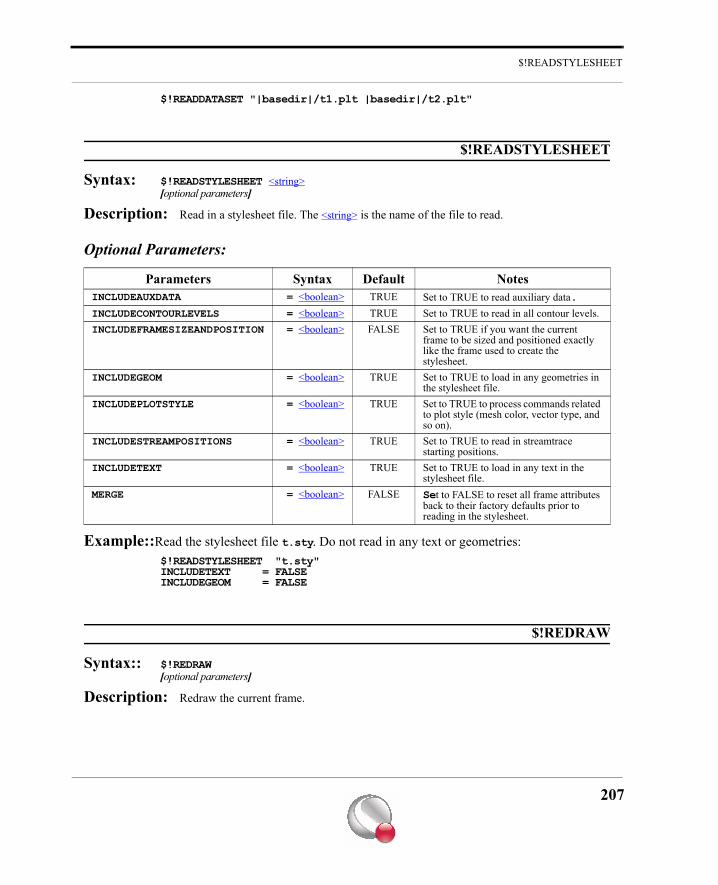
$!READSTYLESHEET
$!READDATASET "|basedir|/t1.plt |basedir|/t2.plt"
$!READSTYLESHEET
Syntax: $!READSTYLESHEET <string>[optional parameters]
Description: Read in a stylesheet file. The <string> is the name of the file to read.
Optional Parameters:
Example::Read the stylesheet file t.sty. Do not read in any text or geometries:$!READSTYLESHEET "t.sty"INCLUDETEXT = FALSEINCLUDEGEOM = FALSE
$!REDRAW
Syntax:: $!REDRAW[optional parameters]
Description: Redraw the current frame.
Parameters Syntax Default NotesINCLUDEAUXDATA = <boolean> TRUE Set to TRUE to read auxiliary data.INCLUDECONTOURLEVELS = <boolean> TRUE Set to TRUE to read in all contour levels.INCLUDEFRAMESIZEANDPOSITION = <boolean> FALSE Set to TRUE if you want the current
frame to be sized and positioned exactly like the frame used to create the stylesheet.
INCLUDEGEOM = <boolean> TRUE Set to TRUE to load in any geometries in the stylesheet file.
INCLUDEPLOTSTYLE = <boolean> TRUE Set to TRUE to process commands related to plot style (mesh color, vector type, and so on).
INCLUDESTREAMPOSITIONS = <boolean> TRUE Set to TRUE to read in streamtrace starting positions.
INCLUDETEXT = <boolean> TRUE Set to TRUE to load in any text in the stylesheet file.
MERGE = <boolean> FALSE Set to FALSE to reset all frame attributes back to their factory defaults prior to reading in the stylesheet.
207
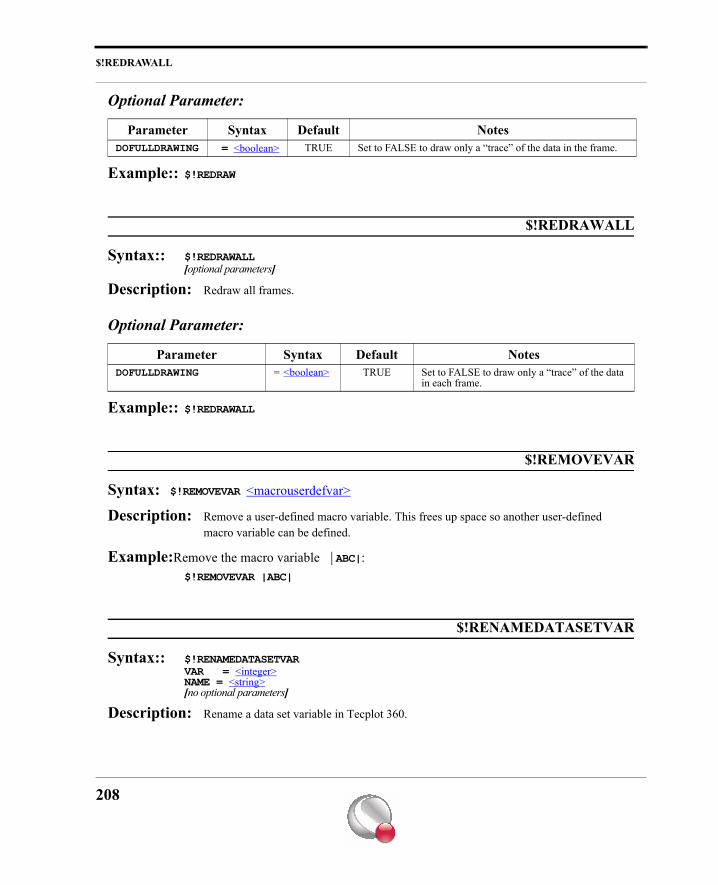
$!REDRAWALL
Optional Parameter:
Example:: $!REDRAW
$!REDRAWALL
Syntax:: $!REDRAWALL[optional parameters]
Description: Redraw all frames.
Optional Parameter:
Example:: $!REDRAWALL
$!REMOVEVAR
Syntax: $!REMOVEVAR <macrouserdefvar>
Description: Remove a user-defined macro variable. This frees up space so another user-defined macro variable can be defined.
Example:Remove the macro variable |ABC|:$!REMOVEVAR |ABC|
$!RENAMEDATASETVAR
Syntax:: $!RENAMEDATASETVARVAR = <integer>NAME = <string>[no optional parameters]
Description: Rename a data set variable in Tecplot 360.
Parameter Syntax Default NotesDOFULLDRAWING = <boolean> TRUE Set to FALSE to draw only a “trace” of the data in the frame.
Parameter Syntax Default NotesDOFULLDRAWING = <boolean> TRUE Set to FALSE to draw only a “trace” of the data
in each frame.
208
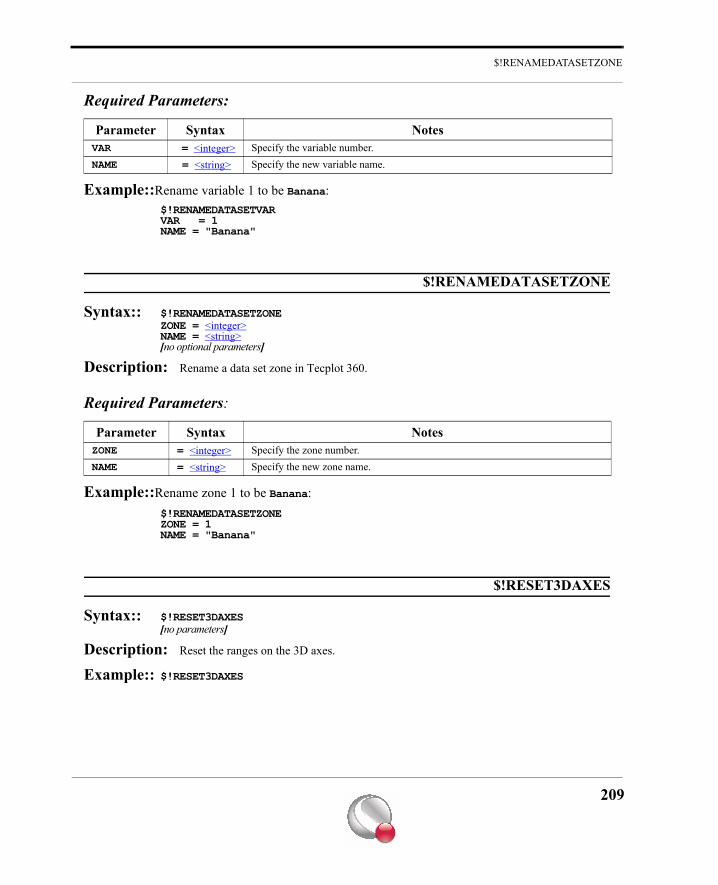
$!RENAMEDATASETZONE
Required Parameters:
Example::Rename variable 1 to be Banana:$!RENAMEDATASETVARVAR = 1NAME = "Banana"
$!RENAMEDATASETZONE
Syntax:: $!RENAMEDATASETZONEZONE = <integer>NAME = <string>[no optional parameters]
Description: Rename a data set zone in Tecplot 360.
Required Parameters:
Example::Rename zone 1 to be Banana:$!RENAMEDATASETZONEZONE = 1NAME = "Banana"
$!RESET3DAXES
Syntax:: $!RESET3DAXES[no parameters]
Description: Reset the ranges on the 3D axes.
Example:: $!RESET3DAXES
Parameter Syntax NotesVAR = <integer> Specify the variable number.NAME = <string> Specify the new variable name.
Parameter Syntax NotesZONE = <integer> Specify the zone number.NAME = <string> Specify the new zone name.
209
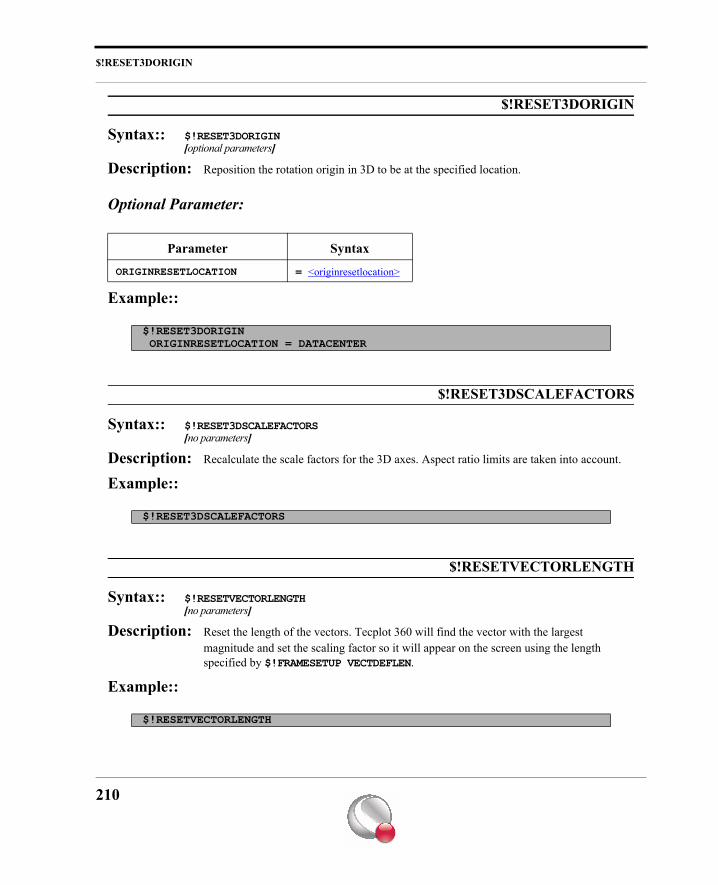
$!RESET3DORIGIN
$!RESET3DORIGIN
Syntax:: $!RESET3DORIGIN[optional parameters]
Description: Reposition the rotation origin in 3D to be at the specified location.
Optional Parameter:
Example::
$!RESET3DSCALEFACTORS
Syntax:: $!RESET3DSCALEFACTORS[no parameters]
Description: Recalculate the scale factors for the 3D axes. Aspect ratio limits are taken into account.
Example::
$!RESETVECTORLENGTH
Syntax:: $!RESETVECTORLENGTH[no parameters]
Description: Reset the length of the vectors. Tecplot 360 will find the vector with the largest magnitude and set the scaling factor so it will appear on the screen using the length specified by $!FRAMESETUP VECTDEFLEN.
Example::
Parameter Syntax
ORIGINRESETLOCATION = <originresetlocation>
$!RESET3DORIGIN ORIGINRESETLOCATION = DATACENTER
$!RESET3DSCALEFACTORS
$!RESETVECTORLENGTH
210
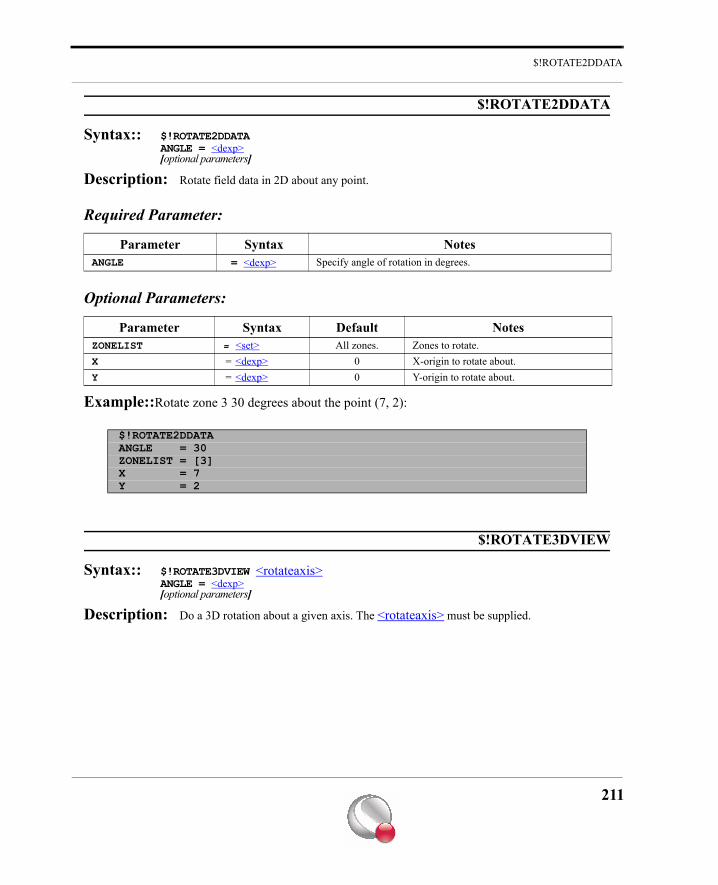
$!ROTATE2DDATA
$!ROTATE2DDATA
Syntax:: $!ROTATE2DDATAANGLE = <dexp>[optional parameters]
Description: Rotate field data in 2D about any point.
Required Parameter:
Optional Parameters:
Example::Rotate zone 3 30 degrees about the point (7, 2):
$!ROTATE3DVIEW
Syntax:: $!ROTATE3DVIEW <rotateaxis>ANGLE = <dexp>[optional parameters]
Description: Do a 3D rotation about a given axis. The <rotateaxis> must be supplied.
Parameter Syntax NotesANGLE = <dexp> Specify angle of rotation in degrees.
Parameter Syntax Default NotesZONELIST = <set> All zones. Zones to rotate.X = <dexp> 0 X-origin to rotate about.Y = <dexp> 0 Y-origin to rotate about.
$!ROTATE2DDATA ANGLE = 30ZONELIST = [3]X = 7Y = 2
211
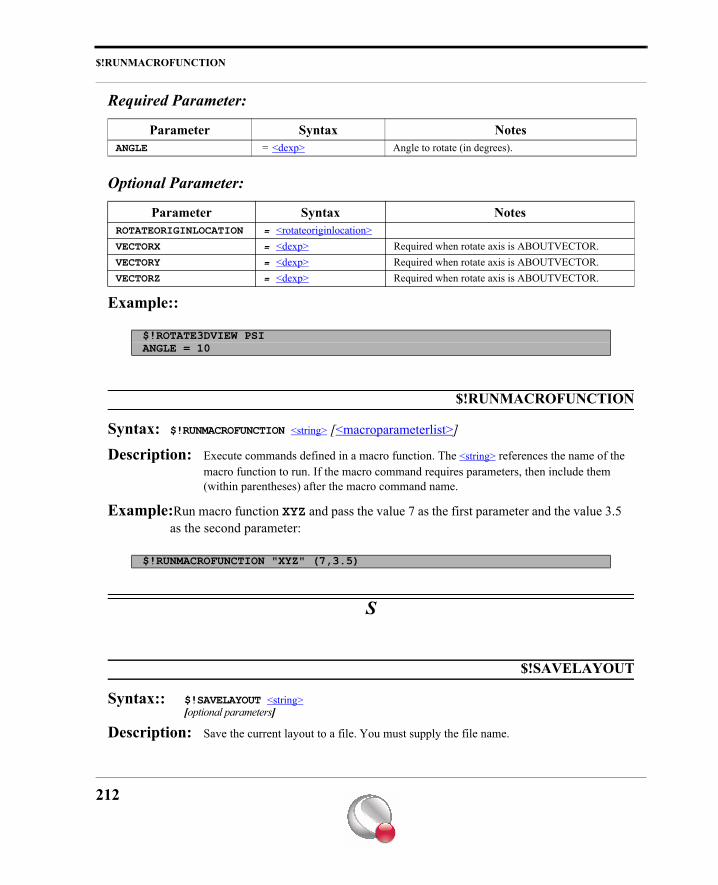
$!RUNMACROFUNCTION
Required Parameter:
Optional Parameter:
Example::
$!RUNMACROFUNCTION
Syntax: $!RUNMACROFUNCTION <string> [<macroparameterlist>]
Description: Execute commands defined in a macro function. The <string> references the name of the macro function to run. If the macro command requires parameters, then include them (within parentheses) after the macro command name.
Example:Run macro function XYZ and pass the value 7 as the first parameter and the value 3.5 as the second parameter:
S
$!SAVELAYOUT
Syntax:: $!SAVELAYOUT <string>[optional parameters]
Description: Save the current layout to a file. You must supply the file name.
Parameter Syntax NotesANGLE = <dexp> Angle to rotate (in degrees).
Parameter Syntax NotesROTATEORIGINLOCATION = <rotateoriginlocation>VECTORX = <dexp> Required when rotate axis is ABOUTVECTOR.VECTORY = <dexp> Required when rotate axis is ABOUTVECTOR.VECTORZ = <dexp> Required when rotate axis is ABOUTVECTOR.
$!ROTATE3DVIEW PSIANGLE = 10
$!RUNMACROFUNCTION "XYZ" (7,3.5)
212
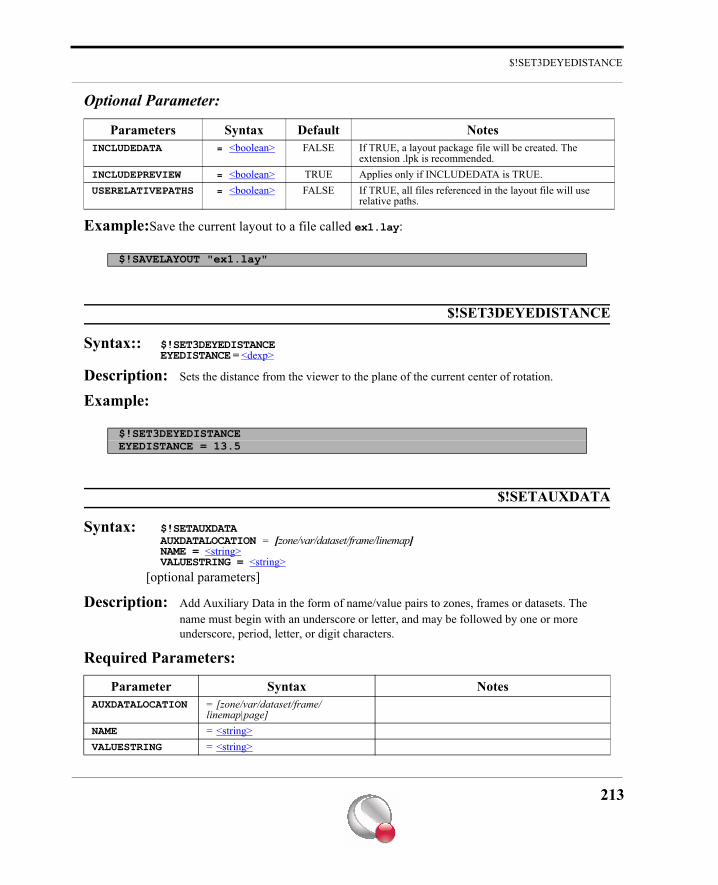
$!SET3DEYEDISTANCE
Optional Parameter:
Example:Save the current layout to a file called ex1.lay:
$!SET3DEYEDISTANCE
Syntax:: $!SET3DEYEDISTANCEEYEDISTANCE = <dexp>
Description: Sets the distance from the viewer to the plane of the current center of rotation.
Example:
$!SETAUXDATA
Syntax: $!SETAUXDATAAUXDATALOCATION = [zone/var/dataset/frame/linemap]NAME = <string>VALUESTRING = <string>
[optional parameters]
Description: Add Auxiliary Data in the form of name/value pairs to zones, frames or datasets. The name must begin with an underscore or letter, and may be followed by one or more underscore, period, letter, or digit characters.
Required Parameters:
Parameters Syntax Default NotesINCLUDEDATA = <boolean> FALSE If TRUE, a layout package file will be created. The
extension .lpk is recommended.INCLUDEPREVIEW = <boolean> TRUE Applies only if INCLUDEDATA is TRUE.USERELATIVEPATHS = <boolean> FALSE If TRUE, all files referenced in the layout file will use
relative paths.
$!SAVELAYOUT "ex1.lay"
$!SET3DEYEDISTANCEEYEDISTANCE = 13.5
Parameter Syntax NotesAUXDATALOCATION = [zone/var/dataset/frame/
linemap|page]NAME = <string>VALUESTRING = <string>
213
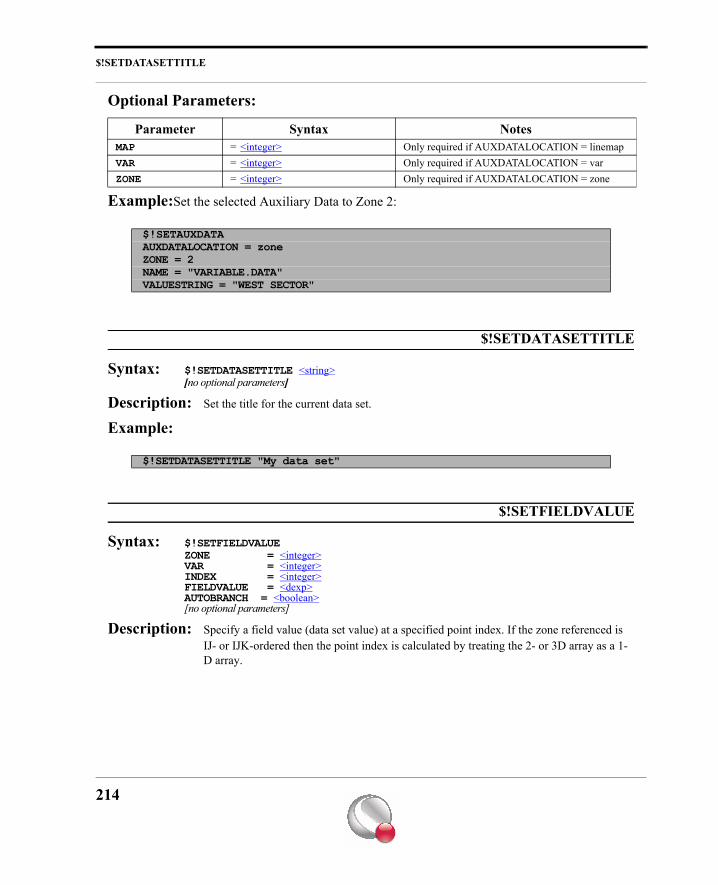
$!SETDATASETTITLE
Optional Parameters:
Example:Set the selected Auxiliary Data to Zone 2:
$!SETDATASETTITLE
Syntax: $!SETDATASETTITLE <string>[no optional parameters]
Description: Set the title for the current data set.
Example:
$!SETFIELDVALUE
Syntax: $!SETFIELDVALUEZONE = <integer>VAR = <integer>INDEX = <integer>FIELDVALUE = <dexp>AUTOBRANCH = <boolean>[no optional parameters]
Description: Specify a field value (data set value) at a specified point index. If the zone referenced is IJ- or IJK-ordered then the point index is calculated by treating the 2- or 3D array as a 1-D array.
Parameter Syntax NotesMAP = <integer> Only required if AUXDATALOCATION = linemapVAR = <integer> Only required if AUXDATALOCATION = varZONE = <integer> Only required if AUXDATALOCATION = zone
$!SETAUXDATAAUXDATALOCATION = zoneZONE = 2NAME = "VARIABLE.DATA"VALUESTRING = "WEST SECTOR"
$!SETDATASETTITLE "My data set"
214
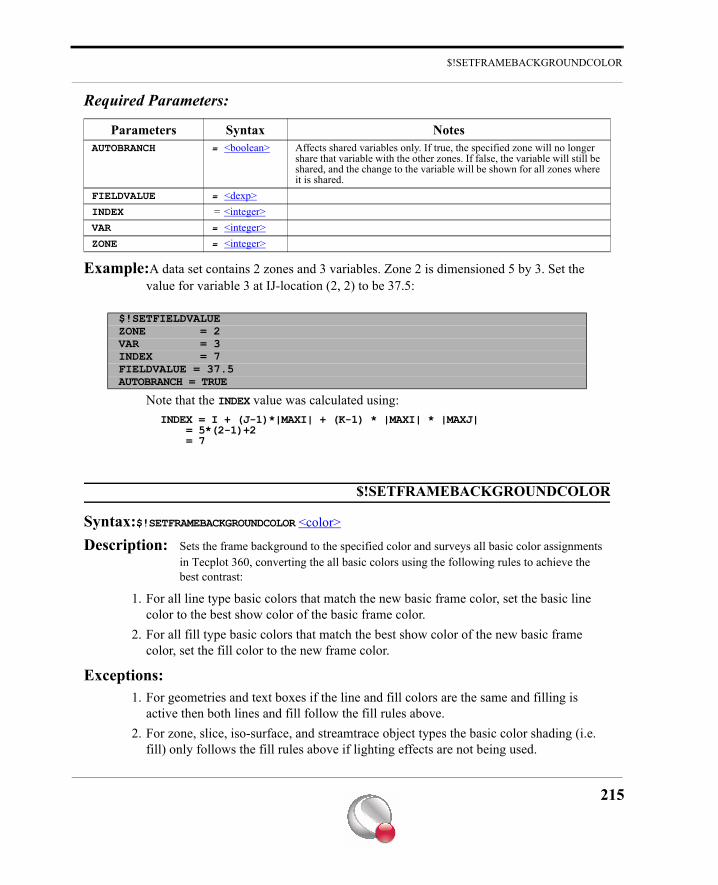
$!SETFRAMEBACKGROUNDCOLOR
Required Parameters:
Example:A data set contains 2 zones and 3 variables. Zone 2 is dimensioned 5 by 3. Set the value for variable 3 at IJ-location (2, 2) to be 37.5:
Note that the INDEX value was calculated using:INDEX = I + (J-1)*|MAXI| + (K-1) * |MAXI| * |MAXJ| = 5*(2-1)+2 = 7
$!SETFRAMEBACKGROUNDCOLOR
Syntax:$!SETFRAMEBACKGROUNDCOLOR <color>
Description: Sets the frame background to the specified color and surveys all basic color assignments in Tecplot 360, converting the all basic colors using the following rules to achieve the best contrast:
1. For all line type basic colors that match the new basic frame color, set the basic line color to the best show color of the basic frame color.
2. For all fill type basic colors that match the best show color of the new basic frame color, set the fill color to the new frame color.
Exceptions: 1. For geometries and text boxes if the line and fill colors are the same and filling is
active then both lines and fill follow the fill rules above.2. For zone, slice, iso-surface, and streamtrace object types the basic color shading (i.e.
fill) only follows the fill rules above if lighting effects are not being used.
Parameters Syntax NotesAUTOBRANCH = <boolean> Affects shared variables only. If true, the specified zone will no longer
share that variable with the other zones. If false, the variable will still be shared, and the change to the variable will be shown for all zones where it is shared.
FIELDVALUE = <dexp>INDEX = <integer>VAR = <integer>ZONE = <integer>
$!SETFIELDVALUEZONE = 2VAR = 3INDEX = 7FIELDVALUE = 37.5AUTOBRANCH = TRUE
215
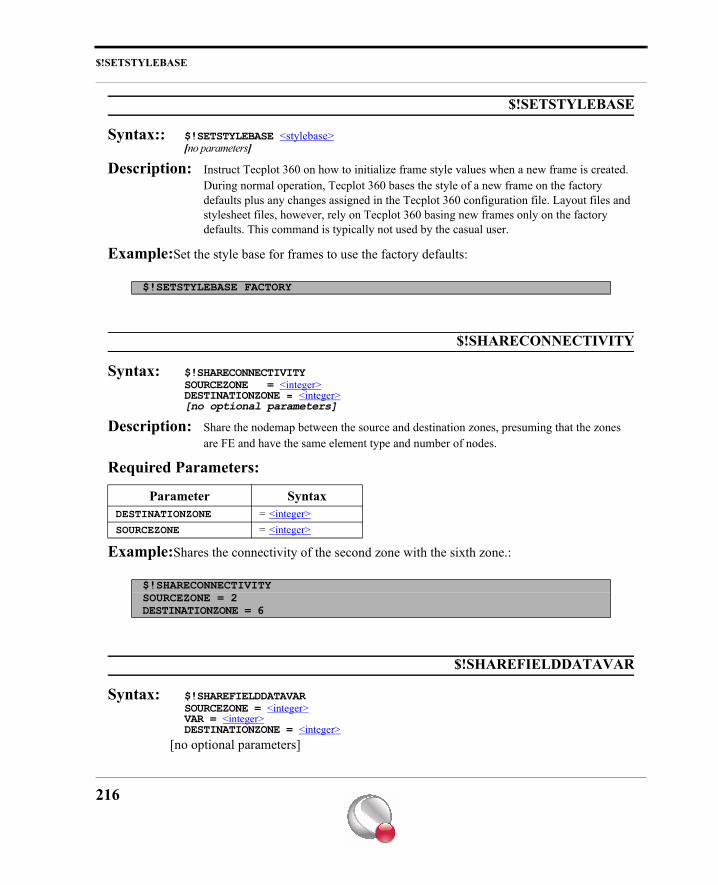
$!SETSTYLEBASE
$!SETSTYLEBASE
Syntax:: $!SETSTYLEBASE <stylebase>[no parameters]
Description: Instruct Tecplot 360 on how to initialize frame style values when a new frame is created. During normal operation, Tecplot 360 bases the style of a new frame on the factory defaults plus any changes assigned in the Tecplot 360 configuration file. Layout files and stylesheet files, however, rely on Tecplot 360 basing new frames only on the factory defaults. This command is typically not used by the casual user.
Example:Set the style base for frames to use the factory defaults:
$!SHARECONNECTIVITY
Syntax: $!SHARECONNECTIVITYSOURCEZONE = <integer>DESTINATIONZONE = <integer>[no optional parameters]
Description: Share the nodemap between the source and destination zones, presuming that the zones are FE and have the same element type and number of nodes.
Required Parameters:
Example:Shares the connectivity of the second zone with the sixth zone.:
$!SHAREFIELDDATAVAR
Syntax: $!SHAREFIELDDATAVARSOURCEZONE = <integer>VAR = <integer>DESTINATIONZONE = <integer>
[no optional parameters]
$!SETSTYLEBASE FACTORY
Parameter SyntaxDESTINATIONZONE = <integer>SOURCEZONE = <integer>
$!SHARECONNECTIVITYSOURCEZONE = 2DESTINATIONZONE = 6
216
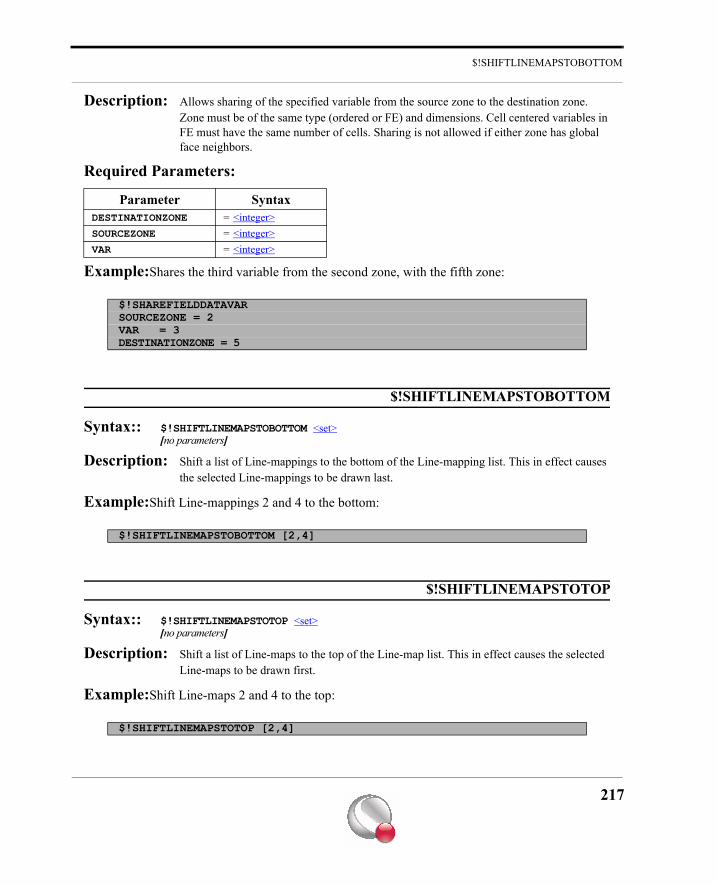
$!SHIFTLINEMAPSTOBOTTOM
Description: Allows sharing of the specified variable from the source zone to the destination zone. Zone must be of the same type (ordered or FE) and dimensions. Cell centered variables in FE must have the same number of cells. Sharing is not allowed if either zone has global face neighbors.
Required Parameters:
Example:Shares the third variable from the second zone, with the fifth zone:
$!SHIFTLINEMAPSTOBOTTOM
Syntax:: $!SHIFTLINEMAPSTOBOTTOM <set>[no parameters]
Description: Shift a list of Line-mappings to the bottom of the Line-mapping list. This in effect causes the selected Line-mappings to be drawn last.
Example:Shift Line-mappings 2 and 4 to the bottom:
$!SHIFTLINEMAPSTOTOP
Syntax:: $!SHIFTLINEMAPSTOTOP <set> [no parameters]
Description: Shift a list of Line-maps to the top of the Line-map list. This in effect causes the selected Line-maps to be drawn first.
Example:Shift Line-maps 2 and 4 to the top:
Parameter SyntaxDESTINATIONZONE = <integer>SOURCEZONE = <integer>VAR = <integer>
$!SHAREFIELDDATAVARSOURCEZONE = 2VAR = 3DESTINATIONZONE = 5
$!SHIFTLINEMAPSTOBOTTOM [2,4]
$!SHIFTLINEMAPSTOTOP [2,4]
217
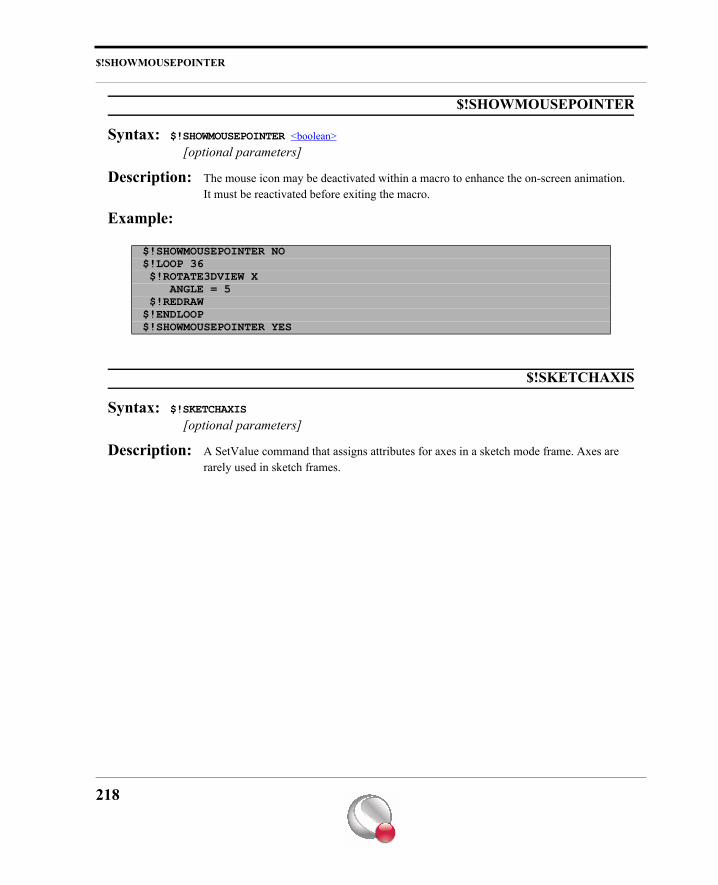
$!SHOWMOUSEPOINTER
$!SHOWMOUSEPOINTER
Syntax: $!SHOWMOUSEPOINTER <boolean> [optional parameters]
Description: The mouse icon may be deactivated within a macro to enhance the on-screen animation. It must be reactivated before exiting the macro.
Example:
$!SKETCHAXIS
Syntax: $!SKETCHAXIS
[optional parameters]
Description: A SetValue command that assigns attributes for axes in a sketch mode frame. Axes are rarely used in sketch frames.
$!SHOWMOUSEPOINTER NO$!LOOP 36 $!ROTATE3DVIEW X ANGLE = 5 $!REDRAW$!ENDLOOP$!SHOWMOUSEPOINTER YES
218
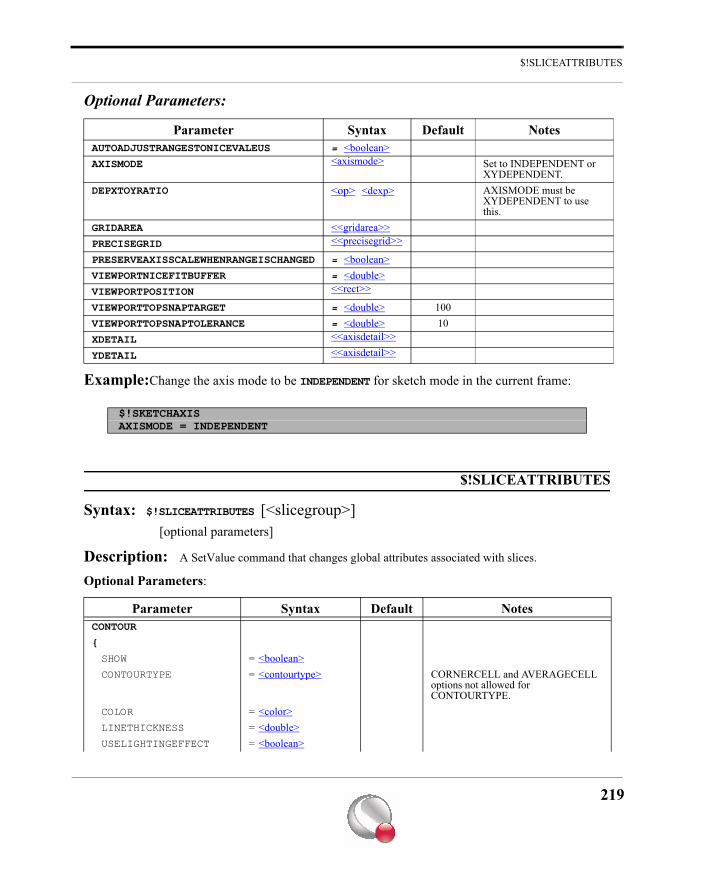
$!SLICEATTRIBUTES
Optional Parameters:
Example:Change the axis mode to be INDEPENDENT for sketch mode in the current frame:
$!SLICEATTRIBUTES
Syntax: $!SLICEATTRIBUTES [<slicegroup>] [optional parameters]
Description: A SetValue command that changes global attributes associated with slices.
Optional Parameters:
Parameter Syntax Default NotesAUTOADJUSTRANGESTONICEVALEUS = <boolean>AXISMODE <axismode> Set to INDEPENDENT or
XYDEPENDENT.DEPXTOYRATIO <op> <dexp> AXISMODE must be
XYDEPENDENT to use this.
GRIDAREA <<gridarea>>PRECISEGRID <<precisegrid>>
PRESERVEAXISSCALEWHENRANGEISCHANGED = <boolean>VIEWPORTNICEFITBUFFER = <double>VIEWPORTPOSITION <<rect>>
VIEWPORTTOPSNAPTARGET = <double> 100VIEWPORTTOPSNAPTOLERANCE = <double> 10XDETAIL <<axisdetail>>
YDETAIL <<axisdetail>>
$!SKETCHAXISAXISMODE = INDEPENDENT
Parameter Syntax Default NotesCONTOUR
{
SHOW = <boolean>CONTOURTYPE = <contourtype> CORNERCELL and AVERAGECELL
options not allowed for CONTOURTYPE.
COLOR = <color>LINETHICKNESS = <double>USELIGHTINGEFFECT = <boolean>
219
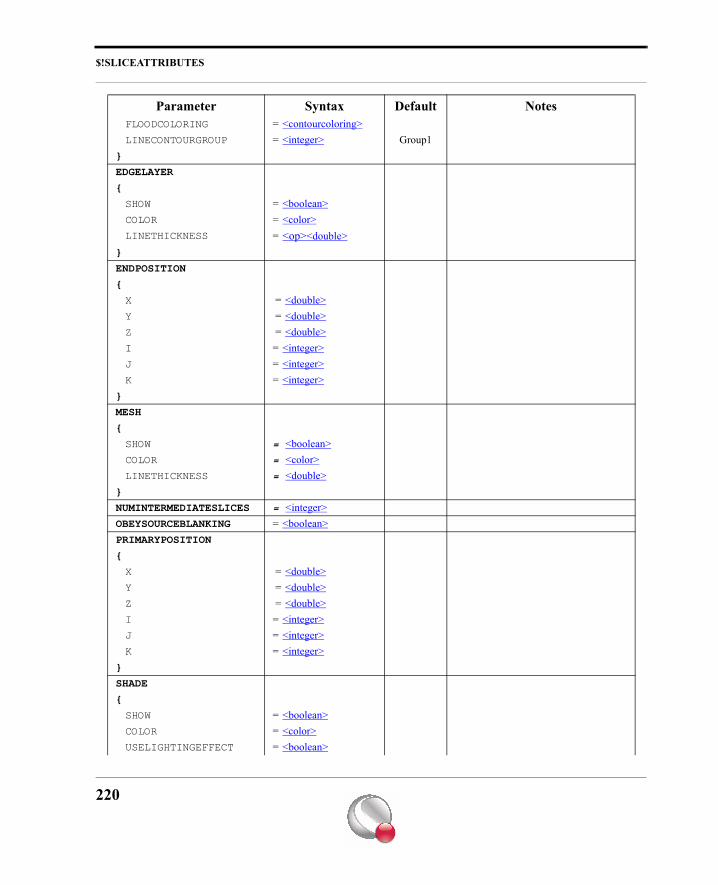
$!SLICEATTRIBUTES
FLOODCOLORING = <contourcoloring>LINECONTOURGROUP = <integer> Group1
}
EDGELAYER
{
SHOW = <boolean>COLOR = <color>LINETHICKNESS = <op><double>
}
ENDPOSITION
{
X = <double>Y = <double>Z = <double>I = <integer>J = <integer>K = <integer>
}
MESH
{
SHOW = <boolean>COLOR = <color>LINETHICKNESS = <double>
}
NUMINTERMEDIATESLICES = <integer>OBEYSOURCEBLANKING = <boolean>PRIMARYPOSITION
{
X = <double>Y = <double>Z = <double>I = <integer>J = <integer>K = <integer>
}
SHADE
{
SHOW = <boolean>COLOR = <color>USELIGHTINGEFFECT = <boolean>
Parameter Syntax Default Notes
220
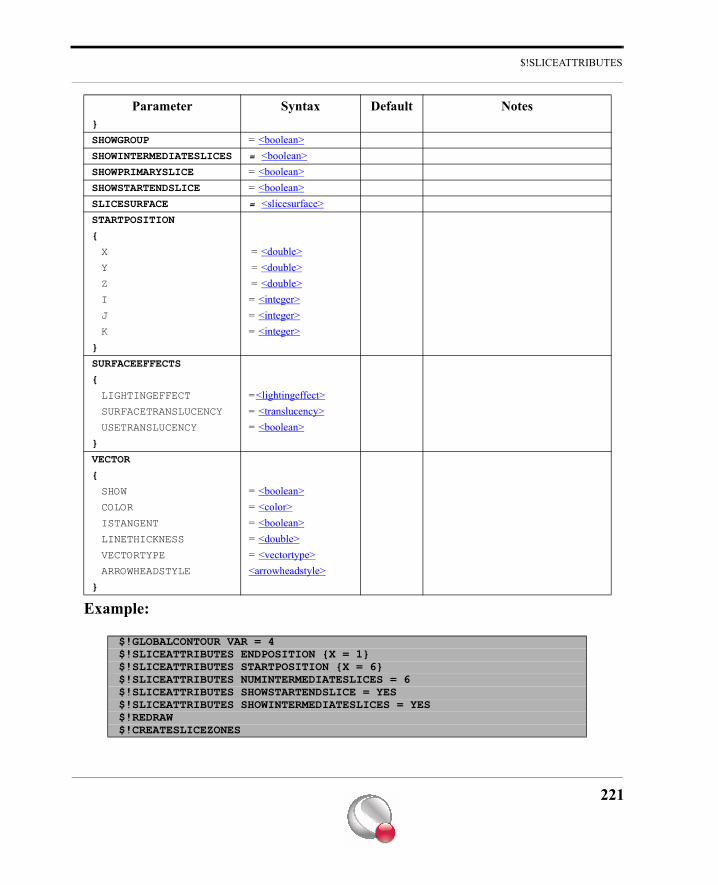
$!SLICEATTRIBUTES
Example:
}
SHOWGROUP = <boolean>SHOWINTERMEDIATESLICES = <boolean>SHOWPRIMARYSLICE = <boolean>SHOWSTARTENDSLICE = <boolean>SLICESURFACE = <slicesurface>STARTPOSITION
{
X = <double>Y = <double>Z = <double>I = <integer>J = <integer>K = <integer>
}
SURFACEEFFECTS
{
LIGHTINGEFFECT =<lightingeffect>SURFACETRANSLUCENCY = <translucency>USETRANSLUCENCY = <boolean>
}
VECTOR
{
SHOW = <boolean>COLOR = <color>ISTANGENT = <boolean>LINETHICKNESS = <double>VECTORTYPE = <vectortype>ARROWHEADSTYLE <arrowheadstyle>
}
$!GLOBALCONTOUR VAR = 4$!SLICEATTRIBUTES ENDPOSITION {X = 1}$!SLICEATTRIBUTES STARTPOSITION {X = 6}$!SLICEATTRIBUTES NUMINTERMEDIATESLICES = 6$!SLICEATTRIBUTES SHOWSTARTENDSLICE = YES$!SLICEATTRIBUTES SHOWINTERMEDIATESLICES = YES$!REDRAW$!CREATESLICEZONES
Parameter Syntax Default Notes
221
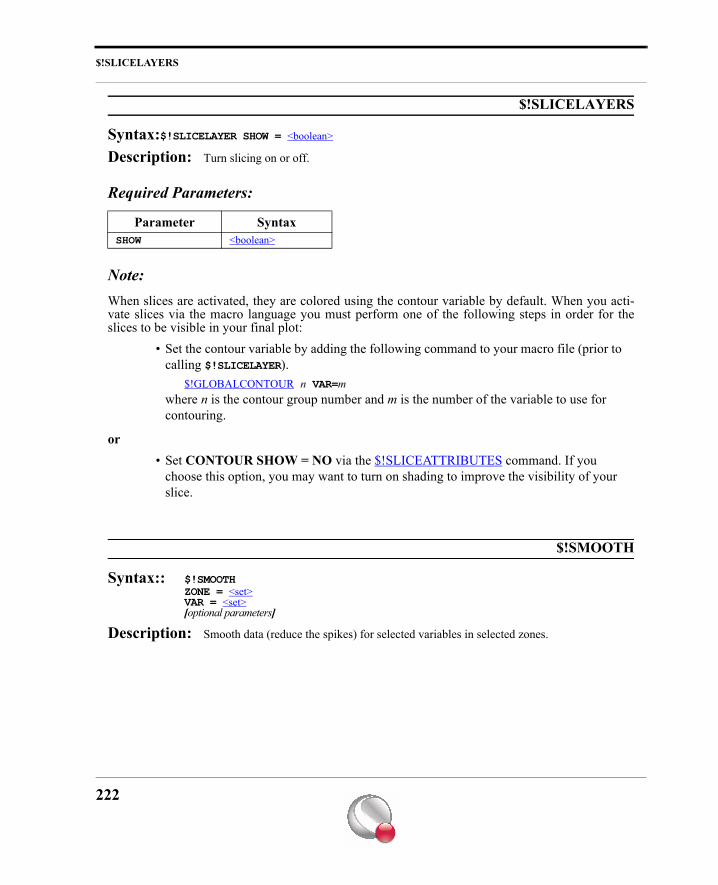
$!SLICELAYERS
$!SLICELAYERS
Syntax:$!SLICELAYER SHOW = <boolean>
Description: Turn slicing on or off.
Required Parameters:
Note:When slices are activated, they are colored using the contour variable by default. When you acti-vate slices via the macro language you must perform one of the following steps in order for theslices to be visible in your final plot:
• Set the contour variable by adding the following command to your macro file (prior to calling $!SLICELAYER).
$!GLOBALCONTOUR n VAR=mwhere n is the contour group number and m is the number of the variable to use for contouring.
or• Set CONTOUR SHOW = NO via the $!SLICEATTRIBUTES command. If you
choose this option, you may want to turn on shading to improve the visibility of your slice.
$!SMOOTH
Syntax:: $!SMOOTHZONE = <set>VAR = <set>[optional parameters]
Description: Smooth data (reduce the spikes) for selected variables in selected zones.
Parameter SyntaxSHOW <boolean>
222
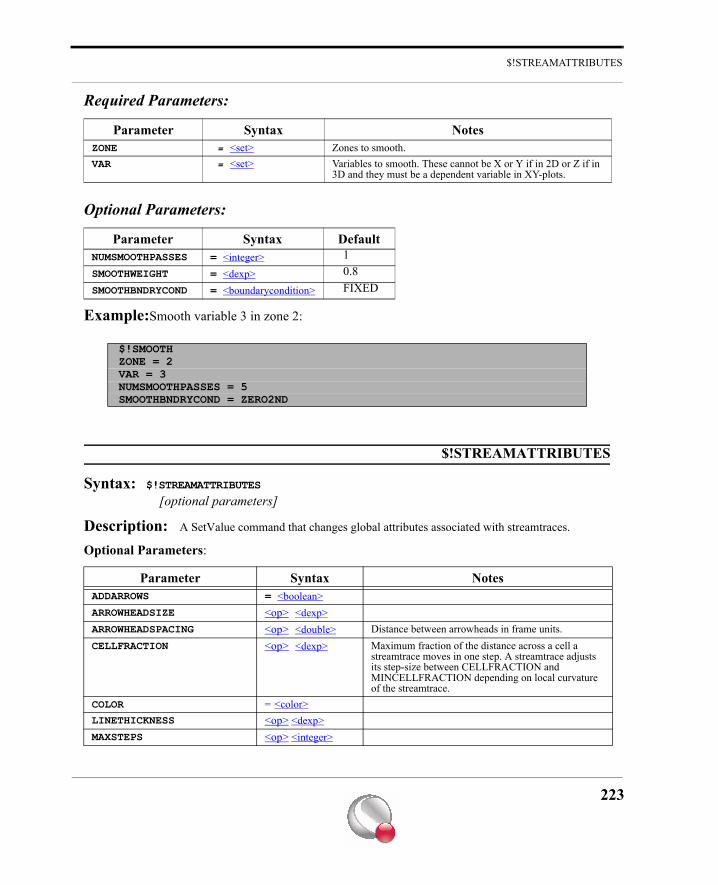
$!STREAMATTRIBUTES
Required Parameters:
Optional Parameters:
Example:Smooth variable 3 in zone 2:
$!STREAMATTRIBUTES
Syntax: $!STREAMATTRIBUTES
[optional parameters]
Description: A SetValue command that changes global attributes associated with streamtraces.
Optional Parameters:
Parameter Syntax NotesZONE = <set> Zones to smooth.VAR = <set> Variables to smooth. These cannot be X or Y if in 2D or Z if in
3D and they must be a dependent variable in XY-plots.
Parameter Syntax DefaultNUMSMOOTHPASSES = <integer> 1SMOOTHWEIGHT = <dexp> 0.8SMOOTHBNDRYCOND = <boundarycondition> FIXED
$!SMOOTHZONE = 2VAR = 3NUMSMOOTHPASSES = 5SMOOTHBNDRYCOND = ZERO2ND
Parameter Syntax NotesADDARROWS = <boolean>ARROWHEADSIZE <op> <dexp>ARROWHEADSPACING <op> <double> Distance between arrowheads in frame units.CELLFRACTION <op> <dexp> Maximum fraction of the distance across a cell a
streamtrace moves in one step. A streamtrace adjusts its step-size between CELLFRACTION and MINCELLFRACTION depending on local curvature of the streamtrace.
COLOR = <color>LINETHICKNESS <op> <dexp>MAXSTEPS <op> <integer>
223
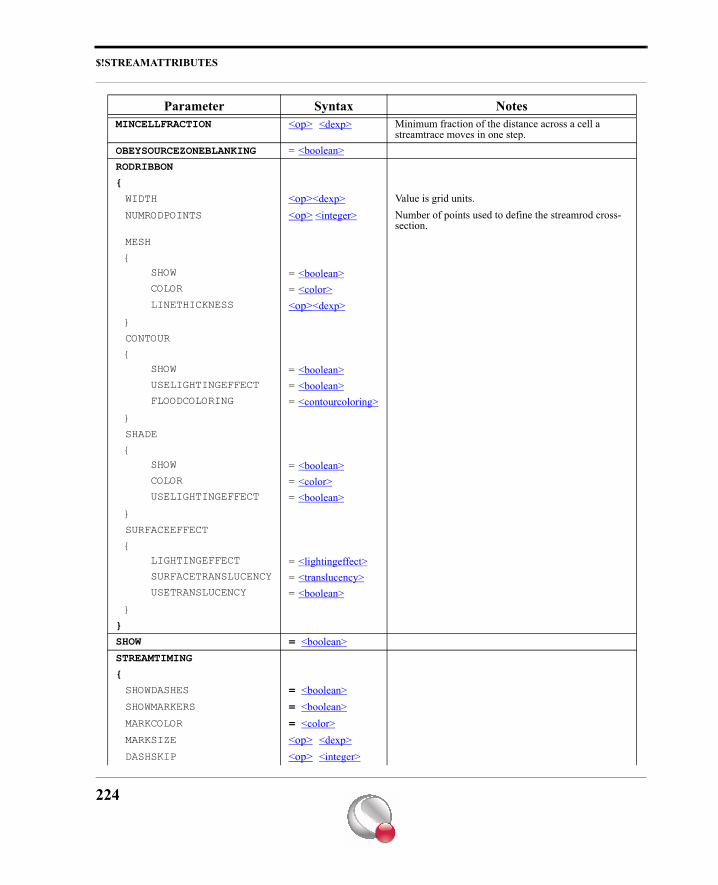
$!STREAMATTRIBUTES
MINCELLFRACTION <op> <dexp> Minimum fraction of the distance across a cell a streamtrace moves in one step.
OBEYSOURCEZONEBLANKING = <boolean>RODRIBBON
{
WIDTH <op><dexp> Value is grid units.NUMRODPOINTS <op> <integer> Number of points used to define the streamrod cross-
section.MESH
{ SHOW = <boolean> COLOR = <color> LINETHICKNESS <op><dexp>}
CONTOUR
{ SHOW = <boolean> USELIGHTINGEFFECT = <boolean> FLOODCOLORING = <contourcoloring>}
SHADE
{ SHOW = <boolean> COLOR = <color> USELIGHTINGEFFECT = <boolean>}
SURFACEEFFECT
{ LIGHTINGEFFECT = <lightingeffect> SURFACETRANSLUCENCY = <translucency> USETRANSLUCENCY = <boolean>}
}
SHOW = <boolean>STREAMTIMING
{
SHOWDASHES = <boolean>SHOWMARKERS = <boolean>MARKCOLOR = <color>MARKSIZE <op> <dexp>DASHSKIP <op> <integer>
Parameter Syntax Notes
224
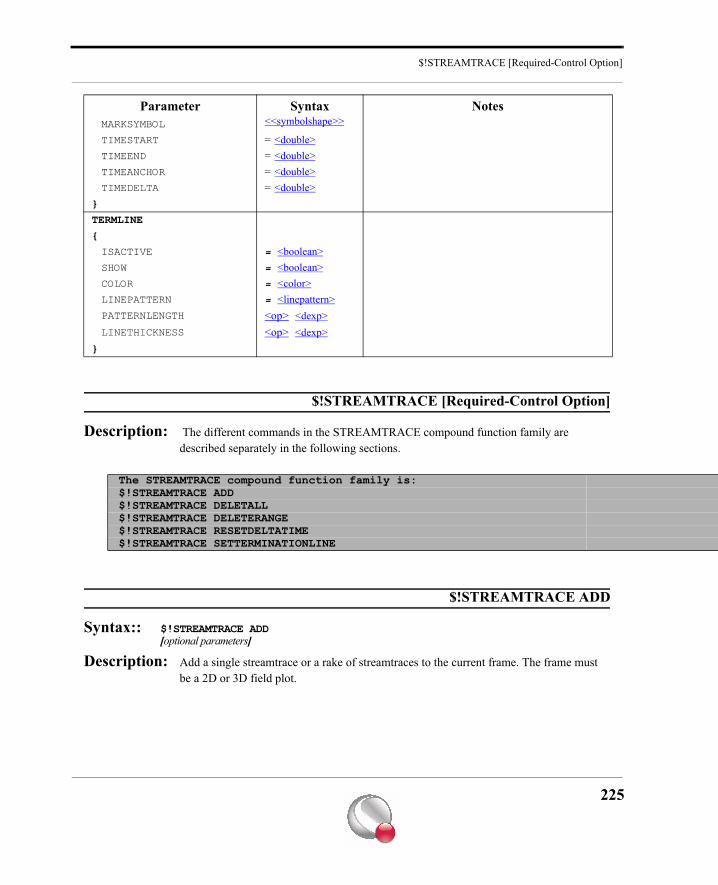
$!STREAMTRACE [Required-Control Option]
$!STREAMTRACE [Required-Control Option]
Description: The different commands in the STREAMTRACE compound function family are described separately in the following sections.
$!STREAMTRACE ADD
Syntax:: $!STREAMTRACE ADD[optional parameters]
Description: Add a single streamtrace or a rake of streamtraces to the current frame. The frame must be a 2D or 3D field plot.
MARKSYMBOL <<symbolshape>>
TIMESTART = <double>TIMEEND = <double>TIMEANCHOR = <double>TIMEDELTA = <double>
}
TERMLINE
{
ISACTIVE = <boolean>SHOW = <boolean>COLOR = <color>LINEPATTERN = <linepattern>PATTERNLENGTH <op> <dexp>LINETHICKNESS <op> <dexp>
}
The STREAMTRACE compound function family is:$!STREAMTRACE ADD$!STREAMTRACE DELETALL$!STREAMTRACE DELETERANGE$!STREAMTRACE RESETDELTATIME$!STREAMTRACE SETTERMINATIONLINE
Parameter Syntax Notes
225
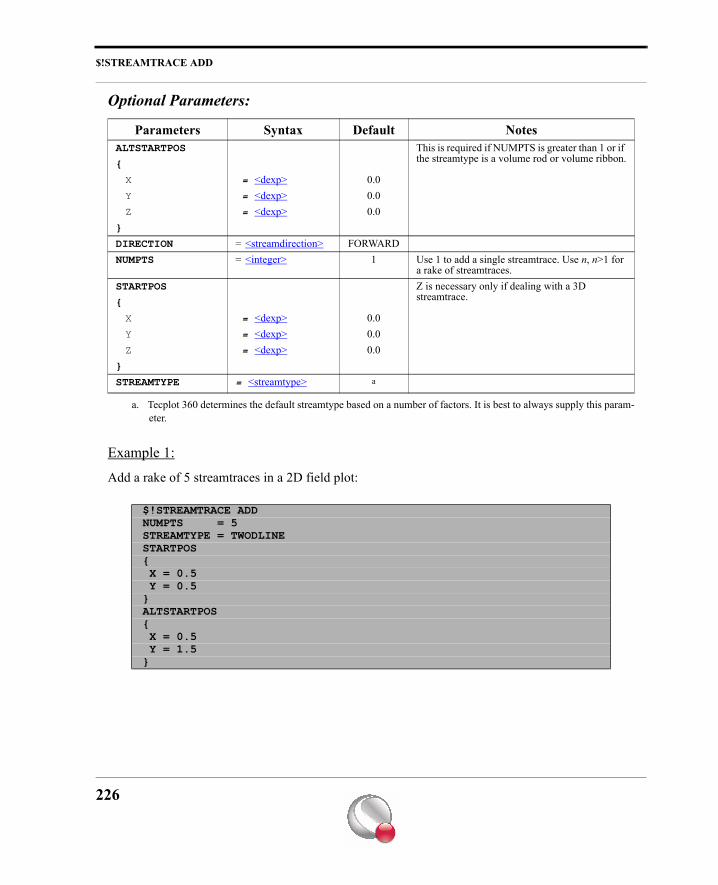
$!STREAMTRACE ADD
Optional Parameters:
Example 1:
Add a rake of 5 streamtraces in a 2D field plot:
Parameters Syntax Default NotesALTSTARTPOS This is required if NUMPTS is greater than 1 or if
the streamtype is a volume rod or volume ribbon.{
X = <dexp> 0.0Y = <dexp> 0.0Z = <dexp> 0.0
}
DIRECTION = <streamdirection> FORWARDNUMPTS = <integer> 1 Use 1 to add a single streamtrace. Use n, n>1 for
a rake of streamtraces.STARTPOS Z is necessary only if dealing with a 3D
streamtrace.{
X = <dexp> 0.0Y = <dexp> 0.0Z = <dexp> 0.0
}
STREAMTYPE = <streamtype> a
a. Tecplot 360 determines the default streamtype based on a number of factors. It is best to always supply this param-eter.
$!STREAMTRACE ADDNUMPTS = 5STREAMTYPE = TWODLINESTARTPOS{ X = 0.5 Y = 0.5}ALTSTARTPOS{ X = 0.5 Y = 1.5}
226
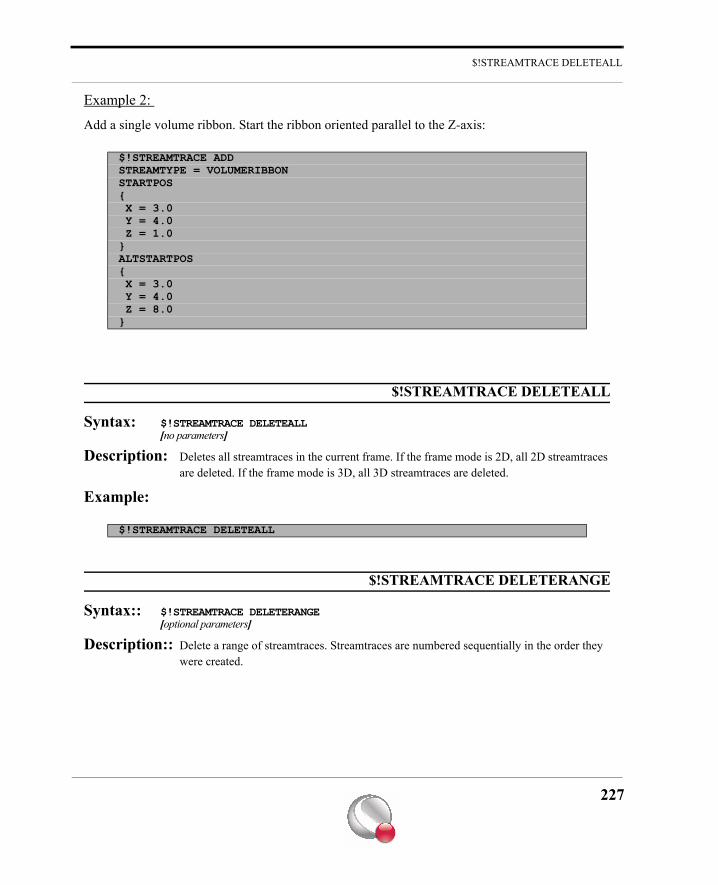
$!STREAMTRACE DELETEALL
Example 2:
Add a single volume ribbon. Start the ribbon oriented parallel to the Z-axis:
$!STREAMTRACE DELETEALL
Syntax: $!STREAMTRACE DELETEALL[no parameters]
Description: Deletes all streamtraces in the current frame. If the frame mode is 2D, all 2D streamtraces are deleted. If the frame mode is 3D, all 3D streamtraces are deleted.
Example:
$!STREAMTRACE DELETERANGE
Syntax:: $!STREAMTRACE DELETERANGE[optional parameters]
Description:: Delete a range of streamtraces. Streamtraces are numbered sequentially in the order they were created.
$!STREAMTRACE ADDSTREAMTYPE = VOLUMERIBBONSTARTPOS{ X = 3.0 Y = 4.0 Z = 1.0}ALTSTARTPOS{ X = 3.0 Y = 4.0 Z = 8.0}
$!STREAMTRACE DELETEALL
227
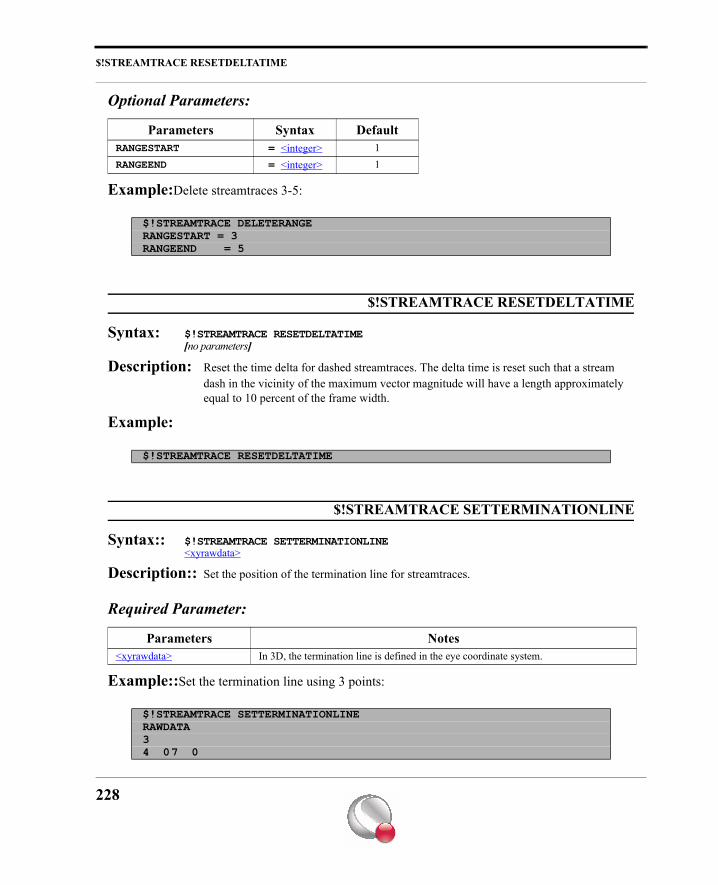
$!STREAMTRACE RESETDELTATIME
Optional Parameters:
Example:Delete streamtraces 3-5:
$!STREAMTRACE RESETDELTATIME
Syntax: $!STREAMTRACE RESETDELTATIME[no parameters]
Description: Reset the time delta for dashed streamtraces. The delta time is reset such that a stream dash in the vicinity of the maximum vector magnitude will have a length approximately equal to 10 percent of the frame width.
Example:
$!STREAMTRACE SETTERMINATIONLINE
Syntax:: $!STREAMTRACE SETTERMINATIONLINE<xyrawdata>
Description:: Set the position of the termination line for streamtraces.
Required Parameter:
Example::Set the termination line using 3 points:
Parameters Syntax DefaultRANGESTART = <integer> 1RANGEEND = <integer> 1
$!STREAMTRACE DELETERANGERANGESTART = 3RANGEEND = 5
$!STREAMTRACE RESETDELTATIME
Parameters Notes<xyrawdata> In 3D, the termination line is defined in the eye coordinate system.
$!STREAMTRACE SETTERMINATIONLINERAWDATA34 07 0
228
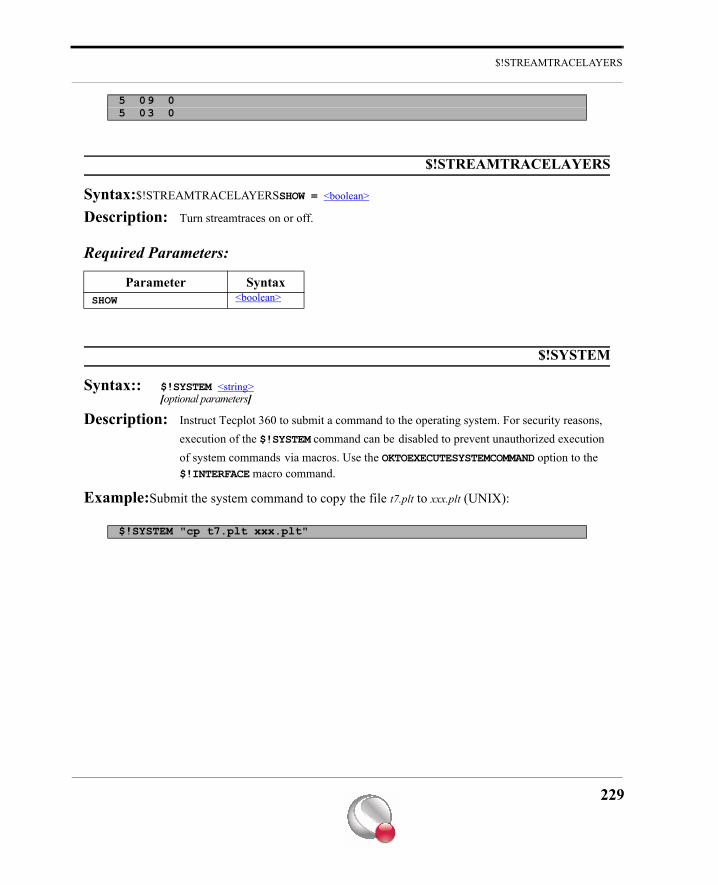
$!STREAMTRACELAYERS
$!STREAMTRACELAYERS
Syntax:$!STREAMTRACELAYERSSHOW = <boolean>
Description: Turn streamtraces on or off.
Required Parameters:
$!SYSTEM
Syntax:: $!SYSTEM <string>[optional parameters]
Description: Instruct Tecplot 360 to submit a command to the operating system. For security reasons, execution of the $!SYSTEM command can be disabled to prevent unauthorized execution of system commands via macros. Use the OKTOEXECUTESYSTEMCOMMAND option to the $!INTERFACE macro command.
Example:Submit the system command to copy the file t7.plt to xxx.plt (UNIX):
5 09 05 03 0
Parameter SyntaxSHOW <boolean>
$!SYSTEM "cp t7.plt xxx.plt"
229
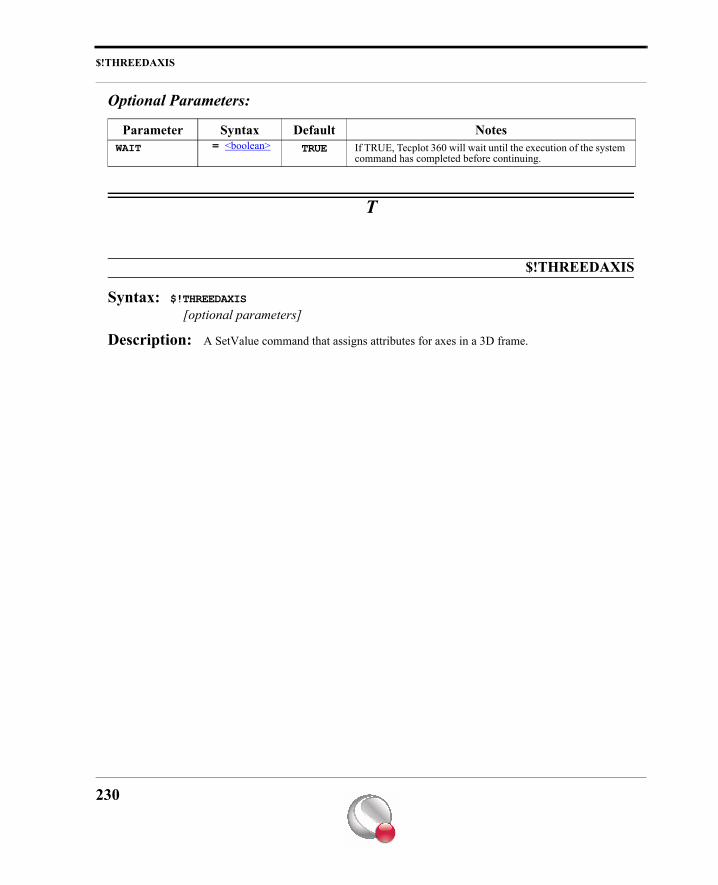
$!THREEDAXIS
Optional Parameters:
T
$!THREEDAXIS
Syntax: $!THREEDAXIS
[optional parameters]
Description: A SetValue command that assigns attributes for axes in a 3D frame.
Parameter Syntax Default NotesWAIT = <boolean> TRUE If TRUE, Tecplot 360 will wait until the execution of the system
command has completed before continuing.
230
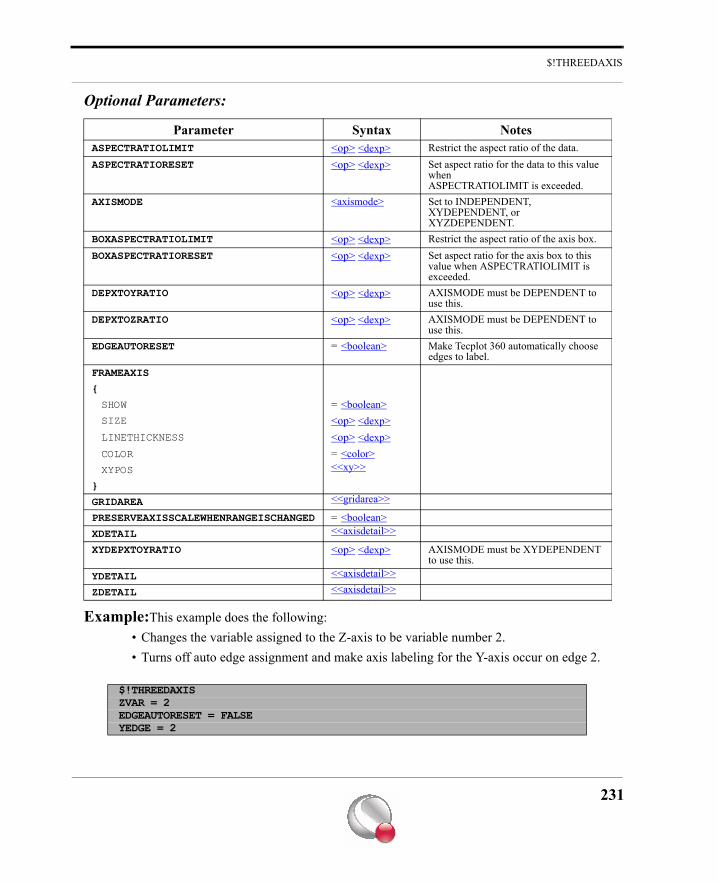
$!THREEDAXIS
Optional Parameters:
Example:This example does the following:• Changes the variable assigned to the Z-axis to be variable number 2.• Turns off auto edge assignment and make axis labeling for the Y-axis occur on edge 2.
Parameter Syntax NotesASPECTRATIOLIMIT <op> <dexp> Restrict the aspect ratio of the data.ASPECTRATIORESET <op> <dexp> Set aspect ratio for the data to this value
when ASPECTRATIOLIMIT is exceeded.
AXISMODE <axismode> Set to INDEPENDENT, XYDEPENDENT, or XYZDEPENDENT.
BOXASPECTRATIOLIMIT <op> <dexp> Restrict the aspect ratio of the axis box.BOXASPECTRATIORESET <op> <dexp> Set aspect ratio for the axis box to this
value when ASPECTRATIOLIMIT is exceeded.
DEPXTOYRATIO <op> <dexp> AXISMODE must be DEPENDENT to use this.
DEPXTOZRATIO <op> <dexp> AXISMODE must be DEPENDENT to use this.
EDGEAUTORESET = <boolean> Make Tecplot 360 automatically choose edges to label.
FRAMEAXIS
{
SHOW = <boolean>SIZE <op> <dexp>LINETHICKNESS <op> <dexp>COLOR = <color>XYPOS <<xy>>
}
GRIDAREA <<gridarea>>
PRESERVEAXISSCALEWHENRANGEISCHANGED = <boolean>XDETAIL <<axisdetail>>
XYDEPXTOYRATIO <op> <dexp> AXISMODE must be XYDEPENDENT to use this.
YDETAIL <<axisdetail>>
ZDETAIL <<axisdetail>>
$!THREEDAXISZVAR = 2EDGEAUTORESET = FALSEYEDGE = 2
231
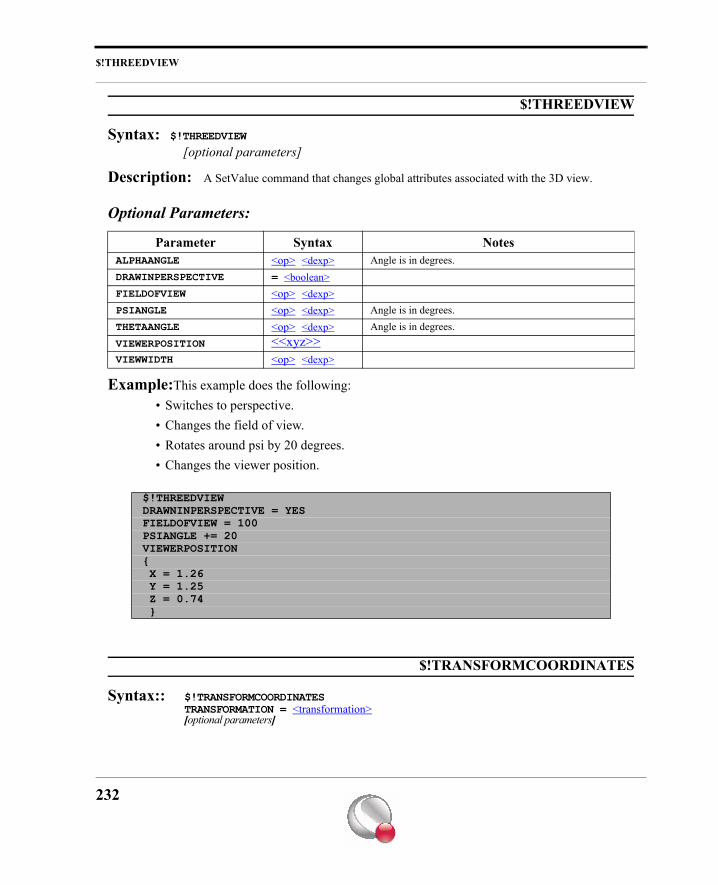
$!THREEDVIEW
$!THREEDVIEW
Syntax: $!THREEDVIEW
[optional parameters]
Description: A SetValue command that changes global attributes associated with the 3D view.
Optional Parameters:
Example:This example does the following:• Switches to perspective.• Changes the field of view.• Rotates around psi by 20 degrees.• Changes the viewer position.
$!TRANSFORMCOORDINATES
Syntax:: $!TRANSFORMCOORDINATESTRANSFORMATION = <transformation>[optional parameters]
Parameter Syntax NotesALPHAANGLE <op> <dexp> Angle is in degrees.DRAWINPERSPECTIVE = <boolean>FIELDOFVIEW <op> <dexp>PSIANGLE <op> <dexp> Angle is in degrees.THETAANGLE <op> <dexp> Angle is in degrees.VIEWERPOSITION <<xyz>>VIEWWIDTH <op> <dexp>
$!THREEDVIEWDRAWNINPERSPECTIVE = YESFIELDOFVIEW = 100PSIANGLE += 20VIEWERPOSITION{ X = 1.26 Y = 1.25 Z = 0.74 }
232
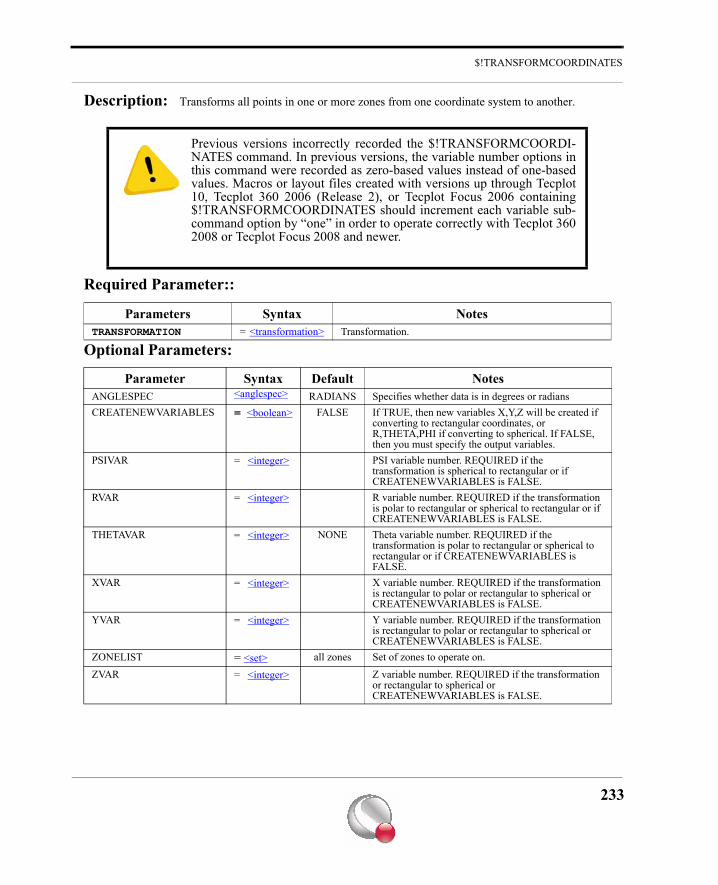
$!TRANSFORMCOORDINATES
Description: Transforms all points in one or more zones from one coordinate system to another.
Required Parameter::
Optional Parameters:
Previous versions incorrectly recorded the $!TRANSFORMCOORDI-NATES command. In previous versions, the variable number options inthis command were recorded as zero-based values instead of one-basedvalues. Macros or layout files created with versions up through Tecplot10, Tecplot 360 2006 (Release 2), or Tecplot Focus 2006 containing$!TRANSFORMCOORDINATES should increment each variable sub-command option by “one” in order to operate correctly with Tecplot 3602008 or Tecplot Focus 2008 and newer.
Parameters Syntax NotesTRANSFORMATION = <transformation> Transformation.
Parameter Syntax Default NotesANGLESPEC <anglespec> RADIANS Specifies whether data is in degrees or radiansCREATENEWVARIABLES = <boolean> FALSE If TRUE, then new variables X,Y,Z will be created if
converting to rectangular coordinates, or R,THETA,PHI if converting to spherical. If FALSE, then you must specify the output variables.
PSIVAR = <integer> PSI variable number. REQUIRED if the transformation is spherical to rectangular or if CREATENEWVARIABLES is FALSE.
RVAR = <integer> R variable number. REQUIRED if the transformation is polar to rectangular or spherical to rectangular or if CREATENEWVARIABLES is FALSE.
THETAVAR = <integer> NONE Theta variable number. REQUIRED if the transformation is polar to rectangular or spherical to rectangular or if CREATENEWVARIABLES is FALSE.
XVAR = <integer> X variable number. REQUIRED if the transformation is rectangular to polar or rectangular to spherical or CREATENEWVARIABLES is FALSE.
YVAR = <integer> Y variable number. REQUIRED if the transformation is rectangular to polar or rectangular to spherical or CREATENEWVARIABLES is FALSE.
ZONELIST = <set> all zones Set of zones to operate on.ZVAR = <integer> Z variable number. REQUIRED if the transformation
or rectangular to spherical or CREATENEWVARIABLES is FALSE.
233
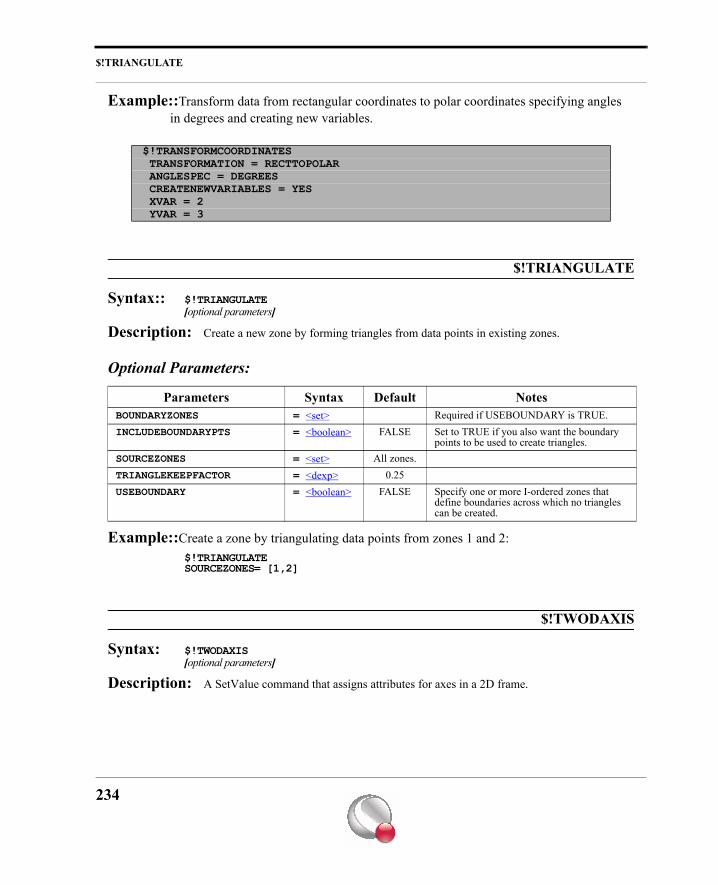
$!TRIANGULATE
Example::Transform data from rectangular coordinates to polar coordinates specifying angles in degrees and creating new variables.
$!TRIANGULATE
Syntax:: $!TRIANGULATE[optional parameters]
Description: Create a new zone by forming triangles from data points in existing zones.
Optional Parameters:
Example::Create a zone by triangulating data points from zones 1 and 2:$!TRIANGULATESOURCEZONES= [1,2]
$!TWODAXIS
Syntax: $!TWODAXIS[optional parameters]
Description: A SetValue command that assigns attributes for axes in a 2D frame.
$!TRANSFORMCOORDINATES TRANSFORMATION = RECTTOPOLAR ANGLESPEC = DEGREES CREATENEWVARIABLES = YES XVAR = 2 YVAR = 3
Parameters Syntax Default NotesBOUNDARYZONES = <set> Required if USEBOUNDARY is TRUE.INCLUDEBOUNDARYPTS = <boolean> FALSE Set to TRUE if you also want the boundary
points to be used to create triangles.SOURCEZONES = <set> All zones.TRIANGLEKEEPFACTOR = <dexp> 0.25USEBOUNDARY = <boolean> FALSE Specify one or more I-ordered zones that
define boundaries across which no triangles can be created.
234
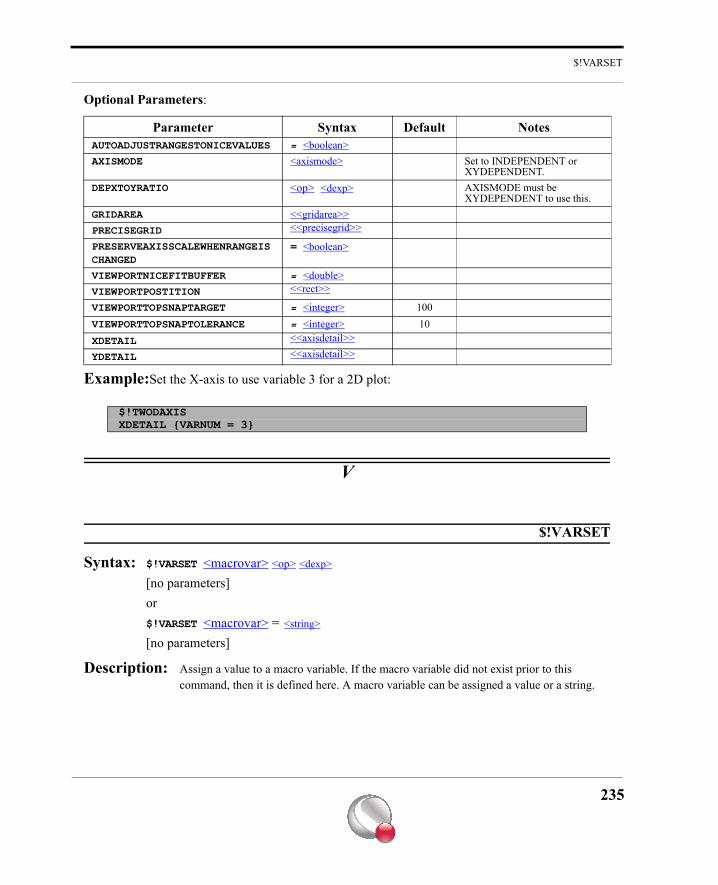
$!VARSET
Optional Parameters:
Example:Set the X-axis to use variable 3 for a 2D plot:
V
$!VARSET
Syntax: $!VARSET <macrovar> <op> <dexp>
[no parameters]or$!VARSET <macrovar> = <string>
[no parameters]
Description: Assign a value to a macro variable. If the macro variable did not exist prior to this command, then it is defined here. A macro variable can be assigned a value or a string.
Parameter Syntax Default NotesAUTOADJUSTRANGESTONICEVALUES = <boolean>AXISMODE <axismode> Set to INDEPENDENT or
XYDEPENDENT.DEPXTOYRATIO <op> <dexp> AXISMODE must be
XYDEPENDENT to use this.GRIDAREA <<gridarea>>PRECISEGRID <<precisegrid>>
PRESERVEAXISSCALEWHENRANGEISCHANGED
= <boolean>
VIEWPORTNICEFITBUFFER = <double>VIEWPORTPOSTITION <<rect>>
VIEWPORTTOPSNAPTARGET = <integer> 100VIEWPORTTOPSNAPTOLERANCE = <integer> 10XDETAIL <<axisdetail>>
YDETAIL <<axisdetail>>
$!TWODAXISXDETAIL {VARNUM = 3}
235
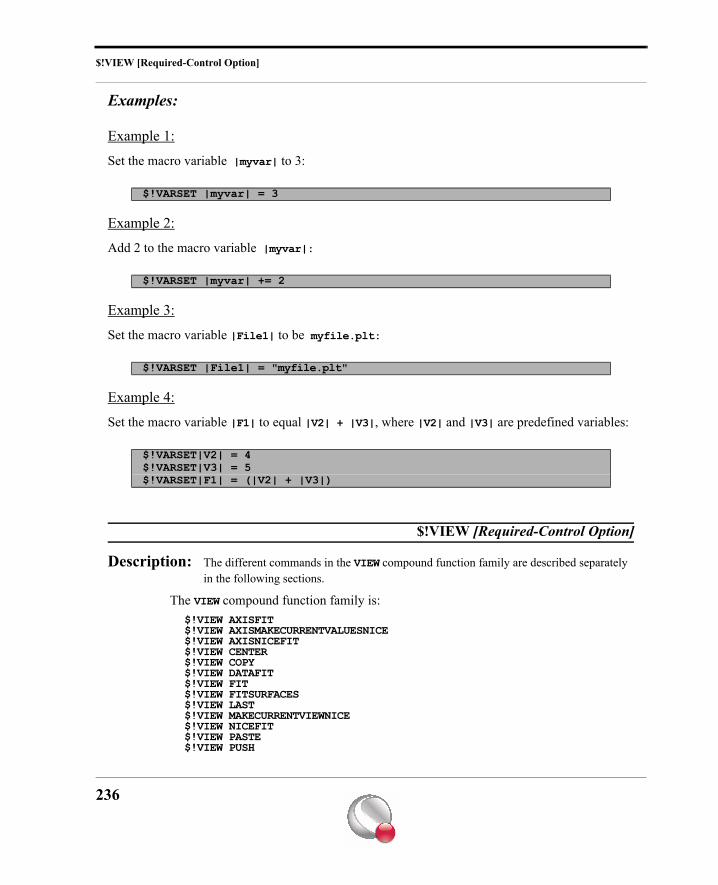
$!VIEW [Required-Control Option]
Examples:
Example 1:
Set the macro variable |myvar| to 3:
Example 2:
Add 2 to the macro variable |myvar|:
Example 3:
Set the macro variable |File1| to be myfile.plt:
Example 4:
Set the macro variable |F1| to equal |V2| + |V3|, where |V2| and |V3| are predefined variables:
$!VIEW [Required-Control Option]
Description: The different commands in the VIEW compound function family are described separately in the following sections.
The VIEW compound function family is:$!VIEW AXISFIT$!VIEW AXISMAKECURRENTVALUESNICE$!VIEW AXISNICEFIT$!VIEW CENTER$!VIEW COPY$!VIEW DATAFIT$!VIEW FIT$!VIEW FITSURFACES$!VIEW LAST$!VIEW MAKECURRENTVIEWNICE$!VIEW NICEFIT$!VIEW PASTE$!VIEW PUSH
$!VARSET |myvar| = 3
$!VARSET |myvar| += 2
$!VARSET |File1| = "myfile.plt"
$!VARSET|V2| = 4$!VARSET|V3| = 5$!VARSET|F1| = (|V2| + |V3|)
236
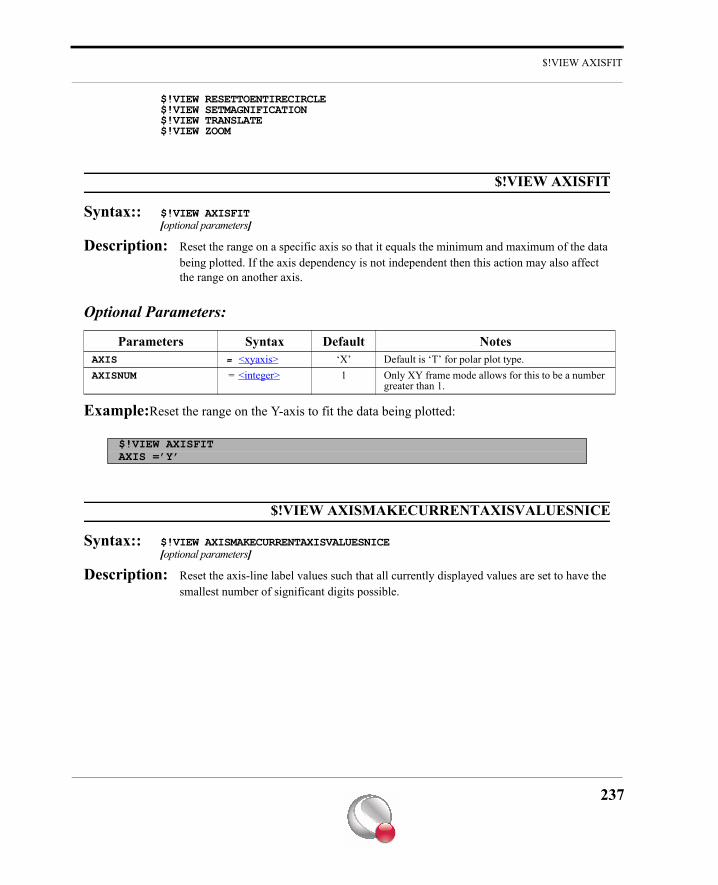
$!VIEW AXISFIT
$!VIEW RESETTOENTIRECIRCLE $!VIEW SETMAGNIFICATION$!VIEW TRANSLATE$!VIEW ZOOM
$!VIEW AXISFIT
Syntax:: $!VIEW AXISFIT[optional parameters]
Description: Reset the range on a specific axis so that it equals the minimum and maximum of the data being plotted. If the axis dependency is not independent then this action may also affect the range on another axis.
Optional Parameters:
Example:Reset the range on the Y-axis to fit the data being plotted:
$!VIEW AXISMAKECURRENTAXISVALUESNICE
Syntax:: $!VIEW AXISMAKECURRENTAXISVALUESNICE[optional parameters]
Description: Reset the axis-line label values such that all currently displayed values are set to have the smallest number of significant digits possible.
Parameters Syntax Default NotesAXIS = <xyaxis> ‘X’ Default is ‘T’ for polar plot type.AXISNUM = <integer> 1 Only XY frame mode allows for this to be a number
greater than 1.
$!VIEW AXISFITAXIS =’Y’
237
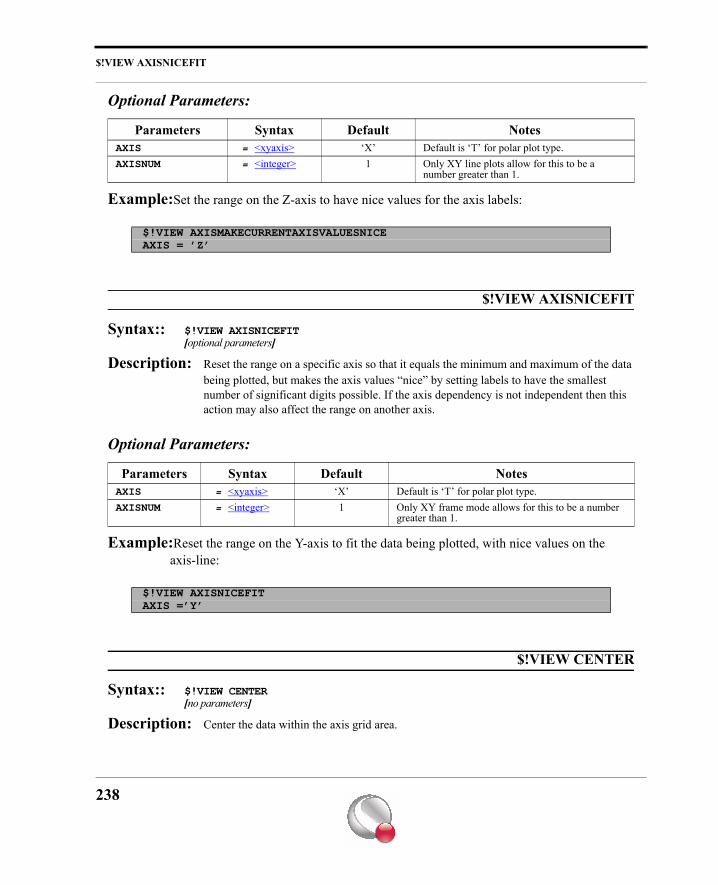
$!VIEW AXISNICEFIT
Optional Parameters:
Example:Set the range on the Z-axis to have nice values for the axis labels:
$!VIEW AXISNICEFIT
Syntax:: $!VIEW AXISNICEFIT[optional parameters]
Description: Reset the range on a specific axis so that it equals the minimum and maximum of the data being plotted, but makes the axis values “nice” by setting labels to have the smallest number of significant digits possible. If the axis dependency is not independent then this action may also affect the range on another axis.
Optional Parameters:
Example:Reset the range on the Y-axis to fit the data being plotted, with nice values on the axis-line:
$!VIEW CENTER
Syntax:: $!VIEW CENTER[no parameters]
Description: Center the data within the axis grid area.
Parameters Syntax Default NotesAXIS = <xyaxis> ‘X’ Default is ‘T’ for polar plot type.AXISNUM = <integer> 1 Only XY line plots allow for this to be a
number greater than 1.
$!VIEW AXISMAKECURRENTAXISVALUESNICEAXIS = ’Z’
Parameters Syntax Default NotesAXIS = <xyaxis> ‘X’ Default is ‘T’ for polar plot type.AXISNUM = <integer> 1 Only XY frame mode allows for this to be a number
greater than 1.
$!VIEW AXISNICEFITAXIS =’Y’
238
$!VIEW COPY
$!VIEW COPY
Syntax:: $!VIEW COPY[no parameters]
Description: Copy the current view to the view paste buffer. See also $!VIEW PASTE.
$!VIEW DATAFIT
Syntax:: $!VIEW DATAFIT[no parameters]
Description: Fit the current set of data zones or line mappings being plotted within the grid area. This does not take into consideration text or geometries.
$!VIEW FIT
Syntax:: $!VIEW FIT[no parameters]
Description: Fit the entire plot to the grid area. This also takes into consideration text and geometries that are plotted using the grid coordinate system. In 3D, this also includes the axes.
$!VIEW FITSURFACES
Syntax:: $!VIEW FITSURFACES[no parameters]
Description: Fits active plot surfaces to the grid area. 3D volume zones are excluded when surfaces to plot are set to none. See $!FIELDMAP for more information on setting surfaces to plot.
$!VIEW LAST
Syntax:: $!VIEW LAST[no parameters]
Description: Retrieve the previous view from the view stack. Each frame mode within each frame maintains its own view stack. $!VIEW LAST will not reverse alterations to data.
239
$!VIEW MAKECURRENTVIEWNICE
$!VIEW MAKECURRENTVIEWNICE
Syntax:: $!VIEW MAKECURRENTVIEWNICE[no parameters]
Description: Shifts axis to make axis-line values nice without changing the extents of the window. Only works in Sketch/XY/2D.
$!VIEW NICEFIT
Syntax:: $!VIEW NICEFIT[no parameters]
Description: Change view to make the extents of the frame neatly hold the plot with integer values for axis labels. Only works in Sketch/XY/2D.
$!VIEW PASTE
Syntax:: $!VIEW PASTE[no parameters]
Description: Retrieve the view from the view paste buffer and assign it to the current frame.
$!VIEW PUSH
Syntax:: $!VIEW PUSH[no parameters]
Description: Instruct Tecplot 360 to push the current view onto the view stack. A view will not be pushed if the current view is the same as the top view on the stack. Note that commands VIEW AXISFIT, VIEW CENTER, VIEW DATAFIT, VIEW FIT, and VIEW ZOOM automatically push a view onto the stack. Tecplot 360 automatically pushes the current view onto the stack when a $!REDRAW command is issued and the current view is different from the top view on the view stack.
$!VIEW RESETTOENTIRECIRCLE
Syntax:: $!VIEW RESETTOENTIRECIRCLE[no parameters]
Description: Reset the Theta-R Axis to initial settings. For Polar plots only.
240
$!VIEW SETMAGNIFICATION
$!VIEW SETMAGNIFICATION
Syntax:: $!VIEW SETMAGNIFICATIONMAGNIFICATION = <dexp>
Description: Set the magnification for the data being plotted. A magnification of 1 will size the plot so it can fit within the grid area.
Required Parameter:
Example::Make the plot to be drawn one-half as big as when it fits within the grid area:
$!VIEW TRANSLATE
Syntax:: $!VIEW TRANSLATEX = <dexp>Y = <dexp>[no optional parameters]
Description: Shift the data being plotted in the X- and/or Y-direction. The amount translated is in frame units.
Required Parameters
Example:Translate the view 10 percent of the frame width to the right:
Parameters SyntaxMAGNIFICATION = <dexp>
$!VIEW SETMAGNIFICATIONMAGNIFICATION = 0.5
Parameters Syntax Default NotesX = <dexp> 0.0 Amount to translate in X-frame units.Y = <dexp> 0.0 Amount to translate in Y-frame units.
$!VIEW TRANSLATE X = 10 Y = 0
241
$!VIEW ZOOM
$!VIEW ZOOM
Syntax: $!VIEW ZOOMX1 = <dexp>Y1 = <dexp>X2 = <dexp>Y2 = <dexp>[no optional parameters]
Description: Change the view by “zooming” into the data. In Sketch, XY, and 2D frame mode plots, Tecplot 360 will adjust the ranges on the axis to view the region defined by the rectangle with corners at (X1, Y1) and (X2, Y2). For 3D orthographic plots, the view is translated and scaled to fit the region. For 3D perspective plots, the view is rotated about the viewer and scaled to fit the region. X1 and so forth are measured in grid coordinates.
Required Parameters:
Example:Zoom so the rectangular region with corners at (1, 0) and (7, 9) are in view:
W - X
$!WHILE...$!ENDWHILE
Syntax: $!WHILE <conditionalexp>.$!ENDWHILE
Description: Continue to execute a set of commands until a conditional expression is false.
Parameters SyntaxX1 = <dexp>Y1 = <dexp>X2 = <dexp>Y2 = <dexp>
$!VIEW ZOOMX1 = 1Y1 = 0X2 = 7Y2 = 9
242
$!WORKSPACEVIEW [Required-Control Option]
Example:Execute a set of commands until the macro variable |myvar| is greater than 1.0:
$!WORKSPACEVIEW [Required-Control Option]
Description: The different commands in the WORKSPACEVIEW compound function family are described separately in the following sections.
The WORKSPACEVIEW compound functions are:$!WORKSPACEVIEW FITALLFRAMES$!WORKSPACEVIEW FITPAPER$!WORKSPACEVIEW FITSELECTEDFRAMES$!WORKSPACEVIEW LASTVIEW$!WORKSPACEVIEW MAXIMIZE$!WORKSPACEVIEW TRANSLATE$!WORKSPACEVIEW UNMAXIMIZE$!WORKSPACEVIEW ZOOM
$!WORKSPACEVIEW FITALLFRAMES
Syntax: $!WORKSPACEVIEW FITALLFRAMES[no parameters]
Description: Change the view in the workspace so all frames are fit just inside the edges of the workspace.
$!WORKSPACEVIEW FITPAPER
Syntax: $!WORKSPACEVIEW FITPAPER[no parameters]
Description: Change the view in the workspace so the entire paper is fit just inside the edges of the workspace.
$!WORKSPACEVIEW FITSELECTEDFRAMES
Syntax: $!WORKSPACEVIEW FITSELECTEDFRAMES[no parameters]
$!VARSET |myvar| = 0.0$!WHILE |myvar| < 1.0$!VARSET |myvar| += 0.01$!ENDWHILE
243
$!WORKSPACEVIEW LASTVIEW
Description: Change the view in the workspace so the currently selected frames (that is, the frames with pick handles) are fit just inside the edges of the workspace.
$!WORKSPACEVIEW LASTVIEW
Syntax: $!WORKSPACEVIEW LASTVIEW[no parameters]
Description: Return to the previous workspace view.
$!WORKSPACEVIEW MAXIMIZE
Syntax: $!WORKSPACEVIEW MAXIMIZE[no parameters]
Description: Temporarily expand the work area as large as possible. The maximized work area occupies the entire Tecplot 360 process window.
$!WORKSPACEVIEW TRANSLATE
Syntax: $!WORKSPACEVIEW TRANSLATEX = <dexp>Y = <dexp>[no optional parameters]
Description: Shift the view of the workspace. This has no effect on the local view within any frame in your layout.
Required Parameters:
Example:Shift the workspace view to the left by 2 inches (as measured by the workspace ruler):
Parameters Syntax Default NotesX = <dexp> 0 Value is in inches.Y = <dexp> 0 Value is in inches.
$!WORKSPACEVIEW TRANSLATEX = -2Y = 0
244
$!WORKSPACEVIEW UNMAXIMIZE
$!WORKSPACEVIEW UNMAXIMIZE
Syntax: $!WORKSPACEVIEW UNMAXIMIZE[no parameters]
Description: Returns the workspace to its normal size after it has been expanded after $!WORKSPACE MAXIMIZE has been used.
$!WORKSPACEVIEW ZOOM
Syntax: $!WORKSPACEVIEW ZOOMX1 = <dexp>Y1 = <dexp>X2 = <dexp>Y2 = <dexp>[no optional parameters]
Description: Change the view into the work area. This has no effect on the local view within any frame in your layout.
Required Parameters:
Example:Make the region in the lower left corner of an 8.5 by 11 paper be viewable in the work area. The paper is in portrait orientation:
$!WRITECOLORMAP
Syntax: $!WRITECOLORMAP <string>[no parameters]
Description: Write the current color map to a file. The <string> is the name of the file to write to.
Parameters SyntaxX1 = <dexp>Y1 = <dexp>X2 = <dexp>Y2 = <dexp>
$!WORKSPACEVIEW ZOOMX1 = 0Y1 = 5.5X2 = 4.25Y2 = 9.75
245
$!WRITECURVEINFO
Example:
$!WRITECURVEINFO
Syntax: $!WRITECURVEINFO <string> SOURCEMAP = <integer>[optional parameters]
Description: Write out the curve details or the calculated data points for the equation(s) used to draw the curve for a selected line mapping. The <string> is the name of the file to write to.
Required Parameter:
Optional Parameter:
Example:Write out the coefficients for XY line mapping number 3 to map3.out:
$!WRITEDATASET
Syntax: $!WRITEDATASET <string>[optional parameters]
Description: Write the data set attached to the current frame to a file. The <string> is the name of the file to write to.
$!WRITECOLORMAP "mycolors.map"
Parameter Syntax NotesSOURCEMAP = <integer> This must be the number of a line mapping that does some type of curve
fit or spline.
Parameters Syntax Default NotesCURVEINFOMODE = <curveinfomode> CURVE DETAILS Use CURVE DETAILS or CURVEPOINTS.
$!WRITECURVEINFO "map3.out"SOURCEMAP = 3CURVEINFOMODE = CURVE DETAILS
246
$!WRITESTYLESHEET
Optional Parameters:
Example:Write out only zone 3 to a file called zone3.plt:
$!WRITESTYLESHEET
Syntax: $!WRITESTYLESHEET <string>[optional parameters]
Description: Write the style for the current frame to a file. The <string> is the name of the file to write to.
Parameters Syntax Default NotesASSOCIATELAYOUTWITHDATAFILE = <boolean> TRUEBINARY = <boolean> TRUE If FALSE, you can include PRECISION
and USEPOINTFORMAT.INCLUDEAUTOGENFACENEIGHBORS = <boolean> FALSEINCLUDECUSTOMLABELS = <boolean> TRUEINCLUDEDATA = <boolean> TRUEINCLUDEDATASHARELINKAGE = <boolean> FALSEINCLUDEGEOM = <boolean> TRUEINCLUDETEXT = <boolean> TRUEPRECISION = <integer> 12 Only used if ASCII (that is, BINARY is
FALSE).USEPOINTFORMAT = <boolean> FALSE Only used if ASCII (that is, BINARY is
FALSE).VARPOSITIONLIST = <set> All vars. Use this to limit the number of variables
written out.ZONELIST = <set> All zones. Use this to limit the number of zones
written out.
$!WRITEDATASET "zone3.plt"INCLUDETEXT = FALSEINCLUDEGEOM = FALSEINCLUDECUSTOMLABELS = FALSEZONELIST = [3]
247
$!XYLINEAXIS
Optional Parameters:
Example:Write out a stylesheet for the current frame to f1.sty:
$!XYLINEAXIS
Syntax: $!XYLINEAXIS
[optional parameters]
Description: A SetValue command that assigns attributes for axes in an XY Line plot.
Optional Parameters:
Parameters Syntax DefaultINCLUDECONTOURLEVELS = <boolean> TRUEINCLUDETEXT = <boolean> TRUEINCLUDEGEOM = <boolean> TRUEINCLUDEPLOTSTYLE = <boolean> TRUEINCLUDESTREAMPOSITIONS = <boolean> TRUEINCLUDEFACTORYDEFAULTS = <boolean> FALSEUSERELATIVEPATHS = <boolean>INCLUDEAUXDATA = <boolean> TRUE
$!WRITESTYLESHEET "f1.sty"INCLUDEFACTORYDEFAULTS = TRUE
Parameter Syntax Default NotesAUTOADJUSTRANGESTONICEVALUES
= <boolean>
AXISMODE <axismode> Set to INDEPENDENT or XYDEPENDENT.
DEPXTOYRATIO <op> <dexp> AXISMODE must be XYDEPENDENT to use this. This applies only to the X1- and Y1-axes.
GRIDAREA <<gridarea>>PRECISEGRID <<precisegrid>>
PRESERVEAXISSCALE = <boolean>VIEWPORTNICEFITBUFFER = <double> Between 1 and 100.VIEWPORTTOPSNAPTARGET = <integer> 100VIEWPORTTOPSNAPTOLERANCE = <integer> 10
248
$!XYLINEAXIS
Example:Set the axis mode to be independent for the XY-axes (note that this affects only X1 versus Y1):
XDETAIL <integer> <<axisdetail>> The <integer> option specifies which axis to operate on, 1 ≤ n ≤ 5.
YDETAIL <integer> <<axisdetail>> The <integer> option specifies which axis to operate on, 1 ≤ n ≤ 5.
$!XYLINEAXISAXISMODE = INDEPENDENT
Parameter Syntax Default Notes
249
$!XYLINEAXIS
250
Chapter 9 Macro Commands for the Analyze Menu
All of the macro commands associated with the Analyze menu are embedded within Tecplot 360’sEXTENDEDCOMMAND macro. The syntax of this macro is shown below:
The first <string> is a text string should be set to CFDAnalyzer3. The second string is sent to one ofthe add-ons listed below.
9 - 1 Summary of Analyze Macro CommandsANIMATESTREAKLINES may be used following a streakline calculation to animate the streaklines,either to the screen or to a file.ATTACHINTEGRATIONRESULTS is used following an integration to create a text field and attach it tothe current Tecplot 360 frame. This macro has the same effect as clicking Make Text on the Integra-tion Results text dialog.Note: It is not necessary to direct the macro to display the Integration Results dialog in order toattach or save the results.CALCPARTICLEPATH calculates particle paths or streaklines for steady or unsteady flow solutions,using the location of any existing streamtraces as starting locations for the particles. Particles mayhave mass or be massless.CALCTURBULENCEFUNCTION calculates any of four turbulence-related functions, given any two inyour data set.CALCULATE calculates a PLOT3D function. The name of this function must be specified in the short-ened form listed in Section 9 - 3 “Parameter Assignment Values”.CALCULATEACCURACY uses Richardson extrapolation to estimate the order accuracy of the solution,given the solution on three grids of successively finer resolution. If either of the plotting options areset to TRUE, the resulting Tecplot 360 frames will be in front after executing this command.DISPLAYBOUNDARIES displays zone boundaries in a new frame according to settings made by theSETGEOMETRYANDBOUNDARIES macro. Each boundary of each 3D zone (in 3D Cartesian plots) or 2D
$!EXTENDEDCOMMAND COMMANDPROCESSORID = <string> COMMAND = <string>
251
Macro Commands for the Analyze Menu
zone (in 2D Cartesian plots) is displayed and named according to the boundary condition applied toit. Boundaries that are connected to the boundaries of adjacent zones are named as such.EXTRACTFLOWFEATURE displays shock surfaces, vortex cores, or separation and attachment lines for3D flow solutions. Separation and attachment lines are only calculated on no-slip wall boundariesidentified by the SETGEOMETRYANDBOUNDARIES macro. Shock surfaces are displayed as iso-surfacesof a new variable, ShockFeature, while the remaining features are displayed as new zones.EXTRAPOLATESOLUTION performs Richardson extrapolation to estimate the true solution from threeinput solutions on grids of successively finer resolution. It saves the extrapolated solution as a newzone in the current data set. It also saves an additional zone containing the difference between thissolution and the original solution.INTEGRATE performs an integration. All Integrate dialog options are available to this macro, includ-ing the display options. If the PLOTRESULTS parameter is set to TRUE, then the Tecplot 360 frameshowing the integration results is the current frame following this command.SAVEINTEGRATIONRESULTS has the same effect as clicking Save on the Integration Results dialogand selecting a file. The results are saved to the file named by the FILE parameter.SETFIELDVARIABLES identifies variables in your data, such as velocity, pressure and temperature,for use in analysis.SETFLUIDPROPERTIES sets the properties of the fluid, such as viscosity. These are used by someactions of the CALCULATE and INTEGRATE commands.SETGEOMETRYANDBOUNDARIES identifies boundaries of zones in a flow solution and the boundaryconditions applied to them. It also specifies whether zones with coincident boundary nodes shouldbe considered connected at those points, as well as whether 2D solutions should be regarded as axi-symmetric.SETREFERENCEVALUES sets the reference (free-stream) properties of the solution. This information isused by other calculations.SETUNSTEADYFLOWOPTIONS identifies solution time levels for unsteady flow solutions. This informa-tion is used for particle path and streakline calculations.
9 - 2 Macro Command DescriptionThe syntax, mandatory and optional parameters for each of the macro commands listed in Section 9- 1are described below. Items within single angle brackets (<>) are defined in Section 9 - 3.
NOTE: The COMMAND strings below must becontained on a single line in your macrocommand file, although they appear on mul-tiple lines below.
252
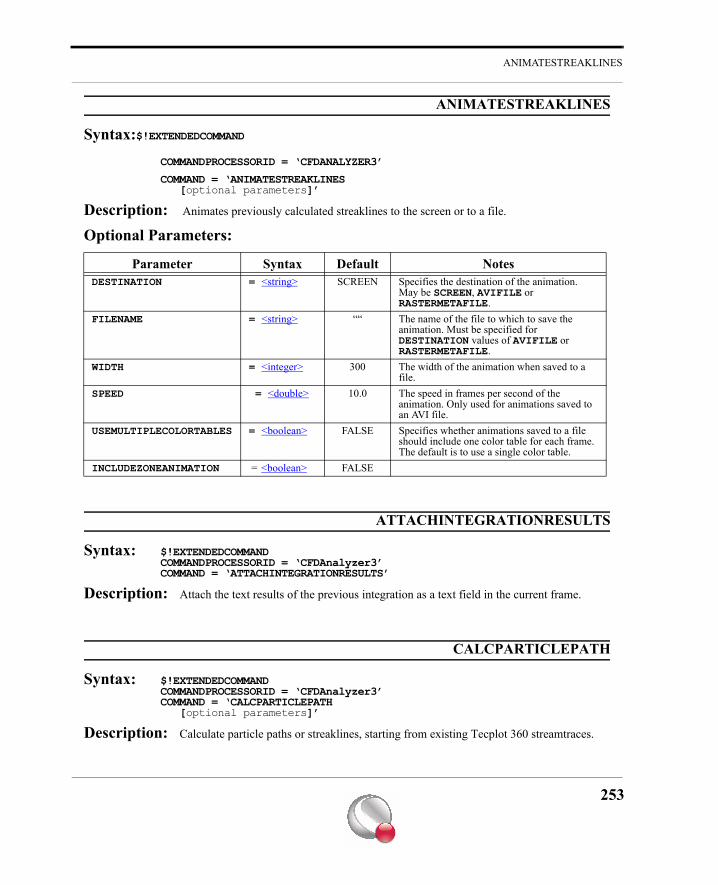
ANIMATESTREAKLINES
ANIMATESTREAKLINES
Syntax:$!EXTENDEDCOMMANDCOMMANDPROCESSORID = ‘CFDANALYZER3’
COMMAND = ‘ANIMATESTREAKLINES[optional parameters]’
Description: Animates previously calculated streaklines to the screen or to a file.
Optional Parameters:
ATTACHINTEGRATIONRESULTS
Syntax: $!EXTENDEDCOMMANDCOMMANDPROCESSORID = ‘CFDAnalyzer3’COMMAND = ‘ATTACHINTEGRATIONRESULTS’
Description: Attach the text results of the previous integration as a text field in the current frame.
CALCPARTICLEPATH
Syntax: $!EXTENDEDCOMMANDCOMMANDPROCESSORID = ‘CFDAnalyzer3’COMMAND = ‘CALCPARTICLEPATH
[optional parameters]’
Description: Calculate particle paths or streaklines, starting from existing Tecplot 360 streamtraces.
Parameter Syntax Default NotesDESTINATION = <string> SCREEN Specifies the destination of the animation.
May be SCREEN, AVIFILE or RASTERMETAFILE.
FILENAME = <string> ““ The name of the file to which to save the animation. Must be specified for DESTINATION values of AVIFILE or RASTERMETAFILE.
WIDTH = <integer> 300 The width of the animation when saved to a file.
SPEED = <double> 10.0 The speed in frames per second of the animation. Only used for animations saved to an AVI file.
USEMULTIPLECOLORTABLES = <boolean> FALSE Specifies whether animations saved to a file should include one color table for each frame. The default is to use a single color table.
INCLUDEZONEANIMATION = <boolean> FALSE
253
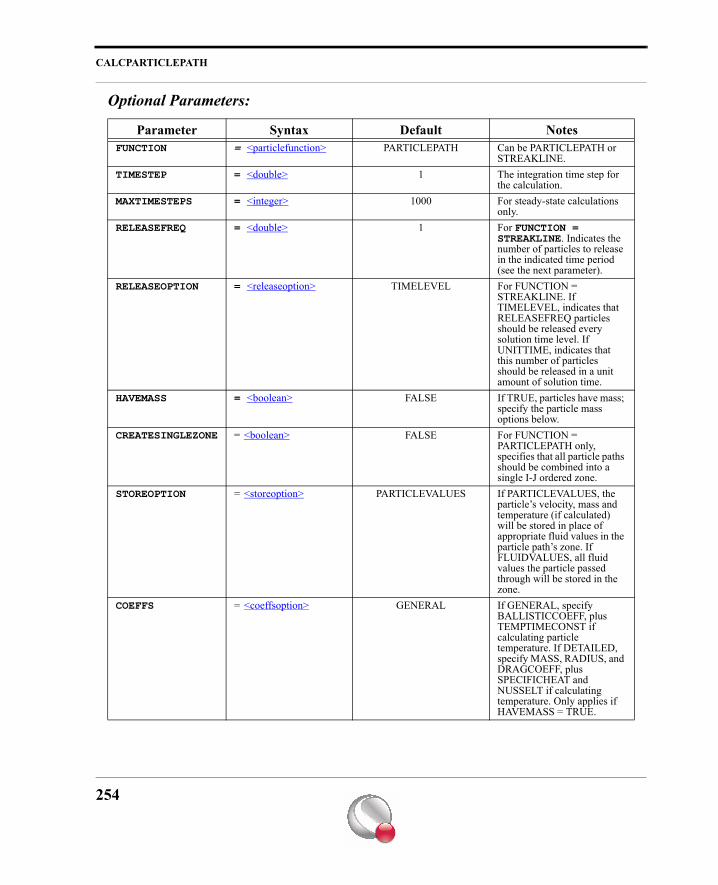
CALCPARTICLEPATH
Optional Parameters:
Parameter Syntax Default NotesFUNCTION = <particlefunction> PARTICLEPATH Can be PARTICLEPATH or
STREAKLINE.TIMESTEP = <double> 1 The integration time step for
the calculation.MAXTIMESTEPS = <integer> 1000 For steady-state calculations
only.RELEASEFREQ = <double> 1 For FUNCTION =
STREAKLINE. Indicates the number of particles to release in the indicated time period (see the next parameter).
RELEASEOPTION = <releaseoption> TIMELEVEL For FUNCTION = STREAKLINE. If TIMELEVEL, indicates that RELEASEFREQ particles should be released every solution time level. If UNITTIME, indicates that this number of particles should be released in a unit amount of solution time.
HAVEMASS = <boolean> FALSE If TRUE, particles have mass; specify the particle mass options below.
CREATESINGLEZONE = <boolean> FALSE For FUNCTION = PARTICLEPATH only, specifies that all particle paths should be combined into a single I-J ordered zone.
STOREOPTION = <storeoption> PARTICLEVALUES If PARTICLEVALUES, the particle’s velocity, mass and temperature (if calculated) will be stored in place of appropriate fluid values in the particle path’s zone. If FLUIDVALUES, all fluid values the particle passed through will be stored in the zone.
COEFFS = <coeffsoption> GENERAL If GENERAL, specify BALLISTICCOEFF, plus TEMPTIMECONST if calculating particle temperature. If DETAILED, specify MASS, RADIUS, and DRAGCOEFF, plus SPECIFICHEAT and NUSSELT if calculating temperature. Only applies if HAVEMASS = TRUE.
254
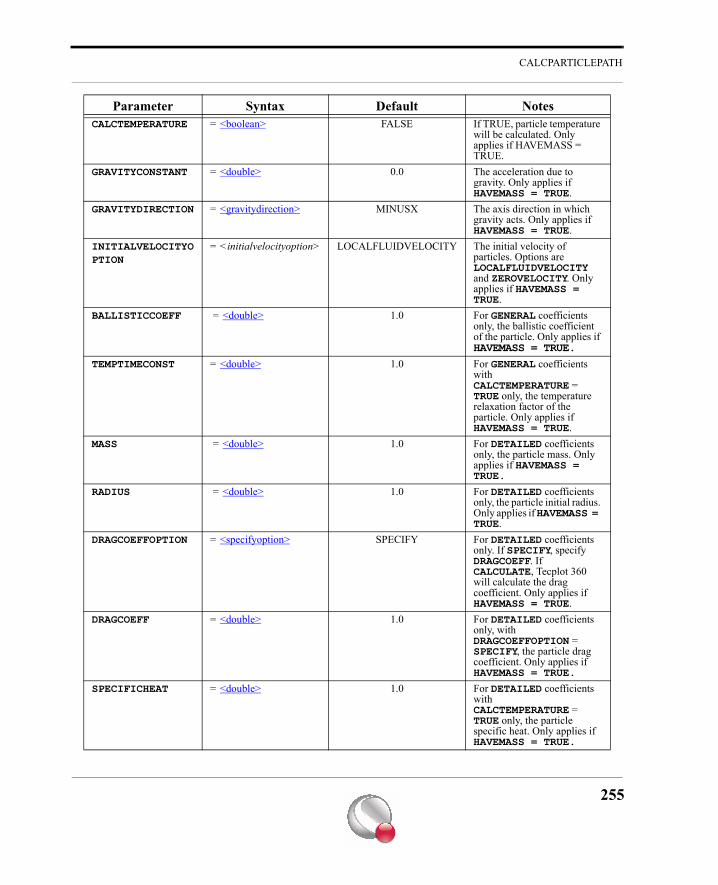
CALCPARTICLEPATH
CALCTEMPERATURE = <boolean> FALSE If TRUE, particle temperature will be calculated. Only applies if HAVEMASS = TRUE.
GRAVITYCONSTANT = <double> 0.0 The acceleration due to gravity. Only applies if HAVEMASS = TRUE.
GRAVITYDIRECTION = <gravitydirection> MINUSX The axis direction in which gravity acts. Only applies if HAVEMASS = TRUE.
INITIALVELOCITYOPTION
= <initialvelocityoption> LOCALFLUIDVELOCITY The initial velocity of particles. Options are LOCALFLUIDVELOCITY and ZEROVELOCITY. Only applies if HAVEMASS = TRUE.
BALLISTICCOEFF = <double> 1.0 For GENERAL coefficients only, the ballistic coefficient of the particle. Only applies if HAVEMASS = TRUE.
TEMPTIMECONST = <double> 1.0 For GENERAL coefficients with CALCTEMPERATURE = TRUE only, the temperature relaxation factor of the particle. Only applies if HAVEMASS = TRUE.
MASS = <double> 1.0 For DETAILED coefficients only, the particle mass. Only applies if HAVEMASS = TRUE.
RADIUS = <double> 1.0 For DETAILED coefficients only, the particle initial radius. Only applies if HAVEMASS = TRUE.
DRAGCOEFFOPTION = <specifyoption> SPECIFY For DETAILED coefficients only. If SPECIFY, specify DRAGCOEFF. If CALCULATE, Tecplot 360 will calculate the drag coefficient. Only applies if HAVEMASS = TRUE.
DRAGCOEFF = <double> 1.0 For DETAILED coefficients only, with DRAGCOEFFOPTION = SPECIFY, the particle drag coefficient. Only applies if HAVEMASS = TRUE.
SPECIFICHEAT = <double> 1.0 For DETAILED coefficients with CALCTEMPERATURE = TRUE only, the particle specific heat. Only applies if HAVEMASS = TRUE.
Parameter Syntax Default Notes
255
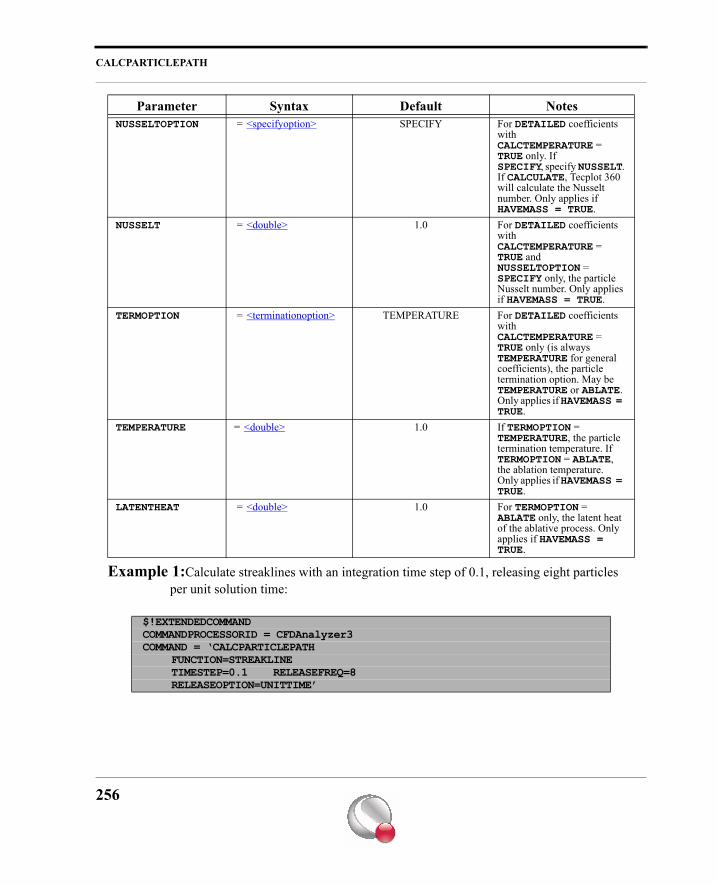
CALCPARTICLEPATH
Example 1:Calculate streaklines with an integration time step of 0.1, releasing eight particles per unit solution time:
NUSSELTOPTION = <specifyoption> SPECIFY For DETAILED coefficients with CALCTEMPERATURE = TRUE only. If SPECIFY, specify NUSSELT. If CALCULATE, Tecplot 360 will calculate the Nusselt number. Only applies if HAVEMASS = TRUE.
NUSSELT = <double> 1.0 For DETAILED coefficients with CALCTEMPERATURE = TRUE and NUSSELTOPTION = SPECIFY only, the particle Nusselt number. Only applies if HAVEMASS = TRUE.
TERMOPTION = <terminationoption> TEMPERATURE For DETAILED coefficients with CALCTEMPERATURE = TRUE only (is always TEMPERATURE for general coefficients), the particle termination option. May be TEMPERATURE or ABLATE. Only applies if HAVEMASS = TRUE.
TEMPERATURE = <double> 1.0 If TERMOPTION = TEMPERATURE, the particle termination temperature. If TERMOPTION = ABLATE, the ablation temperature. Only applies if HAVEMASS = TRUE.
LATENTHEAT = <double> 1.0 For TERMOPTION = ABLATE only, the latent heat of the ablative process. Only applies if HAVEMASS = TRUE.
$!EXTENDEDCOMMANDCOMMANDPROCESSORID = CFDAnalyzer3COMMAND = ‘CALCPARTICLEPATH
FUNCTION=STREAKLINETIMESTEP=0.1 RELEASEFREQ=8RELEASEOPTION=UNITTIME’
Parameter Syntax Default Notes
256
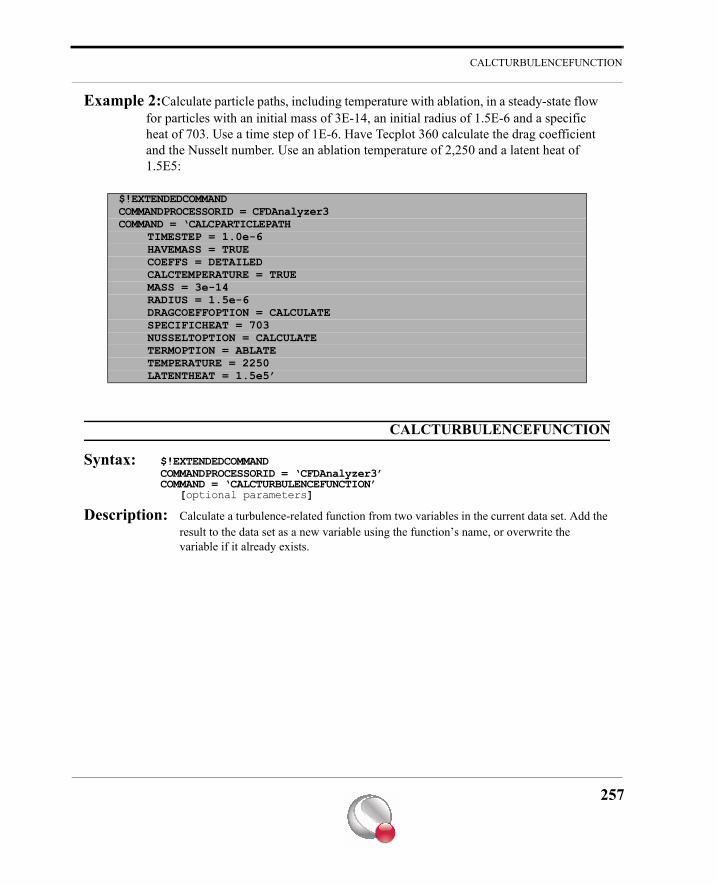
CALCTURBULENCEFUNCTION
Example 2:Calculate particle paths, including temperature with ablation, in a steady-state flow for particles with an initial mass of 3E-14, an initial radius of 1.5E-6 and a specific heat of 703. Use a time step of 1E-6. Have Tecplot 360 calculate the drag coefficient and the Nusselt number. Use an ablation temperature of 2,250 and a latent heat of 1.5E5:
CALCTURBULENCEFUNCTION
Syntax: $!EXTENDEDCOMMANDCOMMANDPROCESSORID = ‘CFDAnalyzer3’COMMAND = ‘CALCTURBULENCEFUNCTION’
[optional parameters]
Description: Calculate a turbulence-related function from two variables in the current data set. Add the result to the data set as a new variable using the function’s name, or overwrite the variable if it already exists.
$!EXTENDEDCOMMANDCOMMANDPROCESSORID = CFDAnalyzer3COMMAND = ‘CALCPARTICLEPATH
TIMESTEP = 1.0e-6HAVEMASS = TRUECOEFFS = DETAILEDCALCTEMPERATURE = TRUEMASS = 3e-14RADIUS = 1.5e-6DRAGCOEFFOPTION = CALCULATESPECIFICHEAT = 703NUSSELTOPTION = CALCULATETERMOPTION = ABLATETEMPERATURE = 2250LATENTHEAT = 1.5e5’
257
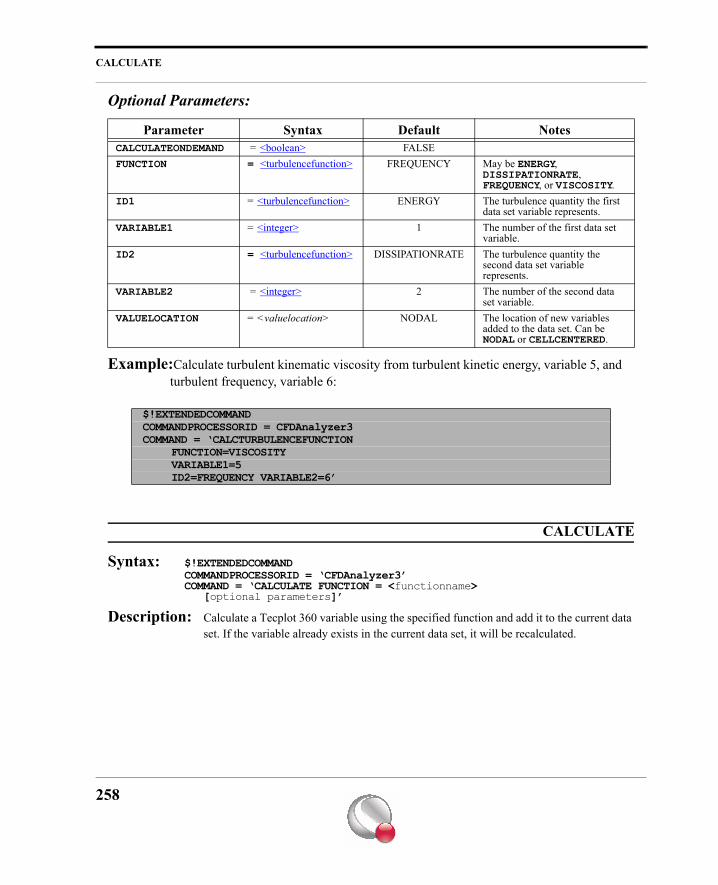
CALCULATE
Optional Parameters:
Example:Calculate turbulent kinematic viscosity from turbulent kinetic energy, variable 5, and turbulent frequency, variable 6:
CALCULATE
Syntax: $!EXTENDEDCOMMANDCOMMANDPROCESSORID = ‘CFDAnalyzer3’COMMAND = ‘CALCULATE FUNCTION = <functionname>
[optional parameters]’
Description: Calculate a Tecplot 360 variable using the specified function and add it to the current data set. If the variable already exists in the current data set, it will be recalculated.
Parameter Syntax Default NotesCALCULATEONDEMAND = <boolean> FALSEFUNCTION = <turbulencefunction> FREQUENCY May be ENERGY,
DISSIPATIONRATE, FREQUENCY, or VISCOSITY.
ID1 = <turbulencefunction> ENERGY The turbulence quantity the first data set variable represents.
VARIABLE1 = <integer> 1 The number of the first data set variable.
ID2 = <turbulencefunction> DISSIPATIONRATE The turbulence quantity the second data set variable represents.
VARIABLE2 = <integer> 2 The number of the second data set variable.
VALUELOCATION = <valuelocation> NODAL The location of new variables added to the data set. Can be NODAL or CELLCENTERED.
$!EXTENDEDCOMMANDCOMMANDPROCESSORID = CFDAnalyzer3COMMAND = ‘CALCTURBULENCEFUNCTION
FUNCTION=VISCOSITYVARIABLE1=5ID2=FREQUENCY VARIABLE2=6’
258
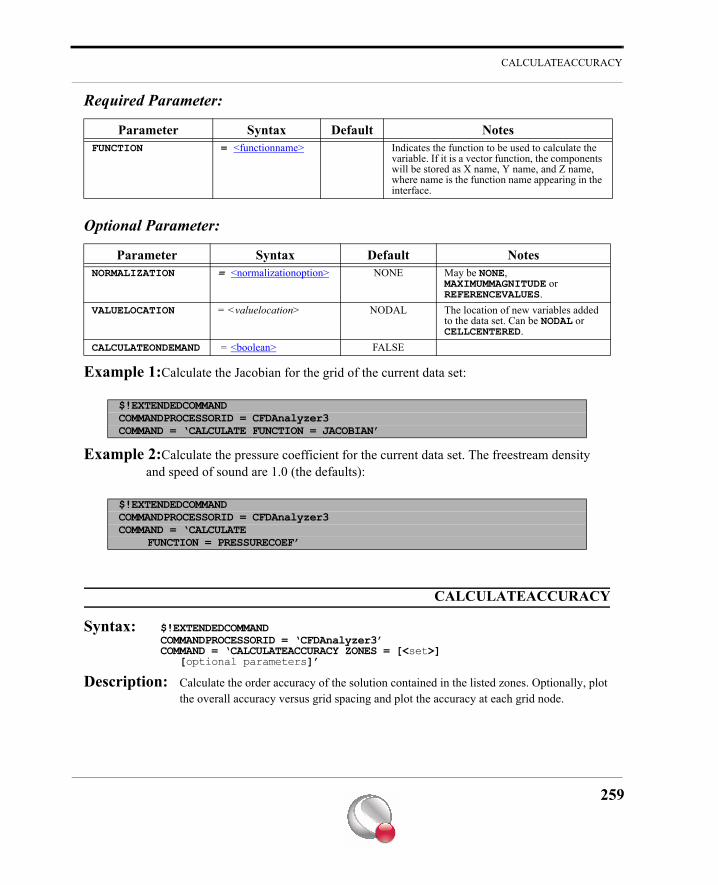
CALCULATEACCURACY
Required Parameter:
Optional Parameter:
Example 1:Calculate the Jacobian for the grid of the current data set:
Example 2:Calculate the pressure coefficient for the current data set. The freestream density and speed of sound are 1.0 (the defaults):
CALCULATEACCURACY
Syntax: $!EXTENDEDCOMMANDCOMMANDPROCESSORID = ‘CFDAnalyzer3’COMMAND = ‘CALCULATEACCURACY ZONES = [<set>]
[optional parameters]’
Description: Calculate the order accuracy of the solution contained in the listed zones. Optionally, plot the overall accuracy versus grid spacing and plot the accuracy at each grid node.
Parameter Syntax Default NotesFUNCTION = <functionname> Indicates the function to be used to calculate the
variable. If it is a vector function, the components will be stored as X name, Y name, and Z name, where name is the function name appearing in the interface.
Parameter Syntax Default NotesNORMALIZATION = <normalizationoption> NONE May be NONE,
MAXIMUMMAGNITUDE or REFERENCEVALUES.
VALUELOCATION = <valuelocation> NODAL The location of new variables added to the data set. Can be NODAL or CELLCENTERED.
CALCULATEONDEMAND = <boolean> FALSE
$!EXTENDEDCOMMANDCOMMANDPROCESSORID = CFDAnalyzer3COMMAND = ‘CALCULATE FUNCTION = JACOBIAN’
$!EXTENDEDCOMMANDCOMMANDPROCESSORID = CFDAnalyzer3COMMAND = ‘CALCULATE
FUNCTION = PRESSURECOEF’
259
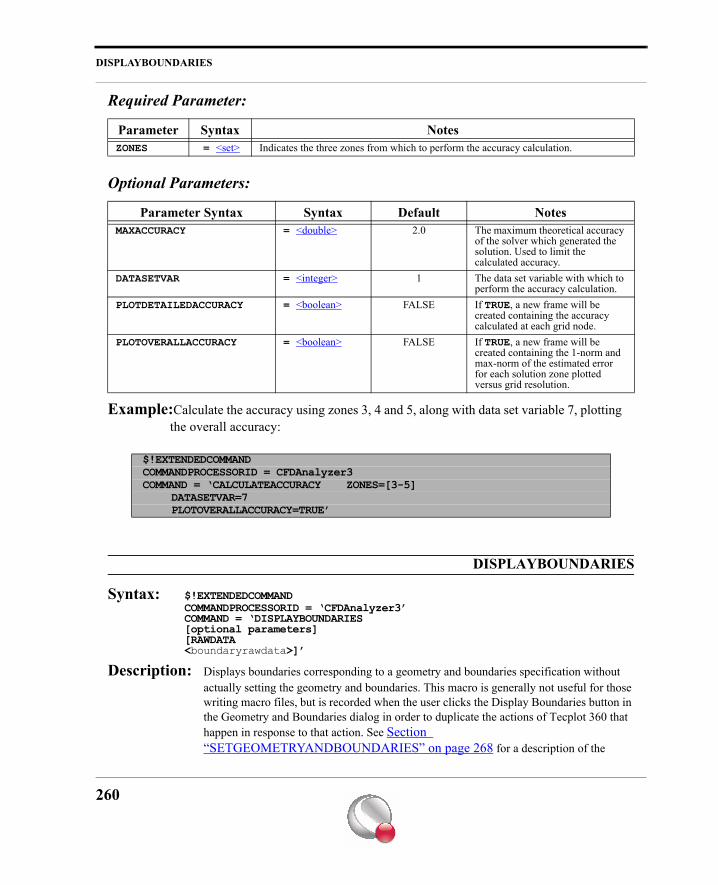
DISPLAYBOUNDARIES
Required Parameter:
Optional Parameters:
Example:Calculate the accuracy using zones 3, 4 and 5, along with data set variable 7, plotting the overall accuracy:
DISPLAYBOUNDARIES
Syntax: $!EXTENDEDCOMMANDCOMMANDPROCESSORID = ‘CFDAnalyzer3’COMMAND = ‘DISPLAYBOUNDARIES[optional parameters][RAWDATA<boundaryrawdata>]’
Description: Displays boundaries corresponding to a geometry and boundaries specification without actually setting the geometry and boundaries. This macro is generally not useful for those writing macro files, but is recorded when the user clicks the Display Boundaries button in the Geometry and Boundaries dialog in order to duplicate the actions of Tecplot 360 that happen in response to that action. See Section “SETGEOMETRYANDBOUNDARIES” on page 268 for a description of the
Parameter Syntax NotesZONES = <set> Indicates the three zones from which to perform the accuracy calculation.
Parameter Syntax Syntax Default NotesMAXACCURACY = <double> 2.0 The maximum theoretical accuracy
of the solver which generated the solution. Used to limit the calculated accuracy.
DATASETVAR = <integer> 1 The data set variable with which to perform the accuracy calculation.
PLOTDETAILEDACCURACY = <boolean> FALSE If TRUE, a new frame will be created containing the accuracy calculated at each grid node.
PLOTOVERALLACCURACY = <boolean> FALSE If TRUE, a new frame will be created containing the 1-norm and max-norm of the estimated error for each solution zone plotted versus grid resolution.
$!EXTENDEDCOMMANDCOMMANDPROCESSORID = CFDAnalyzer3COMMAND = ‘CALCULATEACCURACY ZONES=[3-5]
DATASETVAR=7PLOTOVERALLACCURACY=TRUE’
260
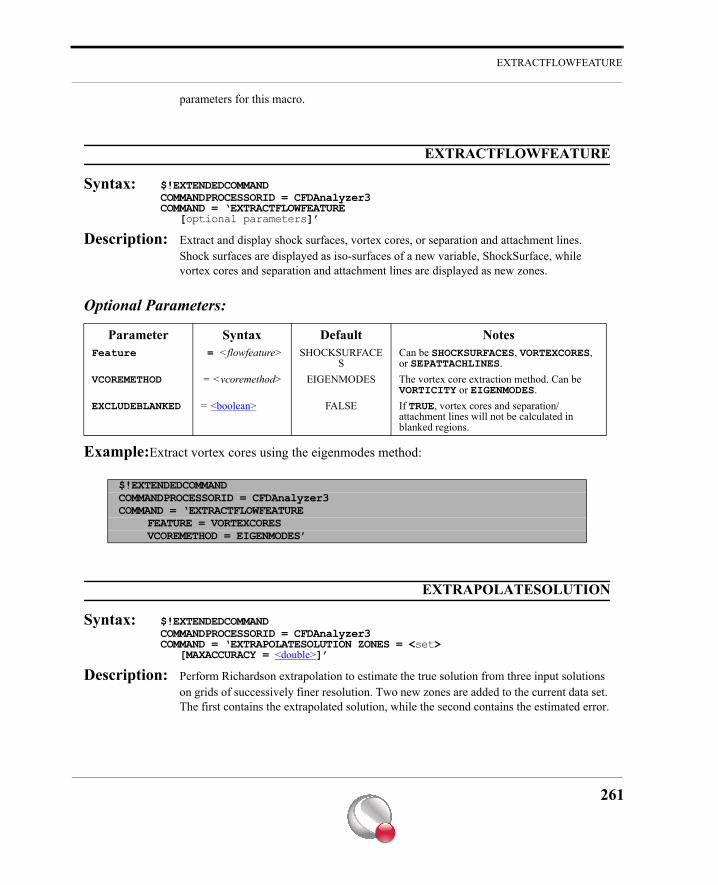
EXTRACTFLOWFEATURE
parameters for this macro.
EXTRACTFLOWFEATURE
Syntax: $!EXTENDEDCOMMANDCOMMANDPROCESSORID = CFDAnalyzer3COMMAND = ‘EXTRACTFLOWFEATURE
[optional parameters]’
Description: Extract and display shock surfaces, vortex cores, or separation and attachment lines. Shock surfaces are displayed as iso-surfaces of a new variable, ShockSurface, while vortex cores and separation and attachment lines are displayed as new zones.
Optional Parameters:
Example:Extract vortex cores using the eigenmodes method:
EXTRAPOLATESOLUTION
Syntax: $!EXTENDEDCOMMANDCOMMANDPROCESSORID = CFDAnalyzer3COMMAND = ‘EXTRAPOLATESOLUTION ZONES = <set>
[MAXACCURACY = <double>]’
Description: Perform Richardson extrapolation to estimate the true solution from three input solutions on grids of successively finer resolution. Two new zones are added to the current data set. The first contains the extrapolated solution, while the second contains the estimated error.
Parameter Syntax Default NotesFeature = <flowfeature> SHOCKSURFACE
SCan be SHOCKSURFACES, VORTEXCORES, or SEPATTACHLINES.
VCOREMETHOD = <vcoremethod> EIGENMODES The vortex core extraction method. Can be VORTICITY or EIGENMODES.
EXCLUDEBLANKED = <boolean> FALSE If TRUE, vortex cores and separation/attachment lines will not be calculated in blanked regions.
$!EXTENDEDCOMMANDCOMMANDPROCESSORID = CFDAnalyzer3COMMAND = ‘EXTRACTFLOWFEATURE
FEATURE = VORTEXCORESVCOREMETHOD = EIGENMODES’
261
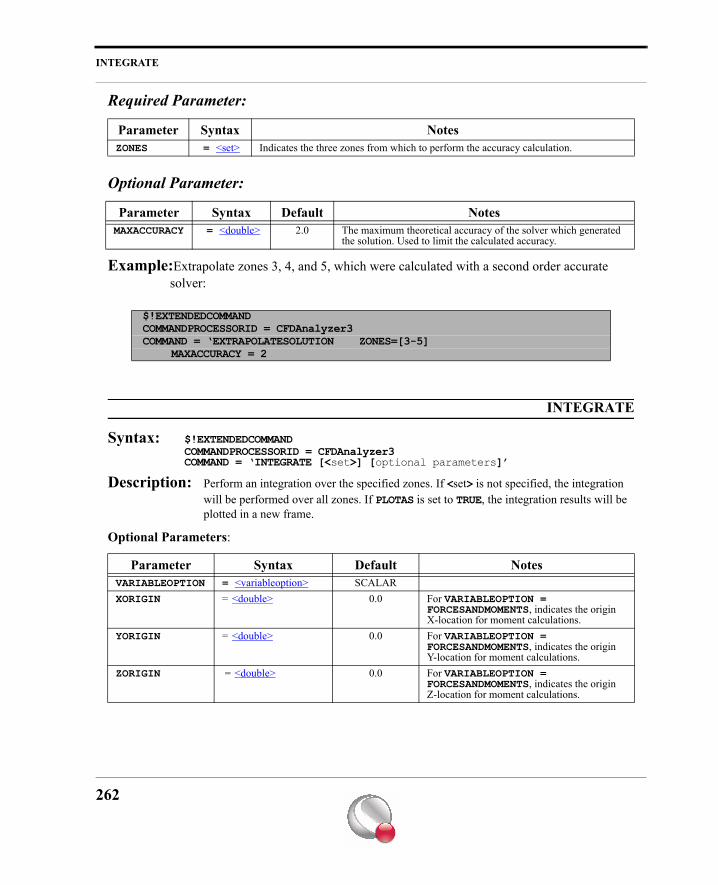
INTEGRATE
Required Parameter:
Optional Parameter:
Example:Extrapolate zones 3, 4, and 5, which were calculated with a second order accurate solver:
INTEGRATE
Syntax: $!EXTENDEDCOMMANDCOMMANDPROCESSORID = CFDAnalyzer3COMMAND = ‘INTEGRATE [<set>] [optional parameters]’
Description: Perform an integration over the specified zones. If <set> is not specified, the integration will be performed over all zones. If PLOTAS is set to TRUE, the integration results will be plotted in a new frame.
Optional Parameters:
Parameter Syntax NotesZONES = <set> Indicates the three zones from which to perform the accuracy calculation.
Parameter Syntax Default NotesMAXACCURACY = <double> 2.0 The maximum theoretical accuracy of the solver which generated
the solution. Used to limit the calculated accuracy.
$!EXTENDEDCOMMANDCOMMANDPROCESSORID = CFDAnalyzer3COMMAND = ‘EXTRAPOLATESOLUTION ZONES=[3-5]
MAXACCURACY = 2
Parameter Syntax Default NotesVARIABLEOPTION = <variableoption> SCALARXORIGIN = <double> 0.0 For VARIABLEOPTION =
FORCESANDMOMENTS, indicates the origin X-location for moment calculations.
YORIGIN = <double> 0.0 For VARIABLEOPTION = FORCESANDMOMENTS, indicates the origin Y-location for moment calculations.
ZORIGIN = <double> 0.0 For VARIABLEOPTION = FORCESANDMOMENTS, indicates the origin Z-location for moment calculations.
262
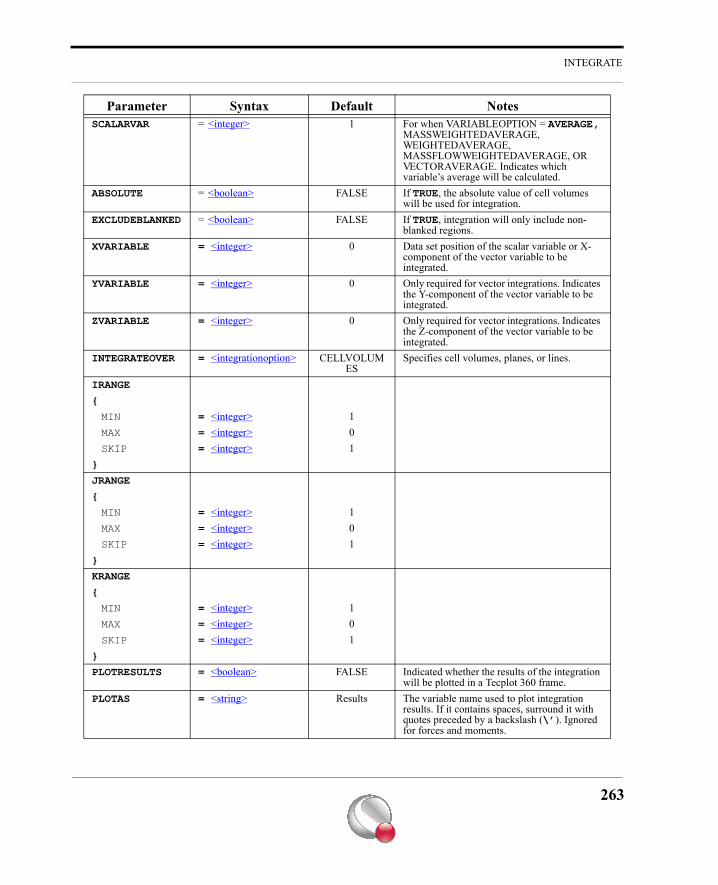
INTEGRATE
SCALARVAR = <integer> 1 For when VARIABLEOPTION = AVERAGE, MASSWEIGHTEDAVERAGE, WEIGHTEDAVERAGE, MASSFLOWWEIGHTEDAVERAGE, OR VECTORAVERAGE. Indicates which variable’s average will be calculated.
ABSOLUTE = <boolean> FALSE If TRUE, the absolute value of cell volumes will be used for integration.
EXCLUDEBLANKED = <boolean> FALSE If TRUE, integration will only include non-blanked regions.
XVARIABLE = <integer> 0 Data set position of the scalar variable or X-component of the vector variable to be integrated.
YVARIABLE = <integer> 0 Only required for vector integrations. Indicates the Y-component of the vector variable to be integrated.
ZVARIABLE = <integer> 0 Only required for vector integrations. Indicates the Z-component of the vector variable to be integrated.
INTEGRATEOVER = <integrationoption> CELLVOLUMES
Specifies cell volumes, planes, or lines.
IRANGE
{
MIN = <integer> 1MAX = <integer> 0SKIP = <integer> 1
}
JRANGE
{
MIN = <integer> 1MAX = <integer> 0SKIP = <integer> 1
}
KRANGE
{
MIN = <integer> 1MAX = <integer> 0SKIP = <integer> 1
}
PLOTRESULTS = <boolean> FALSE Indicated whether the results of the integration will be plotted in a Tecplot 360 frame.
PLOTAS = <string> Results The variable name used to plot integration results. If it contains spaces, surround it with quotes preceded by a backslash (\’). Ignored for forces and moments.
Parameter Syntax Default Notes
263
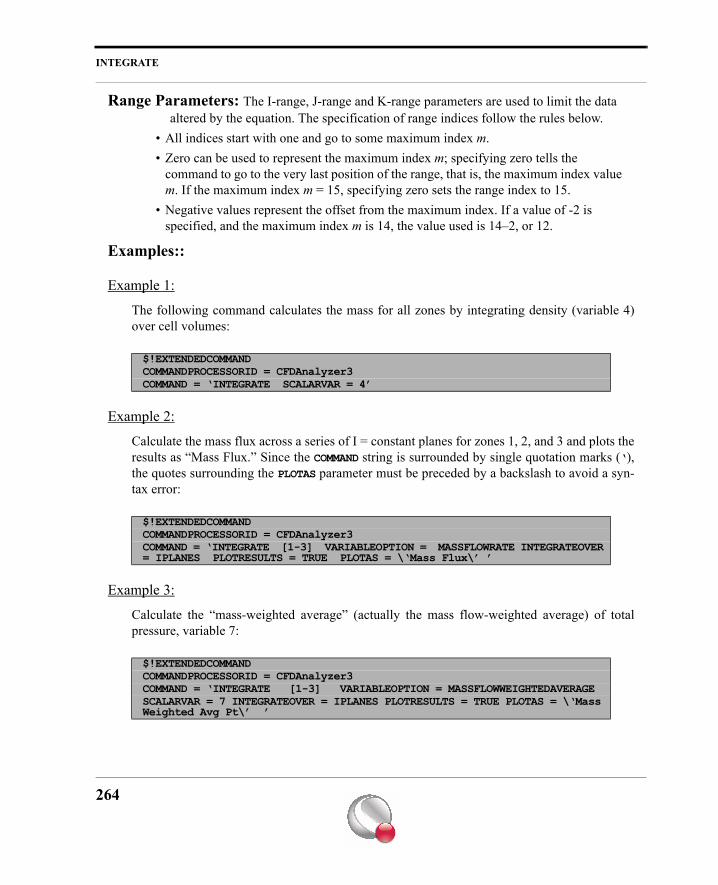
INTEGRATE
Range Parameters: The I-range, J-range and K-range parameters are used to limit the data altered by the equation. The specification of range indices follow the rules below.
• All indices start with one and go to some maximum index m.• Zero can be used to represent the maximum index m; specifying zero tells the
command to go to the very last position of the range, that is, the maximum index value m. If the maximum index m = 15, specifying zero sets the range index to 15.
• Negative values represent the offset from the maximum index. If a value of -2 is specified, and the maximum index m is 14, the value used is 14–2, or 12.
Examples::
Example 1:
The following command calculates the mass for all zones by integrating density (variable 4)over cell volumes:
Example 2:
Calculate the mass flux across a series of I = constant planes for zones 1, 2, and 3 and plots theresults as “Mass Flux.” Since the COMMAND string is surrounded by single quotation marks (‘),the quotes surrounding the PLOTAS parameter must be preceded by a backslash to avoid a syn-tax error:
Example 3:
Calculate the “mass-weighted average” (actually the mass flow-weighted average) of totalpressure, variable 7:
$!EXTENDEDCOMMANDCOMMANDPROCESSORID = CFDAnalyzer3COMMAND = ‘INTEGRATE SCALARVAR = 4’
$!EXTENDEDCOMMANDCOMMANDPROCESSORID = CFDAnalyzer3COMMAND = ‘INTEGRATE [1-3] VARIABLEOPTION = MASSFLOWRATE INTEGRATEOVER = IPLANES PLOTRESULTS = TRUE PLOTAS = \‘Mass Flux\’ ’
$!EXTENDEDCOMMANDCOMMANDPROCESSORID = CFDAnalyzer3COMMAND = ‘INTEGRATE [1-3] VARIABLEOPTION = MASSFLOWWEIGHTEDAVERAGESCALARVAR = 7 INTEGRATEOVER = IPLANES PLOTRESULTS = TRUE PLOTAS = \‘Mass Weighted Avg Pt\’ ’
264
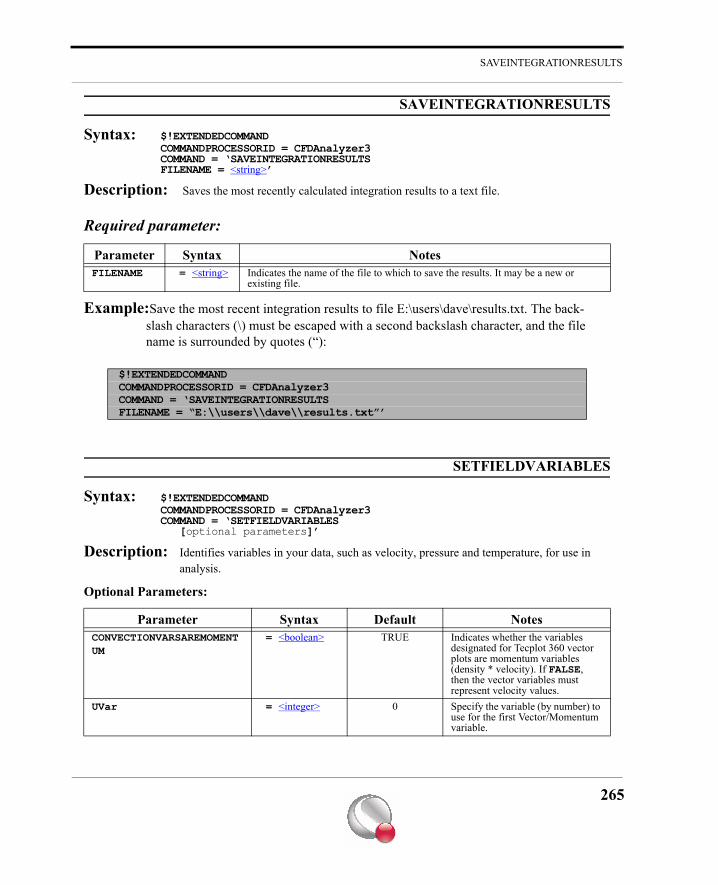
SAVEINTEGRATIONRESULTS
SAVEINTEGRATIONRESULTS
Syntax: $!EXTENDEDCOMMANDCOMMANDPROCESSORID = CFDAnalyzer3COMMAND = ‘SAVEINTEGRATIONRESULTSFILENAME = <string>’
Description: Saves the most recently calculated integration results to a text file.
Required parameter:
Example:Save the most recent integration results to file E:\users\dave\results.txt. The back-slash characters (\) must be escaped with a second backslash character, and the file name is surrounded by quotes (“):
SETFIELDVARIABLES
Syntax: $!EXTENDEDCOMMANDCOMMANDPROCESSORID = CFDAnalyzer3COMMAND = ‘SETFIELDVARIABLES
[optional parameters]’
Description: Identifies variables in your data, such as velocity, pressure and temperature, for use in analysis.
Optional Parameters:
Parameter Syntax NotesFILENAME = <string> Indicates the name of the file to which to save the results. It may be a new or
existing file.
$!EXTENDEDCOMMANDCOMMANDPROCESSORID = CFDAnalyzer3COMMAND = ‘SAVEINTEGRATIONRESULTSFILENAME = “E:\\users\\dave\\results.txt”’
Parameter Syntax Default NotesCONVECTIONVARSAREMOMENTUM
= <boolean> TRUE Indicates whether the variables designated for Tecplot 360 vector plots are momentum variables (density * velocity). If FALSE, then the vector variables must represent velocity values.
UVar = <integer> 0 Specify the variable (by number) to use for the first Vector/Momentum variable.
265
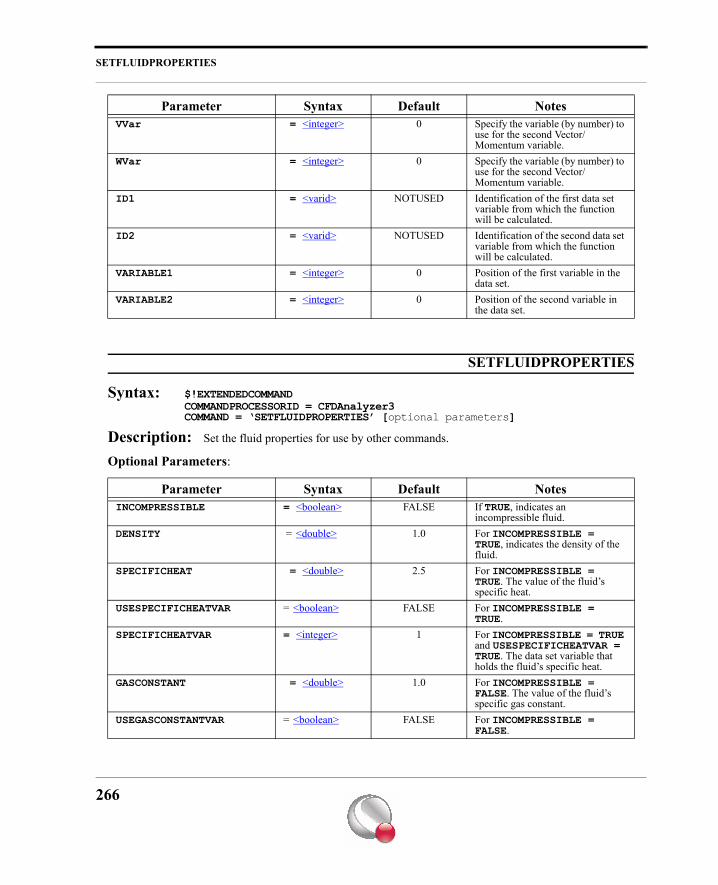
SETFLUIDPROPERTIES
SETFLUIDPROPERTIES
Syntax: $!EXTENDEDCOMMAND COMMANDPROCESSORID = CFDAnalyzer3COMMAND = ‘SETFLUIDPROPERTIES’ [optional parameters]
Description: Set the fluid properties for use by other commands.
Optional Parameters:
VVar = <integer> 0 Specify the variable (by number) to use for the second Vector/Momentum variable.
WVar = <integer> 0 Specify the variable (by number) to use for the second Vector/Momentum variable.
ID1 = <varid> NOTUSED Identification of the first data set variable from which the function will be calculated.
ID2 = <varid> NOTUSED Identification of the second data set variable from which the function will be calculated.
VARIABLE1 = <integer> 0 Position of the first variable in the data set.
VARIABLE2 = <integer> 0 Position of the second variable in the data set.
Parameter Syntax Default NotesINCOMPRESSIBLE = <boolean> FALSE If TRUE, indicates an
incompressible fluid.DENSITY = <double> 1.0 For INCOMPRESSIBLE =
TRUE, indicates the density of the fluid.
SPECIFICHEAT = <double> 2.5 For INCOMPRESSIBLE = TRUE. The value of the fluid’s specific heat.
USESPECIFICHEATVAR = <boolean> FALSE For INCOMPRESSIBLE = TRUE.
SPECIFICHEATVAR = <integer> 1 For INCOMPRESSIBLE = TRUE and USESPECIFICHEATVAR = TRUE. The data set variable that holds the fluid’s specific heat.
GASCONSTANT = <double> 1.0 For INCOMPRESSIBLE = FALSE. The value of the fluid’s specific gas constant.
USEGASCONSTANTVAR = <boolean> FALSE For INCOMPRESSIBLE = FALSE.
Parameter Syntax Default Notes
266
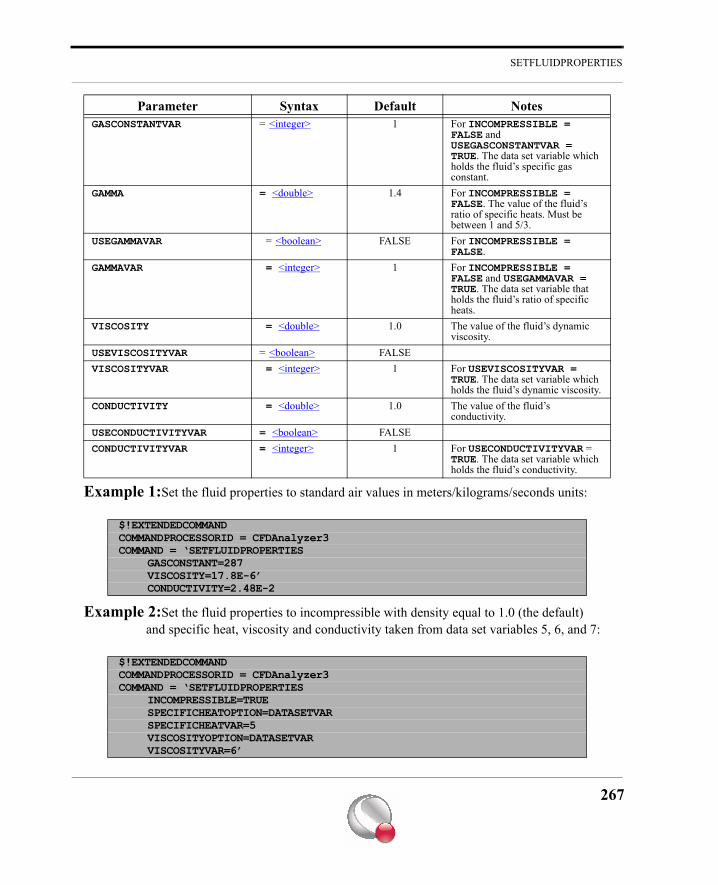
SETFLUIDPROPERTIES
Example 1:Set the fluid properties to standard air values in meters/kilograms/seconds units:
Example 2:Set the fluid properties to incompressible with density equal to 1.0 (the default) and specific heat, viscosity and conductivity taken from data set variables 5, 6, and 7:
GASCONSTANTVAR = <integer> 1 For INCOMPRESSIBLE = FALSE and USEGASCONSTANTVAR = TRUE. The data set variable which holds the fluid’s specific gas constant.
GAMMA = <double> 1.4 For INCOMPRESSIBLE = FALSE. The value of the fluid’s ratio of specific heats. Must be between 1 and 5/3.
USEGAMMAVAR = <boolean> FALSE For INCOMPRESSIBLE = FALSE.
GAMMAVAR = <integer> 1 For INCOMPRESSIBLE = FALSE and USEGAMMAVAR = TRUE. The data set variable that holds the fluid’s ratio of specific heats.
VISCOSITY = <double> 1.0 The value of the fluid’s dynamic viscosity.
USEVISCOSITYVAR = <boolean> FALSEVISCOSITYVAR = <integer> 1 For USEVISCOSITYVAR =
TRUE. The data set variable which holds the fluid’s dynamic viscosity.
CONDUCTIVITY = <double> 1.0 The value of the fluid’s conductivity.
USECONDUCTIVITYVAR = <boolean> FALSECONDUCTIVITYVAR = <integer> 1 For USECONDUCTIVITYVAR =
TRUE. The data set variable which holds the fluid’s conductivity.
$!EXTENDEDCOMMANDCOMMANDPROCESSORID = CFDAnalyzer3COMMAND = ‘SETFLUIDPROPERTIES
GASCONSTANT=287VISCOSITY=17.8E-6’CONDUCTIVITY=2.48E-2
$!EXTENDEDCOMMANDCOMMANDPROCESSORID = CFDAnalyzer3COMMAND = ‘SETFLUIDPROPERTIES
INCOMPRESSIBLE=TRUESPECIFICHEATOPTION=DATASETVARSPECIFICHEATVAR=5VISCOSITYOPTION=DATASETVARVISCOSITYVAR=6’
Parameter Syntax Default Notes
267
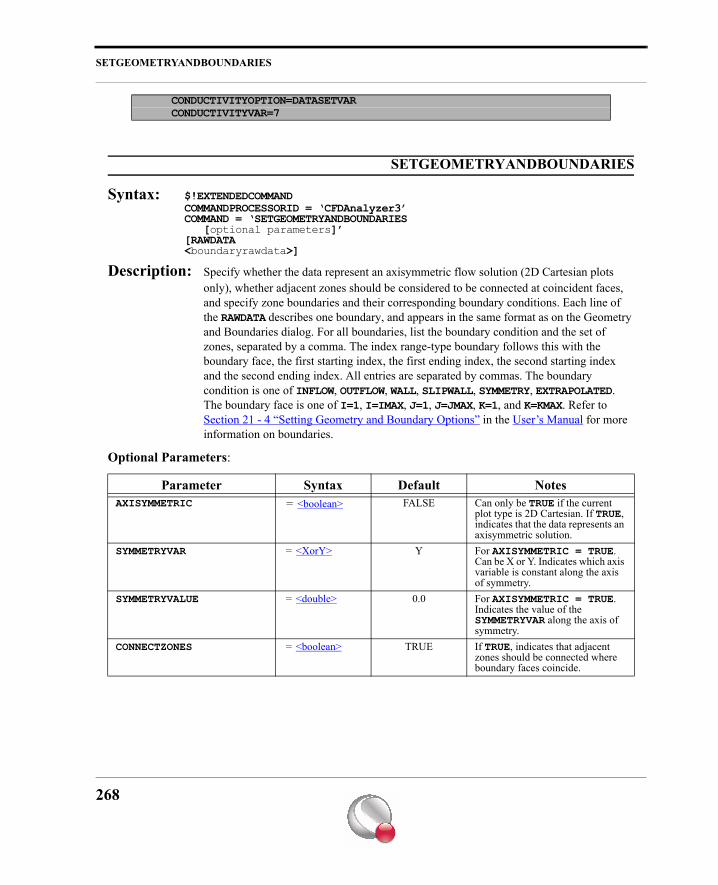
SETGEOMETRYANDBOUNDARIES
SETGEOMETRYANDBOUNDARIES
Syntax: $!EXTENDEDCOMMANDCOMMANDPROCESSORID = ‘CFDAnalyzer3’COMMAND = ‘SETGEOMETRYANDBOUNDARIES
[optional parameters]’[RAWDATA<boundaryrawdata>]
Description: Specify whether the data represent an axisymmetric flow solution (2D Cartesian plots only), whether adjacent zones should be considered to be connected at coincident faces, and specify zone boundaries and their corresponding boundary conditions. Each line of the RAWDATA describes one boundary, and appears in the same format as on the Geometry and Boundaries dialog. For all boundaries, list the boundary condition and the set of zones, separated by a comma. The index range-type boundary follows this with the boundary face, the first starting index, the first ending index, the second starting index and the second ending index. All entries are separated by commas. The boundary condition is one of INFLOW, OUTFLOW, WALL, SLIPWALL, SYMMETRY, EXTRAPOLATED. The boundary face is one of I=1, I=IMAX, J=1, J=JMAX, K=1, and K=KMAX. Refer to Section 21 - 4 “Setting Geometry and Boundary Options” in the User’s Manual for more information on boundaries.
Optional Parameters:
CONDUCTIVITYOPTION=DATASETVARCONDUCTIVITYVAR=7
Parameter Syntax Default NotesAXISYMMETRIC = <boolean> FALSE Can only be TRUE if the current
plot type is 2D Cartesian. If TRUE, indicates that the data represents an axisymmetric solution.
SYMMETRYVAR = <XorY> Y For AXISYMMETRIC = TRUE. Can be X or Y. Indicates which axis variable is constant along the axis of symmetry.
SYMMETRYVALUE = <double> 0.0 For AXISYMMETRIC = TRUE. Indicates the value of the SYMMETRYVAR along the axis of symmetry.
CONNECTZONES = <boolean> TRUE If TRUE, indicates that adjacent zones should be connected where boundary faces coincide.
268
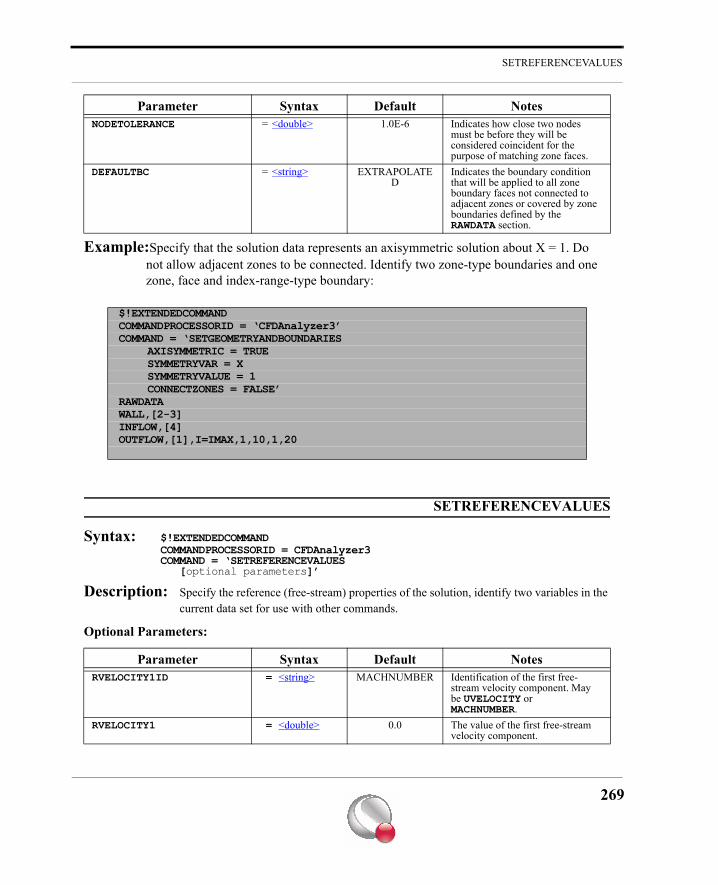
SETREFERENCEVALUES
Example:Specify that the solution data represents an axisymmetric solution about X = 1. Do not allow adjacent zones to be connected. Identify two zone-type boundaries and one zone, face and index-range-type boundary:
SETREFERENCEVALUES
Syntax: $!EXTENDEDCOMMANDCOMMANDPROCESSORID = CFDAnalyzer3COMMAND = ‘SETREFERENCEVALUES
[optional parameters]’
Description: Specify the reference (free-stream) properties of the solution, identify two variables in the current data set for use with other commands.
Optional Parameters:
NODETOLERANCE = <double> 1.0E-6 Indicates how close two nodes must be before they will be considered coincident for the purpose of matching zone faces.
DEFAULTBC = <string> EXTRAPOLATED
Indicates the boundary condition that will be applied to all zone boundary faces not connected to adjacent zones or covered by zone boundaries defined by the RAWDATA section.
$!EXTENDEDCOMMANDCOMMANDPROCESSORID = ‘CFDAnalyzer3’COMMAND = ‘SETGEOMETRYANDBOUNDARIES
AXISYMMETRIC = TRUESYMMETRYVAR = XSYMMETRYVALUE = 1CONNECTZONES = FALSE’
RAWDATAWALL,[2-3]INFLOW,[4]OUTFLOW,[1],I=IMAX,1,10,1,20
Parameter Syntax Default NotesRVELOCITY1ID = <string> MACHNUMBER Identification of the first free-
stream velocity component. May be UVELOCITY or MACHNUMBER.
RVELOCITY1 = <double> 0.0 The value of the first free-stream velocity component.
Parameter Syntax Default Notes
269
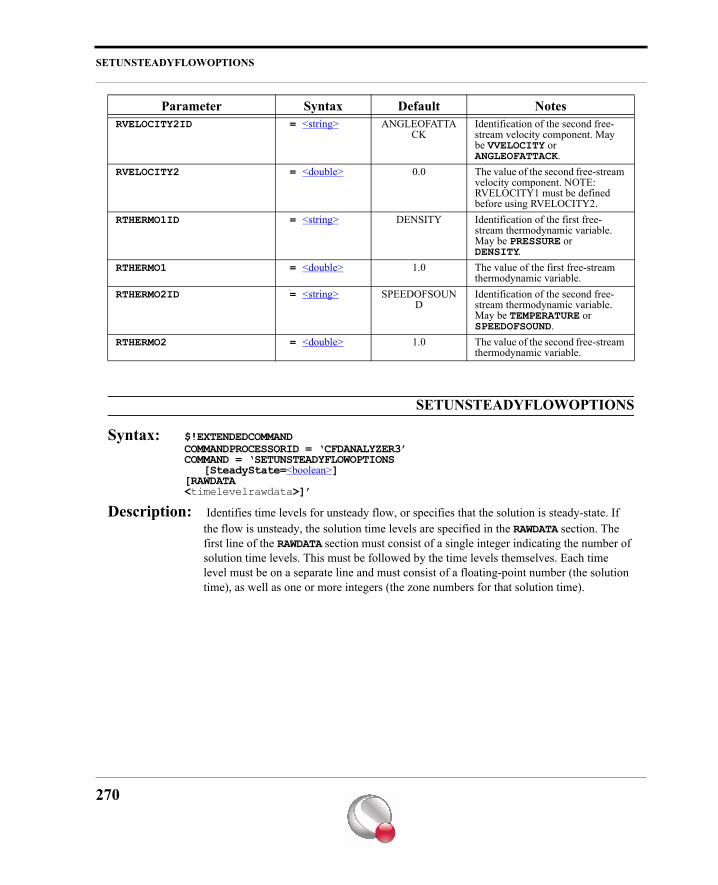
SETUNSTEADYFLOWOPTIONS
SETUNSTEADYFLOWOPTIONS
Syntax: $!EXTENDEDCOMMANDCOMMANDPROCESSORID = ‘CFDANALYZER3’COMMAND = ‘SETUNSTEADYFLOWOPTIONS
[SteadyState=<boolean>][RAWDATA<timelevelrawdata>]’
Description: Identifies time levels for unsteady flow, or specifies that the solution is steady-state. If the flow is unsteady, the solution time levels are specified in the RAWDATA section. The first line of the RAWDATA section must consist of a single integer indicating the number of solution time levels. This must be followed by the time levels themselves. Each time level must be on a separate line and must consist of a floating-point number (the solution time), as well as one or more integers (the zone numbers for that solution time).
RVELOCITY2ID = <string> ANGLEOFATTACK
Identification of the second free-stream velocity component. May be VVELOCITY or ANGLEOFATTACK.
RVELOCITY2 = <double> 0.0 The value of the second free-stream velocity component. NOTE: RVELOCITY1 must be defined before using RVELOCITY2.
RTHERMO1ID = <string> DENSITY Identification of the first free-stream thermodynamic variable. May be PRESSURE or DENSITY.
RTHERMO1 = <double> 1.0 The value of the first free-stream thermodynamic variable.
RTHERMO2ID = <string> SPEEDOFSOUND
Identification of the second free-stream thermodynamic variable. May be TEMPERATURE or SPEEDOFSOUND.
RTHERMO2 = <double> 1.0 The value of the second free-stream thermodynamic variable.
Parameter Syntax Default Notes
270
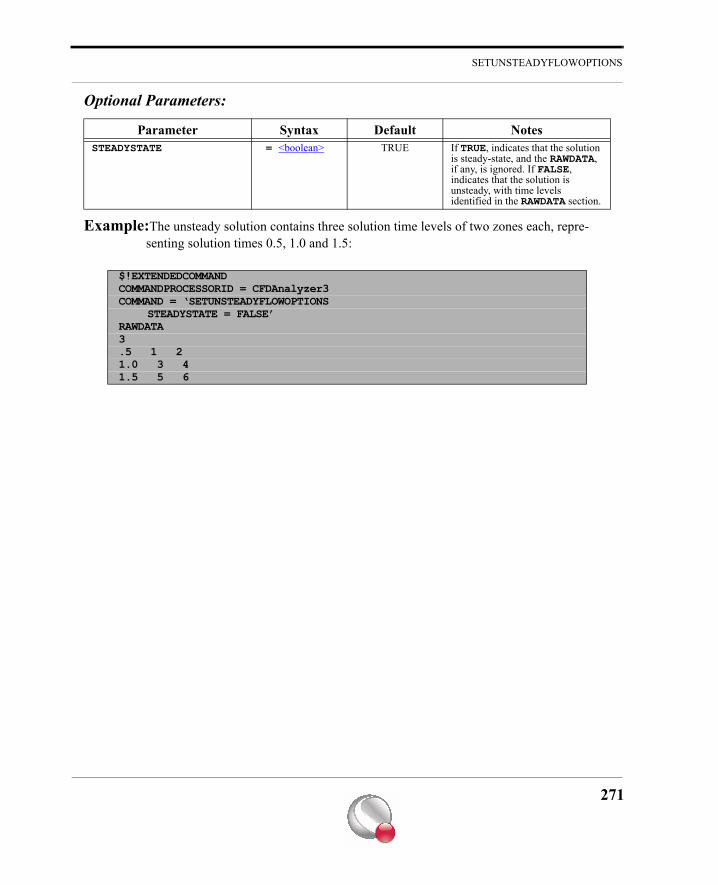
SETUNSTEADYFLOWOPTIONS
Optional Parameters:
Example:The unsteady solution contains three solution time levels of two zones each, repre-senting solution times 0.5, 1.0 and 1.5:
Parameter Syntax Default NotesSTEADYSTATE = <boolean> TRUE If TRUE, indicates that the solution
is steady-state, and the RAWDATA, if any, is ignored. If FALSE, indicates that the solution is unsteady, with time levels identified in the RAWDATA section.
$!EXTENDEDCOMMANDCOMMANDPROCESSORID = CFDAnalyzer3COMMAND = ‘SETUNSTEADYFLOWOPTIONS
STEADYSTATE = FALSE’RAWDATA3.5 1 21.0 3 41.5 5 6
271
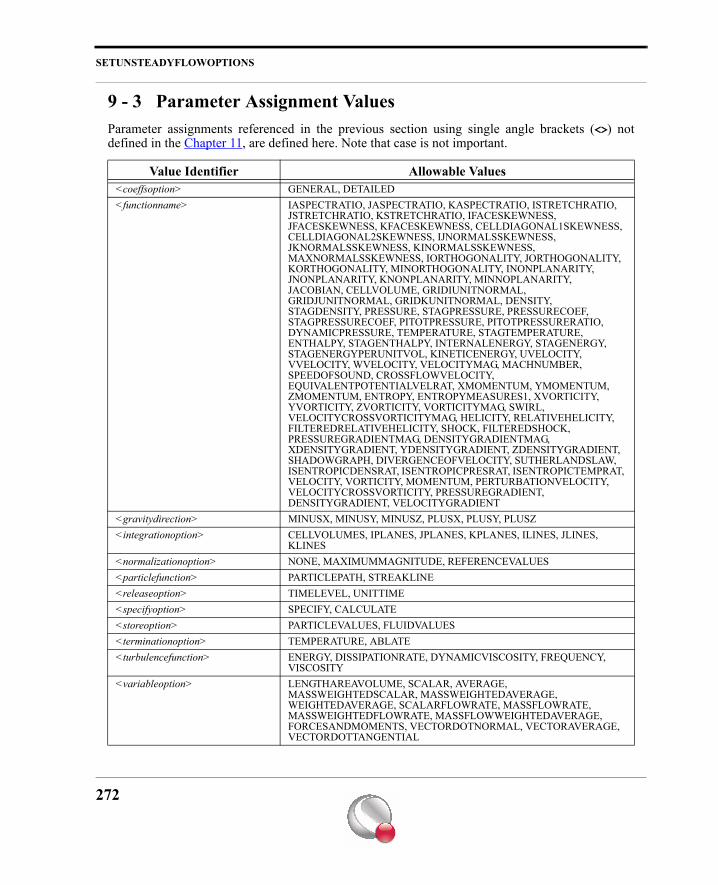
SETUNSTEADYFLOWOPTIONS
9 - 3 Parameter Assignment ValuesParameter assignments referenced in the previous section using single angle brackets (<>) notdefined in the Chapter 11, are defined here. Note that case is not important.
Value Identifier Allowable Values<coeffsoption> GENERAL, DETAILED<functionname> IASPECTRATIO, JASPECTRATIO, KASPECTRATIO, ISTRETCHRATIO,
JSTRETCHRATIO, KSTRETCHRATIO, IFACESKEWNESS, JFACESKEWNESS, KFACESKEWNESS, CELLDIAGONAL1SKEWNESS, CELLDIAGONAL2SKEWNESS, IJNORMALSSKEWNESS, JKNORMALSSKEWNESS, KINORMALSSKEWNESS, MAXNORMALSSKEWNESS, IORTHOGONALITY, JORTHOGONALITY, KORTHOGONALITY, MINORTHOGONALITY, INONPLANARITY, JNONPLANARITY, KNONPLANARITY, MINNOPLANARITY, JACOBIAN, CELLVOLUME, GRIDIUNITNORMAL, GRIDJUNITNORMAL, GRIDKUNITNORMAL, DENSITY, STAGDENSITY, PRESSURE, STAGPRESSURE, PRESSURECOEF, STAGPRESSURECOEF, PITOTPRESSURE, PITOTPRESSURERATIO, DYNAMICPRESSURE, TEMPERATURE, STAGTEMPERATURE, ENTHALPY, STAGENTHALPY, INTERNALENERGY, STAGENERGY, STAGENERGYPERUNITVOL, KINETICENERGY, UVELOCITY, VVELOCITY, WVELOCITY, VELOCITYMAG, MACHNUMBER, SPEEDOFSOUND, CROSSFLOWVELOCITY, EQUIVALENTPOTENTIALVELRAT, XMOMENTUM, YMOMENTUM, ZMOMENTUM, ENTROPY, ENTROPYMEASURES1, XVORTICITY, YVORTICITY, ZVORTICITY, VORTICITYMAG, SWIRL, VELOCITYCROSSVORTICITYMAG, HELICITY, RELATIVEHELICITY, FILTEREDRELATIVEHELICITY, SHOCK, FILTEREDSHOCK, PRESSUREGRADIENTMAG, DENSITYGRADIENTMAG, XDENSITYGRADIENT, YDENSITYGRADIENT, ZDENSITYGRADIENT, SHADOWGRAPH, DIVERGENCEOFVELOCITY, SUTHERLANDSLAW, ISENTROPICDENSRAT, ISENTROPICPRESRAT, ISENTROPICTEMPRAT, VELOCITY, VORTICITY, MOMENTUM, PERTURBATIONVELOCITY, VELOCITYCROSSVORTICITY, PRESSUREGRADIENT, DENSITYGRADIENT, VELOCITYGRADIENT
<gravitydirection> MINUSX, MINUSY, MINUSZ, PLUSX, PLUSY, PLUSZ<integrationoption> CELLVOLUMES, IPLANES, JPLANES, KPLANES, ILINES, JLINES,
KLINES<normalizationoption> NONE, MAXIMUMMAGNITUDE, REFERENCEVALUES<particlefunction> PARTICLEPATH, STREAKLINE<releaseoption> TIMELEVEL, UNITTIME<specifyoption> SPECIFY, CALCULATE<storeoption> PARTICLEVALUES, FLUIDVALUES<terminationoption> TEMPERATURE, ABLATE<turbulencefunction> ENERGY, DISSIPATIONRATE, DYNAMICVISCOSITY, FREQUENCY,
VISCOSITY<variableoption> LENGTHAREAVOLUME, SCALAR, AVERAGE,
MASSWEIGHTEDSCALAR, MASSWEIGHTEDAVERAGE, WEIGHTEDAVERAGE, SCALARFLOWRATE, MASSFLOWRATE, MASSWEIGHTEDFLOWRATE, MASSFLOWWEIGHTEDAVERAGE, FORCESANDMOMENTS, VECTORDOTNORMAL, VECTORAVERAGE, VECTORDOTTANGENTIAL
272
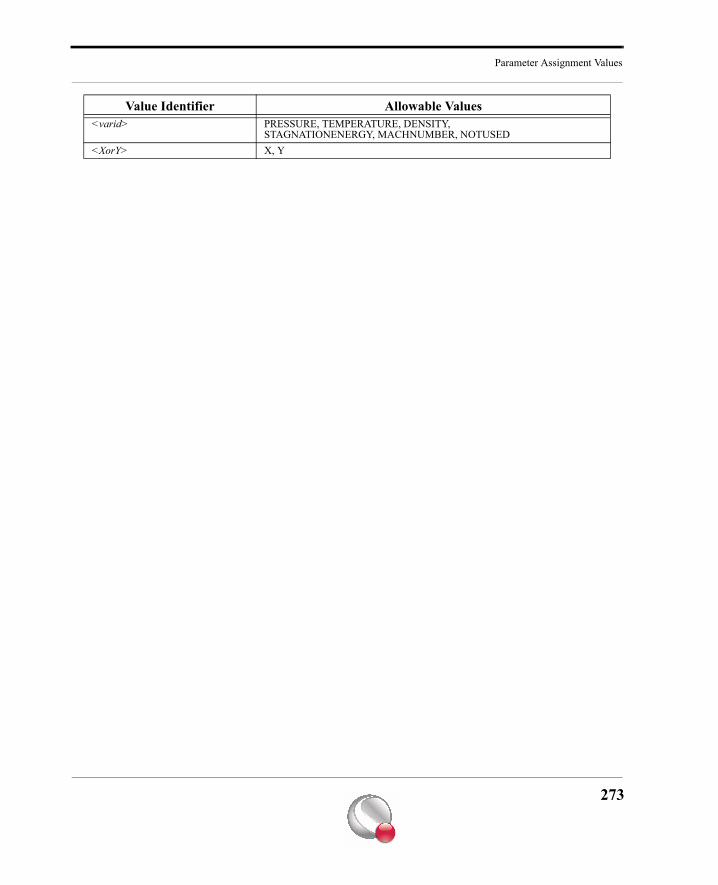
Parameter Assignment Values
<varid> PRESSURE, TEMPERATURE, DENSITY, STAGNATIONENERGY, MACHNUMBER, NOTUSED
<XorY> X, Y
Value Identifier Allowable Values
273
SETUNSTEADYFLOWOPTIONS
274
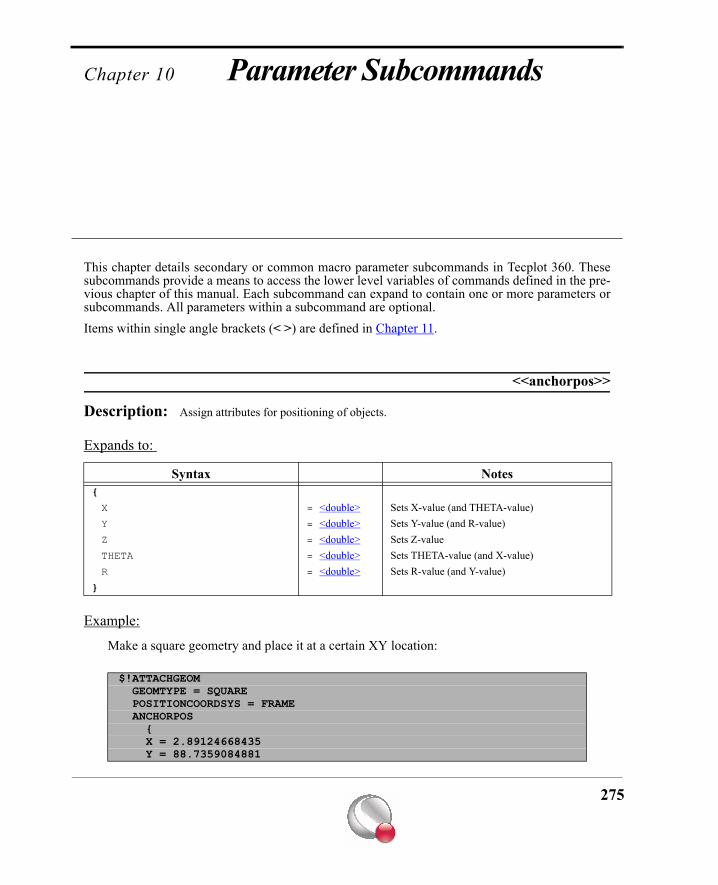
Chapter 10 Parameter Subcommands
This chapter details secondary or common macro parameter subcommands in Tecplot 360. Thesesubcommands provide a means to access the lower level variables of commands defined in the pre-vious chapter of this manual. Each subcommand can expand to contain one or more parameters orsubcommands. All parameters within a subcommand are optional.Items within single angle brackets (< >) are defined in Chapter 11.
<<anchorpos>>
Description: Assign attributes for positioning of objects.
Expands to:
Example:
Make a square geometry and place it at a certain XY location:
Syntax Notes{
X = <double> Sets X-value (and THETA-value)Y = <double> Sets Y-value (and R-value)Z = <double> Sets Z-value THETA = <double> Sets THETA-value (and X-value)R = <double> Sets R-value (and Y-value)
}
$!ATTACHGEOM GEOMTYPE = SQUARE POSITIONCOORDSYS = FRAME ANCHORPOS { X = 2.89124668435 Y = 88.7359084881
275
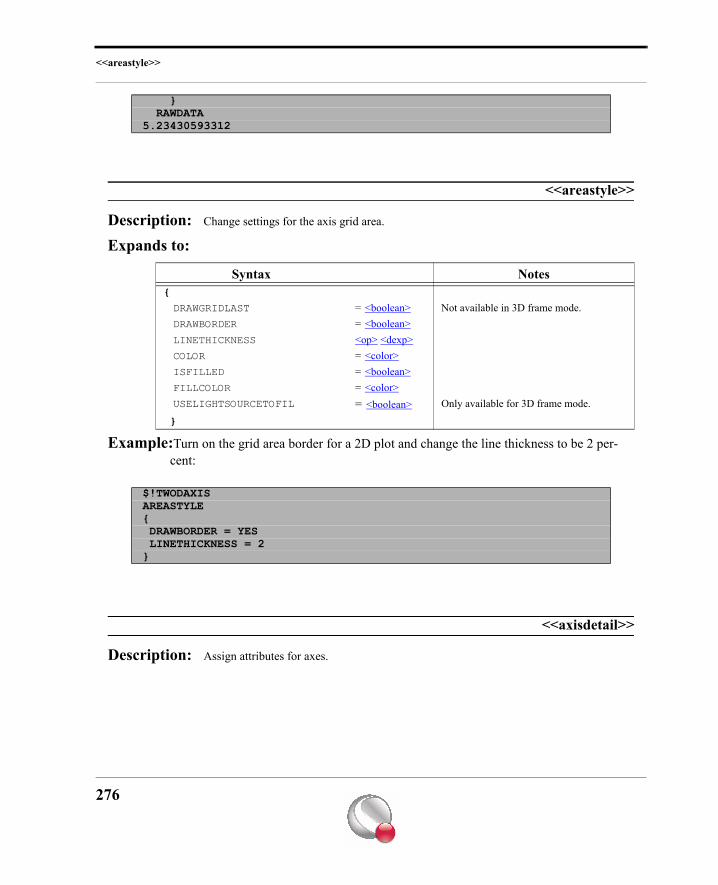
<<areastyle>>
<<areastyle>>
Description: Change settings for the axis grid area.
Expands to:
Example:Turn on the grid area border for a 2D plot and change the line thickness to be 2 per-cent:
<<axisdetail>>
Description: Assign attributes for axes.
} RAWDATA5.23430593312
Syntax Notes{
DRAWGRIDLAST = <boolean> Not available in 3D frame mode.DRAWBORDER = <boolean>LINETHICKNESS <op> <dexp>COLOR = <color>ISFILLED = <boolean>FILLCOLOR = <color> USELIGHTSOURCETOFIL = <boolean> Only available for 3D frame mode.
}
$!TWODAXISAREASTYLE{ DRAWBORDER = YES LINETHICKNESS = 2}
276
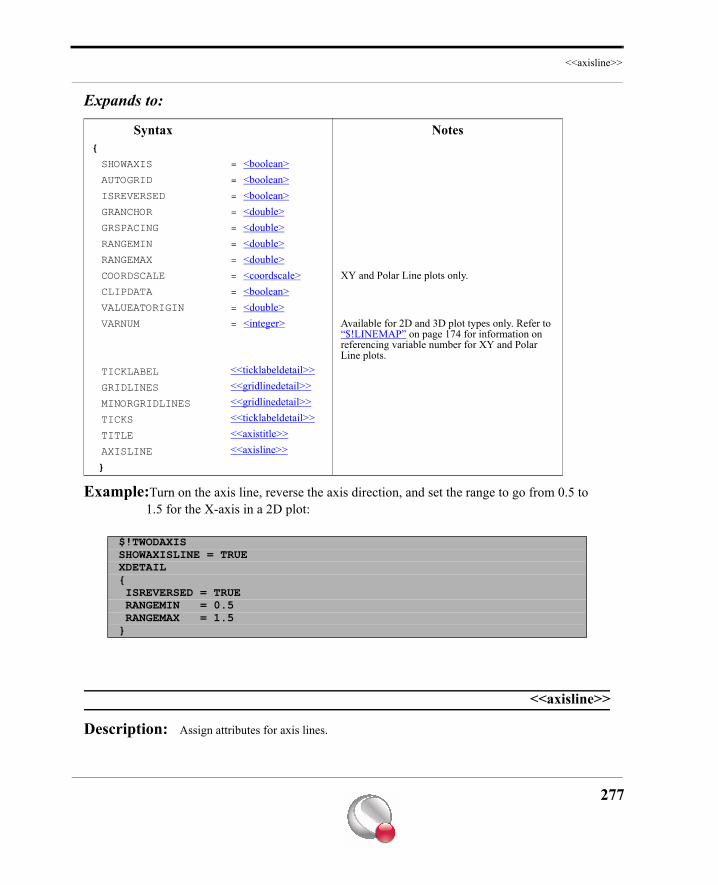
<<axisline>>
Expands to:
Example:Turn on the axis line, reverse the axis direction, and set the range to go from 0.5 to 1.5 for the X-axis in a 2D plot:
<<axisline>>
Description: Assign attributes for axis lines.
Syntax Notes{
SHOWAXIS = <boolean>AUTOGRID = <boolean>ISREVERSED = <boolean>GRANCHOR = <double>GRSPACING = <double>RANGEMIN = <double>RANGEMAX = <double>COORDSCALE = <coordscale> XY and Polar Line plots only.CLIPDATA = <boolean>VALUEATORIGIN = <double>VARNUM = <integer> Available for 2D and 3D plot types only. Refer to
“$!LINEMAP” on page 174 for information on referencing variable number for XY and Polar Line plots.
TICKLABEL <<ticklabeldetail>>GRIDLINES <<gridlinedetail>>MINORGRIDLINES <<gridlinedetail>>TICKS <<ticklabeldetail>>TITLE <<axistitle>>AXISLINE <<axisline>>
}
$!TWODAXISSHOWAXISLINE = TRUEXDETAIL{ ISREVERSED = TRUE RANGEMIN = 0.5 RANGEMAX = 1.5}
277
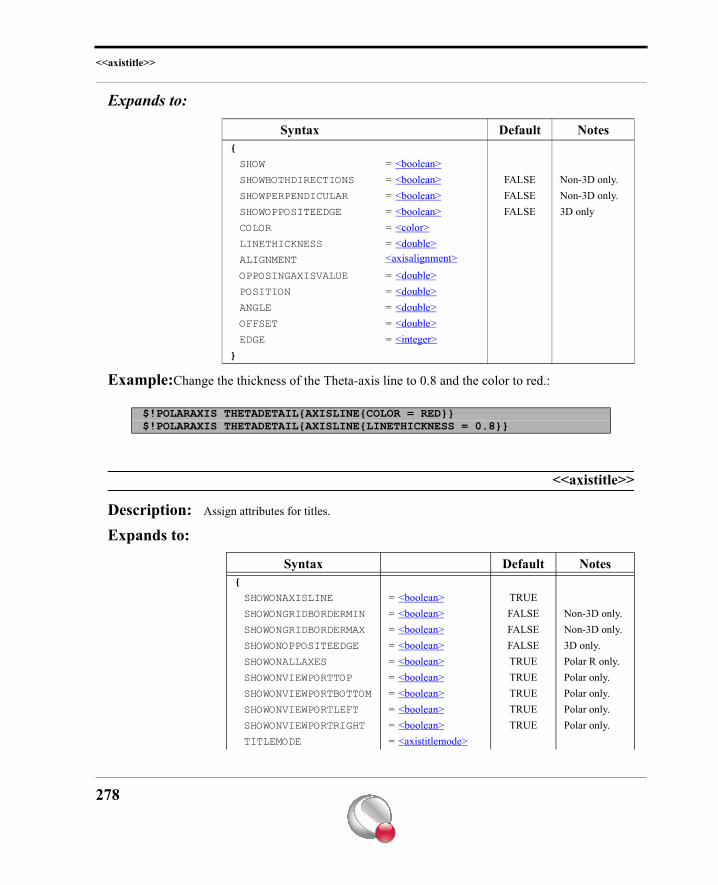
<<axistitle>>
Expands to:
Example:Change the thickness of the Theta-axis line to 0.8 and the color to red.:
<<axistitle>>
Description: Assign attributes for titles.
Expands to:
Syntax Default Notes{
SHOW = <boolean>SHOWBOTHDIRECTIONS = <boolean> FALSE Non-3D only.SHOWPERPENDICULAR = <boolean> FALSE Non-3D only.SHOWOPPOSITEEDGE = <boolean> FALSE 3D onlyCOLOR = <color>LINETHICKNESS = <double>ALIGNMENT <axisalignment>OPPOSINGAXISVALUE = <double>POSITION = <double>ANGLE = <double>OFFSET = <double>EDGE = <integer>
}
$!POLARAXIS THETADETAIL{AXISLINE{COLOR = RED}}$!POLARAXIS THETADETAIL{AXISLINE{LINETHICKNESS = 0.8}}
Syntax Default Notes{
SHOWONAXISLINE = <boolean> TRUE SHOWONGRIDBORDERMIN = <boolean> FALSE Non-3D only. SHOWONGRIDBORDERMAX = <boolean> FALSE Non-3D only. SHOWONOPPOSITEEDGE = <boolean> FALSE 3D only. SHOWONALLAXES = <boolean> TRUE Polar R only. SHOWONVIEWPORTTOP = <boolean> TRUE Polar only. SHOWONVIEWPORTBOTTOM = <boolean> TRUE Polar only. SHOWONVIEWPORTLEFT = <boolean> TRUE Polar only. SHOWONVIEWPORTRIGHT = <boolean> TRUE Polar only. TITLEMODE = <axistitlemode>
278
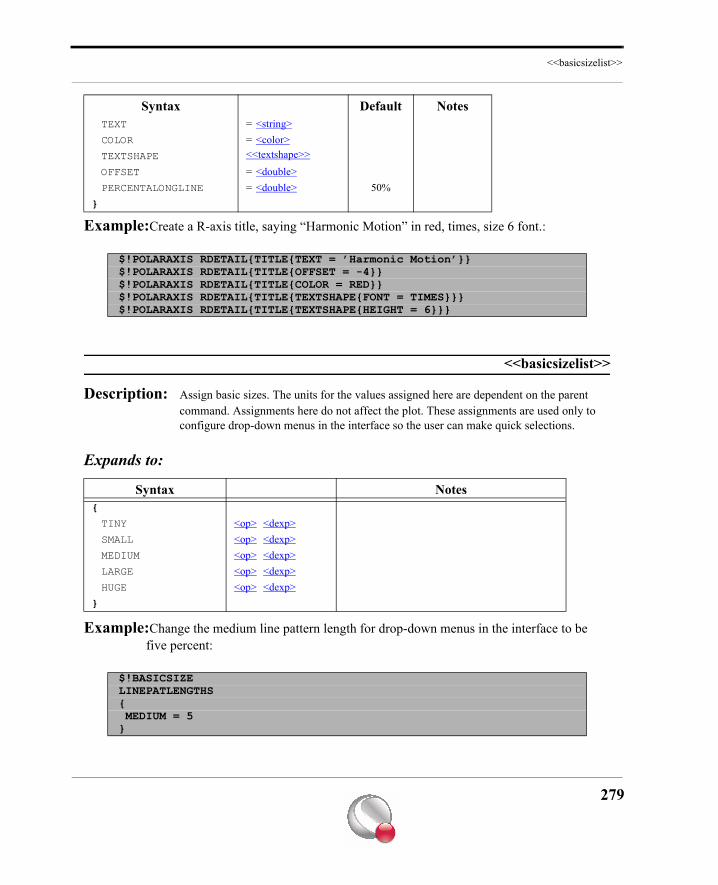
<<basicsizelist>>
Example:Create a R-axis title, saying “Harmonic Motion” in red, times, size 6 font.:
<<basicsizelist>>
Description: Assign basic sizes. The units for the values assigned here are dependent on the parent command. Assignments here do not affect the plot. These assignments are used only to configure drop-down menus in the interface so the user can make quick selections.
Expands to:
Example:Change the medium line pattern length for drop-down menus in the interface to be five percent:
TEXT = <string>COLOR = <color>TEXTSHAPE <<textshape>>OFFSET = <double>PERCENTALONGLINE = <double> 50%
}
$!POLARAXIS RDETAIL{TITLE{TEXT = ’Harmonic Motion’}}$!POLARAXIS RDETAIL{TITLE{OFFSET = -4}}$!POLARAXIS RDETAIL{TITLE{COLOR = RED}}$!POLARAXIS RDETAIL{TITLE{TEXTSHAPE{FONT = TIMES}}}$!POLARAXIS RDETAIL{TITLE{TEXTSHAPE{HEIGHT = 6}}}
Syntax Notes{
TINY <op> <dexp>SMALL <op> <dexp>MEDIUM <op> <dexp>LARGE <op> <dexp>HUGE <op> <dexp>
}
$!BASICSIZELINEPATLENGTHS{ MEDIUM = 5}
Syntax Default Notes
279
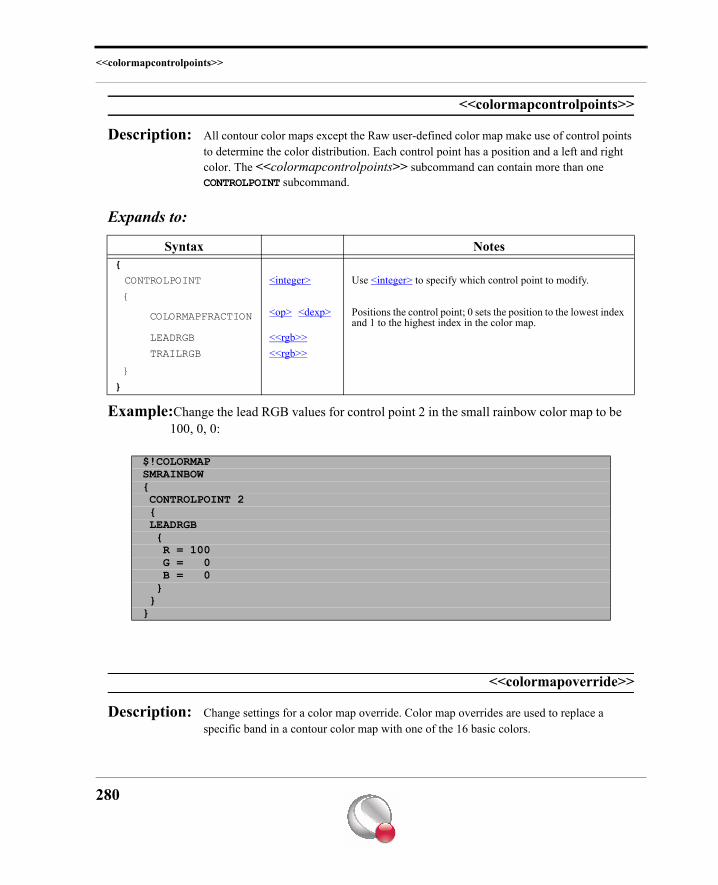
<<colormapcontrolpoints>>
<<colormapcontrolpoints>>
Description: All contour color maps except the Raw user-defined color map make use of control points to determine the color distribution. Each control point has a position and a left and right color. The <<colormapcontrolpoints>> subcommand can contain more than one CONTROLPOINT subcommand.
Expands to:
Example:Change the lead RGB values for control point 2 in the small rainbow color map to be 100, 0, 0:
<<colormapoverride>>
Description: Change settings for a color map override. Color map overrides are used to replace a specific band in a contour color map with one of the 16 basic colors.
Syntax Notes{
CONTROLPOINT <integer> Use <integer> to specify which control point to modify.{
COLORMAPFRACTION <op> <dexp> Positions the control point; 0 sets the position to the lowest index and 1 to the highest index in the color map.
LEADRGB <<rgb>> TRAILRGB <<rgb>>}
}
$!COLORMAPSMRAINBOW{ CONTROLPOINT 2 { LEADRGB { R = 100 G = 0 B = 0 } }}
280
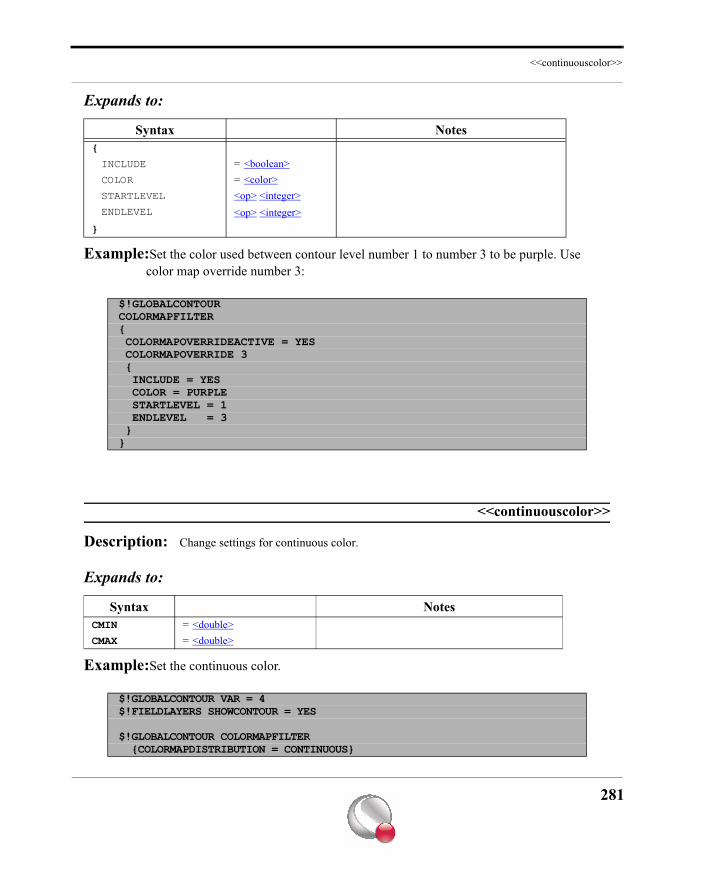
<<continuouscolor>>
Expands to:
Example:Set the color used between contour level number 1 to number 3 to be purple. Use color map override number 3:
<<continuouscolor>>
Description: Change settings for continuous color.
Expands to:
Example:Set the continuous color.
Syntax Notes{
INCLUDE = <boolean>COLOR = <color>STARTLEVEL <op> <integer>ENDLEVEL <op> <integer>
}
$!GLOBALCONTOURCOLORMAPFILTER{ COLORMAPOVERRIDEACTIVE = YES COLORMAPOVERRIDE 3 { INCLUDE = YES COLOR = PURPLE STARTLEVEL = 1 ENDLEVEL = 3 }}
Syntax NotesCMIN = <double>CMAX = <double>
$!GLOBALCONTOUR VAR = 4$!FIELDLAYERS SHOWCONTOUR = YES
$!GLOBALCONTOUR COLORMAPFILTER {COLORMAPDISTRIBUTION = CONTINUOUS}
281
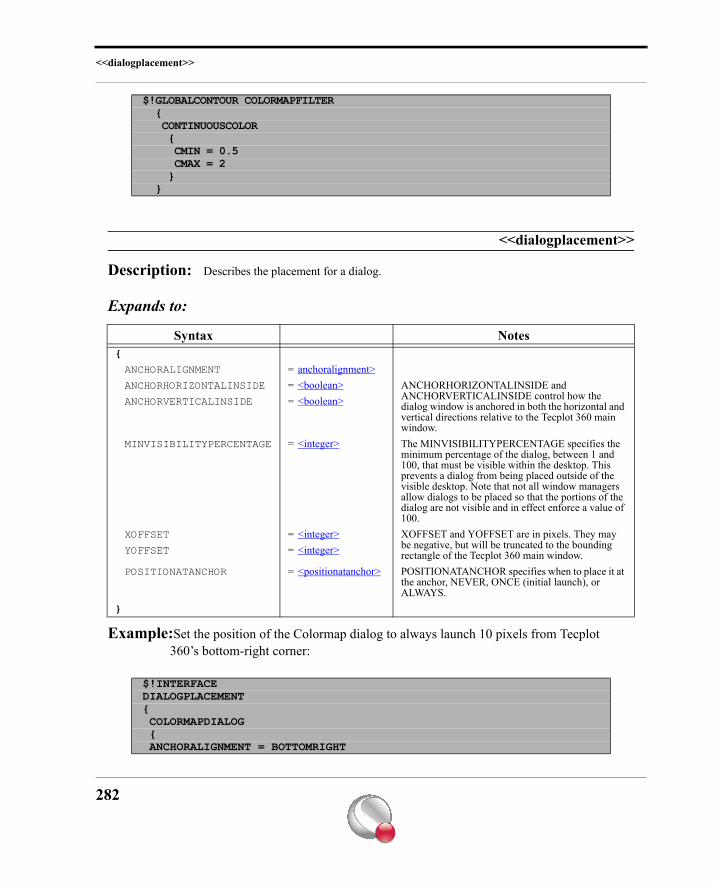
<<dialogplacement>>
<<dialogplacement>>
Description: Describes the placement for a dialog.
Expands to:
Example:Set the position of the Colormap dialog to always launch 10 pixels from Tecplot 360’s bottom-right corner:
$!GLOBALCONTOUR COLORMAPFILTER { CONTINUOUSCOLOR { CMIN = 0.5 CMAX = 2 } }
Syntax Notes{
ANCHORALIGNMENT = anchoralignment>ANCHORHORIZONTALINSIDE = <boolean> ANCHORHORIZONTALINSIDE and
ANCHORVERTICALINSIDE control how the dialog window is anchored in both the horizontal and vertical directions relative to the Tecplot 360 main window.
ANCHORVERTICALINSIDE = <boolean>
MINVISIBILITYPERCENTAGE = <integer> The MINVISIBILITYPERCENTAGE specifies the minimum percentage of the dialog, between 1 and 100, that must be visible within the desktop. This prevents a dialog from being placed outside of the visible desktop. Note that not all window managers allow dialogs to be placed so that the portions of the dialog are not visible and in effect enforce a value of 100.
XOFFSET = <integer> XOFFSET and YOFFSET are in pixels. They may be negative, but will be truncated to the bounding rectangle of the Tecplot 360 main window.YOFFSET = <integer>
POSITIONATANCHOR = <positionatanchor> POSITIONATANCHOR specifies when to place it at the anchor, NEVER, ONCE (initial launch), or ALWAYS.
}
$!INTERFACEDIALOGPLACEMENT{ COLORMAPDIALOG { ANCHORALIGNMENT = BOTTOMRIGHT
282
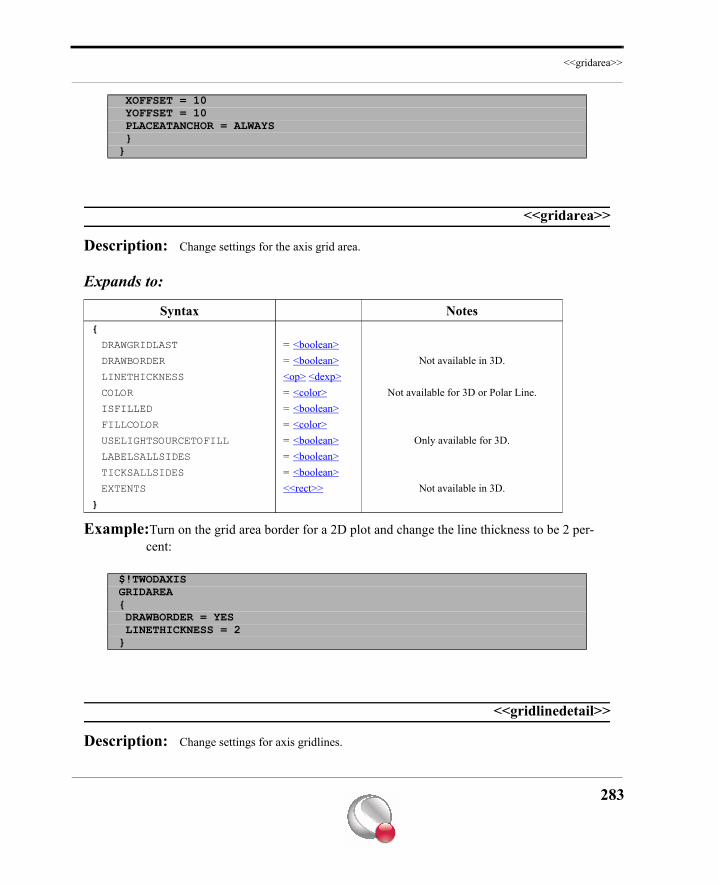
<<gridarea>>
<<gridarea>>
Description: Change settings for the axis grid area.
Expands to:
Example:Turn on the grid area border for a 2D plot and change the line thickness to be 2 per-cent:
<<gridlinedetail>>
Description: Change settings for axis gridlines.
XOFFSET = 10 YOFFSET = 10 PLACEATANCHOR = ALWAYS }}
Syntax Notes{
DRAWGRIDLAST = <boolean>DRAWBORDER = <boolean> Not available in 3D.LINETHICKNESS <op> <dexp>COLOR = <color> Not available for 3D or Polar Line.ISFILLED = <boolean>FILLCOLOR = <color>USELIGHTSOURCETOFILL = <boolean> Only available for 3D.LABELSALLSIDES = <boolean>TICKSALLSIDES = <boolean>EXTENTS <<rect>> Not available in 3D.
}
$!TWODAXISGRIDAREA{ DRAWBORDER = YES LINETHICKNESS = 2}
283
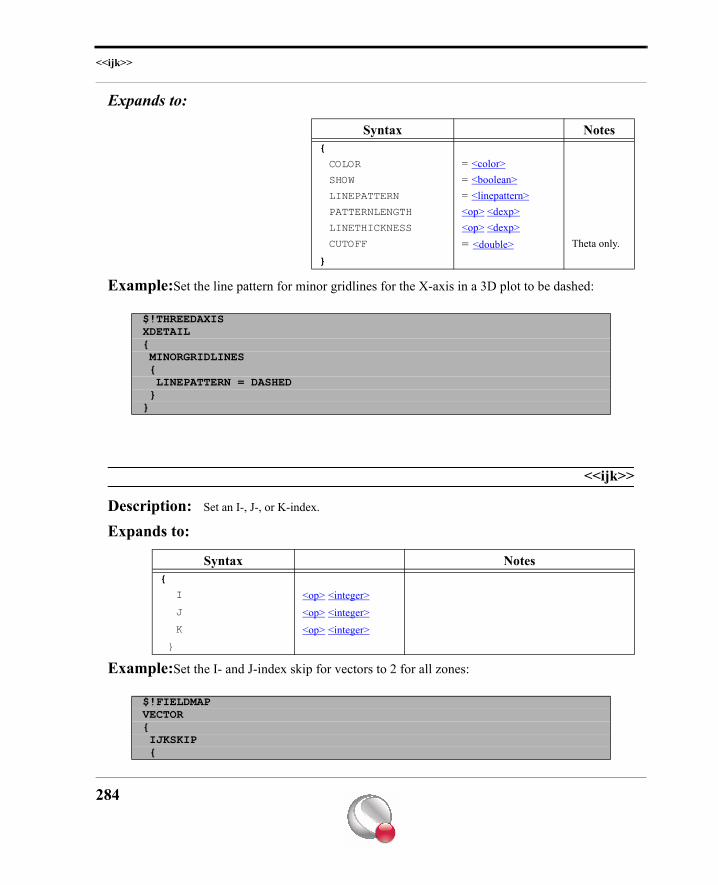
<<ijk>>
Expands to:
Example:Set the line pattern for minor gridlines for the X-axis in a 3D plot to be dashed:
<<ijk>>
Description: Set an I-, J-, or K-index.
Expands to:
Example:Set the I- and J-index skip for vectors to 2 for all zones:
Syntax Notes{
COLOR = <color>SHOW = <boolean>LINEPATTERN = <linepattern>PATTERNLENGTH <op> <dexp>LINETHICKNESS <op> <dexp>CUTOFF = <double> Theta only.
}
$!THREEDAXISXDETAIL{ MINORGRIDLINES { LINEPATTERN = DASHED }}
Syntax Notes{
I <op> <integer> J <op> <integer> K <op> <integer>}
$!FIELDMAPVECTOR{ IJKSKIP {
284
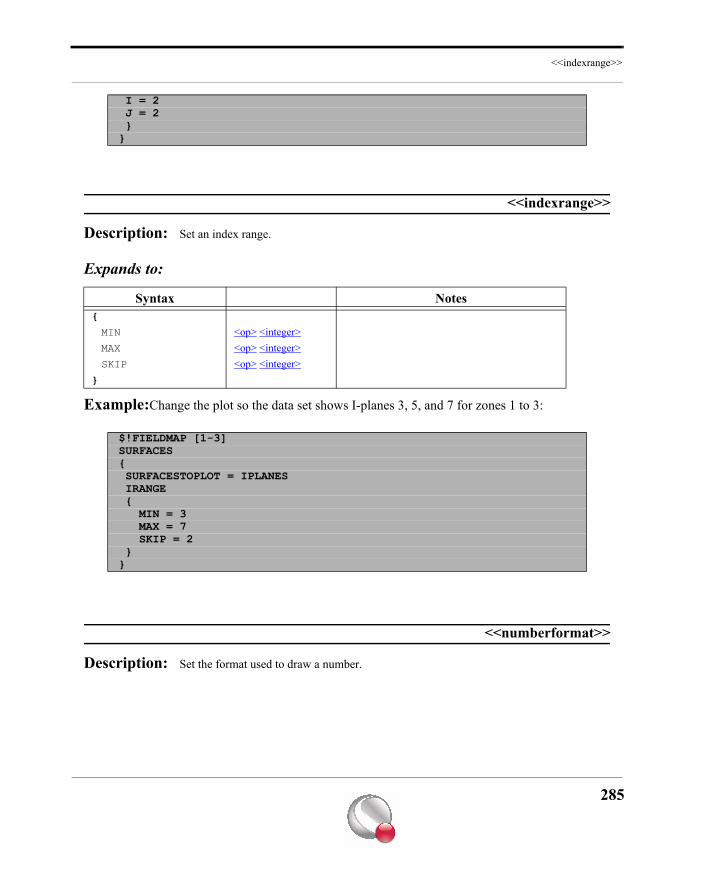
<<indexrange>>
<<indexrange>>
Description: Set an index range.
Expands to:
Example:Change the plot so the data set shows I-planes 3, 5, and 7 for zones 1 to 3:
<<numberformat>>
Description: Set the format used to draw a number.
I = 2 J = 2 }}
Syntax Notes{
MIN <op> <integer>MAX <op> <integer>SKIP <op> <integer>
}
$!FIELDMAP [1-3]SURFACES{ SURFACESTOPLOT = IPLANES IRANGE { MIN = 3 MAX = 7 SKIP = 2 }}
285
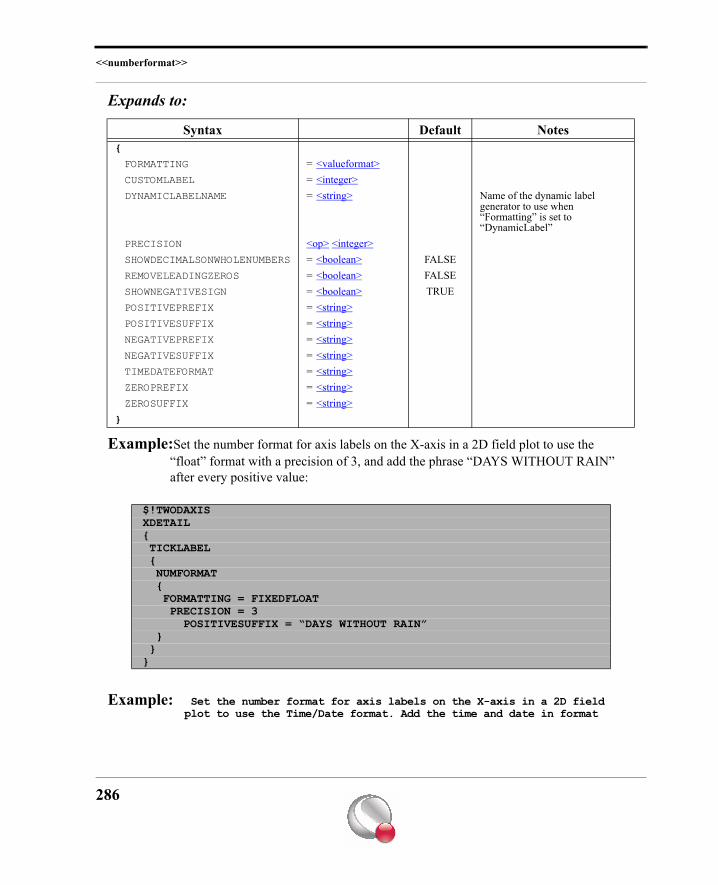
<<numberformat>>
Expands to:
Example:Set the number format for axis labels on the X-axis in a 2D field plot to use the “float” format with a precision of 3, and add the phrase “DAYS WITHOUT RAIN” after every positive value:
Example: Set the number format for axis labels on the X-axis in a 2D field plot to use the Time/Date format. Add the time and date in format
Syntax Default Notes{
FORMATTING = <valueformat>CUSTOMLABEL = <integer>DYNAMICLABELNAME = <string> Name of the dynamic label
generator to use when “Formatting” is set to “DynamicLabel”
PRECISION <op> <integer>SHOWDECIMALSONWHOLENUMBERS = <boolean> FALSEREMOVELEADINGZEROS = <boolean> FALSESHOWNEGATIVESIGN = <boolean> TRUEPOSITIVEPREFIX = <string>POSITIVESUFFIX = <string>NEGATIVEPREFIX = <string>NEGATIVESUFFIX = <string>TIMEDATEFORMAT = <string>ZEROPREFIX = <string>ZEROSUFFIX = <string>
}
$!TWODAXISXDETAIL{ TICKLABEL { NUMFORMAT { FORMATTING = FIXEDFLOAT PRECISION = 3 POSITIVESUFFIX = “DAYS WITHOUT RAIN” } }}
286
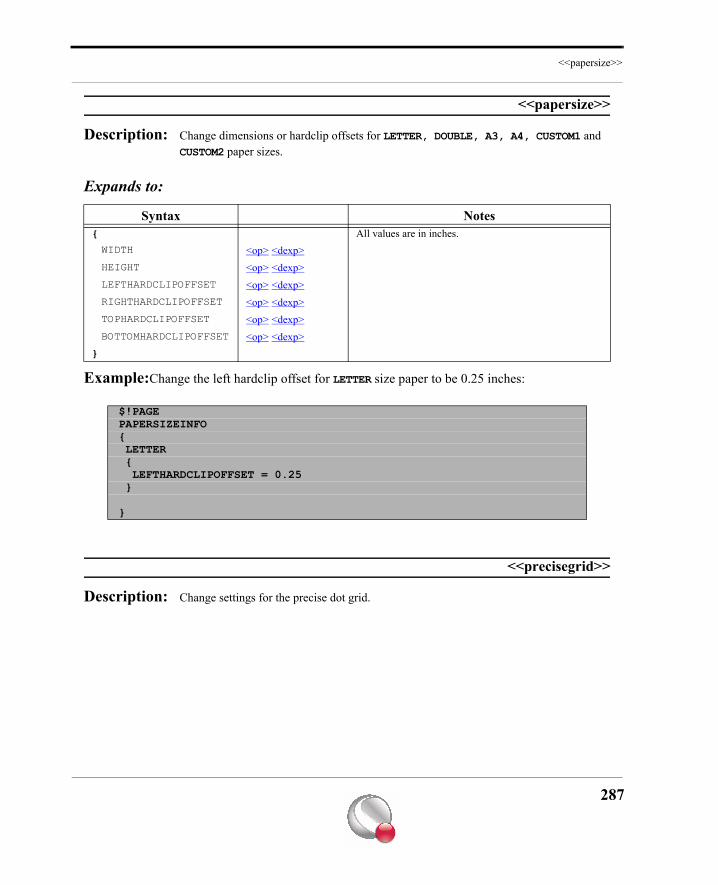
<<papersize>>
<<papersize>>
Description: Change dimensions or hardclip offsets for LETTER, DOUBLE, A3, A4, CUSTOM1 and CUSTOM2 paper sizes.
Expands to:
Example:Change the left hardclip offset for LETTER size paper to be 0.25 inches:
<<precisegrid>>
Description: Change settings for the precise dot grid.
Syntax Notes{ All values are in inches.WIDTH <op> <dexp>HEIGHT <op> <dexp>LEFTHARDCLIPOFFSET <op> <dexp>RIGHTHARDCLIPOFFSET <op> <dexp>TOPHARDCLIPOFFSET <op> <dexp>BOTTOMHARDCLIPOFFSET <op> <dexp>
}
$!PAGEPAPERSIZEINFO{ LETTER { LEFTHARDCLIPOFFSET = 0.25 }
}
287
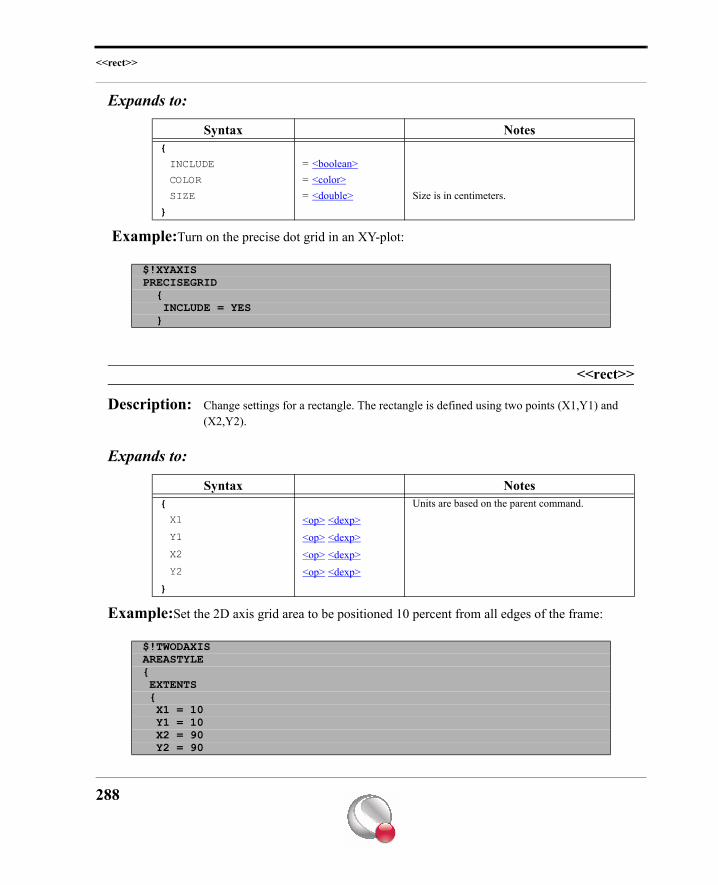
<<rect>>
Expands to:
Example:Turn on the precise dot grid in an XY-plot:
<<rect>>
Description: Change settings for a rectangle. The rectangle is defined using two points (X1,Y1) and (X2,Y2).
Expands to:
Example:Set the 2D axis grid area to be positioned 10 percent from all edges of the frame:
Syntax Notes{
INCLUDE = <boolean>COLOR = <color>SIZE = <double> Size is in centimeters.
}
$!XYAXISPRECISEGRID { INCLUDE = YES }
Syntax Notes{ Units are based on the parent command.X1 <op> <dexp>Y1 <op> <dexp>X2 <op> <dexp>Y2 <op> <dexp>
}
$!TWODAXISAREASTYLE{ EXTENTS { X1 = 10 Y1 = 10 X2 = 90 Y2 = 90
288
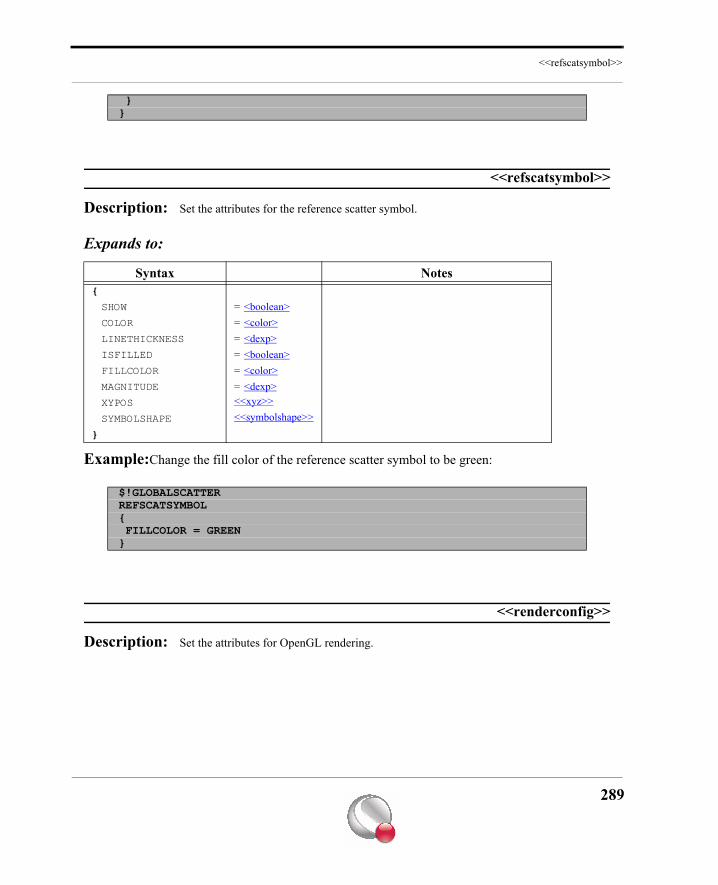
<<refscatsymbol>>
<<refscatsymbol>>
Description: Set the attributes for the reference scatter symbol.
Expands to:
Example:Change the fill color of the reference scatter symbol to be green:
<<renderconfig>>
Description: Set the attributes for OpenGL rendering.
}}
Syntax Notes{
SHOW = <boolean>COLOR = <color>LINETHICKNESS = <dexp>ISFILLED = <boolean>FILLCOLOR = <color>MAGNITUDE = <dexp>XYPOS <<xyz>>SYMBOLSHAPE <<symbolshape>>
}
$!GLOBALSCATTERREFSCATSYMBOL{ FILLCOLOR = GREEN}
289
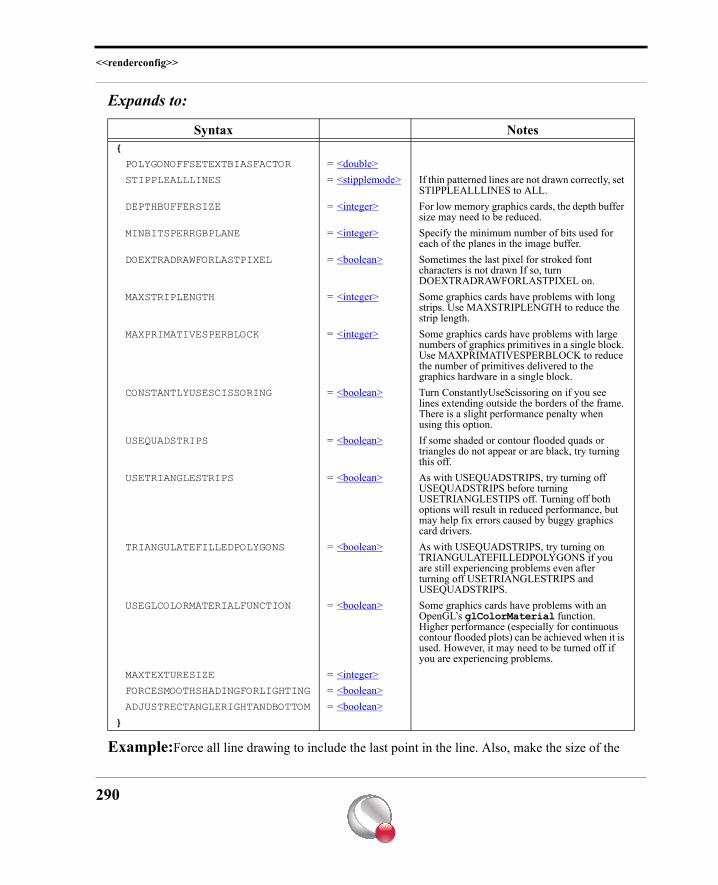
<<renderconfig>>
Expands to:
Example:Force all line drawing to include the last point in the line. Also, make the size of the
Syntax Notes{
POLYGONOFFSETEXTBIASFACTOR = <double>STIPPLEALLLINES = <stipplemode> If thin patterned lines are not drawn correctly, set
STIPPLEALLLINES to ALL.DEPTHBUFFERSIZE = <integer> For low memory graphics cards, the depth buffer
size may need to be reduced. MINBITSPERRGBPLANE = <integer> Specify the minimum number of bits used for
each of the planes in the image buffer.DOEXTRADRAWFORLASTPIXEL = <boolean> Sometimes the last pixel for stroked font
characters is not drawn If so, turn DOEXTRADRAWFORLASTPIXEL on.
MAXSTRIPLENGTH = <integer> Some graphics cards have problems with long strips. Use MAXSTRIPLENGTH to reduce the strip length.
MAXPRIMATIVESPERBLOCK = <integer> Some graphics cards have problems with large numbers of graphics primitives in a single block. Use MAXPRIMATIVESPERBLOCK to reduce the number of primitives delivered to the graphics hardware in a single block.
CONSTANTLYUSESCISSORING = <boolean> Turn ConstantlyUseScissoring on if you see lines extending outside the borders of the frame. There is a slight performance penalty when using this option.
USEQUADSTRIPS = <boolean> If some shaded or contour flooded quads or triangles do not appear or are black, try turning this off.
USETRIANGLESTRIPS = <boolean> As with USEQUADSTRIPS, try turning off USEQUADSTRIPS before turning USETRIANGLESTIPS off. Turning off both options will result in reduced performance, but may help fix errors caused by buggy graphics card drivers.
TRIANGULATEFILLEDPOLYGONS = <boolean> As with USEQUADSTRIPS, try turning on TRIANGULATEFILLEDPOLYGONS if you are still experiencing problems even after turning off USETRIANGLESTRIPS and USEQUADSTRIPS.
USEGLCOLORMATERIALFUNCTION = <boolean> Some graphics cards have problems with an OpenGL’s glColorMaterial function. Higher performance (especially for continuous contour flooded plots) can be achieved when it is used. However, it may need to be turned off if you are experiencing problems.
MAXTEXTURESIZE = <integer>FORCESMOOTHSHADINGFORLIGHTING = <boolean>ADJUSTRECTANGLERIGHTANDBOTTOM = <boolean>
}
290
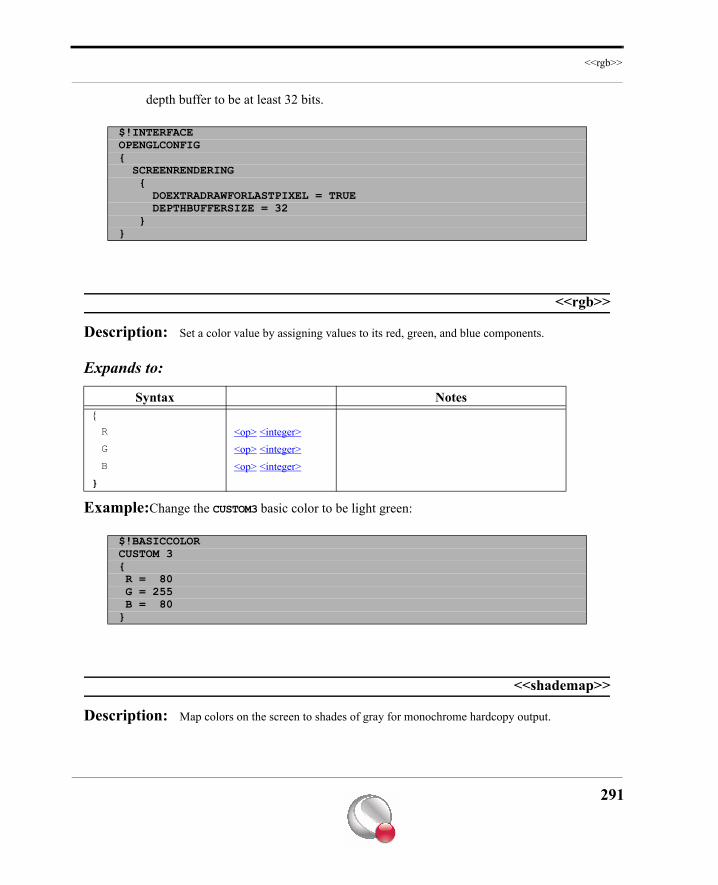
<<rgb>>
depth buffer to be at least 32 bits.
<<rgb>>
Description: Set a color value by assigning values to its red, green, and blue components.
Expands to:
Example:Change the CUSTOM3 basic color to be light green:
<<shademap>>
Description: Map colors on the screen to shades of gray for monochrome hardcopy output.
$!INTERFACEOPENGLCONFIG{ SCREENRENDERING { DOEXTRADRAWFORLASTPIXEL = TRUE DEPTHBUFFERSIZE = 32 }}
Syntax Notes{R <op> <integer>G <op> <integer>B <op> <integer>
}
$!BASICCOLORCUSTOM 3{ R = 80 G = 255 B = 80}
291
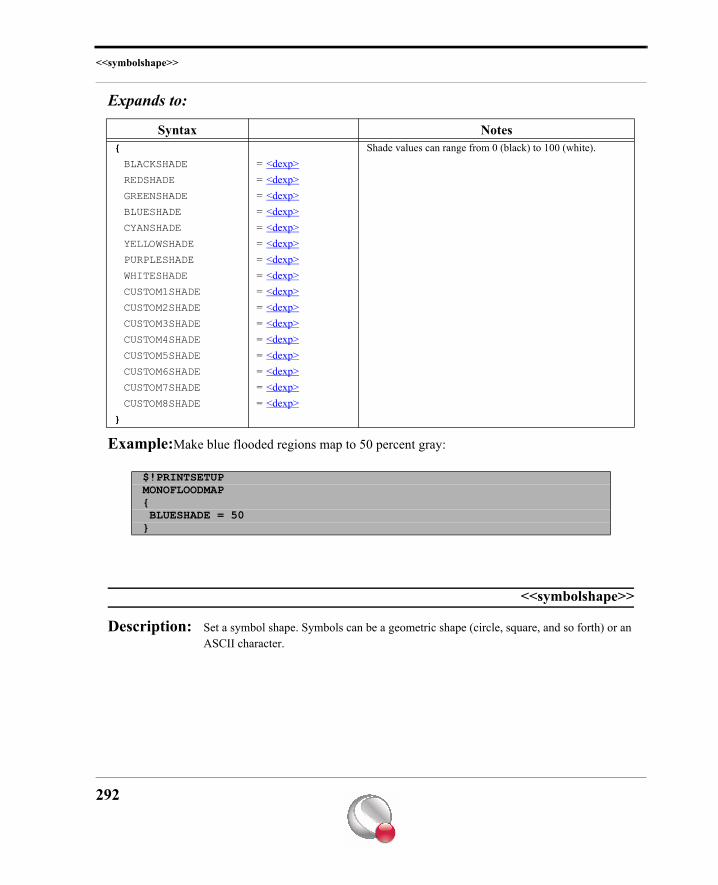
<<symbolshape>>
Expands to:
Example:Make blue flooded regions map to 50 percent gray:
<<symbolshape>>
Description: Set a symbol shape. Symbols can be a geometric shape (circle, square, and so forth) or an ASCII character.
Syntax Notes{ Shade values can range from 0 (black) to 100 (white).BLACKSHADE = <dexp>REDSHADE = <dexp>GREENSHADE = <dexp>BLUESHADE = <dexp>CYANSHADE = <dexp>YELLOWSHADE = <dexp>PURPLESHADE = <dexp>WHITESHADE = <dexp>CUSTOM1SHADE = <dexp>CUSTOM2SHADE = <dexp>CUSTOM3SHADE = <dexp>CUSTOM4SHADE = <dexp>CUSTOM5SHADE = <dexp>CUSTOM6SHADE = <dexp>CUSTOM7SHADE = <dexp>CUSTOM8SHADE = <dexp>
}
$!PRINTSETUPMONOFLOODMAP{ BLUESHADE = 50}
292
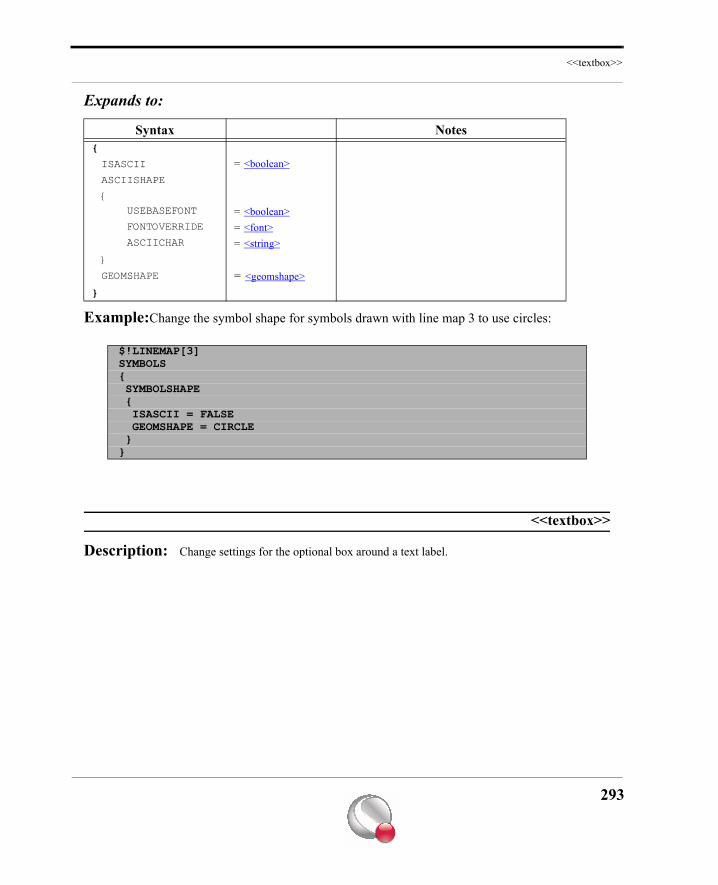
<<textbox>>
Expands to:
Example:Change the symbol shape for symbols drawn with line map 3 to use circles:
<<textbox>>
Description: Change settings for the optional box around a text label.
Syntax Notes{
ISASCII = <boolean>ASCIISHAPE
{ USEBASEFONT = <boolean> FONTOVERRIDE = <font> ASCIICHAR = <string>}
GEOMSHAPE = <geomshape>}
$!LINEMAP[3]SYMBOLS{ SYMBOLSHAPE { ISASCII = FALSE GEOMSHAPE = CIRCLE }}
293
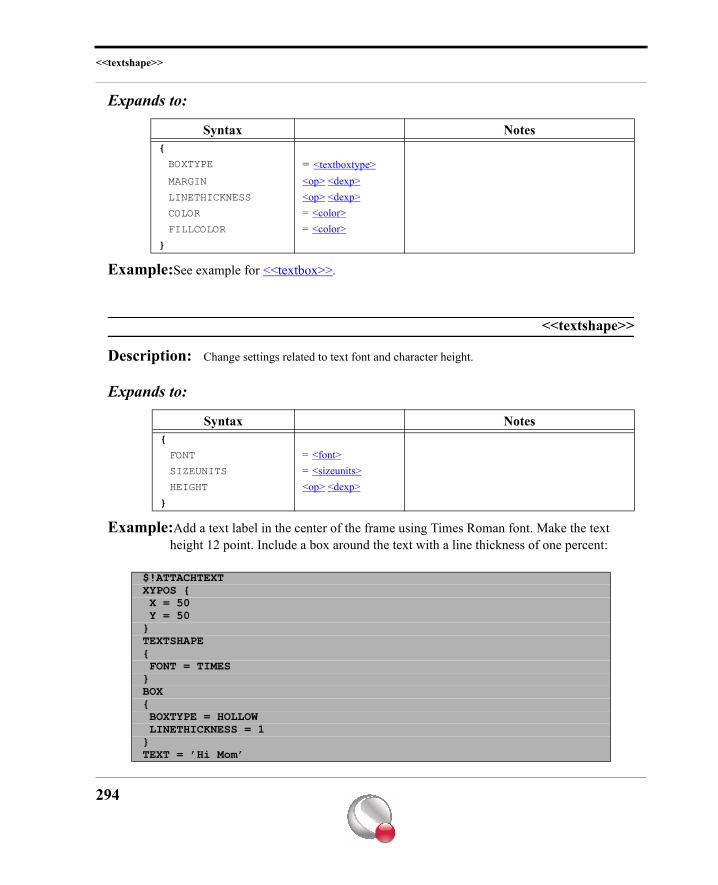
<<textshape>>
Expands to:
Example:See example for <<textbox>>.
<<textshape>>
Description: Change settings related to text font and character height.
Expands to:
Example:Add a text label in the center of the frame using Times Roman font. Make the text height 12 point. Include a box around the text with a line thickness of one percent:
Syntax Notes{
BOXTYPE = <textboxtype>MARGIN <op> <dexp>LINETHICKNESS <op> <dexp>COLOR = <color>FILLCOLOR = <color>
}
Syntax Notes{
FONT = <font>SIZEUNITS = <sizeunits>HEIGHT <op> <dexp>
}
$!ATTACHTEXTXYPOS { X = 50 Y = 50}TEXTSHAPE{ FONT = TIMES}BOX{ BOXTYPE = HOLLOW LINETHICKNESS = 1}TEXT = ’Hi Mom’
294
<<ticklabeldetail>>
<<ticklabeldetail>>
Description: Change settings for the text used to label axis tick marks.
Expands to:
Example:Change the color for X-axis tick mark labels in a 2D plot to be red:
<<tickmarkdetail>>
Description: Assign attributes for axis tick marks.
Syntax Default Notes{
SHOWONAXISLINE = <boolean> TRUESHOWONGRIDBORDERMIN = <boolean> FALSE Non-3D only.SHOWONGRIDBORDERMAX = <boolean> FALSE Non-3D only. SHOWONOPPOSITEEDGE = <boolean> FALSE 3D only. SHOWONALLAXES = <boolean> TRUE Polar R only. SHOWATAXISINTERSECTION = <boolean>SKIP = <integer>ERASEBEHINDLABELS = <boolean>NUMFORMAT <<numberformat>>TEXTSHAPE <<textshape>> Not allowed to change size units
parameter.OFFSET <op> <dexp>LABELALIGNMENT = <labelalignment>ANGLE <op> <dexp>COLOR = <color>
}
$!TWODAXISXDETAIL{ TICKLABEL { COLOR = RED }}
295
<<volumeobjectstoplot>>
Expands to:
Example:Set the tick mark length to 2 percent for the second Y-axis in an XY-plot:
<<volumeobjectstoplot>>
Description: Specifies what volume objects are to be displayed.
Syntax Default Notes{
SHOWONAXISLINE = <boolean> TRUE SHOWONGRIDBORDERMIN = <boolean> FALSE Non-3D only. SHOWONGRIDBORDERMAX = <boolean> FALSE Non-3D only. SHOWONOPPOSITEEDGE = <boolean> FALSE 3D only. SHOWONALLAXES = <boolean> TRUE Polar R only. TICKDIRECTION = <tickdirection>LENGTH <op> <dexp>LINETHICKNESS <op> <dexp>NUMMINORTICKS = <integer>MINORLENGTH = <double>MINORLINETHICKNESS = <double>
}
$!XYLINEAXISYDETAIL 2{ TICKS { LENGTH = 2 SHOWONGRIDBORDERMIN = TRUE }}
296
<<xy>>
Expands to:
Example:
<<xy>>
Description: Change settings for an (X,Y) position.
Expands to:
Example:See the XYPOS parameter in the example for <<textshape>>.
<<xyz>>
Description: Change settings for an (X, Y, Z) triplet.
Syntax Notes{
SHOWISOSURFACES = <boolean>SHOWSLICES = <boolean>SHOWSTREAMTRACES = <boolean>}
$!FIELDVOLUMEMODE { VOLUMEOBJECTSTOPLOT { SHOWISOSURFACES = NO SHOWSLICES = YES SHOWSTREAMTRACES = YES } }
Syntax Notes{
X <op> <dexp>Y <op> <dexp>
}
297
<<zebrashade>>
Expands to:
Example:Change the scale factor on the Z-axis to be 0.5:
<<zebrashade>>
Description: Change zebra shading attributes.
Expands to:
Example:Turn on zebra shading and make the zebra shade color to be black:
Syntax Notes{
X <op> <dexp>Y <op> <dexp>Z <op> <dexp>
}
$!GLOBALTHREEDAXISSCALEFACT{ Z = 0.5}
Syntax Notes{INCLUDE = <boolean>ISTRANSPARENT = <boolean> COLOR = <color>
}
$!GLOBALCONTOURCOLORMAPFILTER{ ZEBRA { INCLUDE = TRUE COLOR = BLACK }}
298
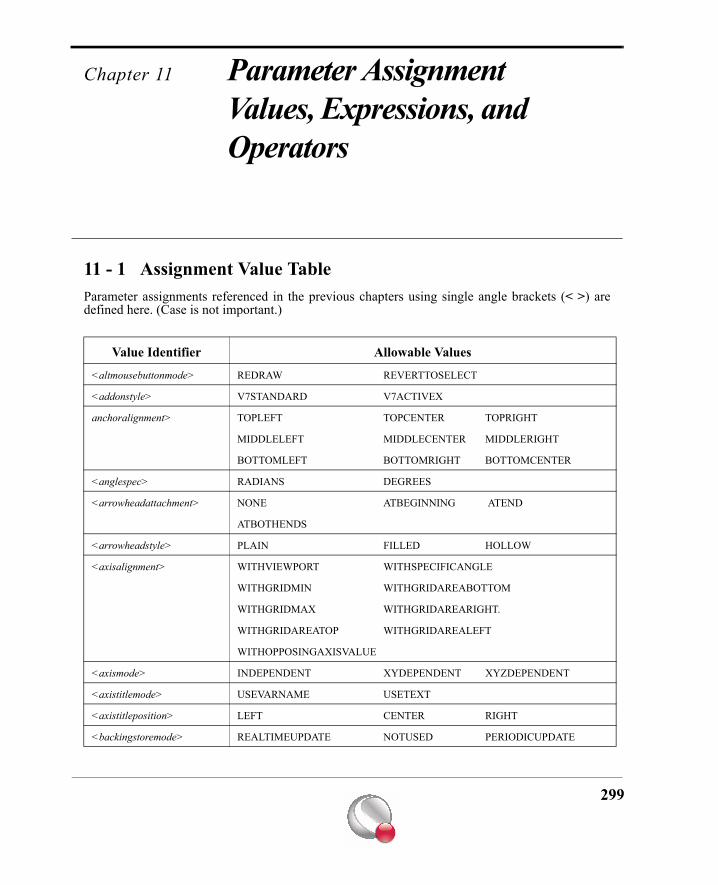
Chapter 11 Parameter Assignment Values, Expressions, and Operators
11 - 1 Assignment Value TableParameter assignments referenced in the previous chapters using single angle brackets (< >) aredefined here. (Case is not important.)
Value Identifier Allowable Values
<altmousebuttonmode> REDRAW REVERTTOSELECT
<addonstyle> V7STANDARD V7ACTIVEX
anchoralignment> TOPLEFT TOPCENTER TOPRIGHT
MIDDLELEFT MIDDLECENTER MIDDLERIGHT
BOTTOMLEFT BOTTOMRIGHT BOTTOMCENTER
<anglespec> RADIANS DEGREES
<arrowheadattachment> NONE ATBEGINNING ATEND
ATBOTHENDS
<arrowheadstyle> PLAIN FILLED HOLLOW
<axisalignment> WITHVIEWPORT WITHSPECIFICANGLE
WITHGRIDMIN WITHGRIDAREABOTTOM
WITHGRIDMAX WITHGRIDAREARIGHT.
WITHGRIDAREATOP WITHGRIDAREALEFT
WITHOPPOSINGAXISVALUE
<axismode> INDEPENDENT XYDEPENDENT XYZDEPENDENT
<axistitlemode> USEVARNAME USETEXT
<axistitleposition> LEFT CENTER RIGHT
<backingstoremode> REALTIMEUPDATE NOTUSED PERIODICUPDATE
299
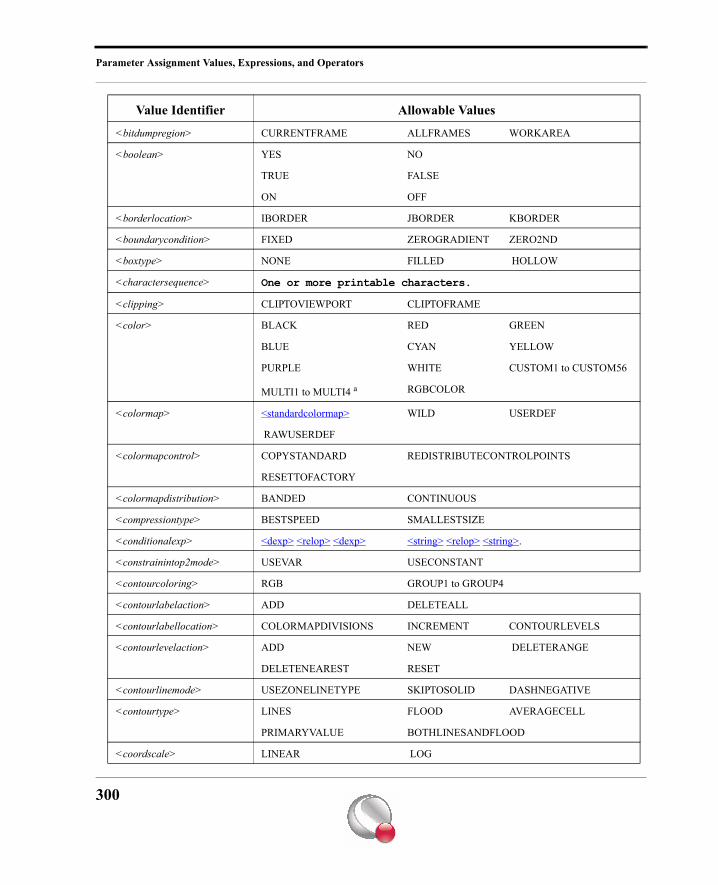
Parameter Assignment Values, Expressions, and Operators
<bitdumpregion> CURRENTFRAME ALLFRAMES WORKAREA
<boolean> YES NO
TRUE FALSE
ON OFF
<borderlocation> IBORDER JBORDER KBORDER
<boundarycondition> FIXED ZEROGRADIENT ZERO2ND
<boxtype> NONE FILLED HOLLOW
<charactersequence> One or more printable characters.
<clipping> CLIPTOVIEWPORT CLIPTOFRAME
<color> BLACK RED GREEN
BLUE CYAN YELLOW
PURPLE WHITE CUSTOM1 to CUSTOM56
MULTI1 to MULTI4 a RGBCOLOR
<colormap> <standardcolormap> WILD USERDEF
RAWUSERDEF
<colormapcontrol> COPYSTANDARD REDISTRIBUTECONTROLPOINTS
RESETTOFACTORY
<colormapdistribution> BANDED CONTINUOUS
<compressiontype> BESTSPEED SMALLESTSIZE
<conditionalexp> <dexp> <relop> <dexp> <string> <relop> <string>.
<constrainintop2mode> USEVAR USECONSTANT
<contourcoloring> RGB GROUP1 to GROUP4
<contourlabelaction> ADD DELETEALL
<contourlabellocation> COLORMAPDIVISIONS INCREMENT CONTOURLEVELS
<contourlevelaction> ADD NEW DELETERANGE
DELETENEAREST RESET
<contourlinemode> USEZONELINETYPE SKIPTOSOLID DASHNEGATIVE
<contourtype> LINES FLOOD AVERAGECELL
PRIMARYVALUE BOTHLINESANDFLOOD
<coordscale> LINEAR LOG
Value Identifier Allowable Values
300
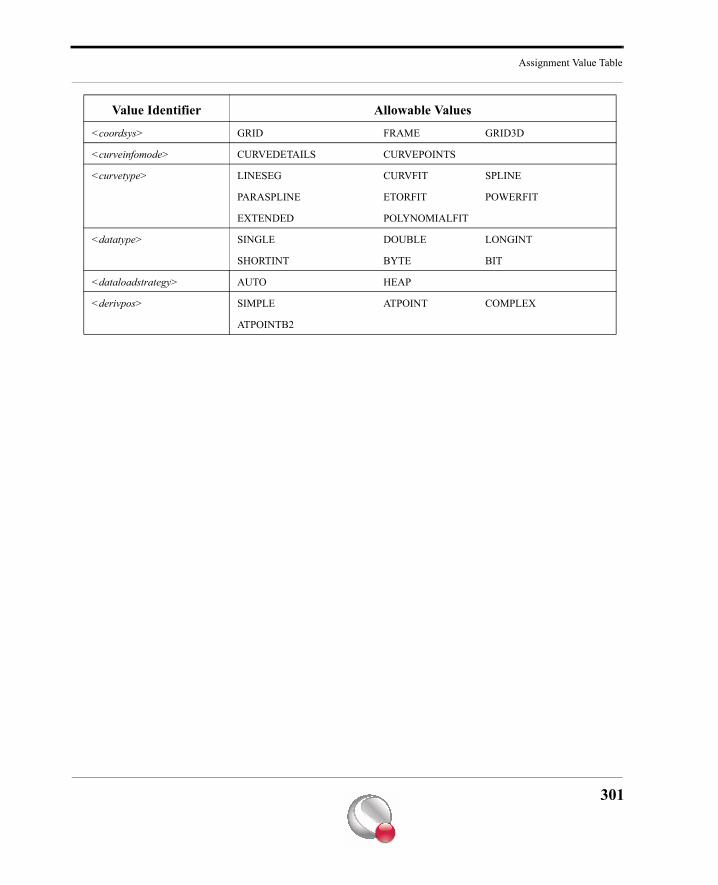
Assignment Value Table
<coordsys> GRID FRAME GRID3D
<curveinfomode> CURVEDETAILS CURVEPOINTS
<curvetype> LINESEG CURVFIT SPLINE
PARASPLINE ETORFIT POWERFIT
EXTENDED POLYNOMIALFIT
<datatype> SINGLE DOUBLE LONGINT
SHORTINT BYTE BIT
<dataloadstrategy> AUTO HEAP
<derivpos> SIMPLE ATPOINT COMPLEX
ATPOINTB2
Value Identifier Allowable Values
301
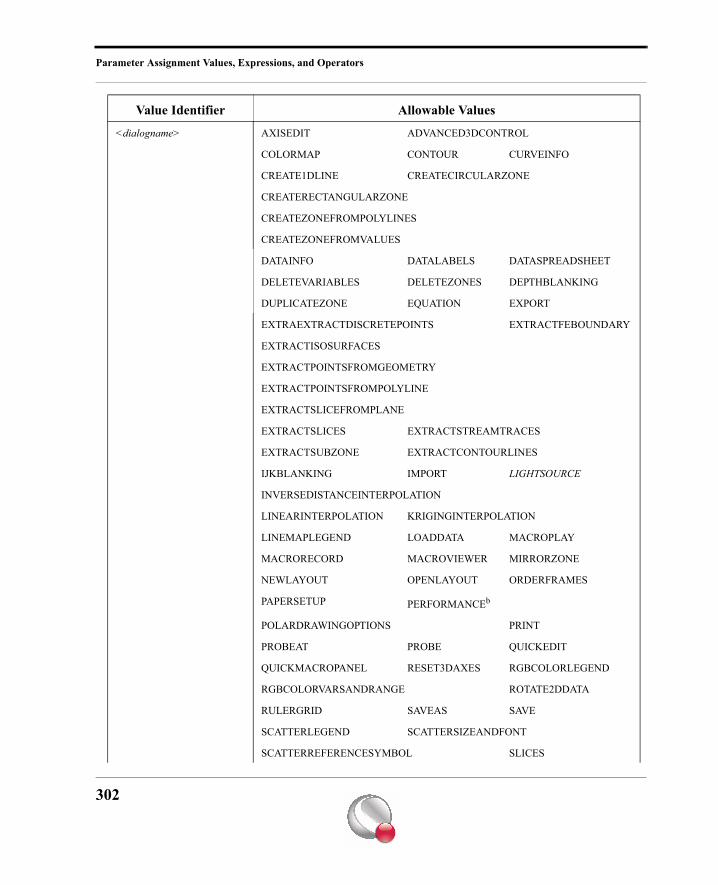
Parameter Assignment Values, Expressions, and Operators
<dialogname> AXISEDIT ADVANCED3DCONTROL
COLORMAP CONTOUR CURVEINFO
CREATE1DLINE CREATECIRCULARZONE
CREATERECTANGULARZONE
CREATEZONEFROMPOLYLINES
CREATEZONEFROMVALUES
DATAINFO DATALABELS DATASPREADSHEET
DELETEVARIABLES DELETEZONES DEPTHBLANKING
DUPLICATEZONE EQUATION EXPORT
EXTRAEXTRACTDISCRETEPOINTS EXTRACTFEBOUNDARY
EXTRACTISOSURFACES
EXTRACTPOINTSFROMGEOMETRY
EXTRACTPOINTSFROMPOLYLINE
EXTRACTSLICEFROMPLANE
EXTRACTSLICES EXTRACTSTREAMTRACES
EXTRACTSUBZONE EXTRACTCONTOURLINES
IJKBLANKING IMPORT LIGHTSOURCE
INVERSEDISTANCEINTERPOLATION
LINEARINTERPOLATION KRIGINGINTERPOLATION
LINEMAPLEGEND LOADDATA MACROPLAY
MACRORECORD MACROVIEWER MIRRORZONE
NEWLAYOUT OPENLAYOUT ORDERFRAMES
PAPERSETUP PERFORMANCEb
POLARDRAWINGOPTIONS PRINT
PROBEAT PROBE QUICKEDIT
QUICKMACROPANEL RESET3DAXES RGBCOLORLEGEND
RGBCOLORVARSANDRANGE ROTATE2DDATA
RULERGRID SAVEAS SAVE
SCATTERLEGEND SCATTERSIZEANDFONT
SCATTERREFERENCESYMBOL SLICES
Value Identifier Allowable Values
302
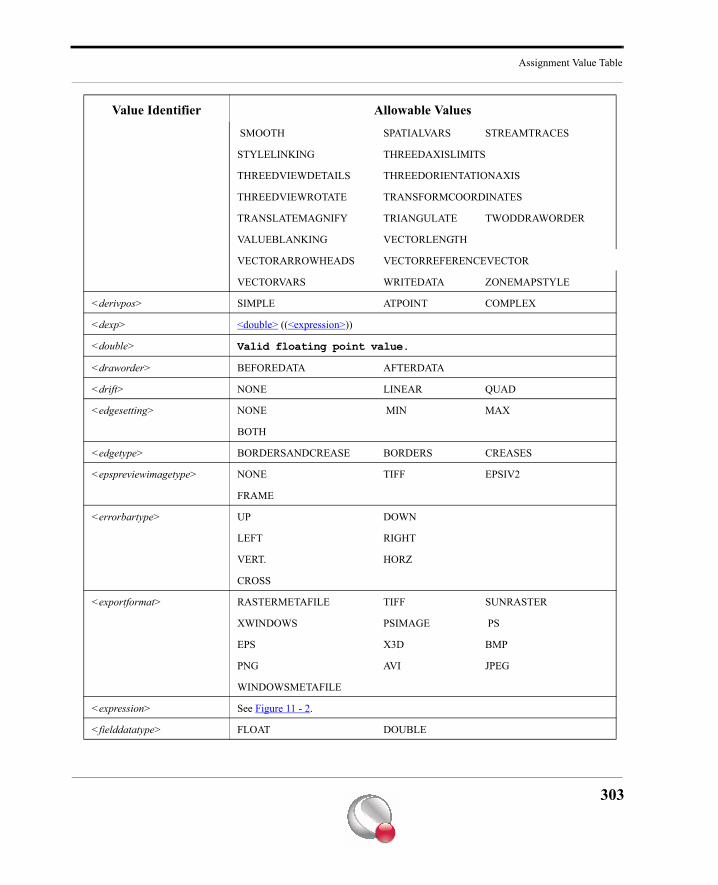
Assignment Value Table
SMOOTH SPATIALVARS STREAMTRACES
STYLELINKING THREEDAXISLIMITS
THREEDVIEWDETAILS THREEDORIENTATIONAXIS
THREEDVIEWROTATE TRANSFORMCOORDINATES
TRANSLATEMAGNIFY TRIANGULATE TWODDRAWORDER
VALUEBLANKING VECTORLENGTH
VECTORARROWHEADS VECTORREFERENCEVECTOR
VECTORVARS WRITEDATA ZONEMAPSTYLE
<derivpos> SIMPLE ATPOINT COMPLEX
<dexp> <double> ((<expression>))
<double> Valid floating point value.
<draworder> BEFOREDATA AFTERDATA
<drift> NONE LINEAR QUAD
<edgesetting> NONE MIN MAX
BOTH
<edgetype> BORDERSANDCREASE BORDERS CREASES
<epspreviewimagetype> NONE TIFF EPSIV2
FRAME
<errorbartype> UP DOWN
LEFT RIGHT
VERT. HORZ
CROSS
<exportformat> RASTERMETAFILE TIFF SUNRASTER
XWINDOWS PSIMAGE PS
EPS X3D BMP
PNG AVI JPEG
WINDOWSMETAFILE
<expression> See Figure 11 - 2.
<fielddatatype> FLOAT DOUBLE
Value Identifier Allowable Values
303
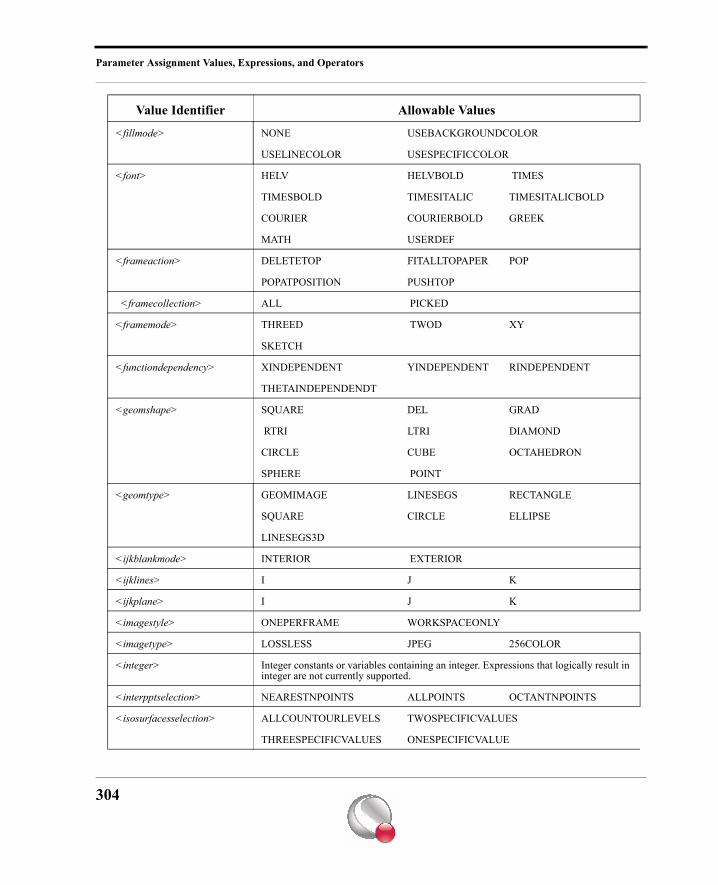
Parameter Assignment Values, Expressions, and Operators
<fillmode> NONE USEBACKGROUNDCOLOR
USELINECOLOR USESPECIFICCOLOR
<font> HELV HELVBOLD TIMES
TIMESBOLD TIMESITALIC TIMESITALICBOLD
COURIER COURIERBOLD GREEK
MATH USERDEF
<frameaction> DELETETOP FITALLTOPAPER POP
POPATPOSITION PUSHTOP
<framecollection> ALL PICKED
<framemode> THREED TWOD XY
SKETCH
<functiondependency> XINDEPENDENT YINDEPENDENT RINDEPENDENT
THETAINDEPENDENDT
<geomshape> SQUARE DEL GRAD
RTRI LTRI DIAMOND
CIRCLE CUBE OCTAHEDRON
SPHERE POINT
<geomtype> GEOMIMAGE LINESEGS RECTANGLE
SQUARE CIRCLE ELLIPSE
LINESEGS3D
<ijkblankmode> INTERIOR EXTERIOR
<ijklines> I J K
<ijkplane> I J K
<imagestyle> ONEPERFRAME WORKSPACEONLY
<imagetype> LOSSLESS JPEG 256COLOR
<integer> Integer constants or variables containing an integer. Expressions that logically result in integer are not currently supported.
<interpptselection> NEARESTNPOINTS ALLPOINTS OCTANTNPOINTS
<isosurfacesselection> ALLCOUNTOURLEVELS TWOSPECIFICVALUES
THREESPECIFICVALUES ONESPECIFICVALUE
Value Identifier Allowable Values
304
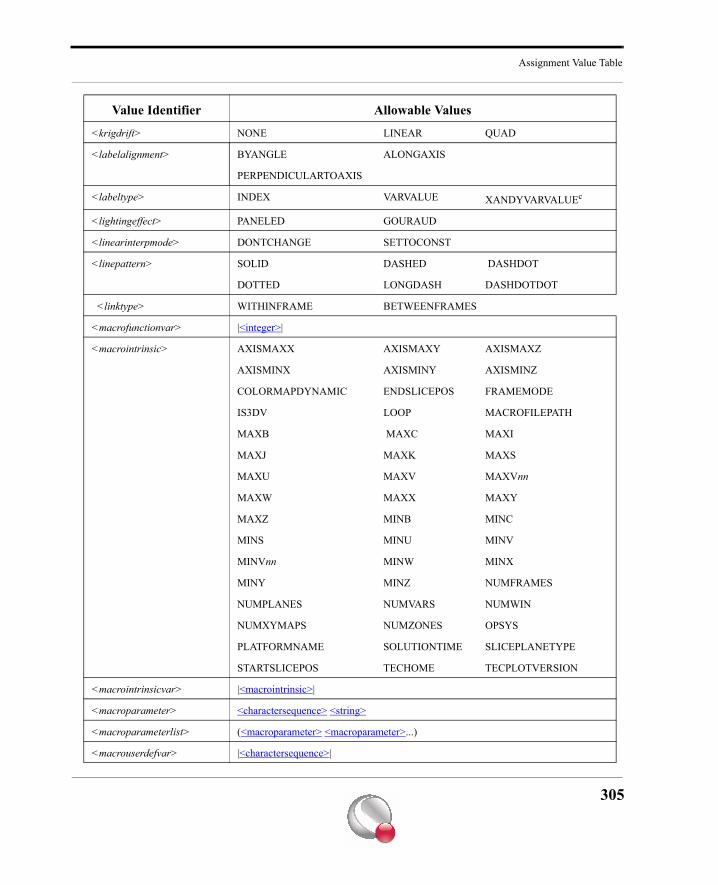
Assignment Value Table
<krigdrift> NONE LINEAR QUAD
<labelalignment> BYANGLE ALONGAXIS
PERPENDICULARTOAXIS
<labeltype> INDEX VARVALUE XANDYVARVALUEc
<lightingeffect> PANELED GOURAUD
<linearinterpmode> DONTCHANGE SETTOCONST
<linepattern> SOLID DASHED DASHDOT
DOTTED LONGDASH DASHDOTDOT
<linktype> WITHINFRAME BETWEENFRAMES
<macrofunctionvar> |<integer>|
<macrointrinsic> AXISMAXX AXISMAXY AXISMAXZ
AXISMINX AXISMINY AXISMINZ
COLORMAPDYNAMIC ENDSLICEPOS FRAMEMODE
IS3DV LOOP MACROFILEPATH
MAXB MAXC MAXI
MAXJ MAXK MAXS
MAXU MAXV MAXVnn
MAXW MAXX MAXY
MAXZ MINB MINC
MINS MINU MINV
MINVnn MINW MINX
MINY MINZ NUMFRAMES
NUMPLANES NUMVARS NUMWIN
NUMXYMAPS NUMZONES OPSYS
PLATFORMNAME SOLUTIONTIME SLICEPLANETYPE
STARTSLICEPOS TECHOME TECPLOTVERSION
<macrointrinsicvar> |<macrointrinsic>|
<macroparameter> <charactersequence> <string>
<macroparameterlist> (<macroparameter> <macroparameter>...)
<macrouserdefvar> |<charactersequence>|
Value Identifier Allowable Values
305
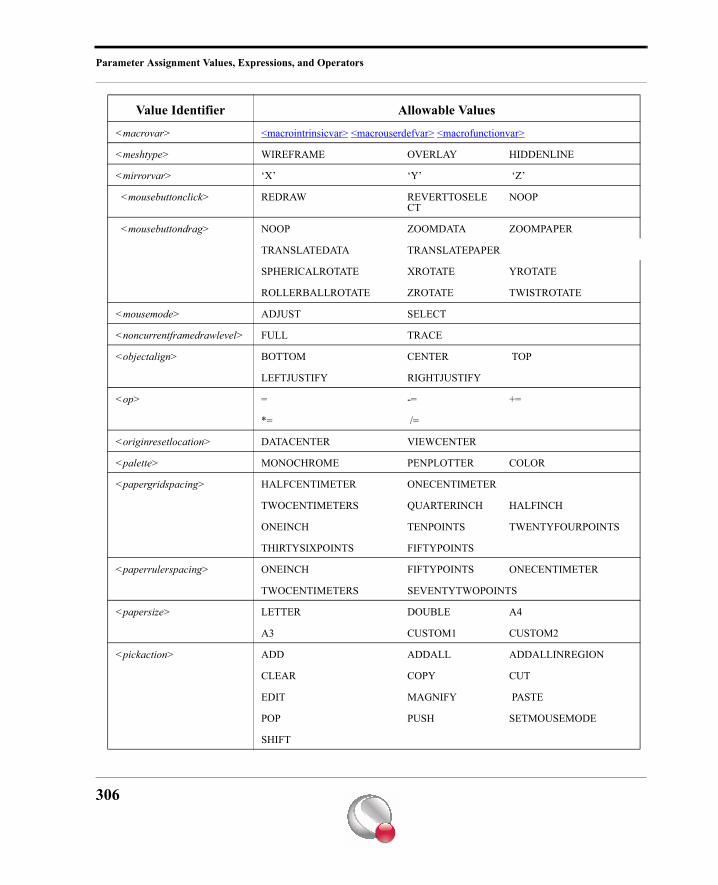
Parameter Assignment Values, Expressions, and Operators
<macrovar> <macrointrinsicvar> <macrouserdefvar> <macrofunctionvar>
<meshtype> WIREFRAME OVERLAY HIDDENLINE
<mirrorvar> ‘X’ ‘Y’ ‘Z’
<mousebuttonclick> REDRAW REVERTTOSELECT
NOOP
<mousebuttondrag> NOOP ZOOMDATA ZOOMPAPER
TRANSLATEDATA TRANSLATEPAPER
SPHERICALROTATE XROTATE YROTATE
ROLLERBALLROTATE ZROTATE TWISTROTATE
<mousemode> ADJUST SELECT
<noncurrentframedrawlevel> FULL TRACE
<objectalign> BOTTOM CENTER TOP
LEFTJUSTIFY RIGHTJUSTIFY
<op> = -= +=
*= /=
<originresetlocation> DATACENTER VIEWCENTER
<palette> MONOCHROME PENPLOTTER COLOR
<papergridspacing> HALFCENTIMETER ONECENTIMETER
TWOCENTIMETERS QUARTERINCH HALFINCH
ONEINCH TENPOINTS TWENTYFOURPOINTS
THIRTYSIXPOINTS FIFTYPOINTS
<paperrulerspacing> ONEINCH FIFTYPOINTS ONECENTIMETER
TWOCENTIMETERS SEVENTYTWOPOINTS
<papersize> LETTER DOUBLE A4
A3 CUSTOM1 CUSTOM2
<pickaction> ADD ADDALL ADDALLINREGION
CLEAR COPY CUT
EDIT MAGNIFY PASTE
POP PUSH SETMOUSEMODE
SHIFT
Value Identifier Allowable Values
306
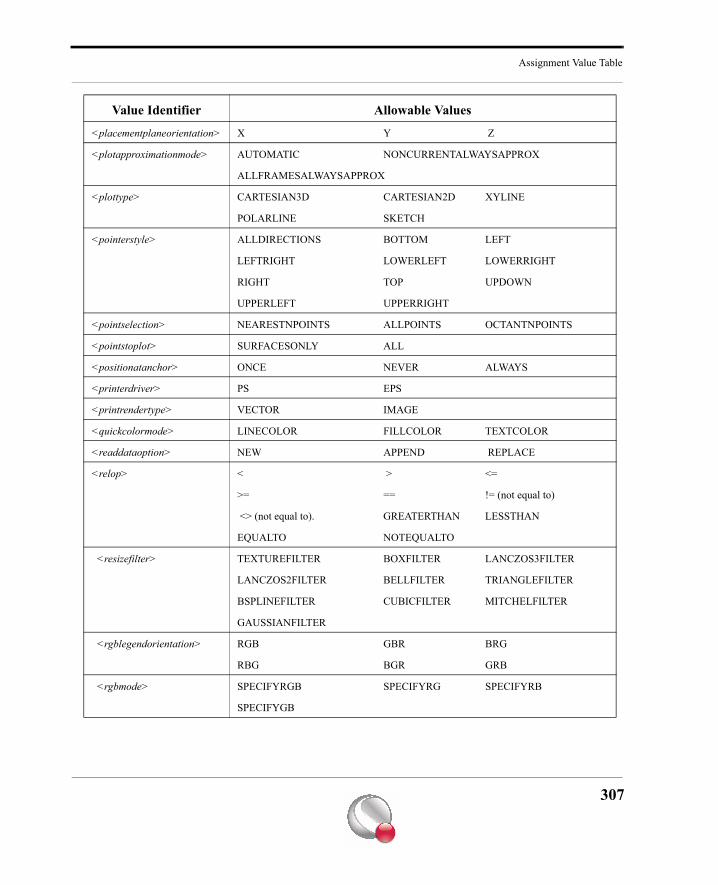
Assignment Value Table
<placementplaneorientation> X Y Z
<plotapproximationmode> AUTOMATIC NONCURRENTALWAYSAPPROX
ALLFRAMESALWAYSAPPROX
<plottype> CARTESIAN3D CARTESIAN2D XYLINE
POLARLINE SKETCH
<pointerstyle> ALLDIRECTIONS BOTTOM LEFT
LEFTRIGHT LOWERLEFT LOWERRIGHT
RIGHT TOP UPDOWN
UPPERLEFT UPPERRIGHT
<pointselection> NEARESTNPOINTS ALLPOINTS OCTANTNPOINTS
<pointstoplot> SURFACESONLY ALL
<positionatanchor> ONCE NEVER ALWAYS
<printerdriver> PS EPS
<printrendertype> VECTOR IMAGE
<quickcolormode> LINECOLOR FILLCOLOR TEXTCOLOR
<readdataoption> NEW APPEND REPLACE
<relop> < > <=
>= == != (not equal to)
<> (not equal to). GREATERTHAN LESSTHAN
EQUALTO NOTEQUALTO
<resizefilter> TEXTUREFILTER BOXFILTER LANCZOS3FILTER
LANCZOS2FILTER BELLFILTER TRIANGLEFILTER
BSPLINEFILTER CUBICFILTER MITCHELFILTER
GAUSSIANFILTER
<rgblegendorientation> RGB GBR BRG
RBG BGR GRB
<rgbmode> SPECIFYRGB SPECIFYRG SPECIFYRB
SPECIFYGB
Value Identifier Allowable Values
307
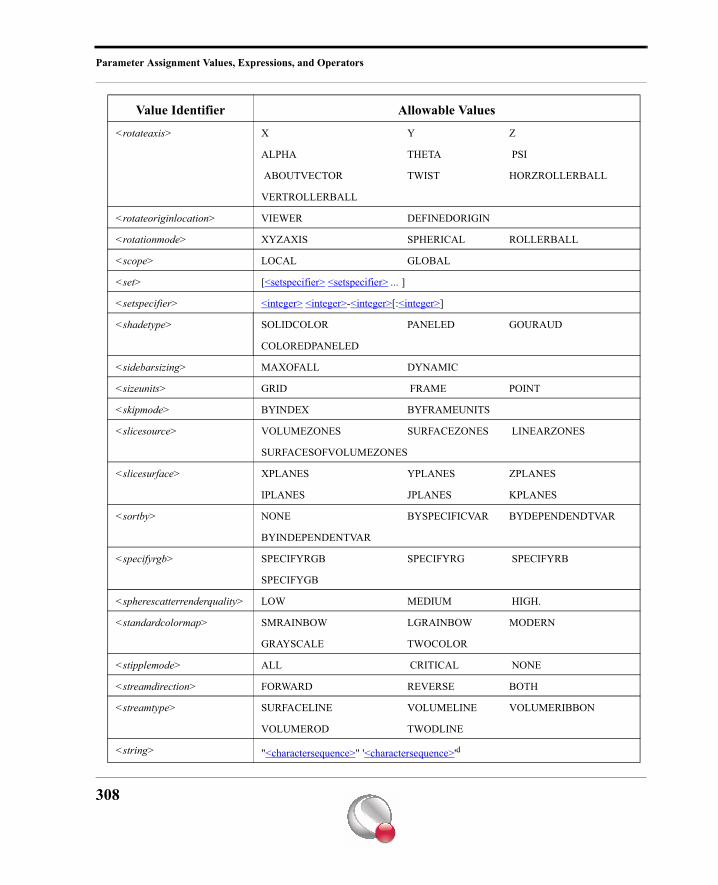
Parameter Assignment Values, Expressions, and Operators
<rotateaxis> X Y Z
ALPHA THETA PSI
ABOUTVECTOR TWIST HORZROLLERBALL
VERTROLLERBALL
<rotateoriginlocation> VIEWER DEFINEDORIGIN
<rotationmode> XYZAXIS SPHERICAL ROLLERBALL
<scope> LOCAL GLOBAL
<set> [<setspecifier> <setspecifier> ... ]
<setspecifier> <integer> <integer>-<integer>[:<integer>]
<shadetype> SOLIDCOLOR PANELED GOURAUD
COLOREDPANELED
<sidebarsizing> MAXOFALL DYNAMIC
<sizeunits> GRID FRAME POINT
<skipmode> BYINDEX BYFRAMEUNITS
<slicesource> VOLUMEZONES SURFACEZONES LINEARZONES
SURFACESOFVOLUMEZONES
<slicesurface> XPLANES YPLANES ZPLANES
IPLANES JPLANES KPLANES
<sortby> NONE BYSPECIFICVAR BYDEPENDENDTVAR
BYINDEPENDENTVAR
<specifyrgb> SPECIFYRGB SPECIFYRG SPECIFYRB
SPECIFYGB
<spherescatterrenderquality> LOW MEDIUM HIGH.
<standardcolormap> SMRAINBOW LGRAINBOW MODERN
GRAYSCALE TWOCOLOR
<stipplemode> ALL CRITICAL NONE
<streamdirection> FORWARD REVERSE BOTH
<streamtype> SURFACELINE VOLUMELINE VOLUMERIBBON
VOLUMEROD TWODLINE
<string> "<charactersequence>" '<charactersequence>'d
Value Identifier Allowable Values
308
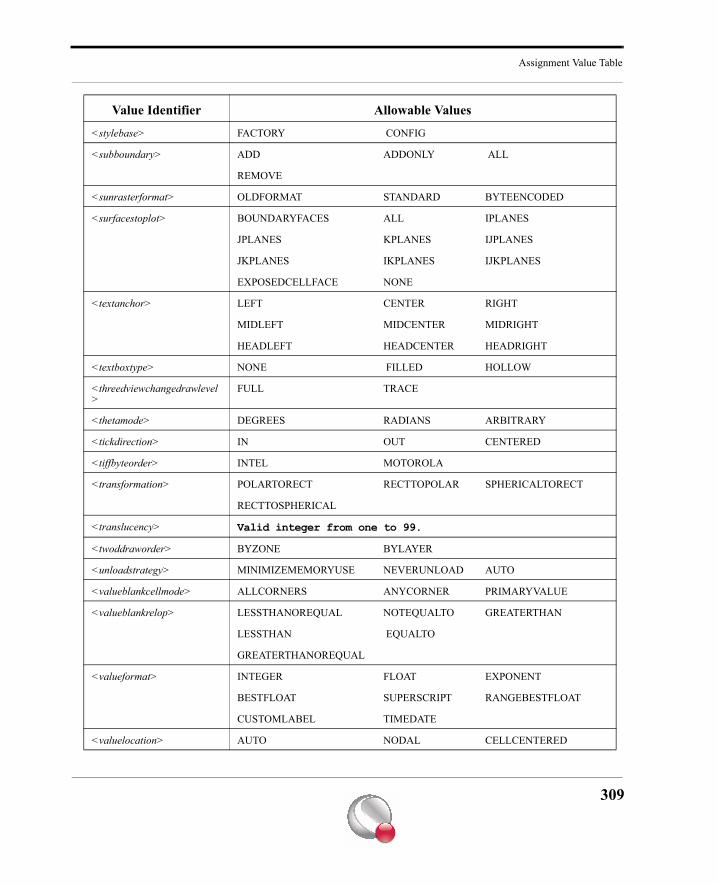
Assignment Value Table
<stylebase> FACTORY CONFIG
<subboundary> ADD ADDONLY ALL
REMOVE
<sunrasterformat> OLDFORMAT STANDARD BYTEENCODED
<surfacestoplot> BOUNDARYFACES ALL IPLANES
JPLANES KPLANES IJPLANES
JKPLANES IKPLANES IJKPLANES
EXPOSEDCELLFACE NONE
<textanchor> LEFT CENTER RIGHT
MIDLEFT MIDCENTER MIDRIGHT
HEADLEFT HEADCENTER HEADRIGHT
<textboxtype> NONE FILLED HOLLOW
<threedviewchangedrawlevel>
FULL TRACE
<thetamode> DEGREES RADIANS ARBITRARY
<tickdirection> IN OUT CENTERED
<tiffbyteorder> INTEL MOTOROLA
<transformation> POLARTORECT RECTTOPOLAR SPHERICALTORECT
RECTTOSPHERICAL
<translucency> Valid integer from one to 99.
<twoddraworder> BYZONE BYLAYER
<unloadstrategy> MINIMIZEMEMORYUSE NEVERUNLOAD AUTO
<valueblankcellmode> ALLCORNERS ANYCORNER PRIMARYVALUE
<valueblankrelop> LESSTHANOREQUAL NOTEQUALTO GREATERTHAN
LESSTHAN EQUALTO
GREATERTHANOREQUAL
<valueformat> INTEGER FLOAT EXPONENT
BESTFLOAT SUPERSCRIPT RANGEBESTFLOAT
CUSTOMLABEL TIMEDATE
<valuelocation> AUTO NODAL CELLCENTERED
Value Identifier Allowable Values
309
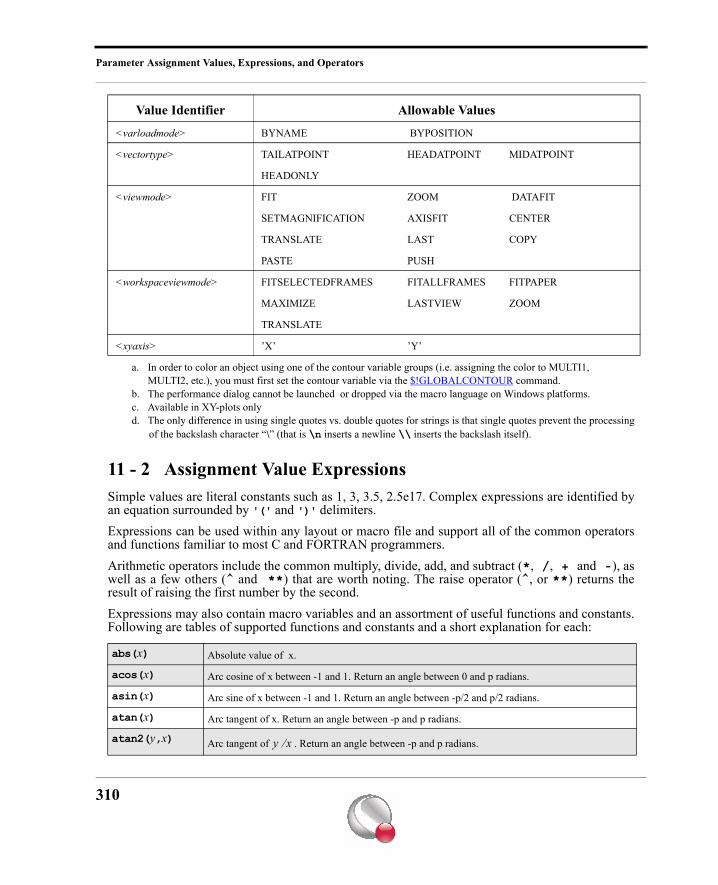
Parameter Assignment Values, Expressions, and Operators
11 - 2 Assignment Value ExpressionsSimple values are literal constants such as 1, 3, 3.5, 2.5e17. Complex expressions are identified byan equation surrounded by '(' and ')' delimiters.Expressions can be used within any layout or macro file and support all of the common operatorsand functions familiar to most C and FORTRAN programmers.Arithmetic operators include the common multiply, divide, add, and subtract (*, /, + and -), aswell as a few others (^ and **) that are worth noting. The raise operator (^, or **) returns theresult of raising the first number by the second.Expressions may also contain macro variables and an assortment of useful functions and constants.Following are tables of supported functions and constants and a short explanation for each:
<varloadmode> BYNAME BYPOSITION
<vectortype> TAILATPOINT HEADATPOINT MIDATPOINT
HEADONLY
<viewmode> FIT ZOOM DATAFIT
SETMAGNIFICATION AXISFIT CENTER
TRANSLATE LAST COPY
PASTE PUSH
<workspaceviewmode> FITSELECTEDFRAMES FITALLFRAMES FITPAPER
MAXIMIZE LASTVIEW ZOOM
TRANSLATE
<xyaxis> ’X’ ’Y’
a. In order to color an object using one of the contour variable groups (i.e. assigning the color to MULTI1, MULTI2, etc.), you must first set the contour variable via the $!GLOBALCONTOUR command.
b. The performance dialog cannot be launched or dropped via the macro language on Windows platforms.c. Available in XY-plots onlyd. The only difference in using single quotes vs. double quotes for strings is that single quotes prevent the processing
of the backslash character “\” (that is \n inserts a newline \\ inserts the backslash itself).
abs(x) Absolute value of x.
acos(x) Arc cosine of x between -1 and 1. Return an angle between 0 and p radians.
asin(x) Arc sine of x between -1 and 1. Return an angle between -p/2 and p/2 radians.
atan(x) Arc tangent of x. Return an angle between -p and p radians.
atan2(y,x) Arc tangent of . Return an angle between -p and p radians.
Value Identifier Allowable Values
y x⁄
310
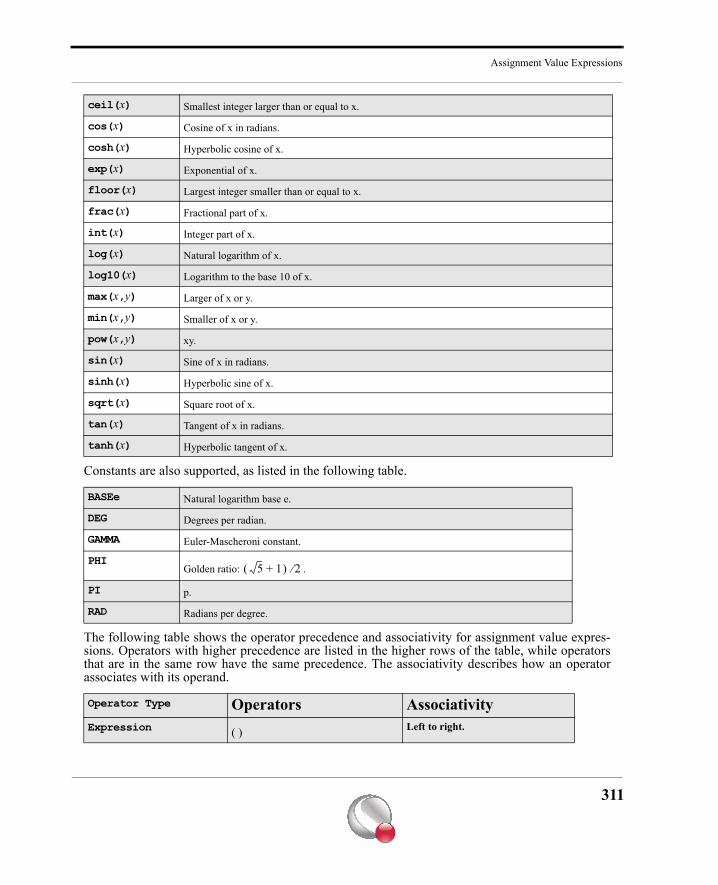
Assignment Value Expressions
Constants are also supported, as listed in the following table.
The following table shows the operator precedence and associativity for assignment value expres-sions. Operators with higher precedence are listed in the higher rows of the table, while operatorsthat are in the same row have the same precedence. The associativity describes how an operatorassociates with its operand.
ceil(x) Smallest integer larger than or equal to x.
cos(x) Cosine of x in radians.
cosh(x) Hyperbolic cosine of x.
exp(x) Exponential of x.
floor(x) Largest integer smaller than or equal to x.
frac(x) Fractional part of x.
int(x) Integer part of x.
log(x) Natural logarithm of x.
log10(x) Logarithm to the base 10 of x.
max(x,y) Larger of x or y.
min(x,y) Smaller of x or y.
pow(x,y) xy.
sin(x) Sine of x in radians.
sinh(x) Hyperbolic sine of x.
sqrt(x) Square root of x.
tan(x) Tangent of x in radians.
tanh(x) Hyperbolic tangent of x.
BASEe Natural logarithm base e.
DEG Degrees per radian.
GAMMA Euler-Mascheroni constant.
PHIGolden ratio: .
PI p.
RAD Radians per degree.
Operator Type Operators AssociativityExpression ( ) Left to right.
5 1+( ) 2⁄
311
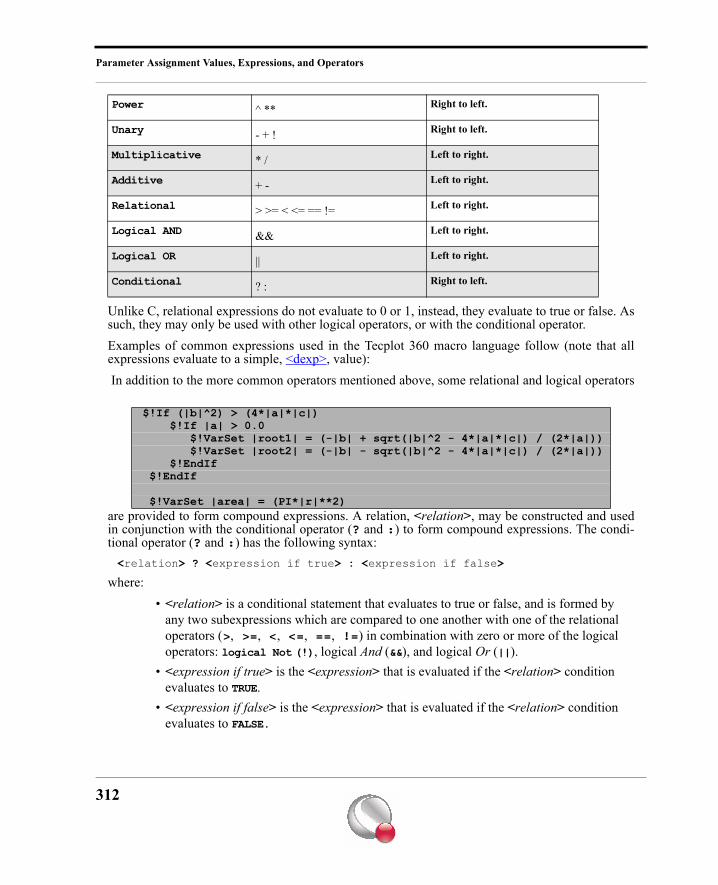
Parameter Assignment Values, Expressions, and Operators
Unlike C, relational expressions do not evaluate to 0 or 1, instead, they evaluate to true or false. Assuch, they may only be used with other logical operators, or with the conditional operator.Examples of common expressions used in the Tecplot 360 macro language follow (note that allexpressions evaluate to a simple, <dexp>, value): In addition to the more common operators mentioned above, some relational and logical operators
are provided to form compound expressions. A relation, <relation>, may be constructed and usedin conjunction with the conditional operator (? and :) to form compound expressions. The condi-tional operator (? and :) has the following syntax:<relation> ? <expression if true> : <expression if false>
where:• <relation> is a conditional statement that evaluates to true or false, and is formed by
any two subexpressions which are compared to one another with one of the relational operators (>, >=, <, <=, ==, !=) in combination with zero or more of the logical operators: logical Not (!), logical And (&&), and logical Or (||).
• <expression if true> is the <expression> that is evaluated if the <relation> condition evaluates to TRUE.
• <expression if false> is the <expression> that is evaluated if the <relation> condition evaluates to FALSE.
Power ^ ** Right to left.
Unary - + ! Right to left.
Multiplicative * / Left to right.
Additive + - Left to right.
Relational > >= < <= == != Left to right.
Logical AND && Left to right.
Logical OR || Left to right.
Conditional ? : Right to left.
$!If (|b|^2) > (4*|a|*|c|) $!If |a| > 0.0 $!VarSet |root1| = (-|b| + sqrt(|b|^2 - 4*|a|*|c|) / (2*|a|)) $!VarSet |root2| = (-|b| - sqrt(|b|^2 - 4*|a|*|c|) / (2*|a|)) $!EndIf $!EndIf $!VarSet |area| = (PI*|r|**2)
312
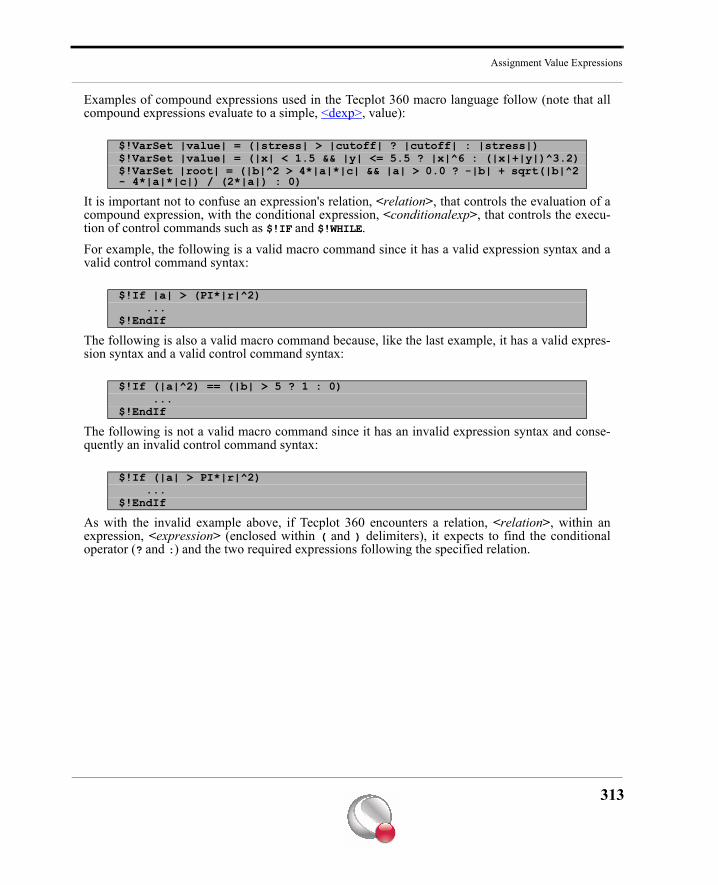
Assignment Value Expressions
Examples of compound expressions used in the Tecplot 360 macro language follow (note that allcompound expressions evaluate to a simple, <dexp>, value):
It is important not to confuse an expression's relation, <relation>, that controls the evaluation of acompound expression, with the conditional expression, <conditionalexp>, that controls the execu-tion of control commands such as $!IF and $!WHILE.For example, the following is a valid macro command since it has a valid expression syntax and avalid control command syntax:
The following is also a valid macro command because, like the last example, it has a valid expres-sion syntax and a valid control command syntax:
The following is not a valid macro command since it has an invalid expression syntax and conse-quently an invalid control command syntax:
As with the invalid example above, if Tecplot 360 encounters a relation, <relation>, within anexpression, <expression> (enclosed within ( and ) delimiters), it expects to find the conditionaloperator (? and :) and the two required expressions following the specified relation.
$!VarSet |value| = (|stress| > |cutoff| ? |cutoff| : |stress|)$!VarSet |value| = (|x| < 1.5 && |y| <= 5.5 ? |x|^6 : (|x|+|y|)^3.2)$!VarSet |root| = (|b|^2 > 4*|a|*|c| && |a| > 0.0 ? -|b| + sqrt(|b|^2 - 4*|a|*|c|) / (2*|a|) : 0)
$!If |a| > (PI*|r|^2) ...$!EndIf
$!If (|a|^2) == (|b| > 5 ? 1 : 0) ...$!EndIf
$!If (|a| > PI*|r|^2) ... $!EndIf
313
Parameter Assignment Values, Expressions, and Operators
314
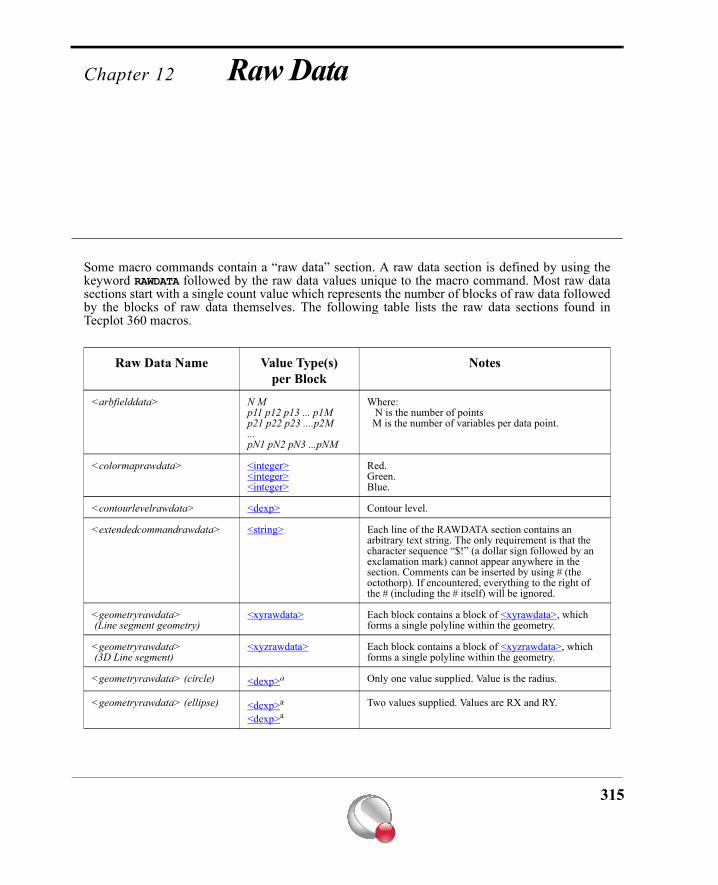
Chapter 12 Raw Data
Some macro commands contain a “raw data” section. A raw data section is defined by using thekeyword RAWDATA followed by the raw data values unique to the macro command. Most raw datasections start with a single count value which represents the number of blocks of raw data followedby the blocks of raw data themselves. The following table lists the raw data sections found inTecplot 360 macros.
Raw Data Name Value Type(s)per Block
Notes
<arbfielddata> N Mp11 p12 p13 ... p1Mp21 p22 p23 ....p2M...pN1 pN2 pN3 ...pNM
Where: N is the number of points M is the number of variables per data point.
<colormaprawdata> <integer><integer><integer>
Red.Green.Blue.
<contourlevelrawdata> <dexp> Contour level.
<extendedcommandrawdata> <string> Each line of the RAWDATA section contains an arbitrary text string. The only requirement is that the character sequence “$!” (a dollar sign followed by an exclamation mark) cannot appear anywhere in the section. Comments can be inserted by using # (the octothorp). If encountered, everything to the right of the # (including the # itself) will be ignored.
<geometryrawdata> (Line segment geometry)
<xyrawdata> Each block contains a block of <xyrawdata>, which forms a single polyline within the geometry.
<geometryrawdata> (3D Line segment)
<xyzrawdata> Each block contains a block of <xyzrawdata>, which forms a single polyline within the geometry.
<geometryrawdata> (circle) <dexp>a Only one value supplied. Value is the radius.
<geometryrawdata> (ellipse) <dexp>a
<dexp>aTwo values supplied. Values are RX and RY.
315
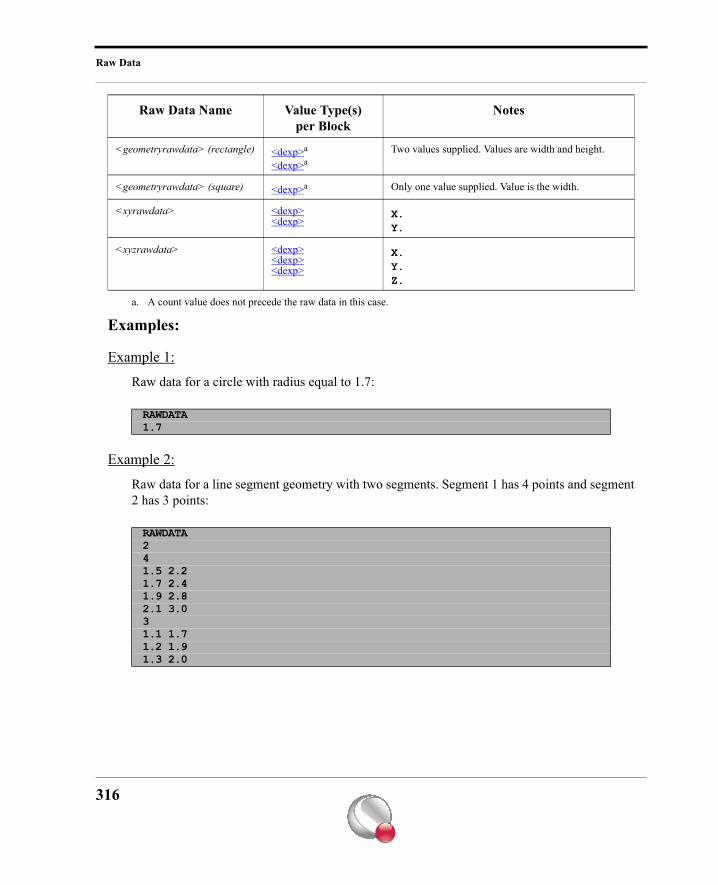
Raw Data
Examples:
Example 1:
Raw data for a circle with radius equal to 1.7:
Example 2:
Raw data for a line segment geometry with two segments. Segment 1 has 4 points and segment2 has 3 points:
<geometryrawdata> (rectangle) <dexp>a
<dexp>aTwo values supplied. Values are width and height.
<geometryrawdata> (square) <dexp>a Only one value supplied. Value is the width.
<xyrawdata> <dexp><dexp>
X.Y.
<xyzrawdata> <dexp><dexp><dexp>
X.Y.Z.
a. A count value does not precede the raw data in this case.
RAWDATA1.7
RAWDATA241.5 2.21.7 2.41.9 2.82.1 3.031.1 1.71.2 1.91.3 2.0
Raw Data Name Value Type(s)per Block
Notes
316
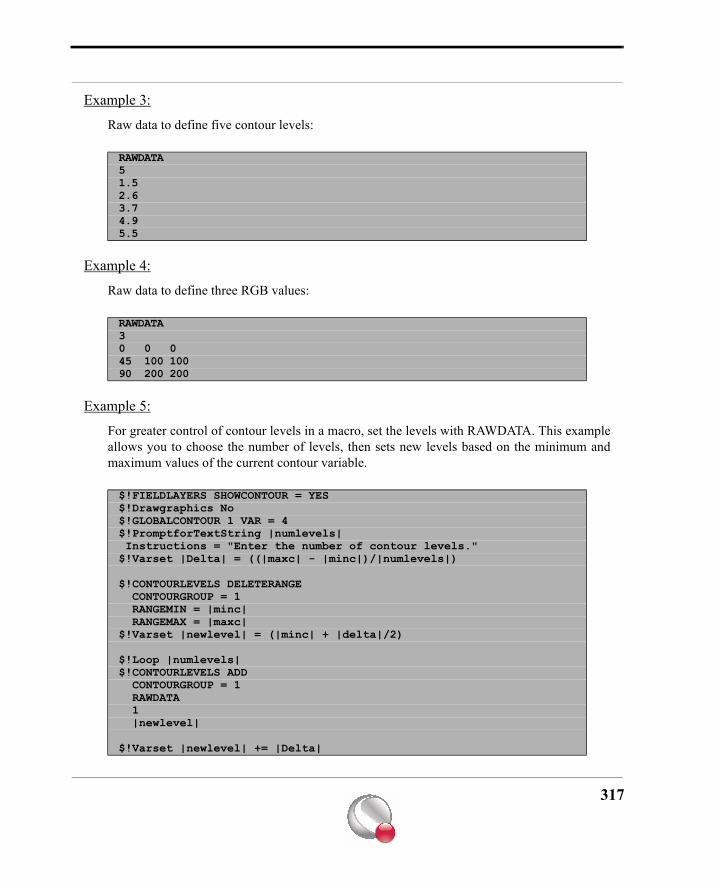
Example 3:
Raw data to define five contour levels:
Example 4:
Raw data to define three RGB values:
Example 5:
For greater control of contour levels in a macro, set the levels with RAWDATA. This exampleallows you to choose the number of levels, then sets new levels based on the minimum andmaximum values of the current contour variable.
RAWDATA5 1.52.63.74.95.5
RAWDATA30 0 0 45 100 10090 200 200
$!FIELDLAYERS SHOWCONTOUR = YES$!Drawgraphics No$!GLOBALCONTOUR 1 VAR = 4$!PromptforTextString |numlevels| Instructions = "Enter the number of contour levels."$!Varset |Delta| = ((|maxc| - |minc|)/|numlevels|)
$!CONTOURLEVELS DELETERANGE CONTOURGROUP = 1 RANGEMIN = |minc| RANGEMAX = |maxc|$!Varset |newlevel| = (|minc| + |delta|/2)
$!Loop |numlevels|$!CONTOURLEVELS ADD CONTOURGROUP = 1 RAWDATA 1 |newlevel|
$!Varset |newlevel| += |Delta|
317
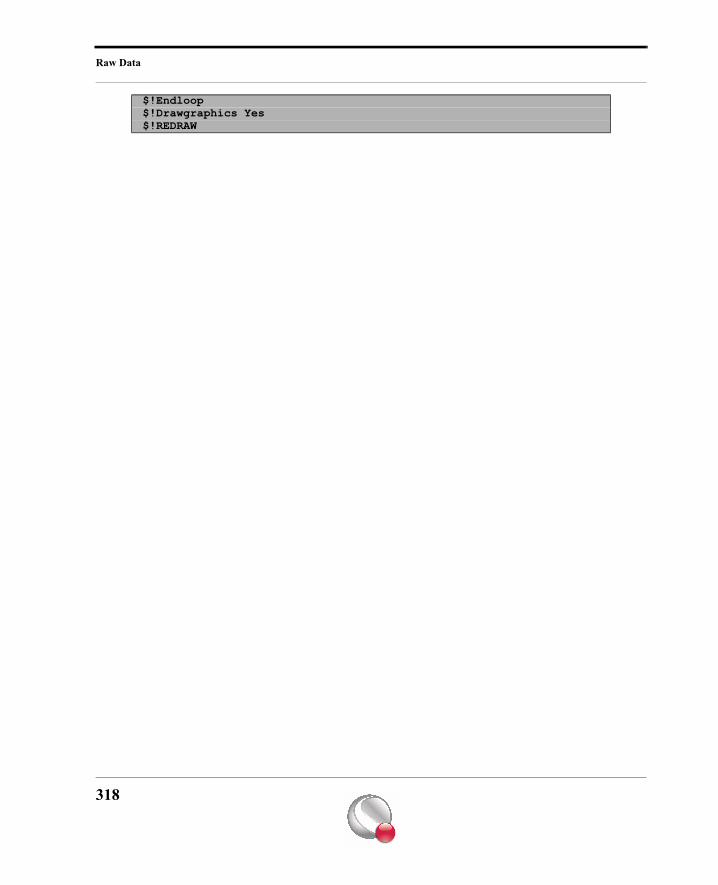
Raw Data
$!Endloop$!Drawgraphics Yes$!REDRAW
318
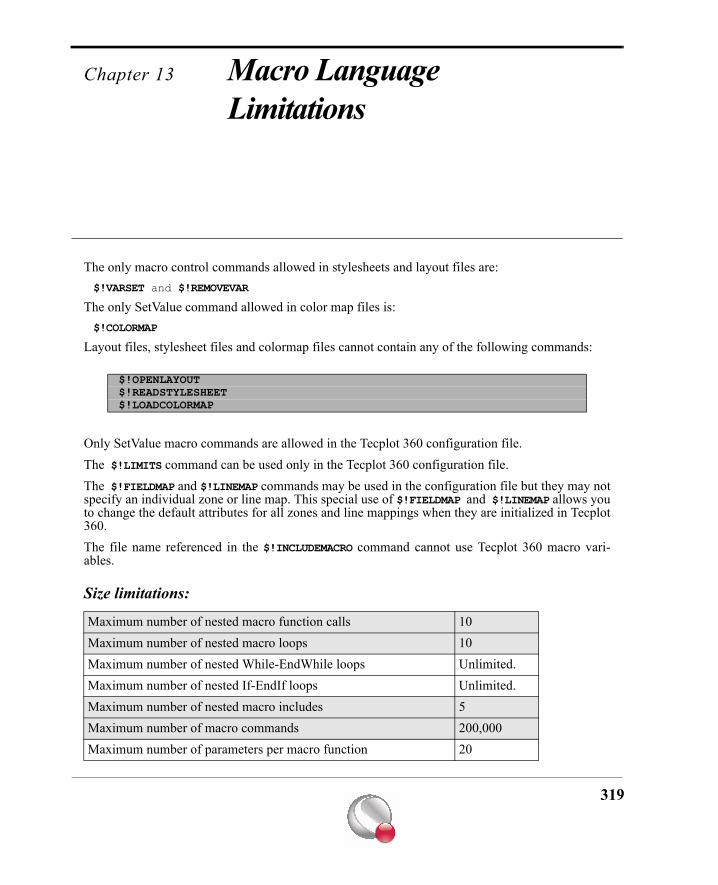
Chapter 13 Macro Language Limitations
The only macro control commands allowed in stylesheets and layout files are:$!VARSET and $!REMOVEVAR
The only SetValue command allowed in color map files is:$!COLORMAP
Layout files, stylesheet files and colormap files cannot contain any of the following commands:
Only SetValue macro commands are allowed in the Tecplot 360 configuration file.The $!LIMITS command can be used only in the Tecplot 360 configuration file.The $!FIELDMAP and $!LINEMAP commands may be used in the configuration file but they may notspecify an individual zone or line map. This special use of $!FIELDMAP and $!LINEMAP allows youto change the default attributes for all zones and line mappings when they are initialized in Tecplot360.The file name referenced in the $!INCLUDEMACRO command cannot use Tecplot 360 macro vari-ables.
Size limitations:
$!OPENLAYOUT$!READSTYLESHEET$!LOADCOLORMAP
Maximum number of nested macro function calls 10Maximum number of nested macro loops 10Maximum number of nested While-EndWhile loops Unlimited.Maximum number of nested If-EndIf loops Unlimited.Maximum number of nested macro includes 5Maximum number of macro commands 200,000Maximum number of parameters per macro function 20
319
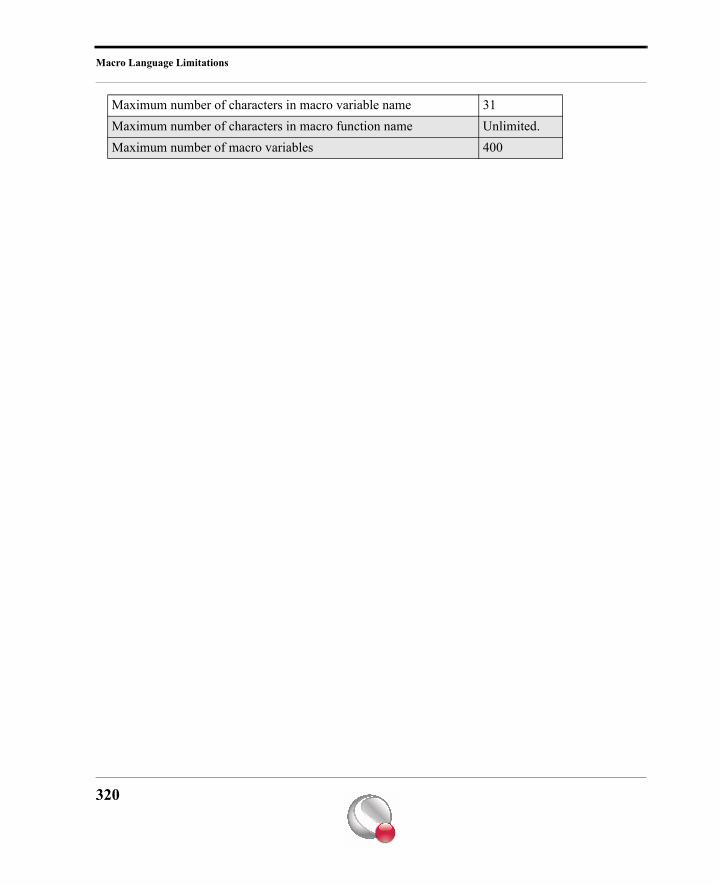
Macro Language Limitations
Maximum number of characters in macro variable name 31Maximum number of characters in macro function name Unlimited.Maximum number of macro variables 400
320
Part 2 Python Scripting
Chapter 14 Using Tecplot 360’s Python Interpreter
14 - 1 Using Python Scripts with Tecplot 360A Python interpreter has been added to Tecplot 360 to allow you to harness the automation capabil-ities of macros and extend Tecplot 360’s functionality using standard Python libraries (e.g. FFT)without writing an add-on. You may incorporate Python scripts with Tecplot 360 in several differ-ent ways:
1. Using a macro file that calls Python modules.2. Using the Python Quick Scripts dialog.3. Running standalone Python modules launched via the Play Macro or Script dialog
(accessed via Scripting>Play Macro/Script).
Refer to Chapter 29 “Working With Python Scripts” in the User’s Manual for details on each of theabove scenarios.
14 - 2 Installation and SetupWhen you install Tecplot 360, a Python interpreter is included in $TEC_360_2008/python, where$TEC_360_2008 is the directory of your Tecplot 360 installation. In order to access your Pythonscripts via the Tecplot 360 interface, ensure that the following line is included in your tecplot.addfile (located at base directory of your Tecplot 360 installation):$!LoadAddon “pythonutil”
Python scripts can be accessed via Scripting>Play Macro/Script.
Several Python scripting samples have been included for your reference. These scripts are locatedin your Tecplot 360 installation directory and are also available at www.tecplottalk.com/python.
It is imperative that your PYTHONHOME and PYTHONPATH envi-ronment variables be set properly. Refer to the Section 29 - 5 “PythonInstallation Notes” in the User’s Manual for additional details. This is aPython requirement, not a Tecplot 360 requirement.
322
Chapter 15 Python Syntax Rules
Tecplot 360’s Python commands are wrapper functions to the TecUtil functions included with theAdd-on Developer’s Kit (ADK). The ADK contains C/C++ functions which are thoroughly docu-mented in the ADK Reference Manual. Each entry in the manual includes an indicator for whetherthe function is available to the Python interpreter. The syntax required for using Tecplot 360’sPython interpreter is described for each function in the ADK Reference Manual as well as theremainder of this chapter.
15 - 1 Import ModulesYou must include the following import statements at the start of every Python script you wish to usewith Tecplot 360:
Both of the above modules are included in your Tecplot 360 distribution. TecUtil contains theTecUtil library function calls. TecVals contains the enumerated values, set value constants anddefines required for the TecUtil library.
You may also include other Python libraries that your script requires, such as NumPy or SciPy.NumPy and SciPy are Python libraries created for scientific computations, such as FFT and linear
Refer to www.tecplottalk.com/python forsample Python scripts that you may down-load and execute.
import TecUtilimport TecVals
The TecUtil library will work properly only when you are run-ning Tecplot 360. You can not run Python scripts that use theTecUtil library outside of the Tecplot 360 environment.
323
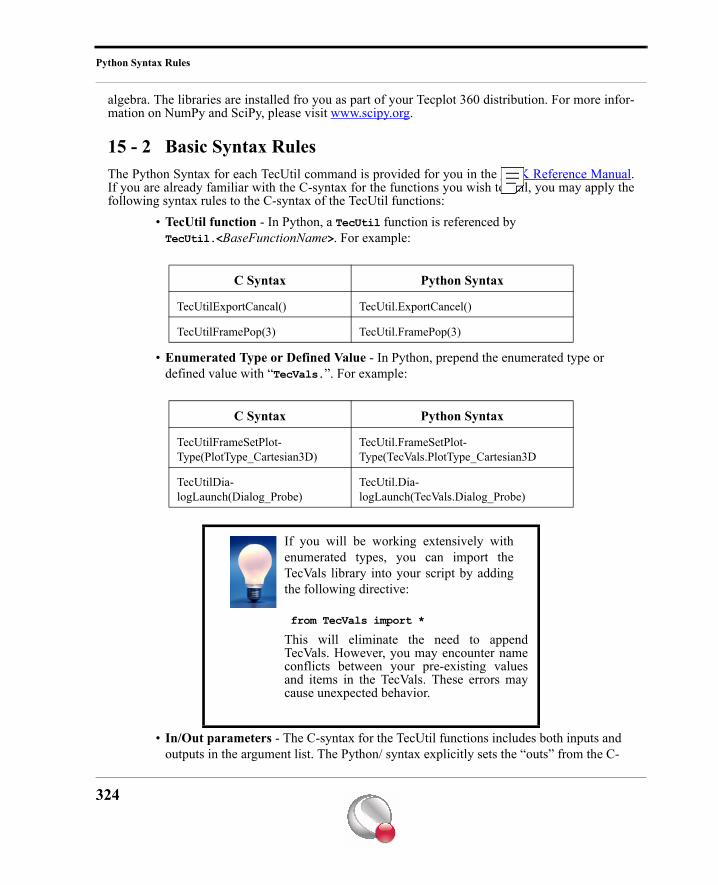
Python Syntax Rules
algebra. The libraries are installed fro you as part of your Tecplot 360 distribution. For more infor-mation on NumPy and SciPy, please visit www.scipy.org.
15 - 2 Basic Syntax RulesThe Python Syntax for each TecUtil command is provided for you in the ADK Reference Manual.If you are already familiar with the C-syntax for the functions you wish to call, you may apply thefollowing syntax rules to the C-syntax of the TecUtil functions:
• TecUtil function - In Python, a TecUtil function is referenced by TecUtil.<BaseFunctionName>. For example:
• Enumerated Type or Defined Value - In Python, prepend the enumerated type or defined value with “TecVals.”. For example:
• In/Out parameters - The C-syntax for the TecUtil functions includes both inputs and outputs in the argument list. The Python/ syntax explicitly sets the “outs” from the C-
C Syntax Python Syntax
TecUtilExportCancal() TecUtil.ExportCancel()
TecUtilFramePop(3) TecUtil.FramePop(3)
C Syntax Python Syntax
TecUtilFrameSetPlot-Type(PlotType_Cartesian3D)
TecUtil.FrameSetPlot-Type(TecVals.PlotType_Cartesian3D
TecUtilDia-logLaunch(Dialog_Probe)
TecUtil.Dia-logLaunch(TecVals.Dialog_Probe)
If you will be working extensively withenumerated types, you can import theTecVals library into your script by addingthe following directive:
from TecVals import *
This will eliminate the need to appendTecVals. However, you may encounter nameconflicts between your pre-existing valuesand items in the TecVals. These errors maycause unexpected behavior.
324
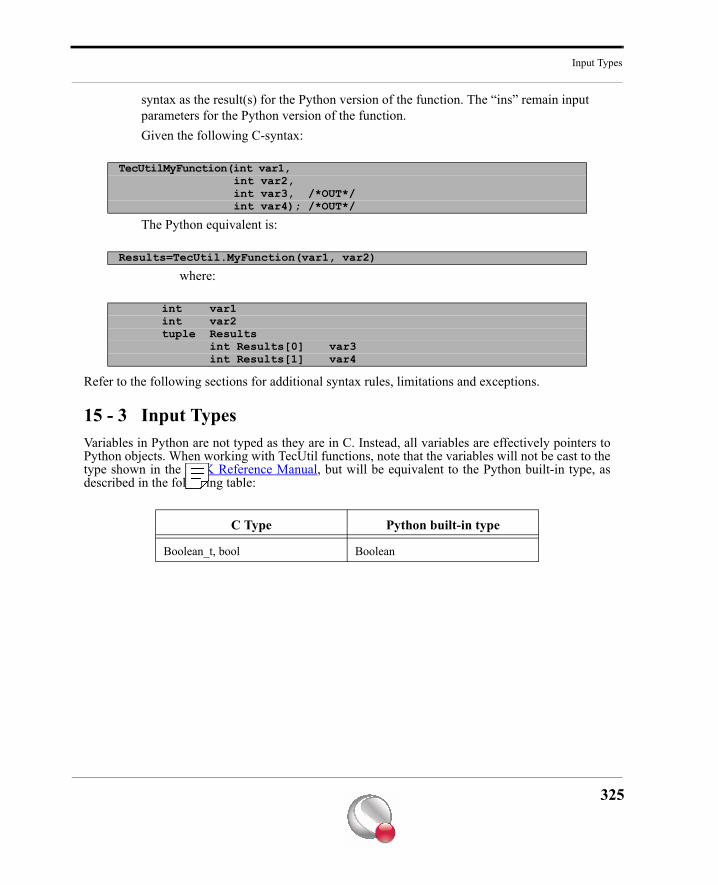
Input Types
syntax as the result(s) for the Python version of the function. The “ins” remain input parameters for the Python version of the function.Given the following C-syntax:
The Python equivalent is:
where:
Refer to the following sections for additional syntax rules, limitations and exceptions.
15 - 3 Input TypesVariables in Python are not typed as they are in C. Instead, all variables are effectively pointers toPython objects. When working with TecUtil functions, note that the variables will not be cast to thetype shown in the ADK Reference Manual, but will be equivalent to the Python built-in type, asdescribed in the following table:
TecUtilMyFunction(int var1, int var2,int var3, /*OUT*/int var4); /*OUT*/
Results=TecUtil.MyFunction(var1, var2)
int var1int var2tuple Results
int Results[0] var3int Results[1] var4
C Type Python built-in type
Boolean_t, bool Boolean
325
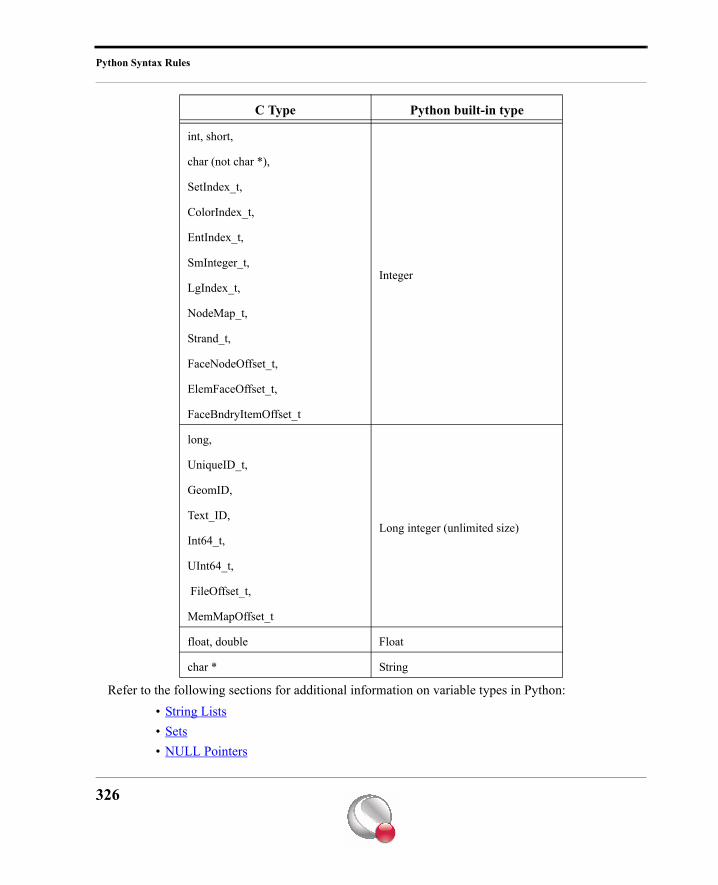
Python Syntax Rules
Refer to the following sections for additional information on variable types in Python:• String Lists• Sets• NULL Pointers
int, short,
Integer
char (not char *),
SetIndex_t,
ColorIndex_t,
EntIndex_t,
SmInteger_t,
LgIndex_t,
NodeMap_t,
Strand_t,
FaceNodeOffset_t,
ElemFaceOffset_t,
FaceBndryItemOffset_t
long,
Long integer (unlimited size)
UniqueID_t,
GeomID,
Text_ID,
Int64_t,
UInt64_t,
FileOffset_t,
MemMapOffset_t
float, double Float
char * String
C Type Python built-in type
326
Input Types
• Sequences• ArgList_pa Types• Input Parameters With Mixed Types• Opaque Types
15- 3.1 String ListsIf a variable is of the type String_pa, perform the following steps for the Python syntax:
1. Declare a list:
2. In the function prototype, use mylist in lieu of the StringList_pa variable.
For example, given the following C-syntax:
The equivalent Python syntax is:
where:
15- 3.2 SetsIf a variable is of the type Set_pa, perform the following steps for the Python syntax:
1. Declare a list or tuple:
or
2. In the function prototype, use mylist or mytuple in lieu of the Set_pa variable.
For example, given the following C-syntax:
mylist=[“val1”, “val2”, ..., “valn”]
TecUtilMyFunction ( Boolean IsTrue,StringList_pa VarList)
mylist=[“val1”, “val2”, ..., “valn”]TecUtil.MyFunction(IsTrue, mylist)
boolean IsTruelist mylist
mylist=[6,13,15]
nine=9.0mytuple = (0, 1, 4, 9, 16, 25)
TecUtilMyFunction ( Boolean IsTrue,Set_pa VarSet)
327
Python Syntax Rules
The equivalent Python syntax is:
where:
or
where:
15- 3.3 NULL PointersUse the None object in your Python code wherever a NULL pointer would have been passed in Ccode. For example:
15- 3.4 SequencesArrays of values in Python are defined as either a list or a tuple. TecUtil functions support bothforms of input arrays. Square brackets are used to denote lists and parentheses are used to denotetuples. Consider the following examples:
Note that some of the values being passed to CreateSimpleZone are integers, even though the func-tion expects doubles. This is acceptable - the values will be promoted to the expected type withinthe TecUtil glue function.
mylist=[1, 4, 9]TecUtil.MyFunction(IsTrue, mylist)
boolean IsTruelist mylist
nine=9.0mytuple = (0, 1, 4, 9, 16, 25)TecUtil.MyFunction(IsTrue, mytuple)
boolean IsTruetuple mytuple
success=TecUtil.LineMapSetAssignment(TecVals.SV_Zone, None, 0, 2)
four = 4nine = 9.0xVals = [0, 1.0, 2, 3.0, 4, 5] # Okay to mix integers and doublesyVals = (0, 1, four, nine, 16, 25) # This tuple references other
# objects (four and nine).numPoints = len(xVals)success = TecUtil.CreateSimpleZone(numPoints, xVals, yVals,
TecVals.FieldDataType_Double)
328
Input Types
Also note that while lists and tuples in Python can point to objects of different types, includingother lists, not all mixtures are acceptable to Tecplot 360. For example, you cannot input strings orreferences to another list in a function that expects doubles.
15- 3.5 ArgList_pa TypesArgList_pa types are used in TecUtil functions that end with the letter X. TecUtil functions that endin the letter X (i.e. TecUtil*X) are TecUtil functions that require a flexible, or extended, argumentlist or a varied number of arguments. Where appropriate, a standard argument list function is pro-vided along with the extended version so that common uses of the function are not burdened withthe additional instructions required for the extended version.The ArgList_pa type maps nicely to a Python dictionary native type. Dictionaries are lists of keyvalue pairs.The following code snippet illustrates how this might be used in a call to TecUtilStyleSetLowLev-elX. Note: For brevity, we have omitted creation of the zoneSet variable.
Note that the name string (second parameter in the C version of the TecUtilArgListAppend* func-tions) becomes the key string in the Python dictionary. The value portion of the dictionary must be a tuple. The first item in the tuple identifies the type ofdata using constants found in the TecVals module. The type identifiers correspond to the ArgLi-stAppend* function that you would normally call in C:
The C code:ArgList_pa arglist1 = TecUtilArgListAlloc();TecUtilArgListAppendString(arglist1, SV_P1, SV_FIELDMAP);TecUtilArgListAppendString(arglist1, SV_P2, SV_EDGELAYER);TecUtilArgListAppendString(arglist1, SV_P3, SV_COLOR);TecUtilArgListAppendSet(arglist1, SV_OBJECTSET, zoneSet);TecUtilArgListAppendArbParam(arglist1, SV_IVALUE, (ArbParam_t) Blue_C);TecUtilStyleSetLowLevelX(arglist1);TecUtilArgListDealloc(&argList1);:
The equivalent code in Python:argList = dict()argList[TecVals.SV_P1] = (TecVals.AppendString, TecVals.SV_FIELDMAP)argList[TecVals.SV_P2] = (TecVals.AppendString, TecVals.SV_EDGELAYER)argList[TecVals.SV_P3] = (TecVals.AppendString, TecVals.SV_COLOR)argList[TecVals.SV_OBJECTSET] = (TecVals.AppendSet, [2])argList[TecVals.SV_IVALUE] = (TecVals.AppendArbParam, TecVals.Blue_C)TecUtil.StyleSetLowLevelX(argList)
TecVals.AppendArbParamTecVals.AppendIntTecVals.AppendDoubleTecVals.AppendSetTecVals.AppendStringListTecVals.AppendArray
329
Python Syntax Rules
The second item in the value tuple holds the actual data (what is usually the third parameter in the Cversion of the TecUtilArgListAppend* function). When the data are in the form of a Set, StringList,or Array, then again the native Python lists can be used.
15- 3.6 Input Parameters With Mixed TypesIn the ADK, ArbParam_t is used to cast input parameters when the data being passed may take dif-ferent forms (integer, double, list, etc.).When an input parameter is an ArbParam_t in the C syntax, the ADK Reference Manual will indi-cate the type of data actually expected (usually depending on other input parameters). In the Pythoncall, simply use the appropriate built-in type (see also: Section 15 - 3 “Input Types”).For example, when calling TecUtilStateChanged for Zones Added, the ArbParam_t parameter ref-erences a Set_pa. Since Set_pa maps to a Python list, the call would simply be:
15- 3.7 Opaque TypesSome functions return a pointer to an "opaque" type. These are references that cannot be manipu-lated in the Python code - they are used only as input parameters for subsequent calls to otherTecUtil functions. In these cases, you do not need to be concerned with the data type that isreturned. Simply assign the return object to a variable and pass that variable back into the functionsthat need it.For example:
Opaque types include:Menu_paAddOn_paNodeMap_paFaceNeighbor_paFaceMap_paElemToFaceMap_paFieldData_paAuxData_paViewState_paUniqueID_tGeom_ID
Any TecUtil*X function that requires aparameter that is a pointer is not supportedby the Python interpreter.
TecUtil.StateChanged(TecVals.StateChange_ZonesAdded, [1,2,3])
textId = TecUtil.TextCreate(TecVals.CoordSys_Frame, 50, 50, TecVals.Units_Frame, 3.5, "Hello World")
TecUtil.TextSetFont(textId, TecVals.Font_Helvetica)
330
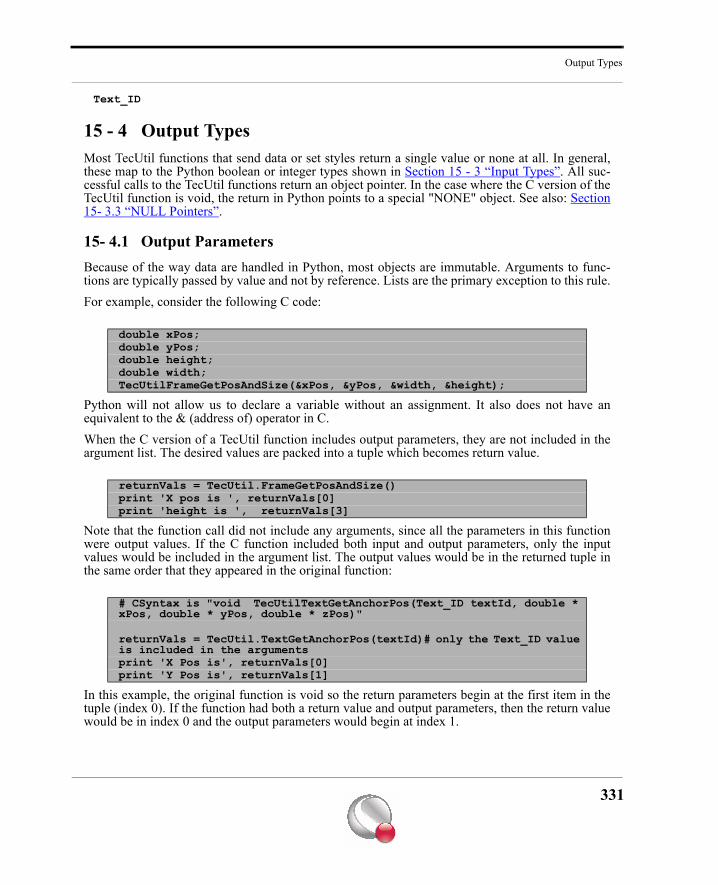
Output Types
Text_ID
15 - 4 Output TypesMost TecUtil functions that send data or set styles return a single value or none at all. In general,these map to the Python boolean or integer types shown in Section 15 - 3 “Input Types”. All suc-cessful calls to the TecUtil functions return an object pointer. In the case where the C version of theTecUtil function is void, the return in Python points to a special "NONE" object. See also: Section15- 3.3 “NULL Pointers”.
15- 4.1 Output ParametersBecause of the way data are handled in Python, most objects are immutable. Arguments to func-tions are typically passed by value and not by reference. Lists are the primary exception to this rule.For example, consider the following C code:
Python will not allow us to declare a variable without an assignment. It also does not have anequivalent to the & (address of) operator in C.When the C version of a TecUtil function includes output parameters, they are not included in theargument list. The desired values are packed into a tuple which becomes return value.
Note that the function call did not include any arguments, since all the parameters in this functionwere output values. If the C function included both input and output parameters, only the inputvalues would be included in the argument list. The output values would be in the returned tuple inthe same order that they appeared in the original function:
In this example, the original function is void so the return parameters begin at the first item in thetuple (index 0). If the function had both a return value and output parameters, then the return valuewould be in index 0 and the output parameters would begin at index 1.
double xPos;double yPos;double height;double width;TecUtilFrameGetPosAndSize(&xPos, &yPos, &width, &height);
returnVals = TecUtil.FrameGetPosAndSize()print 'X pos is ', returnVals[0]print 'height is ', returnVals[3]
# CSyntax is "void TecUtilTextGetAnchorPos(Text_ID textId, double * xPos, double * yPos, double * zPos)"
returnVals = TecUtil.TextGetAnchorPos(textId)# only the Text_ID value is included in the argumentsprint 'X Pos is', returnVals[0]print 'Y Pos is', returnVals[1]
331
Python Syntax Rules
15- 4.2 Reference CountsALL returns from TecUtil functions are new references. The Python code is therefore the "owner"of these objects, and is responsible for performing DECREFs (decrement the reference count) whenthe objects are no longer needed.
15 - 5 Exceptions to the RulesA small number of functions use slight variations to the rules shown above.
• ViewDealloc • The C syntax indicates that the "address of" (&) operator be prepended to the variable
name. Since this is not a valid Python operator, the opaque pointer is passed in as is. • ContourGetLevels
The list of levels is returned as the third item in the return tuple. In Python, do not call TecUtilArrayDealloc as noted in the instructions, although the return tuple should be de-referenced when it is no longer needed.
15 - 6 Convenience FunctionsTecplot 360’s Python interpreter includes a small library of convenience functions for reading andwriting data. The following functions are provided:
• ZoneGetDimensions• IOrderedDataValuesGet• IOrderedDataValuesSet• IJOrderedDataValuesGet• IJOrderedDataValuesSet• IJKOrderedDataValuesGet• IJKOrderedDataValuesSet
15- 6.1 ZoneGetDimensionsZoneGetDimensions is an abbreviated version of ZoneGetInfo that skips all the FieldData_pareturns. It has the following syntax:
On return, dims will reference a tuple with the following values:dims = TecUtil.ZoneGetDimensions(zoneNum)
dims[0] I-dimension for ordered data, or number of data points for FE data.
332
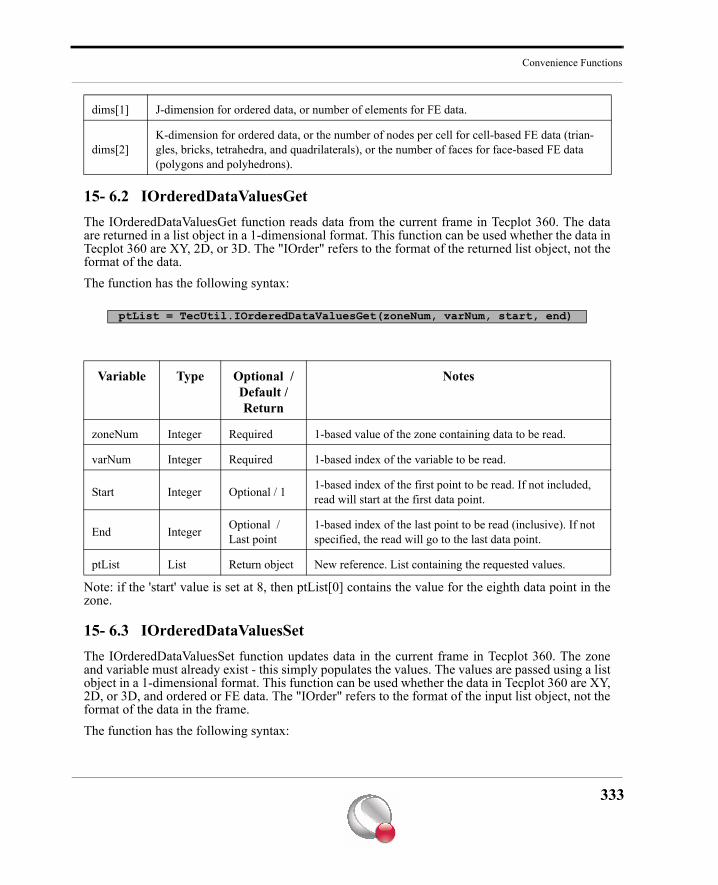
Convenience Functions
15- 6.2 IOrderedDataValuesGetThe IOrderedDataValuesGet function reads data from the current frame in Tecplot 360. The dataare returned in a list object in a 1-dimensional format. This function can be used whether the data inTecplot 360 are XY, 2D, or 3D. The "IOrder" refers to the format of the returned list object, not theformat of the data.The function has the following syntax:
Note: if the 'start' value is set at 8, then ptList[0] contains the value for the eighth data point in thezone.
15- 6.3 IOrderedDataValuesSetThe IOrderedDataValuesSet function updates data in the current frame in Tecplot 360. The zoneand variable must already exist - this simply populates the values. The values are passed using a listobject in a 1-dimensional format. This function can be used whether the data in Tecplot 360 are XY,2D, or 3D, and ordered or FE data. The "IOrder" refers to the format of the input list object, not theformat of the data in the frame.The function has the following syntax:
dims[1] J-dimension for ordered data, or number of elements for FE data.
dims[2]K-dimension for ordered data, or the number of nodes per cell for cell-based FE data (trian-gles, bricks, tetrahedra, and quadrilaterals), or the number of faces for face-based FE data (polygons and polyhedrons).
ptList = TecUtil.IOrderedDataValuesGet(zoneNum, varNum, start, end)
Variable Type Optional / Default / Return
Notes
zoneNum Integer Required 1-based value of the zone containing data to be read.
varNum Integer Required 1-based index of the variable to be read.
Start Integer Optional / 1 1-based index of the first point to be read. If not included, read will start at the first data point.
End Integer Optional / Last point
1-based index of the last point to be read (inclusive). If not specified, the read will go to the last data point.
ptList List Return object New reference. List containing the requested values.
333
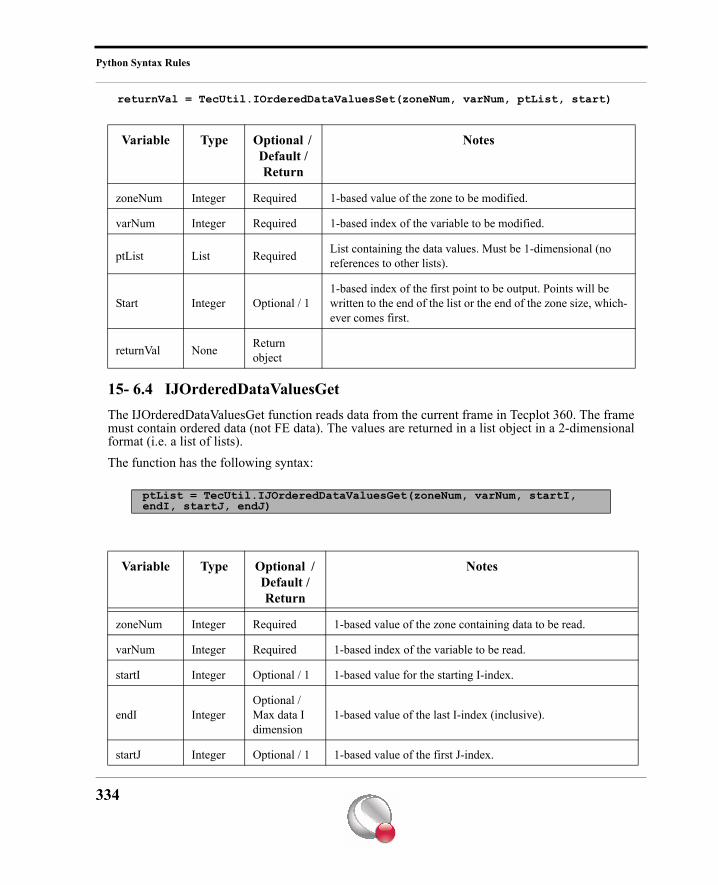
Python Syntax Rules
returnVal = TecUtil.IOrderedDataValuesSet(zoneNum, varNum, ptList, start)
15- 6.4 IJOrderedDataValuesGetThe IJOrderedDataValuesGet function reads data from the current frame in Tecplot 360. The framemust contain ordered data (not FE data). The values are returned in a list object in a 2-dimensionalformat (i.e. a list of lists). The function has the following syntax:
Variable Type Optional / Default / Return
Notes
zoneNum Integer Required 1-based value of the zone to be modified.
varNum Integer Required 1-based index of the variable to be modified.
ptList List Required List containing the data values. Must be 1-dimensional (no references to other lists).
Start Integer Optional / 11-based index of the first point to be output. Points will be written to the end of the list or the end of the zone size, which-ever comes first.
returnVal None Return object
ptList = TecUtil.IJOrderedDataValuesGet(zoneNum, varNum, startI, endI, startJ, endJ)
Variable Type Optional / Default / Return
Notes
zoneNum Integer Required 1-based value of the zone containing data to be read.
varNum Integer Required 1-based index of the variable to be read.
startI Integer Optional / 1 1-based value for the starting I-index.
endI IntegerOptional / Max data I dimension
1-based value of the last I-index (inclusive).
startJ Integer Optional / 1 1-based value of the first J-index.
334
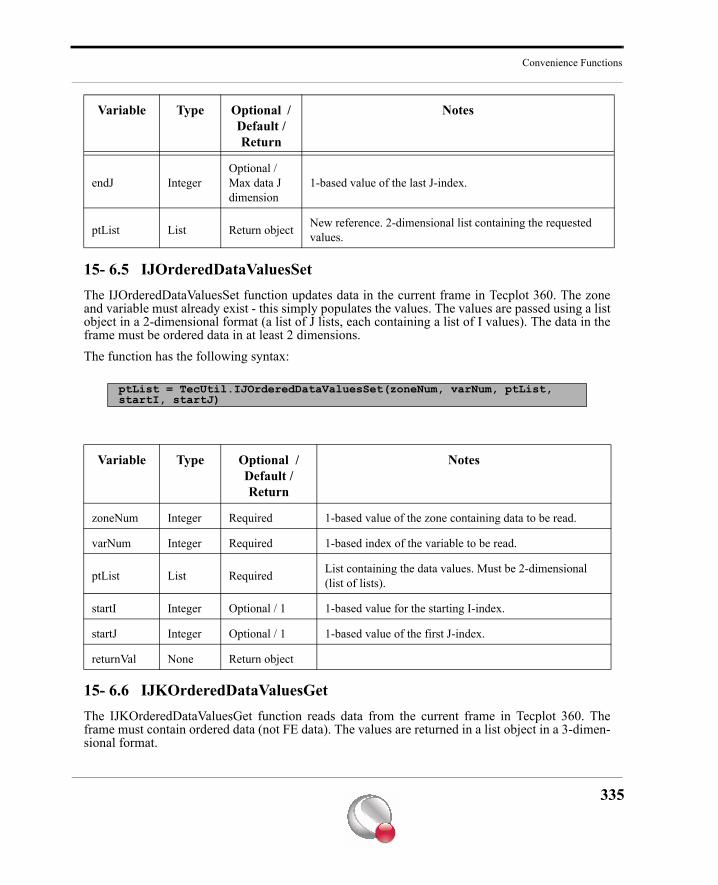
Convenience Functions
15- 6.5 IJOrderedDataValuesSetThe IJOrderedDataValuesSet function updates data in the current frame in Tecplot 360. The zoneand variable must already exist - this simply populates the values. The values are passed using a listobject in a 2-dimensional format (a list of J lists, each containing a list of I values). The data in theframe must be ordered data in at least 2 dimensions.The function has the following syntax:
15- 6.6 IJKOrderedDataValuesGetThe IJKOrderedDataValuesGet function reads data from the current frame in Tecplot 360. Theframe must contain ordered data (not FE data). The values are returned in a list object in a 3-dimen-sional format.
endJ IntegerOptional / Max data J dimension
1-based value of the last J-index.
ptList List Return object New reference. 2-dimensional list containing the requested values.
ptList = TecUtil.IJOrderedDataValuesSet(zoneNum, varNum, ptList, startI, startJ)
Variable Type Optional / Default / Return
Notes
zoneNum Integer Required 1-based value of the zone containing data to be read.
varNum Integer Required 1-based index of the variable to be read.
ptList List Required List containing the data values. Must be 2-dimensional (list of lists).
startI Integer Optional / 1 1-based value for the starting I-index.
startJ Integer Optional / 1 1-based value of the first J-index.
returnVal None Return object
Variable Type Optional / Default / Return
Notes
335
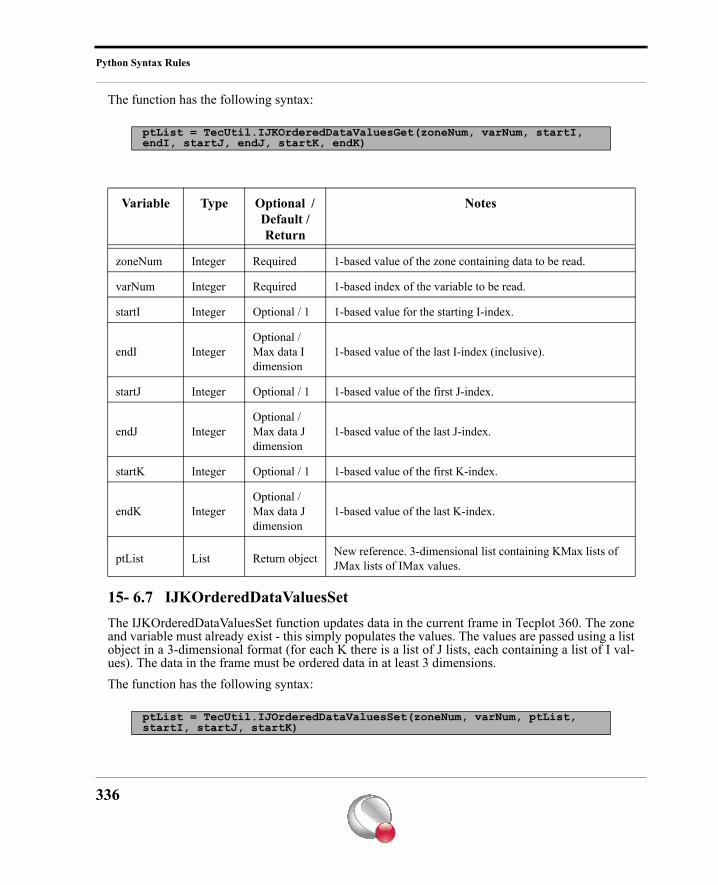
Python Syntax Rules
The function has the following syntax:
15- 6.7 IJKOrderedDataValuesSetThe IJKOrderedDataValuesSet function updates data in the current frame in Tecplot 360. The zoneand variable must already exist - this simply populates the values. The values are passed using a listobject in a 3-dimensional format (for each K there is a list of J lists, each containing a list of I val-ues). The data in the frame must be ordered data in at least 3 dimensions.The function has the following syntax:
ptList = TecUtil.IJKOrderedDataValuesGet(zoneNum, varNum, startI, endI, startJ, endJ, startK, endK)
Variable Type Optional / Default / Return
Notes
zoneNum Integer Required 1-based value of the zone containing data to be read.
varNum Integer Required 1-based index of the variable to be read.
startI Integer Optional / 1 1-based value for the starting I-index.
endI IntegerOptional / Max data I dimension
1-based value of the last I-index (inclusive).
startJ Integer Optional / 1 1-based value of the first J-index.
endJ IntegerOptional / Max data J dimension
1-based value of the last J-index.
startK Integer Optional / 1 1-based value of the first K-index.
endK IntegerOptional / Max data J dimension
1-based value of the last K-index.
ptList List Return object New reference. 3-dimensional list containing KMax lists of JMax lists of IMax values.
ptList = TecUtil.IJOrderedDataValuesSet(zoneNum, varNum, ptList, startI, startJ, startK)
336
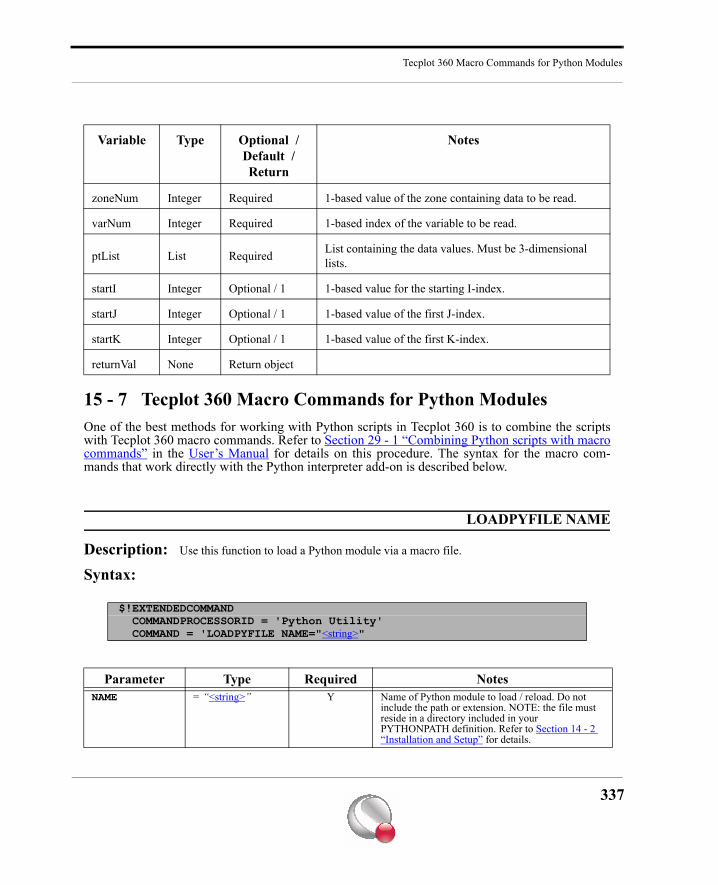
Tecplot 360 Macro Commands for Python Modules
15 - 7 Tecplot 360 Macro Commands for Python ModulesOne of the best methods for working with Python scripts in Tecplot 360 is to combine the scriptswith Tecplot 360 macro commands. Refer to Section 29 - 1 “Combining Python scripts with macrocommands” in the User’s Manual for details on this procedure. The syntax for the macro com-mands that work directly with the Python interpreter add-on is described below.
LOADPYFILE NAME
Description: Use this function to load a Python module via a macro file.
Syntax:
Variable Type Optional / Default / Return
Notes
zoneNum Integer Required 1-based value of the zone containing data to be read.
varNum Integer Required 1-based index of the variable to be read.
ptList List Required List containing the data values. Must be 3-dimensional lists.
startI Integer Optional / 1 1-based value for the starting I-index.
startJ Integer Optional / 1 1-based value of the first J-index.
startK Integer Optional / 1 1-based value of the first K-index.
returnVal None Return object
$!EXTENDEDCOMMAND COMMANDPROCESSORID = 'Python Utility' COMMAND = 'LOADPYFILE NAME="<string>"
Parameter Type Required NotesNAME = “<string>” Y Name of Python module to load / reload. Do not
include the path or extension. NOTE: the file must reside in a directory included in your PYTHONPATH definition. Refer to Section 14 - 2 “Installation and Setup” for details.
337
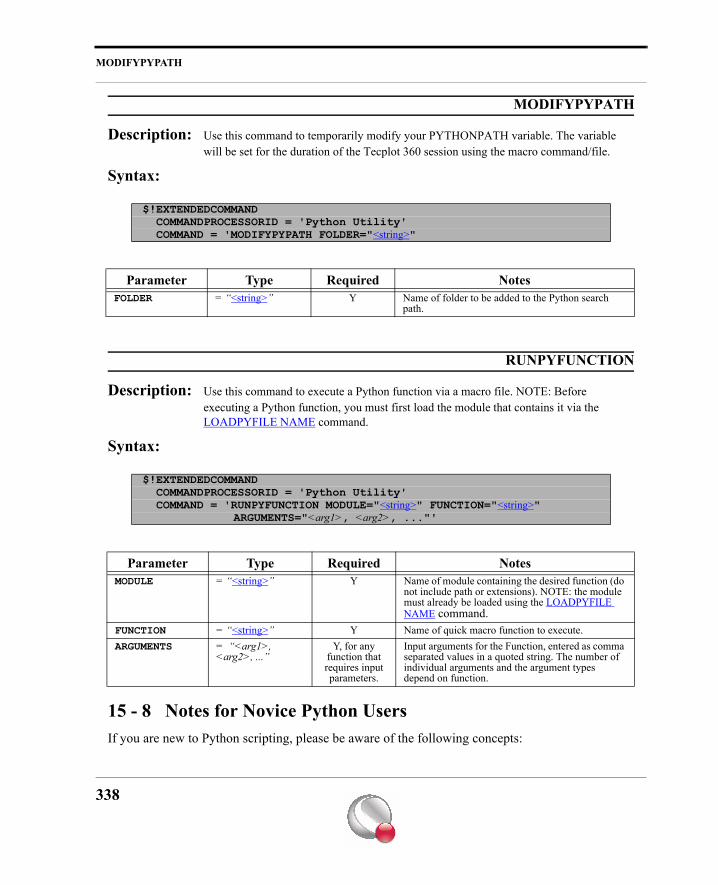
MODIFYPYPATH
MODIFYPYPATH
Description: Use this command to temporarily modify your PYTHONPATH variable. The variable will be set for the duration of the Tecplot 360 session using the macro command/file.
Syntax:
RUNPYFUNCTION
Description: Use this command to execute a Python function via a macro file. NOTE: Before executing a Python function, you must first load the module that contains it via the LOADPYFILE NAME command.
Syntax:
15 - 8 Notes for Novice Python UsersIf you are new to Python scripting, please be aware of the following concepts:
$!EXTENDEDCOMMAND COMMANDPROCESSORID = 'Python Utility' COMMAND = 'MODIFYPYPATH FOLDER="<string>"
Parameter Type Required NotesFOLDER = “<string>” Y Name of folder to be added to the Python search
path.
$!EXTENDEDCOMMAND COMMANDPROCESSORID = 'Python Utility' COMMAND = 'RUNPYFUNCTION MODULE="<string>" FUNCTION="<string>"
ARGUMENTS="<arg1>, <arg2>, ..."'
Parameter Type Required NotesMODULE = “<string>” Y Name of module containing the desired function (do
not include path or extensions). NOTE: the module must already be loaded using the LOADPYFILE NAME command.
FUNCTION = “<string>” Y Name of quick macro function to execute.ARGUMENTS = “<arg1>,
<arg2>, ...”Y, for any
function that requires input parameters.
Input arguments for the Function, entered as comma separated values in a quoted string. The number of individual arguments and the argument types depend on function.
338
Notes for Novice Python Users
• There are not any Python equivalents for TecUtil Alloc, Dealloc or manipulation functions. Use the built-in Python functions.
• The comment symbol in Python is “#”.
339
RUNPYFUNCTION
340
$!ACTIVEFIELDFILEMAPS 63
Index
Symbols$!ACTIVEFIELDFILEMAPS 63$!ACTIVELINEMAPS 64$!ADDMACROPANELTITLE 64$!ALTERDATA 65, 67$!ANIMATECONTOURLEVELS 68$!ANIMATEIJKBLANKING 68$!ANIMATEIJKPLANES 70$!ANIMATELINEMAPS 72, 73$!ANIMATESLICES 71, 73$!ANIMATESTREAM 72, 74, 75$!ANIMATETIME 75$!ANIMATEZONES 75, 76$!ATTACHDATASET 77, 78$!ATTACHGEOM 78, 79, 80$!ATTACHTEXT 80, 81, 294$!BASICCOLOR 82, 83, 291$!BASICSIZE 83, 84, 279$!BLANKING 84, 86$!BRANCHCONNECTIVITY 87$!BRANCHFIELDDATAVAR 87$!BREAK 88$!COLORMAP 142, 143
in color map files 319$!COLORMAPCONTROL COPYSTANDARD 89$!COLORMAPCONTROL
REDISTRIBUTECONTROLPOINTS 88$!COLORMAPCONTROL
RESETTOFACTORY 89$!COMPATIBILITY 89$!CONTINUE 90$!CONTOURLABELS 90$!CONTOURLABELS ADD 90, 91$!CONTOURLABELS DELETEALL 91$!CONTOURLEVELS ADD 92$!CONTOURLEVELS DELETENEAREST 93$!CONTOURLEVELS DELETERANGE 93, 94$!CONTOURLEVELS NEW 94$!CONTOURLEVELS RESET 94, 95$!CONTOURLEVELS RESETTONICE 95$!CREATECIRCULARZONE 96$!CREATECONTOURLINEZONES 97$!CREATEFEBOUNDARY 98$!CREATEFESURFACEFROMIORDERED 98$!CREATEISOZONES 99$!CREATELINEMAP 99
$!CREATEMIRRORZONES 100$!CREATENEWFRAME 100, 101$!CREATERECTANGULARZONE 101, 102$!CREATESIMPLEZONE 102, 103$!CREATESLICEZONEFROMPLANE 103, 104$!CREATESLICEZONES 104$!CREATESPHERICALZONE 104$!CREATESTREAMZONES 105$!DATASETUP 106$!DEFAULTGEOM 107$!DEFAULTTEXT 108$!DELAY 108$!DELETEAUXDATA 109$!DELETELINEMAPS 109$!DELETEZONES 110$!DOUBLEBUFFER OFF 110$!DOUBLEBUFFER ON 111$!DOUBLEBUFFER SWAP 111$!DRAWGRAPHICS 111$!DROPDIALOG 112$!DUPLICATELINEMAP 112$!DUPLICATEZONE 113$!ELSE 114$!ELSEIF 115$!ENDIF 158$!ENDLOOP 180$!ENDWHILE 242$!EXPORT 116$!EXPORTCANCEL 116$!EXPORTFINISH 116$!EXPORTNEXTFRAME 117$!EXPORTSETUP 117, 119$!EXPORTSTART 118$!EXTENDEDCOMMAND 119$!EXTRACTFROMGEOM 120, 121$!EXTRACTFROMPOLYLINE 121, 122$!FIELDLAYERS 122, 123$!FIELDMAP 123, 284, 285
restrictions on using 319$!FILECONFIG 126$!FONTADJUST 129, 130$!FRAMECONTROL DELETETOP 130, 184$!FRAMECONTROL FITALLTOPAPER 131, 184$!FRAMECONTROL POP 131$!FRAMECONTROL POPATPOSITION 131$!FRAMECONTROL POPBYNAME 132, 185$!FRAMECONTROL PUSH 132$!FRAMECONTROL PUSHBYNAME 133$!FRAMECONTROL PUSHTOP 133$!FRAMENAME 134
341
INDEX
$!FRAMESETUP 135$!GETAUXDATA 137$!GETCONNECTIVITYREFCOUNT 137$!GETCURFRAMENAME 138$!GETFIELDVALUE 138$!GETFIELDVALUEREFCOUNT 139$!GETNODEINDEX 140$!GETUSERINPUT
replaced by $!PROMPTFORTEXTSTRING 201$!GETVARLOCATION 140$!GETVARNUMBYNAME 141$!GLOABLPAPER 149$!GLOBALCOLORMAP 142$!GLOBALCONTOUR 143, 146, 281, 298$!GLOBALEDGE 146$!GLOBALFRAME 146, 147$!GLOBALLINEPLOT 147$!GLOBALLINKING 149$!GLOBALPOLAR 150$!GLOBALRGB 150$!GLOBALSCATTER 152, 289$!GLOBALTHREED 154, 298$!GLOBALTHREEDVECTOR 155$!GLOBALTIME 157$!GLOBALTWODVECTOR 157$!IF 158$!INCLUDEMACRO 159
restrictions on using 319$!INTERFACE 159$!INVERSEDISTINTERPOLATE 168$!ISOSURFACEATTRIBUTES 169$!ISOSURFACELAYERS 171$!KRIG 171$!LAUNCHDIALOG 172$!LIMITS 173, 319$!LINEARINTERPOLATE 174$!LINEMAP 174, 293
restrictions on using 319$!LINEPLOTLAYERS 178$!LINKING 178$!LOADADDON 179$!LOADCOLORMAP 180
restrictions on using 319$!LOOP 180$!LOOP-ENDLOOP 88$!MACROFUNCTION 25, 180$!NEWLAYOUT 181$!OPENLAYOUT 182
restrictions on using 319$!PAGE 18, 183, 287
$!PAGECONTROL 184–??$!PAGENAME 185$!PAUSE 185, 186$!PICK ADD 186$!PICK ADDALL 187$!PICK ADDALLINRECT 188$!PICK CLEAR 190$!PICK COPY 190$!PICK CUT 190$!PICK EDIT 190$!PICK MAGNIFY 193$!PICK PASTE 193$!PICK POP 194$!PICK PUSH 194$!PICK SETMOUSEMODE 194$!PICK SHIFT 194$!PLOTTYPE 195, 196$!POLARDAXIS 196$!POLARTORECTANGULAR 197$!POLARVIEW 197$!PRINT 197$!PRINTSETUP 198, 292$!PROMPTFORFILENAME 200$!PROMPTFORTEXTSTRING 201$!PROMPTFORYESNO 201$!PROPAGATELINKING 202$!PUBLISH 202$!QUIT 203$!RAWCOLORMAP 203$!READDATASET 204$!READSTYLESHEET 207
restrictions on using 319$!REDRAW 207$!REDRAWALL 208$!REMOVEVAR 208
in stylesheets and layout files 319$!RENAMEDATASETVAR 208$!RENAMEDATASETZONE 209$!RESET3DAXES 209$!RESET3DORIGIN 210$!RESET3DSCALEFACTORS 210$!RESETVECTORLENGTH 210$!ROTATE2DDATA 211$!ROTATE3DVIEW 211$!RUNMACROFUNCTION 212$!SAVELAYOUT 212$!SET3DEYEDISTANCE 213$!SETAUXDATA 213$!SETDATASETTITLE 214$!SETFIELDVALUE 214
342
$!SETFRAMEBACKGROUNDCOLOR 215
$!SETFRAMEBACKGROUNDCOLOR 215$!SETSTYLEBASE 216$!SHARECONNECTIVITY 216$!SHAREFIELDDATAVAR 216$!SHIFTLINEMAPSTOBOTTOM 217$!SHIFTLINEMAPSTOTOP 217$!SHOWMOUSEPOINTER 218$!SKETCHAXIS 218$!SLICEATRRIBUTES 219$!SMOOTH 222$!STREAMATTRIBUTES 223$!STREAMTRACE ADD 225, 227$!STREAMTRACE DELETEALL 227$!STREAMTRACE DELETERANGE 227$!STREAMTRACE RESETDELTATIME 228$!STREAMTRACE
SETTERMINATIONLINE 228$!SYSTEM 229$!THREEDAXIS 230, 282, 284$!THREEDVIEW 232$!TRANFORMCOORDINATES 232$!TRIANGULATE 234$!TWODAXIS 234, 275, 276, 277, 279, 283, 286,
288, 295$!VARSET 19, 23, 24, 235
in stylesheets and layout files 319$!VIEW AXISFIT 237$!VIEW AXISNICEFIT 238$!VIEW CENTER 238$!VIEW COPY 239$!VIEW DATAFIT 239$!VIEW FIT 239$!VIEW LAST 239$!VIEW MAKECURRENTVIEWNICE 240$!VIEW NICEFIT 240$!VIEW PASTE 240$!VIEW PUSH 240$!VIEW RESETTOENTIRECIRCLE 240$!VIEW SETMAGNIFICATION 241$!VIEW TRANSLATE 241$!VIEW ZOOM 242$!WHILE 242$!WHILE-$!ENDWHILE 88$!WORKSPACEVIEW 243$!WORKSPACEVIEW FITALLFRAMES 243$!WORKSPACEVIEW FITPAPER 243$!WORKSPACEVIEW
FITSELECTEDFRAMES 243$!WORKSPACEVIEW LASTVIEW 244$!WORKSPACEVIEW MAXIMIZE 244
$!WORKSPACEVIEW TRANSLATE 244$!WORKSPACEVIEW UNMAXIMIZE 245$!WORKSPACEVIEW ZOOM 245$!WRITECOLORMAP 245$!WRITECURVEINFO 246$!WRITEDATASET 246$!WRITESTYLESHEET 247$!XYLINEAXIS 248, 296<addmousebuttonmode> 299<addonstyle> 299<anglespec> 299<arrowheadattachment> 299<arrowheadstyle> 299<axisalignment> 299<axismode> 299<axistitlemode> 299<axistitleposition> 299<backingstoremode> 299<bitdumpregion> 300<boolean> 300<borderlocation> 300<boundarycondition> 300<boxtype> 300<charactersequence> 300<clipping> 300<color> 300<colormap> 300<colormapcontrol> 300<colormapdistribution> 300<compressiontype> 300<conditionalexp> 300<constraintop2mode> 300<contourcoloring> 300<contourlabelaction> 300<contourlabellocation> 300<contourlevelaction> 300<contourlinemode> 300<contourtype> 300<coordscale> 300<coordsys> 301<curveinfomode> 301<curvetype> 301<dataloadstrategy> 301<datatype> 301<derivpos> 301<dexp> 303<dialogname> 302<double> 303<draworder> 303<drift> 303
343
INDEX
<edgesetting> 303<edgetype> 303<epspreviewimagetype> 303<errorbartype> 303<exportformat> 303<expression> 303<fielddatatype> 303<fillmode> 304<font> 304<frameaction> 304<framecollection> 304<framemode> 304<functiondependency> 304<geomshape> 304<geomtype> 304<ijkblankmode> 304<ijklines> 304<ijkplane> 304<imagestyle> 304<integer> 304<interpptselection> 304<isosurfaceselection> 304<krigdrift> 305<labelalignment> 305<labeltype> 305<lightingeffect> 305<linearinterpmode> 305<linepattern> 305<linktype> 305<macrofunctionvar> 305<macrointrinsic> 305<macrointrinsicvar> 305<macroparameter> 305<macroparameterlist> 305<macrouserdefvar> 305<macrovar> 306<meshplottype> 306<mirrorvar> 306<mousebuttonclick> 306<mousebuttondrag> 306<mousemode> 306<noncurrentframedrawlevel> 306<objectalign> 306<op> 306<originresetlocation> 306<palette> 306<papergridspacing> 306<paperrulerspacing> 306<papersize> 306<pickaction> 306
<plotapproximationmode> 307<plottype> 307<pointerstyle> 307<pointselection> 307<pointstoplot> 307<positionatanchor> 307<printerdriver> 307<printrendertype> 307<quickcolormode> 307<readdataoption> 307<relop> 307<resizefilter> 307<rgblegendorientation> 307<rgbmode> 307<rotateaxis> 308<rotateoriginlocation> 308<rotationmode> 308<scope> 308<set> 308<setspecifier> 308<sizeunits> 308<skipmode> 308<slicesource> 308<sortby> 308<standardcolormap> 308<stipplemode> 308<streamdirection> 308<streamtype> 308<string> 308<stylebase> 309<subboundary> 309<sunrasterformat> 309<surfacestoplot> 309<textanchor> 309<textboxtype> 309<thetamode> 309<threedviewchangedrawlevel> 309<tickdirection> 309<tiffbyteorder> 309<transformation> 309<translucency> 309<twoddraworder> 309<valueblankcellmode> 309<valueblankrelop> 309<valueformat> 309<valuelocation> 309<varloadmode> 310<vectorplottype> 310<viewmode> 310<workspaceviewmode> 310
344
<xyaxis> 310
<xyaxis> 310
Numerics2D axes
settings 2342D draw order 3092D field plots 91
vector plots 1573D axes
attributes 230reset 209
3D plotsglobal attributes 154, 232
3D rotation 3083D vector plot attributes 155
AAction commands 63Active planes 304Active zones 63Add-on
loading 179Add-on commands
send to add-on 119Add-on style 299ALIGNINGCONTOURLABELS 136Alignment 306
axis 299ALLOWDATAPOINTSELECT 160ALLOWHWACCELERATION 165Alter data command 65Anchor 275
text 80Angle
rotate 3D 154, 212, 232Angle units 299Animate commands 68–77ANIMATESTREAKLINES macro command 251,
253Animation
contour levels 68frames 73IJK blanking 68IJK planes 70iso-surface 71line mappings 72slice 73stream markers 75streamtraces 75Time 75
zone 75, 76zones 76
Area style 276Arrays
for Python 328Arrowhead
angle 78attachment 78, 299size 78style 78, 299
ARROWHEADSIZES 84ATTACHINTEGRATIONRESULTS
macro command 251, 253AUTOREDRAWISACTIVE 160Auxiliary data 137
delete 109macro variables 19setting 213
Axes 237, 238, 276, 277, 2782D settings 2343D attributes 230adjust to center data 238adjust to nice fit 240adjust to nice view 240assign variables 196, 230, 234, 235attributes 275, 276, 277, 278, 295dependent mode 299fit to data 237grid area 276, 283grid areas 283gridlines 283in Sketch frame mode 218labels 286nice fit 238number 237, 238polar
attributes 196reset 209reset scale factors 210tick marks 295
attributes 295label formatting 295labels 295
title mode 299title position 299variables 231XY Line attributes assignments 248
Axis alignment 299
345
INDEX
BBack buffer
swap to front 111Backing store 299BACKINGSTOREMODE 160basicsizelist subcommand 279BEEPONFRAMEINTERRUPT 160Blanking 84, 86
animate 68IJK 84Value 309value 84
BOLDFACTOR 130Boundary condition 300Box type 300Break out command 88Buffer commands 110–111
CCACHELIGHTDISPLAYLISTSONLY 160CALCPARTICLEPATH macro command 251, 253CALCTURBULENCEFUNCTION
macro command 251, 257CALCULATE macro command 251, 258CALCULATEACCURACY macro command 251,
259Case of characters 19Cell labels 152Center
view 238Character sequence 300Circle
raw data 315Circular zone 96, 104Clipping 78Color
fill color 79flooding 281palette 306rgb 82text 80
Color map 88, 142, 300active 88, 89assignment value options 308color spectrum 142contour 280
override 280control 88, 300control commands 88–90control points 88, 89, 280
distribution 280, 300files 319gray scale output 291loading 180override 280, 281raw data 315raw user-defined 280reset to default 142RGB values 203standard 89user-defined 89write to file 245
Color palette 306Color text 81COLORMAPFILE 127Colors 78, 82, 300
assigning RGB values 291quickedit 307RGB 150, 291set command in macros 82shading 291zebra shading 298
Command Line 11Command parameters 17Conditional execute 242Conditional expressions 300Configuration
OpenGL 289Configuration file
SetValue macro commands 319Configuring dropdown menus 279Continue command 90Continue to execute a set of commands 242Contour
color map 280override 280zebra shading 298
line mode 300plot type 300
Contour color map 89Contour commands 90–95Contour labels 90, 144, 300Contour levels 94, 300
animate 68animation 68delete 93new 94raw data 315
Contour plotanimation 68
346
Control commands
attributes 123color map 89, 142global changes 143label 89, 90labels 144levels 68
add 92copy to another frame 248delete 93reset 94, 95
show 123variable 144
Control commandsIf...Endif 158, 313
Control points 88, 89contour color maps 280
Convenience functionsPython scripting 332–337
Coordinatesconvert polar to rectangular 197
Copy picked objects 190Current frame
attach text 80Curve details
write to file 246Curve equations
write 246Cut
delete picked objects 190Cutaway views
blanking 84
DData 160
adjust axes to fit 237, 238center in view 238fit to axis grid area 239read 204reading 307rotate 211rotating 19smooth 222
Data alteration 65Data extraction 120Data fit 239Data labels 152Data manipulation 65
polar to rectangular coordinates 197Data operations
zone number specification 67
Data pointmoving 160select 160
Data setattach to frame command 77naming 214variable 138write 246
Data set variablesset value (from macro variable) 214
Data sharingbranching connectivity 87branching variables 87connectivity 216field variables 216reference count 139
Data type 102, 301DATAFILEVARLOADMODE 127Debugging macro files 11Debugging macros 11Delay 108Delete
objects 190Delete picked objects 190Derivative position 301DERIVATIVEBOUNDARY 160Destination
map 112zone 168
Dialogdrop a Tecplot dialog 112
Displayrender 167
Display message 185, 186DISPLAYBOUNDARIES
macro command 251, 260DOAUTOFNAMEEXTENSION 127Double 303Double buffer
compound functions 110turning off 110turning on 111
Double expression 303Draw order 309
Line mappings 217sort level 154, 232
Dropdown menus 279Duplicate zones 113Dura labels
labeling node 305
347
INDEX
EEdge attributes 124Edge plot
show 123Edge setting 303Edit
global edit on picked objects 190Ellipse
raw data 315ENABLEDELAYS 163ENABLEINTERRUPTS 163ENABLEPAUSES 163ENABLEWARNINGS 163Encapsulated PostScript
preview image 303EndLoop command 180Environment variables 22EQUATIONFILE 127Equations 66Error bars
plot types 303Examples
2D axes attributes 196, 2353D axis attributes 231activating field zones for plotting 63Adding contour levels 92adding Line maps 64adding zones to the set of active zones 63assigning attributes for field plots 126assigning axes attributes 277assigning control point for small rainbow color
map 143assigning the medium line pattern length 84attributes applied to all frames 147attributes for default geometry 107attributes for exporting image files 118axis grid area borders 276, 283axis gridlines settings 284axis modes 219axis tick mark attributes 296axis tick mark labels 295basic size values 279circle raw data 316color map control points 280contour attributes 146contour levels raw data 317Create a new zone for each contour line on an
existing contour plot. 97Creating mirror zones 100Deleting contour levels 93
edit picked objects 182, 193inverse distance interpolation 169Line legend and data labels 148line mappings attributes 177line plot layers on or off 178line segment geometry raw data 316macro function file 12making Line maps active for plotting 64making line maps active for plotting 64making zones active for plotting 63mapping monochrome hardcopy output 292paper characteristics 183paper size dimensions 287path information 129pick all in rectangle 189positioning frame on the paper 134Preplot launch command 106print attributes 199rectangle settings 288removing Line maps 64removing zones from the set of active zones 64RGB values raw data 317set parameters for dynamic frame attributes 136setting (X,Y) positions 297setting (X,Y,Z) triplets 298setting 3D global attributes 155setting attributes of 2D vector plots 158setting attributes of 3D vector plots 156setting attributes of default font 108setting attributes of Tecplot interface 168setting character spacing and sizing for fonts 130setting color map overrides 281setting color values 291setting grid area borders 276, 283setting I- J- and K-indices 284setting IJK blankings 86setting numbers formats 286setting reference scatter symbols attributes 289setting scatter attributes 153setting some Tecplot limits 173setting symbol shapes 293setting text shapes 294setting the red, green, and blue components 83text box 294turning on scatter layers 123Using value-blankings 86XY Line axis attributes 249zebra shading attributes 298
Examples of macros 259, 264Exit command 203
348
Export 116
Export 116image
attributes 117Exporting
layout to paper or file 197Exporting images
file types 303formats 303
Expression 303EXTENDEDCOMMAND macro 251Extract
3D slice 103isosurfaces 99
EXTRACTFLOWFEATUREmacro command 252, 261
EXTRAPOLATESOLUTIONmacro command 252, 261
Eye distance 213
FFE boundary 98FE surfaces 99Field plots 123
contour attributes 143plot layers 122scatter attributes 152
Field valuesetting 214
Field variable query 138Fieldmaps
set active zones command 63specify 63
Fileopen data set 204open layout 182save data set 246save layout 212
File nameprompt for 200
File names 121, 122File paths
configuration 126Finite-element
create FE-surface zones 99Finite-element data
zone boundary creation 98First line of macro file 17Flooded contour plots 300FNAMEFILTER 127Font 108, 304
Fonts 80spacing 129
Formatsin macro variables 25
Formatting numbers 285FORTRAN-like equations 65Frame
attach data 77attach to data set command 77delete 130, 184invisible borders 167layout 132order 132text (attach) 80view last 239
Frame control commands 130–133, 184–??Frame coordinates 301Frame manipulating 304Frame modes 227, 304Frame style
attributes 216FRAMEHEADERFORMAT 147FRAMEHEADERHEIGHT 147Frames 77, 131
create 100delete active frame 130, 184dynamic attributes 135fit all into workspace view 243fit frames to paper 131, 184fit selected frames in view 243get name 138number of frames 21pop 131push 133setting global attributes 146, 147
Frames with pick handles 244FRAMETEXTSIZES 84
GGeometries
copy to another frame 248default attributes 107
Geometryattach command 78attach to frame 78attributes 107color 78defaults 107extract data 120
Geometry attributes 78
349
INDEX
Geometry raw data 315Geometry type 79, 304
circle 304ellipse 304rectangle 304square 304
Global attributes 142–149Global edit
on picked objects 190Graphics
turn drawing on or off 111Gray scale output 291Grid
precise dot 287Grid area 283Grid area border 276, 283Grid area example 288Grid coordinates 301Grid lines 283gridarea subcommand 283gridlinedetail subcommand 283Gridlines 283
II-, J-, or K-indices
setting 284If command 158IJK Blanking 86IJK blanking 84
animation 68blanking domain 304
IJK index 284ijk subcommand 284IJK-indices
minimum/maximum as variables 20IJK-planes
animation 70Image
export 116attributes 117
Image style 304IMAGERENDERING 165Import Modules 323Index ranges 285
setting 285indexrange subcommand 285Infinite
see LoopInitial dialog placement 282INITIAL3DSCALE 136
initialdialogplacement subcommand 282INITIALPLOTFIRSTZONEONLY 163INPUTDATAFILE 127INPUTLAYOUTFILE 127Integer 304INTEGRATE macro command 252, 262Interface
Data 160launch dialog 172render 167set attributes 159
Internal macro variables 23INTERPNPOINTS 160Interpolation
inverse distance method 168kriging 171linear method 174pointer selection 307
INTERPPTSELECTION 160INTERRUPTCHECKINGFREQUENCY 164Intrinsic values 305INVDISTEXPONENT 160INVDISTMINRADIUS 160Inverse distance interpolation 168I-ordered zones 234ISFILLED 79Iso-surface
animate 71Iso-surfaces 169Isosurfaces
zone creation 99
JJacobian
macro example 259
KKrig drift 305KRIGDRIFT 160Kriging 171Kriging Drift 303KRIGRANGE 160KRIGZEROVALUE 160
LLabel
contour 89Labels
tick marks 295LARGESTEP 166, 167
350
Layout
Layoutclear 181new 181printing to paper or file 197saving 212
Layout filesmacro control commands 319
Layoutsattach data set of another frame 77opening 182
Light source shading 154, 232change settings 142
Lighting effects 305Limitations 319Limits
set in Tecplot 173Line mappings 64, 72, 112
animation 72attributes 174create 99delete 109draw order 217duplicate 112number of line mappings 21set active mappings command 64shift to bottom of list 217shift to top of list 217write coefficients 246write curve information 246
line mappingsshow symbols 178
Line mapsactivate 64attributes 319defaults 319see Line mappings 109specify 64
Line pattern 79Line patterns 305Line plot layers 178Line plots 73
setting global attributes 147show lines 178
Line spacetext 81
Line thickness 79Linear interpolation 174
action on outside points 305LINEARINTERPCONST 160LINEARINTERPMODE 160
LINEPATLENGTHS 84Lines
line plots 178LINETHICKNESSES 84Load data 204Loading your own macro function file 12Log axes 300Loop
See also InfiniteLoop command 180
MMacro command summary 27Macro command syntax 17Macro commands 10, 11, 17
ANIMATESTREAKLINES 251, 253ATTACHINTEGRATIONRESULTS 251, 253CALCPARTICLEPATH 251, 253CALCTURBULENCEFUNCTION 251, 257CALCULATE 251, 258CALCULATEACCURACY 251, 259conditionally processing 158DISPLAYBOUNDARIES 251, 260EXTRACTFLOWFEATURE 252, 261EXTRAPOLATESOLUTION 252, 261INTEGRATE 252, 262macro variables 19major 27SAVEINTEGRATIONRESULTS 252, 265SETFIELDVARIABLES 252, 265SETFLUIDPROPERTIES 252, 266SETGEOMETRYANDBOUNDARIES 252, 268SETREFERENCEANDFIELDVARIABLES 269SETREFERENCEVALUES 252SETUNSTEADYFLOWOPTIONS 252, 270spacing 18
Macro control commands 63allowed in stylesheets and layouts 319Break 88Continue 90Delay 108include macro 159Loop...Endloop 180pause 185, 186run macro function 212stop execution 185, 186system commands 229While...Endwhile 242
Macro definitions 12Macro files 17
351
INDEX
debugging 11first line 17nesting one file within another 159
Macro functionexecute 212
Macro function filesexample 12loading your own 12
Macro functions 11, 12definition 180retaining 11run command 24
Macro languagerestrictions and limitations 319
Macro Panel 12Macro panel 181
title 64Macro syntax
examples 313Macro variable
set field value 214values 23
Macro variablesassigning strings 23assigning value or string 235assigning values 23function 24get current frame name 138get field value 138name 23remove user-defined 208select variable (by name) 141strings 23using formats 25
Macro viewer 12MACROFILE 127Macros 10, 11, 12
debugging 11running from the command line 11running from the Quick Macro Panel 12running from the Tecplot interface 11
Macros vs. macro functions vs. macro commands 11
Magnificationset for view 241zoom 242
Magnify picked objects 193Major macro commands 27Managing Tecplot macros 11Mandatory parameters 17
Mappingsdelete 109duplicate 112
Mass calculation example 264Mass flux example 264Mass-weighted average example 264MAXCHRSINTEXTLABELS 173MAXCUSTOMCOLORSININTERFACE 164Maximum index 264Maximum values
as variables 20MAXNUMCONTOURLEVELS 173MAXPTSINALINE 173MEDIUMSTEP 166, 167Mesh attributes 124Mesh plot
show 123Mesh plots
plot types 306Message
display 185, 186Minimum values
as variables 21MINPIXELSFORDRAG 164Mirror zones
create 100Modern color maps 142Modifiers
command-specific 17Modules
Python import 323Monochrome hardcopy 291Mouse button assignments 299Mouse mode
set for picking 194Mouse pointer 307Move picked objects 194Movie files 68, 70, 71, 73, 74, 75, 76, 77
NName
get frame name 138Negative values 66, 264NULL Pointers 328Number format 285Number formats 309Number of cycles for animation 71, 74, 75Number of ellipse points 79number of zones 21numberformat subcommand 285
352
Numbers
Numbersformatting in macro variables 25
NUMPTSALLOWEDBEFOREAPPROX 165NUMSMOOTHPASSES 160NUMSTREAMRAKEPOINTS 136
OObject
size 83OKTOEXECUTESYSTEMCOMMAND 165Opaque types 330OpenGL
rendering settings 289OpenGL rendering 289OPENGLCONFIG 165Operating system
using as variable 21Operating system instructions 229Optional box settings 293Optional parameters 17Order frames 131Output
file configuration 126OUTPUTASCIIDATAFILE 127OUTPUTBINARYDATAFILE 127OUTPUTLAYOUTFILE 127OUTPUTLAYOUTPACKAGEFILE 127Overrides
color map 280
PPage
color 183set specifications 183show grid 183show ruler 183
Paper 287color 183fit within workspace view 243grid spacing 306set specifications 149, 183show grid 183show ruler 183size 149, 287
Paper ruler spacing 306Paper size 306papersize subcommand 287Parameter
assignment 17Parameter Assignment Values 299
Parameter assignment values 272Parameter assignments 17, 299Parameter subcommands 17, 275Parameters
data setup command 106for CFD Analyzer macro commands 252
Parameters for dynamic frame attributes 135Paste 193
from view paste buffer 240Paths
configuring for output 126Pattern length 79Pause macro execution 185, 186PERCENTAGEOFPOINTSTOKEEP 165Pick
copy picked objects 190delete picked objects 190global edit on picked objects 190magnify picked objects 193mouse mode set 194move picked objects 194object at given location 186objects in rectangle 188objects of type 187objects to delete 190paste picked objects from buffer 193pop picked objects 194push picked objects back 194
Pick commands 186–195PICKHANDLEWIDTH 166Planes
animate 70Plot Approximation 307Plot layers 122, 178
field plots 122Plot Type 307Plot Types
Vector 310PLOTAPPROXIMATIONMODE 166Plotting points 307Points
write to file 246Points to plot 307POINTTEXTSIZES 84Polar axes
attributes 196Polar coordinates
convert to rectangular 197Polyline
extracting data 121
353
INDEX
raw data 315Pop frame 131Pop frame at specified position 131Popping
picked objects 194Position
text example 294Precise dot grid 287precisegrid subcommand 287Preferences
basic color 82basic size 83show coordinates 159
PREPLOTARGS 106PRINTDEBUG 166Printers 307
rendering 307Printing
attributes 198to paper or file 197
Prompt commands 200–201Push
picked objects 194view stack 240
Push frames 133Push top frame to bottom 133Python scripting 322–??
arrays 328convenience functions 332–337import modules 323input types 325–331NULL pointers 328opaque types 330output types 331
QQuery dialogs 201Query functions 138–142Quick Edit
colors 307Quick Macro Panel 12, 181
title 64QUICKCOLORMODE 166Quit command 203
RRange Parameters 66, 264Raster Metafile 118Raw data 103, 122, 228
circle 316
color map 315contour level 315contour levels 317geometry 315line segment geometry 316RGB values 317section of macro commands 315square 316values 315XY 316XYZ 316
Raw User-Defined color maps 280RAWDATA
example 316, 317Read data 204rect subcommand 288Rectangle 288
raw data 316Rectangles 288
settings 288Rectangular zones
create 101Redraw 207Redraw All 208Reference scatter symbol 153
attributes 289Reference scatter symbols 289refscatsymbol subcommand 289Remove user-defined macro variable 208rendconfig subcommand 289Rendering
off-screen 167with OpenGL 289
Retaining macro function 11RGB 291
components 82rgb subcommand 291Rotate
2D plot 2113D plots 154, 211, 232
Rotate a 3D plotexample 19
ROTATIONdetails 166
Rotation 308axis 308origin location 308reset rotation origin 210
rotation origin 210Ruler 183, 306
354
RULERPADDING 166
RULERPADDING 166RULERTHICKNESS 166RUNDISPLAYLISTSAFTERBUILDING 165Running
macro function 24Running macros
from the command line 11from the Quick Macro Panel 12from the tecplot interface 11Tecplot 11
SSave
color map 245curve information 246data set 246stylesheet 247
SAVEINTEGRATIONRESULTSmacro command 252, 265
SCALE 166Scale factors
reset 210Scatter
legend 152, 169sizing by variable 152, 169
Scatter attributes 124Scatter plot
show 123Scatter plots 124
set global attributes 152Scatter symbol attributes 289Scatter symbols 289Scope of text 79Scratch data type 106SCRATCHDATAFIELDTYPE 106SCRBACKGROUNDCOLOR 166SCREENRENDERING 165Scripting
Python 322–??Select objects 186SETFIELDVARIABLES
macro command 252, 265SETFLUIDPROPERTIES
macro command 252, 266SETGEOMETRYANDBOUNDARIES
macro command 252, 268SETREFERENCEANDFIELDVARIABLES
macro command 269SETREFERENCEVALUES
macro command 252
Setting (X,Y) positions 297Setting (X,Y,Z) triplets 297Setting attributes
reference scatter symbols 289Setting color values 291Setting I-, J-, or K-indices 284Setting index ranges 285Setting number formats 285Setting symbol shapes 292Setting zebra shading attributes 298Settings
OpenGL rendering 289SETUNSTEADYFLOWOPTIONS
macro command 252, 270SetValue commands
in color map files 319macro configuration files 319
Shade attributes 125Shade maps 291shademap subcommand 291Shading 291Shift picked objects 194SHOWCONTINUOUSSTATUS 166SHOWCOORDINATES 166SHOWCOORDINATESWITHSELECTORADJUS
TOR 166SHOWFRAMEBORDERSWHENOFF 167-showpanel flag 12SHOWSTATUSLINE 167SHOWTEXTGEOMSINAPPROXVIEW 167SHOWWAITDIALOGS 167Simple zone
create 102Single angle brackets 275, 299Size 279
object 83paper 149preference 83set command in macros 83
Size limitationsmacro control commands 319
Size lists 279Size preferences 83Size units 308Sketch
axis 218Skip mode 308Slice
animate 73create slice zone command 103
355
INDEX
Slice source 308Slices 308
create zones 104global settings 219
Slicing 308Small Rainbow color maps 89SMALLSTEP 166, 167SMOOTHBNDRYCOND 160Smoothing
data 222SMOOTHWEIGHT 160SNAPTOGRID 147SNAPTOPAPER 147Source maps 112Source zones 97, 98, 99, 100Specify
fieldmaps 63line maps 64
Steps per cycle in animation 75STEPSIZE 166, 167Stipple 308Stop macro execution 185, 186Stream dashes
animation 75Stream markers
animation 75Streamtrace commands 223–229
add 225delete all 227delete range 227reset time increments 228set termination line 228
Streamtrace paths 75Streamtraces
animate 75animation
dashes or markers 75create zones 105delete all 227direction 308global settings 223type 308
Stringsassigning 23
STROKEFONTLINETHICKNESS 130STYLEFILE 128Stylesheet
read 207write to file 247
Stylesheets
macro control commands 319Subscript 129SUBSUPFRACTION 130SunRaster format options 309Superscript 129Surface Effects 124Surfaces to plot 309Symbol shape 292, 304Symbol shapes
setting 292Symbols
line plots 178symbolshape subcommand 292SYMBOLSIZES 84Syntax
example macros 313for CFD Analyzer macro commands 252
System command instructions 229System environment variables 22
TTECHOME
using as variable 22Tecplot
starting 7Tecplot Interface 11Tecplot interface
set attributes 159Tecplot macro 10tecplot.mcr 12TEMPFILEPATH 128Text 293
anchor 80, 309angle 80attach command 80attributes 80, 108box 80centering 82character height 294color 80copy to another frame 248default 108defaults 108display 185, 186fonts 80, 294, 304frame 80height 294label box 293label details 295line spacing 81
356
Text box 80
prompt for 201setting font and position 294setting fonts 294shape 294spacing 129subscript 129superscript 129text box 80thickness 294zone (attach) 80
Text box 80Text boxes 293, 309Text shape 81Textbox 80textbox subcommand 293textshape subcommand 294Tick marks 295
attributes 295axis 295directions 309label formatting 295labels 295setting attributes 296
ticklabeldetail subcommand 295TICKLENGTHS 84Tickmark labels
alignment 305tickmarkdetail subcommand 295TIFF byte order 309Time
Animation 75Title
data set 214Transform
coordinates 232polar to rectangular coordinates 197
Translateview 241workspace view 244
Translate picked objects 194TRANSLATION 167Translucency 309TRIANGLEKEEPFACTOR 160
UUndo
view only 239UNIXHELPBROWSERCMD 167USEAPPROXIMATEPLOTS 167USEDISPLAYLISTS 167
USEDOUBLEBUFFERING 167User input dialogs 200, 201User interface
launch dialog 172set attributes 159
User-defined variables 23USETECPLOTPRINTDRIVERS 168
VValue blanking 84, 309
cell mode 309Values
display 152, 153macro variables 19set field value 214
Variable lists 179Variables
3D axis 231assign to 2D axis 196, 234, 235assign to 3D axes 230assigning values 235contours 144environment 22initializing 235internal 19location 140macro functions 24remove user-defined macro variable 208renaming 208scatter symbol sizing 152, 169variable number 141vector 156, 158
VECTDEFLEN 136VECTMINLEN 136Vector plot
attributes 155Vector plots 310
variables 156vector format 125
Vector variables 158minimum/maximum as variables 21
Vectorslength reset 210reference vector 155, 157
Vectors plotshow 123
Vertical bars (’|’s) 19View
axis fit 237axis nice fit 238
357
INDEX
center 238copy 239data fit 239fit 239fit all frames 243fit paper in workspace 243fit selected frames 243last 239magnify 241maximize 245maximize workspace view 244nice fit 240paste 240return to last view 244rotate 211shift workspace 244translate 241zoom workspace 245
View commands 236–242, 243–245View compound function family 236View mode 310View stack 240
retrieve last view 239Viewer/Debugger 10volume attributes 125Volume objects 296Volume surfaces
create FE surfaces 99VOLUMEMODE 125volumeobjectstoplot subcommand 296
WWhile command 242Workspace
color map dialog 88frame 130view 244
translate 244unmaximize 245
view mode 310Workspace commands 243–245Write
color map 245data set 246stylesheet 247
XX-axis gridlines 284XORCOLOR 168XY
raw data 316XY Line axes attributes
assign 248XY line plots
coordinate scale 300curve information 301curve type 301error bars 303
XY mappingfunction dependency 304
xy subcommand 297XY vectors 297XYZ
raw data 316vectors 297
xyz subcommand 297
ZZ-clip 154, 232Zebra shading 298
attributes 298zebrashade subcommand 298Zone
animation 75, 76attach geometry 78attributes 123
Zone boundariesfinite-element data 98for finite element data 98
Zone numbersspecify 67
Zones 21, 79animate 75, 76attributes 319concatenate 106create 96–??, 96–??, 104–106create isozones command 99create mirrors 100create rectangular 101defaults 319delete 110duplicate 113FE surface 99new 102
streamtraces 104renaming 209specify number 67triangulate 234
Zoompicked objects 193
358
Zoom
view 242workspace view 245
359
INDEX
360