Embed Size (px)
Citation preview

All dollar amounts expressed in this news release are in Canadian dollars unless otherwise noted.
Reference: Fraser Phillips, Senior Vice President, Investor Relations and Strategic Analysis 604.699.4621
Marcia Smith, Senior Vice President, Sustainability and External Affairs 604.699.4616
Additional corporate information is available at www.teck.com
For Immediate Release 18-28-TR
Date: July 25, 2018
TECK REPORTS UNAUDITED SECOND QUARTER RESULTS FOR 2018 Vancouver, BC – Teck Resources Limited (TSX: TECK.A and TECK.B, NYSE: TECK) (“Teck”) reported adjusted profit attributable to shareholders of $653 million ($1.14 per share) in the second quarter compared with $580 million ($1.00 per share) in 2017. “Our results for the second quarter were strong, with adjusted profit of $653 million and adjusted EBITDA of $1.4 billion,” said Don Lindsay, President and CEO. “Our operations continued to perform well, Fort Hills achieved commercial production in the quarter and is now ramping up to full capacity.” Highlights and Significant Items
Profit attributable to shareholders was $634 million ($1.10 per share) in the second quarter compared with $580 million ($1.00 per share) a year ago. Adjusted profit was $653 million ($1.14 per share) in the second quarter compared with $580 million ($1.00 per share) in the second quarter of last year.
EBITDA was $1.4 billion in the second quarter compared with $1.3 billion in the second quarter of 2017.
Gross profit was $1.2 billion in the second quarter compared with $1.1 billion a year ago. Gross profit before depreciation and amortization was $1.6 billion in the second quarter compared with $1.4 billion in the second quarter of 2017.
At Fort Hills, commissioning is now complete and production is expected to ramp up to full capacity by the beginning of the fourth quarter of 2018. Systems relating to all three trains are running well and plant start-up has exceeded expectations. We have included results from operations in our earnings from June 1.
Steelmaking coal orders from customers were in place to exceed our sales guidance of 6.7 million tonnes, however, sales volumes of steelmaking coal were negatively affected due to strike preparations at CP Rail’s operations. There were two such events during the second quarter and the strike was resolved, but sales were affected as port stocks remained low.
We continued to progress engineering work on the Quebrada Blanca Phase 2 project in anticipation of approval of the SEIA for the project and a development decision in the fourth quarter. A decision to proceed with development will be contingent upon regulatory
+1 604 699 4000 Tel
+1 604 699 4750 Fax
www.teck.com
Teck Resources Limited
Suite 3300, 550 Burrard Street
Vancouver, BC Canada V6C 0B3

2 Teck Resources Limited 2018 Second Quarter News Release
approvals and market conditions, among other considerations, and we are currently exploring various potential financing alternatives for the project. We will shortly launch a process to seek an additional partner for Quebrada Blanca Phase 2. Our objective is to ultimately hold a 60 — 70% interest in the project and a transaction would most likely be announced in the fourth quarter.
The British Columbia Utilities Commission (BCUC) has approved the $1.2 billion sale of our two-thirds interest in the Waneta Dam to BC Hydro. We expect closing of the sale to occur on July 26, 2018.
Our liquidity remains strong at over $5.6 billion inclusive of $1.7 billion in cash at July 25, 2018 and US$3.0 billion of undrawn, committed credit facilities. On completion of the Waneta transaction, we will have $2.9 billion in cash and liquidity of $6.8 billion. In addition, we only have US$220 million of debt due before 2022.
Antamina achieved record zinc production of 126,500 tonnes in the second quarter, exceeding the previous record by 24,200 tonnes.
Strong mining performance from our steelmaking coal operations contributed towards record material movement for the business unit in the first half of the year, providing operational flexibility going forward.
We have updated our guidance for certain production items, unit costs, capital expenditures and our annualized commodity price and foreign exchange rate sensitivities. Further details are located in our Guidance and Outlook sections.
We were named to the Best 50 Corporate Citizens of Canada for the twelfth consecutive year by media and investment company, Corporate Knights.
We announced on July 25 that we will pay an eligible dividend of $0.05 per share on our outstanding Class A common shares and Class B subordinate voting shares on September 28, 2018, to shareholders of record at the close of business on September 14, 2018.

3 Teck Resources Limited 2018 Second Quarter News Release
This management’s discussion and analysis is dated as at July 25, 2018 and should be read in conjunction with the unaudited condensed interim consolidated financial statements of Teck Resources Limited (“Teck”) and the notes thereto for the three and six months ended June 30, 2018 and with the audited consolidated financial statements of Teck and the notes thereto for the year ended December 31, 2017. In this news release, unless the context otherwise dictates, a reference to “the company” or “us,” “we” or “our” refers to Teck and its subsidiaries. Additional information, including our Annual Information Form and Management’s Discussion and Analysis for the year ended December 31, 2017, is available on SEDAR at www.sedar.com. This document contains forward-looking statements. Please refer to the cautionary language under the heading “CAUTIONARY STATEMENT ON FORWARD-LOOKING INFORMATION.”
Overview Prices for our principal products were strong in the second quarter and higher than a year ago, however, following the end of the quarter there has been significant weakness in commodity prices and market uncertainty. In the second quarter steelmaking coal prices rose 10% from a year ago and averaged US$183 per tonne, copper prices averaged US$3.12 per pound, up 21% from a year ago, while zinc prices rose 20% from a year ago and averaged US$1.41 per pound. As result of the favorable prices, partially offset by a stronger Canadian dollar, we recorded higher gross profits of $1.2 billion and EBITDA of $1.4 billion in the second quarter compared with $1.1 billion and $1.3 billion, respectively, in the second quarter a year ago. Oil markets continued to strengthen in the second quarter, with prices trending higher. Western Canadian Select (WCS) averaged US$49 per barrel in the second quarter, up US$12 from a year ago and up US$10 from the first quarter of this year. In May, the commissioning of the Fort Hills oil sands mining and processing operations was completed. The production volumes and product quality have exceeded expectations during start-up and production is expected to reach full capacity by the beginning of the fourth quarter of 2018, three months earlier than previously expected. While plant performance has exceeded expectations, unusually wet weather and resulting soft ground conditions have affected mine production in June and July. However, due to the strong start-up and commissioning, we now expect our production to be 8.5 million to 10 million barrels of bitumen and operating costs to be $28.50 to $32.50 per barrel for the year, versus 7.5 — 9.0 million barrels and $35.00 to $40.00 per barrel previously. With the completion of our Fort Hills project, our strong financial position and favourable demand for our key products, we are well positioned for ongoing profitability and strong cash flows. However, recent uncertainty in global markets and the associated effect on commodity prices could affect our results going forward.

4 Teck Resources Limited 2018 Second Quarter News Release
Profit and Adjusted Profit1
Profit attributable to shareholders in the second quarter was $634 million, or $1.10 per share, compared with $580 million, or $1.00 per share, in the same period a year ago. Adjusted profit attributable to shareholders, taking into account the items identified in the table below, was $653 million, or $1.14 per share, compared with $580 million, or $1.00 per share, in the second quarter last year.
The increase in our adjusted profit in the second quarter compared with a year ago was primarily attributable to substantially higher prices for our principal products. This was partly offset by higher unit costs in our steelmaking coal business unit, which was primarily attributable to higher diesel costs and our efforts to capture margin in the favourable steelmaking coal price environment. In addition, a stronger Canadian dollar in the second quarter compared with a year ago negatively affected our profit in the period. Profit and Adjusted Profit
Three months ended June 30,
Six months ended June 30,
(CAD$ in millions) 2018 2017 2018 2017
Profit attributable to shareholders $ 634 $ 580 $ 1,393 $ 1,136
Add (deduct):
Debt repurchase losses – 27 – 159
Debt prepayment option loss (gain) 15 (17) 24 (33)
Asset sales and provisions 3 (1) 3 (9)
Foreign exchange loss (gains) 1 (9) 1 (19)
Collective agreement charges – – – 1
Other – – (15) –
Adjusted profit $ 653 $ 580 $ 1,406 $ 1,235
Adjusted basic earnings per share1 $ 1.14 $ 1.00 $ 2.45 $ 2.14
Adjusted diluted earnings per share1 $ 1.12 $ 0.99 $ 2.41 $ 2.11
In addition to the items identified in the table above, our results include gains and losses due to changes in market prices and interest rates in respect of pricing adjustments, commodity derivatives, share-based compensation and changes in the discounted value of decommissioning and restoration costs at closed mines. Taken together, these items resulted in $38 million of after-tax losses ($53 million before tax) in the second quarter, or $0.07 per share. We do not adjust our reported profit for these items as they occur on a regular basis. Note: 1) Non-GAAP financial measure. See “Use of Non-GAAP Financial Measures” section for further information.

5 Teck Resources Limited 2018 Second Quarter News Release
FINANCIAL OVERVIEW Three months
ended June 30, Six months
ended June 30,
(CAD$ in millions, except per share data) 2018 2017 2018 2017
Revenues and profit
Revenues $ 3,016 $ 2,832 $ 6,108 $ 5,679
Gross profit before depreciation and amortization1 $ 1,594 $ 1,442 $ 3,304 $ 2,951
Gross profit $ 1,241 $ 1,073 $ 2,601 $ 2,236
EBITDA1 $ 1,403 $ 1,341 $ 2,958 $ 2,656
Profit attributable to shareholders $ 634 $ 580 $ 1,393 $ 1,136 Cash flow
Cash flow from operations $ 1,107 $ 1,408 $ 2,227 $ 2,701
Property, plant and equipment expenditures $ 345 $ 329 $ 805 $ 685
Capitalized stripping costs $ 175 $ 173 $ 372 $ 325
Investments $ 119 $ 32 $ 150 $ 71 Balance Sheet
Cash balances $ 1,631 $ 846
Total assets $ 38,634 $ 34,898
Debt, including current portion $ 6,619 $ 6,385 Per share amounts
Profit attributable to shareholders $ 1.10 $ 1.00 $ 2.43 $ 1.97
Dividends declared $ 0.05 $ 0.10 $ 0.10 $ 0.10 PRODUCTION, SALES AND PRICES Production (000’s tonnes, except steelmaking coal and bitumen)
Steelmaking coal (million tonnes) 6.3 6.8 12.5 12.9
Copper2 75 70 149 134
Zinc in concentrate 188 158 336 304
Zinc — refined 75 74 154 152
Bitumen (million barrels)3 0.7 – 0.7 – Sales (000’s tonnes, except steelmaking coal and blended bitumen)
Steelmaking coal (million tonnes) 6.6 7.1 12.7 12.8
Copper2 74 69 151 133
Zinc in concentrate 115 113 255 246
Zinc — refined 77 74 154 150
Blended bitumen (million barrels)3 1.2 – 1.2 – Average prices and exchange rates
Steelmaking coal (realized US$/tonne) $ 183 $ 167 $ 194 $ 187
Copper (LME cash — US$/pound) $ 3.12 $ 2.57 $ 3.14 $ 2.61
Zinc (LME cash — US$/ pound) $ 1.41 $ 1.18 $ 1.48 $ 1.22
Blended bitumen (realized US$/barrel)3 $ 53.32 $ – $ 53.32 $ –
Average exchange rate (C$ per US$1.00) $ 1.29 $ 1.35 $ 1.28 $ 1.33
Notes: 1) Non-GAAP financial measure. See “Use of Non-GAAP Financial Measures” section for further information.
2) We include 100% of production and sales from our Quebrada Blanca and Carmen de Andacollo mines in our production and sales volumes, even though we own 90% (effective April 2018) and 90%, respectively, of these operations, because we fully consolidate their results in our financial statements. We include 22.5% and 21.31% of production and sales from Antamina and Fort Hills, respectively, representing our proportionate ownership interest in these operations.
3) Production volumes, sales volumes and realized prices for bitumen are from June 1, 2018.

6 Teck Resources Limited 2018 Second Quarter News Release
BUSINESS UNIT RESULTS
Our revenues, gross profit before depreciation and amortization, and gross profit by business unit are summarized in the table below.
Three months
ended June 30, Six months
ended June 30,
(CAD$ in millions) 2018 2017 2018 2017
Revenues
Steelmaking coal $ 1,582 $ 1,610 $ 3,170 $ 3,229
Copper 731 562 1,470 1,075
Zinc 625 660 1,390 1,375
Energy1 78 – 78 –
Total $ 3,016 $ 2,832 $ 6,108 $ 5,679
Gross profit, before depreciation and amortization2
Steelmaking coal $ 957 $ 993 $ 1,960 $ 2,102
Copper 390 253 805 448
Zinc 234 196 526 401
Energy1 13 – 13 –
Total $ 1,594 $ 1,442 $ 3,304 $ 2,951
Gross profit
Steelmaking coal $ 771 $ 801 $ 1,587 $ 1,764
Copper 275 119 568 155
Zinc 194 153 445 317
Energy1 1 – 1 –
Total $ 1,241 $ 1,073 $ 2,601 $ 2,236
Gross profit margins before depreciation2
Steelmaking coal 60% 62% 62% 65%
Copper 53% 45% 55% 42%
Zinc 37% 30% 38% 29%
Energy1 17% – 17% –
Note: 1) Energy results are effective from June 1, 2018. 2) Non-GAAP financial measure. See “Use of Non-GAAP Financial Measures” section for further information.

7 Teck Resources Limited 2018 Second Quarter News Release
STEELMAKING COAL BUSINESS UNIT
Three months
ended June 30, Six months
ended June 30,
(CAD$ in millions) 2018 2017 2018 2017
Steelmaking coal price (realized US$/tonne) $ 183 $ 167 $ 194 $ 187
Steelmaking coal price (realized CAD$/tonne) $ 236 $ 226 $ 248 $ 251
Production (million tonnes) 6.3 6.8 12.5 12.9
Sales (million tonnes) 6.6 7.1 12.7 12.8
Gross profit, before depreciation and amortization1 $ 957 $ 993 $ 1,960 $ 2,102
Gross profit $ 771 $ 801 $ 1,587 $ 1,764
Property, plant and equipment expenditures $ 48 $ 10 $ 146 $ 61 Note: 1) Non-GAAP financial measure. See “Use of Non-GAAP Financial Measures” section for further information.
Performance Gross profit in the second quarter from our steelmaking coal business unit was $771 million compared with $801 million a year ago. Despite higher realized steelmaking coal prices, gross profit before depreciation and amortization in the second quarter declined by $36 million from a year ago (see table below) due to lower sales volumes and higher operating costs. Second quarter sales of 6.6 million tonnes were 7% lower than a year ago, as port inventories remained low and sales volumes were negatively affected by lost rail capacity, estimated at approximately 300,000 tonnes. The lost tonnes were a result of strike preparation at CP Rail’s operations on two occasions in mid-April and late-May. The table below summarizes the gross profit changes, before depreciation and amortization, in our steelmaking coal business unit for the quarter:
(CAD$ in millions) Three months
ended June 30,
As reported in second quarter of 2017 $ 993
Increase (decrease):
Steelmaking coal price realized 132
Sales volumes (58)
Unit operating and transportation costs (45)
Foreign exchange (65)
Net decrease (36)
As reported in current quarter $ 957
Property, plant and equipment expenditures totaled $48 million in the second quarter, of which $23 million was for sustaining capital. Capitalized stripping costs were $130 million in the second quarter compared with $132 million a year ago, as we continue development in recently permitted areas.

8 Teck Resources Limited 2018 Second Quarter News Release
Markets The second quarter price index for steelmaking coal sold under quarterly contracts was US$197 per tonne. Global steel production and demand for seaborne steelmaking coal remained strong through the first half of 2018. Factors affecting the market included strong steel pricing and demand in China, as well as ongoing closure of excess capacity, robust steel production and pricing in the rest of the world due to synchronized global growth and reduced steel exports from China. Depletion and reduced production of some Eastern European coal mines continued to increase demand for seaborne steelmaking coal for European steel mills. In addition, continuing logistics and production issues constrained coal supply and this also supported the coal market. While demand for steelmaking coal remains strong, government policy and trade war uncertainty has created price volatility and placed downward pressure on steelmaking coal prices, which we believe contributed to the decline in prices subsequent to the end of the second quarter. Operations Second quarter production was 6.3 million tonnes, 6% lower compared to the same period a year ago. This was largely the result of declining production at Coal Mountain Operations as the operation reaches the end of its mine reserve. Coal Mountain Operations will process its last mined coal in the third quarter. We have continued to haul raw coal from Elkview Operations to Coal Mountain Operations for processing to make up the lost production relating to the pressure event that occurred at Elkview Operations in January. As disclosed in the first quarter, the coal dryer at Elkview Operations has been recommissioned and returned to full production. The business unit achieved total material movement in the second quarter of approximately 77 million bank cubic metres of material, a 3% increase over the same quarter a year ago. Equipment utilization and productivities have returned to historical high performance levels, resulting in more total material moved than in the second quarter of last year when operating rates were challenged by above average employee turnover. Supplemental mining capacity provided by leased haul trucks and contract mining have further contributed towards record second quarter material movement at three operations, and record material movement for the coal business unit for the first half of 2018. Overall, this has led to an increase in raw coal inventories and restoring operational flexibility going forward. Cost of Sales Site cost of sales in the second quarter were $59 per tonne compared with $53 per tonne a year ago, which is within our annual guidance range of $56 to $60 per tonne. As anticipated, the decision to increase mining activity in contract mining, equipment rentals and labour resulted in higher costs, but will result in additional production to capture margin. In addition, diesel costs increased, predominantly as a result of higher prices. All of these factors, combined with longer haul distances and increased activity on mobile maintenance in the second quarter compared with a year prior, has increased the unit cost per tonne. This was anticipated when we set our 2018 guidance. Second quarter transportation costs of $36 per tonne were 6% higher compared to the same period a year ago with an increase in rail fuel surcharges due to higher diesel prices. In the first

9 Teck Resources Limited 2018 Second Quarter News Release
quarter, we experienced additional vessel demurrage costs primarily attributable to the poor performance at Westshore Terminals. As a result, we are expecting full year transportation costs to be at the high end of annual guidance of $35 to $37 per tonne. The tables below report the components of our unit costs in Canadian and equivalent U.S. dollars.
Three months
ended June 30, Six months
ended June 30,
(amounts reported in CAD$ per tonne) 2018 2017 2018 2017
Site cost of sales $ 59 $ 53 $ 58 $ 54
Transportation costs 36 34 37 34
Unit costs1 $ 95 $ 87 $ 95 $ 88
Three months
ended June 30, Six months
ended June 30,
(amounts reported in US$ per tonne) 2018 2017 2018 2017
Site cost of sales $ 45 $ 39 $ 46 $ 41
Transportation costs 28 26 29 25
Unit costs1 $ 73 $ 65 $ 75 $ 66 Notes: 1) Non-GAAP financial measure. See “Use of Non-GAAP Financial Measures” section for further information. Unit costs do not
include deferred stripping or capital expenditures.
Our total cost of sales for the quarter also included an $11 per tonne charge for the amortization of capitalized stripping costs and $17 per tonne for other depreciation. Outlook Our annual steelmaking coal production guidance of 26 to 27 million tonnes remains unchanged, but currently expect it to be near the lower end of the range. As in prior years, annual production volumes can be adjusted to reflect market demand for our products, subject to adequate rail and port service. The business unit continues to evaluate raw coal processing opportunities by capturing the latent production capacity of Elk Valley processing plants. A portion of Elkview Operations’ raw coal inventory is currently being processed at Coal Mountain Operations. We are expecting sales volumes in the third quarter of 2018 to be approximately 6.8 million tonnes, subject to our logistics chain performance. While demand for steelmaking coal remains strong, the risk and uncertainty of a trade war could affect sales and pricing levels. Strong operating performance in the mines and changes in our mine sequence has resulted in an increase to capitalized stripping costs to approximately $470 million, above the original guidance of $390 million. High productivities and solid performance in the mines has led to an increase in raw coal inventory, blending options and operational flexibility that will enhance the business unit’s ability to meet production targets.

10 Teck Resources Limited 2018 Second Quarter News Release
We plan to invest approximately $12 million to complete and evaluate the MacKenzie Redcap detailed design study. MacKenzie Redcap development is expected to supply approximately 1.4 million tonnes of steelmaking coal production per year and has the potential to extend Cardinal River Operations for approximately nine years beyond the planned closure in 2020. Beyond 2020, that additional tonnage would be additive to the current planned production capacity of 27 million tonnes in the Elk Valley. Elk Valley Water Management Update We continue to implement the water quality management measures required by the Elk Valley Water Quality Plan (the Plan), which was approved in the fourth quarter of 2014 by the B.C. Minister of Environment. The Plan establishes short, medium and long-term water quality targets for selenium, nitrate, sulphate and cadmium to protect the environment and human health, as well as a plan to manage calcite formation. We expect that in order to maintain acceptable water quality, some form of water treatment will be required for an indefinite period after mining operations end. The Plan contemplates additional water treatment and ongoing monitoring to ensure that the water quality targets set out in the Plan are in fact protective of the environment and human health and provides for adjustments if warranted by monitoring results. Capital spending on water treatment in 2018 is expected to be approximately $80 million. This will include engineering and construction of the new Fording River South Active Water Treatment Facility, which commenced in May, and completion of facility modifications and recommissioning of the West Line Creek Active Water Treatment Facility, expected in the fourth quarter. We are advancing R&D projects with the potential to significantly reduce capital and operating costs for water treatment. This includes a full-scale Saturated Rock Fill (SRF), which was commissioned in January 2018 and is successfully achieving near-complete removal of selenium and nitrate from mine-affected water. SRFs have the potential to replace or augment traditional treatment technology at approximately one-sixth the capital cost and half the ongoing operating cost. A recent letter by the U.S. Commissioners of the International Joint Commission (IJC) outlining concerns related to water quality is not reflective of the extensive research and data exchange between U.S. and Canadian stakeholders. Teck continues to work closely with U.S. and Canadian governments and stakeholders as we implement the Elk Valley Water Quality plan. To date, we have no indication of a referral to the IJC.

11 Teck Resources Limited 2018 Second Quarter News Release
COPPER BUSINESS UNIT
Three months
ended June 30, Six months
ended June 30,
(CAD$ in millions) 2018 2017 2018 2017
Copper price (realized — US$/pound) $ 3.14 $ 2.58 $ 3.15 $ 2.63
Production (000’s tonnes) 75 70 149 134
Sales (000’s tonnes) 74 69 151 133
Gross profit, before depreciation and amortization1 $ 390 $ 253 $ 805 $ 448
Gross profit $ 275 $ 119 $ 568 $ 155
Property, plant and equipment expenditures $ 133 $ 58 $ 231 $ 102 Note: 1) Non-GAAP financial measure. See “Use of Non-GAAP Financial Measures” section for further information.
Performance Gross profit from our copper business unit was $275 million in the second quarter compared with $119 million a year ago. Gross profit before depreciation and amortization increased by $137 million compared with a year ago (see table below). This was primarily due to higher realized prices and sales volumes of copper, zinc and molybdenum. Depreciation and amortization charges were $19 million lower than the second quarter a year ago primarily as a result of our asset impairment charge in respect of Quebrada Blanca recorded in the fourth quarter of 2017 and the extension of mine life until the fourth quarter of this year. Copper production in the second quarter increased by 7% from a year ago primarily due to higher ore grades and recoveries at Highland Valley Copper. Production in the first half of 2017 was affected by significantly lower grades, as expected in the mine plan, which have since recovered. Our cash unit costs before by-product credits in the second quarter increased by 5% to US$1.77 per pound compared to US$1.69 per pound during the same period a year ago. Significantly higher production of zinc and molybdenum combined with substantially higher zinc and molybdenum prices resulted in cash unit cost after by-product credits declining by US$0.05 per pound to US$1.21 per pound compared to US$1.26 per pound during the same period last year. The table below summarizes the changes in gross profit, before depreciation and amortization, in our copper business unit for the quarter:
(CAD$ in millions) Three months ended June 30,
As reported in the second quarter of 2017 $ 351 $ 253
Increase (decrease):
Copper price realized 118
Sales volumes 15
Co-product and by-product contribution 30
Unit operating costs (6)
Foreign exchange (20)
Net increase 137
As reported in current quarter $ 390

12 Teck Resources Limited 2018 Second Quarter News Release
Property, plant and equipment expenditures totaled $133 million, including $31 million for sustaining capital and $75 million for new mine development related to the Quebrada Blanca Phase 2 project. Capitalized stripping costs were $41 million in the second quarter, $6 million higher than a year ago. Markets London Metal Exchange (LME) copper prices in the second quarter of 2018 averaged US$3.12 per pound, up 21% from the same quarter a year ago. Copper prices reached a four-year high in June, at US$3.29 per pound, as the market perceived an improving outlook on Chinese demand. Prices rose through most of the second quarter before being negatively affected by uncertainty over the impacts on Chinese and global demand for commodities following the imposition of trade tariffs by the U.S. government on Chinese exports. Copper demand indicators in China in the first half of 2018 were supportive, however, some demand growth could be negatively affected as approvals for new solar projects and new subsidized housing construction have been suspended for the rest of 2018. In North America, GDP growth in the U.S. remains robust on the back of the construction sector. In Europe, the recovery in the economy that started in 2017 has continued into 2018 with construction, transportation and engineering sectors showing strength. Industrial activity still looks broadly supportive, however, recent concerns over trade talks and tariffs have increased downward pressure in commodities markets. Operations Highland Valley Copper Copper production was 27,700 tonnes in the second quarter, 6,600 tonnes higher than a year ago, primarily due to substantially higher grades and improved recoveries. Molybdenum production of 2.2 million pounds was similar to the same period a year ago. Copper and molybdenum ore grades and recoveries were higher than expected and similar to those experienced in the first quarter of 2018, as we adjusted plans to mine in higher-grade areas of the Valley pit due to short-term geotechnical considerations in the Lornex pit. Consistent with the original mine plan and currently available ore sources, copper and molybdenum grades are expected to decline in the second half of 2018 as we mine ore from lower-grade sections of the Lornex and Valley pits. Overall we have brought forward some higher grade ore from 2019, and as a result we have increased our 2018 copper production guidance to 100,000 to 105,000 tonnes compared to our prior guidance of 95,000 to 100,000 tonnes. Cost of sales were 21% higher than the same period last year primarily due to increased sales volumes, increased tailings dam lift construction and higher diesel prices. Unit operating costs were substantially lower than a year ago as a result of the significant increase in copper and molybdenum production. The $73 million project to install an additional ball mill to increase grinding circuit capacity is progressing on budget and on schedule with start-up anticipated in the third quarter of 2019. An autonomous haulage pilot is on track to have six trucks operational by the end of the year and after a successful trial of shovel-based ore sorting technology over the last six months, we are

13 Teck Resources Limited 2018 Second Quarter News Release
now planning to fully operationalize the technology with installations on the rest of the main shovel fleet.
Antamina Copper production in the second quarter was 10% lower than a year ago at 106,300 tonnes, primarily as a result of lower copper grades. Antamina processed less copper-only ore and more copper-zinc ore than during the same period last year. The mix of mill feed in the quarter was 53% copper-only ore and 47% copper-zinc ore, compared with 58% and 42%, respectively, a year ago. Zinc production increased 24% from last year to 126,500 tonnes, which is a new quarterly record, primarily due to increased processing of copper-zinc ores and higher grades. Operating costs in the second quarter were slightly higher than a year ago as higher prices for diesel and grinding supplies were partially offset by lower weather-related expenses compared to those required in 2017. Carmen de Andacollo Copper production in the second quarter of 16,000 tonnes was 6% lower than a year ago as the lower grades anticipated in the mine plan were partially offset by higher mill throughput. Operating costs were similar to a year ago as lower sales volumes and lower power rates offset higher maintenance costs due to the timing of major mill maintenance. Quebrada Blanca Since the first quarter of 2017, all supergene ore mined has been sent directly to the dump leach circuit. This has resulted in lower recovery and a longer leaching cycle at reduced operating costs compared to the previous operation of the heap leach circuit. Production in the second quarter increased by 29% from last year to 6,900 tonnes compared with 5,300 tonnes a year ago, primarily due to higher grades and increased production from secondary leaching. Mining of supergene ore was previously planned to be completed in the second quarter, but the mine plan has now been extended to October 2018. Cathode production will carry on into early 2020, as leaching of the dump material and secondary extraction continue. Operating costs were $3 million higher than a year ago, due to higher power and sulphuric acid consumption related to higher production levels. Depreciation and amortization charges decreased by $15 million compared with a year ago partly due to the asset impairment charge taken in the fourth quarter of 2017 and the extension of the mine life until the fourth quarter of 2018. We now expect 2018 copper cathode production at Quebrada Blanca to be 24,000 to 26,000 tonnes compared to our previous guidance of 20,000 to 24,000 tonnes. Cost of Sales
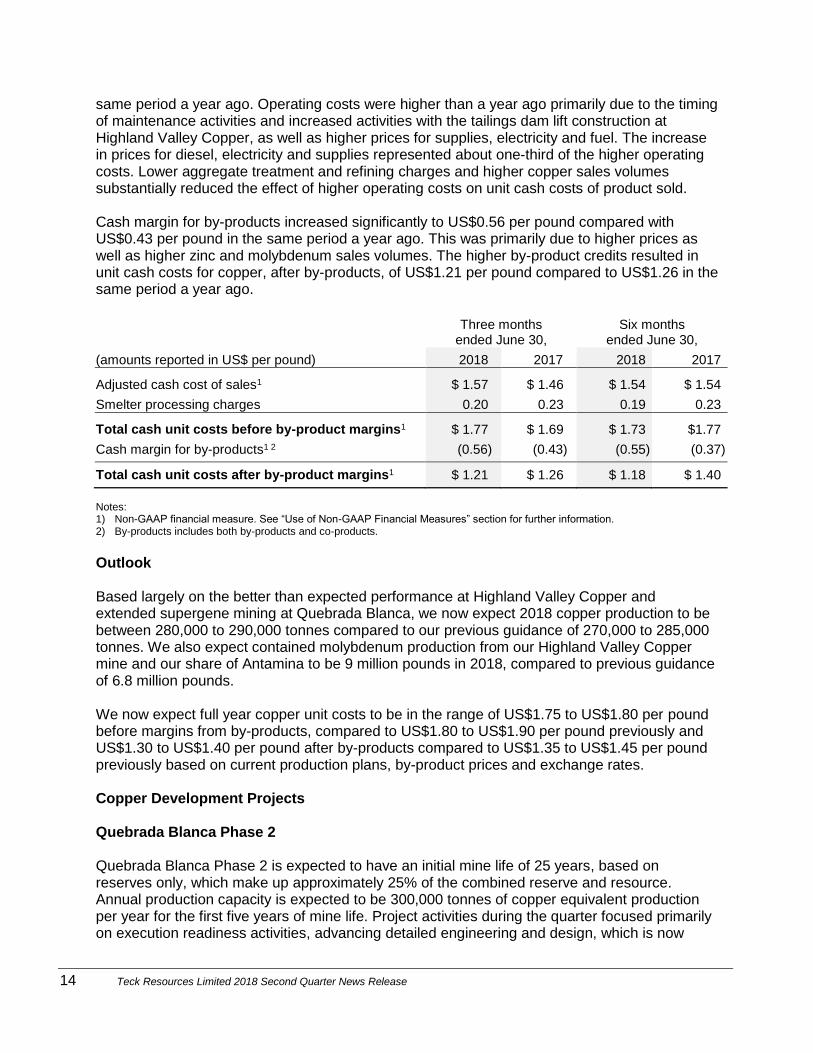
Unit cash costs of product sold in the second quarter of 2018 as reported in U.S. dollars, before cash margins for by-products, were US$1.77 per pound compared to US$1.69 per pound in the
14 Teck Resources Limited 2018 Second Quarter News Release
same period a year ago. Operating costs were higher than a year ago primarily due to the timing of maintenance activities and increased activities with the tailings dam lift construction at Highland Valley Copper, as well as higher prices for supplies, electricity and fuel. The increase in prices for diesel, electricity and supplies represented about one-third of the higher operating costs. Lower aggregate treatment and refining charges and higher copper sales volumes substantially reduced the effect of higher operating costs on unit cash costs of product sold. Cash margin for by-products increased significantly to US$0.56 per pound compared with US$0.43 per pound in the same period a year ago. This was primarily due to higher prices as well as higher zinc and molybdenum sales volumes. The higher by-product credits resulted in unit cash costs for copper, after by-products, of US$1.21 per pound compared to US$1.26 in the same period a year ago.
Three months
ended June 30, Six months
ended June 30,
(amounts reported in US$ per pound) 2018 2017 2018 2017
Adjusted cash cost of sales1 $ 1.57 $ 1.46 $ 1.54 $ 1.54
Smelter processing charges 0.20 0.23 0.19 0.23
Total cash unit costs before by-product margins1 $ 1.77 $ 1.69 $ 1.73 $1.77
Cash margin for by-products1 2 (0.56) (0.43) (0.55) (0.37) Total cash unit costs after by-product margins1 $ 1.21 $ 1.26 $ 1.18 $ 1.40 Notes: 1) Non-GAAP financial measure. See “Use of Non-GAAP Financial Measures” section for further information. 2) By-products includes both by-products and co-products.
Outlook Based largely on the better than expected performance at Highland Valley Copper and extended supergene mining at Quebrada Blanca, we now expect 2018 copper production to be between 280,000 to 290,000 tonnes compared to our previous guidance of 270,000 to 285,000 tonnes. We also expect contained molybdenum production from our Highland Valley Copper mine and our share of Antamina to be 9 million pounds in 2018, compared to previous guidance of 6.8 million pounds. We now expect full year copper unit costs to be in the range of US$1.75 to US$1.80 per pound before margins from by-products, compared to US$1.80 to US$1.90 per pound previously and US$1.30 to US$1.40 per pound after by-products compared to US$1.35 to US$1.45 per pound previously based on current production plans, by-product prices and exchange rates. Copper Development Projects Quebrada Blanca Phase 2 Quebrada Blanca Phase 2 is expected to have an initial mine life of 25 years, based on reserves only, which make up approximately 25% of the combined reserve and resource. Annual production capacity is expected to be 300,000 tonnes of copper equivalent production per year for the first five years of mine life. Project activities during the quarter focused primarily on execution readiness activities, advancing detailed engineering and design, which is now

15 Teck Resources Limited 2018 Second Quarter News Release
approximately 70% complete, and continuing progress on the Social and Environmental Impact Assessment (SEIA) regulatory approval process. The Indigenous Consultation Process conducted by the regulatory authorities with eight Indigenous communities has been completed with all the communities involved. The environmental evaluation has also finished, and the lead agency is preparing to issue their report, which will contain a technical recommendation for the Environmental Evaluation Commission to vote on the approval of the project. We expect the vote to take place in the month of August, and after that to receive final permit approval documents. A decision to proceed with development will be contingent upon regulatory approvals and market conditions, among other considerations, and we are currently exploring various potential financing alternatives for the project. We will shortly launch a process to seek an additional partner for Quebrada Blanca Phase 2. Our objective is to ultimately hold a 60 — 70% interest in the project and a transaction would most likely be announced in the fourth quarter. Project development expenditures for the first nine months of 2018 are expected to be approximately US$250 million. Total spending in 2018 will depend on the timing of regulatory approvals and potential sanction decision in the fourth quarter of 2018. On April 4, 2018, we acquired an additional 13.5% interest in Compañía Minera Teck Quebrada Blanca S.A. (QBSA) through the purchase of Inversiones Mineras S.A. (IMSA), a private Chilean company. The acquisition brings our interest in QBSA to 90%. ENAMI, a Chilean State agency, holds a 10% preference share in QBSA, which does not require ENAMI to fund capital spending. The purchase price consisted of US$52.5 million paid in cash on closing, an additional payment of US$60 million payable on approval of the social and environmental impact assessment for the Quebrada Blanca Phase 2 project and the expiry of certain appeal rights, and a further US$50 million payable within 30 days of the commencement of commercial production at Quebrada Blanca Phase 2. Additional amounts may become payable to the extent that average copper prices exceed US$3.15 per pound in each of the first three years following commencement of commercial production, up to a cumulative maximum of US$100 million if commencement of commercial production occurs prior to January 21, 2024, or up to a lesser maximum in certain circumstances thereafter.
NuevaUnión NuevaUnión is a joint venture owned 50% by Teck and 50% by Goldcorp Inc. In the first quarter of 2018, a Prefeasibility Study (PFS) on the NuevaUnión project was completed, which incorporates key design changes to improve project economics and respond to community and Indigenous peoples’ input. In the second quarter of 2018, NuevaUnión advanced the evaluation and optimization of numerous opportunities to improve project economics identified in the PFS, such as the use of high-pressure grinding rolls, before starting a Feasibility Study (FS), which is expected to commence in the third quarter of 2018 and require approximately 12 months to complete. Detailed project economics will be released with the completion of the FS. NuevaUnión also advanced the current phase of the drilling campaign at the La Fortuna deposit in the second quarter of 2018.

16 Teck Resources Limited 2018 Second Quarter News Release
Project Satellite During the second quarter of 2018 we continued to advance our Project Satellite initiative to surface value from five substantial base metals assets: Zafranal, San Nicolás, Galore Creek, Schaft Creek, and Mesaba, all of which are located in stable jurisdictions in the Americas. The current focus of the Satellite initiative is on environmental and social baseline studies, community engagement programs, engineering and design work to prepare social and environmental impact assessments and development permit applications on the Zafranal and San Nicolás assets in particular. At the Zafranal copper-gold project in southern Peru, the project team is advancing technical and engineering work in support of a feasibility study along with expanded community engagement activities and permitting work that is necessary to prepare a social and environmental impact assessment (SEIA). We expect to complete the feasibility study and submit the SEIA during the fourth quarter of 2018. At the San Nicolás copper-zinc-silver-gold project in Zacatecas, Mexico, a significant drill program of approximately 32,500 meters continued successfully in the second quarter of 2018, which includes infill, geotechnical, hydrogeological and exploration drill holes. The drill program is approximately 70% complete, with greater than 21,000 meters drilled. In addition, the project team continues to advance social and environmental baseline studies, community engagement activities, preliminary hydrogeological studies and project engineering programs in support of a prefeasibility study and an SEIA. We expect to complete the prefeasibility study in the second half of 2019. Planned spending in 2018 is $28 million, which is included in capital expenditures for new mine development for our copper business unit. Work programs including mapping, sampling, drilling, environmental and social baseline studies, focused engineering studies, and required regulatory compliance and permitting work continued on each of the Galore Creek (copper-gold-silver), Schaft Creek (copper-molybdenum-gold-silver) and Mesaba (copper-nickel-platinum group elements) projects in the second quarter of 2018. Planned spending in 2018 for the three projects is $16 million, which will be included in exploration expenses.

17 Teck Resources Limited 2018 Second Quarter News Release
ZINC BUSINESS UNIT
Three months
ended June 30, Six months
ended June 30,
(CAD$ in millions) 2018 2017 2018 2017
Zinc price (realized — US$/lb) $ 1.42 $ 1.18 $ 1.49 $ 1.23
Production (000’s tonnes)
Refined zinc 75 74 154 152
Zinc in concentrate1 160 135 288 265
Sales (000’s tonnes)
Refined zinc 77 74 154 150
Zinc in concentrate1 89 90 208 205
Gross profit before depreciation and amortization2 $ 234 $ 196 $ 526 $ 401
Gross profit $ 194 $ 153 $ 445 $ 317
Property, plant and equipment expenditures $ 86 $ 47 $ 137 $ 89 Note: 1) Represents production and sales from Red Dog and Pend Oreille. Excludes co-product zinc production from our copper business
unit. 2) Non-GAAP financial measure. See “Use of Non-GAAP Financial Measures” section for further information.
Performance Gross profit from our zinc business unit was $194 million in the second quarter compared with $153 million a year ago. Gross profit before depreciation and amortization increased by $38 million (see table below) due primarily to higher zinc prices, partially offset by higher unit operating cost and the stronger Canadian dollar. Refined zinc production from our Trail Operations in the second quarter was similar to the same period a year ago. At Red Dog, zinc production was 20% higher than a year ago due to higher grade ore and improved recoveries. The table below summarizes the gross profit change, before depreciation and amortization, in our zinc business unit for the quarter.
(CAD$ in millions) Three months
ended June 30,
As reported in the second quarter of 2017 $ 196
Increase (decrease):
Zinc price realized 67
Sales volumes 1
Unit operating costs (14)
Co-product and by-product contribution (1)
Royalties (3)
Foreign exchange (12)
Net increase 38
As reported in current quarter $ 234

18 Teck Resources Limited 2018 Second Quarter News Release
Property, plant and equipment expenditures include $44 million for sustaining capital, which included $28 million at our Trail Operations and $12 million at Red Dog. Markets London Metal Exchange (LME) zinc prices averaged US$1.41 per pound in the second quarter of 2018, a decrease of 9% over the previous quarter, but 20% higher than the second quarter of 2017. Zinc reached a 10-year high in February at just over US$1.64 per pound, and has been on a downward trend since. LME zinc prices have come under the same pressures as other commodities following the announcement of trade tariffs by the U.S. government against Chinese exports. Global demand for refined zinc was stronger in the second quarter of 2018 with galvanized steel production up 2.1% over the previous quarter, according to CRU. In China, CRU estimates that galvanized steel production grew 5.5% in the second quarter over the prior quarter, which had been affected by environmental cuts to steel production. Galvanized steel prices in the U.S. have risen in the second quarter by 11% over the previous quarter and by 25% over the same time last year. Operations Red Dog Zinc production of 153,600 tonnes in the second quarter was 20% higher than during the same period last year due to higher grades and recoveries. Zinc sales of 83,800 tonnes in the second quarter was slightly ahead of our previous guidance of 80,000 tonnes. Offsite zinc inventory available for sale as of July 1, 2018 was approximately 18,000 tonnes of contained metal, compared to 28,000 tonnes at the same time last year. Site operating costs in the second quarter of US$72 million were similar to last year. Capitalized stripping costs were US$3 million compared with US$5 million in the same period a year ago. After our strong second quarter results, we now expect Red Dog’s production of contained metal in 2018 to be in the range of 535,000 to 550,000 tonnes of zinc compared to previous guidance 525,000 to 545,000 tonnes. Trail Operations Refined zinc production of 74,600 tonnes in the second quarter was 2% higher than the same period a year ago. Refined lead production in the second quarter of 16,200 tonnes was 27% lower than a year ago. This was primarily the result of treating lower grade lead concentrates compared to last year due to operating disruptions at some mines that supply lead concentrates, which required alternative concentrates to be processed. Silver production was 44% lower than a year ago primarily due to changes to the lead concentrate feed mix. Operating costs were similar to a year ago at $113 million in the second quarter.

19 Teck Resources Limited 2018 Second Quarter News Release
Sustaining capital expenditures in the quarter included $19 million for the Number 2 Acid Plant and $9 million for various small projects. The construction of the acid plant is over 60% completed, and on time and on budget, with commissioning planned in the second quarter of 2019. We continue to expect Trail Operations to produce 305,000 to 310,000 tonnes of refined zinc, but now expect 65,000 tonnes of refined lead and 14 million ounces of silver (previously 70,000 tonnes and 16 to 18 million ounces respectively) due to limited concentrate feed availability. Refined lead production is lower compared to previous years primarily due to a planned extended maintenance shutdown of the Kivcet furnace in the fourth quarter of 2018, which occurs once every four years. In addition, with the sale of our two-thirds interest in the Waneta Dam, energy costs at Trail Operations are expected to increase by approximately $75 million on an annualized basis. Pend Oreille Zinc production during the second quarter of 5,800 tonnes was 20% lower than a year ago due to reduced availability of higher grade ore sources and additional ground support requirements. We expect ore availability to improve in the second half and expect production of zinc to be 30,000 tonnes in 2018, compared to our previous guidance of 35,000 tonnes. Production rates beyond 2018 are uncertain, although the potential exists to extend the mine life at similar rates for several more years. Cost of Sales
Unit cash costs of product sold in the second quarter of 2018 as reported in U.S. dollars, before cash margins for by-products, were US$0.55 per pound compared to US$0.53 per pound a year ago. Operating costs were similar to a year ago, however, higher oil prices are expected to increase diesel costs at Red Dog in the second half of 2018 as new inventory is received with the 2018 sealift. Unit cash costs for zinc, after by-products, of US$0.52 per pound were US$0.02 higher than the same period a year ago.
Three months
ended June 30, Six months
ended June 30,
(amounts reported in US$ per pound) 2018 2017 2018 2017
Adjusted cash cost of sales1 $ 0.31 $ 0.27 $ 0.30 $ 0.29
Smelter processing charges 0.24 0.26 0.25 0.27
Total cash unit costs before by-product margins1 0.55 0.53 0.55 0.56
Cash margin for by-products1 2 (0.03) (0.03) (0.02) (0.03) Total cash unit costs after by-product margins1 $ 0.52 $ 0.50 $ 0.53 $ 0.53 Notes: 1) Non-GAAP financial measure. See “Use of Non-GAAP Financial Measures” section for further information. 2) By-products includes both by-products and co-products.
20 Teck Resources Limited 2018 Second Quarter News Release
Outlook
We now expect overall zinc metal production to be between 655,000 and 670,000 tonnes, compared to our previous guidance of 645,000 to 670,000 tonnes. The Red Dog concentrate shipping season commenced on July 6, 2018. We expect sales of 160,000 tonnes of contained zinc in the third quarter, reflecting the normal seasonal pattern of Red Dog sales.
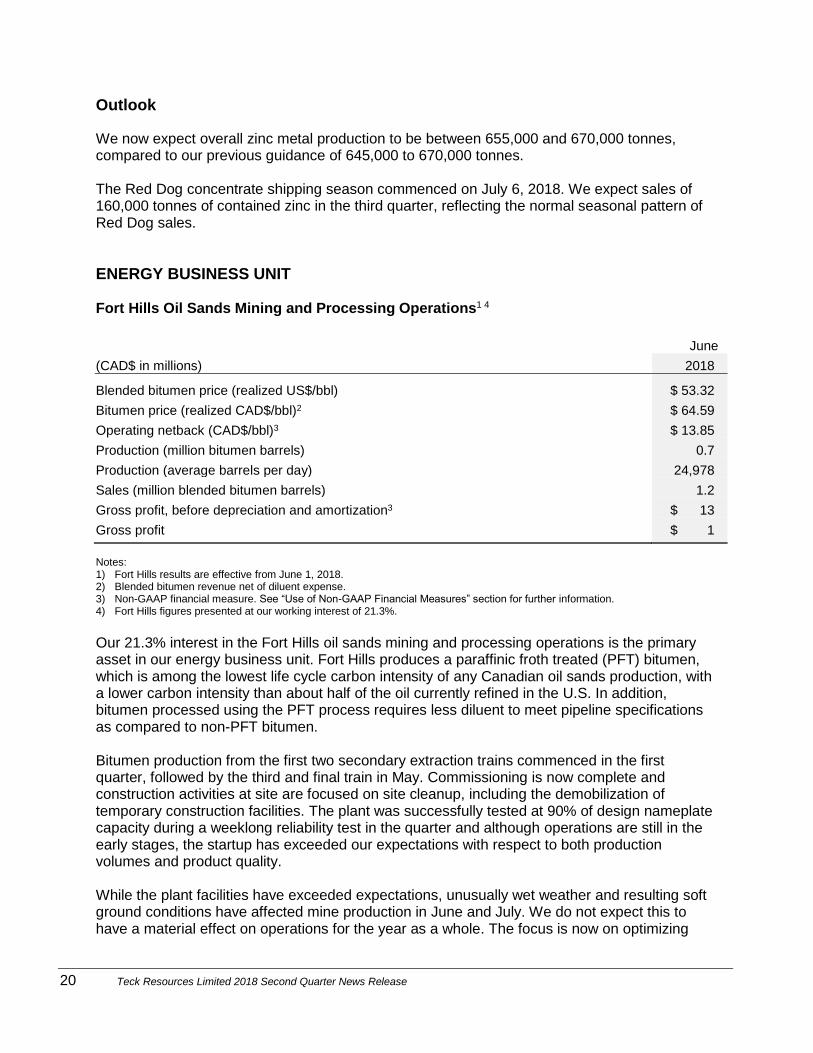
ENERGY BUSINESS UNIT Fort Hills Oil Sands Mining and Processing Operations1 4
June
(CAD$ in millions) 2018
Blended bitumen price (realized US$/bbl) $ 53.32
Bitumen price (realized CAD$/bbl)2 $ 64.59
Operating netback (CAD$/bbl)3 $ 13.85
Production (million bitumen barrels) 0.7
Production (average barrels per day) 24,978
Sales (million blended bitumen barrels) 1.2
Gross profit, before depreciation and amortization3 $ 13
Gross profit $ 1 Notes: 1) Fort Hills results are effective from June 1, 2018. 2) Blended bitumen revenue net of diluent expense. 3) Non-GAAP financial measure. See “Use of Non-GAAP Financial Measures” section for further information. 4) Fort Hills figures presented at our working interest of 21.3%.
Our 21.3% interest in the Fort Hills oil sands mining and processing operations is the primary asset in our energy business unit. Fort Hills produces a paraffinic froth treated (PFT) bitumen, which is among the lowest life cycle carbon intensity of any Canadian oil sands production, with a lower carbon intensity than about half of the oil currently refined in the U.S. In addition, bitumen processed using the PFT process requires less diluent to meet pipeline specifications as compared to non-PFT bitumen. Bitumen production from the first two secondary extraction trains commenced in the first quarter, followed by the third and final train in May. Commissioning is now complete and construction activities at site are focused on site cleanup, including the demobilization of temporary construction facilities. The plant was successfully tested at 90% of design nameplate capacity during a weeklong reliability test in the quarter and although operations are still in the early stages, the startup has exceeded our expectations with respect to both production volumes and product quality. While the plant facilities have exceeded expectations, unusually wet weather and resulting soft ground conditions have affected mine production in June and July. We do not expect this to have a material effect on operations for the year as a whole. The focus is now on optimizing

21 Teck Resources Limited 2018 Second Quarter News Release
mining capacity to reliably sustain production in excess of 90% of plant capacity by the fourth quarter of 2018. We receive our share of bitumen from the Fort Hills oil sands mining and processing operations and are responsible for the blending, transportation and sales of the product after the transfer point. Following the completion of commissioning, we concluded the facility had achieved commercial production and operating results from Fort Hills are included in our consolidated results from June 1, 2018. Prior to June, our share of bitumen production was 2.9 million barrels and our sales of blended bitumen were 2.6 million barrels. Fort Hills has produced 17.0 million barrels of bitumen since first oil in January, of which our share was 3.6 million barrels. Our share of production exceeded 27,000 barrels per day in the second quarter, which was greater than our guidance of 12,000 to 20,000 barrels per day for the quarter. As a result of the strong start-up and commissioning, production guidance has been increased to 8.5 million to 10 million barrels of bitumen for the year, up from 7.5 million to 8.5 million barrels previously. In the second quarter, our share of Fort Hills capital expenditures were $87 million, including $11 million for major enhancements, $1 million for sustaining capital and $75 for new mine development. In addition, we capitalized production ramp-up costs, net of sales proceeds during the final construction and ramp-up phase in April and May of 2018. Sales proceeds exceeded production ramp-up costs by $14 million in the second quarter. Crude Oil Prices Net bitumen realizations are influenced by the North American crude oil benchmark prices of NYMEX WTI, Canadian heavy crude oil (WCS differential at Hardisty is a common reference) and diluent (condensate at Edmonton). Bitumen price realizations can also be affected by specific bitumen quality and spot sales. NYMEX WTI is the current light oil benchmark for North American crude oil prices. WTI averaged US$67.88 per barrel in the second quarter. Current global crude oil supply/demand balances suggest that WTI pricing will remain at these higher levels for the foreseeable future. However, government policy and trade war uncertainty could negatively affect both demand and prices. Western Canada Select, or WCS, is a blend of conventionally produced heavy oils and bitumen, blended with diluent (condensate). WCS is a widely marketed crude grade with transparent market price references quoted at Hardisty and U.S. Gulf Coast market hubs. WCS at Hardisty, typically trades at a differential below the NYMEX WTI benchmark price, and traded at an average discount of US$19.27 per barrel for the second quarter, for a heavy value of US$48.61 per barrel for the second quarter. With new Canadian heavy production coming on stream throughout 2018 and 2019 and with limited pipeline export capacity to accommodate this new production, market conditions are indicative of a widening of this discount. To facilitate the transportation of our bitumen by pipeline, we blend condensate acquired at the Edmonton/Fort Saskatchewan market hub for delivery to and blending at the East Tank Farm blending facility. Relative to NYMEX WTI, the benchmark market differential for condensate for the second quarter, determined at Edmonton, averaged US$0.95 per barrel for a condensate, for a value of US$68.83 per barrel for the second quarter. Readily accessed supplies of diluent

22 Teck Resources Limited 2018 Second Quarter News Release
in the near term are indicative of a condensate value at Edmonton, at or near the NYMEX WTI price.
Operating Netback1
The following table summarizes our Fort Hills operating netback for the month of June:
June2
(Amounts reported in CAD$ per barrel of bitumen sold) 2018
Bitumen price realized3 $ 64.59
Crown royalties4 (3.59)
Transportation costs5 (8.90)
Operating costs6 (38.25)
Operating netback1 $ 13.85 Notes: 1) Non-GAAP measure. See “Use of Non-GAAP Financial Measures” section for further details. 2) Fort Hills financial results are included in operating results from June 1, 2018. 3) Bitumen price realized represents the realized petroleum revenue (blended bitumen sales revenue) net of diluent expense,
expressed on a per barrel basis. Blended bitumen sales revenue represents revenue from our share of the heavy crude oil blend known as Fort Hills Reduced Carbon Life Cycle Dilbit Blend (FRB), sold at the Hardisty and U.S. Gulf Coast market hubs. FRB is comprised of bitumen produced from the Fort Hills oil sands mining and processing operations blended with purchased diluent. The cost of blending is affected by the amount of diluent required and the cost of purchasing, transporting and blending the diluent. A portion of diluent expense is effectively recovered in the sales price of the blended product. Diluent expense is also affected by the Canadian and U.S. benchmark pricing and changes in the value of the Canadian dollar relative to the U.S. dollar.
4) The royalty rate applicable to pre-payout oil sands operations starts at 1% of gross revenue and increases for every dollar by which the WTI crude oil price in Canadian dollars exceeds $55 per barrel, to a maximum of 9% when the WTI crude oil price is $120 per barrel or higher. Fort Hills is currently in the pre-payout phase. Detailed information regarding Alberta oil sands royalties can be found on the following website: https://www.energy.alberta.ca/OS/OSRoyalty/Pages/default.aspx.
5) Transportation costs represent pipeline and storage costs downstream of the East Tank Farm blending facility. We use various pipeline and storage facilities to transport and sell our blend to customers throughout North America. Sales to the U.S. markets require additional transportation costs, but realize higher selling prices.
6) Operating costs were lower than our guidance of CAD$40 to $50 per barrel. Operating costs per barrel are expected to decrease as the project continues to ramp-up to full capacity by the end of 2018.
Outlook Due to the strong start-up and commissioning, we now expect our share of bitumen production to be in the range of 8.5 million to 10.0 million barrels and operating costs to be $28.50 to $32.50 per barrel for the year, versus 7.5 million to 9.0 million barrels and $35.00 to $40.00 previously. Based on our share of Fort Hills operating at full production rates (approximately 90% of nameplate capacity of 194,000 barrels per day), our estimated EBITDA sensitivity to a US$1/barrel change in the WCS price is approximately $18.5 million and $13.5 million to our after-tax profit. Frontier Energy Project The regulatory application review of Frontier is continuing with a public hearing before a federal/provincial panel scheduled to commence on September 25, 2018. The earliest a federal decision statement could be expected for Frontier is mid-2019. Our expenditures on Frontier are

23 Teck Resources Limited 2018 Second Quarter News Release
limited to supporting this process. We continue to evaluate the future project schedule and development options as part of our ongoing capital review and prioritization process.
OTHER OPERATING INCOME AND EXPENSES Other operating expense, net of other income, was $117 million in the second quarter compared with other operating expense of $45 million a year ago. Significant items include negative pricing adjustments of $20 million, $29 million of take or pay contracts, $15 million of commodity derivative losses and $27 million in share-based compensation. The commodity derivative losses result from our short-term zinc and lead positions and from derivatives embedded in our gold and silver streaming agreements. The table below outlines our outstanding receivable positions, provisionally valued at June 30, 2018 and March 31, 2018.
Outstanding at Outstanding at
June 30, 2018 March 31, 2018
(payable pounds in millions) Pounds US$/lb Pounds US$/lb
Copper 112 3.01 130 3.04
Zinc 136 1.33 158 1.51
Our finance expense of $55 million in the second quarter decreased by $4 million from a year ago. Our finance expense includes the interest expense on our debt, finance fees and amortization, interest components of our pension obligations and accretion on our decommissioning and restoration provisions, less any interest that we capitalize against our development projects. The primary reasons for the decrease in our finance expense were the lower outstanding debt balances and the favorable effect of a stronger Canadian dollar on our U.S. dollar denominated debt. In addition, a slightly higher amount of interest was capitalized against our development projects, including $41 million for Fort Hills and $41 million for Quebrada Blanca Phase 2, reflecting our increased carrying values of both of these projects compared with a year ago, but only two months of interest capitalization for Fort Hills compared to three months in 2017. We expect our interest expense to increase by approximately $40 million in the third quarter as we have ceased capitalizing interest to Fort Hills. Non-operating expense in the second quarter was $12 million comprised of a $20 million loss on the revaluation of the embedded call option on our 8.5% long-term notes (due in 2024), offset by net foreign exchange gains of $8 million. However, as the foreign exchange gains and losses were subject to varying rates of tax, depending on the jurisdiction and nature, they resulted collectively in a $1 million after-tax loss. Income and resource taxes for the quarter were $368 million, or 36% of pre-tax profits. This effective tax rate is higher than the Canadian statutory income tax rate of 27% as a result of resource taxes and higher rates in some foreign jurisdictions. Due to available tax pools, we are currently shielded from cash income taxes, but not resource taxes, in Canada. We remain subject to cash taxes in foreign jurisdictions.
24 Teck Resources Limited 2018 Second Quarter News Release
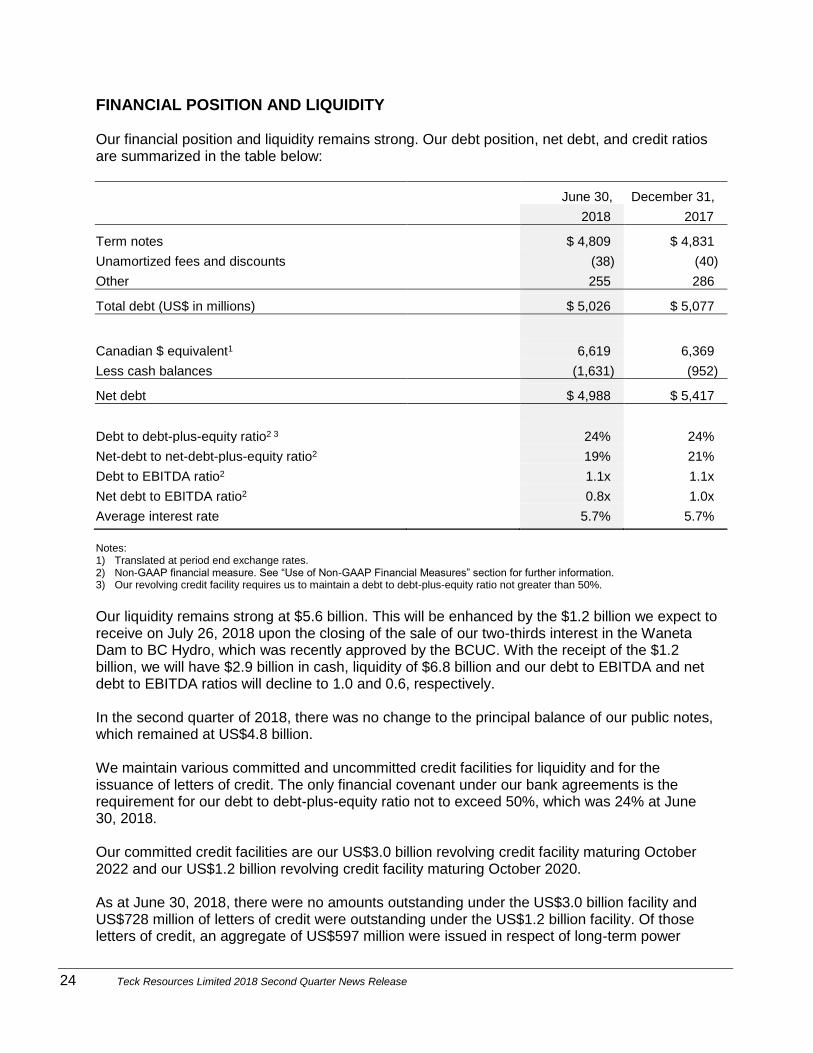
FINANCIAL POSITION AND LIQUIDITY Our financial position and liquidity remains strong. Our debt position, net debt, and credit ratios are summarized in the table below:
June 30, December 31,
2018 2017
Term notes $ 4,809 $ 4,831
Unamortized fees and discounts (38) (40)
Other 255 286
Total debt (US$ in millions) $ 5,026 $ 5,077
Canadian $ equivalent1 6,619 6,369
Less cash balances (1,631) (952)
Net debt $ 4,988 $ 5,417
Debt to debt-plus-equity ratio2 3 24% 24%
Net-debt to net-debt-plus-equity ratio2 19% 21%
Debt to EBITDA ratio2 1.1x 1.1x
Net debt to EBITDA ratio2 0.8x 1.0x
Average interest rate 5.7% 5.7% Notes: 1) Translated at period end exchange rates. 2) Non-GAAP financial measure. See “Use of Non-GAAP Financial Measures” section for further information. 3) Our revolving credit facility requires us to maintain a debt to debt-plus-equity ratio not greater than 50%.
Our liquidity remains strong at $5.6 billion. This will be enhanced by the $1.2 billion we expect to receive on July 26, 2018 upon the closing of the sale of our two-thirds interest in the Waneta Dam to BC Hydro, which was recently approved by the BCUC. With the receipt of the $1.2 billion, we will have $2.9 billion in cash, liquidity of $6.8 billion and our debt to EBITDA and net debt to EBITDA ratios will decline to 1.0 and 0.6, respectively. In the second quarter of 2018, there was no change to the principal balance of our public notes, which remained at US$4.8 billion. We maintain various committed and uncommitted credit facilities for liquidity and for the issuance of letters of credit. The only financial covenant under our bank agreements is the requirement for our debt to debt-plus-equity ratio not to exceed 50%, which was 24% at June 30, 2018. Our committed credit facilities are our US$3.0 billion revolving credit facility maturing October 2022 and our US$1.2 billion revolving credit facility maturing October 2020. As at June 30, 2018, there were no amounts outstanding under the US$3.0 billion facility and US$728 million of letters of credit were outstanding under the US$1.2 billion facility. Of those letters of credit, an aggregate of US$597 million were issued in respect of long-term power
25 Teck Resources Limited 2018 Second Quarter News Release
purchase agreements for the Quebrada Blanca Phase 2 project and $167 million in respect of certain long-term transport service agreements for our share of the Fort Hills project. We also have various other uncommitted credit facilities and arrangements that secure our reclamation and other obligations in the amount of approximately $2.1 billion. We may be required to post additional security in respect of reclamation at our sites in future periods as additional land is disturbed, regulatory requirements change and closure plans are updated. Operating Cash Flow Cash flow from operations in the second quarter decreased to $1.1 billion compared with $1.4 billion last year, as change in working capital items last year contributed $364 million to our cash flows compared with minimal changes in 2018. In the second quarter last year as a result of changes to an index-linked steelmaking coal price mechanism, we had received approximately $200 million of provisional customer payments that were subsequently repaid in the third quarter of 2017. Changes to working capital items in the second quarter of this year were minimal, as the seasonal drawdown of production inventories at Red Dog were primarily offset by the build-up of working capital items with the ramp-up of Fort Hills. Investing Activities Expenditures on property, plant and equipment were $345 million in the second quarter, including $61 million of new mine development for the Fort Hills oil sands mining and processing operations, $101 million on sustaining capital and $86 million on major enhancement projects. The largest components of sustaining expenditures were $23 million at our steelmaking coal operations, $28 million at our Trail Operations and $15 million at Highland Valley Copper. Included in new mine development for Fort Hills is a reduction of $14 million of capitalized production costs, net of sales proceeds, during the final ramp-up and construction phase. Capitalized production stripping costs were $175 million in the second quarter compared with $173 million a year ago. The majority of this represents the advancement of pits for future production at our steelmaking coal mines. In early April, we acquired an additional 13.5% indirect interest in the company that owns the Quebrada Blanca Phase 2 (QB2) copper project. The purchase price consists of US$52.5 million paid in cash on closing, an additional payment of US$60 million payable on the issuance of the major approval of the social and environmental impact assessment for the QB2 project and the expiry of certain appeal rights, and a further US$50 million payable within 30 days of the commencement of commercial production at QB2. Additional amounts may become payable to the extent that average copper prices exceed US$3.15 per pound in each of the first three years following the commencement of commercial production, up to a cumulative maximum of US$100 million if commencement of commercial production occurs prior to January 21, 2024, or up to a lesser maximum amount in certain circumstances thereafter.

26 Teck Resources Limited 2018 Second Quarter News Release
The table below summarizes our year-to-date capital spending for 2018:
($ in millions) Sustaining Major
Enhancement New Mine
Development Sub-total Capitalized
Stripping Total
Steelmaking coal $ 95 $ 51 $ – $ 146 $ 279 $ 425
Copper 53 20 158 231 84 315
Zinc 83 47 7 137 9 146
Energy 6 24 258 288 – 288
Corporate 3 – – 3 – 3
$ 240 $ 142 $ 423 $ 805 $ 372 $ 1,177
Financing Activities Debt interest and finance charges paid were $70 million in the second quarter compared with $87 million in the same period a year ago. The decrease was primarily a result of our lower debt balances. We paid our regular base quarterly dividend of $0.05 per share, which totaled $28 million in the second quarter and received $17 million in proceeds from employees exercising stock options.
OUTLOOK The sensitivity of our annualized profit attributable to shareholders and EBITDA to changes in the Canadian/U.S. dollar exchange rate and commodity prices, before pricing adjustments, based on our current balance sheet, our expected 2018 mid-range production estimates, current commodity prices and a Canadian/U.S. dollar exchange rate of $1.30, is as follows:
2018 Mid-Range Change Estimated Estimated
Production Effect of Change Effect on
Estimates1 on Annualized Annualized
Profit2 EBITDA2
US$ exchange CAD$0.01 $43 million $66 million Steelmaking coal (millions tonnes) 26.5 US$1/tonne $20 million $31 million
Copper (000s tonnes) 285.0 US$0.01/lb $ 5 million $ 7 million
Zinc (000s tonnes)3 970.0 US$0.01/lb $10 million $14 million Notes: 1) All production estimates are subject to change based on market and operating conditions. 2) The effect on our profit attributable to shareholders and on EBITDA of commodity price and exchange rate movements will
vary from quarter to quarter depending on sales volumes. Our estimate of the sensitivity of profit and EBITDA to changes in the U.S. dollar exchange rate is sensitive to commodity price assumptions.
3) Zinc includes 307,500 tonnes of refined zinc and 662,500 tonnes of zinc contained in concentrate.
The decline in our estimated foreign exchange rate sensitivity from previous estimates is primarily due to the effect of lower commodity prices, which are denominated in U.S. dollars.

27 Teck Resources Limited 2018 Second Quarter News Release
The sales of our products are denominated in U.S. dollars while a significant portion of our expenses are incurred in local currencies, particularly the Canadian dollar and the Chilean peso. Foreign exchange fluctuations can have a significant effect on our operating margins, unless such fluctuations are offset by related changes to commodity prices. Our U.S. dollar denominated debt is subject to revaluation based on changes in the Canadian/U.S. dollar exchange rate. As at June 30, 2018, $3.6 billion of our U.S. dollar denominated debt is designated as a hedge against our foreign operations that have a U.S. dollar functional currency. As a result, any foreign exchange gains or losses arising on that amount of our U.S. dollar debt are recorded in other comprehensive income, with the remainder being charged to profit. Commodity markets are volatile. Prices can change rapidly and customers can alter shipment plans. This can have a substantial effect on our business and financial results. Demand for our products remains strong and prices for our products rose substantially in the past year, which have contributed additional revenues and cash flows. Production disruptions in the coal producing region of Australia caused by weather and other events in the past few years has also had an effect on available supplies and market prices. Variable growth rates in expanding economies of China, India and other emerging markets have affected both demand and prices for some of our products. In addition, recent uncertainty in global markets arising from government policy changes, including tariffs and the potential for trade wars, may have a significant positive or negative effect on the various products we produce. Price volatility will continue, but over the long-term, the industrialization of emerging economies, as well as infrastructure replacement in developed economies, will continue to be a major factor in the demand for the commodities we produce. While price volatility remains a significant factor in our industry, we have taken significant steps to insulate our company from its effects. We have improved operations, reduced unit costs and are now enjoying significant gross profit cash margins. We have strengthened our balance sheet and credit ratings by reducing debt and completed our capital-intensive Fort Hills project. Further, the supply and demand balance for our products is favorable. Combined, these factors provide a significant positive outlook for the company. The capitalization of interest ceases once major development projects reach commercial production. We expect our finance expense to increase by approximately $40 million in the third quarter as we have ceased capitalizing interest at Fort Hills. This will be partially offset by an increase in capitalized interest attributable to Quebrada Blanca Phase 2. In addition, with the sale of our two-thirds interest in the Waneta Dam, energy costs at our Trail Operations are expected to increase by approximately $75 million on an annualized basis.

28 Teck Resources Limited 2018 Second Quarter News Release
FINANCIAL INSTRUMENTS AND DERIVATIVES We hold a number of financial instruments and derivatives, which are recorded on our balance sheet at fair value with gains and losses in each period included in other comprehensive income and profit for the period as appropriate. The most significant of these instruments are marketable securities, metal-related forward contracts including those embedded in our silver and gold streaming agreements, and settlements receivable and payable, and prepayment rights on certain long-term debt notes. Some of our gains and losses on metal-related financial instruments are affected by smelter price participation and are taken into account in determining royalties and other expenses. All are subject to varying rates of taxation depending on their nature and jurisdiction.

29 Teck Resources Limited 2018 Second Quarter News Release
GUIDANCE Production Guidance The table below shows our guidance for our share of production of our principal products for 2017 in 2018 and the following three years. There are no changes to the three year production guidance as reported in our 2017 annual report.
Units in 000’s tonnes (excluding steelmaking coal, molybdenum and bitumen) 2017
Previous 2018
Guidance
Change Current 2018
Guidance
Three-Year Guidance
2019 — 2021
PRINCIPAL PRODUCTS Steelmaking coal (million tonnes) 26.6 26 — 27 – 26 — 27 26.5 — 27.5
Copper1 2 3
Highland Valley Copper 93 95 — 100 5 — 5 100 — 105 120 — 140
Antamina 95 90 — 95 – 90 — 95 90 — 100
Carmen de Andacollo 76 63 — 68 – 63 — 68 60
Quebrada Blanca 23 20 — 24 4 — 2 24 — 26 –
287 270 — 285 10 — 5 280 — 290 270 — 300
Zinc1 2 4
Red Dog 542 525 — 545 10 — 5 535 — 550 475 — 525
Antamina 84 85 — 90 – 85 — 90 90 — 100
Pend Oreille 33 35 (5) 30 –
659 645 — 670 10 — 0 655 — 670 575 — 625
Refined zinc
Trail Operations 310 305 — 310 – 305 — 310 310 — 315
Bitumen (million barrels)2
Fort Hills n/a 7.5 — 9.0 1.0 — 1.0 8.5 — 10.0 14 OTHER PRODUCTS
Lead1
Red Dog 111 95 — 100 – 95 — 100 85 — 100
Refined lead
Trail Operations 87 70 (5) 65 95 — 105 Molybdenum (million pounds)1 2
Highland Valley Copper 9.2 5.0 2.2 7.2 4.0 — 5.0
Antamina 2.0 1.8 – 1.8 2.5 — 3.0
11.2 6.8 2.2 9.0 6.5 — 8.0
Refined silver (million ounces)
Trail Operations 21.4 16 — 18 (3) 14
Notes:
1) Metal contained in concentrate.
2) We include 100% of production from our Quebrada Blanca and Carmen de Andacollo mines in our production volumes, even though we own 90% (effective April 2018) and 90%, respectively, of these operations, because we fully consolidate their results in our financial statements. We include 22.5% of production from Antamina, representing our proportionate equity interest in Antamina. We include 21.3% of production from Fort Hills, representing our estimated proportionate equity interest in Fort Hills.
3) Copper production includes cathode production at Quebrada Blanca and Carmen de Andacollo.
4) Total zinc includes co-product zinc production from our copper business unit.

30 Teck Resources Limited 2018 Second Quarter News Release
Sales Guidance The table below shows our sales for the last quarter and our sales guidance for the next quarter for selected primary products.
Q2 2018 Q3 2018
Guidance
Steelmaking coal (million tonnes) 6.6 6.8
Zinc (000’s tonnes)1
Red Dog 83.8 160.0 Note: 1) Metal contained in concentrate.
Unit Cost Guidance The table below reports our unit costs for selected principal products for 2017 and our guidance for unit costs for selected principal products in 2018.
(Per unit costs — CAD$/tonne) 2017 Previous 2018
Guidance Change Current 2018
Guidance
Steelmaking coal1
Site cost of sales $ 52 $ 56 — 60 – $ 56 — 60
Transportation costs 37 35 — 37 – 35 — 37
Unit cost of sales — CAD$/tonne $ 89 $ 91 — 97 – $ 91 — 97
(Per unit cash costs — US$/pound)
Copper2 Total cash unit costs Net cash unit costs after by-product margins
$ 1.75
1.33
$ 1.80 — 1.90
1.35 — 1.45
$ (0.05) — (0.10)
(0.05) — (0.05)
$ 1.75 — 1.80
1.30 — 1.40
Zinc3 Total cash unit costs Net cash unit costs after by-product margins
$ 0.52
0.28
$ 0.50 — 0.55
0.30 — 0.35
–
–
$ 0.50 — 0.55
0.30 — 0.35
(Cash operating cost in CAD$/barrel)
Bitumen
Cash operating cost n/a $ 35 — 404 $ (6.50)— (7.50) $ 28.50 — 32.50
Notes: 1) Steelmaking coal unit costs are reported in Canadian dollars per tonne. Steelmaking coal unit cost of sales include site costs,
transport costs, and other and does not include deferred stripping or capital expenditures. See “Use of Non-GAAP Financial measures” section for further information.
2) Copper unit costs are reported in U.S. dollars per payable pound of metal contained in concentrate. Copper total cash costs after by-product margins include adjusted cash cost of sales, smelter processing charges and cash margin for by-products including co-products. Assumes a zinc price of US$1.30 per pound, a molybdenum price of US$12 per pound, a silver price of US$16.00 per ounce, a gold price of US$1,250 per ounce and a Canadian/U.S. dollar exchange rate of $1.30. See “Use of Non-GAAP Financial measures section for further information.
3) Zinc unit costs are reported in U.S. dollars per payable pound of metal contained in concentrate. Zinc total cash costs after by-product margins are mine costs including adjusted cash cost of sales, smelter processing charges and cash margin for by-products. Assumes a lead price of US$1.00 per pound, a silver price of US$16.00 per ounce and a Canadian/U.S. dollar exchange rate of $1.30. By-products include both by-products and co-products. See “Use of Non-GAAP Financial measures section for further information.

31 Teck Resources Limited 2018 Second Quarter News Release
Capital Expenditure Guidance The table below reports our capital expenditures for 2017 and our guidance for capital expenditures in 2018.
(Teck’s share in CAD$ millions) 2017
Previous 2018 Guidance Changes
Current 2018 Guidance
Sustaining
Steelmaking coal1 $ 112 $ 275 $ – $ 275
Copper 126 180 – 180
Zinc 168 230 – 230
Energy2 34 40 – 40
Corporate 4 5 – 5
$ 444 $ 730 $ – $ 730
Major Enhancement
Steelmaking coal $ 55 $ 160 $ – $ 160
Copper 8 70 – 70
Zinc 15 95 – 95
Energy2 - 90 – 90
$ 78 $ 415 $ – $ 415
New Mine Development
Copper3 $ 186 $ 375 $ – $ 375
Zinc 36 35 – 35
Energy2 877 195 – 195
$ 1,099 $ 605 $ – $ 605
Sub-total
Steelmaking coal $ 167 $ 435 $ – $ 435
Copper 320 625 – 625
Zinc 219 360 – 360
Energy2 911 325 – 325
Corporate 4 5 – 5
$ 1,621 $ 1,750 $ – $ 1,750
Capitalized Stripping
Steelmaking coal $ 506 $ 390 $ 80 $ 470
Copper 147 145 – 145
Zinc 25 25 – 25
$ 678 $ 560 $ 80 $ 640
Total
Steelmaking coal $ 673 $ 825 $ 80 $ 905
Copper 467 770 – 770
Zinc 244 385 – 385
Energy2 911 325 – 325
Corporate 4 5 – 5
$ 2,299 $ 2,310 $ 80 $ 2,390 Notes: 1) For steelmaking coal, sustaining capital includes Teck’s share of water treatment charges of $3 million in 2017. Sustaining capital guidance
includes Teck’s share of water treatment charges related to the Elk Valley Water Quality Plan, which are approximately $80 million in 2018. Steelmaking coal guidance for 2018 excludes $120 million of planned 2018 spending for port upgrades at Neptune Bulk Terminals, as Neptune Bulk Terminals is equity accounted on our balance sheet.
2) For energy, Fort Hills capital expenditures guidance is at our estimated working interest of 21.3%, and does not include any capitalized revenue and associated costs, capitalized interest or reduction of capital accruals. Major enhancement guidance for 2018 includes tailings management

32 Teck Resources Limited 2018 Second Quarter News Release
and new mine equipment at Fort Hills. New mine development guidance for 2018 includes expected spending at Fort Hills, assuming some further increase in our project interest and Frontier.
3) For copper, new mine development guidance for 2018 includes Quebrada Blanca Phase 2, Zafranal and San Nicolás.
QUARTERLY PROFIT AND CASH FLOW
(in millions, except for share data) 2018 2017 (restated) 2016
Q2 Q1 Q4 Q3 Q2 Q1 Q4 Q3 Q2
Revenue $ 3,016 $ 3,092 $ 3,156 $ 3,075 $ 2,832 $ 2,847 $ 3,557 $ 2,305 $ 1,740
Gross profit 1,241 1,360 1,263 1,068 1,073 1,163 1,577 452 212
EBITDA1 1,403 1,555 1,563 1,370 1,341 1,315 1,561 804 468
Profit attributable to shareholders 634 759 740 584 580 556 697 234 15
Basic earnings per share $ 1.10 $ 1.32 $ 1.28 $ 1.01 $ 1.00 $ 0.96 $ 1.21 $ 0.41 $ 0.03 Diluted earnings per share $ 1.09 $ 1.30 $ 1.26 $ 1.00 $ 0.99 $ 0.95 $ 1.19 $ 0.40 $ 0.03
Cash flow from operations $ 1,107 $ 1,120 $ 1,464 $ 901 $ 1,408 $ 1,293 $ 1,490 $ 854 $ 339
Notes: 1) Non-GAAP financial measure. See “Use of Non-GAAP Financial Measures” section for further information. 2) Information for 2016 has not been restated for IFRS 15, Revenue from Contracts with Customers (see Note 12 to our
consolidated interim financial statements).
ADOPTION OF NEW ACCOUNTING STANDARDS AND ACCOUNTING DEVELOPMENTS Effective January 1, 2018, we adopted new IFRS pronouncements – IFRS 15, Revenue from Contracts with Customers (IFRS 15) and IFRS 9, Financial Instruments (IFRS 9). The effect of adoption of these new pronouncements is outlined in our Management’s Discussion and Analysis for the first quarter ended March 31, 2018. We have outlined the effects in more detail in Note 14 to our interim consolidated financial statements as at June 30, 2018, which also discloses our restated comparative financial statements for the periods ended January 1, 2017, June 30, 2017 and December 31, 2017. We have also provided an overview below of IFRS 16, Leases (IFRS 16), a new IFRS pronouncement issued, but not yet effective. We are required to apply IFRS 16 effective from January 1, 2019. Leases In January 2016, the IASB issued IFRS 16, Leases (IFRS 16), which eliminates the classification of leases as either operating or finance leases for a lessee. Under IFRS 16, all leases are considered finance leases and will be recorded on the balance sheet. The only exemptions to this classification will be for leases that are 12 months or less in duration or for leases of low-value assets. The requirement to record all leases as finance leases under IFRS 16 will increase lease assets and lease liabilities on an entity’s financial statements. IFRS 16 will also change the nature of expenses relating to leases, as the straight-line lease expense previously recognized for operating leases will be replaced with depreciation expense for lease assets and finance expense for lease liabilities. IFRS 16 includes an overall disclosure objective and requires a company to disclose (a) information about lease assets and expenses and cash

33 Teck Resources Limited 2018 Second Quarter News Release
flows related to leases, (b) a maturity analysis of lease liabilities, and (c) any additional company-specific information that is relevant to satisfying the disclosure objective. IFRS 16 is effective from January 1, 2019. We are currently assessing and quantifying the effect of this standard on our financial statements. During the second quarter, we continued our scoping of contracts across our operations and commenced a detailed review of contracts. We also began developing calculation methodologies and draft financial statement disclosures. On the transition date of January 1, 2019, we expect to recognize additional leases on our consolidated balance sheet, which will increase our debt and property, plant and equipment balances. As a result of recognizing additional finance leases, we expect a reduction in our cost of sales, as operating lease expense will be replaced by depreciation expense and finance expense.
OUTSTANDING SHARE DATA As at July 25, 2018, there were 566.9 million Class B subordinate voting shares and 7.8 million Class A common shares outstanding. In addition, there were approximately 21 million stock options outstanding with exercise prices ranging between $4.15 and $58.80 per share. More information on these instruments and the terms of their conversion is set out in Note 23 of our 2017 audited financial statements.
INTERNAL CONTROL OVER FINANCIAL REPORTING Our management is responsible for establishing and maintaining adequate internal control over financial reporting. Any system of internal control over financial reporting, no matter how well designed, has inherent limitations. Therefore, even those systems determined to be effective can provide only reasonable assurance with respect to financial statement preparation and presentation. There have been no significant changes in our internal controls during the quarter ended June 30, 2018 that have materially affected, or are reasonably likely to materially affect, internal control over financial reporting except as noted below. During the quarter ended June 30, 2018, we completed our implementation of internal controls over the financial reporting relating to our interest in the Fort Hills oil sands mining and processing operations, where commissioning was completed in the period and we have included operating results from Fort Hills in our consolidated results from June 1, 2018.
CRITICAL ACCOUNTING ESTIMATES AND JUDGMENTS In preparing consolidated financial statements, management makes estimates and judgments that affect the reported amounts of assets, liabilities, revenue and expenses across all reportable segments. Management makes estimates and judgments that are believed to be reasonable under the circumstances. Our estimates and judgments are based on historical experience and other factors we consider to be reasonable, including expectations of future events. Critical accounting estimates and judgments are those that could affect the consolidated financial statements materially, entail significant uncertainty and where changes are reasonably likely to occur from period to period. The judgments and other sources of estimation uncertainty that have a risk of resulting in a material adjustment to the carrying amounts of assets and liabilities within
34 Teck Resources Limited 2018 Second Quarter News Release
the next year include the recoverable amounts of long-lived assets, determination of the available for use date for property, plant and equipment, joint arrangements, streaming transactions, estimated recoverable reserves and resources and the valuation of other assets and liabilities such as decommissioning and restoration provisions and the accounting for income taxes. Our critical estimates and judgments are consistent with those reported in our 2017 annual consolidated financial statements and Management’s Discussion and Analysis. For streaming transactions, affected by the adoption of IFRS 15, we outlined our revised estimates and judgments disclosures in our Management’s Discussion and Analysis and interim consolidated financial statements as at March 31, 2018 and there are no changes to these estimates or judgments as at June 30, 2018.

35 Teck Resources Limited 2018 Second Quarter News Release
REVENUES AND GROSS PROFIT Our revenue and gross profit by business unit are summarized in the tables below:
Three months ended June 30,
Six months ended June 30,
(Teck’s share in CAD$ millions) 2018 2017 2018 2017
REVENUES
Steelmaking coal $ 1,582 $ 1,610 $ 3,170 $ 3,229 Copper
Highland Valley Copper 249 158 537 297
Antamina 297 243 555 435
Quebrada Blanca 64 40 120 94
Carmen de Andacollo 121 121 258 249
731 562 1,470 1,075 Zinc
Trail Operations 521 562 1,106 1,138
Red Dog 245 193 581 439
Pend Oreille 19 24 46 49
Other 2 2 4 4
Intra-segment sales (162) (121) (347) (255)
625 660 1,390 1,375 Energy1 78 – 78 – TOTAL REVENUES $ 3,016 $ 2,832 $ 6,108 $ 5,679
GROSS PROFIT (LOSS)
Steelmaking coal $ 771 $ 801 $ 1,587 $ 1,764 Copper
Highland Valley Copper 63 (2) 149 (42)
Antamina 193 140 360 239
Quebrada Blanca (3) (39) (7) (93)
Carmen de Andacollo 22 20 67 53
Other – – (1) (2)
275 119 568 155 Zinc
Trail Operations 30 44 99 91
Red Dog 161 114 342 235
Pend Oreille (9) (4) (8) (8)
Other 12 (1) 12 (1)
194 153 445 317
Energy1 1 – 1 –
TOTAL GROSS PROFIT $ 1,241 $ 1,073 $ 2,601 $ 2,236
Note: 1) Energy results are effective from June 1, 2018.

36 Teck Resources Limited 2018 Second Quarter News Release
COST OF SALES SUMMARY Our cost of sales information by business unit is summarized in the tables below:
Three months ended June 30,
Six months ended June 30,
(Teck’s share in CAD$ millions) 2018 2017 2018 2017
OPERATING COSTS
Steelmaking coal $ 384 $ 372 $ 733 $ 687 Copper
Highland Valley Copper 133 110 273 234
Antamina 57 53 107 104
Quebrada Blanca 45 42 81 90
Carmen de Andacollo 77 76 144 145
Other – – 1 2
312 281 606 575
Zinc
Trail Operations 113 111 212 211
Red Dog 26 27 65 68
Pend Oreille 24 19 47 40
Other (10) 3 (8) 5
153 160 316 324
Energy1 35 – 35 –
Total operating costs $ 884 $ 813 $ 1,690 $ 1,586
TRANSPORTATION COSTS
Steelmaking coal $ 238 $ 242 $ 470 $ 432 Copper
Highland Valley Copper 10 8 20 14
Antamina 8 7 14 12
Quebrada Blanca – – 1 1
Carmen de Andacollo 5 5 12 12
23 20 47 39
Zinc
Trail Operations 39 34 73 71
Red Dog 17 16 40 38
Pend Oreille 1 1 1 1
57 51 114 110 Energy1 8 – 8 –
Total transportation costs $ 326 $ 313 $ 639 $ 581
Note: 1) Energy results are effective from June 1, 2018.

37 Teck Resources Limited 2018 Second Quarter News Release
COST OF SALES SUMMARY, continued
Three months
ended June 30, Six months
ended June 30,
(Teck’s share in CAD$ millions) 2018 2017 2018 2017
CONCENTRATE AND DILUENT PURCHASES
Zinc concentrate purchases
Trail Operations $ 321 $ 353 $ 685 $ 725
Intra-segment purchases (162) (121) (347) (255)
159 232 338 470
Energy — diluent purchases1 22 – 22 –
Total concentrate purchases and diluent $ 181 $ 232 $ 360 $ 470 ROYALTY COSTS
Steelmaking coal $ 3 $ 3 $ 7 $ 8 Copper
Antamina 6 8 12 13 Zinc
Red Dog 22 21 96 70
Total royalty costs $ 31 $ 32 $ 115 $ 91
DEPRECIATION AND AMORTIZATION
Steelmaking coal $ 186 $ 192 $ 373 $ 338 Copper
Highland Valley Copper 43 42 95 91
Antamina 33 35 62 67
Quebrada Blanca 22 37 45 96
Carmen de Andacollo 17 20 35 39
115 134 237 293 Zinc
Trail Operations 18 20 37 40
Red Dog 19 15 38 28
Pend Oreille 3 8 6 16
40 43 81 84 Energy1 12 – 12 –
Total depreciation and amortization $ 353 $ 369 $ 703 $ 715
TOTAL COST OF SALES $ 1,775 $ 1,759 $ 3,507 $ 3,443
Note: 1) Energy results are effective from June 1, 2018.

38 Teck Resources Limited 2018 Second Quarter News Release
CAPITALIZED STRIPPING COSTS
Three months
ended June 30, Six months
ended June 30,
(Teck’s share in CAD$ millions) 2018 2017 2018 2017
Steelmaking coal $ 130 $ 132 $ 279 $ 238 Copper
Highland Valley Copper 19 14 41 31
Antamina 21 20 40 40
Carmen de Andacollo 1 1 3 1
41 35 84 72 Zinc
Red Dog 4 6 9 15
Total $ 175 $ 173 $ 372 $ 325

39 Teck Resources Limited 2018 Second Quarter News Release
PRODUCTION AND SALES STATISTICS Production statistics for each of our operations are presented in the tables below. Operating results are on a 100% basis.
Three months ended June 30,
Six months ended June 30,
Steelmaking coal 2018 2017 2018 2017
Waste production (million BCM’s) 70.5 68.3 141.9 128.7
Clean coal production (million tonnes) 6.3 6.8 12.5 12.9
Clean coal strip ratio (waste BCM’s/coal tonnes) 11.1:1 10.1:1 11.3:1 10.0:1
Sales (million tonnes) 6.6 7.1 12.7 12.8
Highland Valley Copper
Tonnes mined (000's) 27,778 28,643 54,743 56,824
Tonnes milled (000's) 12,441 12,375 24,653 24,883
Copper
Grade (%) 0.28 0.23 0.28 0.21
Recovery (%) 80.1 74.7 78.4 72.3
Production (000's tonnes) 27.7 21.1 55.0 37.5
Sales (000's tonnes) 26.2 19.8 57.1 37.5
Molybdenum
Production (million pounds) 2.2 2.2 4.8 3.8
Sales (million pounds) 2.0 2.0 4.4 3.6
Antamina Tonnes mined (000's) 59,002 62,254 117,087 118,025
Tonnes milled (000's)
Copper-only ore 6,901 7,704 14,265 15,685
Copper-zinc ore 6,072 5,525 10,874 9,499
12,973 13,229 25,139 25,184
Copper1
Grade (%) 0.91 1.00 0.95 0.94
Recovery (%) 89.0 89.4 90.0 88.6
Production (000's tonnes) 106.3 118.5 214.5 208.2
Sales (000's tonnes) 112.7 113.5 211.2 206.2
Zinc1
Grade (%) 2.27 2.00 2.25 2.04
Recovery (%) 88.3 88.6 88.4 88.5
Production (000's tonnes) 126.5 102.3 216.4 174.9
Sales (000's tonnes) 116.4 98.2 209.4 181.4
Molybdenum
Production (million pounds) 1.7 2.1 4.4 2.3
Sales (million pounds) 2.6 – 5.9 – Note: 2) Copper ore grades and recoveries apply to all of the processed ores. Zinc ore grades and recoveries apply to copper-zinc ores
only.

40 Teck Resources Limited 2018 Second Quarter News Release
PRODUCTION AND SALES STATISTICS, continued
Three months
ended June 30, Six months
ended June 30, Quebrada Blanca 2018 2017 2018 2017
Tonnes mined (000's) 3,367 3,056 7,163 6,183
Tonnes placed (000's)
Heap leach ore – – – 622
Dump leach ore 2,238 1,840 4,777 3,372
2,238 1,840 4,777 3,994
Grade (SCu%)1
Heap leach ore – – – 0.42
Dump leach ore 0.38 0.24 0.34 0.27
Production (000's tonnes)
Heap leach ore 1.5 2.5 2.8 6.9
Dump leach ore 5.4 2.8 10.2 5.3
6.9 5.3 13.0 12.2
Sales (000's tonnes) 7.1 5.2 13.4 12.2
Note: 1) For heap leach and dump leach operations, copper grade is reported as % soluble copper (SCu%) rather than % total copper.
Carmen de Andacollo
Tonnes mined (000’s) 5,847 6,598 11,649 13,329
Tonnes milled (000’s) 4,440 3,932 8,770 8,344
Copper
Grade (%) 0.40 0.46 0.40 0.48
Recovery (%) 86.5 89.3 87.0 89.2
Production (000’s tonnes) 15.1 16.2 30.7 35.8
Sales (000’s tonnes) 13.9 16.9 30.4 34.8
Gold1
Production (000’s ounces) 13.1 12.2 27.1 26.8
Sales (000’s ounces) 12.5 12.6 27.9 24.9
Copper cathode
Production (000’s tonnes) 0.9 0.8 2.0 1.6
Sales (000’s tonnes) 1.3 1.1 2.1 1.8 Note: 1) Carmen de Andacollo processes 100% of gold mined, 100% of the gold produced is for the account of Royal Gold, Inc. until
900,000 ounces have been delivered, and 50% thereafter.

41 Teck Resources Limited 2018 Second Quarter News Release
PRODUCTION AND SALES STATISTICS, continued
Three months
ended June 30, Six months
ended June 30, Trail Operations 2018 2017 2018 2017
Concentrate treated (000’s tonnes)
Zinc 141 133 287 282
Lead 28 39 64 81 Metal production
Zinc (000's tonnes) 74.6 73.4 153.6 151.6 Lead (000's tonnes) 16.2 22.2 36.1 46.0 Silver (million ounces) 3.3 5.9 7.6 11.6
Gold (000's ounces) 9.8 10.4 20.8 19.4
Metal sales
Zinc (000's tonnes) 76.9 73.9 154.2 149.6 Lead (000's tonnes) 14.9 21.4 33.5 45.0 Silver (million ounces) 3.2 6.0 7.4 11.7 Gold (000's ounces) 10.5 10.2 21.4 18.8
Red Dog Tonnes mined (000's) 2,765 2,947 5,668 5,776
Tonnes milled (000's) 1,112 1,117 2,025 2,136
Zinc
Grade (%) 16.4 14.2 16.2 14.4
Recovery (%) 84.4 80.6 83.9 80.4
Production (000's tonnes) 153.6 127.8 275.1 248.3
Sales (000's tonnes) 83.8 83.3 195.0 188.8
Lead
Grade (%) 4.7 5.2 4.6 5.3
Recovery (%) 48.8 54.7 48.9 53.2
Production (000's tonnes) 25.7 31.6 45.4 60.5
Sales (000's tonnes) – – – –
Pend Oreille Tonnes mined (000's) 250 158 411 349
Tonnes milled (000's) 105 122 232 264
Zinc
Grade (%) 6.3 6.9 6.1 7.1
Recovery (%) 87.2 84.9 88.1 86.7
Production (000's tonnes) 5.8 7.2 12.5 16.3
Sales (000's tonnes) 5.6 7.3 13.0 16.4
Lead
Grade (%) 0.7 1.1 0.8 1.5
Recovery (%) 54.3 62.0 59.6 69.6
Production (000's tonnes) 0.4 0.9 1.1 2.8
Sales (000's tonnes) 0.4 1.0 1.2 2.8

42 Teck Resources Limited 2018 Second Quarter News Release
USE OF NON-GAAP FINANCIAL MEASURES Our financial results are prepared in accordance with International Financial Reporting Standards (IFRS). This document refers to adjusted profit, adjusted earnings per share, EBITDA, adjusted EBITDA, gross profit before depreciation and amortization, gross profit margins before depreciation, cash unit costs, adjusted cash costs of sales, cash margins for by-products, adjusted revenue, operating netback, net debt, debt to debt-plus-equity ratio, the net debt to net debt-plus-equity ratio, debt to EBITDA ratio and net debt to EBITDA ratio, which are not measures recognized under IFRS in Canada and do not have a standardized meaning prescribed by IFRS or Generally Accepted Accounting Principles (GAAP) in the United States. For adjusted profit, we adjust profit attributable to shareholders as reported to remove the effect (after taxes) of certain types of transactions that in our judgment are not indicative of our normal operating activities or do not necessarily occur on a regular basis. EBITDA is profit attributable to shareholders before net finance expense, income and resource taxes, and depreciation and amortization. Adjusted EBITDA is EBITDA before the pre-tax effect of the adjustments that we make to profit attributable to shareholders as described above. These adjustments to profit attributable to shareholders and EBITDA highlight items and allow us and readers to analyze the rest of our results more clearly. We believe that disclosing these measures assist readers in understanding the ongoing cash generating potential of our business in order to provide liquidity to fund working capital needs, service outstanding debt, fund future capital expenditures and investment opportunities, and pay dividends. Gross profit before depreciation and amortization is gross profit with the depreciation and amortization expense added back. Gross profit margins before depreciation are gross profit before depreciation and amortization, divided by revenue for each respective business unit. Unit costs are calculated by dividing the cost of sales for the principal product by sales volumes. We include this information as it is frequently requested by investors and investment analysts who use it to assess our cost structure and margins and compare it to similar information provided by many companies in our industry. Operating netbacks per barrel in our energy business unit are calculated as blended bitumen sales revenue net of diluent expenses, also referred to as bitumen price realized, less royalties, transportation and operating expenses divided by barrels of bitumen sold. We include this information as investors and investment analysts use it to measure our profitability on a per barrel basis and compare it to similar information provided by other companies in the oil sands industry. We sell both copper concentrates and refined copper cathodes. The price for concentrates sold to smelters is based on average London Metal Exchange prices over a defined quotational period, from which processing and refining deductions are made. In addition, we are paid for an agreed percentage of the copper contained in concentrates, which constitutes payable pounds. Adjusted revenue excludes the revenue from co-products and by-products, but adds back the processing and refining allowances to arrive at the value of the underlying payable pounds of copper. Readers may compare this on a per unit basis with the price of copper on the LME. Adjusted cash cost of sales for our steelmaking coal operations is defined as the cost of the product as it leaves the mine excluding depreciation and amortization charges. Adjusted cash cost of sales for our copper operations is defined as the cost of the product delivered to the port

43 Teck Resources Limited 2018 Second Quarter News Release
of shipment, excluding depreciation and amortization charges. It is common practice in the industry to exclude depreciation and amortization as these costs are ‘non-cash’ and discounted cash flow valuation models used in the industry substitute expectations of future capital spending for these amounts. In order to arrive at adjusted cash costs of sales for copper we also deduct the costs of by-products and co-products. Total cash unit costs include the smelter and refining allowances added back in determining adjusted revenue. This presentation allows a comparison of unit costs, including smelter allowances, to the underlying price of copper in order to assess the margin. Unit costs, after deducting co-product and by-product margins, are also a common industry measure. By deducting the co- and by-product margin per unit of the principal product, the margin for the mine on a per unit basis may be presented in a single metric for comparison to other operations. Readers should be aware that this metric, by excluding certain items and reclassifying cost and revenue items, distorts our actual production costs as determined under IFRS. Net debt is total debt less cash and cash equivalents. The debt to debt-plus-equity ratio takes total debt as reported and divides that by the sum of total debt plus total equity. The net debt to net debt-plus-equity ratio is net debt divided by the sum of net debt plus total equity, expressed as a percentage. The debt to EBITDA ratio takes total debt as reported and divides that by EBITDA for the twelve months ended at the reporting period, expressed as the number of times EBITDA needs to be earned to repay all of the outstanding debt. The net debt to EBITDA ratio is the same calculation as the debt to EBITDA ratio, but using net debt as the numerator. These measures are disclosed, as we believe they provide readers with information that allows them to assess our credit capacity and the ability to meet our short and long-term financial obligations. The measures described above do not have standardized meanings under IFRS, may differ from those used by other issuers, and may not be comparable to such measures as reported by others. These measures have been derived from our financial statements and applied on a consistent basis as appropriate. We disclose these measures because we believe they assist readers in understanding the results of our operations and financial position and are meant to provide further information about our financial results to investors. These measures should not be considered in isolation or used in substitute for other measures of performance prepared in accordance with IFRS. Reconciliation of Basic Earnings per share to Adjusted Basic Earnings per share
Three months ended June 30,
Six months ended June 30,
(Per share amounts) 2018 2017 2018 2017
Basic earnings per share $ 1.10 $ 1.00 $ 2.43 $ 1.97
Add (deduct):
Debt repurchase losses – 0.05 – 0.28
Debt prepayment option loss (gain) 0.03 (0.03) 0.05 (0.06)
Asset sales and provisions 0.01 – – (0.01)
Foreign exchange (gains) losses – (0.02) – (0.04)
Other – – (0.03) –
Adjusted basic earnings per share $ 1.14 $ 1.00 $ 2.45 $ 2.14

44 Teck Resources Limited 2018 Second Quarter News Release
Reconciliation of Diluted Earnings per share to Adjusted Diluted Earnings per share
Three months ended June 30,
Six months ended June 30,
(Per share amounts) 2018 2017 2018 2017
Diluted earnings per share $ 1.09 $ 0.99 $ 2.39 $ 1.94
Add (deduct):
Debt repurchase losses – 0.05 – 0.28
Debt prepayment option loss (gain) 0.03 (0.03) 0.05 (0.06)
Asset sales and provisions – – – (0.01)
Foreign exchange (gains) losses – (0.02) – (0.04)
Other – – (0.03) –
Adjusted diluted earnings per share $ 1.12 $ 0.99 $ 2.41 $ 2.11
Reconciliation of Net Debt to EBITDA Ratio
(A) Twelve
months ended December 31, 2017
(B) Six Months ended
June 30, 2017
(C) Six months
ended June 30,
2018
(A-B+C) Twelve
months ended June 30, 2018
Profit attributable
to shareholders $ 2,460 $ 1,136 $ 1,393 $ 2,717
Finance expense net of finance income 212 134 87 165
Provision for income taxes 1,425 671 775 1,529
Depreciation and amortization 1,492 715 703 1,480
EBITDA $ 5,589 (D) $ 2,656 $ 2,958 $ 5,891 (E)
Total debt at period end $ 6,369 $ 6,619
Less: cash and cash equivalents at period end (952) (1,631)
Net debt $ 5,417 (F) $ 4,988 (G)
Debt to EBITDA ratio 1.1 1.1
Net Debt to EBITDA ratio 1.0 (F/D) 0.8 (G/E)
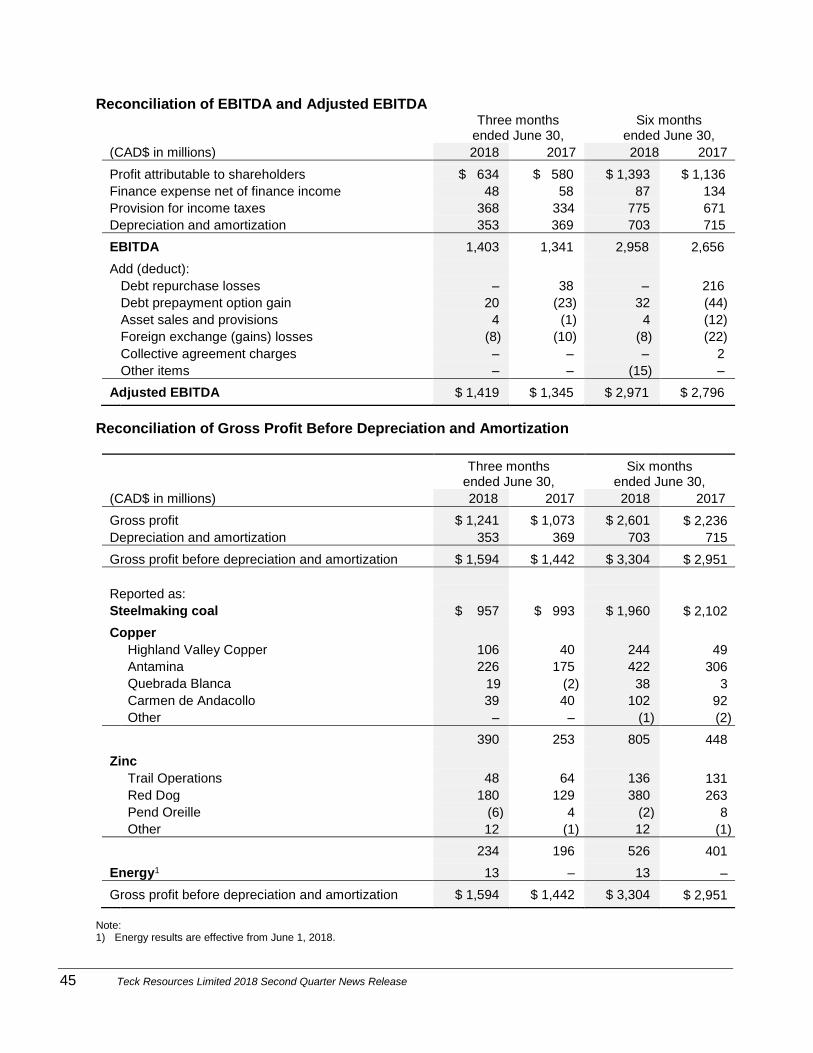
45 Teck Resources Limited 2018 Second Quarter News Release
Reconciliation of EBITDA and Adjusted EBITDA
Three months ended June 30,
Six months ended June 30,
(CAD$ in millions) 2018 2017 2018 2017
Profit attributable to shareholders $ 634 $ 580 $ 1,393 $ 1,136
Finance expense net of finance income 48 58 87 134
Provision for income taxes 368 334 775 671
Depreciation and amortization 353 369 703 715
EBITDA 1,403 1,341 2,958 2,656 Add (deduct):
Debt repurchase losses – 38 – 216
Debt prepayment option gain 20 (23) 32 (44)
Asset sales and provisions 4 (1) 4 (12)
Foreign exchange (gains) losses (8) (10) (8) (22)
Collective agreement charges – – – 2
Other items – – (15) –
Adjusted EBITDA $ 1,419 $ 1,345 $ 2,971 $ 2,796
Reconciliation of Gross Profit Before Depreciation and Amortization
Three months ended June 30,
Six months ended June 30,
(CAD$ in millions) 2018 2017 2018 2017
Gross profit $ 1,241 $ 1,073 $ 2,601 $ 2,236
Depreciation and amortization 353 369 703 715
Gross profit before depreciation and amortization $ 1,594 $ 1,442 $ 3,304 $ 2,951
Reported as:
Steelmaking coal $ 957 $ 993 $ 1,960 $ 2,102 Copper
Highland Valley Copper 106 40 244 49
Antamina 226 175 422 306
Quebrada Blanca 19 (2) 38 3
Carmen de Andacollo 39 40 102 92
Other – – (1) (2)
390 253 805 448 Zinc
Trail Operations 48 64 136 131
Red Dog 180 129 380 263
Pend Oreille (6) 4 (2) 8
Other 12 (1) 12 (1)
234 196 526 401 Energy1 13 – 13 –
Gross profit before depreciation and amortization $ 1,594 $ 1,442 $ 3,304 $ 2,951
Note: 1) Energy results are effective from June 1, 2018.

46 Teck Resources Limited 2018 Second Quarter News Release
Steelmaking Coal Unit Cost Reconciliation
Three months
ended June 30, Six months
ended June 30,
(CAD$ in millions, except where noted) 2018 2017 2018 2017 Cost of sales as reported $ 811 $ 809 $ 1,583 $ 1,465
Less:
Transportation (238) (242) (470) (432)
Depreciation and amortization (186) (192) (373) (338)
Adjusted cash cost of sales $ 387 $ 375 $ 740 $ 695
Tonnes sold (millions) 6.6 7.1 12.7 12.8 Per unit costs — CAD$/tonne
Adjusted cash cost of sales $ 59 $ 53 $ 58 $ 54
Transportation 36 34 37 34
Cash unit costs — CAD$/tonne $ 95 $ 87 $ 95 $ 88
US$ AMOUNTS
Average exchange rate (CAD$ per US$1.00) $ 1.29 $ 1.35 $ 1.28 $ 1.33
Per unit costs — US$/tonne1
Adjusted cash cost of sales $ 45 $ 39 $ 46 $ 41
Transportation 28 26 29 25
Cash unit costs — US$/tonne $ 73 $ 65 $ 75 $ 66
Note: 1) Average period exchange rates are used to convert to US$/tonne equivalent.

47 Teck Resources Limited 2018 Second Quarter News Release
Copper Unit Cost Reconciliation
Three months
ended June 30, Six months
ended June 30,
(CAD$ in millions, except where noted) 2018 2017 2018 2017 Revenue as reported $ 731 $ 562 $ 1,470 $ 1,075
By-product revenue (A)1 (131) (99) (257) (169)
Smelter processing charges 40 45 80 86
Adjusted revenue $ 640 $ 508 $ 1,293 $ 992
Cost of sales as reported $ 456 $ 443 $ 902 $ 920
Less:
Depreciation and amortization (115) (134) (237) (293)
Inventory write-downs (3) (6) (3) (13)
Collective agreement charges – – – (2)
By-product cost of sales (B)1 (18) (16) (31) (29)
Adjusted cash cost of sales $ 320 $ 287 $ 631 $ 583
Payable pounds sold (millions) (C) 157.9 146.3 321.6 283.3 Adjusted per unit cash costs — CAD$/pound
Adjusted cash cost of sales $ 2.03 $ 1.96 $ 1.96 $ 2.06
Smelter processing charges 0.25 0.31 0.25 0.30
Total cash unit costs — CAD$/pound (D) $ 2.28 $ 2.27 $ 2.21 $ 2.36 Cash margin for by-products — CAD$/pound ((A – B)/C)1 (0.72) (0.57) (0.70) (0.49)
Net cash unit cost CAD$/pound2 $ 1.56 $ 1.70 $ 1.51 $ 1.87
US$ AMOUNTS
Average exchange rate (CAD$ per US$1.00) $ 1.29 $ 1.35 $ 1.28 $ 1.33 Adjusted per unit costs — US$/pound3
Adjusted cash cost of sales $ 1.57 $ 1.46 $ 1.54 $ 1.54
Smelter processing charges 0.20 0.23 0.19 0.23
Total cash unit costs — US$/pound $ 1.77 $ 1.69 $ 1.73 $ 1.77 Cash margin for by-products — US$/pound (0.56) (0.43) (0.55) (0.37)
Net cash unit costs — US$/pound $ 1.21 $ 1.26 $ 1.18 $ 1.40
Notes: 1) By-products includes both by-products and co-products. By-product costs of sales also includes cost recoveries associated with
our streaming transactions. 2) Net cash unit cost of principal product after deducting co-product and by-product margins per unit of principal product and
excluding depreciation and amortization. 3) Average period exchange rates are used to convert to US$/lb equivalent.

48 Teck Resources Limited 2018 Second Quarter News Release
Zinc Unit Cost Reconciliation (Mining Operations1)
Three months
ended June 30,
Six months
ended June 30,
(CAD$ in millions, except where noted) 2018 2017 2018 2017 Revenue as reported $ 625 $ 660 $ 1,390 $ 1,375 Less: Trail Operations revenues as reported (521) (562) (1,106) (1,138) Other revenues as reported (2) (2) (4) (4) Add back: Intra-segment sales as reported 162 121 347 255
$ 264 $ 217 $ 627 $ 488 By-product revenues (A)2 (6) (6) (10) (12) Smelter processing charges 51 59 123 139
Adjusted revenue $ 309 $ 270 $ 740 $ 615
Cost of sales as reported $ 431 $ 507 $ 945 $ 1,058 Less: Trail Operations cost of sales as reported (491) (518) (1,007) (1,047) Other costs as reported 10 (3) 8 (5) Add back: Intra-segment purchases as reported 162 121 347 255
$ 112 $ 107 $ 293 $ 261 Less: Depreciation and amortization (22) (23) (44) (44) Royalty costs (22) (21) (96) (70)
Adjusted cash cost of sales $ 68 $ 63 $ 153 $ 147
Payable pounds sold (millions) (C) 167.5 169.7 389.6 384.5 Adjusted per unit costs — CAD$/pound Adjusted cash cost of sales $ 0.41 $ 0.37 $ 0.39 $ 0.38 Smelter processing charges 0.30 0.35 0.32 0.36
Total cash unit costs — CAD$/pound $ 0.71 $ 0.72 $ 0.71 $ 0.74 Cash margin for by-products — CAD$/pound (A/C) 2 (0.04) (0.04) (0.03) (0.03)
Net cash unit cost CAD$/pound3 $ 0.67 $ 0.68 $ 0.68 $ 0.71
US$ amounts Average exchange rate (CAD$ per US$1.00) $ 1.29 $ 1.35 $ 1.28 $ 1.33 Adjusted per unit costs — US$/pound4 Adjusted cash cost of sales $ 0.31 $ 0.27 $ 0.30 $ 0.29 Smelter processing charges 0.24 0.26 0.25 0.27
Total cash unit costs — US$/pound $ 0.55 $ 0.53 $ 0.55 $ 0.56 Cash margin for by-products — US$/pound (0.03) (0.03) (0.02) (0.03)
Net cash unit cost US$/pound $ 0.52 $ 0.50 $ 0.53 $ 0.53 Notes: 1) Red Dog and Pend Oreille. 2) By-products includes both by-products and co-products. 3) Net cash unit cost of principal product after deducting co-product and by-product margins per unit of principal product and
excluding depreciation, amortization and royalty costs. 4) Average period exchange rates are used to convert to US$/lb equivalent.

49 Teck Resources Limited 2018 Second Quarter News Release
Energy Business Unit — Operating Netback Reconciliation June
(CAD$ in millions, except where noted) 2018 Revenue as reported $ 78 Less: Cost of diluent for blending (22) Add back: crown royalties1 (D) 3
Adjusted revenue (A) $ 59
Cost of sales as reported $ 77 Less: Depreciation and amortization (12)
Cash cost of sales $ 65 Less: Cost of diluent for blending (22) Transportation (C) (8)
Adjusted cash cost of sales (E) $ 35
Blended bitumen barrels sold (000s of barrels) 1,162 Less diluent barrels included in blended bitumen (000s of barrels) (244)
Bitumen barrels sold (000s of barrels) (B) 918 Per barrel amounts — CAD$/barrel Bitumen price realized (adjusted revenue) (A/B) $ 64.59 Crown royalties (D/B) (3.59) Transportation (C/B) (8.90) Operating costs (E/B) (38.25)
Operating netback — CAD$/barrel $ 13.85 Notes: 1) Revenue is reported after deduction of crown royalties. 2) Calculated per unit amounts may differ due to rounding.
Blended Bitumen Price Realized Reconciliation Revenue as reported $ 78 Add back: crown royalties1 3
Blended bitumen revenue (A) $ 81 Blended bitumen barrels sold (000s of barrels) (B) 1,162 Blended bitumen price realized — (CAD$/barrel) (A/B) = D $ 70.00 Average exchange rate (C) 1.31 Blended bitumen price realized — (US$/barrel) (D/C) $ 53.32

50 Teck Resources Limited 2018 Second Quarter News Release
CAUTIONARY STATEMENT ON FORWARD-LOOKING STATEMENTS This news release contains certain forward-looking information and forward-looking statements as defined in applicable securities laws (collectively referred to in this news release as “forward-looking statements”). All statements other than statements of historical fact are forward-looking statements. Forward-looking statements involve known and unknown risks, uncertainties and other factors, which may cause the actual results, performance or achievements of Teck to be materially different from any future results, performance or achievements expressed or implied by the forward-looking statements. These forward-looking statements, including under the headings “Outlook,” that appear in various places in this release, include estimates, forecasts, and statements as to management’s expectations with respect to, among other things, anticipated global and regional supply and demand for our commodities, production, sales and unit cost guidance and forecasts for our products and individual operations, capital expenditure guidance, capitalized stripping guidance, mine lives and duration of operations at our various mines and operations, expectation that full production capacity at Fort Hills will be achieved by the beginning of the fourth quarter of 2018, our statement that we are well positioned for ongoing profitability and strong cash flows, our expectation that coal production volumes can be adjusted to reflect market demand, potential to extend the mine life at Cardinal River, planned 2018 capital spending relating to the Elk Valley Water Quality Plan and timing of recommissioning of the West Line Creek Active Water Treatment Facility, potential of our R&D projects to significantly reduce capital and operating costs for water treatment in the Elk Valley, anticipated completion date for the D3 mill project at Highland Valley, timing of SEIA approval and development decision for Quebrada Blanca Phase 2, Quebrada Blanca Phase 2 mine life and production capacity projections and expectations regarding partnering for the project, expected spending and activities on our Project Satellite properties, impact of certain accounting initiatives and estimates, all guidance appearing in this presentation including but not limited to the production, sales, unit cost and capital expenditure guidance under the heading “Guidance”, the sensitivity of our profit and EBITDA to changes in currency exchange rates and commodity price changes, the expectation that our efforts have helped insulate our company from the effects of price volatility and the statement that there is a positive outlook for the company and demand and market outlook for commodities and our products. These forward-looking statements involve numerous assumptions, risks and uncertainties and actual results may vary materially. These statements are based on a number of assumptions, including, but not limited to, assumptions regarding general business and economic conditions, the supply and demand for, deliveries of, and the level and volatility of prices of, zinc, copper and steelmaking coal and other primary metals and minerals as well as oil, and related products, the timing of the receipt of regulatory and governmental approvals for our development projects and other operations, our costs of production and production and productivity levels, as well as those of our competitors, power prices, continuing availability of water and power resources for our operations, market competition, the accuracy of our reserve estimates (including with respect to size, grade and recoverability) and the geological, operational and price assumptions on which these are based, conditions in financial markets, the future financial performance of the company, our ability to attract and retain skilled staff, our ability to procure equipment and operating supplies, positive results from the studies on our expansion projects, our steelmaking coal and other product inventories, our ability to secure adequate transportation, including rail and port service, for our products, assumptions that rail and port services perform adequately, our ability to obtain permits for our operations and expansions, and our ongoing relations with

51 Teck Resources Limited 2018 Second Quarter News Release
our employees and business partners and joint venturers. Assumptions regarding Quebrada Blanca Phase 2 are based on current project assumptions and the final Feasibility Study. Assumptions regarding the benefits of R&D efforts to reduce water treatment costs are are based on the assumption that technologies will work on a wide scale. Our Guidance tables include footnotes with further assumptions. The foregoing list of assumptions is not exhaustive. Events or circumstances could cause actual results to vary materially. Factors that may cause actual results to vary materially include, but are not limited to, changes in commodity and power prices, changes in market demand for our products, changes in interest and currency exchange rates, acts of governments and the outcome of legal proceedings, inaccurate geological and metallurgical assumptions (including with respect to the size, grade and recoverability of mineral reserves and resources), unanticipated operational difficulties (including failure of plant, equipment or processes to operate in accordance with specifications or expectations, cost escalation, unavailability of materials and equipment, government action or delays in the receipt of government approvals, industrial disturbances or other job action, adverse weather conditions and unanticipated events related to health, safety and environmental matters), union labour disputes, political risk, social unrest, failure of customers or counterparties (including logistics suppliers) to perform their contractual obligations, changes in our credit ratings, unanticipated increases in costs to construct our development projects, difficulty in obtaining permits, inability to address concerns regarding permits of environmental impact assessments, and changes or further deterioration in general economic conditions. Our Fort Hills project is not controlled by us and schedules and costs may be adjusted by our partners, and timing of spending and continued development is not in our control. Current and new technologies relating to our Elk Valley water treatment efforts may not perform as anticipated. Statements concerning future production costs or volumes are based on numerous assumptions of management regarding operating matters and on assumptions that demand for products develops as anticipated, that customers and other counterparties perform their contractual obligations, that operating and capital plans will not be disrupted by issues such as mechanical failure, unavailability of parts and supplies, labour disturbances, interruption in transportation or utilities, adverse weather conditions, and that there are no material unanticipated variations in the cost of energy or supplies. Statements regarding anticipated steelmaking coal sales volumes and average steelmaking coal prices depend on timely arrival of vessels and performance of our steelmaking coal-loading facilities, as well as the level of spot pricing sales. We assume no obligation to update forward-looking statements except as required under securities laws. Further information concerning risks and uncertainties associated with these forward-looking statements and our business can be found in our Annual Information Form for the year ended December 31, 2017, filed under our profile on SEDAR (www.sedar.com) and on EDGAR (www.sec.gov) under cover of Form 40-F, as well as subsequent filings that can also be found under our profile. Scientific and technical information regarding our material mining projects in this quarterly report was approved by Mr. Rodrigo Alves Marinho, P.Geo., an employee of Teck. Mr. Marinho is a qualified person, as defined under National Instrument (NI) 43-101.

52 Teck Resources Limited 2018 Second Quarter News Release
WEBCAST Teck will host an Investor Conference Call to discuss its Q2/2018 financial results at 11:00 AM Eastern time, 8:00 AM Pacific time, on Thursday, July 26, 2018. A live audio webcast of the conference call, together with supporting presentation slides, will be available at our website at www.teck.com. The webcast will be archived at www.teck.com

53 Teck Resources Limited 2018 Second Quarter News Release
Teck Resources Limited Condensed Interim Consolidated Financial Statements For the Three and Six Months Ended June 30, 2018 (Unaudited)
Title Insert Date

54 Teck Resources Limited 2018 Second Quarter News Release
Teck Resources Limited Consolidated Statements of Income (Unaudited)
Three months
ended June 30,
Six months ended June 30,
(CAD$ in millions, except for share data) 2018 2017
(restated) 2018 2017
(restated)
Revenues (Note 3) $ 3,016 $ 2,832 $ 6,108 $ 5,679
Cost of sales (1,775) (1,759) (3,507) (3,443)
Gross profit 1,241 1,073 2,601 2,236
Other operating income (expenses)
General and administration (29) (24) (60) (56)
Exploration (13) (12) (27) (22)
Research and development (8) (13) (16) (25)
Other operating income (expense) (Note 4) (117) (45) (200) (33)
Profit from operations 1,074 979 2,298 2,100
Finance income 7 1 13 4
Finance expense (Note 5) (55) (59) (100) (138)
Non-operating income (expense) (Note 6) (12) (4) (24) (149) Share of income (loss) of associates and joint ventures (2) 3 (2) 4
Profit before taxes 1,012 920 2,185 1,821
Provision for income taxes (368) (334) (775) (671)
Profit for the period $ 644 $ 586 $ 1,410 $ 1,150
Profit attributable to:
Shareholders of the company $ 634 $ 580 $ 1,393 $ 1,136
Non-controlling interests 10 6 17 14
Profit for the period $ 644 $ 586 $ 1,410 $ 1,150
Earnings per share
Basic $ 1.10 $ 1.00 $ 2.43 $ 1.97
Diluted $ 1.09 $ 0.99 $ 2.39 $ 1.94
Weighted average shares outstanding (millions) 573.9 577.7 573.8 577.4 Weighted average diluted shares outstanding (millions) 582.6 586.2 583.0 586.6
Shares outstanding at end of period (millions) 574.6 577.8 574.6 577.8

55 Teck Resources Limited 2018 Second Quarter News Release
Teck Resources Limited Consolidated Statements of Comprehensive Income (Unaudited)
Three months
ended June 30, Six months
ended June 30,
(CAD$ in millions) 2018 2017
(restated) 2018 2017
(restated) Profit for the period $ 644 $ 586 $ 1,410 $ 1,150
Other comprehensive income (loss) in the period
Items that may be reclassified to profit
Currency translation differences (net of taxes of $14, $(16), $32 and $(25)) 82 (92) 185 (115)
Change in fair value of debt securities (2017 – change in fair value of available-for-sale financial instruments) (net of taxes of $nil, $1, $nil and $nil) – (4) – 3
Share of other comprehensive loss of associates and joint ventures – (1) – (5)
Items that will not be reclassified to profit
Change in fair value of marketable equity securities (net of taxes of $nil, $nil, $nil and $nil) (2) – – –
Remeasurements of retirement benefit plans (net of taxes of $(9), $5, $(18) and $(3)) 22 (12) 43 14
Total other comprehensive income (loss)
for the period 102 (109) 228 (103)
Total comprehensive income for the period $ 746 $ 477 $ 1,638 $ 1,047
Total other comprehensive income (loss) attributable to:
Shareholders of the company $ 98 $ (106) $ 221 $ (99)
Non-controlling interests 4 (3) 7 (4)
$ 102 $ (109) $ 228 $ (103)
Total comprehensive income attributable to:
Shareholders of the company $ 732 $ 474 $ 1,614 $ 1,037
Non-controlling interests 14 3 24 10
$ 746 $ 477 $ 1,638 $ 1,047

56 Teck Resources Limited 2018 Second Quarter News Release
Teck Resources Limited Consolidated Statements of Cash Flows (Unaudited)
Three months
ended June 30, Six months
ended June 30,
(CAD$ in millions) 2018 2017
(restated) 2018 2017
(restated)
Operating activities
Profit for the period $ 644 $ 586 $ 1,410 $ 1,150
Depreciation and amortization 353 369 703 715
Provision for income taxes 368 334 775 671
Loss (gain) on sale of investments and assets – (1) (2) (12)
Foreign exchange gains (8) (10) (8) (22)
Loss on debt repurchase – 38 – 216
Loss (gain) on debt prepayment options 20 (23) 32 (44)
Finance expense 55 59 100 138
Income taxes paid (349) (298) (525) (422)
Other 14 (10) 36 25
Net change in non-cash working capital items 10 364 (294) 286
1,107 1,408 2,227 2,701
Investing activities
Property, plant and equipment (345) (329) (805) (685)
Capitalized production stripping costs (175) (173) (372) (325)
Expenditures on financial investments and other assets (119) (32) (150) (71)
Proceeds from the sale of investments and other assets 25 13 60 90
(614) (521) (1,267) (991)
Financing activities
Repurchase and repayment of debt (8) (382) (44) (1,893)
Debt interest and finance charges paid (70) (87) (199) (263)
Issuance of Class B subordinate voting shares 17 1 45 8
Purchase and cancellation of Class B subordinate voting shares – – (58) –
Dividends paid (28) (58) (57) (58)
Distributions to non-controlling interests (10) (25) (22) (38)
(99) (551) (335) (2,244)
Effect of exchange rate changes on cash and cash equivalents 28 (26) 54 (27)
Increase (decrease) in cash and cash equivalents 422 310 679 (561)
Cash and cash equivalents at beginning of period 1,209 536 952 1,407
Cash and cash equivalents at end of period $ 1,631 $ 846 $ 1,631 $ 846

57 Teck Resources Limited 2018 Second Quarter News Release
Teck Resources Limited Consolidated Balance Sheets (Unaudited)
June 30, December 31,
(CAD$ in millions) 2018 2017
(restated)
ASSETS
Current assets
Cash and cash equivalents $ 1,631 $ 952
Current income taxes receivable 59 48
Trade and settlement receivables 1,268 1,419
Inventories 1,995 1,669
Other current assets 201 310
Assets held for sale 350 350
5,504 4,748
Financial and other assets 1,029 1,051
Investments in associates and joint ventures 1,009 943
Property, plant and equipment 29,853 29,045
Deferred income tax assets 133 154
Goodwill 1,106 1,087
$ 38,634 $ 37,028
LIABILITIES AND EQUITY
Current liabilities
Trade accounts payable and other liabilities $ 2,144 $ 2,290
Current income taxes payable 144 268
Debt (Note 7) 29 55
2,317 2,613
Debt (Note 7) 6,590 6,314
Deferred income tax liabilities 5,999 5,579
Retirement benefit liabilities 540 552
Other liabilities and provisions 1,815 1,977
17,261 17,035
Equity
Attributable to shareholders of the company 21,245 19,851
Attributable to non-controlling interests 128 142
21,373 19,993
$ 38,634 $ 37,028

58 Teck Resources Limited 2018 Second Quarter News Release
Teck Resources Limited Consolidated Statements of Changes in Equity (Unaudited)
Six months
ended June 30,
(CAD$ in millions) 2018 2017 (restated) Class A common shares
Beginning of period $ 6 $ 7
Class A share conversion – (1)
End of period 6 6
Class B subordinate voting shares
Beginning of period 6,603 6,637
Share repurchases (19) –
Issued on exercise of options 58 11
Class A shares conversion – 1
End of period 6,642 6,649
Retained earnings
Beginning of period 12,796 10,720
IFRS 9 transition adjustment on January 1, 2018 (Note 13(c)) 34 –
Profit for the period attributable to shareholders of the company 1,393 1,136
Dividends paid (57) (58)
Share repurchases (39) –
Purchase of non-controlling interests (159) –
Remeasurements of retirement benefit plans 43 14
End of period 14,011 11,812
Contributed surplus
Beginning of period 202 193
Share option compensation expense 8 8
Transfer to Class B subordinate voting shares on exercise of options (12) (2)
End of period 198 199 Accumulated other comprehensive income attributable to shareholders of the company
Beginning of period 244 450
IFRS 9 transition adjustment on January 1, 2018 (Note 13(c)) (34) –
Other comprehensive income (loss) 221 (99)
Less remeasurements of retirement benefit plans recorded in retained earnings (43) (14)
End of period 388 337
Non-controlling interests
Beginning of period 142 159
Profit for the period attributable to non-controlling interests 17 14
Other comprehensive income (loss) attributable to non-controlling interests 7 (4)
Purchase of non-controlling interests (16) –
Acquisition of AQM Copper Inc. – 18
Dividends or distributions (22) (38)
Other – (1)
1 End of period 128 148
Total equity $ 21,373 $ 19,151
Teck Resources Limited Notes to Condensed Interim Consolidated Financial Statements (Unaudited)
59 Teck Resources Limited 2018 Second Quarter News Release
1. BASIS OF PREPARATION
We prepare our annual consolidated financial statements in accordance with International Financial Reporting Standards (IFRS) as issued by the International Accounting Standards Board (IASB). These condensed interim consolidated financial statements have been prepared in accordance with IAS 34, Interim Financial Reporting (IAS 34).
These condensed interim consolidated financial statements should be read in conjunction with our most recent annual financial statements. These consolidated financial statements follow the same accounting policies and methods of application as our most recent annual financial statements, except for those policies disclosed in Note 2 to our consolidated financial statements for the first quarter ended March 31, 2018. Note 13 discloses the effects of the adoption of new IFRS pronouncements for all periods presented. On July 25, 2018, the Audit Committee of the Board of Directors authorized these consolidated financial statements for issuance.
2. SUMMARY OF SIGNIFICANT ACCOUNTING POLICIES Our significant accounting policies that were amended as a result of the adoption of IFRS 15, Revenue from Contracts with Customers (IFRS 15) and IFRS 9, Financial Instruments (IFRS 9) (Note 13) are consistent with those reported in our first quarter 2018 consolidated financial statements. As at June 1, 2018, our Fort Hills oil sands mining and processing operations were considered available for use and accordingly, we have included one month of operating results in our consolidated statement of income during the quarter ended June 30, 2018. Our revenue recognition policy for blended bitumen sales is outlined below. Revenue Our revenue consists of sales of steelmaking coal, copper, zinc and lead concentrates, refined zinc, lead and silver and blended bitumen. We also sell other by-products, including molybdenum concentrates, various refined specialty metals, chemicals and fertilizers. Our performance obligations relate primarily to the delivery of these products to our customers with each separate shipment representing a separate performance obligation. Revenue, including revenue from the sale of by-products, is recognized at the point in time when the customer obtains control of the product. Control is achieved when a product is delivered to the customer, we have a present right to payment for the product, significant risks and rewards of ownership have transferred to the customer according to contract terms and there is no unfulfilled obligation that could affect the customer’s acceptance of the product. Blended bitumen For blended bitumen, control of the product generally transfers to the customer when the product passes the delivery point as specified in the contract, which normally coincides with title and risk transfer to the customer. The majority of our blended bitumen is sold under pricing arrangements where final prices are determined based on commodity price indices that are finalized at or near the date of sale. Payments for blended bitumen sales are usually due and settled within thirty days. Our revenue for blended bitumen is net of royalty payments to governments.
2. SUMMARY OF SIGNIFICANT ACCOUNTING POLICIES, continued 2. SUMMARY OF SIGNIFICANT ACCOUNTING POLICIES, continued 2. SUMMARY OF SIGNIFICANT ACCOUNTING POLICIES, continued

Teck Resources Limited Notes to Condensed Interim Consolidated Financial Statements (Unaudited)
60 Teck Resources Limited 2018 Second Quarter News Release
3. REVENUES We adopted IFRS 15 on January 1, 2018, as outlined in Note 13(b). The following disclosures present our disaggregated revenue information as required by IFRS 15. a) Total Revenues by Major Product Type and Business Unit The following table shows our revenue disaggregated by major product type and by business unit. Our business units are reported based on the primary products that they produce and are consistent with our reportable segments (Note 9) that have revenue from contracts with customers. A business unit can have revenue from more than one commodity as it can include an operation that produces more than one product.
(CAD$ in millions) Three months ended June 30, 2018
Steelmaking Coal Copper Zinc Energy1 Total
Steelmaking coal $ 1,582 $ – $ – $ – $ 1,582
Copper – 601 – – 601
Zinc – 88 585 – 673
Silver – 4 73 – 77
Lead – – 48 – 48
Blended bitumen – – – 78 78
Other – 38 81 – 119
Intra-segment revenues – – (162) – (162)
$ 1,582 $ 731 $ 625 $ 78 $ 3,016
(CAD$ in millions) Three months ended June 30, 2017 (restated)
Steelmaking Coal Copper Zinc Energy Total
Steelmaking coal $ 1,610 $ – $ – $ – $ 1,610
Copper – 463 – – 463
Zinc – 70 483 – 553
Silver – 4 142 – 146
Lead – – 77 – 77
Blended bitumen – – – – –
Other – 25 79 – 104
Intra-segment revenues – – (121) – (121)
$ 1,610 $ 562 $ 660 $ – $ 2,832

Teck Resources Limited Notes to Condensed Interim Consolidated Financial Statements (Unaudited)
61 Teck Resources Limited 2018 Second Quarter News Release
3. REVENUES, continued (CAD$ in millions) Six months ended June 30, 2018
Steelmaking Coal Copper Zinc Energy1 Total
Steelmaking coal $ 3,170 $ – $ – $ – $ 3,170
Copper – 1,214 – – 1,214
Zinc – 161 1,297 – 1,458
Silver – 10 165 – 175
Lead – – 106 – 106
Blended bitumen – – – 78 78
Other – 85 169 – 254
Intra-segment revenues – – (347) – (347)
$ 3,170 $ 1,470 $ 1,390 $ 78 $ 6,108
(CAD$ in millions) Six months ended June 30, 2017 (restated)
Steelmaking Coal Copper Zinc Energy Total
Steelmaking coal $ 3,229 $ – $ – $ – $ 3,229
Copper – 906 – – 906
Zinc – 119 1,040 – 1,159
Silver – 7 274 – 281
Lead – – 154 – 154
Blended bitumen – – – – –
Other – 43 162 – 205
Intra-segment revenues – – (255) – (255)
$ 3,229 $ 1,075 $ 1,375 $ – $ 5,679
Note: 1) Includes revenue for our Fort Hills oil sands mining and processing operations from June 1, 2018.

Teck Resources Limited Notes to Condensed Interim Consolidated Financial Statements (Unaudited)
62 Teck Resources Limited 2018 Second Quarter News Release
3. REVENUES, continued b) Total Revenues by Regions The following table shows our revenue disaggregated by geographical region. Revenue is attributed to regions based on the location of the port of delivery as designated by the customer. The 2018 results include revenue for our Fort Hills oil sands mining and processing operations from June 1, 2018.
Three months ended June 30,
Six months ended June 30,
(CAD$ in millions) 2018 2017
(restated) 2018 2017
(restated)
Asia
China $ 568 $ 434 $ 1,025 $ 878
Japan 381 329 888 885
South Korea 249 387 625 749
India 287 207 488 265
Other 280 184 582 427
Americas
United States 412 361 784 724
Canada 220 230 490 450
Latin America 98 160 173 224
Europe
Germany 133 176 267 338
Finland 57 76 133 123
Spain 64 64 124 125
Other 267 224 529 491
$ 3,016 $ 2,832 $ 6,108 $ 5,679
4. OTHER OPERATING INCOME (EXPENSE)
Three months
ended June 30, Six months
ended June 30,
(CAD$ in millions) 2018 2017 2018 2017 Settlement pricing adjustments $ (20) $ (3) $ (31) $ 35
Share-based compensation (Note 8(a)) (27) 15 (54) (9)
Environmental and care and maintenance costs 5 (3) 16 (22)
Social responsibility and donations (5) (1) (8) (2)
Gain (loss) on sale of assets (4) 1 (4) 12
Commodity derivatives (15) (21) (34) 25
Take or pay contract costs (29) (19) (56) (40)
Other (22) (14) (29) (32)
$ (117) $ (45) $ (200) $ (33)

Teck Resources Limited Notes to Condensed Interim Consolidated Financial Statements (Unaudited)
63 Teck Resources Limited 2018 Second Quarter News Release
5. FINANCE EXPENSE
Three months
ended June 30, Six months
ended June 30,
(CAD$ in millions) 2018 2017 2018 2017 Debt interest $ 89 $ 98 $ 177 $ 210
Finance lease interest 6 – 12 1
Letters of credit and facility fees 19 20 31 37
Net interest expense on retirement benefit plans 1 3 3 6 Accretion on decommissioning and restoration provisions 24 20 50 39
Other 1 – 4 1
140 141 277 294
Less capitalized borrowing costs (85) (82) (177) (156)
$ 55 $ 59 $ 100 $ 138
6. NON-OPERATING INCOME (EXPENSE)
Three months
ended June 30, Six months
ended June 30,
(CAD$ in millions) 2018 2017 2018 2017 Foreign exchange gains $ 8 $ 10 $ 8 $ 22
Gain (loss) on debt prepayment options (Note 7(a)) (20) 23 (32) 44
Gain on sale of investments – 1 – 1
Loss on debt repurchases – (38) – (216)
$ (12) $ (4) $ (24) $ (149)

Teck Resources Limited Notes to Condensed Interim Consolidated Financial Statements (Unaudited)
64 Teck Resources Limited 2018 Second Quarter News Release
7. DEBT
($ in millions) June 30, 2018 December 31, 2017
Face Carrying Fair Face Carrying Fair
Value Value Value Value Value Value
(US$) (CAD$) (CAD$) (US$) (CAD$) (CAD$)
2.5% notes due February 2018 $ – $ – $ – $ 22 $ 28 $ 28
4.5% notes due January 2021 220 288 291 220 274 285
4.75% notes due January 2022 672 883 891 672 841 884
3.75% notes due February 2023 646 838 812 646 804 818
8.5% notes due June 2024 (a) 600 790 869 600 753 853
6.125% notes due October 2035 609 789 814 609 751 865
6.0% notes due August 2040 491 643 631 491 613 686
6.25% notes due July 2041 795 1,035 1,046 795 986 1,144
5.2% notes due March 2042 399 518 464 399 494 502
5.4% notes due February 2043 377 491 449 377 468 481
4,809 6,275 6,267 4,831 6,012 6,546 Antamina term loan due April 2020 23 30 30 23 28 28
Finance lease liabilities 239 314 314 250 313 313
Other – – – 13 16 16
5,071 6,619 6,611 5,117 6,369 6,903
Less current portion of debt (22) (29) (29) (45) (55) (55)
$ 5,049 $ 6,590 $ 6,582 $ 5,072 $ 6,314 $ 6,848
The fair values of debt are determined using market values, if available, and discounted cash flows based on our cost of borrowing where market values are not available. The latter are considered Level 2 fair value measurements with significant other observable inputs on the fair value hierarchy (Note 12). a) Embedded Prepayment Options The 2024 notes include a prepayment option that is considered to be an embedded derivative. At June 30, 2018, this prepayment option is recorded as financial and other assets on the balance sheet at a fair value of $81 million based on current market interest rates for similar instruments and our credit spread. For the three and six months ended June 30, 2018, the value of the prepayment option decreased by $20 million and $32 million, respectively, which has been recorded as a loss in non-operating income (expense) (three and six months ended June 30, 2017 — $23 million and $44 million
gain) (Note 6).

Teck Resources Limited Notes to Condensed Interim Consolidated Financial Statements (Unaudited)
65 Teck Resources Limited 2018 Second Quarter News Release
7. DEBT, continued b) Revolving Facilities At June 30, 2018, we had two committed revolving credit facilities in the amounts of US$3.0 billion and US$1.2 billion, respectively. The US$3.0 billion facility is available until October 2022 and is undrawn at June 30, 2018. The US$1.2 billion facility is available until October 2020 and has an aggregate of US$728 million in outstanding letters of credit drawn against it at June 30, 2018.
Under our US$3.0 billion and US$1.2 billion facilities, our uncommitted credit facilities, certain standby letters of credit and hedging lines, we have provided subsidiary guarantees for the benefit of the credit facilities. As a result our obligations under these agreements are guaranteed on a senior unsecured basis by Teck Metals Ltd, (TML), Teck Coal Partnership, Teck South American Holdings Ltd., TCL U.S. Holdings Ltd., Teck Alaska Incorporated and Teck Highland Valley Copper Partnership, each a wholly owned subsidiary of Teck. Any amounts drawn under the committed revolving credit facilities can be repaid at any time and are due in full at maturity. While Teck has non-investment grade credit ratings, amounts outstanding under these facilities bear interest at LIBOR plus an applicable margin based on our leverage ratio. If and when Teck regains investment grade credit ratings, amounts outstanding under these facilities will bear interest at LIBOR plus an applicable margin based on credit ratings. Both facilities require that our total debt-to-capitalization ratio, which was 0.24 to 1.0 at June 30, 2018, not exceed 0.5 to 1.0. When our credit ratings are below investment grade, we are required to satisfy financial security requirements under power purchase agreements at Quebrada Blanca and transportation, tank storage and pipeline capacity agreements for our interest in Fort Hills. At June 30, 2018, we had an aggregate of US$835 million in letters of credit outstanding for these security requirements. These letters of credit will be terminated if and when we regain investment grade ratings and, for the power purchase agreements, will also be reduced if, and when, certain project milestones are reached. We maintain uncommitted bilateral credit facilities primarily for the issuance of letters of credit to support our future reclamation obligations. As at June 30, 2018, we were party to various uncommitted credit facilities providing for a total of $2.0 billion of capacity, and the aggregate outstanding letters of credit issued thereunder were $1.5 billion. In addition to the letters of credit outstanding under these uncommitted credit facilities, we also had stand-alone letters of credit of $313 million outstanding at June 30, 2018, which were not issued under a credit facility. These uncommitted credit facilities and stand-alone letters of credit are typically renewed on an annual basis. We also have $350 million in surety bonds outstanding at June 30, 2018 to support current and future reclamation obligations.
8. EQUITY
a) Share-Based Compensation
During the first two quarters of 2018, we granted 1,538,305 Class B subordinate voting share options to employees. These options have a weighted average exercise price of $37.67, a term of 10 years and vest in equal amounts over three years. The weighted average fair value of Class B subordinate voting share options issued was estimated at $11.14 per share option at the grant date using the Black-Scholes option-pricing model. The option valuations were based on an average expected option life of 4 years, a risk-free interest rate of 2.06%, a dividend yield of 2.66% and an expected volatility of 41%.

Teck Resources Limited Notes to Condensed Interim Consolidated Financial Statements (Unaudited)
66 Teck Resources Limited 2018 Second Quarter News Release
8. EQUITY, continued
We have issued and outstanding deferred share units, restricted share units, performance and performance deferred share units (collectively referred to as units). Deferred and restricted share units are granted to both employees and directors. Performance and performance deferred share units are granted to employees only. During the first two quarters of 2018, we issued 859,131 units to employees and directors. Deferred and restricted share units issued vest immediately for directors and vest in three years for employees. Performance and performance deferred share units vest in three years. The performance and performance deferred share units have performance vesting criteria that may result in 0% to 200% of units ultimately vesting. The total number of units outstanding at June 30, 2018 was 7,744,428. Share-based compensation expense of $27 million and $54 million (2017 — $15 million compensation recovery and $9 million compensation expense) was recorded for the three and six months ended June 30, 2018, respectively, in respect of all outstanding share options and units.
b) Accumulated Other Comprehensive Income
June 30, June 30, December 31,
(CAD$ in millions) 2018 2017
(restated) 2017
(restated)
Currency translation differences $ 406 $ 309 $ 228
Unrealized gain (loss) on marketable equity and debt securities (net of tax of $3, $(3) and $(2)) (20) 29 17 Realized gain on marketable equity and debt securities (net of tax $nil, $nil and $nil) 3 – –
Share of other comprehensive loss of associates and joint ventures (1) (1) (1)
$ 388 $ 337 $ 244
c) Dividends
Dividends of $0.05 per share (totaling $28 million) were paid on our Class A common and Class B subordinate voting shares in the second quarter of 2018.

Teck Resources Limited Notes to Condensed Interim Consolidated Financial Statements (Unaudited)
67 Teck Resources Limited 2018 Second Quarter News Release
9. SEGMENTED INFORMATION
Based on the primary products we produce and our development projects, we have five reportable segments — steelmaking coal, copper, zinc, energy and corporate - which is the way we report information to our Chief Executive Officer. The corporate segment includes all of our initiatives in other commodities, our corporate growth activities and groups that provide administrative, technical, financial and other support to all of our business units. Other operating expenses include general and administration costs, exploration, research and development, and other operating income (expense). Sales between operations are carried out on terms that arm’s-length parties would use. Total assets does not include intra-group receivables between segments. Deferred tax assets and liabilities have been allocated amongst segments.
Three months ended June 30, 2018
(CAD$ in millions) Steelmaking
Coal Copper Zinc Energy Corporate Total Segment revenues $ 1,582 $ 731 $ 787 $ 78 $ – $ 3,178
Less: Intra-segment revenues – – (162) – – (162)
Revenues 1,582 731 625 78 – 3,016
Cost of sales (811) (456) (431) (77) – (1,775)
Gross profit 771 275 194 1 – 1,241
Other operating income (expenses) (26) (65) 5 (2) (79) (167)
Profit (loss) from operations 745 210 199 (1) (79) 1,074 Net finance expense (11) (10) (8) (3) (16) (48)
Non-operating income (expenses) 5 3 2 2 (24) (12) Share of loss of associates and joint ventures – (1) – – (1) (2)
Profit (loss) before taxes 739 202 193 (2) (120) 1,012
Capital expenditures $ 178 $ 174 $ 90 $ 76 $ 2 $ 520

Teck Resources Limited Notes to Condensed Interim Consolidated Financial Statements (Unaudited)
68 Teck Resources Limited 2018 Second Quarter News Release
9. SEGMENTED INFORMATION, continued
Three months ended June 30, 2017 (restated)
(CAD$ in millions) Steelmaking
Coal Copper Zinc Energy Corporate Total Segment revenues $ 1,610 $ 562 $ 781 $ – $ – $ 2,953
Less: Intra-segment revenues – – (121) – – (121)
Revenues 1,610 562 660 – – 2,832
Cost of sales (809) (443) (507) – – (1,759)
Gross profit 801 119 153 – – 1,073
Other operating income (expenses) (20) (29) – (7) (38) (94)
Profit (loss) from operations 781 90 153 (7) (38) 979 Net finance expense (10) (14) (10) (4) (20) (58)
Non-operating income (expenses) (10) 6 (2) – 2 (4) Share of income of associates and joint ventures – – – – 3 3
Profit (loss) before taxes 761 82 141 (11) (53) 920
Capital expenditures $ 142 $ 93 $ 53 $ 212 $ 2 $ 502
Six months ended June 30, 2018
(CAD$ in millions) Steelmaking
Coal Copper Zinc Energy Corporate Total Segment revenues $ 3,170 $ 1,470 $ 1,737 $ 78 $ – $ 6,455
Less: Intra-segment revenues – – (347) – – (347)
Revenues 3,170 1,470 1,390 78 – 6,108
Cost of sales (1,583) (902) (945) (77) – (3,507)
Gross profit 1,587 568 445 1 – 2,601
Other operating income (expense) (33) (126) (4) 9 (149) (303)
Profit (loss) from operations 1,554 442 441 10 (149) 2,298 Net finance expense (27) (20) (18) (4) (18) (87)
Non-operating income (expense) 19 4 5 1 (53) (24) Share of loss of associates and joint ventures – (1) – – (1) (2)
Profit (loss) before taxes 1,546 425 428 7 (221) 2,185
Capital expenditures 425 315 146 288 3 1,177
Goodwill 702 404 – – – 1,106
Total assets 15,248 9,891 3,781 6,167 3,547 38,634
Net assets $ 9,262 $ 6,797 $ 2,688 $ 5,261 $ (2,635) $ 21,373

Teck Resources Limited Notes to Condensed Interim Consolidated Financial Statements (Unaudited)
69 Teck Resources Limited 2018 Second Quarter News Release
9. SEGMENTED INFORMATION, continued
Six months ended June 30, 2017 (restated)
(CAD$ in millions) Steelmaking
Coal Copper Zinc Energy Corporate Total Segment revenues $ 3,229 $ 1,075 $ 1,630 $ – $ – $ 5,934
Less: Intra-segment revenues – – (255) – – (255)
Revenues 3,229 1,075 1,375 – – 5,679
Cost of sales (1,465) (920) (1,058) – – (3,443)
Gross profit 1,764 155 317 – – 2,236
Other operating income (expense) (37) (11) 8 (14) (82) (136)
Profit (loss) from operations 1,727 144 325 (14) (82) 2,100 Net finance expense (19) (25) (20) (5) (65) (134)
Non-operating income (expense) (20) 6 (4) – (131) (149) Share of income of associates and joint ventures – 1 – – 3 4
Profit (loss) before taxes 1,688 126 301 (19) (275) 1,821
Capital expenditures 299 174 104 430 3 1,010
Goodwill 702 398 – – – 1,100
Total assets 14,705 9,223 3,613 4,625 2,732 34,898
Net assets $ 8,883 $ 6,394 $ 2,589 $ 4,083 $ (2,798) $ 19,151
10. CONTINGENCIES
We consider provisions for all our outstanding and pending legal claims to be adequate. The final outcome with respect to actions outstanding or pending as at June 30, 2018, or with respect to future claims, cannot be predicted with certainty. Upper Columbia River Basin Teck American Inc. (TAI) continues studies under the 2006 settlement agreement with the U.S. Environmental Protection Agency (EPA) to conduct a remedial investigation on the Upper Columbia River in Washington State. Residential soil testing within the study site has identified certain properties where remediation is required. TAI and EPA have reached an agreement regarding remediation to be undertaken, and that work is ongoing. The Lake Roosevelt litigation involving TML in the Federal District Court for the Eastern District of Washington continues. In September 2012, TML entered into an agreement with the plaintiffs, agreeing that certain facts were established for purposes of the litigation. The agreement stipulated that some portion of the slag discharged from TML’s Trail Operations into the Columbia River between 1896 and 1995, and some portion of the effluent discharged from Trail Operations, have been transported to and are present in the Upper Columbia River in the United States, and that some hazardous substances from the slag and effluent have been released into the environment within the United States. In December 2012, the Court found in favour of the plaintiffs in phase one of the case, issuing a declaratory judgment that TML is liable under the Comprehensive Environmental Response, Compensation, and Liability Act (CERCLA) for response costs, the amount of which will be determined in later phases of the case. In August 2016 the trial court judge ruled in favour of the Tribal plaintiffs awarding approximately $9 million in past response costs and that decision, along with certain other findings in the first phase of the case, is under appeal in the Ninth Circuit Court of Appeals, and a decision is expected in 2018.
Teck Resources Limited Notes to Condensed Interim Consolidated Financial Statements (Unaudited)
70 Teck Resources Limited 2018 Second Quarter News Release
10. CONTINGENCIES, continued A District Court ruling in favour of plaintiffs on a motion seeking recovery from TML for environmental response costs, and in a subsequent proceeding, natural resource damages and assessment costs, arising from the alleged deposition of hazardous substances in the United States from aerial emissions from TML's Trail Operations was overturned on appeal in the Ninth Circuit in July 2016, with the result that alleged damages associated with air emissions are no longer part of the case. A hearing with respect to natural resource damages and assessment costs is expected to follow after resolution of appeals with respect to issues raised in the first phase of the litigation and completion of the remedial investigation and Feasibility Study being undertaken by TAI. There is no assurance that we will ultimately be successful in our defence of the litigation or that we or our affiliates will not be faced with further liability in relation to this matter. Until the studies contemplated by the EPA settlement agreement and additional damage assessments are completed, it is not possible to estimate the extent and cost, if any, of any additional remediation or restoration that may be required or to assess our potential liability for damages. The studies may conclude, on the basis of risk, cost, technical feasibility or other grounds, that no remediation other than some residential soil removal should be undertaken. If other remediation is required and damage to resources found, the cost of that remediation may be material.
11. SEASONALITY OF SALES
Due to ice conditions, the port serving our Red Dog mine is normally only able to ship concentrates from July to October each year. As a result, zinc and lead concentrate sales volumes are generally higher in the third and fourth quarter of each year than in the first and second quarter. Depending on commodity prices, this could result in Red Dog’s profits and cash flows being higher in the last two quarters of the year as finished inventories are sold.

Teck Resources Limited Notes to Condensed Interim Consolidated Financial Statements (Unaudited)
71 Teck Resources Limited 2018 Second Quarter News Release
12. FAIR VALUE MEASUREMENTS Certain of our financial assets and liabilities are measured at fair value on a recurring basis and classified in their entirety based on the lowest level of input that is significant to the fair value measurement. Certain non-financial assets and liabilities may also be measured at fair value on a non-recurring basis. There are three levels of the fair value hierarchy that prioritize the inputs to valuation techniques used to measure fair value, with Level 1 inputs having the highest priority. The levels and the valuation techniques used to value our financial assets and liabilities are described below: Level 1 — Quoted Prices in Active Markets for Identical Assets
Unadjusted quoted prices in active markets that are accessible at the measurement date for identical, unrestricted assets or liabilities. Cash equivalents, marketable equity securities and certain debt securities are valued using quoted market prices in active markets. Accordingly, these items are included in Level 1 of the fair value hierarchy.
Level 2 — Significant Other Observable Inputs
Quoted prices in markets that are not active, quoted prices for similar assets or liabilities in active markets, or inputs that are observable, either directly or indirectly, for substantially the full term of the asset or liability. Derivative instruments and embedded derivatives are included in Level 2 of the fair value hierarchy as they are valued using pricing models or discounted cash flow models. These models require a variety of inputs, including, but not limited to, market prices, forward price curves, yield curves, and credit spreads. These inputs are obtained from or corroborated with the market. Also included in Level 2 are settlement receivables and settlement payables from provisional pricing on concentrate sales and purchases, certain refined metal sales and steelmaking coal sales because they are valued using quoted market prices for forward curves for respective commodities and published price assessments for steelmaking coal sales.
Level 3 — Significant Unobservable Inputs
Unobservable (supported by little or no market activity) prices. We include investments in certain debt securities in Level 3 of the fair value hierarchy because they trade infrequently and have little price transparency. We review the fair value of these instruments periodically and estimate an impairment charge based on management’s best estimates, which are unobservable inputs.

Teck Resources Limited Notes to Condensed Interim Consolidated Financial Statements (Unaudited)
72 Teck Resources Limited 2018 Second Quarter News Release
12. FAIR VALUE MEASUREMENTS, continued The fair values of our financial assets and liabilities measured at fair value on a recurring basis at June 30, 2018 and December 31, 2017 are summarized in the following table: (CAD$ in millions) June 30, 2018 December 31, 2017
Level 1 Level 2 Level 3 Total Level 1 Level 2 Level 3 Total
Financial assets Cash equivalents $ 141 $ – $ – $ 141 $ 722 $ – $ – $ 722
Marketable equity securities 85 – – 85 124 – – 124
Debt securities 63 – 3 66 37 – 4 41
Settlement receivables – 525 – 525 – 687 – 687 Derivative instruments and embedded derivatives – 89 – 89 – 126 – 126
$ 289 $ 614 $ 3 $ 906 $ 883 $ 813 $ 4 $ 1,700
Financial liabilities Derivative instruments and embedded derivatives $ – $ 63 $ – $ 63 $ – $ 43 $ – $ 43
Settlement payables – 58 – 58 – 39 – 39
22. Fair Value Measurements
$ – $ 121 $ – $ 121 $ – $ 82 $ – $ 82
For our non-financial assets and liabilities measured at fair value on a non-recurring basis, no fair value measurements were made as at June 30, 2018.
As at December 31, 2017, we measured certain non-financial assets at their recoverable amounts using a FVLCD basis, which is classified as a Level 3 measurement.
13. ADOPTION OF NEW IFRS PRONOUNCEMENTS
We have adopted the new IFRS pronouncements listed below as at January 1, 2018, in accordance with the transitional provisions outlined in the respective standards and described below. The adoption of these new IFRS pronouncements has resulted in adjustments to previously reported figures as outlined below. a) Adjustments to Consolidated Financial Statements All of the adjustments to previously reported figures outlined below relate to the adoption of IFRS 15 (Note 13(b)).
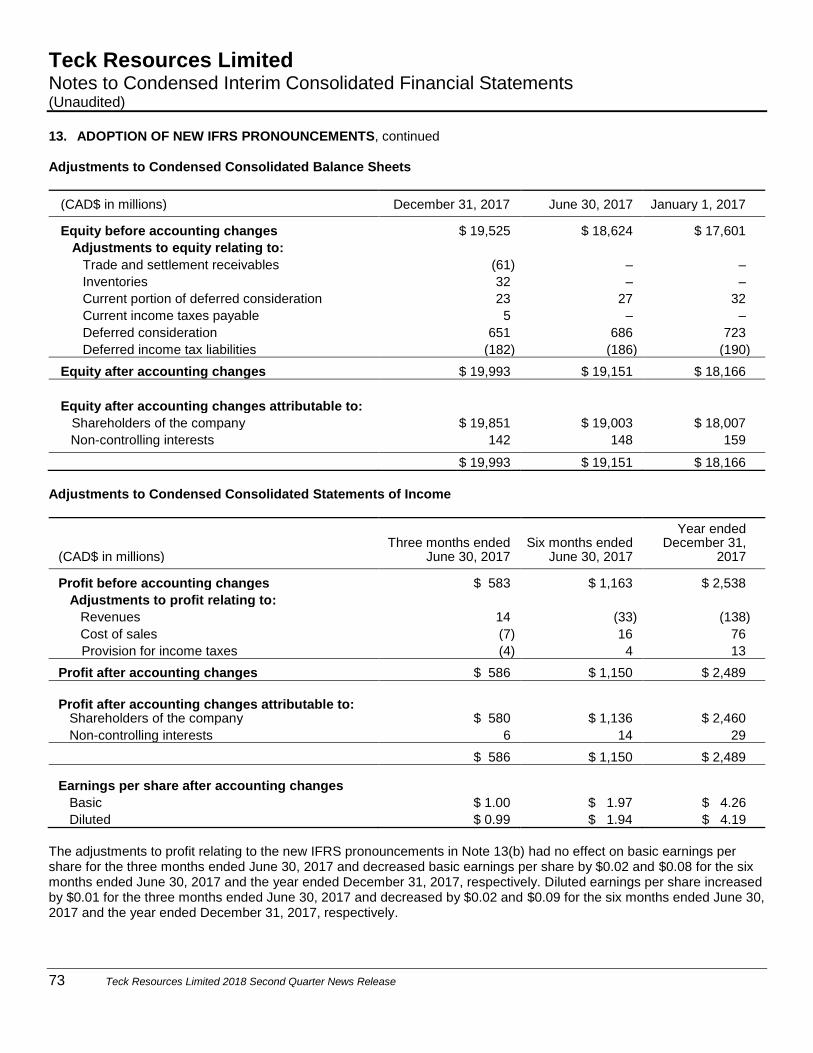
Teck Resources Limited Notes to Condensed Interim Consolidated Financial Statements (Unaudited)
73 Teck Resources Limited 2018 Second Quarter News Release
13. ADOPTION OF NEW IFRS PRONOUNCEMENTS, continued
Adjustments to Condensed Consolidated Balance Sheets
(CAD$ in millions) December 31, 2017 June 30, 2017 January 1, 2017 Equity before accounting changes $ 19,525 $ 18,624 $ 17,601
Adjustments to equity relating to:
Trade and settlement receivables (61) – –
Inventories 32 – –
Current portion of deferred consideration 23 27 32
Current income taxes payable 5 – –
Deferred consideration 651 686 723
Deferred income tax liabilities (182) (186) (190) Equity after accounting changes $ 19,993 $ 19,151 $ 18,166
Equity after accounting changes attributable to:
Shareholders of the company $ 19,851 $ 19,003 $ 18,007
Non-controlling interests 142 148 159 $ 19,993 $ 19,151 $ 18,166
Adjustments to Condensed Consolidated Statements of Income
(CAD$ in millions) Three months ended
June 30, 2017 Six months ended
June 30, 2017
Year ended December 31,
2017 Profit before accounting changes $ 583 $ 1,163 $ 2,538
Adjustments to profit relating to:
Revenues 14 (33) (138)
Cost of sales (7) 16 76
Provision for income taxes (4) 4 13 Profit after accounting changes $ 586 $ 1,150 $ 2,489
Profit after accounting changes attributable to: Shareholders of the company $ 580 $ 1,136 $ 2,460
Non-controlling interests 6 14 29 $ 586 $ 1,150 $ 2,489
Earnings per share after accounting changes
Basic $ 1.00 $ 1.97 $ 4.26
Diluted $ 0.99 $ 1.94 $ 4.19
The adjustments to profit relating to the new IFRS pronouncements in Note 13(b) had no effect on basic earnings per share for the three months ended June 30, 2017 and decreased basic earnings per share by $0.02 and $0.08 for the six months ended June 30, 2017 and the year ended December 31, 2017, respectively. Diluted earnings per share increased by $0.01 for the three months ended June 30, 2017 and decreased by $0.02 and $0.09 for the six months ended June 30, 2017 and the year ended December 31, 2017, respectively.

Teck Resources Limited Notes to Condensed Interim Consolidated Financial Statements (Unaudited)
74 Teck Resources Limited 2018 Second Quarter News Release
13. ADOPTION OF NEW IFRS PRONOUNCEMENTS, continued Adjustments to Condensed Consolidated Statements of Comprehensive Income
(CAD$ in millions) Three months ended
June 30, 2017 Six months ended
June 30, 2017
Year ended December 31,
2017 Comprehensive income before accounting changes $ 492 $ 1,085 $ 2,501
Adjustments to comprehensive income relating to:
Profit 3 (13) (49)
Other comprehensive income:
Currency translation difference (18) (25) (48) Comprehensive income after accounting changes $ 477 $ 1,047 $ 2,404
Comprehensive income after accounting changes attributable to:
Shareholders of the company $ 474 $ 1,037 $ 2,383
Non-controlling interests 3 10 21 $ 477 $ 1,047 $ 2,404
b) Revenue from Contracts with Customers Overview of Changes in IFRS We adopted IFRS 15 on January 1, 2018 in accordance with the transitional provisions of the standard, applying a full retrospective approach in restating our prior period financial information. The new revenue standard introduces a single principles-based, five-step model for the recognition of revenue when control of goods is transferred to, or a service is performed for, the customer. The five steps are to identify the contract(s) with the customer, identify the performance obligations in the contract, determine the transaction price, allocate the transaction price to each performance obligation and recognize revenue as each performance obligation is satisfied. IFRS 15 also requires enhanced disclosures about revenue to help users better understand the nature, amount, timing and uncertainty of revenue and cash flows from contracts with customers. Timing and Amount of Revenue Recognized Based on our analysis, the timing and amount of our revenue from product sales did not change significantly under IFRS 15. The only exception to this relates to steelmaking coal sales where we have a shipment that is partially loaded on a vessel at a reporting date. The performance obligation in these contracts is for the full shipment and accordingly, we cannot recognize revenue until the full shipment is loaded. This is a timing difference only and does not change the amount of revenue recognized for the full shipment.
As part of our assessment of IFRS 15, we analyzed the treatment of freight services provided to customers subsequent to the transfer of control of the product sold. Under IFRS 15, in our view, these services represent performance obligations that should be recognized separately. For the performance obligation related to these freight services, we have concluded that we are the principal to the shipping of product in our refined metal sales and concentrate sales contracts and will continue to reflect the revenue in these arrangements on a gross basis. For certain of our steelmaking coal sales contracts, we have concluded that we are the agent to the ocean freight shipping of product due to the terms of the arrangement, and our revenue will be reported on a net basis for these arrangements. There will be no effect on our gross profit as the freight costs will be netted against revenue for these arrangements and not presented within cost of sales.

Teck Resources Limited Notes to Condensed Interim Consolidated Financial Statements (Unaudited)
75 Teck Resources Limited 2018 Second Quarter News Release
13. ADOPTION OF NEW IFRS PRONOUNCEMENTS, continued
We have assessed the effects of IFRS 15 on our silver and gold streaming arrangements. At the date these transactions were completed, we accounted for the arrangements as the sale of a portion of our mineral interests at Antamina and Carmen de Andacollo, respectively. We did not recognize disposal gains on the transactions as a result of the requirements of the IFRS standards in effect at the dates of closing. Under the recognition and measurement principles of IFRS 15, any gain on these streaming transactions would have been recognized in full as control over the right to the silver or gold mineral interest transferred to the purchaser. Accordingly, we have recognized the deferred consideration recorded on our balance sheet through equity on transition to IFRS 15 as at January 1, 2017. We have also reversed the amortization of the deferred consideration that was recorded as a reduction of cost of sales for each quarter of 2017. The tables in Note 13(a) outline the adjustments to our financial statements resulting from the adoption of IFRS 15, described above, for all comparative periods presented. c) Financial Instruments We adopted IFRS 9 on January 1, 2018 in accordance with the transitional provisions of the standard. We have elected not to adopt the hedging requirements of IFRS 9, but may adopt them in a future period. There were no measurement changes to our financial statements as a result of adopting IFRS 9. We did not record adjustments relating to the implementation of the expected credit loss model for our trade receivables or investments in debt securities and our expected credit loss allowances for these financial assets are nominal as at January 1, 2018 and June 30, 2018.
14. ACQUISITIONS During the quarter ended June 30, 2018, we acquired an additional 13.5% interest in Compañía Minera Teck Quebrada Blanca S.A. (QBSA) through the purchase of Inversiones Mineras S.A. (IMSA), a private Chilean company. The acquisition brings our interest in QBSA to 90%. ENAMI, a Chilean State agency, holds a 10% preference share interest in QBSA, which does not require ENAMI to fund capital spending. The purchase price consists of US$52.5 million paid in cash on closing, an additional payment of US$60 million payable on the issuance of the major approval of the social and environmental impact assessment for the QB2 project and the expiry of certain appeal rights, and a further US$50 million payable within 30 days of the commencement of commercial production at QB2. Additional amounts may become payable to the extent that average copper prices exceed US$3.15 per pound in each of the first three years following commencement of commercial production, up to a cumulative maximum of US$100 million if commencement of commercial production occurs prior to January 21, 2024, or up to a lesser maximum in certain circumstances thereafter. This transaction is considered a change in the ownership of a subsidiary that we control and accordingly, we have accounted for this as an equity transaction. We have recorded a cash payment of $67 million and liabilities for the estimated fair value of amounts due in the future. The total fair value of $175 million was recorded as a reduction in non-controlling interests and equity of $16 million and $159 million, respectively, as at June 30, 2018.