Embed Size (px)
Citation preview
Technology’s the answer!
(but what was the question?) Analytic and Transatlantic divisions in responding to climate change
Presentation to HGDC seminar, 19 November 2003
Michael Grubb
Associated Director of Policy, the Carbon Trust
Visiting Professor, Climate Change and Energy Policy, Imperial College London
Senior Research Associate, Department of Applied Economics, Cambridge

Overview
The basic issue of technology-push vs demand-pull: - examples and significance
Economic theory and technology innovation – The different conceptions – evidence, strengths and
weaknesses– Integrated perspectives– Practical problems arising from incomplete theories of
innovation – Some implications for UK strategy – Technology perspectives and Kyoto strategies
Some additional observations on energy policy and technology
Conclusions
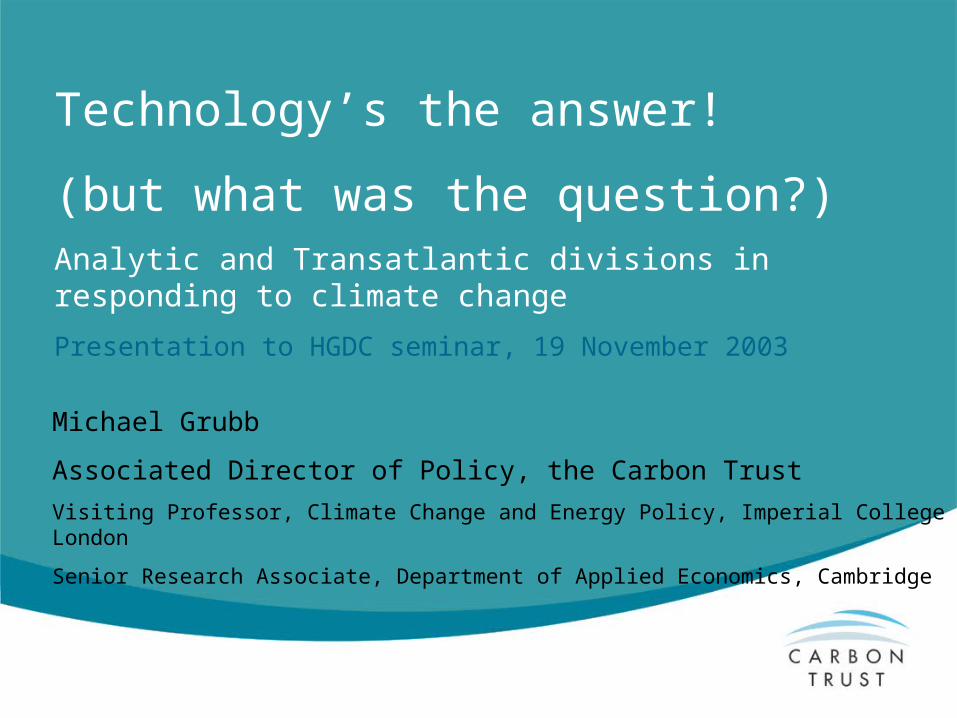
The basic issue
Technology is the answer!– All studies agree that low carbon technology is central to
addressing long-term climate change– Technologies adequate to stabilise the atmosphere are not
yet commercially available
But what was the question?– Is this a question of R&D investment by governments to
develop the technologies that can solve the problem (‘technology push’ / exogenous technical change)?
– Or a question of market incentives to promote private sector investment in emerging technologies and learning-by-doing (‘demand pull’ / induced technical change)
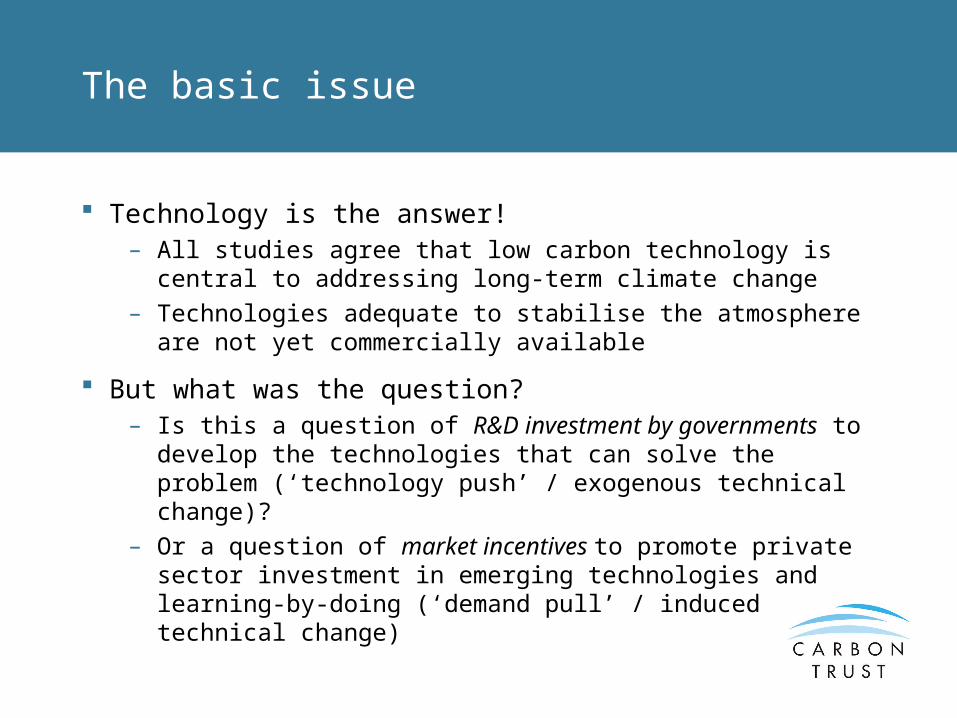
Global Development of Wind Power capacity
0
5000
10000
15000
20000
25000
30000
3500019
83
1985
1987
1989
1991
1993
1995
1997
1999
2001
MW
cu
mu
lati
ve
-500
500
1500
2500
3500
4500
5500
6500
7500
MW
per
yea
r
Cumulative
Annual
Source: Morthurst, Riso national laboratory

Cost trends in wind energy, historic and projections compared to conventional power production
0
2
4
6
8
10
12
1985 1987 1990 1993 1996 1999 2001
Time
c€/k
Wh
Coastal site
Inland site
Gasfired power plantsDenmark Norway
Source: Morthurst, Riso national laboratory
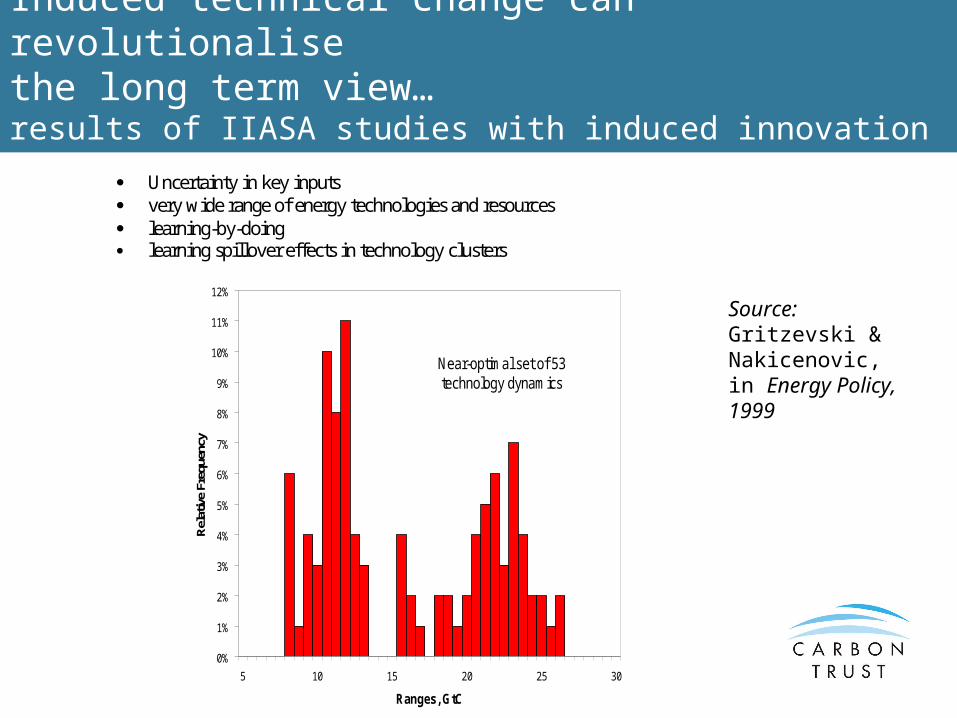
Induced technical change can revolutionalise the long term view… results of IIASA studies with induced innovation
Uncertainty in key inputs very wide range of energy technologies and resources learning-by-doing learning spillover effects in technology clusters
0%
1%
2%
3%
4%
5%
6%
7%
8%
9%
10%
11%
12%
5 10 15 20 25 30
Ranges, GtC
Rel
ativ
e Fr
eque
ncy
Near-optimal set of 53 technology dynamics
Source: Gritzevski & Nakicenovic, in Energy Policy, 1999
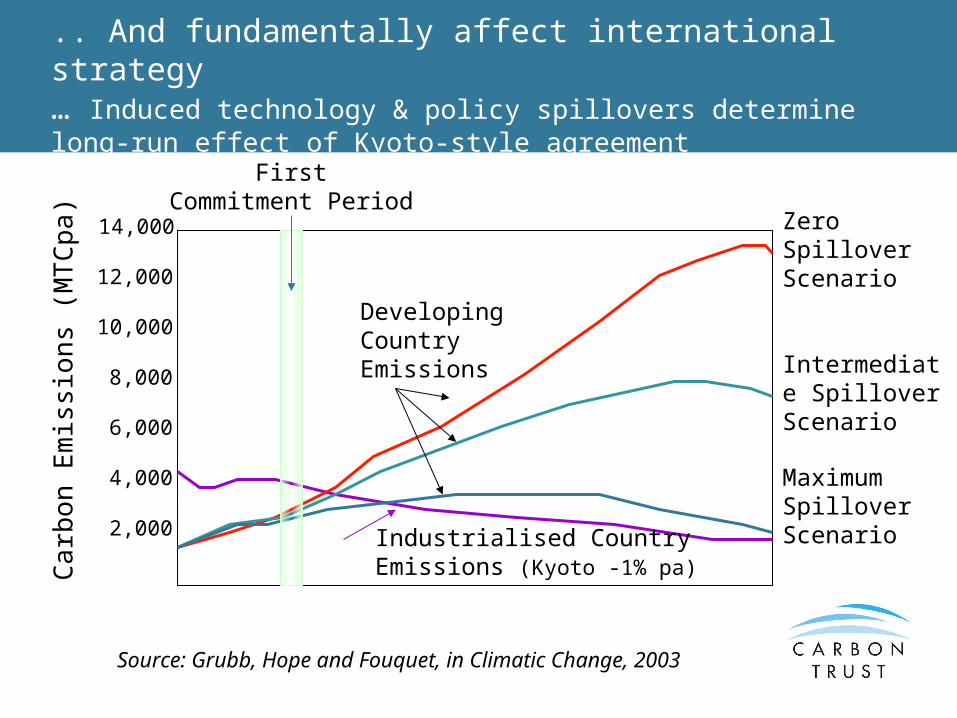
.. And fundamentally affect international strategy … Induced technology & policy spillovers determine long-run effect of Kyoto-style agreement
2,000
4,000
6,000
8,000
10,000
12,000
14,000
Carb
on
Em
issi
on
s (M
TC
pa)
FirstCommitment Period
Zero Spillover Scenario
Intermediate Spillover Scenario
Maximum Spillover ScenarioIndustrialised Country
Emissions (Kyoto -1% pa)
Developing Country Emissions
Source: Grubb, Hope and Fouquet, in Climatic Change, 2003
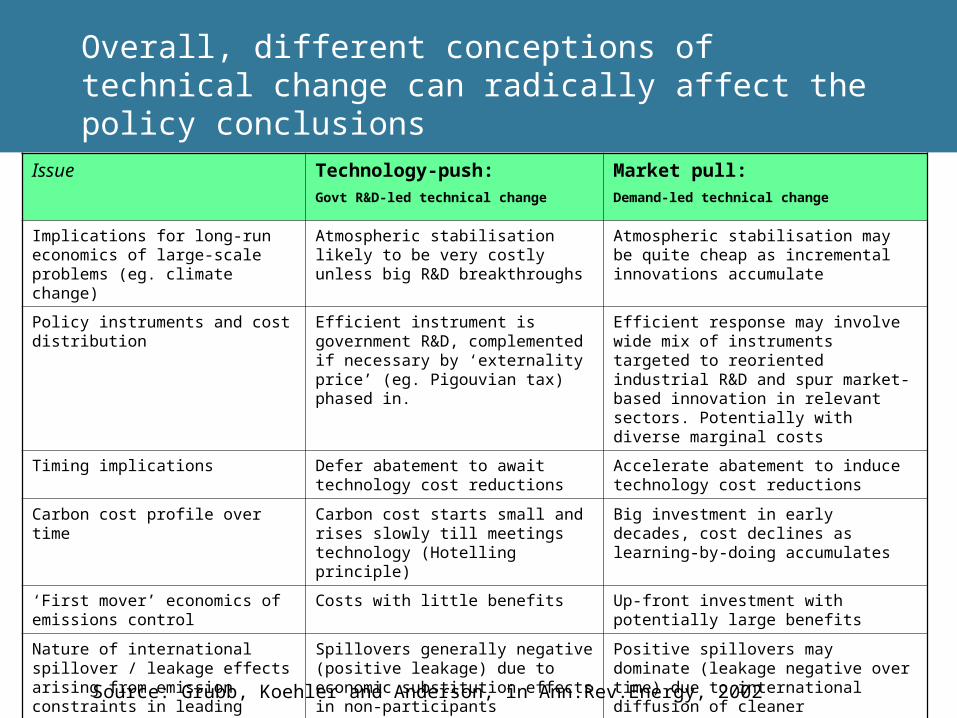
Overall, different conceptions of technical change can radically affect the policy conclusions
Issue Technology-push: Govt R&D-led technical change
Market pull: Demand-led technical change
Implications for long-run economics of large-scale problems (eg. climate change)
Atmospheric stabilisation likely to be very costly unless big R&D breakthroughs
Atmospheric stabilisation may be quite cheap as incremental innovations accumulate
Policy instruments and cost distribution
Efficient instrument is government R&D, complemented if necessary by ‘externality price’ (eg. Pigouvian tax) phased in.
Efficient response may involve wide mix of instruments targeted to reoriented industrial R&D and spur market-based innovation in relevant sectors. Potentially with diverse marginal costs
Timing implications Defer abatement to await technology cost reductions
Accelerate abatement to induce technology cost reductions
Carbon cost profile over time Carbon cost starts small and rises slowly till meetings technology (Hotelling principle)
Big investment in early decades, cost declines as learning-by-doing accumulates
‘First mover’ economics of emissions control
Costs with little benefits Up-front investment with potentially large benefits
Nature of international spillover / leakage effects arising from emission constraints in leading countries
Spillovers generally negative (positive leakage) due to economic substitution effects in non-participants
Positive spillovers may dominate (leakage negative over time) due to international diffusion of cleaner technologies
Source: Grubb, Koehler and Anderson, in Ann.Rev.Energy, 2002

Economic theory and environmental innovation policies

Technology-R&D push – the track record is not encouraging..
The theoretical basis– Classic R&D market failures– The impact of liberalisation
Some classic energy examples:– Nuclear fission– Coal-based synthetic fuels– Nuclear fusion
Basic problems of:– ‘picking winners’– Cooperation vs competition– Policy displacement
Theoretical paradox of the ‘classical’ view– the giant leap – the ‘valley of death’

Demand-led induced technical change – if only markets were so perfect ..
Some classic energy examples:– North sea oil – CCGTs – Wind energy …?
Basic problems of:– Classic R&D failures – Policy stability for environmental innovation– The real world is ‘second best’
Theoretical paradox of the ‘classical’ demand-led view– the need for perfect R&D markets– The need for long term certainty– The need for perfect communication between government,
research, and industry

Diffusion
Integrated perspectives: technologies have to traverse a long, expensive and risky chain of innovation to get from idea to market
Government
Research Consumers
Policy Interventions
Business and finance community
Investments
Market accumula
tion
Commercial-isation
Demon-stration
Applied R&D
Basic R&D
Product/ Technology Push
Market Pull
Source: Foxon (2003) adapted by the author
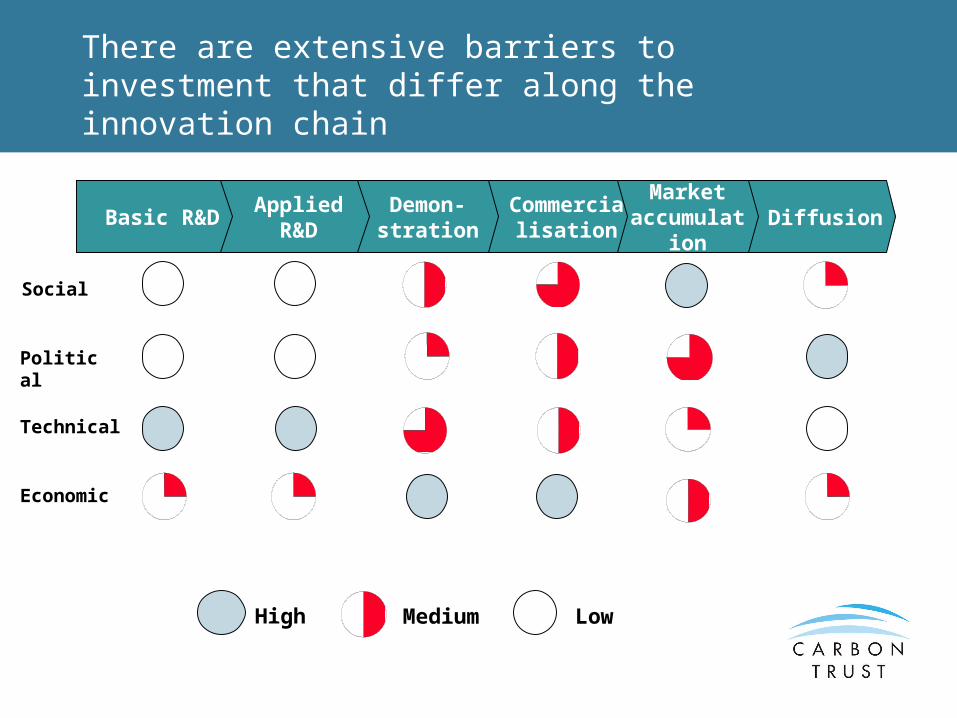
Diffusion
There are extensive barriers to investment that differ along the innovation chain
Market accumula
tion
Commercialisation
Demon-stration
Applied R&D
Basic R&D
Social
Technical
Economic
Political
High Medium Low
n

Diffusion
Market theory is blind to the innovation process – innovation assumed to emerge out of R&D and market pull, with government no-go zone in between
Government
Research Consumers
Carbon trading / taxation
Policy InterventionsC,C,C
Business and finance community
Investments
Market accumula
tion
Commercial-isation
Demon-stration
Applied R&D
Basic R&D
Product/Tech Push
Market Pull
Univ funding
Cofunding, tax breaks
C,C,C: Contentious, constrained, confused …
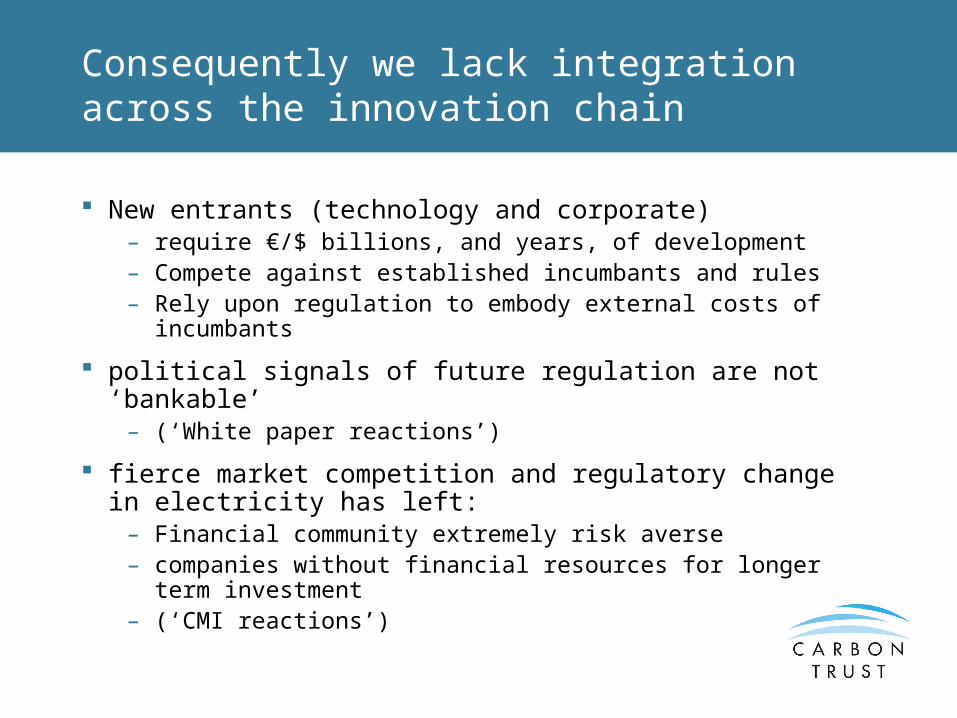
Consequently we lack integration across the innovation chain
New entrants (technology and corporate) – require €/$ billions, and years, of development– Compete against established incumbants and rules– Rely upon regulation to embody external costs of
incumbants
political signals of future regulation are not ‘bankable’– (‘White paper reactions’)
fierce market competition and regulatory change in electricity has left:
– Financial community extremely risk averse– companies without financial resources for longer term
investment– (‘CMI reactions’)

Some elements of integrated strategies - application for the UK

A range of policy measures are needed to help technologies traverse the innovation chain
Note: ROC excludes recycling; Capital grant based on maximum of 40% of typical capital costsSource: PIU Working Papers (OXERA II Base case cost decline)
0
2
4
6
8
10
12
14
1995 2000 2005 2010 2015 2020 2025
Ele
ctr
icit
y P
ric
e (
p/k
Wh
)
Wholesale Price
ROC (Buyout)
Capital Grants/ Loans
CCL Exemption
Offshore Wave
Energy Crops
Offshore Wind
Onshore Wind
RD&D Grants
Appropriate economic support for specific technologies will vary as costs decline
General support
Technology specific support
Illustrative

Support needs to target advantaged technology groups and build upon comparative advantages- whilst market used to identify winning solutions
High Domestic Resource
High Materiality
Early mover advantage
Value added potential
Co-operate Internationally
BuildOptions
Esti
mate
d im
pact
Technology Groups
UK comparative advantage
Assessment Criteria Funding Prioritisation
Invest Aggressively
Watching brief

Low
Low High
High
Materiality of potential Carbon Trust investments
Est
imat
ed im
pac
t o
n
carb
on
em
issi
on
s
Focus• Buildings (Fabric, Ventilation, Cooling,Integrated Design)• Industry (Combustion technologies, Materials,Process control, Process intensification,Separation technologies);• Hydrogen (Infrastructure, Production,Storage and Distribution);• Fuel cells (Domestic CHP, Industrialand Commercial)• CHP (Domestic micro, Advanced macro)• Biomass for local heat generation
Consider• Solar Photovoltaics• Solar water heating collectors• Photoconversion• Wave (Offshore, Near shore devices andshoreline)• Biomass for local electricity generation• Tidal stream• Coal-bed methane• Electricity storage technologies• Buildings (Lighting, Existing building fabric,Existing building services)• Industry (Waste heat recovery).
Monitor• Buildings (Controls)• Waste to energy• Nuclear fission• Ultra-high efficiency CCGT• Smart metering• Wind• Fuel Cells (Transport, Baseload power• Biomass for Transport• Industry (Alternative Equipment)• CO2 sequestration
Limited• Intermediate energy vectors• HVDC Transmission• High Efficiency AutomotivePower Systems• Nuclear fusion• Cleaner coal combustion• Solar thermal electric• Low head hydro• Tidal (Lagoons, Barrages)• Geothermal
Carbon Trust: Low Carbon Technology Assessment seeks to classify main technologies on these bases
Some implications for Kyoto implementation and strategy
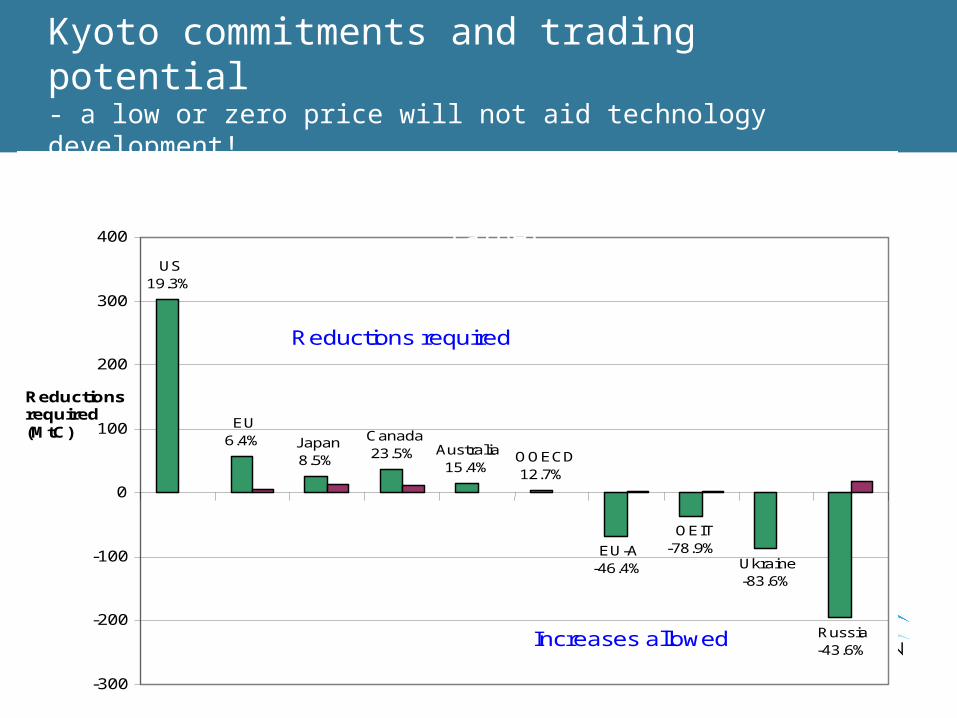
Kyoto commitments and trading potential- a low or zero price will not aid technology development!
EU 6.4%
US 19.3%
Japan 8.5%
Canada 23.5% Australia
15.4% OOECD 12.7%
EU-A -46.4%
OEIT -78.9%
Ukraine -83.6%
Russia -43.6%
-300
-200
-100
0
100
200
300
400
Reductions required (MtC)
Reductions required
Increases allowed
Gap between present (yr 2000) emissions and Kyoto target,and managed forest allowances (MtC/yr)

Analogies with the oil markets?
The oil market: International traded price far greater than marginal cost Major ‘swing’ suppliers have big influence but not monopoly power Price instability has forced restructuring of markets and relationships International collaboration to maintain oil price at ‘reasonable’ levels Strong government-industry interrelationships
Kyoto CP1 carbon market could have all these features (Russia as the Saudi Arabia; EITs as the OPEC; DCs as non-OPEC)
But important differences: Constructed commodity, depends upon institutional credibility (compliance, etc) Heirarchy of ‘environmental and political legitimacy’ Sequentially negotiated allocations CP1 massive supply-demand imbalance created by US pullout
Implications for the Kyoto mechanisms - projects
Heirarchy of value led by project mechanisms:– CDM, small projects
• renewable energy may be highest value • Potential for early start (Delhi, COP8)
– Other CDM– JI – ‘track two’ dependent upon Supervisory Cttee– JI – mainstream, forward trading contingent on meeting eligibility,
probably looser project governance
Removal Units (Annex I sink projects): variable domestic price, low international price
Total volume from international project credits limited
Implications for the Kyoto mechanisms – emissions trading
Heirarchy within AAU trading:
‘Greened’ trading: revenues linked to environmental reinvestment (Russian Green Investment Scheme)
OECD countries that exceed their targets due to domestic action (eg. UK?)
EIT exports governed through non-GIS-type routes (eg. through domestic trading with ‘acceptable’ allocation).
wholesale transfers of AAUs without any linkages or constraints (will this happen at all?)
Some broad conclusions on innovation
‘Supply push’ vs ‘demand pull’ conceptions lead to radically different perceptions and policy prescriptions
An important obstacle to effective policies is inadequate economic combined theories of industrial innovation (and especially environmental innovation):
– ‘standard’ theories yield policies that are limited in their feasibility, effectiveness and dynamic efficiency
– We have no goods tools to design the most dynamically efficient mix of policies
– But it is clear that effective policies are impeded by ‘one size fits all’ application of core policies, such as:
• New Electricity Trading Arrangements (NETA)• European State Aids
Coherent policies need to work across the innovation chain and be clear about strategic priorities and comparative advantages
Kyoto commitments and Kyoto-style structure is a foundational element to give incentives and develop global markets

Supplementary thoughts: On UK energy prospects and energy diversity
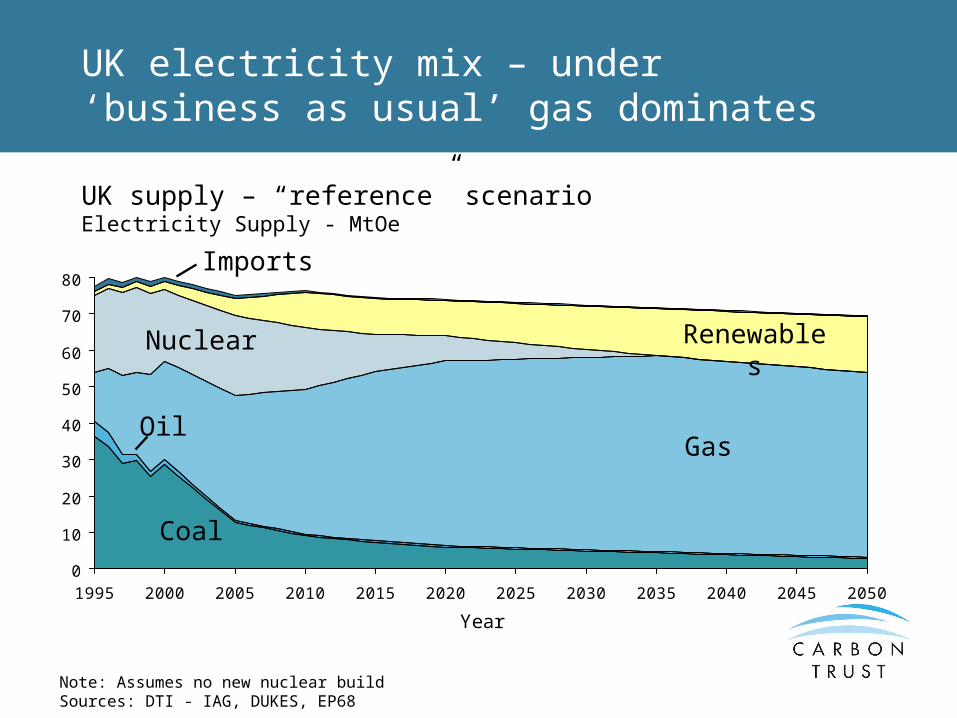
UK electricity mix – under ‘business as usual’ gas dominates
0
10
20
30
40
50
60
70
80
1995 2000 2005 2010 2015 2020 2025 2030 2035 2040 2045 2050
Year
Coal
Gas
Nuclear Renewables
Oil
Imports
Note: Assumes no new nuclear buildSources: DTI - IAG, DUKES, EP68
UK supply – “reference” scenarioElectricity Supply - MtOe

Greater effort on variety of renewables would lead to a more diverse set of energy sources
0
10
20
30
40
50
60
70
80
1995 2000 2005 2010 2015 2020 2025 2030 2035 2040 2045 2050
Year
Coal
Oil
Gas
NuclearRenewable
s
Imports
Source: CT Strategic framework analysis
UK supply – “Renewable Energy” scenarioElectricity Supply - MtOe
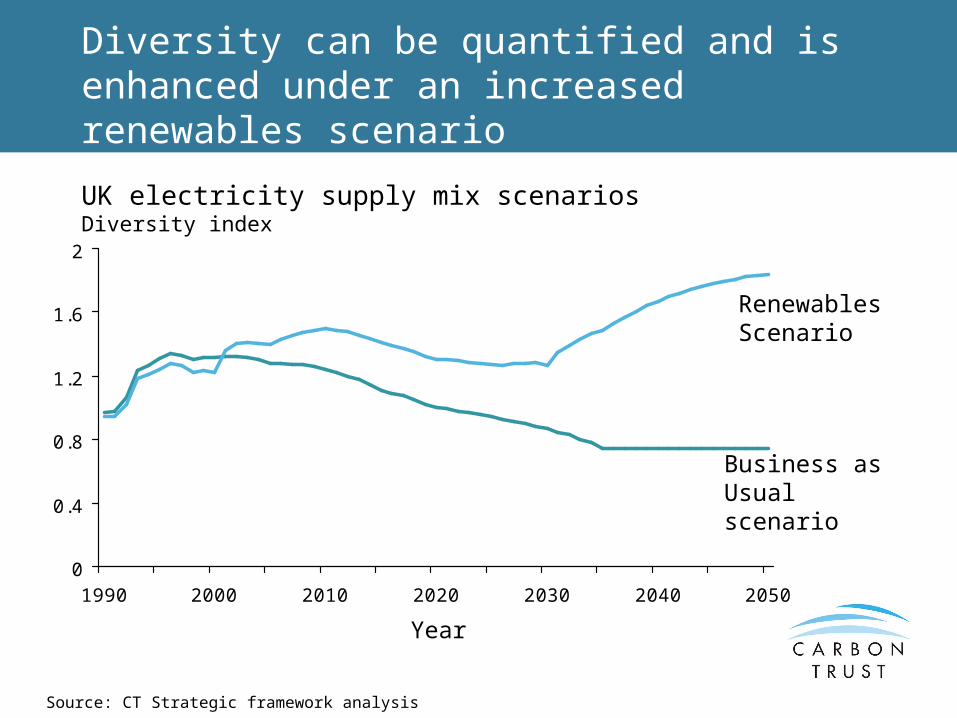
Diversity can be quantified and is enhanced under an increased renewables scenario
0
0.4
0.8
1.2
1.6
2
1990 2000 2010 2020 2030 2040 2050
Year
Renewables Scenario
Business as Usual scenario
UK electricity supply mix scenariosDiversity index
Source: CT Strategic framework analysis

Diversity – index and concentration charge
Diversity index for portfolio of I options = -ipi . ln[pi]
wherepi = the proportional reliance on the ith technology / fuel source
To encourage diversity, could levy a concentration charge, eg.
(exp[pi] – 1) cents /kWh
Would • increase marginal cost of given source as it starts to dominate• give modest boost for new entrants
UK at present relatively diverse –politically palatable starting point!

Conclusions 1: Implications of technology innovation analysis
Modern understanding of the economics of industrial innovation (and especially environmental innovation) need to be codified and applied to inform policy:
– A mix of policies is required for different stages of the innovation chain through from research to market
– Core established policies need to be adapted to avoid being impediments
International economic studies need to incorporate technology (and political) spillovers as well as economic substitution effects
The debate on ‘targets’ vs ‘technology’ is false:– Technology policies without targets (cap & trade) are ineffective– Targets without technology policies are inefficient
Kyoto provides a bedrock of credibility and carbon markets – but much more needs to be done on technology to enable deeper and wider cuts in subsequent negotiating rounds

Conclusions 2: supplementary observations on climate-technology policy
The challenge is not adding abatement costs to ‘do nothing’ future, but is to reorient €/$ trillions of investment over coming decades
– IEA World Investment Outlook
This will not happen without active intervention domestically and internationally
– Innovation is too risky, the ‘bankable’ signals of political declarations and agreements are too weak, and the obstacles to new entrants are too big
Low carbon sources can generally support security objectives, but need appropriate tools to support new entrants rather than protect high carbon existing options
– A ‘concentration charge’ to foster system diversity could be considered