Embed Size (px)
Citation preview
Technovation, 11:4 (1991) 231-246
Technology transfer from U.S. government and university R&D laboratories’
Barry Bozeman Technology and Information Polk y Program, Syracuse University, Syracuse, NY f3244 (U.S.A.1
Michael Crow Office of Science and Technology Policy, Iowa State University and Ames Laboratory, Ames IA 50071 (U.S.A.)
Abstract
Despite the increased interest in domestic technology transfer, there is surprisingly little empirical evidence on determinants of technology transfer activity. This study presents results from a national survey of more than 900 laboratories, focusing on a sub-sample of 134 government laboratories and 139 university laboratories. An environmentaI dependence model of technology transfer activity is presented, arguing that in~uen~e of political authority is a major determinant of technology transfer activity. Tests of the model indicated that scientific and technical mission diversity is particularly important in understanding technology transfer to both government and industry. However, a variety of measures of political boundary spanning are quite important in transfer to government but not so to industry. ~i~ew~e, the nature of the resource base ~government vs. indus- trial) is strongly related to the choice to transfer technology to, respectively, government and industry.
1. lnt~oduction
Technology transfer no longer is the ex- clusive province of individual organizations shopping around for ideas and tools originated elsewhere. Recently, technology transfer has come to be viewed as a critical public policy issue, one so important that nations’ innova- tion rates, economies and very standards of living may hang in the balance. In the United
States, one result of this new emphasis on domestic technology transfer is an intense pub- lic dialogue, another is an outpouring, since 1980, of new public policy measures aimed at promoting technology transfer. These policy initiatives are wide ranging and include relax- ation of anti-trust guidelines, promotion of cooperative research and development (R&D), and mandated involvement of government laboratories in technology transfer2.
Technovation Volume 11 No 4 0166-4972/91/$03.!50 0 1991 Elsevier Science Publishers Ltd 231

B. Bozeman and M. Crow
Despite the increased interest in domestic technology transfer, there is surprisingly little empirical evidence on determinants of tech- nology transfer activity. Several case studies have been provided and anecdotes are per- vasive, but systematic analyses based on large samples of R&D laboratories are in short supply. The purpose of this study is to provide such an analysis. The study presents results from a national survey of more than 900 laboratories, focusing on a sub-sample of 134 government laboratories and 139 university laboratories. An environmental dependence model of technology transfer activity is presented, arguing that influence of political authority is a major determinant of technology transfer activity.
1.1. Explaining technology transfer: an environmental dependence model
One difficulty in the study of technology transfer is its multiple meanings. Some define technology transfer in the broadest sense to in- clude virtually any movement of knowledge or tools from one organizational or institutional context to another [l], whereas others provide a more restrictive definition requiring a physical embodiment in the form of a product or prototype [2]. The concept (and measure) used here is between the broadest and narrowest definitions. We seek to embrace a variety of knowledge development and utilization activi- ties under the concept of technology transfer but, at the same time, to distinguish clearly technology transfer from basic research and pre- commercial applied research. Thus, we define technology transfer as “the transfer of physical devices, processes, ‘know-how’, or proprietary information about devices or processes from one organization or institution to another”3. It should be noted that this definition excludes traditional open literature communication of research in scientific journals and that it requires an organizational context rather than com- munication solely between private individuals.
The explanation of technology transfer ac- tivity has been as problematic as its concep- tualization. The dominant explanations have been rooted in economic theory. Production function models provide explanations of the contribution of technical knowledge to economic growth, microeconomic models of firm behavior seek to account for the amount and composition of producers’ R&D, and models rooted in economic history give in- terpretations of the genesis and flow of technologies. These and other such economic approaches have provided useful and some- times powerful explanations of behavior sur- rounding the production and distribution of scientific and technical goods. However, each approach suffers, to a greater or lesser extent, from an inherent weakness-exclusive or nearly exclusive attention to forces emanating from market environments. If aspects of non-market and political environments are examined at all, it is through the lens of market-oriented con- cepts (e.g. a public good as one for which user charges cannot be efficiently collected).
For a number of reasons, it is necessary to supplement theories of technical change focus- ing exclusively on market-based or market- borrowed concepts. First, and most obvious, many of the producers of technical know- ledge are government and university R&D laboratories, for whom traditional market assumptions may be inappropriate. The great majority of studies in R&D economics focus on private R&D laboratories, but private sector laboratories do not produce the preponderance of technical knowledge and produce a small share of some technical goods, including, for example, pre-commercial applied research. Likewise, while one might expect economic models to account for technology transfer to commercial enterprises, one might expect less success from these same models in predicting technology transfer to government.
A less obvious, but perhaps even more compelling, reason to supplement economic models is that the environment of producers of
232 Technovation Volume 11 No 4

Technology transfer from U. S. R&D laboratories
technical knowledge does not so clearly cut along sector lines as it once did. The emer- gence of new organizational forms, not wholly private and not wholly public, is one factor. One recent study [3] indicated that as many as 25% of R&D units focusing on energy technology could not be meaningfully classified as either government or industry. Likewise, ‘sector blurring’ has been promoted by the in- creasing reliance of R&D laboratories of all types on government funding and, at the same time, policies (such as those discussed above) moving government and university laboratories toward commercial activities.
1.2. An environmental interpretation of technology transfer
Recently there has been a growth of interest in environmental interpretations of a wide range of organization behaviors. While some recent efforts have originated in Schum- peterian approaches to the economics of technical change, most of the work seeking to provide environmental interpretations has been advanced outside economics. One stream of relevant work has viewed organizations from an ‘ecological’ perspective. These studies [4] have employed analogies from biological theories of natural selection to identify the ways in which processes of organizational variation, selection and retention influence changes in organization structures and be- haviors, including organization innovation [S]. One of the most important lessons of the ecological environmental models is that organizations respond to a wide variety of en- vironmental stimuli, and market factors are not always the most critical determinants of technology transfer activity. Another contribu- tion is the notion that rational decision mak- ing, the centerpiece of microeconomics of the firm, often plays a relatively small role in strategic decisions about technology. Indeed, organizations change as a result of ‘organiza-
tional drift’ [6] and other factors that have little to do with self-conscious strategic decisions.
One of the more prominent bodies of research and theory in organizational-environment rela- tions is ‘environmental contingency theory’, which argues that organizational technology, structures and strategy interact, contingent on the demands from the organization’s environ- ment, in an effort to reduce organizational uncertainty and to shelter the organization from undesirable environments changes4. Once again, market variables may prove a crucial environmental contingency but a variety of social, technological and political factors may be just as important in determining organizations’ technology acquisition and transfer activities.
Another body of work relevant to under- standing environmental influences on technology transfer comes from the public organization theory literature. Research on the impacts of political authority on the activities of organizations-both private and public organi- zations-seeks to explain ways in which firms respond to non-market incentives [7]. En- vironmentally based theories of organizations have been directly applied to understanding the missions and operations of R&D laboratories. The results indicate that laboratories’ technical activities are best understood in terms of the interaction of the political authority exerted on the laboratory and the fit of its knowledge products to market requirements [8,9].
Building on the tradition of organization environment theories, we employ an ‘environ- mental dependence model’ to account for dif- ferences in R&D laboratories’ technology transfer activities. The model assumes that laboratories’ strategic choices are constrained by the market, but also by external political authority. However, the laboratories are not without autonomy. Technological strategies are chosen which not only fit environmental demands but also the goal orientation of the laboratory. Furthermore, the laboratory seeks actively to manage and control its dependence
Technovation Volume 11 No 4 233

B. Bozeman and M. Crow
upon the environment. Figure 1 presents the environmental dependence model.
Market Authority
\
Political Authority
/
Fig. 1. Environmental dependence model.
All laboratories, regardless of sector context (industry-government-university), derive the authority to do research and development from some source-market authority, political authority, or some mix of the two. While some organizations in society are chartered under some other type of authority (e.g. religious), almost all R&D laboratories act upon the basis of market and/or political authority and are subject chiefly to market and political con- straints [7]. If the laboratory receives its authority and motivation from the market, generally the output from the laboratory will be oriented towards the commercial market. If the laboratory receives its authority and motiva- tion from a political authority base, it is likely that more attention will be given to output that is less directly commercial (e.g. basic research) and that more of its technical product will be directed to other government entities. It is im- portant to note that R&D organizations often operate with a mix of political and market con- straints and resources and that sector context is not always a reliable indicator of that mix. One recent study showed that a sizable minority of industrial R&D laboratories are chiefly oriented to public domain science and an equally significant minority of government laboratories are oriented to the production of technical goods aimed directly at the market [8].
234 Technovation Volume 11 No 4
The environment creates dependence, chiefly resource dependence, and organizations seek to manage and sometimes exploit the constraints flowing from environmental dependence [lo]. The dependence of the laboratories on an authority agent is mitigated by various factors, including deployment of existing resources, boundary spanning, and manipulation of internal structure and control mechanisms.
The goal orientation of the organization-in the present case, the R&D laboratory-can be viewed as a function of its set of environmental constraints, its reservoir of resources and other dependence management assets, leading to a definition of comparative advantage and selec- tion of effectiveness criteria5. In turn, any set of scientific and technical activities, including technology transfer, is a function of the goal orientation as determined by environment, dependence, and dependence management. Below, each of the components of the model is described and indicators are developed for the testing of the model.
1.3. Dependence constraints
Consider two factors in terms of authority dependency: funding and vulnerability to en- vironmental change. An adequate budget is a prerequisite for laboratory existence, but the source of funding is a better indicator of en- vironmental dependence. A laboratory whose chief support is from its own industrial organization or parent has a quite different set of environmental constraints and dependence relations than one whose funding comes from government agencies. These differences in con- straints and dependence might be assumed to relate, ultimately, to the nature of the organization’s scientific and technical output, particularly technology transfer.
Specifically, we postulate:
Hypothesis One. Laboratories with more funding from government and vulnerability to

Technology transfer from lJ. S. R&D laboratories
shifting political priorities are more likely to engage in technology transfer to other govern- ment agencies.
Hypothesis Two. Laboratories with greater funding from industrial sources and vulner- ability to shifting markets are more likely to engage in technology transfer to industry.
1.4. Dependence management
Organizations deploy resources and develop a variety of mechanisms to manage dependence and to exploit and adapt to their environmeW. Various factors act to mitigate the dependence of laboratories on either political or market environments.
Probably the most important means of managing dependence is through cultivation of resources and deployment of existing resources. In the case of the R&D laboratory, resources include not only the traditional ones-personnel, budget-but also scientific skills.
Hypothesis Three. Laboratories with greater numbers of personnel, especially scientific per- sonnel, and larger budgets are more likely to be involved in transfer of technology to govern- ment and industry.
Organization theorists have devoted con- siderable attention to the role of organization structures in mitigating the environment. Any of a variety of internal structures of organiza- tions can be fashioned (or can evolve) in response to environmental requirements. For example, matrix structure seems to have evolved out of a need to respond to environ- ments that are particularly turbulent, and bureaucratic formalism and ‘over-structuring’ can be interpreted as a response to decrements in internal managerial control. Two structural variables seem especially important for R&D laboratories: the autonomy vs. centralization of R&D tasks and the diversity of the R&D mis- sion. Arguably, research organized around a
principal investigator (PI) or PI-led teams might be expected to be more conducive to scientific investigation in basic and, perhaps, applied research. But a more centralized department-based structure might be more at- tuned with an R&D mission aimed at develop- ing and transferring technology.
Diversity of the laboratory’s scientific and technical activities is a good surrogate for the conventional organization theory concept of organizational complexity. Presumably, an organization with a more diverse set of scientific and technical activities (excluding technology transfer) might also be more oriented to technology transfer because of the synergies involved- in the activities and the greater likelihood of appropriating technical knowledge ill].
Hypothesis Four. More complex laboratories with greater diversity of scientific and technical activities are more likely to be involved in technology transfer.
Hypothesis Five. Laboratories organized in a more centralized fashion (i.e. by depart- ment mode) are more likely to be involved in technology transfer than are laboratories organized in a more decentralized manner (i.e. PI mode).
One of the most import~t strategies that organizations have available for the monitor- ing, understanding and shaping of the en- vironment is ‘boundary spanning’. Boundary spanning is the concept used by organization theorists to describe organizations’ efforts to monitor their environments by developing member roles requiring information exchange with external environmental actors. The func- tions of boundary spanning are to detect information about changes in the external en- vironment and to represent the organization to the environment 1121.
In the context of the R&D laboratory, the director typically plays an important role in boundary spanning and the degree to which the
Technovation Volume 11 No 4 235

B. Bozeman and M. Crow
director is externally oriented may have substantial implications for the laboratory’s ability to manage dependence and, ultimately, to engage in technology transfer. Technology transfer is, at least to some degree, demand driven and the laboratory director‘s boundary spanning activity is often a source of the organization’s de~nition of external demand. Another source of boundary spanning relates to interorganizational relations. It is argued that interorganizational relations are most often motivated by a jointly perceived need for knowledge about the environment and a need to reduce environmental uncertainty. In terms of the R&D laboratory, one of the most rele- vant indicators of interorganizational attempts to manage dependence is the existence and number of formal interlaboratory research agreements.
Hypothesis Sk. Laboratories engaged in boundary-spanning activity, as reflected in the laboratory director’s external activity and the number of formal interlaboratory research agreements, are more likely to be engaged in technology transfer.
There is some reason to believe that the nature of boundary-spanning activity in a politi- cally dominated environment is distinctive in several respects [13]. Regardless of sector, laboratories in a political environment seek to manage political dependence by cultivating sources of political knowledge and by pro- viding information to political decision makers. Such activities might be expected to relate to laboratories’ propensity to transfer technology to government (without any con- comitant effect of technology transfer to industry).
Hypothesis Seven. Laboratories engaged in political boundary spanning, as measured by mail and telephone communization with government and by laboratory directors’ testimony at government agencies’ hearings are more likely to be engaged in technology transfer to government agencies.
1.5. Goal orientation
One of the more fruitful indicators of an organization’s goal orientation or mission definition is its effectiveness criteria. This ap- proach is particularly appropriate in the case of R&D laboratories, which often have goals that are somewhat removed from the parent organization’s goal. Of particular interest is the extent to which the R&D laboratory focuses on goals pertaining to scientific effectiveness and commercial effectiveness. While the two are not necessarily at odds, it is nonetheless the case that many of the laboratories rated highest on one are not rated (by themselves and others) as highly on the other [14]. One might expect that organizations more oriented to commercial goals would be more active in technology transfer.
Hypothesis Eight. Laboratories whose goal orientation, as measured by professed effec- tiveness criteria, is oriented to commercial factors, are more likely to be involved in technology transfer. Those whose goal orienta- tion is oriented to scientific effectiveness criteria are less likely to be involved in technology transfer.
In light of the hypotheses presented above, the general model of the effects of environ- mental dependence on scientific and technical enterprise (Fig. 1) can be operationalized for, respectively, technology transfer to industry and technology transfer to government. Figure 2 depicts the effects of a market environ- ment on technology transfer to industry. Dependence constraint is measured in terms of the percentage of the laboratory’s R&D budget derived from the parent industry and other in- dustry sources (RDIND) and response to a questionnaire item about the influence of market forces on selection of research pro- jects (MSELECT). Dependence management variables include total personnel for the laboratory (TOTPER), total budget for the laboratory (TOTBUD) and total scientific
236 Technovation Volume 11 No 4

Technology transfer from U. S. R&D labora tories
Enwronmental
!-
Dependence Management
ReSOLlRei TOTPER TOTBUD SCIPER
Boundary Spaflnlng DIREXT
LABACREE
MISDIV ORCPI ORCDD
Fig. 2. Environmental dependence model for transfer to industry.
personnel (SCIPER). The boundary-spanning variables for dependence management include a measure of the percentage of time the laboratory director spends on external affairs (DIREXT) and the laboratory’s number of formal interlaboratory R&D agreements (LABAGREE). Structure variables pertaining to dependence management include a measure of the diversity of the laboratory’s mission (MISDIV)’ and two measures of the organiza- tion of research, a binary variable indicating the presence of division- or department-based organization of R&D (ORGDD) and another for principal investigator-based organization of R&D (ORGPI). Goal orientation is operational- ized in terms of responses to two Likert-type scale items, one asking the extent to which scientific criteria are important to the labora- tory’s definition of effectiveness (EFFSCI), the other asking the extent to which commer- cial concerns are important to effectiveness (EFFCOMM). Technology transfer to industry is measured in terms of a binary questionnaire item asking whether the activity is a significant part, of the laboratory’s mission (TRANIND).
The model for technology transfer to government is, in consideration of the distinc-
tiveness of political environments, measured somewhat differently (Fig. 3). The dependence constraint variables are the extent to which government priorities influence the direction of the laboratory’s R&D (GSELECT). Other variables include percentage of R&D budget coming from government sources (GOVBUD) and percentage from government grants (RDGRANT). The variables for dependence management are identical to those in Fig. 2 ex- cept that a new category is added, political boundary spanning. Variables for this new category include mail received from govern- ment sources as a percentage of all the mail received by the laboratory director (GMAIL), a similar measure for phone conversations (GPHONE), and a binary measure based on whether a representative of the laboratory had in the last year served as a witness testifying to a government agency (GTEST). Technology transfer activity is measured as before, except
Market
1
FundIng COVEUD RDCRANT Dependence
Management
Resources TOTPER TOTBUD SCIPER
Boundary Spannmg DIREXT
LABRCREE
Structural MISDIV ORCPI ORCDD
Political Boundary SpafInIng CMAIL
CPHOYE CTEST
Fig. 3. Environmental dependence model for transfer to government.
Technovation Volume 11 No 4 237

B. Bozeman and M. Crow
in this instance the item refers to transfer to government agencies (TRANGOV).
2. Study methods and procedures
The data reported in this study were derived from questionnaires, both mailed and phone administered. This section begins by describing the population and approaches to drawing the sample.
2.1. Population and sample development
Four major research center directories were used to identify the population of U.S. R&D laboratories. Laboratories with fewer than 25 reported employees were excluded from the study population as were those chiefly con- ducting research in the social sciences. This yielded a study population of 16 597 R&D laboratories.
In drawing the sample for this study, both random probability and stratified sampling were used. A random probability sample of 1300 was developed using a computer- generated random number list. In addition to a desire to assure representativeness, best achieved through random probability samp- ling, it was deemed useful to gather information about the largest R&D laboratories in the U.S. Since we were interested in ensuring statistical significance at the less than 0.01 level for a two- tailed test, a list of 1300 was drawn for the sam- ple. The largest 200 laboratories were added to this list*.
2.2. NCRDP questionnaires procedures
The procedures involved developing the NCRDP questionnaire are described elsewhere in detail [8]. The design of the questionnaires was undertaken jointly by the researchers.
An initial master list of questionnaire items was developed from previous theoretical frameworks [3,7], related previous studies, ex- plicit hypotheses, and articulated concerns of NSF program managers. In order to determine possible response bias, question ambiguity and variance, a pre-test was undertaken9.
After considering the results from the pre- test it was clear that not all of the desired infor- mation could be obtained from the mailed questionnaire. The length necessary for the questionnaire including all the desired items would have been prohibitive. A telephone questionnaire was developed. The telephone in- terviews resulted in the gathering of 665 usable responses from 1210 telephone contacts for a response rate of 7 1% .
A number of steps were taken to minimize the refusal rate on the over-sampled R&D laboratory directorslO. Of the 1341 eligible laboratories contacted (by phone and ques- tionnaire) data were received (phone and/or questionnaire) from 966 for an overall response rate of 72%. Considering just the mailed questionnaire, 711 usable responses were re- ceived for a response rate of 53%.
Several steps were taken to determine the likelihood of non-response bias. Most impor- tant, the responding laboratories were com- pared with the entire sample on those variables about which data were available on the entire sample, including total personnel and geo- graphic location. T-test statistics indicated that the total personnel measures for the group of respondents were not significantly different (at the less than 0.25 level) from the entire sample of laboratories. In regard to geographic loca- tion, plots were printed for the group of respondents and non-respondents and no geographic bias trends were discernible”.
3. Findings
Tables 1 and 2 provide cross-tabulations of the variables sector (government-university-
238 Technovation Volume 11 No 4

Technology transfer from U. S. R&D laboratories
TABLE l(a). Technology transfer to commercial organizations TABLE 2(a). Technology transfer to government organizations
Frequency Percent Row Pet. Column Pet. No Yes Total
Frequency Percent Row Pet. Column Pet . No Yes Total
Government 64.00 9.76
47.76 17.34
Industry 208.00 31.71 58.43 56.37
Other 13.00 1.98
48.15 3.52
University 84.00 12.80 60.43 22.76
Total 369.00 56.25
Frequency missing = 310
70.00 134.00 10.67 20.43 52.24 24.39
148.00 356.00 22.56 54.27 41.57 51.57
14.00 27.00 2.13 4.12
51.85 4.88
55.00 139.00 8.38 21.19
39.57 19.16
287.00 656.00 43.75 100.00
TABLE l(b). Statistics for table of sector by TRANSlND
Government 33.00 100.00 4.99 15.13
24.81 75.19 8.13 39.22
lndustry 272.00 88.00 41.15 13.31 75.56 2444 67.00 34.51
Other 17.00 10.00 2.51 1.51
62.96 37.04 4.19 3.92
University 84.00 57.00 12.71 8.62 59.57 40.43 20.69 22.35
Total 406.00 255.00 61.42 38.58
Frequency missing = 305
133.00 20.12
360.00 54.46
27.00 4.08
141.00 21.33
661 .OO 100.00
TABLE 2(b). Statistics for table of sector by TRANSGOV
Statistic
-
Statistic DF Value Probability
DF Value Probability
Chi-Square
Cramer’s V
3 6.317
0.098
0.097 Chi-square 3 105.808 0.000 Cramer’s Y 0.400 Effective sample size = 661 Frequency missing = 305
Effective sample size = 661 Frequency missing = 310
industry) and technology transfer activity for, respectively, transfer of technology to industry and to government organizations.
The tables indicate that 43 A070 of the respon- ding laboratories are engaged in technology transfer to firms and 38.6% seek to transfer technology to government. As indicated by the significance levels of the chi square and Cramer’s Y statistics, the sector type seems
to have some effects on the incidence of technology transfer to government. However, in the case of technology transfer to industry, the relationship to sector is modest. Each sector is involved in technology transfer to commercial organizations; while government organizations are most active (at least on a percentage basis), at least 40% of the laboratories in each sector view technology transfer to industry as a significant part of their mission.
Technovation Volume 11 No 4
B. Bozeman and A#. Crow
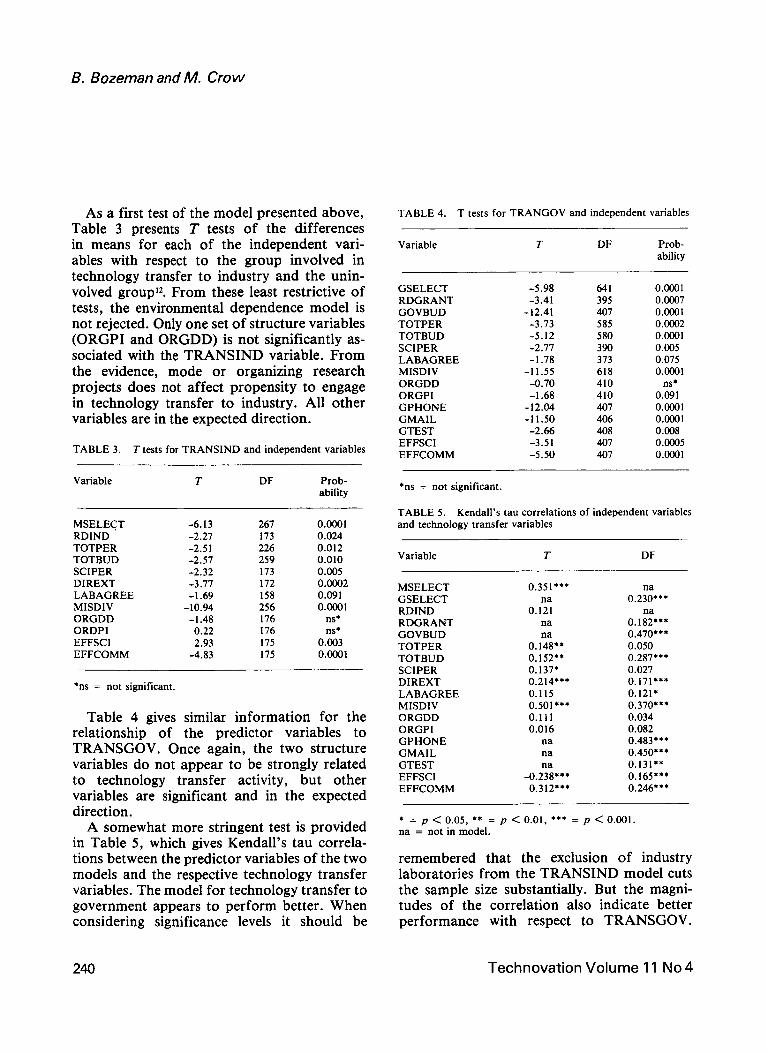
As a first test of the model presented above, Table 3 presents T tests of the differences in means for each of the independent vari- ables with respect to the group involved in technology transfer to industry and the unin- volved group’*. From these least restrictive of tests, the environmental dependence model is not rejected. Only one set of structure variables (ORGPI and ORGDD) is not significantly as- sociated with the TRANSIND variable. From the evidence, mode or organizing research projects does not affect propensity to engage in technology transfer to industry. All other variables are in the expected direction.
TABLE 3. T tests for TRANSIND and independent variables
Variable T DF Prob- ability
MSELECT -6.13 261 RDIND -2.27 173 TOTPER -2.51 226 TOTBUD -2.57 259 SCIPER -2.32 173 DIREXT -3.77 172 LABAGREE -1.69 158 MISDIV -10.94 256 ORGDD -1.48 176 ORDPI 0.22 176 EFFSCI 2.93 175 EFFCOMM -4.83 175
0.0001 0.024 0.012 0.010 0.005 0.0002 0.091 0.0001
ns* *
0.;3 0.0001
*ns = not significant.
Table 4 gives similar information for the relationship of the predictor variables to TRANSGOV. Once again, the two structure variables do not appear to be strongly related to technology transfer activity, but other variables are significant and in the expected direction.
A somewhat more stringent test is provided in Table 5, which gives Kendall’s tau correla- tions between the predictor variables of the two models and the respective technology transfer variables. The model for technology transfer to government appears to perform better. When considering significance levels it should be
TABLE 4. T tests for TRANGOV and independent variables
Variable T DF Prob- ability
GSELECT -5.98 641 RDGRANT -3.41 395 GOVBUD -12.41 407 TOTPER -3.73 585 TOTBUD -5.12 580 SCIPER -2.17 390 LABAGREE -1.78 373 MISDIV -11.55 618 ORGDD -0.70 410 ORGPI -1.68 410 GPHONE -12.04 407 GMAIL -11.50 406 GTEST -2.66 408 EFFSCI -3.51 407 EFFCOMM -5.50 407
0.0001 0.0007 0.0001 0.0002 0.0001 0.005 0.075 0.0001
*
0% 0.0001 0.0001 0.008 0.0005 O.OWl
*ns = not significant.
TABLE 5. Kendall’s tau correlations of independent variables and technology transfer variables
Variable T DF
MSELECT GSELECT RDIND RDGRANT GOVBUD TOTPER TOTBUD SCIPER DIREXT LABAGREE MISDIV ORGDD ORGPI GPHONE GMAIL GTEST EFFSCI EFFCOMM
0.351***
0.12”; na
0. I;** 0.152** 0.137* 0.214*** 0.115 0.501*** 0.111 0.016
na na
-0.21”s*** 0.312***
0.2::***
0.&** 0.470*** 0.050 0.287;;’ 0.027 0.171*** 0.121’ 0.370*** 0.034 0.082 0.483*** 0.450*** 0.131** 0.165*** 0.246***
* =p<o.o5, ** = p <O.Ol, *** =p<O.ool. na = not in model.
remembered that the exclusion of industry laboratories from the TRANSIND model cuts the sample size substantially. But the magni- tudes of the correlation also indicate better performance with respect to TRANSGOV.
240 Technovation Volume 11 No 4

Technology transfer from U. S. R&D laboratories
The table indicates that laboratories engaged in technology transfer to industry tend to be vulnerable to changes in the market, have a large number of total personnel working in the laboratory, have a large number of scien- tific personnel 13, have an externally oriented laboratory director, and, most important (at least statistically), a more diverse R&D mis- sion. As expected, emphasis on scientific effec- tiveness criteria is negatively associated with technology transfer to industry, commercial effectiveness criteria are positively related. The picture for technology transfer to government is somewhat different. Each of the political boundary-spanning variables is significant and strongly related as is the percentage of total budget from government sources. Personnel composition-total numbers and scientific personnel-does not account for technology transfer to government.
Strictly speaking, an ordinary least-squares regression model may not provide an appro- priate interpretation for the binary dependent variables, and an alternative approach is there- fore employed below. However, it is of some value to employ this generally robust technique as a test, albeit a problematic one, of the environmental dependence model. A “trim- med” three-variable model is employed in con- nection to explain, respectively, TRANSIND and TRANSGOV14. In each model, the best predictor variables are drawn from each of the conceptual categories (e.g. dependence con- straints, dependence m~agement, goal orien- tation). The trimmed regression model for TRANSIND includes MSELECT (Dependence Constraint), MISDIV (Dependence Manage- ment), and EFFCOMM (Goal Orientation). The trimmed regression model for TRANSGOV includes GOVBUD (Dependence Constraint), MISDW (Dependence Management), and EFFCOMM (Goal Orientation). Table 6 gives the results for each of the models.
The results reveal that the three-variable models work quite well, with an R-square of 0.408 for the TRANSIND model and 0.401 for
TABLE 6. ‘Trimmed’ regression models for TRANSIND and TRANSGOV
Variable Estimate F Probability < F
Y = TRANSIND
MISDIV EFFCOMM MSELECT R-square = 0.408
Y = TRANSGOV
11.66 76.97 0.0001 3.46 22.89 0.0001 1.59 10.56 0.001
MISDIV 13.47 92.94 O.WOl EFFCOMM 8.50 58.70 0.0001 GOVBUD R-square = 0.401
14.27 98.50 0.0001
the TRANSGOV model. Each of the predictor variables makes a substantial contribution in accounting for unique variance. Each of the signs is in the hypothesized direction. The question remains, however, whether the results might be an artifact of violation of test assumptions with the dichotomous dependent variables.
An appropriate regression-based model for dichotomous dependent variables is provided with the logit procedure. Table 7 reports the results of the logit application for each of the trimmed models. The results are supportive of the models in much the same manner as the OLS analysis. By convention, the gamma statistic is employed to evaluate the power of the logit model (as it is not appropriate to view the logit procedure as explaining variance) and, in both instances, the magnitudes of the gammas indicate a strong model. One point of interest is the vanishing of the EFFCOMM variable in the TRANSGOV model, perhaps because of the distribution of its variances with respect to the dichotomous dependent variable. The chief point, however, is that with a conceptually elegant three-variable model, the technology transfer activity of R&D laboratories is well explained, lending support for further develop- ment of the environmental dependence inter- pretation of scientific and technical enterprise.
Technovation Volume 11 No 4 241

8. Bozeman and M. Crow
TABLE 7. Logit models for TRANSIND and TRANSGOV
Variable Logit Coeff. P R
V = TRANSIND
MISDlV 1.056 O.WOO 0.338 EFFCOMM 0.633 O.ooOl 0.187 MSELECT 1.489 0.004 0.165 Gamma = 0.766
V = TRANSGOV
MlSDlV EFFCOMM GOVBUD Gamma = 0.748
0.938 0.0000 0.321 -0.206 0.121 -0.028 0.030 0.000 0.341
4. Summary and Conclusions
This paper has sought to explain the tech- nology transfer activity of R&D laboratories by developing and testing an environmental dependence model of scientific and technical enterprise. The model assumes that scientific and technical activity is a function of en- vironmental constraints flowing from the organization’s market and political influences. As the organization seeks to manage con- straints and develop a goal or mission orienta- tion, it chooses to focus on technical activity that is adaptive for its environment. An assump- tion of the model is that the R&D laboratory’s mix of political and market constraints is a more significant factor in accounting for its scientific and technical choices than is its sector (university, industry, government) affiliation.
Simple tests of the model (T tests and Ken- dall’s tau correlations) indicated that each of the terms of the model offer some predictive value. The lone exception is the structure for organizing research projects. Scientific and technical mission diversity is particularly im- portant in understanding technology transfer to both government and industry. However, a variety of measures of political boundary spanning are quite important in transfer to
government but not so to industry. Likewise, the nature of the resource base (government vs. industrial) is strongly related to the choice of transfer technology to, respectively, govern- ment and industry.
Both an OLS estimation and a logit-based model were developed to provide a test of a trimmed three-variable model employing only one measure for each major construct of the environmental dependence model. The regres- sion model was effective in accounting for variance in technology transfer behavior and the technically more appropriate logit model, likewise, provided support for the environmen- tal dependence interpretation.
A variety of next steps seem promising. It will be useful to go beyond technology transfer to the explanation of the entire range and mix of scientific and technical activities. There are also some measurement challenges. The actual dynamics of the environmental dependence model are not tested here. A path analysis, testing direction of influence, seems a needed step once stronger measures of scientific and technical activity are developed.
The findings seem suggestive with respect to public policy for technology transfer. One somewhat surprising finding was that co- operative R&D, as measured by number of interlaboratory agreements, was not a strong predictor of technology transfer to either firms or to government. In light of the recent policy emphasis given to cooperative R&D this fmd- ing, while preliminary, at least sounds a note of caution. Granted, there is no measure employed here other than the number of agreements and it is possible that the structure and quality of the agreements is much more important than the raw number. Nevertheless, if laboratories engaging in cooperative R&D are only a bit more likely than others to engage in technology transfer then the short-term value of cooperative R&D is open to question.
One of the most important factors in deter- mining technology transfer activity is the diver- sity of the laboratories’ missions. When we
242 Technovation Volume 11 No 4

Technology transfer from U. S. R&D laboratories
take this finding along with the finding that laboratories with larger total budgets and larger numbers of scientific personnel are more likely to be engaged in technology transfer we might surmise that there are significant threshold effects operating in technology transfer and that only those laboratories with a given level of capacity are likely to be active technology transfer partners. In an era of limited resources, recognizing specialized roles and tailoring policy requirements to laboratory strengths seems to make sense. Not every laboratory is well suited to be a technology transfer partner and, moreover, technology transfer activities may even get in the way of more important activities such as basic research, technology development or education.
Perhaps one of the most significant im- plications of the paper is simply the identifica- tion of the number of laboratories engaged in technology transfer activities. With more than half of all government laboratories engaged in technology transfer and fully 40% of the no-longer-ivory-tower university laboratories active as technology transfer partners, we can assume that the various environmental influences, whether market opportunity or political mandates, have had the effect of entic- ing large numbers of laboratories to fly the technology transfer banner. Now it is impor- tant to begin to understand the impact of this level of activity and the ways in which it has transformed individual laboratories and the U.S. R&D laboratory system.
Notes
I This is a revision of a paper presented at the First Annual Korea-U.S. Seminar on Science and Technology Policy, Center for Science and Technology Policy, Korea Institute of Science and Technology, Seoul, Korea, November 3-6, 1989. The paper is part of the National Comparative Research and Development Project. The authors gratefully acknowledge funding of the National Science Foundation, Science Resources Section.
z Some of the recent federal-level legislation pertaining to technology transfer should be briefly noted. The Stevenson-Wydler Technological Innovation Act of 1980 required government laboratories to set aside 0.5% of their budget to be directed to technology transfer and mandated the formation in each laboratory with more than $20 million budget of an Office of Technology Ap- plications and, finally, facilitated personnel exchanges between government laboratories and universities and in- dustry. The Bayh-Dole Act of 1980 permitted small businesses and not-for-profit organizations to retain title to inventions even if produced with federal funds. The National Cooperative Research Act of 1984 codified rulings by the Department of Justice aimed at easing anti- trust laws applied to joint ventures among firms and between firms and federal laboratories. The Federal Technology Transfer Act of 1986 extended Stevenson- Wydler, formalized the Federal Laboratory Consortium, and authorized federal laboratories to increase to 15 Vo the royalties employees receive for inventions successfully commercialized. Executive Order #12591, signed in 1987, required federal laboratory directors to be respon- sible for entering into cooperative research agreements.
3 This is the definition employed when we gathered questionnaire data about organizations’ technology transfer activities.
4 For a review of the contingency theory literature see ref. 17.
5 For evidence that performance is a function of the laboratory’s ability to align its set of environmental con- straints with its dominant output orientation see ref. 9.
6 For a theory of organizations’ strategies for man- aging dependence and environmental constraints see refs 10 and 18.
’ This is an additive variable based on responses to dichotomous choices for the following activities: basic research, applied research, development of prototype devices, technical assistance, and technological demonstration.
* The researchers recognized that the data provided in the most recent standard research directories would necessarily be somewhat out of date and would entail at least a few coding and other errors. To compensate for these problems, each of the 1500 laboratories was telephoned by the researchers and their staff in order to confirm the continued existence of the laboratory, correct addresses, to develop data about areas of research focus and total personnel, and to confirm the name of the cur- rent laboratory director. As a result of this process, the study sample was reduced from 1500 to 1341.
Technovation Volume 11 No 4 243

B. Bozeman and A.4 Crow
9 A separate sample random probability sample of 60 was drawn from the population by identical computer- generated random number techniques. In addition, to in- dicate the response patterns for the 200 largest R&D laboratories (the “superlabs”); a group of the next 20 largest (201-221) was included in the pre-test. After a period of 1 month had elapsed from the time of the follow-up letter (7 weeks from the initial mailing of the pre-test questionnaire), the pre-test was closed. From the 80 questionnaires mailed, 31 usable questionnaires were returned. The researchers analyzed the responses in order to determine possible ambiguities, degree of response variation, and, comparing known characteristics of the respondents with known characteristics of the population, degrees of non-response bias. From this information, the questionnaire was revised again.
lo Some R&D directors indicated that they averaged as many as five or six mailed questionnaires per month. In order to distinguish this study and to minimize the response rate the following steps were taken: (1) per- sonalized alert and cover letter; (2) confirming phone call; (3) first class postage; (4) high quality paper; (5) multicolor but subdued colors; (6) science indicators in- centive; (7) high quality printing; (8) pleasing format without crowding; (9) easy implementation with few open-ended questions; (10) return postage provided; (11) “hotline” telephone number for questions.
ii Another measure of non-response bias is “wave analysis”. That is, determining whether those who res- pond more quickly are significantly different from those who respond later. The theory is that the later respondents, if different, will tend to be more like those that did not respond at all. Correlation with date of response indicated that only size variables were signifi- cantly correlated (larger laboratories responding later) but the correlations were modest and, moreover, the stratification by size provided some hedge against possible non-response bias. It was concluded that no substantial problems of non-response bias were apparent-as one would expect with such a relatively large response rate.
I2 In each stage of analysis there is a distinction be- tween the database for the examination of, respectively, TRANIND and TRANGOV. In the case of TRANIND, only university and government R&D laboratories are considered because of the lack of perceived construct validity of the question asking industry labs to indicate if they transfer technology to industry. An affirmative response might mean that technology is transferred to a parent, out of the laboratory to the organization, or to another industrial organization. It was not possible,
moreover, to ask a question sufficiently detailed to cap- ture this nuance. In the case of technology transfer to government (TRANGOV) the industry laboratories are included because there is no similar ambiguity in response.
I3 It is absolute number of scientific personnel that is important, perhaps as a size surrogate; ratio of scientific personnel to total personnel was not significantly related.
I4 Given the limitations of regression for dichotomous data, no attempt is made to develop path coefficients for the models.
References
1
2
3
4
5
6
7
8
9
IO
11
12
J.T. Pinkston, Technology transfer: issues for consortia. In K.D Walters (Ed.), Entrepreneurial Management: New Technology and New Market Development, Ballinger, Cambridge, MA, 1989, pp. 143-149. H. Fusfeld, The Technical Enterprise, Ballinger, Cambridge, MA, 1986. M. Crow and B. Bozeman, R&D laboratories’ en- vironmental contexts, Research Policy, 16(5) (1987) 229-259. H. Aldrich, Organizations and Environments, Prentice-Hall, Englewood Cliffs, NJ, 1979. L. Hrebiniak and W. Joyce, Organization adaptation: strategic choice and environmental determinism, Ad- ministrative Science Quarterly, 30 (1985) 336-349. M. Hannan and J. Freeman, The population ecology of organizations, in M. Meyer and Associates, En- vironments and Organizations, Jossey-Bass, San Francisco, CA, pp. 131-172. B. Bozeman, All Organizations Are Public: Bridging Public and Private Organization Theory, Jossey- Bass, San Francisco, CA, 1987. B. Bozeman and M. Crow, The environments of U.S. R&D laboratories: political and market in- fluences, Policy Sciences, 23 (1990) 25-56. M. Crow and B. Bozeman, A typology of R&D laboratories, Journal of Policy Analysis and Management, 6(3) (1987) 328-341. J. Pfeffer and Cl. Salancik, External Control of Organizations, Harper and Row, New York, 1976. R. Nelson, Simple economics of basic research, Journal of Political Economy, (June 1959) 297-306. R.L. Daft, Organization Theory and Design, West Publishing, New York, 2nd edn., 1986.
244 Technovation Volume 11 No 4

Technolug y transfer from U. S. R&D laboratories
13
14
15
16
17
18
B. Bozeman and R. McGowan, Information acquisi- tion and political environments in technologically- intensive government agencies, in Devendra Sahal (Ed.), The Transfer and Utilization of Technical Knowledge, Lexington Books, Lexington, MA, 1982. B. Bozeman and M. Crow, U.S. R&D Laboratories and their Environments: Public and Market ln- fluence. Final Report to the National Science Foun- dation, Science Resources Section, Technology and Information Policy Program, Syracuse, NY, 1987. M. Crow, The Effect of Publicness on Organiza- tional Performance: A Comparative Analysis of R&D Laboratories, Springfield, VA: NTIS, PB85- 216646, 1985. M. Crow and B. Bozeman, R&D Laboratories in the United States: Structure, Capacity and Context, Science and Public Policy, forthcoming. .I. Ford and J. Slocum, Size, technology, environ- ment, and the structure of organizations, Academy of Management Review, 2 (1977) 561-575. J. Thompson, Organizations in Action, McGraw- Hill, New York, 1963.
Barry Bozemnn is Director of the Technology and Informa- tion Policy Program and Pro- fessor of Public Administra- tion and Affiliate Professor of Engineering, The Maxwell School of Public Affairs, Syracuse University. His research has focused on technology transfer, innova- tion, and R&D laboratory policy. Bozeman received his Ph.D. in political science from Ohio State University in 1973.
Michael Crow is Director of the Institute for Physical Research and Technology, Iowa State University. His research interests include science and technology policy, technology and economic development, and universities’ strategies for ac- quiring funds for science in- frastructures. Crow has authored or co-authored several books including Strategic Management of In- dustrial R&D and Synthetic Fuel Technology Development in the United Stares. Crow received his Ph.D. in public administration from the Maxwell School, Syracuse University, in 1985.
Technovation Volume 11 No 4
Le transfert de technologie provenant du gouvernement et des laboratoires de recherche-d&eloppement aux EEUU
RBSUMI?
Malgre I’accroissement d’interet au transfert interne de technologie, il y a Ctrangement tr6s peu de preuves empiriques sur les dkterminants d’activitC de transfert de technologie. Cet Ctude present les rtsultats d’un sondage national sur plus de 900 laboratoires, se concentrant sur un sousCchantillon comprenant 134 laboratoires gouvernementals et 139 laboratoires univer- sitaires. Un modtle d’activit(: de transfert de technologie de dCpendance du milieu est prCsentC, et on propose que l’influence de I’autoritC politique constitue I’un des elements les plus importants qui dkterminent I’activite de transfert de technologie. Plusieurs tests du modtile indiquent que la diversit scientifique et technique des missions est particulikement import~te pour comprendre le transfert de technologie vers le gouvernement autant que vers I’industrie. NCanmoins un certain nombre de mesures de couverture des limites au niveau politique sont assez importantes dans le cas de transfert vers le gouvernement mais non pas vers l’industrie. Egalement la nature de la base des resources (gouvernement contre industrie) est fortement reliC au choix de transferir la technologie vers le gouvernement et vers l’in- dustrie respectivement.
Technologietrans~er von U.S. Regierungs - und Universit& R&D Labors
ABRISS
Trotz zunehmendem Interesse an i&n- dischem Technologietransfer, gibt es iiber- raschend wenig empirisch erstellte Daten iiber die entscheidenden Faktoren, die Technologie aktivieren. Diese Untersuchung bringt, die Ergebnisse einer Umfrage bei 900 Labors im Lande, insbesondere einem Subsample von 134 Regierungslabors und 139 Universit~tslabors.
245

B. Bozeman and M. Crow
Ein umweltabhangiges Model von Techno- logietransferaktivitat wird erstellt, das als wichtigsten entscheidenden Faktor von Technologietransferaktivitat den Einflul3 politischer Autoritat vorbringt. Beim Erproben des Models ergab sich da13 wissenschaftliche und technische Verschiedenartigkeit der Aufgaben besonders wichtig sind, wenn man Technologietransfer zur Regierung und zur In- dustrie verstehen will. Doch sind eine Reihe von MaBnahmen beziiglich politischer Ein- schrankungen im Transfer zur Regierung wichtig, nicht aber zur Industrie. Desgleichen bestimmt die Beschaffenheit der Aktiva (Regierung/Industrie) hauptsachlich die Wahl des Technologietransfer an Regierung und Industrie und deren Anwendung.
La Transferencia de la Tecnologia entre el gobierno de 10s EE.UU. y 10s laboratorios de investigach y desarollo de las universidades
RESUMEN
Aunque el inter& en la transferencia de tec- nologia domestica aumenta cada vez mas, la
falta de pruebas empiricas de 10s factores deter- minantes de la actividad de la transferencia de la tecnologia sorprende. En este estudio se presentan 10s resultados de un sondeo national de m&s de 900 laboratories, con Cnfasis especial en un sub-grupo de 134 laboratorios guber- namentales y 139 laboratorios universitarios. Se ofrece un modelo de actividad de trans- ferencia de tecnologia con dependencia am- biental. Se propone en el argument0 que la influencia de autoridad politica tiene un efecto determinante importante en la actividad de la transferencia de tecnologia. Algunas pruebas llevadas a cabo de1 modelo indican que las distintas misiones cientificas y tecnicas tienen una importancia particular tanto para el gobierno coma para la industria a la hora de entender la transferencia de tecnologia. Sin em- bargo, varias medidas de definition de campo politico tienen bastante importancia para el gobierno mientras no lo tengan para la in- dustria. De la misma forma, existe una fuerte relation entre el tipo de base de recurso (o bien el gobierno o bien la industria) y la decision de transferir la tecnologia, respectivamente, al gobierno o a la industria.
246 Technovation Volume 11 No 4