Embed Size (px)
Citation preview

Technology to Market:
Cost-Benefit Analysis of AMPED
Technologies
Joe Miler, PhD
Program Director: Ilan Gur , PhD
Tech SETA: Russ Ross , PhD
ARPA-E Fellow: Amul Tevar , PhD
9 January 2013
1

Getting past the Standard Interaction
Interesting!
Hey check out my new
BMS sensor that can
solve all your
problems!
2
I’m trying to be polite. Actually, you
haven’t told me enough to have any
clue of how interesting this is for me.
What they
really mean:
Research
scientist OEM Engineer
Hey check out my super-
expensive, unreliable gadget
that we cooked up in lab and
have no idea what to do with!
What they
hear:

3
Lab researcher
Getting past the Standard Interaction
OEM R&D Engineer
How do we go from
cool technology to scalable technology?

Innovation
People creating value through the
implementation of new ideas
» Herman D’hooge, Intel
» Innovation Network

Innovation
People creating value through the
implementation of new ideas
» Herman D’hooge, Intel
» Innovation Network

Technology to Market Plan - Elements
Technology
Market
Manufacturing
Team
Inte
llectu
al Pro
pe
rty
Fun
din
g
Technology-to-Market

Key Activities for AMPED Teams
Research & Development
Year 1 Year 2 Year 3
IP Strategy
Market Engagement and Cost-Benefit Analysis
(Value Proposition)
7
Team Development
Next Stage Plans and Funding

The BMS Design Space
8
Image Sources:
http://www.computertimes.com/mar07Image214.jpg
http://www.plmsdevelopments.com/images_if/gauges.jpg
http://www.linguistics.pitt.edu/henderson/Henderson%20Photos-2/Lab/control-knobs.jpg
Knobs Outputs
Externalities

The BMS Design Space
9
SOC Window
Controls
Charge profile
Therm.
Management
Drive mode
Cell
equalization
Cell Chem. Circuit Arch.
Pack Size
Cell Format
Knobs Outputs
Externalities
Operating
Temp.
Cell mfg errors Drive Profile
Collisions
Regulatory
Consumer
demand
Liability
Initial
Cost/Weight/Volume Lifetime
Charge Rate
Reliability
Safety
Secondary Use
Utilization Diagnostics

The BMS Design Space
10
SOC Window
MPC
Controls
Charge profile
Therm.
Management
Blending
Cell
equalization
Cell Chem. Swappable
Reconfig
. Circuit Arch.
Pack Size
Cell Size
Knobs
Outputs
Externalities
Operating
Temp.
Cell mfg errors
Drive Profiles
Collisions
Regulatory
Consumer
demand
Image Source: http://cdnfiles.hdrcreme.com/32115/medium/knobs-switches.jpg?1318063005

Developing Scalable BMS Technologies
11
Scalable
BMS
Technology
AMPED
Team
Your plan
Industry
Advice

Developing Scalable BMS Technologies
Component
Level
Innovation
System Level
Technical
Performance
Customer
Value
Proposition
Scalable
BMS
Technology
Cost
Analysis
12
Goal: Predict system performance
with State-of-Art Component
vs AMPED Component

Predicting System Performance Improvement
13
Existing Sensor
AMPED Sensor
Goal: Predict system performance
with State-of-Art Component
vs AMPED Component
Example: Novel Sensor
Exis
tin
g
AM
PED
AM
PED
Charge
Rate
Lifetime
Exis
tin
g
Battery Pack Model
System Performance

Challenge #1: Vast Scope of Information Needed
Existing Component
Performance Data Battery Pack Model
Validation Data
for System
Performance
Modeling Results
Required Info: • Accuracy
• Spatial resolution
• Time resolution
• Durability
• Size
Resources: • Spec Sheets
• Interviews
• Tear-down reports
Challenges • Proprietary
• Highly detailed
Required Info: • No. of sensors
• Sampling rate
• Controls scheme
• Power topology
• Thermal
Management
Resources: • Interviews
• Tear-down reports
Challenges • Proprietary
• Inaccessible
Required Info: • Vehicle range
• Charge rate
• Capacity fade
• Safety
Resources: • Internal pack
performance reports
Challenges • Proprietary
• Highly coupled outcomes
14
Example: Novel Sensor

Component
Performance Data Battery Pack Model
Validation Data
for System
Performance
System
Performance Results
Unique to each AMPED team
System model subject to change
• Different vehicle types: HEV, PHEV, AEV
• Different battery designs
• New technologies
Challenge #2: Defining the System to Model
15

System
Model System
Model Pack
Model
System
Model System
Model Pack
Model
Component
Performance Data
System
Model System
Model Pack
Model
Validation
Results
Validation
Results
Results
Validation
Validation
Results
Validation
Results
Results
Validation
Validation
Results
Validation
Results
Results
Validation
Challenge #2: Defining the System to Model
Determining system-level performance is a
multivariate, multidisciplinary optimization problem
16

Practical Approaches to Determining System-Level
Performance Improvements
Benefits
• Expert intuition serves to synthesize
complex problem.
• Details can remain proprietary
while conclusions are shared.
• Experts are often potential
investors and future customers.
Drawbacks
• Expert opinions vary dramatically.
• Disruptive technologies are
impossible foresee.
• Motives may vary.
Approach #1: Seek Expert Advice
Benefits
• Assumptions are clear.
• May break conventional wisdom.
• Existing models provide a launch
point.
Drawbacks
• Assumptions may be wrong.
• Time-intensive.
• Miss the forest for the trees.
• Quality input data is elusive.
Approach #2: Build a Custom Battery Pack Model
17

Many Possible Outcomes to Compare
Extended range
Increased charge rate
Reduced initial pack size (cells)
Reduced non-cell components
Increased lifetime
Improved pack safety
Improved reliability
Improved life estimation
18
Existing Sensor
AMPED Sensor
Example: Novel Sensor
Exis
tin
g
AM
PED
AM
PED
Charge
Rate
Lifetime
Exis
tin
g
Many Possible
Technical Improvements
Battery Pack Model
Expert
Advice
Custom
Model
How to
determine
which system
level
performance
improvements
to pursue?
System Performance

Developing Scalable BMS Technologies
Component
Level
Innovation
System Level
Technical
Performance
Customer
Value
Proposition
Scalable
BMS
Technology
Cost
Analysis
19

Reaching the Customer New
AMPED Tech
Extended range
Increased charge rate
Reduced initial pack size (cells)
Reduced non-cell components
Improved pack safety
Full cell yield utilization
Improved reliability
Improved warranty estimation
Automotive OEMs
Tier 1 Suppliers
Charge stations
Fleet operators
Cell manufacturers
Grid storage companies
System Performance
Improvements
Value Propositions
Possible Customers Definition:
A quantifiable benefit offered to a customer.
?
20

Reaching the Customer New
AMPED Tech
Extended range
Increased charge rate
Reduced initial pack size (cells)
Reduced non-cell components
Improved pack safety
Full cell yield utilization
Improved reliability
Improved life estimation
Automotive OEMs
Tier 1 Suppliers
Charge stations
Fleet operators
Cell manufacturers
Grid storage companies
System Performance
Improvements
Value Propositions
Possible Customers
Vehicle cost savings
Increased vehicle adoption
Regulation compliance
Increased charger use
Fleet capacity factor
Increased cell value
Decreased warranty cost
21

Framework for Assessing Value Propositions
Technical
Improvement
Intermediate
Benefit
Value
Proposition
Potential
Customer
Reduced
Initial Pack
Size (cells)
Lightweighting Vehicle Cost Savings OEMs, Tier 1s
Fewer cells Vehicle Cost Savings OEMs, Tier 1s
Improved
Handling
Vehicle Adoption OEMs
Increased
Trunksize
Vehicle Adoption OEMs
22
Extended range
Increased charge rate
Reduced initial pack size (cells) Reduced non-cell components
Improved pack safety
Full cell yield utilization
Improved reliability
Improved warranty estimation
System Performance
Improvements
Framework provides:
• Methodical breakdown of value
• Techniques for quantifying value
• Targeted references

Value Proposition: Reduced Initial Pack Size (Cells)
• Varied cost savings ► Decreased Bill of Materials (BOM)
► Reduced powertrain requirements
► Secondary mass savings
• Very active research area for automotive industry. All major manufacturers have value estimates for lightweighting.
• Value: $3-4/lb (VTP truck study 2012)
• Lightweighting cost models ► Bjelkengren Thesis, MIT, 2006 (Overview and Secondary Mass Savings) ► Alexandra Frangi, MIT, 2001 (Tech. Cost Modeling (TCM))
Technical
Improvement
Intermediate
Benefit
Value
Proposition
Potential
Customer
Reduced
Initial Pack
Size (cells)
Lightweighting Vehicle Cost Savings OEMs, Tier 1s
Fewer cells Vehicle Cost Savings OEMs, Tier 1s
Improved Handling Vehicle Adoption OEMs
Increased Trunksize Vehicle Adoption OEMs
23

• Cell Costs
► Approximate: $650/kWh (usable)
► Projected to decrease:
~150-400 $/kWh by 2020)
• References
► DOE
► Private sector
Value Proposition: Reduced Initial Pack Size (Cells)
Technical
Improvement
Intermediate
Benefit
Value
Proposition
Potential
Customer
Reduced
Initial Pack
Size (cells)
Lightweighting Vehicle Cost Savings OEMs, Tier 1s
Fewer cells Vehicle Cost Savings OEMs, Tier 1s
Improved Handling Vehicle Adoption OEMs
Increased Trunksize Vehicle Adoption OEMs
24
J. Neubauer, A. Pesaran, B. Williams, M. Ferry, J. Eyer

• Handling ► Difficult to quantify.
► Significant interest in improved handling in performance vehicles.
► Battery results in low center of gravity. Nissan Leaf achieved nearly 1g acceleration with extensive after-market tweak.
• Trunksize ► Secondary benefit, more relevant to late-adopters.
► Brownstone 2000 looked at luggage space. No other known studies.
Value Proposition: Reduced Initial Pack Size (Cells)
Technical
Improvement
Intermediate
Benefit
Value
Proposition
Potential
Customer
Reduced
Initial Pack
Size (cells)
Lightweighting Vehicle Cost Savings OEMs, Tier 1s
Fewer cells Vehicle Cost Savings OEMs, Tier 1s
Improved Handling Vehicle Adoption OEMs
Increased Trunksize Vehicle Adoption OEMs
25

Technical
Improvement
Intermediate
Benefit
Value
Proposition
Potential
Customer
Reduced
Initial Pack
Size (cells)
Lightweighting Vehicle Cost Savings OEMs, Tier 1s
Fewer cells Vehicle Cost Savings OEMs, Tier 1s
Improved Handling Vehicle Adoption OEMs
Increased Trunksize Vehicle Adoption OEMs
Value Proposition Framework Available
26
Spreadsheet of value propositions:
• Full list of value propositions
• Techniques for quantification
• References
Available to all Attendees
Living document… Input welcome!

Effects of Industry Trends on Value Analysis
27
Trend
Increasing cell energy density
Potential Implications
• Less value of pack-lightweighting
• More value to cell enhancement
• More value to cell safety
• More relative value in reducing non-cell components
Understanding how value propositions are
calculated allows you to integrate trends.
Li-Ion Pricing (Red) and Energy Density (Blue) Source: Buchman 2005, from Anderson 2009

Developing Scalable BMS Technologies
Component
Level
Innovation
System Level
Technical
Performance
Customer
Value
Proposition
Scalable
BMS
Technology
Cost
Analysis
Final remarks on value propositions:
28
• System-level performance improvements alone will not yield a scalable technology.
• Value proposition framework is only a tool for orientation.
• You won’t know actual value until you have actual
customers.
• Each customer has its own lens.
• Value propositions are your “technology budget”.

Developing Scalable BMS Technologies
Component
Level
Innovation
System Level
Technical
Performance
Customer
Value
Proposition
Scalable
BMS
Technology
Cost
Analysis
29

Cost-Analysis for AMPED Technologies
• Expectations
► Customers do not expect a perfect cost model
► Customers do need reason to believe value outweigh costs
• A phased approach
30
Early R&D Prototyping
Cost-aware design Preliminary Cost
Model Detailed Cost
Model
Demonstration
Cost-Analysis
Technology Development

Cost-Analysis for AMPED Technologies
31
• Automotive-specific cost considerations
► Fleet standardization of components
► Regulatory
► Warranty
• Available resources
► Cost-modeling tutorial (ARPA-E)
► Industry collaboration
► National Labs and DOE VTP
― Argonne National Lab (ANL)
― DOE Vehicle Technologies Program (VTP)
― National Renewable Energy Lab (NREL)
― Oak Ridge National Lab (ORNL)

MOR-PHEV- Optimize PHEV e-
range for U.S. drivers
ORNL xEV Modeling Tools
MA3T-- estimate demand for
PEV by 1458 consumer segments
MOR-BEV- Optimize BEV range
for U.S. drivers
SED-- Quantify value of electric range and its
sensitivity to charging infrastructure, range certainty, distance certainty, battery cost, value of time
PHEV Calculator-- Estimate PHEV energy costs for
individually-customized travel patterns; based on GPS-validated methods; simple questions for users
ORNL has expertise in modeling the interactions between technology, infrastructure, behavior, policy and market.

• PEV value and travel pattern characterization – Lin, Z., Dong, J., Liu, C., & Greene, D. (2012). Estimation of Energy Use by Plug-In Hybrid Electric Vehicles: Validating
Gamma Distribution for Representing Random Daily Driving Distance. Transportation Research Record, 2287(1), 37-43.
– Lin, Z., & Greene, D. (2011). Predicting Individual Fuel Economy. SAE International Journal of Fuels and Lubricants, 4(1), 84-95.
– Lin, Z., & Greene, D. L. (2011). Assessing Energy Impact of Plug-In Hybrid Electric Vehicles: Significance of Daily Distance Variation over Time and Among Drivers. Transportation Research Record, 2252(1), 99-106.
• Optimal vehicle design and consumer preferences – Lin, Z. (2012). Optimizing and Diversifying the Electric Range of Plug-in Hybrid Electric Vehicles for U.S. Drivers.
International Journal of Alternative Powertrains, 1(1), 108-194. – Lin, Z. (2012). Battery Electric Vehicles: Range Optimization and Diversification for U.S. Drivers. Paper presented at the
91st Transportatin Research Board Annual Meeting, Washington, DC.
• Charging infrastructure—needs and impacts – Dong, J., & Lin, Z. (2012). Within-day recharge of plug-in hybrid electric vehicles: Energy impact of public charging
infrastructure. Transportation Research Part D: Transport and Environment, 17(5), 405-412. – Lin, Z., & Greene, D. L. (2011). Promoting the Market for Plug-In Hybrid and Battery Electric Vehicles: Role of Recharge
Availability. Transportation Research Record, 2252(1), 49-56.
• Integrated analysis of PEV market and societal value – Lin, Z., & Greene, D. (2010). A Plug-in Hybrid Consumer Choice Model with Detailed Market Segmentation. Paper
presented at the The 89th Annual Meeting of Transportation Research Board, Washington, DC, January 10-14, 2010. – (Working) Impacts of DOE technical targets on EV’s demand and environmental impacts – (Working) Sensitivities of EV demand to consumer preferences, energy prices, and range value
Summary of ORNL Areas of Expertise
Applications of ORNL analytical tools generate insights about drivers and barriers of the PEV market, at both system and
component levels.

0
50
100
150
200
0
1000
2000
3000
4000
5000
6000
7000
HEV PHEV40 EV100
Bat
tery
mas
s o
r vo
lum
e, k
g o
r L
Tota
l co
st t
o O
EM, 2
01
0 $
US
Total cost to OEM
Mass
Volume
34
Modeling Li-ion Battery Performance and Cost: BatPaC
Modeling real-world battery packs from bench-scale data
– Prediction year 2020
– Total cost of battery pack
– Mass and volumes
Battery is designed based on pack requirements and cell chemistry performance
BatPaC model used by U.S. EPA and DOT for 2017-2025 light duty vehicle rule making
Support from DOE EERE VTP: Dave Howell, Peter Faguy, and Tien Duong
Available free-of-charge from
www.cse.anl.gov

35
Modeling Li-ion Battery Performance and Cost: BatPaC
BatPaC is based in Microsoft Excel® and may be modified to meet individual users’ needs
Existing BatPaC capabilities includes six Li-ion chemistries, liquid and air thermal management options, uncertainty calculation, etc
36
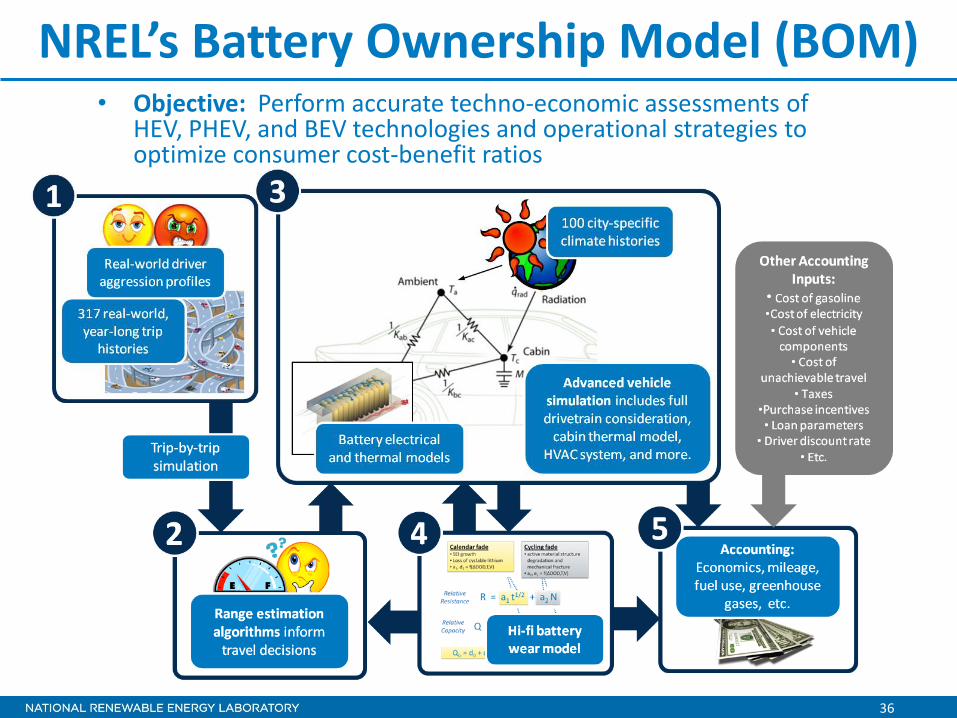
NREL’s Battery Ownership Model (BOM) • Objective: Perform accurate techno-economic assessments of
HEV, PHEV, and BEV technologies and operational strategies to optimize consumer cost-benefit ratios

37
How the BOM can help AMPED teams
• If your technology can... o Decrease battery cost o Increase accessible battery capacity o Reduce battery wear o Improve SOC or SOH estimation o Improve battery efficiency o Reduce thermal management needs o Etc.
• ...then the BOM can quantify it’s value
Quantified Value
Proposition
3
2 5
• AMPED team technology inputs: o Up-front component costs (5) o Technology performance; e.g. SOC identification
algorithms, battery controls strategies, state measurement accuracy, etc. (3)
o Range estimation algorithms (2)
• BOM outputs: o OEM costs o Consumer costs o Consumer benefits
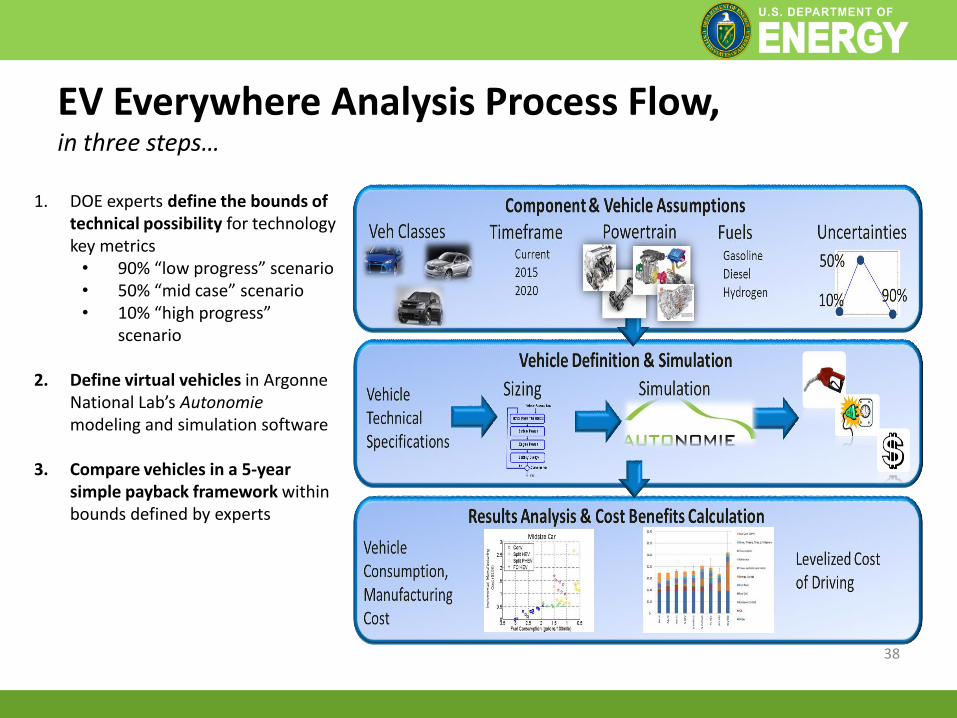
EV Everywhere Analysis Process Flow, in three steps…
1. DOE experts define the bounds of technical possibility for technology key metrics
• 90% “low progress” scenario • 50% “mid case” scenario • 10% “high progress”
scenario
2. Define virtual vehicles in Argonne National Lab’s Autonomie modeling and simulation software
3. Compare vehicles in a 5-year simple payback framework within bounds defined by experts
38

LCD-implied targets
$0.45 $0.46 $0.47 $0.48 $0.49 $0.50
Drive, Wheels, Tires, 12V Battery
Transmission
Glider
Energy Storage
Power electronics and motor
NPV Fuel
Fuel Tank
ICE
Levelized Cost Per Mile ($/mi)
Analysis: 2022 Midsize SI PHEV40
$/kW 7 10 13
$/kWh 200 225 250
% wt reduction 27 24 7
5
190
29
$/kW
$/kWh
% wt
$0.45 $0.46 $0.47 $0.48 $0.49 $0.50
Drive, Wheels, Tires, 12V Battery
Transmission
Glider
Energy Storage
Power electronics and motor
NPV Fuel
Fuel Tank
ICE
Levelized Cost Per Mile ($/mi)
Lightweighting
39

LCD-implied targets
Analysis: 2022 Midsize AEV300
$/kW 7 10 13
$/kWh 125 175 250
% wt reduction 27 24 7
4
110
30
$/kW
$/kWh
% wt Lightweighting
40

Landscape of xEV Resources from the DOE
41
Vehicle Model
• Battery Pack
• Thermal
• Degradation
• Costs
Cost of
Ownership
Drive
Profiles Infrastructure
ANL
ORNL
NREL
VTP
Vehicle
Optimization
Market
Assessment
Other notable groups:
UC Davis - Market studies
MIT - Lightweighting, Vehicle adoption
What other resources
are we missing?
Policy and
Regulation

Developing Scalable BMS Technologies
42
System Improvements
• Difficult finding the
right information
• Difficult choosing
the right system
• Leverage industry
expertise and
existing models
Value Propositions
• Critical to achieving
a scalable
technology
• Many possible paths
• Framework provided
for quantifying and
tracking value
propositions Cost Analysis
• Phased approach
• Leverage existing resources

Acknowledgments
• ARPA-E
► Ilan Gur
► Russ Ross
► Amul Tevar
► Tech-to-Market Team
• DOE VTP group
• National Labs
• Many industry collaborators
43

44
• How much system performance
improvement is needed to get
your attention?
• What does it take for you to
believe research cost
projections?
• What are the key components
of an effective pitch?
Industry
• What other modeling resources
are available?
• What industry information is
most needed in the research
community?
Research
• What other trends will influence new BMS technologies?
• How will regulations affect value propositions and/or cost modeling?
• What scale-up pitfalls do automotive technologies fall into?
General
Questions and Discussion