Embed Size (px)
Citation preview

Technology Management gy gand
Clinical Laboratory Productivity y y
Mehdi Boutorabi DCLS,PhD

Technology has been rapidly introduced into laboratory medicine and other services during the past few decadesg p
altered the ability of medicine to diagnose and treat disease h d h bli ' i f h l hchanged the public's expectations of health care

h l i l dTechnology includes any new procedure, regardless of whether or not instrumentation is involved

Applications of technology in the clinical laboratory
* Performance of a new procedure routinely* Performance of a new procedure in specialty laboratories only* Improved service as a result of decreased turnaround time * Cost reduction in an existing service*Simplification of test performance*Increased accuracy or precision of an existing procedure * Minimize staff interaction* Minimize staff interaction* Reduce repeat testing and sample rejection*Reduce transition periodReduce transition period*Increase specimen /day/month*Increase labor productivity
Efficiency
EffectivenessEffectiveness
Productivity

Effi iEfficiency
Efficiency is determined by the amount of time, money and energy – i.e. resources – that are necessary to
obtain certain results
if we are able to meet our daily production with less energy and fewer operators, we have operated moreenergy and fewer operators, we have operated more
efficiently

Effectiveness
Effectiveness is determined by comparing what a process y p g por installation can produce with what they actually
produce

dProductivity
Productivity is determined by looking at the production obtained (effectiveness) versus the invested effort inobtained (effectiveness) versus the invested effort in
order to achieve the result (efficiency)

productivity and effectiveness
Productive not effective
Employee A # hrs # items
5 250
Redirect focus/capacity
0 1 2 3 4 5 6 7
Employee B
7 250
0 1 2 3 4 5 6 7
7 250
Effective not ProductiveCoach to improve speed
these two are no longer “equal,” and each one requires a different type of management support in order to increase their overall performanceg pp p

Productivity
Productivity is a measure of the amount of work d d i hi i i fproduced within a given time frame
often minutes or hours/Productivity = total work / time

Productivity
Two different measures of productivityTwo different measures of productivity hours worked h idhours paid
Productivity based on hours worked represents the time spent performing the work, while productivity based on hours paid reflects the total fiscal burdenbased on hours paid reflects the total fiscal burden of the clinical laboratory for personnel

An increase in productivity will have occurred ifAn increase in productivity will have occurred if
a)The quality of tests provided increases for a given level of technical effortb) h f h l ff d db)The quantity of technical effort used to produce a given quality of tests decreases)Gi t f t t d t h i l ff t ic)Given amounts of tests and technical effort remain constant but the quality of tests increases
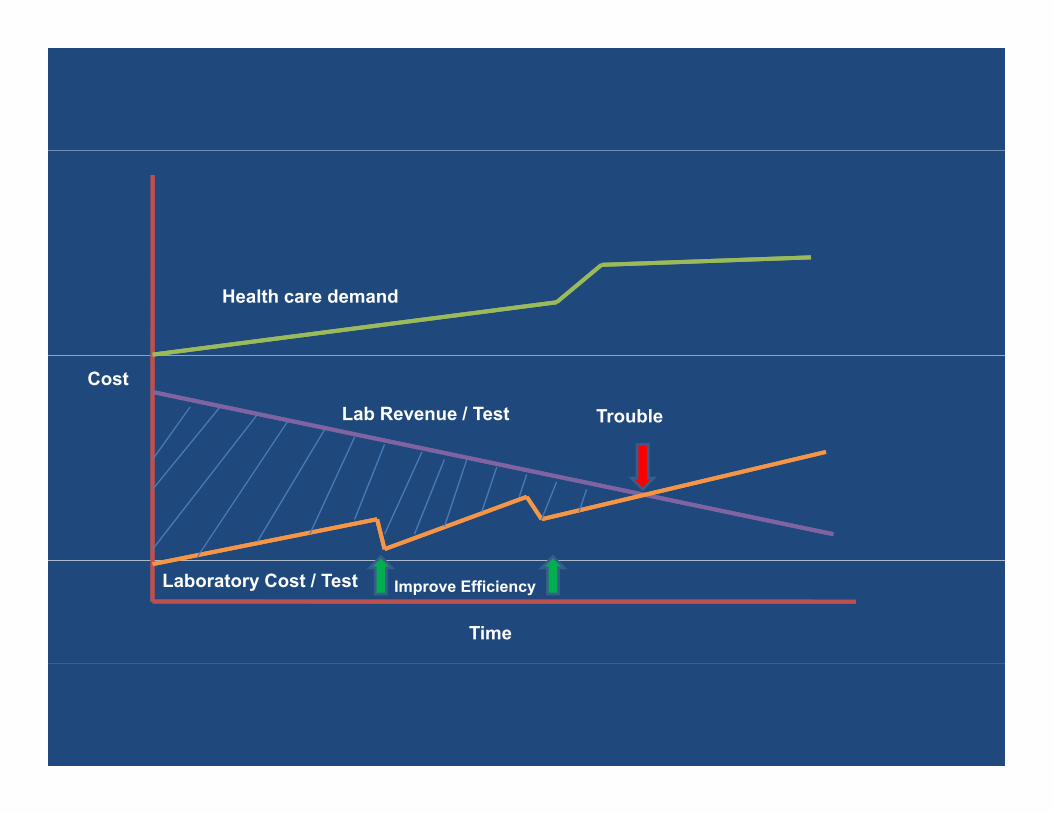
Health care demand
Lab Revenue / Test Trouble
Cost
Laboratory Cost / Test Improve Efficiency
Time

Managing Laboratory costs is impossible itho t managing Laborator Prod cti itwithout managing Laboratory Productivity

Evaluating productivity allows you to achieve the five " i ht " f ti i i l b"rights" of optimizing labor:
• The right number (FTEs) ofTh i h i di id l ( kill )• The right individuals (skills) at
• The right time (schedule) doing • The right things (tasks process) in• The right things (tasks, process) in • The right way (performance excellence)

Measurement tools
Methods of Measure
componentSubtypeMeasureMajor Type
Task listList of test times per
instruments or methodanalysis sheet personal
utili ation report
Industrialengineering time
standardsTechnical StaffLaborTimeliness of service
providedutilization report
Operational Maintenance checklistMaintenance standards,Instruments andQuality and TimelinessOperational Maintenance checklist
Manufacturer tolerancelimit
standards,Temperaturestandards
Instruments and ComputerAutomation
Quality and Timeliness of service provided
Test Turnaround timePrecision,Quality and Timeliness
Quality control reagentReference standard
Quality Control Standards
Precision,Accuracy,
ReproducibilityClinical
Quality and Timeliness of service provided
Manual recordingRaw test countTestsQuality and Timeliness Manual recordingComputerized records
Raw test count,Relative value
per test
TestsQuality Control Standards
WorkloadQuality and Timeliness of service provided
Standard costsCost accountingLaboratory workDepartmental Standard costsCost accountingCost allocation
Laboratory work stations
Laboratory sections
DepartmentalSectionalInpatientOutpatient
Economic EfficiencyFiscal

Labor Productivity y

Labor or workforce productivity
Rate of output per worker (or a group of workers) per unit of time as compared withper unit of time as compared with
an established standard or expected rate of output

Paid ProductivityTotal tests /Year
Paid Productivity(units/hr) =Total paid hrs/Year
Worked ProductivityTotal tests /Year
Paid Productivity(units/hr) =Total work hrs/Year

Productivity = total work / timeProductivity = total work / time
Productivity%
Test per hrTest per full time work
Location
h l 10362434Chemistry & Serology
19.511.782 Hematology & coagulation
4.752.8520Microbiology
59.322.8+12.8=35.6160+90=250Immunology & Hormones
11.6735Parasitology & Urinalysis

Most commonly used units for lab productivity
Tests per paid full‐time equivalent (FTE)Tests per paid full‐time equivalent (FTE)
265335 tests= 44225 tests/paid FTE
P id h bill d t t ( h/bt)
/p6 Paid FTEs
Paid hours per billed test (ph/bt)
13728 paid hours= 0 05 ph/bt= 0.05 ph/bt
265335 billed tests

Productivity ratio = paid hours per billed test
13728 paid hours= 0.05 ph/bt
0 05
0.05 ph/bt265335 billed tests
0.05
0.04 0.06
Lower is better Midpoint0.05

AMS RangePH/BTLabTotal(PH/BT)FTEsBilled Tests
(Performed)Location
0.04‐0.060.021155,040Chemistry & Serology
0.1‐0.120.13١23,370 Hematology & coagulation
0.19‐0.240.5315,700Microbiology
0.06‐0.080.07٢71,250Immunology & Hormones
0.14‐0.180.319,975Parasitology & Urinalysis

1.4
1.29%
4%
2%Test Distribution
Chem
p
1.0
0 8
58%27%Immun
Hemat
Par / UAph/bt
0.8
0.6
Mic
0.4
0.2
٠ ١ ٢ ٣ ۴ ۵ ۶
creater productivity with increase volume and automation
1 2 3 4 650creater productivity with increase volume and automation

0.11 0.12 0.13 0.14 0.15 0.16 0.17 ph/bt
Operations that provide specialized services or require manual tasks outside the lab’s controlrequire manual tasks outside the lab’s control
Highly automated, efficientoperations utilizing best practices

Causes of solution for low labor productivityInadequate AutomationPoor skill levelPoor workflow cause by poor facility designInappropriate batching of tests(tests are run 6 times per week when 3 time per weeks are adequate)p q )Tests are performed in laboratory when they should be send outHigh percentage of stat testingInappropriate test TAT standardInappropriate test TAT standardInappropriate quality control program: repeat testExcessive machine breakdown: repeat testPoor distribution of work between shifts or departmentUnnecessary quality control

Workload MeasurementWorkload Measurement
the sum of the work achieved, obtained by multiplying the raw count of each individual procedure by its unit value expressed in units (minutes)expressed in units (minutes)– how much work the laboratory does – whether the staffing level is adequateg q– whether the laboratory needs expensive equipment– whether the laboratory is working efficiently

Workload Measurements MethodsWorkload Measurements Methods
Basic MeasurementThe simplest and most basic method is totally the number of
patient tests performed each day

The CAP Workload Recording MethodThe CAP Workload Recording MethodThe Laboratory Management Planning Committee of the
Collage of American Pathologist (CAP)
The basis for measuring workload is the unit value, assigned to each procedure One unit is equal to 1 minute The total uniteach procedure. One unit is equal to 1 minute. The total unit
value for each procedure represents the average time necessary to perform the procedure

Management application of WLU system
Type of Test Unit ValueStool Exam 10Gram Stain 3
Vaginal Discharge 10Blood Grouping 5
Glucose 5Urine (Macroscopic) 3
CBC 2

Using the number of tests (raw count) g ( )is not accurate
• complexity which varies greatly from test to test• the specific time required to perform any test

Included in the unit value is the time needed for:• Specimen processing• Specimen processing• Testing• Clerical time, including logging and recording results
l h• Glassware washing• Reagent preparation• Preparation and reading of blanks• Daily instrument calibration• Maintenance and repair• Technical supervisionTechnical supervisionNot include in the unit value measurements are:• Specimen collection
R• Repeats
Repeats should be counted only if it is necessary to perform (elevated results)Repeats should be counted only if it is necessary to perform (elevated results)For the CAP workload recording method a clear distinction must be made between repeat andFor the CAP workload recording method a clear distinction must be made between repeat andFor the CAP workload recording method, a clear distinction must be made between repeat and For the CAP workload recording method, a clear distinction must be made between repeat and
duplicate.duplicate.
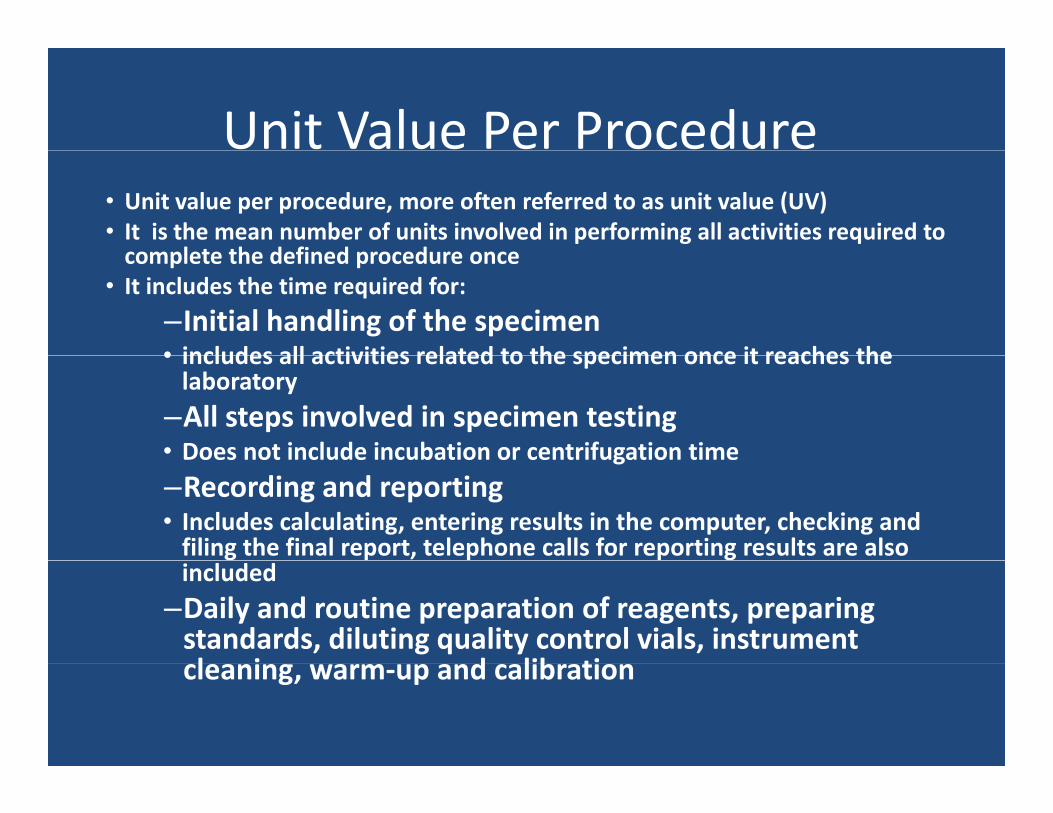
Unit Value Per Procedure • Unit value per procedure, more often referred to as unit value (UV)• It is the mean number of units involved in performing all activities required to complete the defined procedure oncecomplete the defined procedure once
• It includes the time required for: –Initial handling of the specimen• includes all activities related to the specimen once it reaches the• includes all activities related to the specimen once it reaches the laboratory
–All steps involved in specimen testing• Does not include incubation or centrifugation timeDoes not include incubation or centrifugation time–Recording and reporting• Includes calculating, entering results in the computer, checking and filing the final report, telephone calls for reporting results are also included
–Daily and routine preparation of reagents, preparing standards, diluting quality control vials, instrument l i d lib ticleaning, warm‐up and calibration

Unit Value Per ProcedureUnit Value Per Procedure – Maintenance and repair
• Includes regular weekly or monthly preventive maintenance, emergency repairs, time spent in identifying defective reagents
• Does not include major breakdowns– Solution preparationp p– Glassware wash up
• Includes washing, drying and sterilization Technical supervision– Technical supervision
– Standards, quality control, and repeats are counted as tests and are included in the raw countU it l d d t i l d i ll ti– Unit value per procedure does not include specimen collection

Paid ProductivityTotal WLUs/Year
Paid Productivity(units/hr) =Total paid hrs/Year
If one laboratory employs one laboratory assistant or full time equivalent and produces a total of 37319 WLUs annually, what is the paid productivity?
Total paid time = 44 hr/week X 52 weeks = 2288 hr
37319 3731937319Paid Productivity = = 16
2288
Work Productivity = = 21 1786

Efficiency of productivity expressed as a y p y ppercentage
units per hourunits per hourProductivity as Percentage = x 100
60
16Paid Productivity as Percentage = x 100 = 26.6 %
60
21Work Productivity as Percentage = x 100 = 35 %
6060
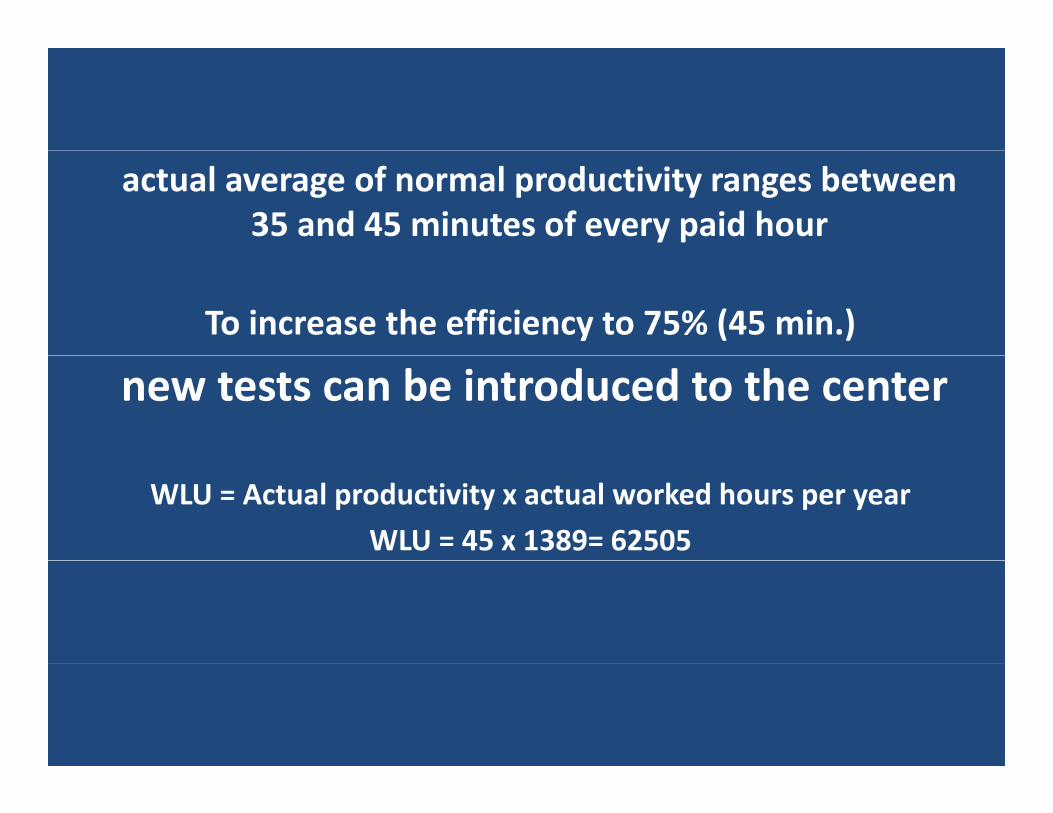
actual average of normal productivity ranges between 35 and 45 minutes of every paid hour
To increase the efficiency to 75% (45 min.)
new tests can be introduced to the center
WLU = Actual productivity x actual worked hours per yearWLU = 45 x 1389= 62505

Implement lab wide practices to improve productivity
Equipment
• Reduce # of workstations
IT solutions
• Autoverification• Reduce # of workstations• Automate
• Autoverification• Bidirectional interfaces• Eliminate paper

If the WLU of a laboratory is 227518 WLU/yearIf the WLU of a laboratory is 227518 WLU/year, how many employees are needed?
Actual worked hours/year = 1389 hours = 83340 min.N f l i d 257518/83340 2 73No, of employees required = 257518/83340 = 2.73

Cost per Workload Unit
Cost per workload unit can be used, in conjunction with workload units per activity, to determine costs of new programs and services and to determine the financial resources to be added, transferred or removed from a functional centre due to changes in population served, program or service (i.e. impact
l i )analysis).

The options for increasing productivity include:
maintaining the worked hours but increasing the workload units
decreasing the worked hours but maintaining the workload unitsdecreasing the worked hours but maintaining the workload units
decreasing both the worked hours and workload units but decreasing the worked hours more than the workload unitso ed ou s o e t a t e o oad u ts
increasing both the worked hours and workload units but increasing the workload units more than the worked hours
decreasing the worked hours and increasing the workload units
Total WLUs/YearPaid Productivity(units/hr) =
Total paid hrs/Year
The Productivity of AutomationThe Productivity of Automation
Difficult to separate from Labor productivity distinctlyDifficult to separate from Labor productivity distinctly different characteristics provide more cost effective utilization of equipmentsq p
Unfortunately automation is often purchased and y putilized in this era based on empirical needs and is not always match to workload volume or test complexity which cause under or over utilization.

In one place, at one time a technology may be good and other times not appropriate because there is a change in
the environment or in the main target
Two different sites with identical equipment will have different capacities to manage the demand for caredifferent capacities to manage the demand for care
Time and Place

Steps for improving the productivity of automation
•Consolidate priority testmultichannel vs discrete test cost should be determinedmultichannel vs discrete test cost should be determined
•Optimize test grouping (Lab Disease‐related group)
interact with clinician to prioritize/consolidate test/disease profilep / / p
•Utilize cost accounting techniques for instruments, section and department•Utilize automatic data processing to decrease turnaround time•Improve capital productivity
iuse cost accountingdetermine most/least expensive procedureevaluate cost of least/purchase or rent vs capital purchase

U d t di W kflUnderstanding your WorkflowThe key to implementing a successful automatedThe key to implementing a successful automated system is a comprehensive understanding of your workflow This will enable you to design a systemworkflow. This will enable you to design a system
that provides optimum efficiencies for your laboratory Laboratories vary enormously in termslaboratory. Laboratories vary enormously in terms of workflow, workload, in‐patient/out‐patient work ratio physical laboratory space datawork ratio, physical laboratory space, data
inputting requirements etc.

improve workflow Byimprove workflow By automating pre‐analytical and post analytical
steps sample handling and processingsteps, sample handling, and processing
Labor intensive taskSpecimen labeling/handling/preparation and storage
Automated Specimen Separation
Blood separation into serum or plasma has been an insuperable bottleneck in allhas been an insuperable bottleneck in all
clinical laboratoriesId ll l ti h ld b dIdeally, sample separation should be done at the point of sample collection and
incorporate automated labeling

Sample LabelingMistakes in sample labeling can lead to sample misplacement and mislabeling,sample misplacement and mislabeling,
resulting in a loss of samples and inaccurate resultsinaccurate results
The progression from manual labeling to 2‐ and 3‐D barcodes has dealt with
many labeling problems and y g psignificantly cut down on sample misplacement and mislabelingmisplacement and mislabeling.

CHANGES IN ANALYTICAL METHODCHANGES IN ANALYTICAL METHOD
In many cases the financial consequencesIn many cases the financial consequences of changes in reagents are clear and simple,
b h ff f h i l i lbut the effects of changes in analytical method or equipment are more complex

replacing an existing Instrument flame Photometer
(for the measurement of serum and urine Na+ and K+) by a new ion‐selective electrode (ISE) analyser without
change in workload
number of staff employed cannot be changed in th h t t th t t l l b t ill bthe short term, the total labor costs will be
unchanged

Independent workload costpvariable or workload dependent costs
flame photometerthe variable costs are directly related to the running time of the instrument for the ISE analyser depend on the workload, batch size and time between batchesthe ISE analyser has direct costs even when nothe ISE analyser has direct costs even when no specimens are analysed

EFFECT OF WORKLOAD ON COSTSEFFECT OF WORKLOAD ON COSTS
direct cost per test of both labor anddirect cost per test, of both labor and consumables, decreases as workload increases in a manner which depends on the type of testin a manner which depends on the type of test
With assay kits, for example, the amount of reagent prepared should ideally match the daily workload. This means that the analysis of the 21st specimen when themeans that the analysis of the 21st specimen, when the
reagent vial is only sufficient for 20, will produce a stepwise increase in expenditure and cost per test. Onstepwise increase in expenditure and cost per test. On the other hand, assay of only 10 specimens will result in
wastage and also increase the cost per test
ELISA Processor

EFFECT OF LABORATORY ORGANISATION ON COSTSON COSTS
Most tests are done in batches, and the unit cost is smaller for large batches than for single analyses. As a result, some
l b i d l i flaboratories tend to accumulate specimens for non‐urgent tests and run them in a single batch at say weekly intervals, or send them away to a larger centre. Although this will save money for y g g ythe laboratory, it may incur costly clinical delays, particularly if
the patient is kept in hospital

Ten Reasons Why technologies are not Successful
• Incomplete understanding of current environment, processes, costs, customer expectations• Loss in flexibility due to fixed processes and limited throughput• Unrealistic expectations of system, cost reduction, throughput• Unplanned and poorly developed ‘workarounds’ required to interface p p y p qautomation with manual processes• Inadequate technical support• Hidden costs, labor, supplies, maintenance Hidden costs, labor, supplies, maintenance•Failure to optimize current processes prior to automation
→never automate a poor process!

Clinical productivity is synonymous with Quality

Clinical ProductivityClinical Productivity * Develop Laboratory Disease related test group* Interact with clinician to prioritize and consolidate test* Interact with clinician to prioritize and consolidate test * Integrate test group into laboratory quality assurance plan* Interact with clinical staff to determine their optimum test choicesp* Provide interpretative reporting for clinicians

Th kThank you