Embed Size (px)
Citation preview

Technology exports an imports of Japanese enterprises and the
impact of the financial crisis
Presentation to the 2nd Meeting of the Working Party on International Trade in Goods and Trade in Services Statistics (WPTGS)
16-18 November 2009
Toshie KoriInternational Department, Bank of Japan
2
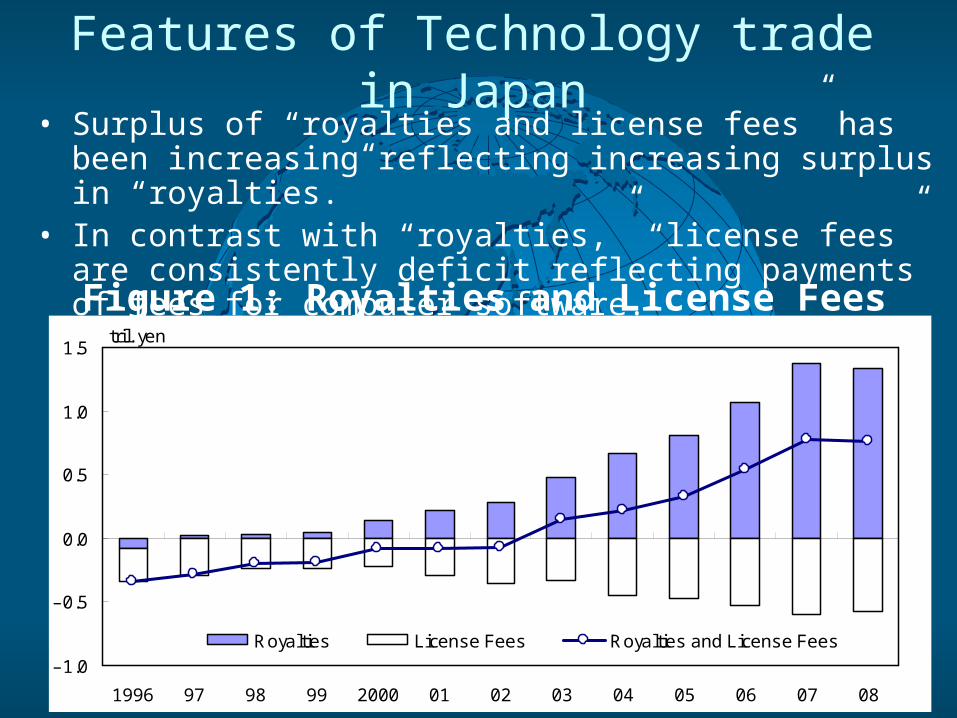
Features of Technology trade in Japan
• Surplus of “royalties and license fees” has been increasing reflecting increasing surplus in “royalties.”
• In contrast with “royalties,” “license fees” are consistently deficit reflecting payments of fees for computer software.
–1.0
–0.5
0.0
0.5
1.0
1.5
1996 97 98 99 2000 01 02 03 04 05 06 07 08
tril. yen
Royalties License Fees Royalties and License Fees
Figure 1: Royalties and License Fees
3
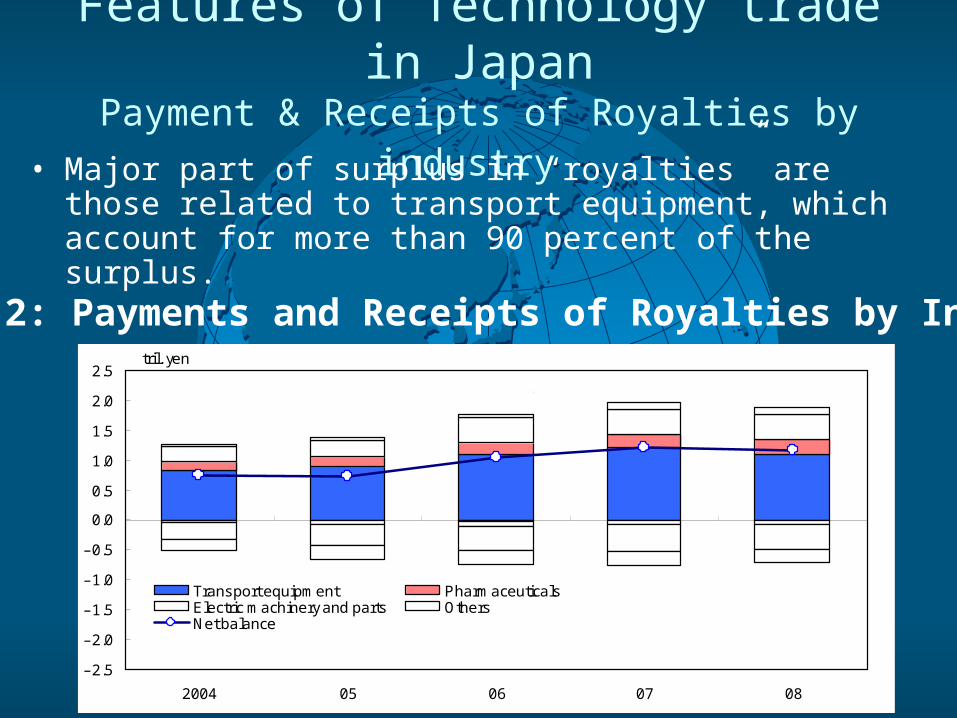
Features of Technology trade in Japan
Payment & Receipts of Royalties by industry • Major part of surplus in “royalties” are those related to
transport equipment, which account for more than 90 percent of the surplus.
Figure 2: Payments and Receipts of Royalties by Industry
–2.5
–2.0
–1.5
–1.0
–0.5
0.0
0.5
1.0
1.5
2.0
2.5
2004 05 06 07 08
tril. yen
Transport equipment PharmaceuticalsElectric machinery and parts OthersNet balance
(Credit)
(Debit)
4
Features of Technology trade in Japan
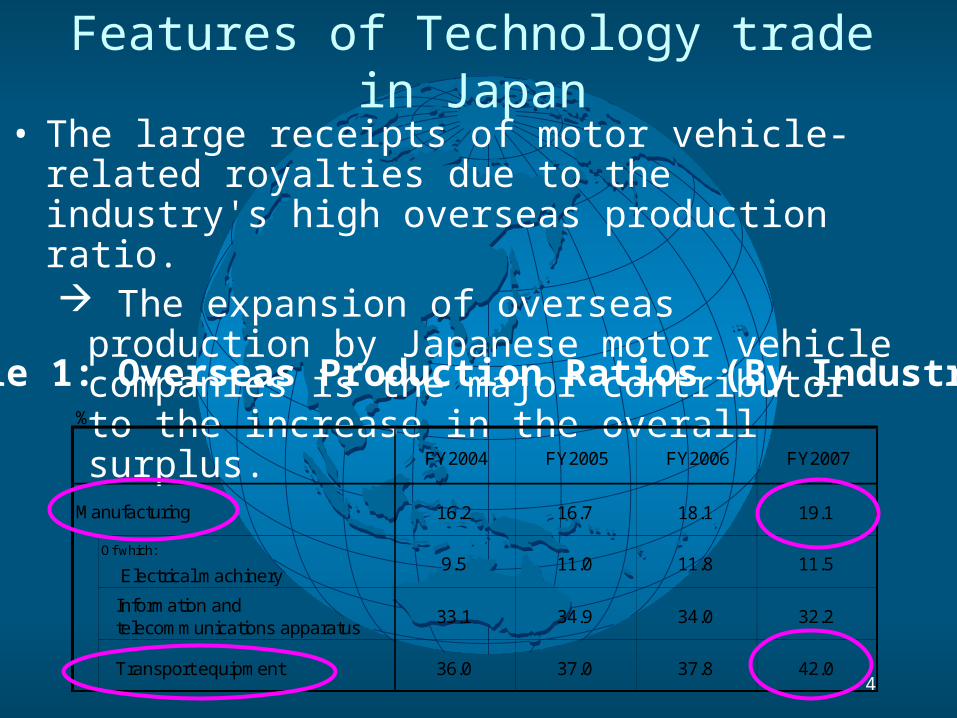
• The large receipts of motor vehicle-related royalties due to the industry's high overseas production ratio. The expansion of overseas production by
Japanese motor vehicle companies is the major contributor to the increase in the overall surplus.
Table 1: Overseas Production Ratios (By Industry)
FY2004 FY2005 FY2006 FY2007
16.2 16.7 18.1 19.1
Electrical machinery
Information andtelecommunications apparatus
33.1 34.9 34.0 32.2
Transport equipment 36.0 37.0 37.8 42.0
%
9.5 11.0 11.8 11.5Of which:
Manufacturing
5
Features of Technology trade in Japan
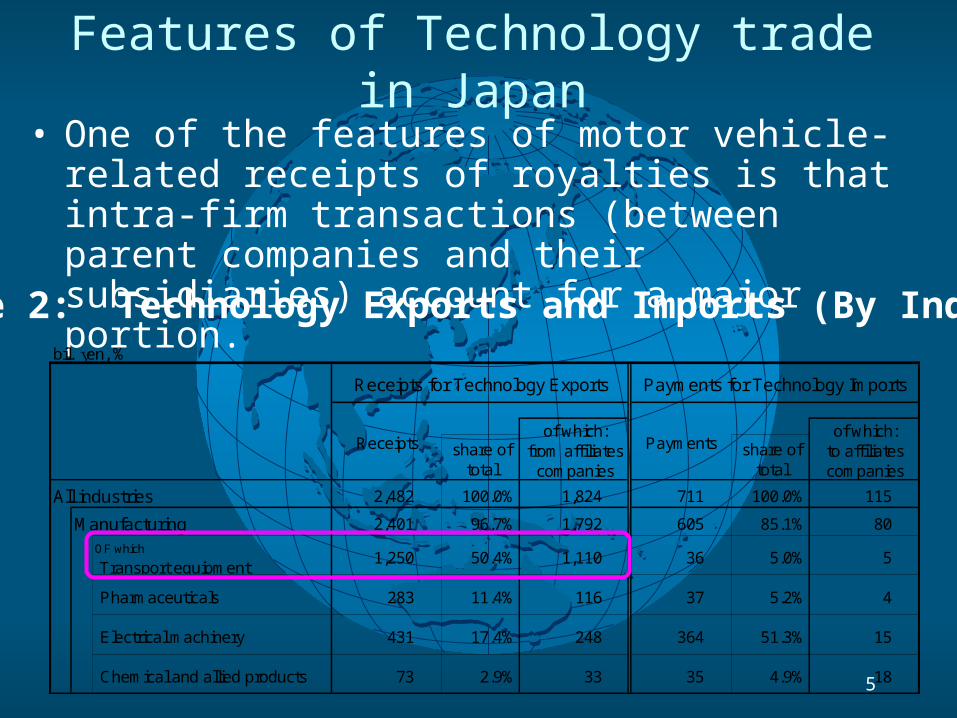
• One of the features of motor vehicle-related receipts of royalties is that intra-firm transactions (between parent companies and their subsidiaries) account for a major portion.
Table 2: Technology Exports and Imports (By Industry)bil. yen, %
share oftotal
share oftotal
All industries 2,482 100.0% 1,824 711 100.0% 115
Manufacturing 2,401 96.7% 1,792 605 85.1% 80
OF which
Transport equipment1,250 50.4% 1,110 36 5.0% 5
Pharmaceuticals 283 11.4% 116 37 5.2% 4
Electrical machinery 431 17.4% 248 364 51.3% 15
Chemical and allied products 73 2.9% 33 35 4.9% 18
Receipts
Payments for Technology Imports
Paymentsof which:
to affiliatescompanies
of which:from affiliates
companies
Receipts for Technology Exports
6
Features of Technology trade in Japan
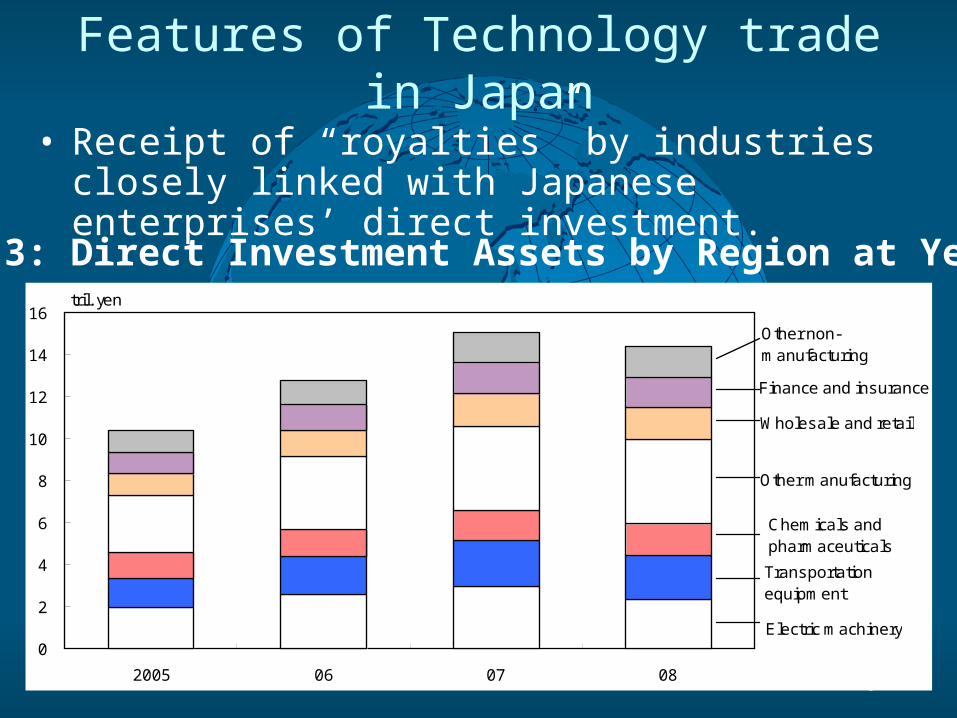
Figure 3: Direct Investment Assets by Region at Year-End
Electric machinery
Transportationequipment
Chemicals andpharmaceuticals
Other manufacturing
Wholesale and retail
Finance and insurance
Other non-manufacturing
0
2
4
6
8
10
12
14
16
2005 06 07 08
tril. yen
• Receipt of “royalties” by industries closely linked with Japanese enterprises’ direct investment.
7
Features of Technology trade in Japan
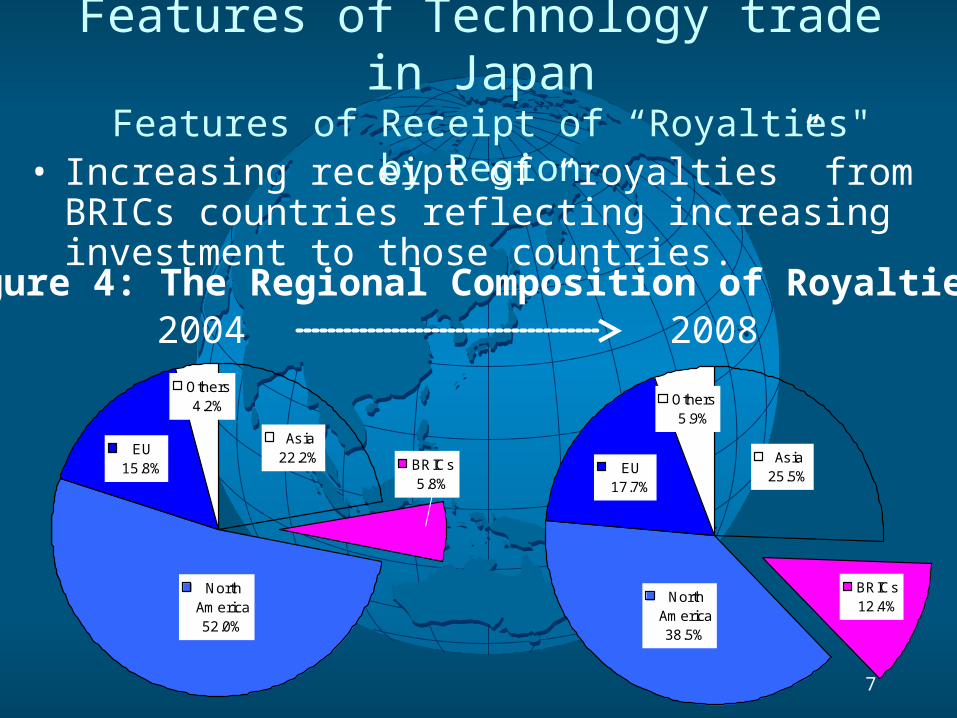
Features of Receipt of “Royalties" by Region
NorthAmerica52.0%
BRICs5.8%
EU15.8%
Asia22.2%
Others4.2% Others
5.9%
BRICs12.4%
NorthAmerica38.5%
EU17.7%
Asia25.5%
2004 2008Figure 4: The Regional Composition of Royalties
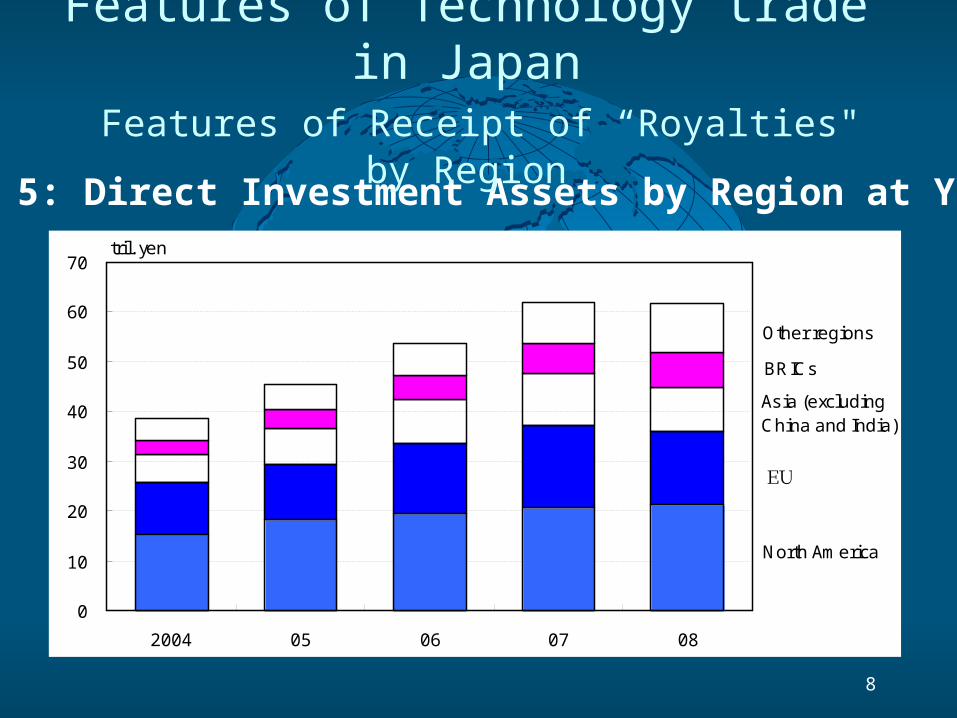
• Increasing receipt of “royalties” from BRICs countries reflecting increasing investment to those countries.
8
North America
EU
Asia (excludingChina and India)
BRICs
Other regions
0
10
20
30
40
50
60
70
2004 05 06 07 08
tril. yen
Figure 5: Direct Investment Assets by Region at Year End
Features of Technology trade in Japan
Features of Receipt of “Royalties" by Region
9
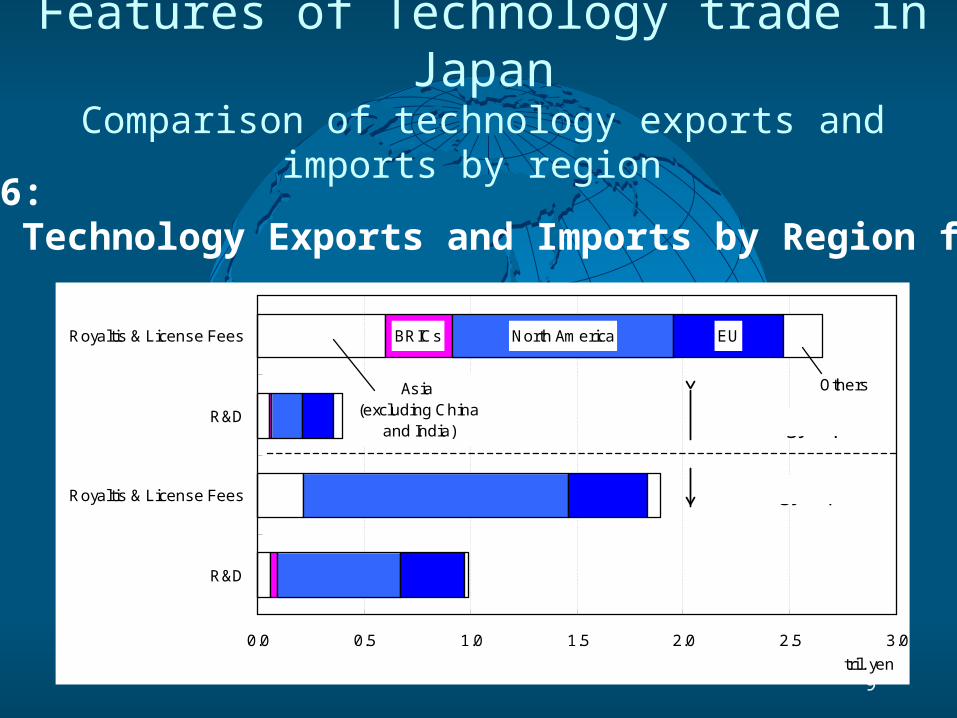
Asia (excluding China
and India)
BRICs North America EU
Others
0.0 0.5 1.0 1.5 2.0 2.5 3.0
R&D
Royaltis & License Fees
R&D
Royaltis & License Fees
tril. yen
Technology exports
Technology imports
Figure 6: Technology Exports and Imports by Region for 2008
Features of Technology trade in JapanComparison of technology exports and imports by
region
10
Features of Technology trade in Japan
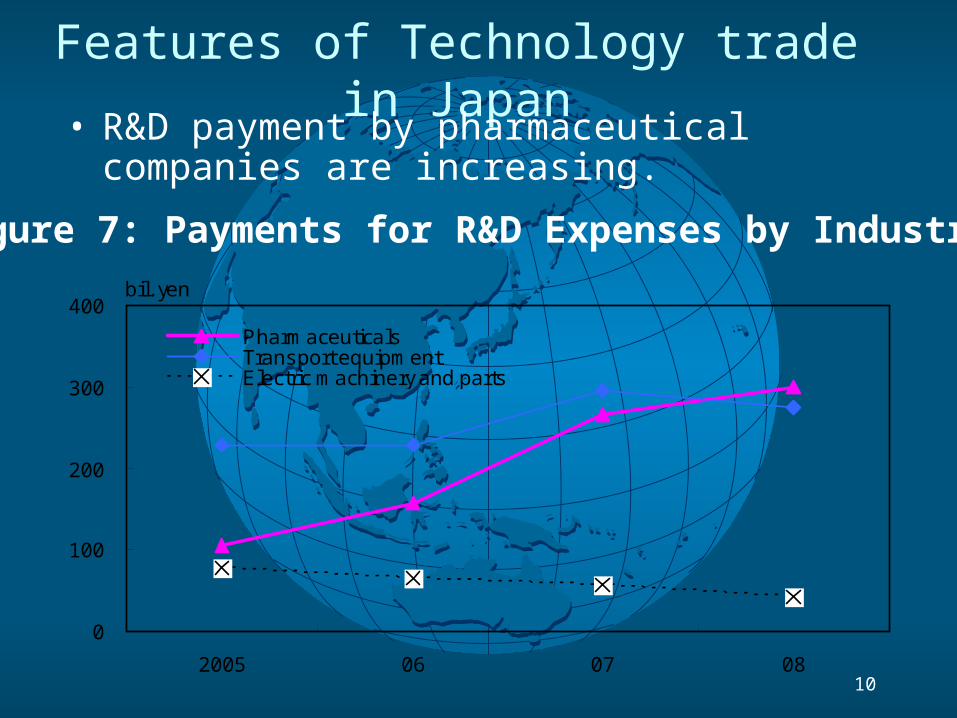
Figure 7: Payments for R&D Expenses by Industry
0
100
200
300
400
2005 06 07 08
bil. yen
PharmaceuticalsTransport equipmentElectric machinery and parts
• R&D payment by pharmaceutical companies are increasing.
11
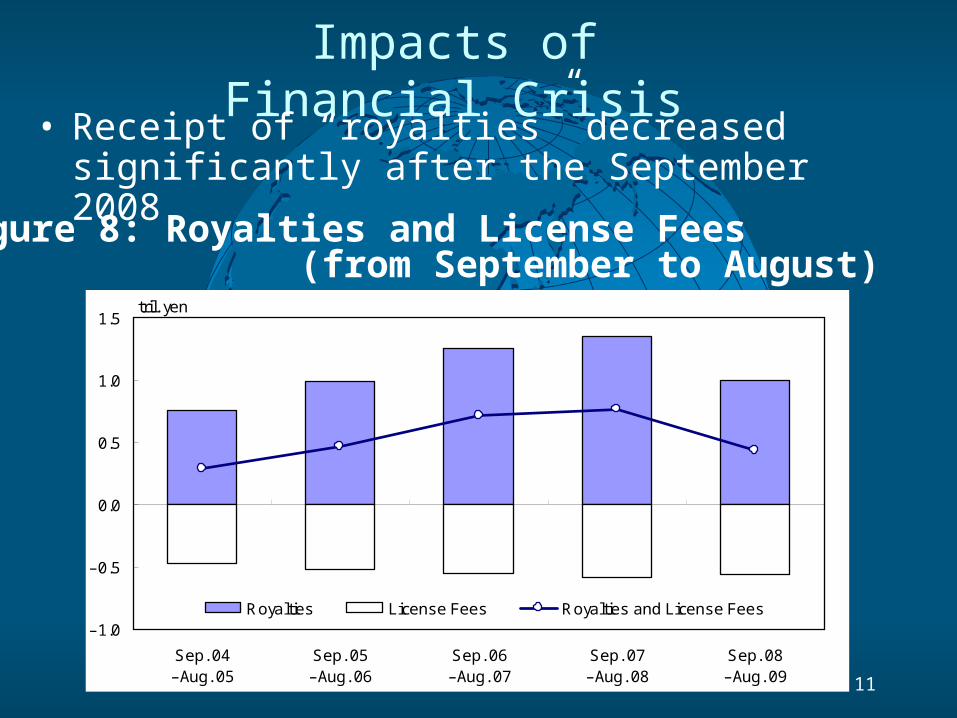
Impacts of Financial Crisis
Figure 8: Royalties and License Fees (from September to August)
–1.0
–0.5
0.0
0.5
1.0
1.5
Sep. 04–Aug. 05
Sep. 05–Aug. 06
Sep. 06–Aug. 07
Sep. 07–Aug. 08
Sep. 08–Aug. 09
tril. yen
Royalties License Fees Royalties and License Fees
• Receipt of “royalties” decreased significantly after the September 2008.
12
Impacts of Financial Crisis
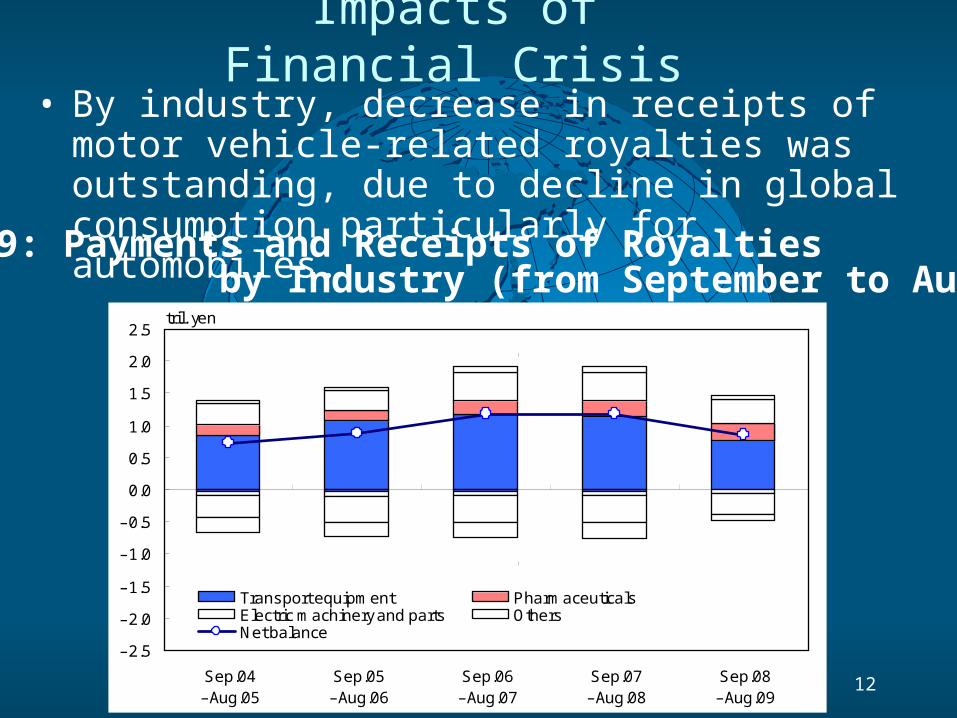
Figure 9: Payments and Receipts of Royalties by Industry (from September to August)
–2.5
–2.0
–1.5
–1.0
–0.5
0.0
0.5
1.0
1.5
2.0
2.5
Sep.04–Aug.05
Sep.05–Aug.06
Sep.06–Aug.07
Sep.07–Aug.08
Sep.08–Aug.09
tril. yen
Transport equipment PharmaceuticalsElectric machinery and parts OthersNet balance
(Credit)
(Debit)
• By industry, decrease in receipts of motor vehicle-related royalties was outstanding, due to decline in global consumption particularly for automobiles.
13
Impacts of Financial Crisis
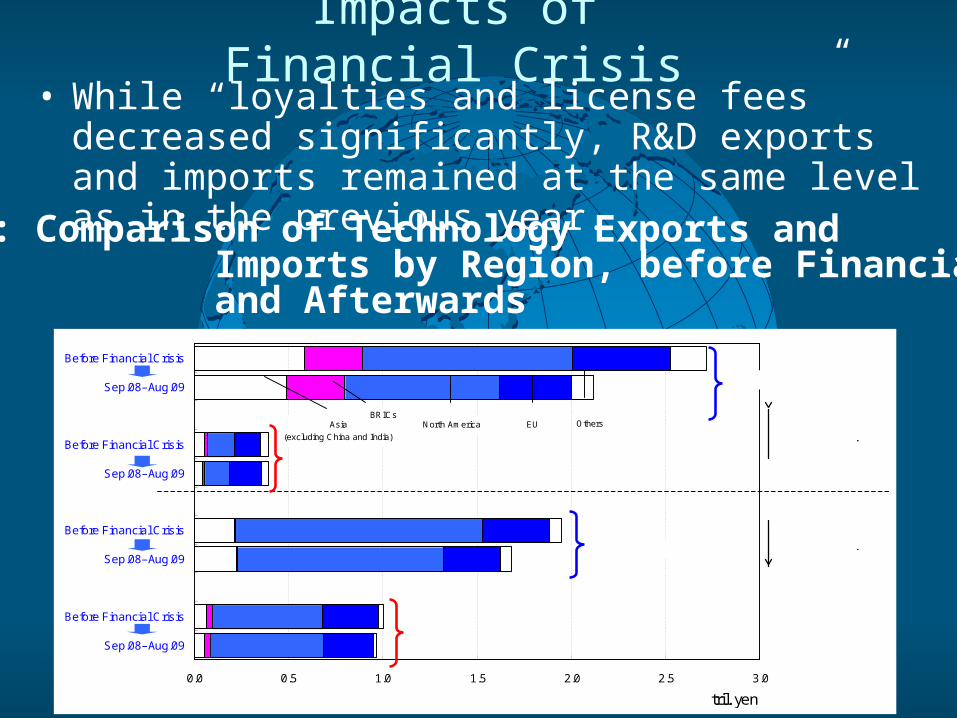
Figure 10: Comparison of Technology Exports and Imports by Region, before Financial Crisis and Afterwards
Asia
(excluding China and India)
BRICsNorth America EU Others
0.0 0.5 1.0 1.5 2.0 2.5 3.0
Sep.08–Aug.09
Before Financial Crisis
Sep.08–Aug.09
Before Financial Crisis
Sep.08–Aug.09
Before Financial Crisis
Sep.08–Aug.09
Before Financial Crisis
tril. yen
Technical exports
Technical importsRoyaltis and License Fees
R&D
R&D
Royaltis and License Fees
• While “loyalties and license fees” decreased significantly, R&D exports and imports remained at the same level as in the previous year.
14
Impacts of Financial Crisis
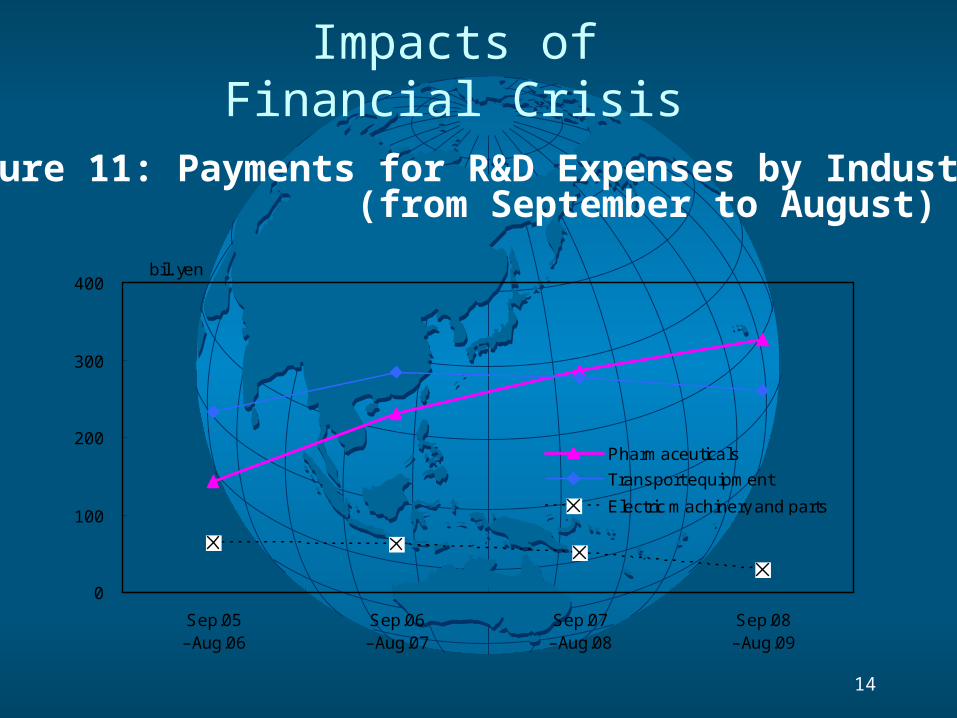
Figure 11: Payments for R&D Expenses by Industry (from September to August)
0
100
200
300
400
Sep.05–Aug.06
Sep.06–Aug.07
Sep.07–Aug.08
Sep.08–Aug.09
bil. yen
Pharmaceuticals
Transport equipment
Electric machinery and parts