Embed Size (px)
Citation preview

ECO/CPE/WP1(2018)8 │ 1
GOING DIGITAL: WHAT DETERMINES TECHNOLOGY DIFFUSION AMONG FIRMS?For Official Use
Going digital: What determines technology diffusion among firms?By Dan Andrews, Giuseppe Nicoletti and Christina Timiliotis
This version, 20 May 2018, draft not for quotation*
Dan Andrews ([email protected])Giuseppe Nicoletti ([email protected])Christina Timiliotis ([email protected])
*The ideas expressed in this paper are the authors’ own and do not necessarily reflect those of the institutions to which they are affiliated.

2 │ ECO/CPE/WP1(2018)8
GOING DIGITAL: WHAT DETERMINES TECHNOLOGY DIFFUSION AMONG FIRMS?For Official Use
ECO/CPE/WP1(2018)8 │ 3
GOING DIGITAL: WHAT DETERMINES TECHNOLOGY DIFFUSION AMONG FIRMS?For Official Use
Table of contents
Going digital: What determines technology diffusion among firms? 5
1. Introduction 52. Productivity, digital technologies and structural influences 83. Digital technologies: data and stylised facts 234. The influence of capabilities and incentives on digital adoption 255. Policy complementarities 406. Policy implications and conclusion 42
References 44
Annex A. Description of the data and variables used 49
Annex B. Robustness and additional results 63
Annex C. Policy initiatives bridging the digital gap 68
1.1. Policies encouraging the diffusion of high-speed broadband: some examples 681.2. Policies initiatives promoting digital skills 69
Tables
Table 1. Summary statistics of policy and structural factors 19Table 2. Proxies for capability and incentive factors 28Table 3. Capabilities and digital adoption 31Table 4. Market incentives and digital adoption 34Table 5. The joint effects of incentives and capabilities 35Table 6. The complementarity between incentives and capabilities 41
Table A.1. Description of variables and sources 49Table A.2. Country coverage 51Table A.3. Summary statistics (average values) 51Table A.4. Summary statistics for digital technologies, by year 52Table A.5. Average adoption rates by industry (2010-2016) 53Table A.6. High-speed broadband connections are critical to the adoption of all digital 55Table A.7. The enabling role of Cloud Computing for ERP and CRM adoption 55Table A.8. Correlations across digital technologies 56Table B.1. Principal Component Analysis 63Table B.2. EPL interacted with job turnover 64Table B.3. Capabilities and digital adoption – robustness to a different exposure variable 65Table B.4. Univariate regression results: robustness to dropping one sector at a time 66Table B.5. Univariate regression results: robustness to dropping one country at a time 67Table C.1. Bridging the digital gap 69

4 │ ECO/CPE/WP1(2018)8
GOING DIGITAL: WHAT DETERMINES TECHNOLOGY DIFFUSION AMONG FIRMS?For Official Use
Table C.2. Policy initiatives in support of vocational training and higher education in ICT 69
Figures
Figure 1. The divergence in labour productivity growth 9Figure 2. The diffusion of digital technologies is uneven across countries and industries 13Figure 3. Structural channels influencing digital adoption 15Figure 4. Use of high-speed broadband (>30 Mbit/s) is associated with higher digital 24Figure 5. Structural policies and the diffusion of complex cloud computing 25Figure 6. The complementarity of training with adoption is stronger for the low-skilled 30Figure 7. Economic significance (Capabilities) 38Figure 8. Economic significance (Incentives) 39Figure 9. Packaging reforms helps increasing the returns of up-to-date management 42
Figure A.1. Enterprises using cloud computing services, by firm size, 2016 54Figure A.2. Use of enterprise resource planning software, by firm size, 2015 54Figure A.3. The quality of management 57Figure A.4. Individuals using the Internet to interact with public authorities (E- Government) by
age, 2016 58Figure A.5. Education and training 59Figure A.6. Entry and exit 60Figure A.7. Labour market settings 61Figure A.8. Access to capital, average 2010-2015 61Figure A.9. R&D fiscal incentives, 2013 62Figure A.10. Digital trade openness 62Figure B.1. The correlation between knowledge intensity and the share of high-routine
employment 64
Boxes
Box 1. Digital technologies covered by the analysis 11Box 2. The EU data protection framework 22
ECO/CPE/WP1(2018)8 │ 5
GOING DIGITAL: WHAT DETERMINES TECHNOLOGY DIFFUSION AMONG FIRMS?For Official Use
Abstract
Insufficient diffusion of new technologies has been quoted as one possible reason for weak productivity performance over the past two decades (Andrews et al., 2016). This paper uses a novel data set of digital technology usage covering 25 industries in 25 European countries over the 2010-16 period to explore the drivers of digital adoption by of a range of digital technologies by firms. The focus is on structural and policy factors affecting firms’ capabilities and incentives to adopt -- including the availability of enabling infrastructures (such as high-speed broadband internet), managerial quality and workers skills, and product, labour and financial market settings. We identify the effects of structural and policy factors based on the difference-in-difference approach pioneered by Rajan and Zingales (1998) and show that a number of these factors are statistically and economically significant for technology adoption. Specifically, we find strong support for the hypothesis that low managerial quality, lack of ICT skills and poor matching of workers to jobs curb digital technology diffusion. Similarly our evidence suggests that policies affecting market incentives are important for adoption, especially those relevant for market access, competition and efficient reallocation of labour and capital. Finally, we show that there are important complementarities between the two sets of factors, with market incentives reinforcing the positive effects of enhancements in firm capabilities on adoption of digital technologies.

6 │ ECO/CPE/WP1(2018)8
GOING DIGITAL: WHAT DETERMINES TECHNOLOGY DIFFUSION AMONG FIRMS?For Official Use
Going digital: What determines technology diffusion among firms?
1. Introduction
1. The rapid development of information and communication technologies over the past 15 years has coincided with a generalised slowdown in aggregate productivity growth, the so-called modern productivity paradox (Acemoglu et al., 2014; Brynjolfsson et al., 2017). Barriers to technology diffusion across firms, with laggard firms increasingly falling behind the best practice ones, have been identified as one potential explanation of this paradox (Andrews et al., 2015 and 2016). This paper identifies a set of structural factors with the potential to overcome these barriers and catalyse the adoption of digital technologies by firms.
2. Indeed, while many firms now have access to broadband networks, the diffusion of more advanced digital tools and applications is far from complete and differs significantly across countries (McKinsey Global Institute, 2018). A key question is the extent to which the shortfall in digital diffusion reflects structural weaknesses that can potentially be addressed by public policy. For instance, the well-documented complementarity between technology use and workers’ skills (Machin and van Reenen, 1998; Autor et al., 2003; Bartel et al., 2007) can become an obstacle to diffusion where the necessary human capital is in short supply, an area where education and training policies have a clear role to play. Similarly, firms’ incentives to adopt new technologies are related to competitive pressures (Aghion and Griffith, 2005, and references therein), which in turn are heavily influenced by policies that affect the business environment. Systematic cross-country research on the link between policies, structural factors and adoption of recent digital technologies by firms however, is still scarce. Existing research generally takes either a broad approach by considering the effects of structural factors on ICT investment as a whole (Guerrieri et al., 2010; Cette et al., 2011) or focuses narrowly on the adoption of specific technologies (see the survey in Oliveira and Martins, 2011).
3. Against this background, this paper exploits cross-country industry-level data to explore the link between structural factors and diffusion of a range of digital technologies across firms in a cross-section of 24 European countries and Turkey and 25 manufacturing and services industries over 2010-2016. To our knowledge, this is the first empirical study to cover such a wide set of countries and technologies contributing to two streams of research, the link between human capital and adoption on the one hand and the link between the business environment and adoption on the other. A further contribution is that we also explore the synergies between these two sets of factors in affecting the propensity of firms to adopt.
4. Our working hypothesis is that cross-country differences in digital adoption stem from differences in firms’ capabilities and incentives to adopt new technologies. According to the capabilities hypothesis, the complementary intangible investments required for successful adoption of new technologies have become increasingly sophisticated over time. This places an added premium on organisational capital, skills and the efficient allocation of human talents, thus

ECO/CPE/WP1(2018)8 │ 7
GOING DIGITAL: WHAT DETERMINES TECHNOLOGY DIFFUSION AMONG FIRMS?For Official Use
highlighting the importance of policies in the areas of education, training and job matching.
5. Yet, building capabilities is not sufficient if market incentives to adopt new technologies are weak. This is related to a number of factors, including market discipline that makes it difficult for technologically backward firms to remain in the market; the ease with which firms can adjust their labour force to implement new production methods; and access to capital and labour for firms that wish to adopt the latest technologies. Together, these factors bring into closer focus policy reforms spurring competitive pressures, business dynamism and efficient resource reallocation.
6. While the list of digital technologies used in firms grows by the day, the focus of this study is on two sets of core digital technologies, namely cloud computing (standard and complex) and back or front office integration, for which cross-country industry-level data are available. Insofar as these technologies are linked to productivity improvements1, and because their diffusion rates are far from complete, findings concerning the drivers of their adoption by firms are informative and could apply to a broader set of technologies. We consider high-speed broadband internet an enabler of these technologies and systematically control for its availability.
7. Indeed, we demonstrate a statistically significant positive link between the penetration of high-speed broadband and the diffusion of each of these technologies. This finding validates the intuition that improving the roll-out of high quality broadband infrastructure is complementary to the adoption of more sophisticated digital applications, and constitutes the backbone of a digital economy.2
8. We then explore the effects of capabilities and incentives on digital technology diffusion by exploiting the idea that these structural factors are likely to be more binding for some industries than others – due to the inherent technological characteristics of the industry – an approach in the spirit of Rajan and Zingales (1998). In terms of capabilities, we focus on measures of management quality, the availability of ICT skills and training, the matching of skills to jobs, and the role of E-Government forging worker’s digital affinity in their day-to-day life. As for market incentives, we consider indicators of the ease of firm entry and exit, of barriers to competition and digital trade, of the adaptability of the workforce and of access to private equity.
9. The results should be interpreted with some caution as the lack of sufficient time-series coverage of measures of digital technology diffusion constrains the analysis to be cross-sectional (over an average of the 2010-2016 period), implying an identification strategy that is therefore based on country-industry variability
1 Empirical investigations of the link between digital adoption and productivity are still limited. Recent papers include Bartelsman et al. (2016), Fabling and Grimes (2016) and Dhyne et al. (2017). A forthcoming companion explores in more detail the link between adoption of the same digital technologies covered here and productivity performance.2 These results are consistent with the findings by Fabling and Grimes (2016) that diffusion of ultrafast broadband in New Zealand firms has been complementary to important organisational investments that require adoption of digital technologies.

8 │ ECO/CPE/WP1(2018)8
GOING DIGITAL: WHAT DETERMINES TECHNOLOGY DIFFUSION AMONG FIRMS?For Official Use
across a relatively small sample. Nonetheless, the econometric results lend broad support to the idea that the adoption of digital technologies by firms is supported by policy and structural factors that lift firms’ capabilities or sharpen their incentives to adopt.
10. Policies aimed at building capabilities within firms can raise digital adoption via two key channels. First, higher organisational capital is associated with disproportionately higher digital adoption in knowledge-intensive industries relative to other industries. This is consistent with recent research demonstrating the complementarity between the productive use of ICT technologies and organisational capital, particularly managerial skills (Bloom et al., 2012a). For instance, assuming a causal relationship, our estimates imply that increasing the quality of management schools in Slovakia to best practice levels (in Belgium), or the diffusion of modern managerial practices from Greek to Danish levels, is associated with a 10 percentage point increase in the adoption rate of cloud computing in knowledge intensive industries relative to other industries.
11. Second, building capabilities within firms requires access to a deep talent pool. In this regard, three elements emerge as important for digital adoption in our estimates: the general level of ICT competence in the working age population, which among other factors is driven by the digital environment workers are exposed to, e.g. through the availability of E-Government services; the provision of specific ICT training (on the job or during job transitions); and an appropriate matching of workers’ skills to jobs. To name one example, regression results suggest that increasing the provision of ICT training to low-skilled employees from a low level (Greece) to the sample maximum (Denmark) could increase the adoption rates of cloud computing and digital front office technologies (such as customer relationship management) by around 7 percentage points in knowledge intensive industries relative to other industries. Interestingly, the marginal benefit of training for adoption is found to be twice as large for low-skilled than for high-skilled workers, suggesting that policies that encourage the training of low skilled workers are likely to entail a double dividend for productivity and inclusiveness.
12. The three sets of factors that affect market incentives (labour market flexibility, competitive pressures and the availability of risk capital), which previous research has shown to be relevant for laggard firms’ catch up to frontier productivity levels (Andrews et al., 2015), are also found to be significantly related to the adoption of digital technologies. Policies encouraging the provision of venture capital (raising it from the low levels in the Czech Republic to the high levels in Denmark), for instance by eliminating fiscal bias towards debt financing or setting up public-private partnerships, could raise adoption of complex cloud computing technologies by around 8 percentage points in industries highly dependent on external finance relative to other industries. At the same time, reforms lowering administrative burdens on start-ups (from high levels in Turkey to low levels in the Netherlands) or easing employment protection legislation (from tighter levels in Portugal to looser levels in the United Kingdom) would also stimulate adoption of a range of digital technologies in high firm (or job) turnover versus low turnover industries, though the economic magnitude of the gains would be more modest.
13. We also find evidence of significant complementarities in the way factors affecting capabilities and incentives have a bearing for digital adoption. For

ECO/CPE/WP1(2018)8 │ 9
GOING DIGITAL: WHAT DETERMINES TECHNOLOGY DIFFUSION AMONG FIRMS?For Official Use
instance the benefits from improving managerial quality are enhanced if competitive pressures and labour market flexibility are high. These results suggest that digital adoption could be boosted by packaging reforms in these two areas.
14. On the whole, our findings suggest ample scope for product, labour and financial market reforms to amplify the benefits of reforms in education and training systems in speeding up the diffusion of digital technologies across firms. The results, ranging from around 5 to 10 percentage point increases in adoption rates, are economically significant given that, for instance, the diffusion of cloud computing and customer relationship management varied between 10 and 60 % in our sample of countries in 2016. They therefore unveil an important channel through which policy could help close the rising gap between frontier and laggard firms, with potentially significant effects on aggregate productivity developments.
15. Against the background of rising gaps between productivity performance by frontier and laggard firms, the next section discusses the link between the lack of technology diffusion and aggregate productivity weakness. It documents the variability in the adoption of digital technologies across countries and industries and discusses the channels through which structural and policy factors can influence digital technology diffusion and aggregate productivity developments. Section 3 describes the data and provides illustrative evidence on the link between structural factors and rates of digital adoption. Section 4 lays out the empirical framework and reports the empirical results on the influence of our measures of capabilities and incentives on some key digital technologies. Finally, we discuss policy implications and conclude.
2. Productivity, digital technologies and structural influences
2.1. Breakdown of the diffusion machine 16. Potential output growth has declined by about one percentage point per annum across the OECD since the late 1990s, which is entirely accounted for by a slowdown in labour productivity growth (Ollivaud, et al., 2016). A key observation is that the (pre-crisis) aggregate productivity slowdown masks a widening performance gap between more productive and less productive firms (Decker et al., 2016; Andrews et al., 2016; Figure 1), which has in turn amplified wage inequality (Berlingieri et al., 2017; Barth et al., 2016; Song et al., 2016). The rising gap in labour productivity is mirrored by similar gap in multifactor-productivity growth (Andrews et al., 2016). This productivity divergence is not just driven by frontier firms pushing the technological boundary outwards. Instead, firm-level econometric evidence suggests that the OECD-wide pace of technological convergence – whereby laggard firms can catch-up based on the adoption of a larger stock of unexploited technologies – has declined by around one-third since the late 1990s (Andrews et al., 2016). A key conjecture is that this stagnation in laggard firm productivity is related to the declining capabilities or incentives for such firms to adopt best practices from the frontier – a breakdown of the diffusion machine (OECD, 2015; Andrews et al., 2016).
17. According to the capabilities hypothesis, the complementary intangible investments required for successful adoption of new technologies – such as managerial capital and skills – have become increasingly sophisticated, as the nature of innovation at the global frontier has shifted from one based on tangibles

10 │ ECO/CPE/WP1(2018)8
GOING DIGITAL: WHAT DETERMINES TECHNOLOGY DIFFUSION AMONG FIRMS?For Official Use
to one based on ideas. In this regard, it is particularly significant that laggard firms fell further behind in market services (Figure 1, Panel B), where intangibles and tacit knowledge are becoming ever more important and the premium on capabilities should be highest.
18. But the market incentives for technological adoption may have also weakened, as adjustment frictions that rein in the creative destruction process have increased. A slew of micro-level evidence suggests that it has become relatively easier for weak firms that do not adopt the latest technologies to survive, including: i) the declining propensity for high productivity firms to expand and low productivity firms to downsize (Decker et al., 2017); ii) declining firm entry, implying less indirect pressure on incumbent firms to adopt (Criscuolo et al., 2014; Hathaway and Litan, 2014); and iii) the increasing tendency of marginal firms to survive and consume an increasing share of the aggregate resources, despite a collapse in their relative productivity (Adalet McGowan et al. , 2017a). As business dynamism has stalled and scarce resources have become increasingly trapped in redundant activities, it has arguably become more difficult for both new entrants and incumbent firms to adjust their labour force to meet new conditions and to access the capital required for adoption.
19. These findings are significant in light of aggregate level analysis which suggests that while adoption lags for new technologies across countries have fallen over time, there has been a divergence in long-run penetration rates once technologies are adopted by frontier firms (Comin and Mestieri, 2013).3 In other words, new technologies developed at the global frontier are spreading at an increasingly fast pace across countries but diffuse increasingly slowly to all firms within any economy, and many existing technologies may remain unexploited by a non-trivial share of firms in an economy. Against this backdrop, research into the barriers to technology adoption is warranted.
Figure 1. The divergence in labour productivity growth
Average labour productivity across each 2-digit sector (log, 2001=0)
A: Manufacturing B: Business services
3 For instance, Comin and Mestieri (2013) estimate that while it took an average of 45 years for the telegraph to spread across countries, the adoption lag for the cell phone technology was only 15 years. On the other hand, the cross-country differences in the penetration of new technologies have increased significantly between the earlier telephone technology and the more recent cell phone.

ECO/CPE/WP1(2018)8 │ 11
GOING DIGITAL: WHAT DETERMINES TECHNOLOGY DIFFUSION AMONG FIRMS?For Official Use
yyyy
36892
yyyy
37257
yyyy
37622
yyyy
37987
yyyy
38353
yyyy
38718
yyyy
39083
yyyy
39448
yyyy
39814
yyyy
40179
yyyy
40544
yyyy
40909
yyyy
41275-0.10
0.00
0.10
0.20
0.30
0.40
0.50
Frontier firms
Laggard
firms
Top 5%
yyyy
36892
yyyy
37257
yyyy
37622
yyyy
37987
yyyy
38353
yyyy
38718
yyyy
39083
yyyy
39448
yyyy
39814
yyyy
40179
yyyy
40544
yyyy
40909
yyyy
41275-0.10
0.00
0.10
0.20
0.30
0.40
0.50
Frontier firms
Laggard firms
Top 5%
Note: The global frontier group of firms is defined by the top 5% of companies with the highest labour productivity levels within each 2-digit industry. Laggards capture all the other firms. The vertical axes represent log-differences from the starting year. For instance, the frontier in manufacturing has a value of about 0.3 in the final year, which corresponds to approximately 30% higher in productivity in 2013 compared to 2001. Average values are shown across 24 OECD countries and 22 manufacturing and 27 market services industries over the time period 2001-13. Services refer to nonfinancial business services.Source: Andrews, D. C. Criscuolo and P. Gal (2016)
2.2. Key technologies20. A wide range of digital technologies has emerged over the past decade, forming an ecosystem that holds the potential to generate significant productivity gains. Among those feature prominently the Internet of Things (IoT), 3D printing or advanced robotics (OECD, 2017b), but data capturing the extent to which firms effectively use these technologies is still scarce. Turning to digital technologies for which comparable adoption rates are available for a large set of European countries, however, reveals that they are unlikely to have reached widespread industrial application. Instead, many firms still seem to lack technologies considered basic by today’s standards. Indeed, McKinsey Global Institute (2018) estimates that overall Europe operates at only 12 percent of digital potential, in comparison with 18 percent for the United States.
21. Indeed, Figure 2 shows that while virtually all firms are now connected to broadband internet, the diffusion of relatively more advanced tools and applications (i.e. with relatively higher adoption costs) lags behind with average diffusion rates ranging from 48% for the use of social media to 12.2% for big data analytics. Moreover, adoption rates for a given technology greatly differ across counties and sectors. For instance, while cloud computing is prevalent in 60% of Finnish firms with 10 or more employees, the corresponding adoption rate stood at just 18% in Poland in 2016. Similarly, according to this metric, the adoption rate of enterprise resource planning systems stood at 62% of ICT producers4 compared to 15% of the Hotel and Restauration sector.5
22. We focus on two broad digital technologies: cloud computing (CC) and front or back office applications. In turn, we distinguish between standard and
4 ISIC Rev.4 sector 61, Manufacture of electronic and optical products5 ISIC Rev.4 sector 55-56, Accommodation and Food and beverage service activities

12 │ ECO/CPE/WP1(2018)8
GOING DIGITAL: WHAT DETERMINES TECHNOLOGY DIFFUSION AMONG FIRMS?For Official Use
advanced cloud computing (complex CC) and between front office integration, i.e. customer relationship management (CRM), and back office integration, i.e. enterprise resource planning (ERP) (see Box 1 for a detailed description of each technology). We consider broadband high-speed internet - a prerequisite to effectively use almost any digital technology – an enabling infrastructure, and systematically control for its availability. The selection of technologies was based on both their expected within-firm productivity-enhancing effects and their potential to diffuse these productivity benefits across firms due to spillovers.6 Indeed, the aggregate benefits of some of these technologies (e.g. ERP) can be boosted by network effects as they diffuse across firms along supply chains.7
Box 1. Digital technologies covered by the analysis
Cloud Computing (CC)
Cloud computing allows firms to access computing resources (e.g. servers, databases, software applications, storage capacity, computing power) on a pay-for-use basis over the internet (the ‘cloud’) without incurring the costs involved in building and maintaining the necessary IT infrastructure (Eurostat, 2016). Relative to on-premise IT facilities, cloud computing enables firms, and in particular start-ups and SMEs, to dynamically scale-up (or down) computing resources at any point in time (elasticity of provision) without human interaction (self-service), while paying only for the services that are effectively used (metered service). While it has become a major digital technology, an important impediment recorded by Eurostat was related to the lack of skills: one in three SMEs reported insufficient knowledge of cloud computing to be a limiting factor.1
According to the 2016 Eurostat Digital Economy and Society survey, the most predominant use of cloud computing lies in the use of cloud-based email services (65% of all firms) (e.g. Gmail or Yahoo!), followed by the storing of files in electronic form (62%) (e.g. Dropbox or Google Drive), and the hosting of firms’ databases (44%). While less widespread, cloud computing also allows for more advanced (and credibly more productivity-enhancing) uses such as financial or accounting (32%) and customer relationship (27%) (e.g. Salesforce) management (CRM) software applications, or the provision of computing power in order to run firm-specific business software applications (21%), which are categorised as complex Cloud Computing (complex CC) in this analysis.
The effects of cloud computing on firm productivity performance can
6 Social media were not included in the analysis as their relevance for productivity is not clear. The adoption rates of other technologies have scarce variability across countries and industries. 7 Hard evidence on these firm-level effects is scarce, not least due to the sensitive nature of the information necessary for the investigation, but ongoing work relying on more aggregate data is devoted to exploring the productivity effects of the same technologies.

ECO/CPE/WP1(2018)8 │ 13
GOING DIGITAL: WHAT DETERMINES TECHNOLOGY DIFFUSION AMONG FIRMS?For Official Use
occur through various channels and depend on the application used. For instance, using cloud document storage services allows several people to share or collaborate on the same document. It thus eliminates the issue of transferring large files and missing on the latest revisions made by someone else. As for CRM systems run over the cloud, their main advantages lie in the possibility to access the system from anywhere in real-time so long as it is connected to the internet, as well as the absence of capacity limits and IT maintenance costs. Cloud computing also has the potential to serve the dissemination of all other technologies described below. For instance, Table A.7 shows that a one percent increase in the share of firms adopting cloud computing is associated with a 0.47 percent increase in the share of firms adopting Customer Relationship Management systems. Enterprise Resource Planning (ERP)
ERP software integrates and automates various functions, such as planning, purchasing, inventory, sales, marketing, finance and human resources, into one system to streamline processes and information across the firm. Its commercialisation began as early as 1972 with German software producer and long-standing market leader SAP (Gartner, 2016). Instead of maintaining separate databases or spreadsheets monitoring each of the above functions, which would need to be merged to get an overview, ERP systems allow employees to obtain this information from one shared database. For instance, by automatically linking sales orders to the financial systems, the order management department can process orders more rapidly. ERP information can also be shared with external parts of a supply chain, for instance to display to other businesses the current stock of a particular good. Therefore, ERP benefits from network externalities as its usage spreads out across firms along supply chains.
Diffusion of ERP systems is limited by the significant amount of time and financial resources required to implement them, as well as their complexity, which in turn requires strong management skills and the provision of adequate trainings for workers.2 For this reason, firms generally only adopt ERP systems once they have reached a critical size (Figure A.2). However, cloud computing has facilitated ERP adoption for SMEs, and ERP systems run by the cloud are expected to catch-up with on premise systems over the coming years.
While firm-level evidence on the productivity impacts of ERP is scarce, it is generally perceived as cost-reducing and efficiency-enhancing in the long term. For instance, ERP systems can lead to a reduced product development cycle, lower inventories, improved customer service and enhanced coordination of global operations (Beheshti and Beheshti, 2010). Hunton et al. (2002) also show that return on assets, return on investment and asset turnover were significantly better for adopters than for a matched set of non-adopters. Customer Relationship Management systems (CRM)
Customer relationship management refers to the acquisition, analysis and use of knowledge about customers (e.g. vendors, channels partners or any

14 │ ECO/CPE/WP1(2018)8
GOING DIGITAL: WHAT DETERMINES TECHNOLOGY DIFFUSION AMONG FIRMS?For Official Use
other group of individuals), in order to improve the efficiency of business processes. While ERP and CRM systems can overlap in some areas, their core functionalities are different, and businesses can opt for one without the other. Young firms in particular, tend to first adopt CRM systems in order to increase sales before optimising their businesses processes through costly ERP systems, especially as the availability of Cloud Computing has made the adoption of CRM less costly.
_______________________________________1 Firms that have yet to adopt cloud computing were also concerned about the risk of a security breach, the location of the data and, related to this, the legal jurisdiction and applicable law in the event of a dispute (information retrieved from Eurostat, Digital Economy and Society database).
2 ERP implementations can exceed the costs budgeted, take longer than anticipated and deliver less than the promised benefits (Zhang et al., 2005). For example, a 2015 Panorama Consulting report based on 562 implementations globally shows that 21% of firms considered their ERP implementation to be “failed”, although these failure rates are significantly lower than those recorded in the early 2000’s (Griffith et al., 1999; Hong and Kim, 2002; Kumar et al., 2003).
Figure 2. The diffusion of digital technologies is uneven across countries and industriesAs a percentage of enterprises with ten or more employees, 2016
Panel A: Diffusion across countries
Broadband Social Media High Speed
Internet
Enterprise
Resource
Planning
Customer
Relationship
Management
Cloud
Computing
Supply
Chain
Management
Cloud
Computing
(complex)
Big Data
0
20
40
60
80
100
%
1st quartile Gap 1st and 3rd quartiles Average Lowest Highest
FIN
GRC NOR
POL
DNK
GRC
DEU
LVA
NLD
TUR
FIN
POL
DNK
LVA
FIN
POL
NLD
POL
Panel B: Diffusion across industries (NACE Rev 2, codes 10-83)

ECO/CPE/WP1(2018)8 │ 15
GOING DIGITAL: WHAT DETERMINES TECHNOLOGY DIFFUSION AMONG FIRMS?For Official Use
62-63
41-43 24-25
62-6345
55-56
62-63
41-43
61
55-56
26
61
41-43
55-5658-60
26
Broadband Social Media High Speed
Internet
Enterprise
Resource
Planning
Customer
Relationship
Management
Cloud
Computing
Supply Chain
Management
Cloud
Computing
(complex)
Big Data
0
20
40
60
80
100
%
1st quartile Gap 1st and 3rd quartiles Average Lowest Highest
55-56 31-33
Note: Data refers to latest available data, i.e. 2016 or 2015; unweighted averages are shown across the sample of 25 countries (Panel A), or all industries (NACE Rev 2, codes 10-83; Panel B; see Table A1 for a description of all sectors). Broadband includes both fixed and mobile connections with an advertised download rate of at least 256 kilobits per second. Enterprise resource planning systems are software-based tools that can integrate the management of internal and external information flows, from material and human resources to finance, accounting and customer relations. Cloud computing refers to ICT services used over the Internet as a set of computing resources. Cloud computing (complex) refers to a subset of relatively more complex uses of cloud computing (accounting software applications, CRM software, and computing power). Supply-chain management refers to the automatic linking of enterprises to their suppliers and/or customers applications. Customer relationship management software is used for managing a company’s interactions with customers, clients, sales prospects, partners, employees and suppliers. Social media refers to applications based on Internet technology or communication platforms for connecting, creating and exchanging content on line with customers, suppliers or partners, or within the enterprise. For information on the latest available year, please refer to Table A.1. For Panel B, sector 24-25 corresponds to Manufacture of basic metals & fabricated metal products excluding machines & equipment; sector 26 to Manufacture of computer, electronic and optical products; sector 31-33 to Manufacture of furniture and other manufacturing; repair and installation of machinery and equipment; sector 41-43 to Construction services; sector 55-56 to Accommodation and Food and beverage service activities; sector 58-60 to Publishing activities; motion picture, video & television programme production, sound recording & music publishing; programming & broadcasting; sector 61 to Telecommunications; and sector 62-63 to Computer programming, consultancy and related activities, information service activities. Source: based on Eurostat, Digital Economy and Society (database)
23. The varying degrees at which digital technologies have diffused across countries seem surprising at first, considering the marginal costs of adopting most technologies displayed above are either close to zero (e.g. for social media), or have plummeted over the past decade (e.g. for cloud computing). Taken together, the observed patterns thus suggest the presence of important structural elements impeding the widespread diffusion of digital technologies across countries. One key enabler is the availability of digital infrastructures – including widely available accessible communication network and services – which in turn can promote the diffusion of digital technologies and inter alia aggregate productivity growth (Égert et al., 2009; Falck and Wiederhold, 2015; Fabling and Grimes, 2016).8 While most firms appear to have broadband connections, wide cross-country and cross-sector differences remain in the adoption of high-speed internet (Figure 2.), which is crucial for an effective use of the digital technologies considered in this paper. Given the importance of high-speed broadband internet for the take up of digital
8 High-speed broadband connection has also been associated with positive effects on job matching and productivity (Bloom et al, 2014; Stevenson, 2008).

16 │ ECO/CPE/WP1(2018)8
GOING DIGITAL: WHAT DETERMINES TECHNOLOGY DIFFUSION AMONG FIRMS?For Official Use
technologies, throughout the analysis below we control for differences in the availability of this key infrastructure across countries and industries. Even so, these differences can only partially account for the wide variability of digital technologies across countries and here is where differences in capabilities and incentives enter the picture.

ECO/CPE/WP1(2018)8 │ 17
GOING DIGITAL: WHAT DETERMINES TECHNOLOGY DIFFUSION AMONG FIRMS?For Official Use
2.3. Structural and policy influences24. The stylised framework depicted in Figure 3 shows some of the channels through which structural and policy factors can drive cross-country differences in the adoption of digital technologies. We conjecture two broad channels: i) firm capabilities, which underpin the complementary intangible inputs required for adoption; and ii) the market environment in which firms operate, which shapes the incentives for firms to experiment with digital technologies. Factors that shape firms’ capabilities or incentives to adopt could affect the diffusion of digital technologies directly, or indirectly by influencing the productivity returns to investments in digital technologies (which would likely feed back into the original decision to adopt). We discuss below the role played by these factors in affecting digital adoption by firms and the corresponding proxies we use in the empirical analysis. As shown in Table 1. and more in detail in the Annex, there is wide variability across countries in structural factors and policies that affect capabilities and incentives (see Table A.3).
Figure 3. Structural channels influencing digital adoption
2.3.1. Capabilities and digital adoption25. The challenging transition of an economy based on tangibles to one based on intangibles (or ideas) can only succeed if firms have access to the right set of capabilities. The transition at the firm level depends on two main factors: (i) strategic decisions and the ability to implement them, and (ii) the talent pool and the ability to upgrade it. The first factor requires high quality management and managerial practices. The second requires a pool of skilled workers that include ICT specialists, whose expertise is (often) fundamental to deploy and manage digital technologies, but also more broadly diffused ICT skills among job seekers

18 │ ECO/CPE/WP1(2018)8
GOING DIGITAL: WHAT DETERMINES TECHNOLOGY DIFFUSION AMONG FIRMS?For Official Use
and workers, and the ability to improve these skills in accordance with technological developments.
Organisational capital
26. Leadership skills, up-to-date managerial practices and innovative working arrangements are a necessary condition for the successful implementation of new technologies. Indeed, there is a robust positive relationship between investment in organisational capital and the returns from ICT investment (Brynjolfsson et al., 1997; Bloom et al., 2012b; Bloom and Van Reenen, 2007; Pellegrino and Zingales, 2017) and Andrews and Criscuolo (2013) find that, in sectors that are heavy users of ICT, increases in organisational capital intensity are associated with swifter productivity growth than in other sectors.
27. To proxy for cross-country differences in managerial practices, we adopt two indicators, which crucially are available for a large number of countries.9 First, the quality of management schools – sourced from the Global Competitiveness Report of the World Economic Forum – captures the quality of education future managers enjoy in dedicated schools.10 Second, we exploit an indicator of the share of workers involved in high performance work practices (HPWP) within firms, sourced from the OECD Programme for the International Assessment of Adult Competencies (PIAAC). Both indicators show significant variability of managerial quality across countries (Figure A.3.), with HPWP more spread out in Nordic and Anglo-Saxon countries than elsewhere. 11
28. While enhancements in managerial practices are chiefly initiated within firms, policies can have an influence by raising incentives to enhance these practices via stronger market competition and discipline as well as via public education, training and the framing (and in some cases the financing) of management schools.12 Also, governments often seek to raise awareness, disseminate good practices, or provide diagnostic tools for companies (especially small and medium-sized enterprises) to identify which measures best suit their needs (OECD, 2016b).13
9 Almost identical results are obtained using the 2012 WEF indicator capturing responses to the question “In your country, who holds senior management positions? [1= usually relatives or friends without regard to merit; 7=mostly professional managers chosen for merit and qualifications]”.10 Admittedly, a low quality of management schools can be compensated by attracting foreign-trained managers, e.g. via favourable tax regimes. However, this is likely to affect only a minority of large firms in the economy.11 This indicator places particular emphasis on incentive systems – including bonus payments, training opportunities and flexible working hours – and the way work is organised, gauged by the prevalence of team work, autonomy, task discretion, mentoring, job rotation and the application of new learning (OECD, 2016b). While the prevalence of these practices may be also influenced by occupational structure, this is unlikely to matter in our sample of relatively homogeneous countries, and can be controlled for in regressions via fixed effects.12 For a more detailed discussion of the policies affecting the use of effective managerial practices at work, see OECD (2016b).

ECO/CPE/WP1(2018)8 │ 19
GOING DIGITAL: WHAT DETERMINES TECHNOLOGY DIFFUSION AMONG FIRMS?For Official Use
Skilled labour
29. The diffusion of digital adoption and the ability to fully harness its productivity benefits in full require a pool of workers with a sound level of generic ICT-skills, out- and on-the-job programmes to provide and maintain such skills, and the appropriate matching of skills to jobs. We use several indicators to measure cross-country differences along these dimensions of the talent pool.
30. The precondition for acquiring digital skills is mastering generic skills (literacy, numeracy, and problem-solving), which provide a basis for learning fast-changing technology-specific skills (OECD, 2016a), but people’s exposure to ICT is also essential. Data on the share of adults with ICT experience from the OECD PIAAC, which we use as an indicator of generic ICT skills, indeed show that in many countries a significant portion of the working age population (from around 20 per cent in Australia to over 40 per cent in Poland) still lacked such basic experience in 2012 (Figure A.5, Panel A).14 Five years later, 42% of individuals using office productivity software – i.e. “use word processors” and “use spreadsheets” – on a daily basis still report insufficient skills to use these technologies effectively (OECD, 2017b).
31. Policy-wise, the promotion of digital literacy typically rests with education ministries via curriculum-related decisions: for instance, among OECD countries, 80% provide support for vocational training and higher education in ICT.15 At later ages broader digital strategies also involve lifelong learning, another indicator we use in the empirical analysis, hinging inter alia on continuous vocational training, adult learning and on-the-job training. Moreover, policies to encourage ICT use by individuals through the provision of e-government services can help fostering citizens’ affinity to digital technologies. Where people integrate digital technologies into their daily life, it is likely they will encounter less difficulties in adapting to similar technologies in different contexts (e.g. at work) and that they take a more open stance towards new technologies more generally. The use of e-government is still quite unevenly developed across Europe, with 85% of Iceland’s population using public services online whereas Italy still stood at 24% in 2016 (Figure A.4).
13 The New Zealand High-Performance Working Initiative, for instance, partly finances business coaching to help streamline work practices and improve performance while also increasing employee engagement and satisfaction. The program is especially designed for small- to medium-sized businesses, which often find it more difficult to adopt such practices, for financial or organisational reasons. Similarly, Germany’s “trusted cloud” training program helps SMEs gain an understanding of cloud computing and its possible applications (OECD, 2017b).14 Digging deeper, the data reveal that most commonly, people falling into this category were aged 55-65, people with less than an upper-secondary level of education and people on semi-skilled occupations (OECD, 2012).15 In Sweden, for instance, the Schools Act 2011 posits that “every pupil, on completing primary and lower secondary school, must be able to use modern technology as a tool for knowledge-seeking, communication, creation and learning” (OECD, 2016a; see Table C.1 and Table C.2. for examples in other OECD countries). Later age initiatives include undergraduate degree programmes, courses that may or may not lead to a technical certification, or public-private partnerships to educate ICT specialists (OECD, 2017b).

20 │ ECO/CPE/WP1(2018)8
GOING DIGITAL: WHAT DETERMINES TECHNOLOGY DIFFUSION AMONG FIRMS?For Official Use
32.
ECO/CPE/WP1(2018)8 │ 21
GOING DIGITAL: WHAT DETERMINES TECHNOLOGY DIFFUSION AMONG FIRMS?For Official Use
Another important indicator is the share of workers involved in on-the-job training. On-the-job training aimed at enhancing ICT skills is particularly important for non-ICT workers, who are often low-skilled. Eurostat data suggests that ICT training to non-ICT workers goes along with the hiring of ICT specialists, pointing to the strong complementarities in intangible investments that are set in motion by the adoption of new technologies. However, as illustrated in Figure A.5 (Panel B), there are wide cross-country differences in the participation of workers in generic training programmes, let alone ICT-specific ones, across OECD countries. The dispersion is especially wide for the low skilled who are typically less involved in training. Indeed, only a minority of the low skilled workers take the opportunity of training offered at work, despite existing legal provisions (in most EU countries) for adults to take training leave (EC, 2017b).
33. Several countries have taken explicit measures to remedy for the gap between training participation rates of the low and high-skilled, for instance by giving priority access to publicly-funded education and training leave to the low-qualified workers (Denmark, Spain) or by funding employers to contribute to the cost of training in various ways (Estonia, France, the Netherlands).16 While the design of such financial incentive schemes is crucial for minimising distortions and maximise their economic and distributional benefits (OECD, 2017d),17 facilitating and encouraging generic and ICT training to low-skilled non-ICT workers can have an impact on the ability to adopt digital technologies.
Allocation of talent
34. Finally, it is not only the level of ICT skills that is important for making firms capable to adopt digital technologies but also the way in which skills in general are matched to jobs within the firm. This is particularly important given that the benefits of human capital-augmenting policies take a long time to be realised, while improving the allocation of human capital will enhance the ‘bang-for-the-buck’ (i.e. productivity impact) of such policies. Given the wide variability in the ability of OECD economies to efficiently allocate skills to jobs and the consequences of mismatch for productivity (Adalet McGowan et al., 2015a), it is likely that cross-country differences in adoption rates partly reflect differences in skill mismatch. We therefore test this hypothesis in the empirical analysis using the indicator of mismatch proposed by Adalet McGowan and Andrews (2015a).18 As shown in Adalet McGowan and Andrews (2015b), this measure of mismatch is
16 See EC (2015) and OECD (2017d).17 For instance, if skills tax expenditures are only available for training connected to a workers’ current employment, they may reduce labour market flexibility and exacerbate skills mismatches. Moreover, skills tax expenditures often provide larger benefits to those with larger taxable incomes, and may provide more benefits to those in secure employment than to those in casual employment. Income-contingent loans may be a way to ensure access to skills investment for credit-constrained workers.18 The indicator combines objective criteria (performance on PIAAC scores relative to average scores of workers performing specific tasks) and subjective criteria (replies to questions concerning the perceived fit in those tasks) to measure the percentage of workers who are either over- or under-skilled. Over-skilling is far more common across all countries, with rates on average two and a half times higher than for under-skilling. See Adalet McGowan and Andrews (2015) for details.

22 │ ECO/CPE/WP1(2018)8
GOING DIGITAL: WHAT DETERMINES TECHNOLOGY DIFFUSION AMONG FIRMS?For Official Use
affected by a number of policies, including lifelong learning as it helps to update or acquire specific and transversal skills needed by employers.
Table 1. Summary statistics of policy and structural factors
. Obs Mean Std. Dev. Min Max
Capabilities
I. Organisational capital Quality of Management school 626 4.883414 0.716024 3.687408 6.099314
High performance work practices 500 26.05715 9.044642 10.17509 41.6223
II. Skilled labour Percentage of adults with no ICT skills 425 20.15593 11.16819 7.243739 43.25481
Lifelong learning 425 50.72941 12.42818 24.3 66.8
Percentage of low skilled in training 450 35.06356 11.61629 15.84475 51.69505
Percentage of high skilled in training 450 63.76499 13.37589 31.32726 80.72747
E-Government 551 55.817.1 17.1 24.1 85
III. Allocation of talent Skill mismatch 525 25.57619 5.604652 18.1 38.3
Incentives
I. Entry and competition Administrative barriers to start-ups 630 2.00624 0.479206 1.121914 3.080247
Barriers in services sectors 630 3.480308 0.67593 1.365741 4.615741
Digital trade restrictions 626 0.2152077 0.0634429 0.11 0.38
II. Exit and reallocation EPL 625 2.529961 0.343966 1.721089 3.204082
Venture Capital 401 0.0311 0.020665 0.002556 0.075
Tax incentives 551 0.7306 0.07 0 0.26
Insolvency regimes 550 0.486888 0.118902 0.130769 0.7
Note: This table only presents summary statistics for the structural and policy indicators. More details on all variables used in the empirical analysis are in Annex A.
2.3.2. Incentives and digital adoption35. The incentives of firms to adopt leading technologies are closely linked to the extent of competitive pressures in the economy. For example, recent firm-level studies document how stronger competition resulting from international trade shocks strengthens firms’ incentives to adopt better technologies (Perla et al., 2015; Bloom et al., 2011). In this regard, it is no coincidence that technology diffusion stalled most – i.e. laggard firms fell further behind the global productivity frontier – in market services that are typically more sheltered from competitive pressures (Figure 1). Beyond this, the special features of digital technologies unveiled by Brynjolfsson and McAfee’s (2014) – easier and faster measurement of outcomes and experimentation and replication of ideas -- highlight the importance of fluid entry/exit and resource reallocation mechanisms in incentivising digital adoption, especially since these features are mutually-reinforcing: e.g. the value of digital experimentation is proportionately greater if the benefits, in the event of success, can be leveraged through scaling-up.19
36. The margins through which digitalisation is propagated onto aggregate growth suggest to focus on policies that are relevant for firm entry and exit and the efficient reallocation of resources across incumbent firms.
19 On the other hand, rapid upscaling due to increasing returns (or network effects) of digital technologies may reduce incentives to innovate via winner-take-most phenomena (Guellec and Paunov, 2017).

ECO/CPE/WP1(2018)8 │ 23
GOING DIGITAL: WHAT DETERMINES TECHNOLOGY DIFFUSION AMONG FIRMS?For Official Use
Entry and competition
37. Key policy areas fostering competition, notably through the entry side, include:
Administrative burdens on start-up firms: structural policies that do not unduly inhibit the entry of new firms are likely to spur digital adoption to the extent that young firms possess a comparative advantage in commercialising new technologies (Henderson, 1993) thus placing indirect pressure on incumbent firms to adopt them. Accordingly, we examine this link, although remaining cross-country differences in administrative burdens on start-up firms – at least according to OECD indicators – are now relatively modest (Figure A.6, Panel A).20
Barriers to entry in competitive services (Figure A.6): given the evidence that rising difficulties in technological catch up are particularly pronounced in those services sectors where pro-competitive product market reforms were least extensive, reforms targeting these impediments to competition are key (Andrews et al., 2016). Effects of service sector reforms are amplified when services additionally feed into other sectors downstream as intermediates.
Open digital markets (Figure A.10): as with any field of trade, open digital markets bring in greater competition benefiting final consumers and businesses through lower prices and a greater variety of products. The European Centre for Internal Political Economy (ECIPE) Digital Trade Restrictiveness Index (DTRI) captures the extent to which countries obstruct digital trade, e.g. through tariffs on digital products, restrictions on digital services and investments, restrictions on the movement of data, and restrictions on e-commerce.21 Restrictions on the movement of data also depend on data protection regulations, which however are common across Europe (see Box 3).
Reallocation and exit
38. Some of the above mentioned policies are also themselves relevant on the reallocation side, in particular well-designed product market regulations (particularly those affecting firm entry and market services). Other policy areas promoting a healthy creative destruction process by facilitating the exit of unproductive firms and the efficient reallocation of labour and capital include:
Employment protection legislation (EPL; Figure A.7): EPL regimes imposing heavy or unpredictable costs on hiring and firing can also slow down the reallocation process (Bassanini et al., 2009; Andrews and Cingano, 2014), thereby tending to handicap productivity-enhancing investments by firms that operate in environments subject to greater
20 A long literature demonstrates the adverse effects of policy-induced barriers on firm entry (Klapper et al., 2006; Ciccone and Papaioannou, 2007) and more efficient technological adoption (Parente and Prescott, 1999; Andrews et al., 2015).21 Conceptually, the index is clustered around four large areas: (1) fiscal restrictions, (2) establishment restrictions, (3) restrictions on data and (4) trading restrictions.

24 │ ECO/CPE/WP1(2018)8
GOING DIGITAL: WHAT DETERMINES TECHNOLOGY DIFFUSION AMONG FIRMS?For Official Use
technological change, such as ICT-intensive activities (Bartelsman et al., 2010; Andrews and Criscuolo, 2013) and radical innovation more generally (Griffith and MacCartney, 2010). At the same time, a reasonable degree of employment protection is also likely to aid digital adoption to the extent that it raises worker commitment and firm’s incentives to invest in firm-specific human capital (Autor, 2003; Wasmer, 2006).
The depth of risk capital markets: to the extent that venture capitalists help bridge the financing gap that arises from the fact that young firms lack internal funds and a track record to signal their “quality” to investors (Hall and Lerner, 2009) risk capital markets affect firm entry and the ability of successful new entrants to grow. Cross-country differences in the availability of risk capital are significant (Figure A.8) and are positively related to the efficiency of technological diffusion (Saia et al, 2015; Andrews et al., 2015).
R&D fiscal incentives: promoting experimentation with new products, processes and business models through R&D tax breaks could encourage investment in digital technologies (Andrews and Criscuolo, 2013), thus affecting adoption rates directly, and indirectly through heightened competitive pressure. However, optimal effectiveness of such policies relies on the presence of complementary policies, notably targeting the exit or restructuring of low-potential incumbent firms, to ensure the availability of R&D resources (i.e. skilled labour) for innovative incumbents and entrants (Acemoglu et al., 2013).
Insolvency regimes (Figure A.6): Since the payoffs from investments in new technologies are often highly uncertain, insolvency regimes may bear on incentives for digital adoption by raising barriers to restructuring or exit of firms in the event of technological failure. As shown by Adalet McGowan et al. (2017b), low costs of scaling down, divest or exit accelerate catch up of laggard firms, inter alia by incentivising experimentation and freeing up resources to underpin digital uptake by successful firms.
39. While the stylised framework in Figure 3 implies that market reforms affect digital adoption by incentivising experimentation and easing reallocation, they may also operate via the capabilities block. For instance, skill mismatch tends to be higher in countries with stringent product and labour market regulations and weaker insolvency regimes (Adalet McGowan and Andrews, 2015b). Moreover, stringent EPL is found to thwart the ability of managers to reduce skill mismatch for any given level of managerial quality (Adalet McGowan and Andrews, 2015b), possibly reflecting excessive protection for incumbent workers in a firm, who might not be the best match for their job. Also, by imposing stronger market discipline, competition ignited by product market reforms can encourage stakeholders in firms to improve managerial capital (e.g. by hiring better managers) and put pressure on management to improve their performance.
40. Quite apart from policies affecting workers’ skills, competition or the ease of reallocation within a market, digital adoption rates can also directly be driven by the trust businesses place in digital technologies. Over recent years, however, the

ECO/CPE/WP1(2018)8 │ 25
GOING DIGITAL: WHAT DETERMINES TECHNOLOGY DIFFUSION AMONG FIRMS?For Official Use
level of trust has suffered from a rising amount of (targeted and large-scale) cyber-attacks. As a result, 57% of large and 38% of small and medium-sized firms in the EU are concerned with the risk of a security-breach when using cloud systems (Eurostat, 2016). Since no comparable cross-country data quantifying the effect of cyberattacks is available to date, this aspect exceeds the scope of this report.
Box 2. The EU data protection framework
As digital technologies allow for the acquisition and handling of increasingly large volumes of personal data, privacy concerns have shifted to the forefront of policy making. The European Parliament thus adopted in 2016 a new harmonised set of data protection rules within the European Union, comprising the General Data Protection Regulation (GDPR) (Regulation (EU) 2016/679) applying from 25 May 2018, and the so-called Police Directive (Directive (EU) 2016/680), together replacing an outdated data protection directive from 1995. The GDPR carries provisions that require businesses to protect the personal data and privacy of EU citizens for transactions that occur within EU member states and regulates the exportation of personal data outside the EU. It is considered the most stringent data privacy regulation to date and expected to influence future privacy standards across the globe.
Costs of compliance for firms are estimated to be significant, with Members of the Fortune 500 spending a combined $7.8bn to avoid falling foul of the GDPR, according to the International Association of Privacy Professionals (Financial Times, 2017). These costs comes on top of the necessary investment in training to employees, notably as non-compliance can lead to penalties of up to 4% of annual global turnover or a maximum of €20 Million Euro.
To offset the increased financial burden placed on firms through this regulation, the cost of services, including for Cloud Computing, provided by European firms (or those dealing with European customer data) is expected to rise in comparison with international competitors. Importantly, however, the state of trust in the digital economy is likely to rise, broadening the potential customer base for European businesses demonstrating their compliance.

26 │ ECO/CPE/WP1(2018)8
GOING DIGITAL: WHAT DETERMINES TECHNOLOGY DIFFUSION AMONG FIRMS?For Official Use
3. Digital technologies: data and stylised facts
3.1. The data on technology usage 41. The data on digital technology usage are drawn from the Eurostat “community survey on ICT usage and e-commerce in enterprises” and has country, industry and time dimensions. The survey provides a compilation of data on the use of information and communication technology, the internet, e-government, e-business and e-commerce in enterprises with more than 10 employees. It covers all members and accession countries of the European Union in 25 industries of the non-farm business sector (NACE Rev 2, codes 10-83) on an annual basis since 2002. However, since most policy variables used in our analysis are only available for OECD countries, the sample is limited to a subset of 25 OECD countries, members of the EU and Turkey. To our best knowledge, this dataset is the only source of comparable cross-country data on digital adoption rates at the sectoral level.
42. The sub-set of indicators covered by our analysis were selected from a list of several hundred variables available in the Eurostat dataset, based on their potential complementarity, their likely productivity-enhancing effects as well as to maximise cross-country, cross-industry coverage (see Box 1 for detail on each of the selected technologies). It is worth noting that many technologies should not be considered in isolation. The emergence of CC, for instance, has drastically changed the IT landscape as it enables a much wider range of firms to apply other technologies (e.g. CRM and ERP systems) which previously required financial and human resources out of reach for many businesses. However, even the emergence of such new technologies cannot entirely overcome the features inherent in some of the technologies – such as the complexity of ERP systems – which prevent their wider dissemination. Correlations across use of different digital technologies are thus not as high as one might expect (see Table A.8).
43. Given the unbalanced nature of the Eurostat survey on ICT usage (with differing period coverage across countries – see Annex A) and the one-off nature of many of the structural and policy indicators, our analysis does not have a time-series dimension. Instead, average country-industry values are taken over the sample period 2010-2016. This procedure is based on the observation that, within each country-industry cell, variability over time was limited over the period considered (Table A.4).The resulting cross-sectional sample therefore covers variation across 25 countries and 25 industries.
3.2. Digital adoption and structural factors: some suggestive evidence44. Access to reliable and fast broadband connections constitutes the backbone of a digital society and economy. Indeed, among the technologies considered in this analysis, none would function effectively without the internet.22 Yet, all connections are not equal. Given the growing volumes of data transferred – not least to store data and software on ‘the cloud’ – the need for broadband connections with speeds greater than at least 30 Mbps has risen significantly, pointing to a
22 While ERP and CRM system could operate within establishments without access to internet, their cost-effectiveness and efficiency-enhancing potential only fully unfolds over the web.

ECO/CPE/WP1(2018)8 │ 27
GOING DIGITAL: WHAT DETERMINES TECHNOLOGY DIFFUSION AMONG FIRMS?For Official Use
strong complementarity between high-speed broadband connection and digital adoption. Indeed, Figure 4 shows that the percentage of firms adopting digital technologies is much higher in countries and industries that have above-average access to high-speed broadband, almost double that when such access is below average for the median country-industry observation. Formally testing for the link between high-speed connections and digital adoption rates – where we control for unobserved country and industry specific factors – confirms this finding (Table A.6).
Figure 4. Use of high-speed broadband (>30 Mbit/s) is associated with higher digital
Note: Average adoption rate across 4 technologies (ERP, CRM, Cloud Computing, Cloud Computing (high)) for a sample of 25 countries and 25 sectors (see Appendix 1 for more details).Source: Authors’ calculations, based on Eurostat, Digital Economy and Society Statistics, Comprehensive Database and national sources, September 2017.
45. Despite being a critical premise for the adoption of digital technologies, the availability (or lack) of high-speed broadband connections cannot fully explain cross-country differences in adoption rates. As argued in the previous section, adoption rates are also likely to be affected by structural policies that enhance complementary human capital (capabilities) or business dynamism (incentives). Illustrative evidence of this link is provided in Figure 5 by comparing kernel densities of digital adoption rates for selected digital technologies across country-industry observations with less and more favourable capability and incentive conditions.
46. For instance, adoption of complex CC across industries appears to be higher in countries that have an above average level of ICT training for non-ICT workers and lower barriers to competition in services sectors. This is consistent with the strong complementarity between digital technologies and skills as well as the presumed effect of pro-competition policies – which promote business dynamism and market discipline – on the propensity to adopt.
47. Clearly, this preliminary evidence needs to be verified by multivariate regression analysis controlling for country and industry characteristics that may

28 │ ECO/CPE/WP1(2018)8
GOING DIGITAL: WHAT DETERMINES TECHNOLOGY DIFFUSION AMONG FIRMS?For Official Use
affect digital adoption, independent of structural and policy settings, as all these phenomena could be driven by common factors that are omitted in these simple bivariate densities, such as for instance industry structure (that tilts production towards ICT-intensive areas requiring education towards STEM areas).
Figure 5. Structural policies and the diffusion of complex cloud computing
A. The adoption of complex CC is higher when ICT training is provided to workers
B. The adoption of complex CC is higher when barriers to services sectors are low
Note: This graph shows the distribution of cloud computing adoption rates for country-industry cells with a high/low (i.e. above/below in-sample averages of) percentage of firms providing ICT training to their employees (Panel A), and high/low barriers to services sectors (Panel B) respectively, for a sample of 25 countries and sectors (see Appendix 1 for a description of the dataset).Source: OECD, based on Eurostat, Digital Economy and Society Statistics, Comprehensive Database and national sources, September 2017.
4. The influence of capabilities and incentives on digital adoption
4.1. Empirical approach 48. To infer how policies can influence the diffusion of digital technologies via their effect on firms’ capabilities and incentives to adopt, we apply the approach popularized by Rajan and Zingales (1998). The advantage of this approach lies in its ability to identify potentially causal effects of country-wide factors by relying on variability at the country-industry level. The lack of within-country variability prevalent for most structural and policy variables is overcome by including an interaction term between the country-level variable and a relevant sectoral exposure variable. The implicit assumption behind this approach is that some industries (i.e. the treatment group) have a ‘naturally’ higher exposure to a given structural or policy factor than other industries (i.e. the control group).
49. Accordingly, we based our analysis on three key sets of assumptions, which have been exploited in a range of recent OECD analyses23:
23 For instance, see Andrews et al. (2015) for knowledge intensity; Andrews and Cingano (2014) for firm turnover; and Adalet McGowan et al. (2017a) for external finance dependency.
ECO/CPE/WP1(2018)8 │ 29
GOING DIGITAL: WHAT DETERMINES TECHNOLOGY DIFFUSION AMONG FIRMS?For Official Use
industries that are intrinsically more knowledge intensive – measured as the share of labour compensation for personnel with tertiary education – are more exposed to policies that affect managerial quality and the level of workers’ skills;
industries that experience higher firm (and job) turnover for technological reasons (e.g. more atomistic and fragmented markets or higher rates of innovation) – measured as the sum of firm entry and exit rates – are more exposed to policies that raise barriers to the entry of firms or impede the adjustment of the workforce; and
industries that are more dependent on external finance – measured as in Rajan-Zingales (1998) – are more exposed to policies that affect the availability of private equity and the efficiency of exit mechanisms, since greater reliance on external creditors increases the likelihood of having to go through a formal insolvency process;
industries that are more reliant on intermediate inputs from the computer services sectors (ISIC Rev 4. Sector 72, “Computer and related activities”) as a share of total inputs, are likely more exposed to policies affecting the openness of markets to trade with digital products and services.
50. Industry-level exposure variables are sourced from a large literature exploiting the same framework to explore the impact of structural factors and policies on economic outcomes (see Annex A for a detailed description of each variable).24 To the extent that the United States can be considered as a relatively ‘frictionless’ and highly diversified economy and in keeping with a vast number of studies using the same sectoral diff-in-diff approach, the exposure variables are computed from US data. This also avoids in-sample issues of endogeneity of the exposure variables, since the United States is not covered by the analysis.
51. We also test for the robustness of the results to our assumptions by alternative exposure variables. Notably we replace the knowledge intensity exposure variable with the sectoral share of high routine-tasks (Marcolin et al., 2016) which is significantly not perfectly correlated with our measure of knowledge intensity (see Figure B.1.). For labour market policies we also use layoff rates (defined as the percentage ratio of annual layoffs to total employment) instead of firm turnover (see Table B.2).
52. The key hypothesis is that industries in the treatment group should be disproportionally more affected than other industries (i.e. the control group) by a change in the relevant policy. The effect of treatment versus control is estimated via the interaction of the structural or policy variable of interest with the corresponding industry exposure variable. At the same time, omitted factors at the country or industry level are accounted for by including fixed effects. For instance, differences in digital adoption rates may arise due to the invariable characteristics of a country (e.g. openness to trade and investment or domestic market size) or inherent technological differences across industries.
24 Knowledge intensity by industry is drawn from OECD (2013), firm turnover by industry is drawn from Bartelsman et al. (2013), dependence on external finance by industry from Rajan and Zingales (1998), and the share of intermediate inputs from the computer services sectors is constructed based on OECD Input-Output tables.

30 │ ECO/CPE/WP1(2018)8
GOING DIGITAL: WHAT DETERMINES TECHNOLOGY DIFFUSION AMONG FIRMS?For Official Use
53. By construction, this approach does not provide an estimate of the average effect of the policy of interest. Rather, identification will be obtained comparing the differential adoption rates between highly and marginally exposed industries in countries with different levels of a given structural or policy factor.
54. The resulting baseline specification is as follows:
scscscscjsc ExpPolBBAdopt ,2,1, * , where
Adopt is the percentage of firms with ≥10 employees that have adopted digital technology j in industry s and country c averaged over the period 2010-16 (contingent on data availability)
BB is the percentage of firms with ≥10 employees with a broadband connection >30 Mb/s averaged over the same period
Pol refers to different national policy or structural factors that affect incentives or capabilities to adopt digital technologies
Exp is the industry exposure to these factors, i.e. ‘natural’ firm turnover, external finance dependency, knowledge intensity or share of computer services in total intermediate inputs; and
δc and δs are country and industry fixed effects
55. As discussed in section 2, we consider a number of proxies for capability and incentive factors (see Table 2). All of them are country-wide. Further details on variable definitions and sources are provided in Appendix A.
Table 2. Proxies for capability and incentive factors
Policy variable Source of policy variable Exposure variable
Capabilities
Organisational
capital
Quality of management schools World Economic Forum Knowledge intensity
High performance work practices
(HPWP)
OECD Programme for the
International Assessment of Adult
Competencies (PIAAC)
Knowledge intensity
Skilled labour Percentage of adults with no ICT
skills
OECD Programme for the
International Assessment of Adult
Competencies (PIAAC)
Knowledge intensity
The share of (low and high-skilled)
workers receiving training
OECD Programme for the
International Assessment of Adult
Competencies (PIAAC)
Knowledge intensity
The share of adults participating in
lifelong learning
OECD Programme for the
International Assessment of Adult
Competencies (PIAAC)
Knowledge intensity
E-Government OECD Science, Technology and
Industry Scoreboard 2017
Knowledge intensity
Allocation of talent Skill mismatch Adalet McGowan and Andrews
(2015) based on the OECD
Programme for the International
Assessment of Adult
Competencies (PIAAC)
Knowledge intensity
Incentives
Entry and
competition
Administrative burdens on start-ups OECD Product Market Regulation
Index
Firm turnover
Barriers to entry in services OECD Product Market Regulation Firm turnover

ECO/CPE/WP1(2018)8 │ 31
GOING DIGITAL: WHAT DETERMINES TECHNOLOGY DIFFUSION AMONG FIRMS?For Official Use
Index
Digital Trade Restrictiveness Index European Centre for International
Political Economy
Share of computer service
(ISIC Rev4 sector C72:
Computer and related
activities) purchases, in total
purchases of intermediates.
Exit and
reallocation
The OECD indicator of employment
protect legislation (EPL)
OECD Indicators of Employment
Protection
Firm turnover
The share of venture capital in GDP Eurostat External financial
dependency
Indirect government support through
R&D tax incentives
OECD Science, Technology and
Industry Scoreboard 2015 - ©
OECD 2015
Knowledge intensity
OECD indicator of the efficiency of
insolvency regimes
OECD Insolvency Regime
Indicator
External financial
dependency
Note: Please refer to Annex 1 for more detailed information.
4.2. Results56. We estimate three versions of our digital adoption model, first testing the influence of capability and incentive factors separately and one by one (Table 3, Table 4), then testing the joint influence of pairs of capability and incentive factors (Table 5) and lastly, for a reduced set of variables, checking for potential policy complementarities between both sets of structural factors (Table 6), which involves adding an interaction of capabilities and incentive indicators to the baseline model. In some cases, we also provide results that summarise the effects of capabilities and incentives on digital adoption by using the first principal component of the technologies covered in our analysis as the dependent variable.25 Multicollinearity among large sets of interaction terms (often with the same exposure variable) makes it difficult to go beyond these three types of regressions. Given that results from the pairwise regressions provide the most conservative estimates of the effects of capability and incentive factors on digital adoption, we use them to infer the economic significance of our estimates.
57. It should be noted at the outset that high-speed broadband penetration has in all cases a strongly significant and positive association with adoption rates of all the technologies considered. Given that this variable measures both demand and supply factors, no quantitative implications for the effects on adoption of the roll out of high-speed broadband Internet can be inferred from the estimates. However, the results strongly confirm the expected complementarity between high-speed broadband and the other digital technologies, underscoring the need for ubiquitous broadband deployment.
4.2.1. The influence of capabilities on digital adoption 58. Table 3 reports the results of difference-in-difference regressions for the individual capability factors. The first principal component of digital technology adoption is strongly and positively associated with all capabilities indicators. Turning to the individual technologies, with the exception of digital adoption of
25 Identical results are also found when the first principal component of the wider set of technologies shown in Figure 2 is used instead.

32 │ ECO/CPE/WP1(2018)8
GOING DIGITAL: WHAT DETERMINES TECHNOLOGY DIFFUSION AMONG FIRMS?For Official Use
ERP, whose regression coefficients are often insignificant, all other digital adoption variables display the expected significant association with capability variables. Both the quality of organisational capital and the availability and allocation of talents are associated with significantly higher digital adoption rates in knowledge-intensive industries relative to other industries.
59. Specifically, the quality of management (proxied by the share of workers involved in management practices that stimulate employee and organisational performance and the training received by future managers in management schools), is associated with higher CRM and cloud computing adoption (both CC and complex CC). These findings confirm that qualified firm management is a necessary complementary investment to the adoption of digital technologies in order to initiate and guide the adoption process, which often implies complex reorganisation of production processes and relationships between functional units within the firm and along supply chains.
60. Moreover, adoption rates of CRM and cloud computing are significantly and positively associated with workers’ general skills, the provision of e-government services, specific ICT competences and participation in lifelong learning and on the job training.26 Thus implementing digital change within a firm requires workers with a multiplicity of skills, which they continuously develop in order to keep pace with the fast changing technological landscape.
61. Digging deeper, the results suggest training to be especially effective for low-skilled workers, as the complementarity with adoption is significantly higher for investment in training for low skilled than high skilled (Figure 6). Increasing the percentage of low-skilled workers that receive training by one standard deviation is associated with a 3 percentage points increase in the share of firms adopting CRM or cloud computing systems in knowledge-intensive relative to other industries, compared to a 1.7 percentage increase from the same increase in training for workers with a high formal education level. While upgrading ICT skills of high-skilled staff remains an important driver of ICT adoption, these findings suggest that the attainment of sound levels of basic ICT skills (e.g. access information online or use software) by low-skilled workers is even more beneficial to the deployment of digital technologies. Thus, investing in training of low-skilled workers not only helps raising their productivity and wages, making the labour market more inclusive, but also holds the potential to increase aggregate productivity via faster adoption of advanced technologies.
Figure 6. The complementarity of training with adoption is stronger for the low-skilled
26 To some extent in turn this reflects some co-variation of these variables across the country-industry dimension.
Low skilled
Low skilled High skilled
High skilled

ECO/CPE/WP1(2018)8 │ 33
GOING DIGITAL: WHAT DETERMINES TECHNOLOGY DIFFUSION AMONG FIRMS?For Official Use
The differential association of training provided to high and low skilled workers with the percentage

34 │ ECO/CPE/WP1(2018)8
GOING DIGITAL: WHAT DETERMINES TECHNOLOGY DIFFUSION AMONG FIRMS?For Official Use
of firms adopting CRM and cloud computing systems

ECO/CPE/WP1(2018)8 │ 35
GOING DIGITAL: WHAT DETERMINES TECHNOLOGY DIFFUSION AMONG FIRMS?For Official Use
Customer Relationship Management
Cloud Computing0
0.5
1
1.5
2
2.5
3
3.5%
Note: This figure shows the ceteris paribus impact of an increase of a one standard deviation (11% for low-skilled, 13% for high-skilled) of the percentage of high/low-skilled workers having participated in formal training on the percentage of firms adopting CRM/Cloud Computing technologies between industries with a high or low knowledge intensity. Calculations are based on estimates from Table 3. Source: OECD, based on Eurostat, Digital Economy and Society Statistics, Comprehensive Database and national sources, September 2017
62. Finally, not only the level of skills but also the way they are allocated matters for digital adoption. Regression estimates suggest that lower skill mismatch is associated with disproportionately higher rates of adoption of CRM and cloud computing in knowledge-intensive sectors compared to other sectors. Thus, digital adoption critically depends on the ability of an economy to avoid wasting talents and allocate workers to the jobs they are best suited for, especially as firms draw from a scarce and fixed pool of skilled labour in the short to medium term. In turn, this ability has been shown to be strongly associated with a range of policies in labour and product markets (Adalet McGowan and Andrews, 2017).
63. As shown in Table B.3 results are robust to replacing knowledge intensity with the sectoral share of high-routine tasks (in the US) as an exposure variable. Also, results are broadly robust to dropping one country or sector at a time (see Table B.4 and Table B.5).

36 │ ECO/CPE/WP1(2018)8
GOING DIGITAL: WHAT DETERMINES TECHNOLOGY DIFFUSION AMONG FIRMS?For Official Use
Table 3. Capabilities and digital adoption
Dependent variable: percentage of firms>10 employees adopting the digital technology
Enterprise Resource
Planning
Customer
Relationship
Management
Cloud
Computing
Cloud
Computing
(complex)
1st principal;
component
A. Capabilities
I. Organisational capital
Quality of Management school x
knowledge intensity-0.0265 0.114*** 0.171*** 0.163*** 1.650***
High-speed broadband access (>30Mbit/s) 0.217*** 0.235*** 0.169*** 0.0991** 2.490***
Observations 477 477 456 435 429
High performance work practices x
knowledge intensity-0.00219 0.00987*** 0.00552** 0.00857*** 0.0807***
High-speed broadband access (>30Mbit/s) 0.353*** 0.251*** 0.171** 0.117** 2.797***
Observations 384 385 364 343 338
II. Skilled labour
Percentage of adults with no ICT skills x
knowledge intensity0.00177 -0.00697*** -0.00850*** -0.0102*** -0.101***
High-speed broadband access (>30Mbit/s) 0.352*** 0.238*** 0.197*** 0.106** 2.807***
Observations 321 321 322 301
Low skilled in training x knowledge intensity 1.35e-05 0.00746*** 0.00612*** 0.00974*** 0.0897***
High-speed broadband access (>30Mbit/s) 0.314*** 0.299*** 0.205*** 0.115** 2.986***
Observations 353 354 334 313 308
High skilled in training x knowledge
intensity-0.000407 0.00497*** 0.00357** 0.00753*** 0.0654***
High-speed broadband access (>30Mbit/s) 0.318*** 0.310*** 0.220*** 0.120** 3.082***
Observations 353 354 334 313 308
Lifelong learning x knowledge intensity -0.000777 0.00706*** 0.00673*** 0.00935*** 0.0897***
High-speed broadband access (>30Mbit/s) 0.351*** 0.218*** 0.183** 0.0803 2.570***
Observations 321 321 322 301 297
E-Government x knowledge intensity 0.000174 0.00509*** 0.00514*** 0.00466*** 0.0550***
High-speed broadband access (>30Mbit/s) 0.191*** 0.233*** 0.148** 0.115** 2.384***
Observations 411 411 390 369 363
III. Allocation of talent
Skill mismatch x knowledge intensity 0.00133 -0.0157*** -0.00863*** -0.00833*** -0.112***
High-speed broadband access (>30Mbit/s) 0.307*** 0.252*** 0.183*** 0.138*** 2.805***
Observations 406 407 386 365 360
Note: This tables reports baseline estimates of the baseline equation where each digital technology is regressed on the percentage of firms using high-speed broadband connections in a given country-industry cell, one policy variable of interest interacted with industry knowledge intensity (except in the case of ICT training which is at the country-industry level) and country and industry fixed effects. The last column shows results for the 1st principal component of the 4 technologies. Regressions are based on a country-industry data for a set of 25 countries 25 industries (NACE Rev 2, 10-83). To maximize coverage, unweighted averages of each variable are used over the time period 2010-2016. ***, ** and * represent p<0.01, p<0.05 and p<0.1 respectively.

ECO/CPE/WP1(2018)8 │ 37
GOING DIGITAL: WHAT DETERMINES TECHNOLOGY DIFFUSION AMONG FIRMS?For Official Use
Source: OECD calculations based on Eurostat, Digital Economy and Society Statistics, Comprehensive Database and national sources, September 2017
4.2.2. Policies affecting the incentives to adopt 64. Estimates of the influence of policies affecting market incentives are reported in Table 4. Results for the first principal component of digital adoption rates suggest that there is considerable scope to spur diffusion of digital technologies via policies that ease frictions on the reallocation process, strengthen competitive pressures and stimulate financial market development.
Entry and competition
65. In line with our expectations, lower administrative burdens on startups are estimated to significantly increase rates of adoption of cloud computing in industries with relatively higher turnover rates, possibly reflecting both stronger competitive pressures on incumbents and the innovative approaches of new entrants. Lower barriers to entry in services sectors have similar effects on adoption rates of both cloud computing and CRM: this may reflect both stronger market incentives to adopt in these service sectors (retail, business services and road freight) and easier adoption due to lower costs of intermediate inputs for other sectors that use these services. Barriers to digital trade have a similar negative impact on the adoption of all technologies, reflecting reduced competitive pressures and more difficult access to crucial inputs.
Exit and reallocation
66. Turning to factors of reallocation, we find that easier EPL regimes are associated with higher adoption rates across all technologies in sectors with a naturally high firm turnover (where reallocation needs are likely to be more intense) relative to low-turnover sectors. Similar effects, though at a weaker level of significance, are found for all technologies when the effect of EPL is tested in sectors with high relative to low job layoff rates (see Table B.2). EPL being the only variable for which the estimated coefficient is significant across all technologies, the results highlight the importance of labour market adaptability for digital adoption, though more research on more granular data would be required to identify the precise channels through which these effects operate.
67. Seed and early-stage finance policies play an overall positive role for the adoption of digital technologies. Sectors more dependent on external finance experience significantly higher adoption rates of CRM systems and cloud computing relative to other sectors. When access to venture capital increases, this likely reflects easier access to finance of ventures that use these technologies, especially (but not only) for young firms. Similarly, incentives to investment in R&D appear to be associated with greater adoption of CRM and CC, perhaps suggesting complementarity between R&D activity and the ability to experiment with digital technologies.
68. Lastly, well-designed insolvency regimes (e.g. where sanctions for personal insolvency are more lenient and barriers to corporate restructuring of insolvent firms are lower) are associated with higher cloud computing adoption rates in sectors relatively more dependent on external finance. Given that this technology is especially attractive for young firms, as it allows to reach scale without incurring heavy investments in IT infrastructure, the results may reflect several factors:

38 │ ECO/CPE/WP1(2018)8
GOING DIGITAL: WHAT DETERMINES TECHNOLOGY DIFFUSION AMONG FIRMS?For Official Use
stronger incentives to adopt due to heightened market discipline, less risk aversion to uptake this digital technology by young entrepreneurs and also more room for new digitalised entrants as resources are released by the exit or downsizing of weak incumbents.
4.2.3. Pairwise regressions and economic significance69. The two panels of Table 5 show the results of the adoption regressions in which capability and incentive variables are jointly and pairwise included. For simplicity, we omitted regression results obtained with the principal component of adoption rates across technologies and focus on just a subset of our indicators of ease of entry and competition and ease of exit and reallocation.27 Adoption rates of each of the digital technologies are regressed on one capability and one incentive variable, while continuing to control for high-speed broadband internet uptake and country and industry fixed effects. It should be noted that the introduction of both variables simultaneously sometimes reduces drastically the number of observations due to different coverage of the capability and incentive variables, making the comparison of results in this table with previous estimates difficult. Nonetheless, given that these regressions are more demanding in terms of both degrees of freedom and variables covered, they yield the more conservative estimates on which the economic significance of structural and policy factors can be verified. Indeed, as expected all estimated coefficients in the joint regressions have a tendency to become slightly smaller than in the previous one by one regressions, though their magnitude is quite stable across specifications.
70. On the whole, the coefficients and significance of the interactions between country-level capability variables and industry-level knowledge intensity remain little affected by their pairwise estimation with the interactions between market incentive variables and their corresponding industry exposure variables. The only exception are regressions that include venture capital, in which many of the capability variables lose significance, most probably reflecting the significant reduction in sample size associated with the use of this incentive variable.
71. Similarly, results for most of the incentive variables are little affected by the inclusion of capability variables in the regression. EPL and digital trade restrictions remain the only variables that have negative effects on rates of digital adoption of most technologies, even though significance is lost in some instances (e.g. when estimated jointly with training and lifelong learning). Administrative burdens on start-ups and barriers to entry in services maintain their negative effects on cloud computing technologies, though the effect on CC loses significance in a few cases. The availability of venture capital still has positive and significant effects on most technologies except ERP, though results lose significance when estimated jointly with e-government. Tax credits to R&D generally maintain their positive and significant effect on adoption of all technologies except ERP, but lose significance when jointly estimated with the quality of management schools. By contrast, the inefficiency of insolvency regimes maintains its negative effects on cloud computing but is now rarely significant, and therefore results for this variable are omitted from the table.
27 Omitted results are similar and available from the authors upon request.

ECO/CPE/WP1(2018)8 │ 39
GOING DIGITAL: WHAT DETERMINES TECHNOLOGY DIFFUSION AMONG FIRMS?For Official Use
Table 4. Market incentives and digital adoption
Dependent variable: percentage of firms>10 employees adopting the digital technology
Enterprise
Resource
Planning
Customer
Relationship
Management
Cloud ComputingCloud Computing
(complex)
1st principal
component
Entry and competition
PMR Administrative burdens on
start-ups x Turnover 0.00235 -0.00158 -0.00330** -0.00630*** -0.0473***
High-speed broadband access
(>30Mbit/s)0.209*** 0.251*** 0.186*** 0.127*** 2.685***
Observations 477 477 456 435 429
PMR Barriers in services
sectors x Turnover0.00147 -0.00195* -0.00216** -0.00399*** -0.0320***
High-speed broadband access
(>30Mbit/s)0.207*** 0.257*** 0.189*** 0.129*** 2.718***
Observations 477 477 456 435 429
Digital Trade Restrictiveness
Index X Share of Computer
services as input into sector x
-0.0371** -0.0769*** -0.0323* -0.0497** -0.607**
High-speed broadband access
(>30Mbit/s)0.204*** 0.228*** 0.174*** 0.102** 2.447***
Observations 477 477 456 435 429
Exit and reallocation Employment Protection
Legislation x Turnover-0.00556* -0.00649*** -0.00423** -0.00439*** 3.632
High-speed broadband access
(>30Mbit/s)0.225*** 0.260*** 0.186*** 0.119*** 2.782***
Observations 477 477 456 435 364
Venture Capital x Financial
Dependency -0.00253 0.526*** 0.348*** 0.547*** -0.0648***
High-speed broadband access
(>30Mbit/s)0.239*** 0.217** 0.194*** 0.0830 2.669***
Observations 290 289 290 270 429
Tax incentive support for BERD
X Knowledge Intensity -0.136 0.656** 0.554*** 0.241 5.298***
High-speed broadband access
(>30Mbit/s)0.253*** 0.267*** 0.185*** 0.124** 2.538***
Observations 411 411 390 370 265
Insolvency Regime Rigidity x
Financial Dependency0.0211 -0.0145 -0.0482** -0.0375** -0.392**
High-speed broadband access
(>30Mbit/s)0.214*** 0.267*** 0.191*** 0.137*** 2.845***
Observations 419 419 398 377 371
Note: This table reports baseline estimates of the baseline equation where each digital technology is regressed on the percentage of firms using high-speed broadband connections in a given country-industry cell, one policy variable of interest interacted with the relevant exposure variable (industry firm turnover or sector dependency on external finance) and country and industry fixed effects. The last column shows results for the 1st principal component of the 4 technologies. Regressions are based on a country-industry data for a set of 25 countries 25 industries (NACE Rev 2, 10-83). To maximize coverage, unweighted averages of each variable are used over the time period 2010-2016. ***, ** and * represent p<0.01, p<0.05 and p<0.1 respectively.

40 │ ECO/CPE/WP1(2018)8
GOING DIGITAL: WHAT DETERMINES TECHNOLOGY DIFFUSION AMONG FIRMS?For Official Use
Source: OECD calculations based on Eurostat, Digital Economy and Society Statistics, Comprehensive Database and national sources, September 2017.

ECO/CPE/WP1(2018)8 │ 41
GOING DIGITAL: WHAT DETERMINES TECHNOLOGY DIFFUSION AMONG FIRMS?For Official Use
Table 5. The joint effects of incentives and capabilities
Pairwise regression results
ENTRY AND COMPETITION
Incentives Administrative barriers for start-ups x Turnover Barriers to the services sector x Turnover DTRI X share of comp services
Enterprise
Resource
Planning
Customer
Relationship
Management
Cloud
Computing
Cloud
Computing
(complex)
Enterprise
Resource
Planning
Customer
Relationship
Management
Cloud
Computing
Cloud
Computing
(complex)
Enterprise
Resource
Planning
Customer
Relationship
Management
Cloud
Computing
Cloud
Computing
(complex)
Incentive 0.00227 -0.00120 -0.00274* -0.00576*** 0.00142 -0.00170 -0.00184** -0.00370*** -0.0398** -0.0691*** -0.0334** -0.0486**
Quality of management schools x
knowledge intensity-0.0249 0.113*** 0.169*** 0.160*** -0.0252 0.113*** 0.170*** 0.160*** -0.0346 0.101*** 0.172*** 0.163***
Incentive 0.00297 -0.00143 -0.00271 -0.00614*** 0.00165 -0.00163 -0.00182* -0.00383*** -0.0261 -0.0616*** -0.0333* -0.0659***
High Performance Work Practices x
knowledge intensity-0.00198 0.00976*** 0.00532** 0.00814*** -0.00195 0.00963*** 0.00523** 0.00799*** -0.00315 0.00766*** 0.00484** 0.00737***
Incentive 0.000410 -0.00297 -0.00322 -0.00600*** 0.000707 -0.00177 -0.00185* -0.00358*** -0.0424** -0.0765*** -0.0356** -0.0561***
Percentage of adults with no ICT skills x
knowledge intensity0.00175 -0.00680*** -0.00831*** -0.00990*** 0.00170 -0.00677*** -0.00829*** -0.00984*** 0.00216 -0.00627*** -0.00816*** -0.00942***
Incentive 0.00330 -0.000244 -0.00202 -0.00589*** 0.00167 -0.00101 -0.00144 -0.00349*** -0.0289* -0.0508*** -0.00923 -0.0305*
Percentage of low skilled in training x
knowledge intensity0.000191 0.00745*** 0.00600*** 0.00939*** 0.000222 0.00733*** 0.00592*** 0.00928*** -0.00110 0.00555*** 0.00586*** 0.00883***
Incentive 0.00327 -0.000370 -0.00225 -0.00608*** 0.00164 -0.00116 -0.00162* -0.00362*** -0.0297* -0.0585*** -0.0203 -0.0427**
Percentage of high skilled in training x
knowledge intensity-0.000256 0.00496*** 0.00346** 0.00722*** -0.000238 0.00485*** 0.00338** 0.00712*** -0.00132 0.00325* 0.00319** 0.00651***
Incentive 0.000502 -0.00287 -0.00328 -0.00591*** 0.000756 -0.00165 -0.00183* -0.00347*** -0.0471** -0.0638** -0.0225 -0.0336*
Lifelong learning x knowledge intensity -0.000750 0.00690*** 0.00654*** 0.00902*** -0.000686 0.00686*** 0.00650*** 0.00893*** -0.00197 0.00544*** 0.00616*** 0.00843***
Incentives 0.00186 -0.00166 -0.00219 -0.00594*** 0.00117 -0.00200 -0.00107 -0.00360*** -0.0490*** -0.0674*** -0.0133 -0.0333*
E-Government x knowledge intensity 0.000214 0.00505*** 0.00510*** 0.00456*** 0.000234 0.00498*** 0.00508*** 0.00448*** -0.000736 0.00383*** 0.00497*** 0.00426***
Incentive 0.00323 -0.00155 -0.00273 -0.00640*** 0.00166 -0.00183* -0.00197** -0.00400*** -0.0230 -0.0786*** -0.0410** -0.0821***
Skill mismatch x knowledge intensity 0.00118 -0.0156*** -0.00847*** -0.00796*** 0.00112 -0.0154*** -0.00835*** -0.00781*** 0.00120 -0.0162*** -0.00884*** -0.00901***
Table 5. (continued)
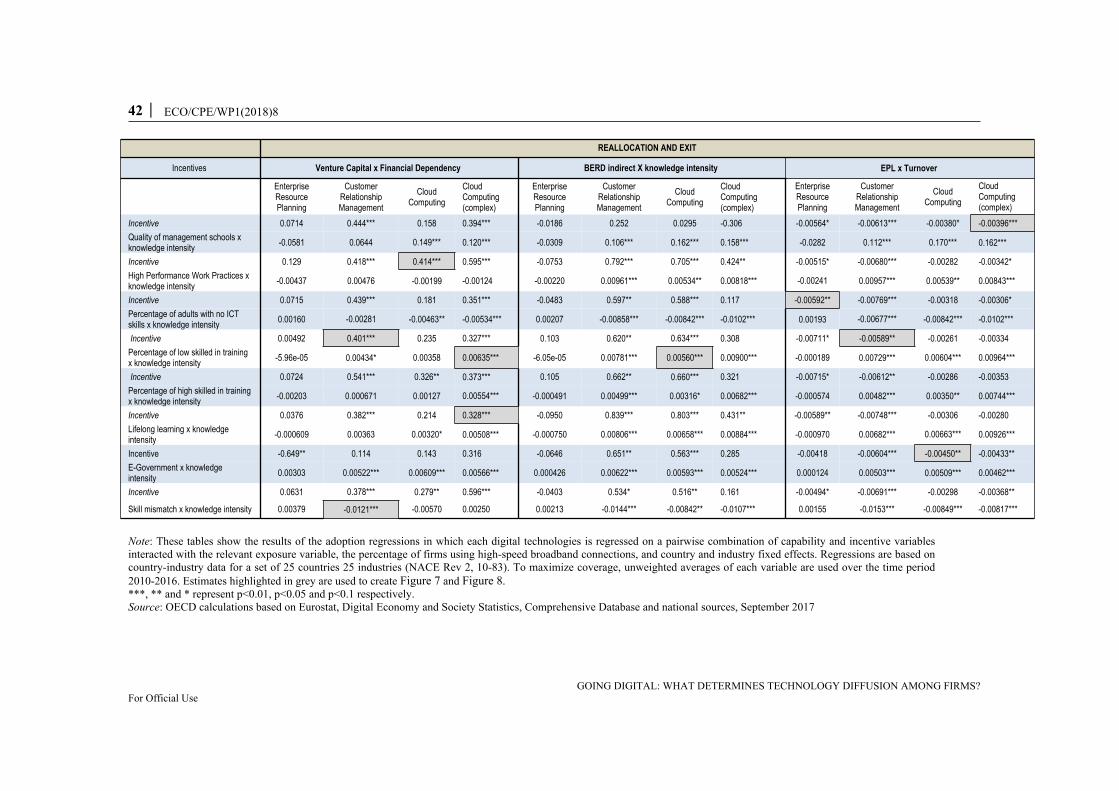
42 │ ECO/CPE/WP1(2018)8
GOING DIGITAL: WHAT DETERMINES TECHNOLOGY DIFFUSION AMONG FIRMS?For Official Use
REALLOCATION AND EXIT
Incentives Venture Capital x Financial Dependency BERD indirect X knowledge intensity EPL x Turnover
Enterprise
Resource
Planning
Customer
Relationship
Management
Cloud
Computing
Cloud
Computing
(complex)
Enterprise
Resource
Planning
Customer
Relationship
Management
Cloud
Computing
Cloud
Computing
(complex)
Enterprise
Resource
Planning
Customer
Relationship
Management
Cloud
Computing
Cloud
Computing
(complex)
Incentive 0.0714 0.444*** 0.158 0.394*** -0.0186 0.252 0.0295 -0.306 -0.00564* -0.00613*** -0.00380* -0.00396***
Quality of management schools x
knowledge intensity-0.0581 0.0644 0.149*** 0.120*** -0.0309 0.106*** 0.162*** 0.158*** -0.0282 0.112*** 0.170*** 0.162***
Incentive 0.129 0.418*** 0.414*** 0.595*** -0.0753 0.792*** 0.705*** 0.424** -0.00515* -0.00680*** -0.00282 -0.00342*
High Performance Work Practices x
knowledge intensity-0.00437 0.00476 -0.00199 -0.00124 -0.00220 0.00961*** 0.00534** 0.00818*** -0.00241 0.00957*** 0.00539** 0.00843***
Incentive 0.0715 0.439*** 0.181 0.351*** -0.0483 0.597** 0.588*** 0.117 -0.00592** -0.00769*** -0.00318 -0.00306*
Percentage of adults with no ICT
skills x knowledge intensity0.00160 -0.00281 -0.00463** -0.00534*** 0.00207 -0.00858*** -0.00842*** -0.0102*** 0.00193 -0.00677*** -0.00842*** -0.0102***
Incentive 0.00492 0.401*** 0.235 0.327*** 0.103 0.620** 0.634*** 0.308 -0.00711* -0.00589** -0.00261 -0.00334
Percentage of low skilled in training
x knowledge intensity-5.96e-05 0.00434* 0.00358 0.00635*** -6.05e-05 0.00781*** 0.00560*** 0.00900*** -0.000189 0.00729*** 0.00604*** 0.00964***
Incentive 0.0724 0.541*** 0.326** 0.373*** 0.105 0.662** 0.660*** 0.321 -0.00715* -0.00612** -0.00286 -0.00353
Percentage of high skilled in training
x knowledge intensity-0.00203 0.000671 0.00127 0.00554*** -0.000491 0.00499*** 0.00316* 0.00682*** -0.000574 0.00482*** 0.00350** 0.00744***
Incentive 0.0376 0.382*** 0.214 0.328*** -0.0950 0.839*** 0.803*** 0.431** -0.00589** -0.00748*** -0.00306 -0.00280
Lifelong learning x knowledge
intensity-0.000609 0.00363 0.00320* 0.00508*** -0.000750 0.00806*** 0.00658*** 0.00884*** -0.000970 0.00682*** 0.00663*** 0.00926***
Incentive -0.649** 0.114 0.143 0.316 -0.0646 0.651** 0.563*** 0.285 -0.00418 -0.00604*** -0.00450** -0.00433**
E-Government x knowledge
intensity0.00303 0.00522*** 0.00609*** 0.00566*** 0.000426 0.00622*** 0.00593*** 0.00524*** 0.000124 0.00503*** 0.00509*** 0.00462***
Incentive 0.0631 0.378*** 0.279** 0.596*** -0.0403 0.534* 0.516** 0.161 -0.00494* -0.00691*** -0.00298 -0.00368**
Skill mismatch x knowledge intensity 0.00379 -0.0121*** -0.00570 0.00250 0.00213 -0.0144*** -0.00842** -0.0107*** 0.00155 -0.0153*** -0.00849*** -0.00817***
Note: These tables show the results of the adoption regressions in which each digital technologies is regressed on a pairwise combination of capability and incentive variables interacted with the relevant exposure variable, the percentage of firms using high-speed broadband connections, and country and industry fixed effects. Regressions are based on country-industry data for a set of 25 countries 25 industries (NACE Rev 2, 10-83). To maximize coverage, unweighted averages of each variable are used over the time period 2010-2016. Estimates highlighted in grey are used to create Figure 7 and Figure 8.***, ** and * represent p<0.01, p<0.05 and p<0.1 respectively.Source: OECD calculations based on Eurostat, Digital Economy and Society Statistics, Comprehensive Database and national sources, September 2017

ECO/CPE/WP1(2018)8 │ 43
GOING DIGITAL: WHAT DETERMINES TECHNOLOGY DIFFUSION AMONG FIRMS?For Official Use
72. To get a sense of the economic significance of the effects of structural factors and policies on the share of firms adopting digital technologies, Figure 7 and Figure 8 illustrate the findings graphically. Interpreting the estimates causally, the figures compare the effect of changes in selected structural and policy factors on digital technology adoption rates between high (i.e. at the 75th percentile distribution) and low exposed sectors (i.e. at the 25th percentile distribution). The changes are cast in terms of moving from worst to best practice in capability and incentive factors. While this approach provides some concreteness to the exercise, a caveat is that the implied changes vary across the different factors as they reflect the variability of capability and incentive conditions across countries. Consequently, comparison of the size of effects ought to be interpreted in the light of the cross-country dispersion in each of the factors (see Table A.4 for details). As already mentioned, calculations are based on the most conservative estimates, accounting for both incentives and capabilities. Effects that are statistically not significant are reported as nil.
73. In most cases, increasing capabilities from the lowest to the highest level observed in the sample would have striking effects on digital adoption rates of exposed industries. For instance, a fourfold increase in the coverage of workers involved in HPWPs (equivalent to moving from 8 percent in Greece to 40 percent in Denmark) would increase the adoption rates of these technologies by roughly 8 percentage points. Similar increases would also be observed upon promoting the use of e-government services (from Italian to Icelandic levels; Panel B) and increasing training of low-skilled workers (from Greek to Danish levels; Panel C). Slightly smaller yet sizeable effects would be obtained from reducing skill mismatch (from Greek to Polish levels).
74. To put these effects into perspective, a 10 percentage point increase is roughly equivalent to one fifth or more (depending on the technology) of the observed dispersion in diffusion rates across our sample of countries (Figure 2). Of course, the simulated changes in capabilities are sometimes very large and would take time to occur as they would require a strong and sustained effort by both public institutions and firms. However, they highlight the potential for education, training and other policies affecting skills to significantly affect the extent of technological take-up by firms over the medium term, pointing to the need to frontload their implementation.
75. The estimated gains in adoption of exposed versus non exposed industries that are implied by policy reforms affecting incentives are somewhat less spectacular but still large, especially in view of the fact that some of them (e.g. reducing administrative burdens or reforming insolvency regimes) could be implemented more rapidly and at lesser cost than those affecting capabilities. For instance, easing firm entry by reducing administrative burdens on start-ups (from the high level in Turkey to the lowest level in the Netherlands) would increase adoption rates of cloud computing by 3 to 4 percentage points, and similar increases would be obtained by lifting barriers to digital trade from high levels in Turkey to best practice in Iceland. Effects of similar size but generalised across all technologies would be obtained by easing EPL (from the relatively tight levels in Portugal to the relatively loose levels in the UK), thereby making adjustment of the workforce to meet digital change within incumbent firms easier and facilitating the entry of innovative firms. The effects simulated for financial market developments leading to an increase in the share of venture capital in GDP (from Czech to Danish levels) are much stronger, particularly as the dispersion in the availability of venture capital across countries is very wide (Table A.3).
76. On the whole, these results suggest that combining reforms aimed at improving the level of managerial expertise and workers’ skills with measures aimed at facilitating business dynamism can be an effective way to leverage on the development of digital technologies by increasing their diffusion across firms. In turn, faster and wider diffusion can help close the gap between laggard and frontier firms, which would sustain aggregate productivity growth.
Figure 7. Economic significance (Capabilities)
A: Increase in digital adoption rate from increasing the diffusion of HPWP to maximum level (DNK)
B: Increase in digital adoption rate from increasing the share of citizens using e-
government services to maximum level (ISL)Differential impact between industries with high and low Differential impact between industries with high and low

44 │ ECO/CPE/WP1(2018)8
GOING DIGITAL: WHAT DETERMINES TECHNOLOGY DIFFUSION AMONG FIRMS?For Official Use
knowledge intensity
Enterprise
Resource
Planning
Customer
Relationship
Management
Cloud Computing Cloud Computing
(complex)
0
1
2
3
4
5
6
7
8
9
10
%
Lowest benefit from reform (FIN)Highest benefit from reform (GRC)
knowledge intensity
Enterprise
Resource
Planning
Customer
Relationship
Management
Cloud ComputingCloud Computing
(complex)
0
2
4
6
8
10
12
%
Lowest benefit from reform (NOR)Highest benefit from reform (ITA)
C: Increase in digital adoption rate from increasing the percentage of low skilled workers in training to
maximum level (DNK)
D: Increase in digital adoption rate from bringing skill mismatch to minimum level (POL)
Differential impact between industries with high and low knowledge intensity
Enterprise
Resource
Planning
Customer
Relationship
Management
Cloud
Computing
Cloud
Computing
(complex)
0
1
2
3
4
5
6
7
8
%
Lowest benefit from reform (NOR) Highest benefit from reform (GRC)
Differential impact between industries with high and low knowledge intensity
Enterprise
Resource
Planning
Customer
Relationship
Management
Cloud Computing Cloud Computing
(complex)
0
1
2
3
4
5
6
7
8
9
10
%
Lowest benefit from reform (BEL) Highest benefit from reform (GRC)
Notes: These graphs show the ceteris paribus increase in digital adoption rates from increasing the quality of management school (Panel A), the percentage of low-skilled in training (Panel C) to sample maximum, or decreasing the share of adults with no ICT skills (Panel B), or the percentage of workers with skill mismatch (Panel D) to sample minimum, between industries with a high (i.e. 75th percentile) or low (i.e. 25th percentile) knowledge intensity. Calculations are based on the most conservative estimates (i.e. smallest magnitude of most significant estimate) from Table 5. No calculations are made where estimates were consistently insignificant (e.g. ERP systems). Note that the lowest benefit (or increase) is reaped by countries that are close to the sample optimum, as their scope for reform is limited. By construction, the lowest/highest benefit will always be made by the same country within each panel. The average effect is represented by the circle, the 1st and 3rd quartile by the blue bar.

ECO/CPE/WP1(2018)8 │ 45
GOING DIGITAL: WHAT DETERMINES TECHNOLOGY DIFFUSION AMONG FIRMS?For Official Use
Figure 8. Economic significance (Incentives)
C: Increase in digital adoption rate from decreasing administrative burdens for start-ups to minimum level
(NLD)
B: Increase in digital adoption rate from increasing the share of venture capital (as a percentage of GDP)
to maximum level (DNK)
Differential impact between industries with high and low firm turnover
Enterprise
Resource
Planning
Customer
Relationship
Management
Cloud
Computing
Cloud
Computing
(high)
0
0.5
1
1.5
2
2.5
3
3.5
4%
Lowest benefit from reform (DNK)Highest benefit from reform (TUR)
Differential impact between industries with high and low external financial dependency
Enterprise
Resource
Planning
Customer
Relationship
Management
Cloud Computing Cloud Computing
(high)
0
2
4
6
8
10
12
14
%Lowest benefit from reform (SWE)highest benefit from reform (CZE)
D: Increase in digital adoption rate from easing barriers to digital trade to minimum level (ISL)
A: Increase in digital adoption rate from reducing EPL to minimum level (GBR)
Differential impact between industries with a high and low share of intermediate computer services
inputs
Enterprise
Resource Planning
Customer
Relationship
Management
Cloud Computing Cloud Computing
(high)
0
0.5
1
1.5
2
2.5
3
3.5
4
4.5
5%
Lowest benefit from reform (IRL) Highest benefit from reform (TUR)
Differential impact between industries with high and low firm turnover
Enterprise
Resource
Planning
Customer
Relationship
Management
Cloud
Computing
Cloud
Computing
(high)
0
0.5
1
1.5
2
2.5
3
%
Lowest benefit from reform (IRL) Highest benefit from reform (PRT)
Notes: These graphs show the ceteris paribus increase in digital adoption rates from decreasing EPL (Panel A), administrative burdens for start-ups (Panel C), and insolvency regime rigidity (Panel D) to sample minimum, or increasing the share of venture capital as a percentage of GDP (Panel B) to sample maximum, between industries with high (i.e. 75th percentile) and low (i.e. 25th percentile) turnover rates (Panel A) or external financial dependency (Panel B, C, D). Calculations are based on the most conservative estimates (i.e. smallest magnitude of most significant estimate) from Table 5. No calculations are made where estimates were consistently insignificant (e.g. ERP systems in Panel B, C, and D). Note that the lowest benefit (or increase) is reaped by countries that are close to the sample optimum, as their scope for reform is limited. By construction, the lowest/highest benefit will always be made by the same country within each panel. The average effect is represented by the circle, the 1st and 3rd quartile by the blue bar.

46 │ ECO/CPE/WP1(2018)8
GOING DIGITAL: WHAT DETERMINES TECHNOLOGY DIFFUSION AMONG FIRMS?For Official Use
5. Policy complementarities
77. There are good reasons to suspect that market incentives can shape the impact of investment in organisational capital on the adoption of digital technologies. For instance, high-quality management practices might only translate into significant increases of digital adoption rates if market settings underpin the creative destruction process through competition-enhancing policies. In this regard, one might expect the returns to investment in capabilities to be proportionally greater in the absence of entry barriers to new, and in particular young firms, to the extent that young firms possess a comparative advantage in commercialising new technologies (Henderson, 1993; see section 2.3.2) thus encouraging managers to experiment with new business strategies and new technologies. In a similar vein, a (policy) complementarity may exist between the quality of management and the ease of adjustment of the workforce. With overly stringent employment protections legislations, managerial decisions concerning a reorganisation of the workforce may be more challenging to implement.
78. To test this conjecture, Table 6 explores the link between the prevalence of high performance work practices (HPWP), proxying for the quality of management, and barriers to competition and reallocation in the form of administrative barriers to start-ups (Panel A), restrictions to digital trade (Panel B), and the stringency employment protections legislations (Panel C). As before, the quantification of an increase in the coverage of workers involved in HPWPs relies on the difference of the effects on digital adoption rates between more and less knowledge intensive sectors. We report results obtained for the first principal component of digital adoption rates as well as for the different technologies.
79. Consistent with our conjecture, the positive effect of managerial quality on adoption is boosted by easier access to markets and reallocation. Lower administrative burdens on startups, more open digital trade and more flexible labour markets increase the positive impact of extending the use of modern managerial practices on the adoption of digital technologies, pointing to a significant complementarity between policies aimed at imposing market incentives and firm capabilities.
80. For example, our estimates suggest that the effects of a wider diffusion of HPWPs (i.e. increasing rates observed in each country to the maximum rate in Denmark) on the adoption of cloud computing would be quite different in countries with different market environments (Figure 9). They would be three times larger in countries with low administrative burdens relative to countries with high burdens and twice as large in countries with relatively less stringent EPL regimes. Estimates are less sensitive to barriers to digital trade, even though the effects of improving management on adoption of cloud computing would still be stronger in an open trade environment than with high barriers to trade. Thus, packaging reforms in the capabilities and incentives areas could increase the bang for the buck on adoption rates.
Table 6. The complementarity between incentives and capabilities: the effects of improving managerial practices on adoption depend on the market environment
Dependent variable: percentage of firms>10 employees adopting the digital technology
Enterprise
Resource
Planning
Customer
Relationship
Management
Cloud
Computing
Cloud Computing
(complex)
1st principal
component

ECO/CPE/WP1(2018)8 │ 47
GOING DIGITAL: WHAT DETERMINES TECHNOLOGY DIFFUSION AMONG FIRMS?For Official Use
A: Administrative Burdens to Startups
High-speed internet 0.353*** 0.251*** 0.170** 0.116** 2.784***
(0.0648) (0.0742) (0.0673) (0.0517) (0.660)
HPWP* Knowledge Intensity 8.26e-06 0.0116*** 0.0121*** 0.0163*** 0.156***
(0.00375) (0.00256) (0.00297) (0.00282) (0.0308)
HPWP* Knowledge Intensity*
Administrative Burdens to Startups
(PMR)
-0.00204 -0.00164 -0.00583*** -0.00696*** -0.0684***
(0.00221) (0.00234) (0.00211) (0.00186) (0.0197)
Observations 384 385 364 343 338
R-squared 0.863 0.891 0.909 0.874 0.922
B: Digital Trade Restrictions
High-speed internet 0.351*** 0.236*** 0.161** 0.0961* 2.647***
(0.0658) (0.0739) (0.0666) (0.0509) (0.650)
HPWP* Knowledge Intensity -0.00132 0.0160*** 0.0102*** 0.0170*** 0.142***
(0.00378) (0.00374) (0.00306) (0.00318) (0.0408)
HPWP* Knowledge Intensity *Digital
Trade Restrictiveness Index
-0.00521 -0.0368** -0.0254** -0.0453*** -0.327*
(0.0172) (0.0169) (0.0123) (0.0143) (0.174)
Observations 384 385 364 343 338
R-squared 0.863 0.893 0.907 0.869 0.919
C: Employment Protection
High-speed internet 0.355*** 0.255*** 0.174** 0.119** 2.820***
(0.0650) (0.0755) (0.0674) (0.0522) (0.661)
HPWP* Knowledge Intensity 0.00368 0.0225*** 0.0200*** 0.0230*** 0.244***
(0.00669) (0.00536) (0.00575) (0.00510) (0.0532)
HPWP* Knowledge Intensity *
Employment Protection Legislation
-0.00244 -0.00525** -0.00616*** -0.00611*** -0.0691***
(0.00251) (0.00238) (0.00234) (0.00199) (0.0206)
Observations 384 385 364 343 338
R-squared 0.863 0.893 0.909 0.870 0.921
Note: This table reports estimates of a model specification in which each digital technology is regressed on the percentage of firms using high-speed broadband connections in a given country-industry cell, the prevalence of high performance work practices interacted with knowledge intensity only, and as a triple interaction term with a policy variable of interest (i.e. product market regulations, digital trade restrictions, and the stringency of employment protection legislation). All regressions include country and industry fixed effects and are based on a country-industry data for a set of 25 countries 25 industries (NACE Rev 2, 10-83). To maximize coverage, unweighted averages of each variable are used over the time period 2010-2016. Further triple interactions results are available upon request. ***, ** and * represent p<0.01, p<0.05 and p<0.1 respectively.Source: OECD calculations based on Eurostat, Digital Economy and Society Statistics, Comprehensive Database and national sources, September 2017.
Figure 9. A market environment favourable to incentives boosts the impact of enhanced managerial practices on the adoption rate of cloud computing

48 │ ECO/CPE/WP1(2018)8
GOING DIGITAL: WHAT DETERMINES TECHNOLOGY DIFFUSION AMONG FIRMS?For Official Use
Increase in CC adoption rates from increasing the diffusion of HPWP to sample maximum level (DNK)
Low PMR High PMR Low DTRI High DTRI Low EPL High EPL
-3
-1
1
3
5
7
9
11
13
15
%
Panel A Panel B Panel C
Note: These graphs show the ceteris paribus increase in digital adoption rates from increasing the diffusion of high performance work practices (HPWP) to sample maximum (DNK), between industries with a high (i.e. 75th percentile) or low (i.e. 25th percentile) knowledge intensity in a policy environment with high (i.e. 75th percentile of the distribution) or low (25th percentile) (A) administrative burdens on start-ups, (B) restrictions on digital trade and (C) employment protections legislations. Calculations are based on results in Table 6. Note that the lowest benefit (or increase) is reaped by countries that are close to the sample optimum, as their scope for reform is limited. By construction, the lowest/highest benefit will always be made by the same country within each panel. The average effect is represented by the circle, the 1st and 3rd quartile by the beige bar.
6. Policy implications and conclusion
81. Policies to revive technological diffusion have come into closer focus, as evidence has emerged that the aggregate productivity slowdown has its roots in rising within-sector productivity dispersion, partly reflecting the flickering ability of laggard firms to catch up to the frontier by adopting latest technologies and business practices (Andrews et al., 2016; Decker et al., 2016; Baily et al., 2016). Accordingly, this paper exploits a novel cross-country industry-level dataset to explore the structural barriers to digital adoption in firms. The results are consistent with the idea that digital adoption in firms is supported by three overriding factors. First, improving the roll-out of high quality broadband infrastructure is complementary to the adoption of more sophisticated digital applications. Even so, significant cross-country differences in digital adoption remain after controlling for the penetration of high-speed broadband, which highlights two additional requirements: the need to lift firms’ capabilities and sharpen their incentives to adopt. This in turn requires implementing structural policies that support the technology-skill complementarity and ease access to markets and resource reallocation.
82. On the capabilities side, a key observation is that the complementary intangible investments required for successful adoption of new technologies have become increasingly sophisticated over time. Consistent with this, we find evidence that digital penetration is more widespread in environments characterised by higher quality management, a wider availability of ICT skills – especially the provision of ICT training to low skilled workers – and a more efficient matching of skills to jobs. But building capabilities is not sufficient if market opportunities and incentives to adopt are weak. In this regard, our results demonstrate the important link between digital diffusion and framework policies that do not unduly inhibit ease of firm entry and exit, competitive pressures and digital trade, reshuffling of the workforce and access to private equity. In

ECO/CPE/WP1(2018)8 │ 49
GOING DIGITAL: WHAT DETERMINES TECHNOLOGY DIFFUSION AMONG FIRMS?For Official Use
sum, as highlighted by our findings on policy complementarity, enhanced capabilities need to be supported by business dynamism and efficient resource reallocation (and vice versa) to bring about significant increases in adoption rates.
83. More research on the barriers to digital adoption is clearly required and a number of avenues for future research thus emerge. First, structural weaknesses that undermine firms’ capabilities and incentives to adopt may result in lower digital adoption rates by indirectly supressing the returns to digital adoption. Accordingly, ongoing work aims to combine the same digital adoption variables exploited in this paper with external industry and firm-level productivity data, in order explore how the same structural and policy factors shape the productivity returns from investments in digital technologies.
84. Second, future research could explore the extent to which digital technologies enhance the productivity payoffs of other intangible investments. For example, there is evidence that the productivity returns to R&D investment vary significantly across countries (Cincera and Veugelers, 2014). While this is likely to reflect differences in framework policies governing firm entry and exit and resource reallocation more generally, one could imagine that the adoption of digital technologies raises the productivity of R&D spending. Indeed, techno-optimists such as Joel Mokyr (2013) stress the potential for digital technologies to fuel future productivity growth by making advances in basic science more likely, which then feed back into new technologies in a virtuous cycle, via the so-called “artificial revelation”.
85. Finally, as sufficient time-series data on digital adoption becomes available, it would be interesting to explore the extent to which recent structural reforms in product and labour markets have translated into higher digital adoption rates. Time-series data on digital adoption would not only provide stronger identification to test the plausibility of the capabilities and incentives framework but would also provide scope for further testing policy complementarities. For example, recent firm-level evidence suggests that the favourable impact of lower policy-induced entry barriers on technological diffusion – as proxied by the catch-up of laggard firms to the global productivity frontier – is stronger in environments where the insolvency regime does not excessively penalise entrepreneurial failure (Adalet McGowan, Andrews and Millot, 2017b). A logical next step would be to test whether the same complementarity between entry and exit policy is relevant for digital adoption. In the same spirit, time-series data would allow investigating whether delays in digital adoption are related to a mismatch between the pace of market reforms (e.g. in the regulation of new business models, access and transfer of data or services sectors) and the speed of technical progress.
50 │ ECO/CPE/WP1(2018)8
GOING DIGITAL: WHAT DETERMINES TECHNOLOGY DIFFUSION AMONG FIRMS?For Official Use
References
Acemoglu, D., D. Autor, D. Dorn, G. Hanson and B. Price (2014), “The return of the Solow Paradox? IT, productivity and employment in US manufacturing”American Economic Review Papers and Proceedings.
Acemoglu, D., U. Akcigit, N. Bloom and W. Kerr (2013), “Innovation, Reallocation and Growth”, NBER Working Papers, No. 18993.
Adalet McGowan, M., D. Andrews and V. Millot (2017a), “The Walking Dead? Zombie Firms and Productivity Performance in OECD countries”, OECD Economics Department Working Paper, No 1372.
Adalet McGowan, M., D. Andrews and V. Millot (2017b), "Insolvency Regimes, Technology Diffusion and Productivity Growth: Evidence from Firms in OECD Countries", OECD Economics Department Working Papers, No. 1425, OECD Publishing, Paris. http://dx.doi.org/10.1787/36600267-en
Adalet McGowan. M. and D. Andrews (2015a), “Labour market mismatch and labour productivity: Evidence from PIAAC”, OECD Economics Department Working Papers No 1209.
Adalet McGowan, M. and D. Andrews (2015b), “Skill Mismatch and Public Policy in OECD Countries”, OECD Economics Department Working Papers, No. 1210, OECD Publishing, Paris. http://dx.doi.org/10.1787/5js1pzw9lnwk-en
Aghion, P., and R. Griffith (2005), Competition and growth, MIT Press.Andrews, D. C. Criscuolo and P. Gal (2016), “The Best versus the Rest: The Global Productivity
Slowdown, Divergence across Firms and the Role of Public Policy”, OECD Productivity Working Papers, No. 5.
Andrews, D., C. Criscuolo and P. Gal (2015), “Frontier Firms, Technology Diffusion and Public Policy: Micro Evidence from OECD Countries”, OECD Productivity Working Papers, No. 2. http://dx.doi.org/10.1787/5jrql2q2jj7b-en
Andrews, D., C. Criscuolo and C. Menon (2014), "Do Resources Flow to Patenting Firms?: Cross-Country Evidence from Firm Level Data," OECD Economics Department Working Papers, 1127, OECD Publishing.
Andrews, D. and F. Cingano (2014), “Public Policy and Resource Allocation: Evidence from Firms in OECD Countries”, Economic Policy, No. 29(78), pp. 253-296.
Andrews, D. and C. Criscuolo (2013), “Knowledge-Based Capital, Innovation and Resource Allocation”, OECD Economics Department Working Papers, No. 1046, OECD Publishing, Paris. http://dx.doi.org/10.1787/5k46bj546kzs-en
Autor, D.H. (2003), "Outsourcing at Will: the Contribution of Unjust Dismissal Doctrine to the Growth of Employment Outsourcing", Journal of Labor Economics, 21(1`), pp. 1-42.
Autor, D., F. Levy and R.J. Murnane (2003), “The skill content of recent technological change: an empirical exploration”, Quarterly Journal of Economics, 118(4): 1279-1333.
Baily, M.N. and N. Montalbano (2016), “Why is US productivity growth so slow? Possible explanations and policy responses”, Hutchins Center Working Paper, No. 22, Brookings Institution.
Bakhshi, H., A. Bravo-Biosca and J. Mateos-Garcia (2014), “Inside the datavores: Estimating the effect of data and online analytics on firm performance”, Nesta, www.nesta.org.uk/sites/default/files/inside_the_datavores_technical_report.pdf
Bartel, A., C. Ichniowski and K. Shaw (2007), “How does information technology affect productivity? Planr-level comparisons of product innovation, process improvement and worker skills”, Quarterly Journal of Economics, 122(4) : 1721-1758.

ECO/CPE/WP1(2018)8 │ 51
GOING DIGITAL: WHAT DETERMINES TECHNOLOGY DIFFUSION AMONG FIRMS?For Official Use
Bartelsman, E., J. Haltiwanger and S. Scarpetta (2009), “Measuring and Analyzing Cross-Country Differences in Firm Dynamics”, in T. Dunne, J.B. Jensen and M.J. Roberts (eds.), Producer Dynamics, University of Chicago Press for the NBER, Chicago, Ill.
Bartelsman, E., G. van Leeuwen and M. Polder (2017), “CDM using a cross-countrymicro-moments database”, Economics of Innovaion and New Technology, 26:1-2, 168-182.
Barth, E., A, Bryson, & J. C. Davis, and Richard Freeman (2016) “It’s Where You Work: Increases in Earnings Dispersion across Establishments and Individuals in the U.S.” Journal of Labor Economics 2016, 34:S2, S67-S97.
Bassanini, A., L. Nunziata and D. Venn (2009), “Job protection legislation and productivity growth in OECD countries”, Economic Policy, No. 24(58), pp. 349-402.
Beheshti, Hooshang M. & Cyrus M. Beheshti (2010), “Improving productivity and firm performance with enterprise resource planning”, Enterprise Information Systems, 4:4, 445-472, DOI: 10.1080/17517575.2010.511276
Berlingieri, G., P. Blanchenay and C. Criscuolo (2017), "The great divergence(s)", OECD Science, Technology and Industry Policy Papers, No. 39, OECD Publishing, Paris. http://dx.doi.org/10.1787/953f3853-en
Bloom, N., J. Liang, J. Roberts and Z. J. Ying (2015), “Does Working from Home Work? Evidence from a Chinese Experiment”, The Quarterly Journal of Economics, 165–218. doi:10.1093/qje/qju032.
Bloom, N., R. Sadun and J. Van Reenen (2012a), “Americans Do IT Better: US Multinationals and the Productivity Miracle”, American Economic Review 102(1): 167–201
Bloom, N., C. Genakos, R. Sadun and J. Van Reenen (2012b), “Management Practices Across Firms and Countries”, NBER Working Paper, No 17850.
Bloom, N., M. Draca and J. Van Reenen (2011), “Trade Induced Technical Change: The Impact of Chinese Imports on Innovation, Diffusion and Productivity”, Mimeo. http://www.stanford.edu/~nbloom/TITC.pdf
Bloom, N. and J. v. Reenen (2007), “Measuring and Explaining Management Practices Across Firms and Countries”, The Quarterly Journal of Economics, Volume 122, Issue 4, 1 November 2007, Pages 1351–1408, https://doi.org/10.1162/qjec.2007.122.4.1351
Bose, Ranjit (2002) "Customer relationship management: key components for IT success", Industrial Management & Data Systems, Vol. 102 Issue: 2, pp.89-97, https://doi.org/10.1108/02635570210419636
Brynjolfsson, E., D. Rock and C. Syverson (2017), “Artificial Intelligence and the Modern Productivity Paradox: A Clash of Expectations and Statistics”, NBER Working paper, No. 24001, NBER.
Brynjolfsson, E., A. McAfee (2014), The Second Machine Age: Work, Progress, and Prosperity in a Time of Brilliant Technologies, W.W. Norton & Co.
Brynjolfsson, E., L.M. Hitt and H.H. Kim (2011), “Strength in numbers: How does data-driven decisionmaking affect firm performance?”, Social Science Research Network, 22 April, http:// papers.ssrn.com/sol3/papers.cfm?abstract_id=1819486
Brynjolfsson, E., A. McAfee, M. Sorell and F. Zhu (2008), “Scale Without Mass: Business Process Replication and Industry Dynamics”, Harvard Business School Technology & Operations Mgt. Unit Research Paper, No. 07-016.
Brynjolfsson, E., A. Renshaw and V. Marshall Alstyne (1997), "The Matrix of Change: A Tool for Business Process Reengineering", Sloan Management Review, pp. 37-54.
Cette, G. and J. Lopez (2011), “ICT demand behaviour: an international comparison”, Economics of Innovation and New Technology,21:4, 397-410.
Ciccone, A., and E. Papaioannou (2007), “Red tape and delayed entry”, Journal of the European Economic Association, 5: 444–458.
Cincera, M. and R. Veugelers (2014), "Differences in the rates of return to R&D for European and US young leading R&D firms," Research Policy, Elsevier, vol. 43(8), pages 1413-1421.

52 │ ECO/CPE/WP1(2018)8
GOING DIGITAL: WHAT DETERMINES TECHNOLOGY DIFFUSION AMONG FIRMS?For Official Use
Comin, D. and M. Mestieri (2013), “If Technology Has Arrived Everywhere, Why Has Income Diverged?”, NBER Working Paper, No. 19010.
Criscuolo, C., P. Gal and C. Menon (2014), “The Dynamics of Employment Growth: New Evidence from 18 Countries”, OECD Science, Technology and Industry Policy Papers, No. 14, OECD Publishing, Paris. http://dx.doi.org/10.1787/5jz417hj6hg6-en
Da Rin, M., G. Nicodano A. Sembenelli (2006), “Public policy and the creation of active venture capital markets”, Journal of Public Economics 90, pp. 1699– 1723.
Decker, R., J. Haltiwanger, R. S. Jarmin and J. Miranda (2017), “Declining Dynamism, Allocative Efficiency, and the Productivity Slowdown”, FEDS Working Paper, No. 2017-019.
Decker, R., J. Haltiwanger, R.S. Jarmin, and J. Miranda (2016), “Declining Business Dynamism: Implications for Productivity?”, Brookings Institution, Hutchins Center Working Paper.
Dhyne, E., J. Konings, J. van den Bosch and S. Vanormelingen (2017), “IT and productivity: a firm level analysis”, paper presented at the OECD-IZA Workhsop on Labour Productivity and IT, Paris (October).
Égert, B., T. Koźluk and D. Sutherland (2009), “Infrastructure and Growth: Empirical Evidence”, OECD Economics Department Working Papers, No. 685, OECD Publishing, Paris, http://dx.doi.org/10.1787/ 225682848268.
European Commission (2018), “Broadband Cost Reduction Directive: Commission refers Bulgaria and the Netherlands to the Court and closes two cases”, Press Release, available at http://europa.eu/rapid/press-release_IP-18-352_en.htm
European Commission (2017a), “The BCO Network Support Facility”, available at https://ec.europa.eu/digital-single-market/sites/digital-agenda/files/bco_network_support_facility_-_activity_report_2017.pdf
European Commission (2017b), EURES, The European Job Mobility Portal, webpage, https://ec.europa.eu/eures/main.jsp?catId=8440&acro=living&lang=en&parentId=7 783&countryId=IT&living= (Accessed on 17 April 2017).
Eurostat (2016), “Cloud Computing – statistics on the use by enterprises”, Statistics Explained (http://ec.europa.eu/eurostat/statistics-explained/index.php/Cloud_computing_-_statistics_on_the_use_by_enterprises)
European Commission/EACEA/Eurydice (2015), “Adult Education and Training in Europe: Widening Access to Learning Opportunities”, Eurydice Report. Luxembourg: Publications Office of the European Union.
Fabling, R., and A. Grimes (2016), “Picking up speed: Does ultrafast broadband increase productivity?”, Motu Working Paper 16-22, Motu Economic and Public Policy Research (November).
Falck, O. and S. Wiederhold (2015), ICT skills are highly valued in European labor markets, September 2015.
Financial Times (19.11.2017), Companies face high costs to meet new EU data rules. Gartner (2017), “Market Share Analysis: ERP Software Worldwide, 2016”, Gartner.Gonçalves, Maria Eduarda (2017): “The EU data protection reform and the challenges of big data:
remaining uncertainties and ways forward”, Information & Communications Technology Law, 26:2, 90-115. DOI: 10.1080/13600834.2017.1295838
Griffith, R. and G. Macartney (2010), "Employment Protection Legislation, Multinational Firms and Innovation", CEPR Discussion Papers, No. 7628.
Griffith, T., Zammuto, R., & Aiman-Smith, L. (1999), Why new technologies fail, Industrial Management (DesPlaines), 29–34.
Guellec, D. and C. Paunov (2017), “Digital Innovation and the Distribution of Income”, NBER Working Paper, No. 23987.
Guerrieri, P., M. Luciani and V. Meliciani (2011), “The determinants of investment in information and communication technologies”,Economics of Innovation and New Technology, 20:4, 387-403.

ECO/CPE/WP1(2018)8 │ 53
GOING DIGITAL: WHAT DETERMINES TECHNOLOGY DIFFUSION AMONG FIRMS?For Official Use
Hall, B.H. and J. Lerner (2009), "The Financing of R&D and Innovation", NBER Working Paper No. 15325.
Haltiwanger, J., S. Scarpetta and H. Schweiger (2006), "Assessing Job Flows Across Countries: The Role of Industry, Firm Size and Regulations", IZA discussion paper No. 2450, Bonn.
Hanushek E.A., and L. Woessmann (2012):” Do better schools lead to more growth? Cognitive skills, economic outcomes, and causation”, Springer Science + Business Media, LLC 2012.
Hathaway, I, and R.E. Litan (2014), “Declining business dynamism in the United States: a look at States and Metros”, Economic Studies, Brookings Institution, Washington D.C.
Henderson, R. (1993). "Underinvestment and Incompetence as Responses to Radical Innovation: Evidence from the Photolithographic Alignment Equipment Industry", RAND Journal of Economics. 24(2) pp. 248–270.
Hernández-Mogollon, R., G.l Cepeda-Carrión, J.G. Cegarra‐Navarro, A. Leal‐Millán, (2010) "The role of cultural barriers in the relationship between open‐mindedness and organizational innovation", Journal of Organizational Change Management, Vol. 23 Issue: 4, pp.360-376, https:// doi.org/10.1108/09534811011055377
Hong, K., & Kim, Y. (2002), “The critical success factors for ERP implementation: An organizational fit perspective”, Information & Management, 40(1), 25–40.
Hunton, James E., Barbara Lippincott, Jacqueline L. Reck (2003): “Enterprise resource planning systems: comparing firm performance of adopters and nonadopters”, International Journal of Accounting Information Systems, Vol. 4, p. 165-184.
Klapper, L., L. Laeven and R. Rajan (2006), "Entry Regulation as a Barrier to Entrepreneurship", Journal of Financial Economics, 82, pp. 591-629.
Koske, I., I.Wanner, R. Bitetti and O. Barbiero (2015), “The 2013 update of the OECD product market regulation indicators: policy insights for OECD and non-OECD countries”, OECD Economics Department Working Papers, No. 1200.
Kumar, V., Maheshwari, B., & Kumar, U. (2003), An investigation of critical management issues in ERP implementation: Empirical evidence from Canadian organizations, Technovation, 23(10), 793–808.
Machin, S. and J. van Reenen (1998), “Technology and changes in skill structure: evidence from seven OECD countries”, Quarterly Journal of Economics, 113(4): 1215-1244
Marcolin, L., S. Miroudot and M. Squicciarini (2016), “The Routine Content Of Occupations: New Cross-Country Measures Based On PIAAC”, OECD Trade Policy Papers, No. 188, OECD Publishing, Paris.
McKinsey Global Institute (2018), Solving the Productivity Puzzle: The Role of Demand and the Promise of Digitization, McKinsey and Company.
Mokyr, J., (2013), “Is technological progress a thing of the past?”, VoxEU, https://voxeu.org/article/technological-progress-thing-past
OECD (2017a), Going Digital: Making the Transformation Work for Growth and Well-Being, Meeting of the OECD Council at Ministerial Level, Paris, 7-8 June 2017.
OECD (2017b), OECD Digital Economy Outlook 2017, OECD Publishing, Paris.http://dx.doi.org/10.1787/9789264276284-en
OECD (2017c), OECD Territorial Reviews: Northern Sparsely Populated Areas, OECD Publishing, Paris. http://dx.doi.org/10.1787/9789264268234-en
OECD (2017d), Tax and Skills, OECD Publishing, Paris. http://dx.doi.org/10.1787/9789264269385-enOECD (2017e), OECD Economic Surveys: Italy 2017, OECD Publishing, Paris.
http://dx.doi.org/10.1787/eco_surveys-ita-2017-enOECD (2017f), OECD Science, Technology and Industry Scoreboard 2017: The digital transformation,
OECD Publishing, Paris http://dx.doi.org/10.1787/9789264268821-enOECD (2016a), “Skills for a Digital World: 2016 Ministerial Meeting on the Digital Economy
Background Report", OECD Digital Economy Papers, No. 250, OECD Publishing, Paris. http://dx.doi.org/10.1787/5jlwz83z3wnw-en

54 │ ECO/CPE/WP1(2018)8
GOING DIGITAL: WHAT DETERMINES TECHNOLOGY DIFFUSION AMONG FIRMS?For Official Use
OECD (2016b), OECD Employment Outlook 2016, OECD Publishing, http://dx.doi.org/10.1787/empl_outlook-2016-en
OECD (2016c), Education at a Glance 2017: OECD Indicators, OECD Publishing, Paris. http://dx.doi.org/10.1787/eag-2017-en
OECD (2016d), Skills Matter: Further Results from the Survey of Adult Skills, OECD Skills Studies, OECD Publishing, Paris. http://dx.doi.org/10.1787/9789264258051-en
OECD (2015), The Future of Productivity, OECD Publishing, http://dx.doi.org/10.1787/9789264248533-en
OECD (2013), Supporting Investment in Knowledge Capital, Growth and Innovation, OECD Publishing, Paris, http://dx.doi.org/10.1787/9789264193307-en.
OECD (2012), “ICT skills and employment: New competences and jobs for a greener and smarter economy”, OECD Digital Economy Papers, No. 198, OECD Publishing, Paris. http://dx.doi.org/10.1787/5k994f3prlr5-en.
Oliveira, T. and Martins (2011), “Literature review of IT adoption models at firm level”, The Electronic Journal Information Systems Evaluation, 14(1) : 110-121.
Ollivaud, P., Y. Guillemette and D. Turner (2016), “The Links between Weak Investment and the Slowdown in OECD Productivity and Potential Output Growth”, OECD Economics Department Working Papers, No. 1304.
Panorama Consulting Solution (2015); “Key findings - The 2015 ERP Report”, available at https://www.panorama-consulting.com/key-findings-from-the-2015-erp-report/
Parente, S. L. and E. C. Prescott. (1999). "Monopoly Rights: A Barrier to Riches." American Economic Review, 89 (5): 1216-1233.Pellegrino, B. and L. Zingales (2017): “Diagnosing the Italian Disease”, NBER Working Paper, No.
23964. Perla, J., C. Tonetti and M. E. Waugh (2015), "Equilibrium Technology Diffusion, Trade, and Growth,"
NBER Working Papers, No. 20881, National Bureau of Economic Research, Inc.Rajan, R. and L. Zingales (1998), “Financial dependence and growth”, American Economic Review, Vol.
88, pp.559-586. Saia, A., D. Andrews and S. Albrizio (2015), “Productivity Spillovers from the Global Frontier and
Public Policy: Industry-Level Evidence”, OECD Economic Department Working Paper, No. 1238, OECD Publishing.
Schwab, Klaus (2017): “The Global Competitiveness Report 2016–2017”, World Economic Forum. Song, J., D. J. Price, F. Guvenen, N. Bloom & T. v. Wachter (2015), “Firming Up Inequality”, NBER
Working Paper, No. 21199.Stevenson, Betsey (2008): "The Internet and Job Search," NBER Working Papers No 13886, National
Bureau of Economic Research, Inc. Wasmer, E. (2006), "Interpreting Europe-US Labor Market Differences: the Specificity of Human
Capital Investments", American Economic Review, 96(3), pp. 811-31.Zhang, Z., Lee, M., Huang, P., Zhang, L., & Huang, X. (2005), A framework of ERP systems
implementation success in China: An empirical study, International Journal of Production Economics, 98(1), 56–80.

ECO/CPE/WP1(2018)8 │ 55
GOING DIGITAL: WHAT DETERMINES TECHNOLOGY DIFFUSION AMONG FIRMS?For Official Use
Annex A. Description of the data and variables used
Table A.1. Description of variables and sources
Description Coverage Source Link
Digital
Technologies
Broadband Enterprises with broadband access (fixed or
mobile) (E_BROAD2)
2010-15 Eurostat - Digital economy
and society statistics -
households and individuals
http://ec.europa.eu/eurostat/
web/digital-economy-and-
society/data/comprehensive-
database
High-speed
Broadband
Maximum contracted download speed of the
fastest internet connection is at least 30 Mb/s
(e_ispdf_ge30)
2014-2016 Eurostat - Digital economy
and society statistics -
households and individuals
http://ec.europa.eu/eurostat/
web/digital-economy-and-
society/data/comprehensive-
database
CC Buy cloud computing services used over the
internet (E_CC)
2014-2016 Eurostat - Digital economy
and society statistics -
households and individuals
http://ec.europa.eu/eurostat/
web/digital-economy-and-
society/data/comprehensive-
database
CC complex Buy high CC services (accounting software
applications, CRM software, computing
power)(E_CC_HI)
2014-2016 Eurostat - Digital economy
and society statistics -
households and individuals
http://ec.europa.eu/eurostat/
web/digital-economy-and-
society/data/comprehensive-
database
ERP Enterprises who have ERP software package to
share information between different functional
areas (E_ERP1)
2010; 2012-
15
Eurostat - Digital economy
and society statistics -
households and individuals
http://ec.europa.eu/eurostat/
web/digital-economy-and-
society/data/comprehensive-
database
CRM Enterprises using software solutions like
Customer Relationship Management (CRM)
2010; 2014-
2015
Eurostat - Digital economy
and society statistics -
households and individuals
http://ec.europa.eu/eurostat/
web/digital-economy-and-
society/data/comprehensive-
database
Incentives
EPL Strictness of employment protection (Collective
and individual dismissal, regular contracts,
Version 3)
2010-13 OECD Indicators of
Employment Protection
http://dotstat.oecd.org//Index.
aspx?QueryId=79221
Insolvency
regimes
Aggregate insolvency indicator (Insol-13) 2010 OECD Insolvency Regime
Indicators
http://www.oecd.org/eco/gro
wth/exit-policies-and-
productivity-growth.htm
Venture Capital Total Venture capital expressed as a percentage
of GDP
2010-15 Eurostat https://data.europa.eu/euodp
/data/dataset/V1eagdIL3oK5
ZPzkT0PCZw
Barrier to
services sectors
PMR subcomponent of Administrative barriers to
start-ups
2013 OECD Product Market
Regulation Index
For more information see
Koske et al. (2015)
Administrative
barriers to start-
ups
PMR subcomponent of barriers to
entrepreneurship
2013 OECD Product Market
Regulation Index
For more information see
Koske et al. (2015)
Digital trade
restrictions
Aggregate Digital Trade Restrictiveness Index (data
published in
2018)
European Centre for
International Political
Economy
http://ecipe.org/dte/database/
Tax incentives Indirect government support through R&D tax
incentives
2013 OECD Science, Technology
and Industry Scoreboard
2015 - © OECD 2015
http://dx.doi.org/10.1787/sti_
scoreboard-2015-en
Capabilities
Quality of
Management
school
Quality of management schools, 1-7(best)
(Weighted average 14-15)
Average
2014-15
The Global Competitiveness
Report 2015–2016 (2016),
World Economic Forum
http://reports.weforum.org/gl
obal-information-technology-
report-2016/technical-notes-
and-sources/
High
performance
Share of jobs with high HPWPa (all factors) in % Average
2012;2015
OECD Programme for the
International
http://dx.doi.org/10.1787/888
933273688

56 │ ECO/CPE/WP1(2018)8
GOING DIGITAL: WHAT DETERMINES TECHNOLOGY DIFFUSION AMONG FIRMS?For Official Use
work practices Assessment of Adult
Competencies (PIAAC)
Lifelong learning Share of adults participation in lifelong learning Average
2012;2015
OECD Programme for the
International
Assessment of Adult
Competencies (PIAAC)
For more information see
Adalet McGowan and
Andrews (2015).
Percentage of
low skilled in
training
Participation in formal and/or non-formal
education level 0-2
Average
2012;2015
OECD Programme for the
International
Assessment of Adult
Competencies (PIAAC)
http://dx.doi.org/10.1787/888
933398714
Percentage of
high skilled in
training
Participation in formal and/or non-formal
education level 3-5
Average
2012;2015
OECD Programme for the
International
Assessment of Adult
Competencies (PIAAC)
http://dx.doi.org/10.1787/888
933398714.
Percentage of
adults with no
ICT skills
Percentage share of adults (15-65) with no ICT
experience
2013 OECD Programme for the
International
Assessment of Adult
Competencies (PIAAC)
http://dx.doi.org/10.1787/888
933454580
ICT training ICT training provided to employees (other than
ICT specialists) (ITUST2)
2012; 2014-
16
Eurostat - Digital economy
and society statistics -
households and individuals
http://ec.europa.eu/eurostat/
web/digital-economy-and-
society/data/comprehensive-
database
E-Government Individuals using the Internet to interact with
public authorities, as a percentage of the
population in each age group
2016 OECD Science, Technology
and Industry Scoreboard
2017
http://dx.doi.org/10.1787/978
9264268821-en
Skill mismatch Share of over- and under-skilled workers. 2011-12 Adalet McGowan, M. and D.
Andrews (2015)
https://www.oecd.org/eco/gro
wth/Skill-mismatch-and-
public-policy-in-OECD-
countries.pdf
Exposure variable
Firm Turnover
The sum of industry-level entry and exit rates for
the United States over the period 1987-1997.
The entry rate is defined as the ratio of new firms
to the total number of active firms in a given
year. The exit rate is defined as the ratio of firms
exiting the market in a given year to the total
number of active firms in the previous year.
1988-97Bartelsmann, Haltiwanger
and Scarpetta (2009)
External
Financial
Dependency
Industry external finance dependency (USA) 1980’sRajan, R. and L. Zingales
(1998)
Knowledge
Intensity
Share of labour compensation of personnel with
tertiary education (USA)1995-2000 OECD (2013)
http://dx.doi.org/10.1787/978926
4193307-en
Job Turnover Industry turnover rate (job turnover) 2001-2003Bassanini, Nunziata and
Venn (2009)
Share of
computer
services inputs
Share computer service (ISIC Rev4 sector C72:
Computer and related activities) purchases,
percentage of total purchases by sector
2011 OECD Input-Output tables OECD Stat
(http://dotstat.oecd.org//Index
.aspx?QueryId=83880)
Routine tasks Share of high routine employment 2010-15 Marcolin et al. (2016), based
on the OECD Programme
for the International
Assessment of Adult
Competencies (PIAAC) and European Labour Force
Survey (1995-2015).
Table A.2. Country coverage
Austria Germany Ireland Netherlands Slovenia
Belgium Finland Italy Norway Spain
Czech Republic France Iceland Portugal Sweden

ECO/CPE/WP1(2018)8 │ 57
GOING DIGITAL: WHAT DETERMINES TECHNOLOGY DIFFUSION AMONG FIRMS?For Official Use
Denmark Greece Lithuania Poland Turkey
Estonia Hungary Latvia Slovakia United Kingdom
Table A.3. Summary statistics (average values)
. Obs Mean Std. Dev. Min Max
Digital Technologies
Broadband 584 0.946802 0.051133 0.695283 1
High-speed Broadband 482 0.354903 0.181625 0.083697 0.957265
Cloud Computing 471 0.242504 0.158422 0.027143 0.886937
Cloud Computing (high) 460 0.138761 0.113644 0 0.652319
ERP 561 0.317957 0.172684 0 0.892771
CRM 552 0.341974 0.188405 0 1
SCM 512 0.213778 0.109067 0 0.634383
Big data 376 0.121444 0.074436 0.00941 0.442308
Social Media 523 0.420708 0.184788 0 0.918744
Incentives
EPL 625 2.529961 0.343966 1.721089 3.204082
Insolvency regimes 550 0.486888 0.118902 0.130769 0.7
Venture Capital 401 0.0311 0.020665 0.002556 0.075
Barriers in services sectors 630 3.480308 0.67593 1.365741 4.615741
Administrative barriers to start-ups 630 2.00624 0.479206 1.121914 3.080247
Digital trade restrictions 626 .2152077 .0634429 .11 .38
Tax incentives 551 0.7306 0.070 0 0.26
Capabilities
Quality of Management school 626 4.883414 0.716024 3.687408 6.099314
High performance work practices 500 26.05715 9.044642 10.17509 41.6223
Lifelong learning 425 50.72941 12.42818 24.3 66.8
Percentage of low skilled in training 450 35.06356 11.61629 15.84475 51.69505
Percentage of high skilled in training 450 63.76499 13.37589 31.32726 80.72747
Percentage of adults with no ICT skills 425 20.15593 11.16819 7.243739 43.25481
ICT training 520 0.243814 0.158819 0.02228 0.884082
E-Government 551 55.817.1 17.1 24.1 85
Skill mismatch 525 25.57619 5.604652 18.1 38.3
Exposure Variables
Firm Turnover (turn) 600 20.05418 3.286501 11.66 26.418
External Financial Dependency (EDF) 550 1.323394 1.32947 -0.19 3.35
Knowledge Intensity (KI) 625 0.422533 0.163885 0.17 0.62
Job turnover 525 44.36817 12.2063 26.69683 88.41486
Share of computer services inputs 625 3.05 2.57 0.57 8.31
Routine tasks 500 0.155 0.11 0.008 0.4
Note: This table presents summary statistics for the entire dataset, i.e. over 25 countries and 25 non-farming business sectors.
Table A.4. Summary statistics for digital technologies, by year
Variable Year Observations Mean Std. Dev. Min Max
High-speed broadband connections 2014 554 0.292277 0.179788 0 0.844943
High-speed broadband connections 2015 569 0.341266 0.192667 0 0.92
High-speed broadband connections 2016 578 0.386863 0.196471 0 1
ERP 2010 634 0.232888 0.159553 0 0.869444
ERP 2012 568 0.254056 0.1543 0 0.81877

58 │ ECO/CPE/WP1(2018)8
GOING DIGITAL: WHAT DETERMINES TECHNOLOGY DIFFUSION AMONG FIRMS?For Official Use
ERP 2013 567 0.297989 0.165386 0 0.8075
ERP 2014 554 0.335103 0.184815 0.009897 1
ERP 2015 548 0.366436 0.183516 0.032499 1
CRM 2010 610 0.305617 0.196722 0 1
CRM 2014 565 0.298077 0.176049 0.016865 1
CRM 2015 573 0.324962 0.171728 0.028658 1
Cloud Computing 2014 574 0.204861 0.156336 0 0.886937
Cloud Computing 2015 346 0.215508 0.164838 0.003937 0.824419
Cloud Computing 2016 501 0.241223 0.168425 0 0.854624
Cloud Computing (high) 2014 550 0.113735 0.107308 0 0.666894
Cloud Computing (high) 2015 321 0.119671 0.110832 0 0.64928
Cloud Computing (high) 2016 552 0.134412 0.122234 0 0.675505
Note: This table presents summary statistics for the entire dataset, i.e. over 25 countries and 25 non-farming business sectors.
Table A.5. Average adoption rates by industry (2010-2016)
NACE
Rev 2Description ERP CRM CC
CC
(complex)
10-12 Manufacture of beverages, food and tobacco products 0.271245 0.188223 0.179248 0.099456
13-15 Manufacture of textiles, wearing apparel, leather and related
products
0.308204 0.212234 0.181328 0.084579
16-18 Manufacture of wood & products of wood & cork, except furniture;
articles of straw & plaiting materials; paper & paper products;
printing & reproduction of recorded media
0.291412 0.26719 0.188538 0.090067
19-23 Manufacture of coke, refined petroleum, chemical & basic
pharmaceutical products, rubber & plastics, other non-metallic
mineral products
0.42955 0.326845 0.227648 0.112065
24-25 Manufacture of basic metals & fabricated metal products excluding
machines & equipments
0.333373 0.248728 0.178942 0.080149
26 Manufacture of computer, electronic and optical products 0.556172 0.447013 0.278731 0.147594
27-28 Manufacture of electrical equipment, machinery and equipment
n.e.c.
0.455789 0.352506 0.187869 0.086747
29-30 Manufacture of motor vehicles, trailers and semi-trailers, other
transport equipment
0.501986 0.276797 0.212032 0.095408
31-33 Manufacture of furniture and other manufacturing; repair and
installation of machinery and equipment
0.272652 0.228846 0.191396 0.094772
35_39 Electricity, gas, steam, air conditioning and water supply 0.341647 0.32225 0.259049 0.133773
41_43 Construction 0.156103 0.144789 0.199024 0.112612
45 Trade of motor vehicles and motorcycles 0.301579 0.427382 0.182405 0.115079
46 Wholesale trade, except of motor vehicles and motorcycles 0.402495 0.393588 0.235896 0.130059
47 Retail trade, except of motor vehicles and motorcycles 0.22922 0.238353 0.177975 0.103962
49_53 Transportation and storage ) 0.198024 0.203841 0.195679 0.103173
55_56 Accommodation and Food and beverage service activities 0.111989 0.16216 0.165641 0.104095
58-60 Publishing activities; motion picture, video & television programme
production, sound recording & music publishing; programming &
broadcasting
0.330037 0.42285 0.385612 0.247627
61 Telecommunications 0.480137 0.659599 0.389523 0.254364
62-63 Computer programming, consultancy and related activities,
information service activities
0.445565 0.605442 0.555143 0.402173
64 Other monetary intermediation, other credit granting 0.295902 0.607317
65 Insurance, reinsurance 0.409749 0.613659
66 Security and commodity contracts brokerage, other activities
auxiliary to financial services, except insurance and pension funding
0.199761 0.458276

ECO/CPE/WP1(2018)8 │ 59
GOING DIGITAL: WHAT DETERMINES TECHNOLOGY DIFFUSION AMONG FIRMS?For Official Use
68 Real estate activities 0.225138 0.284749 0.256101 0.153134
69-74 Professional, scientific and technical activities 0.256945 0.333358 0.337497 0.203696
77-82 Administrative and support service activities 0.199038 0.279514 0.250756 0.161046
Note: This table reports average adoption rates across industries for a set of 25 countries (see Table A.2 for coverage) over the time period 2010-2016 (depending on data availability). Source: based on Eurostat, Digital Economy and Society (database), http://ec.europa.eu/eurostat/web/digital-economy-and-society/data/comprehensivedatabase (accessed September 2017).

60 │ ECO/CPE/WP1(2018)8
GOING DIGITAL: WHAT DETERMINES TECHNOLOGY DIFFUSION AMONG FIRMS?For Official Use
Figure A.1. Enterprises using cloud computing services, by firm size, 2016
As a percentage of enterprises in each employment size class.
Finland
Swed
en
Japa
n
Bra
zil
Icelan
d
Den
mar
k
Nor
way
Irelan
d
Unite
d Kingd
om
Net
herla
nds
Can
ada
Belgium
Aus
tralia
OECD
Switz
erland
Eston
ia
Slove
niaIta
ly
Luxe
mbo
urg
Spa
in
Cze
ch R
epub
lic
Por
tuga
l
Slova
k Rep
ublic
Fra
nce
Aus
tria
Lith
uania
Ger
man
y
Kor
ea
Hun
gary
Tur
key
Gre
ece
Mex
ico
Latvia
Polan
d
0
20
40
60
80
100
% All enterprises 10-49 50-249
250+
Note: Cloud computing refers to ICT services used over the Internet as a set of computing resources to access software, computing power, storage capacity and so on. Data refer to manufacturing and non-financial market services enterprises with ten or more persons employed, unless otherwise stated. OECD data are based on a simple average of the available countries. For country exceptions, see note 5 at the end of the chapter.Source: OECD (2017b) based on ICT Access and Usage by Businesses (database), http://oe.cd/bus (accessed June 2017).
Figure A.2. Use of enterprise resource planning software, by firm size, 2015
As a percentage of enterprises in each employment size class
Ger
man
y
Belgium
Den
mar
k
Net
herla
nds
Por
tuga
l
Swed
en
Aus
tria
Lith
uania
Fra
nce
Luxe
mbo
urg
Gre
ece
Finland
Italy
Kor
ea
Spa
in
Slove
nia
Nor
way
Slova
k Rep
ublic
Cze
ch R
epub
lic
Bra
zil
Switz
erland
Irelan
d
Eston
ia
Can
ada
Polan
d
Tur
key
Unite
d Kingd
om
Hun
gary
Latvia
Icelan
d
0
20
40
60
80
100
% All enterprises 10-49 50-249 250+ All enterprises, 2010
Note: Unless otherwise stated, sector coverage consists of all activities in manufacturing and non-financial market services. Only enterprises with ten or more persons employed are considered. Source: OECD (2017b) based on ICT Access and Usage by Businesses (database), http://oe.cd/bus (accessed June 2017).
Table A.6. High-speed broadband connections are critical to the adoption of all digital
Dependent variable: percentage of firms >10 employees adopting the digital technology
Technology ERP CRM CC CC High

ECO/CPE/WP1(2018)8 │ 61
GOING DIGITAL: WHAT DETERMINES TECHNOLOGY DIFFUSION AMONG FIRMS?For Official Use
High Speed Internet (>30 Mbit/s) 0.214*** 0.248*** 0.178*** 0.110***
(0.0477) (0.0425) (0.0378) (0.0343)
Constant 0.372*** 0.385*** 0.112*** 0.0504**
(0.0303) (0.0264) (0.0204) (0.0196)
Observations 477 477 456 435
R-squared 0.850 0.876 0.906 0.845
Note: The results show estimates for the percentage of firms adopting ERP, CRM or CC technologies regressed on the percentage of firms using high-speed internet, country and industry fixed effects; ***, ** and * represent p<0.01, p<0.05 and p<0.1 respectively.
Table A.7. The enabling role of Cloud Computing for ERP and CRM adoption
ERP CRM
High-speed internet 0.208*** 0.151***
-0.0646 -0.0529
Cloud Computing 0.173** 0.472***
-0.081 -0.0607
Constant 0.345*** 0.336***
-0.0296 -0.0207
Observations 452 453
R-squared 0.855 0.898
Note: The results show the role of Cloud Computing for the adoption of Enterprise Resource Planning and Customer Relationship Management software. Regressions also account for the percentage of firms using high-speed internet, country and industry fixed effects; ***, ** and * represent p<0.01, p<0.05 and p<0.1 respectively.
Table A.8. Correlations across digital technologies
BroadbandHigh-speed
broadband
Cloud
Computing
Cloud
Computing
(complex)
ERP CRM
Broadband 1
High-speed
broadband0.098** 1
Cloud Computing -0.0079 0.2252*** 1
Cloud Computing
(complex)-0.1074** 0.1598*** 0.7279*** 1
Enterprise
Resource
Planning
0.1599*** 0.206*** 0.1257*** 0.0656 1
Customer
Relationship
Management
0.084** 0.2518*** 0.3562*** 0.3097*** 0.4689*** 1
Note: ***, ** and * represent p<0.01, p<0.05 and p<0.1 respectively.
Figure A.3. The quality of management

62 │ ECO/CPE/WP1(2018)8
GOING DIGITAL: WHAT DETERMINES TECHNOLOGY DIFFUSION AMONG FIRMS?For Official Use
Panel A. HighPerformance Work Practices (HPWP) across countries
Share of jobs with high and mean HPWP score (average value, across jobs, of the HPWP index), 2012, 2015
GRC
TUR
ITA
SVK
KOR
FRA
CHL
GBR-N
IR IRL
SVN
POL
ESP
DEU
JPN
EST
AUS
NOR
CZE
CAN
GBR-E
NG
USA
ISR
NZL
NLD
AUT
BEL
SW
EFIN
DNK
0
5
10
15
20
25
30
35
40
45
2.3
2.4
2.5
2.6
2.7
2.8
2.9
3.0
3.1
Percentage of jobs with high HPWP (left) Mean HPWP index
(right)
Note: This figure shows the variation in high performance work practices across OECD countries. The index is constructed using data from the OECD Programme for the Assessment of Adult Competencies (PIAAC) and is based on a set of 9 indicators that are broadly categorized as ‘work organisation’ and ‘management practices’. ‘High’ HPWP refers to the top 25th percentile of the pooled distribution. Data for Belgium corresponds to Flanders.Source: OECD (2016b)
Panel B. The quality of management schools
Index 1-7 (best)
SVK
TUR
GRC
POL
CZE
HUN
LTU
SVN
LVA
EST
AUT
ITA
DEU
NOR
DNK
IRL
ISL
PRT
SW
EFIN
NLD
FRA
ESP
GBR
BEL
0
1
2
3
4
5
6
7
Note: Based on the question: “In your country, how would you assess the quality of business schools? [1 = extremely poor—among the worst in the world; 7 = excellent—among the best in the world]”; 2013–14 weighted average. Source: World Economic Forum, Executive Opinion Survey
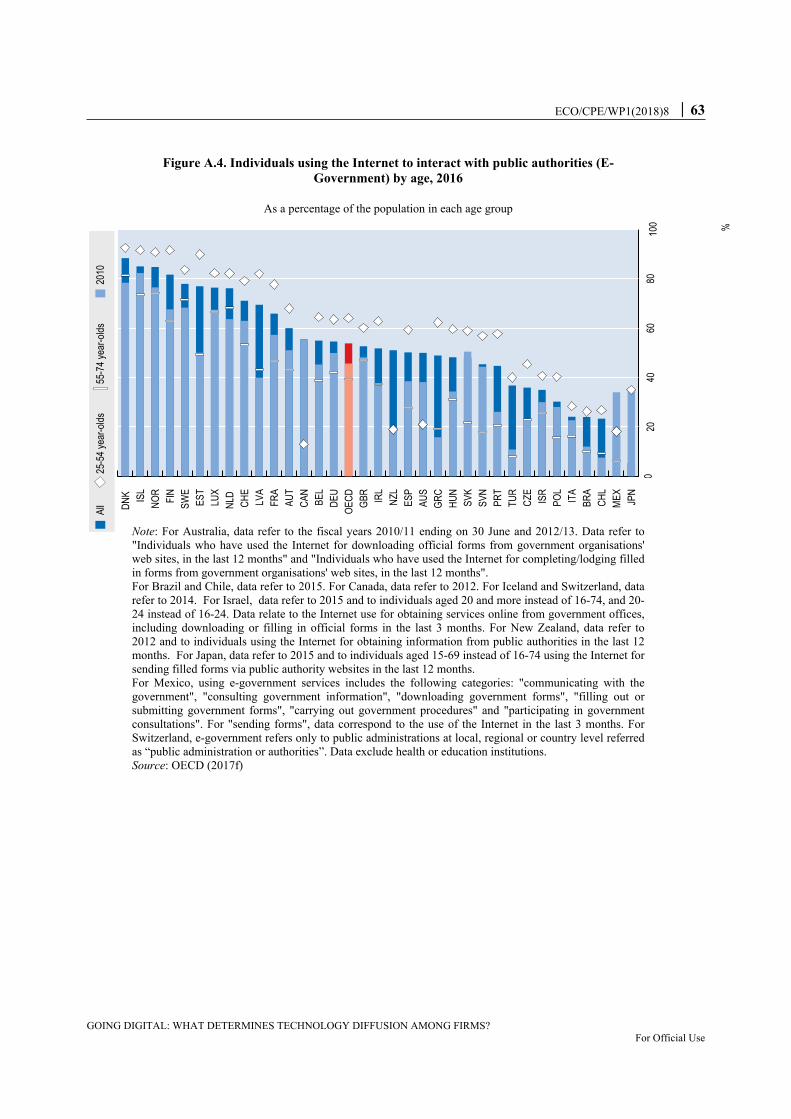
ECO/CPE/WP1(2018)8 │ 63
GOING DIGITAL: WHAT DETERMINES TECHNOLOGY DIFFUSION AMONG FIRMS?For Official Use
Figure A.4. Individuals using the Internet to interact with public authorities (E- Government) by age, 2016
As a percentage of the population in each age group
JP
N
ME
X
CH
L
BR
A
ITA
PO
L
ISR
CZ
E
TU
R
PR
T
SV
N
SV
K
HU
N
GR
C
AU
S
ES
P
NZ
L
IRL
GB
R
OE
CD
DE
U
BE
L
CA
N
AU
T
FR
A
LV
A
CH
E
NL
D
LU
X
ES
T
SW
E
FIN
NO
R
ISL
DN
K
02
04
06
08
01
00
%
A
ll
2
5-5
4 y
ea
r-o
lds
5
5-7
4 y
ea
r-o
lds
2
01
0
Note: For Australia, data refer to the fiscal years 2010/11 ending on 30 June and 2012/13. Data refer to "Individuals who have used the Internet for downloading official forms from government organisations' web sites, in the last 12 months" and "Individuals who have used the Internet for completing/lodging filled in forms from government organisations' web sites, in the last 12 months".For Brazil and Chile, data refer to 2015. For Canada, data refer to 2012. For Iceland and Switzerland, data refer to 2014. For Israel, data refer to 2015 and to individuals aged 20 and more instead of 16-74, and 20-24 instead of 16-24. Data relate to the Internet use for obtaining services online from government offices, including downloading or filling in official forms in the last 3 months. For New Zealand, data refer to 2012 and to individuals using the Internet for obtaining information from public authorities in the last 12 months. For Japan, data refer to 2015 and to individuals aged 15-69 instead of 16-74 using the Internet for sending filled forms via public authority websites in the last 12 months.For Mexico, using e-government services includes the following categories: "communicating with the government", "consulting government information", "downloading government forms", "filling out or submitting government forms", "carrying out government procedures" and "participating in government consultations". For "sending forms", data correspond to the use of the Internet in the last 3 months. For Switzerland, e-government refers only to public administrations at local, regional or country level referred as “public administration or authorities”. Data exclude health or education institutions.Source: OECD (2017f)

64 │ ECO/CPE/WP1(2018)8
GOING DIGITAL: WHAT DETERMINES TECHNOLOGY DIFFUSION AMONG FIRMS?For Official Use
Figure A.5. Education and training
Panel A. Many adults still lack basic computer skills
Percentage share of adults (15-65) with insufficient or no ICT experience
SW
E
NL
D
NO
R
DN
K
GB
R
CA
N
US
A
BE
L
FIN
DE
U
AU
S
OE
CD
AU
T
KO
R
FR
A
CZ
E
ES
T
JP
N
IRL
ES
P
SV
K
ITA
PO
L
0
5
10
15
20
25
30
35
40
45
%
Source: OECD (2016d)
Panel B. Participation of adults in education and training by skill level
Share of adults (25-65 year-olds) participating in formal and/or non-formal education and training by literacy level, 2012 or 2015
NZ
L
NO
R
DN
K
SW
E
NL
D
FIN
US
A
CH
L
CA
N
ES
T
ISR
IRL
CZ
E
SV
N
ES
P
DE
U
AU
S
AU
T
KO
R
JP
N
FR
A
PO
L
TU
R
ITA
SV
K
GR
C
0
10
20
30
40
50
60
70
80
90
100
%
1st quartile Gap 1st and 3rd quartiles Average Lowest Highest
Note: Participation in formal and/or non-formal education refers to participation in the 12 months prior to the survey. Columns showing data broken down by gender are available for consultation on line (see Statlink below. For Chile, Greece, Israel, Lithuania, New Zealand, Singapore, Slovenia and Turkey, the year of reference is 2015. For all other countries it is 2012.Source: OECD (2016c), Education at a Glance 2016: OECD indicators, OECD Publishing, Paris, http://dx.doi.org/10.1787/888933398714.
Figure A.6. Entry and exit
Panel A. Indicators of Product Market Regulations, 2013
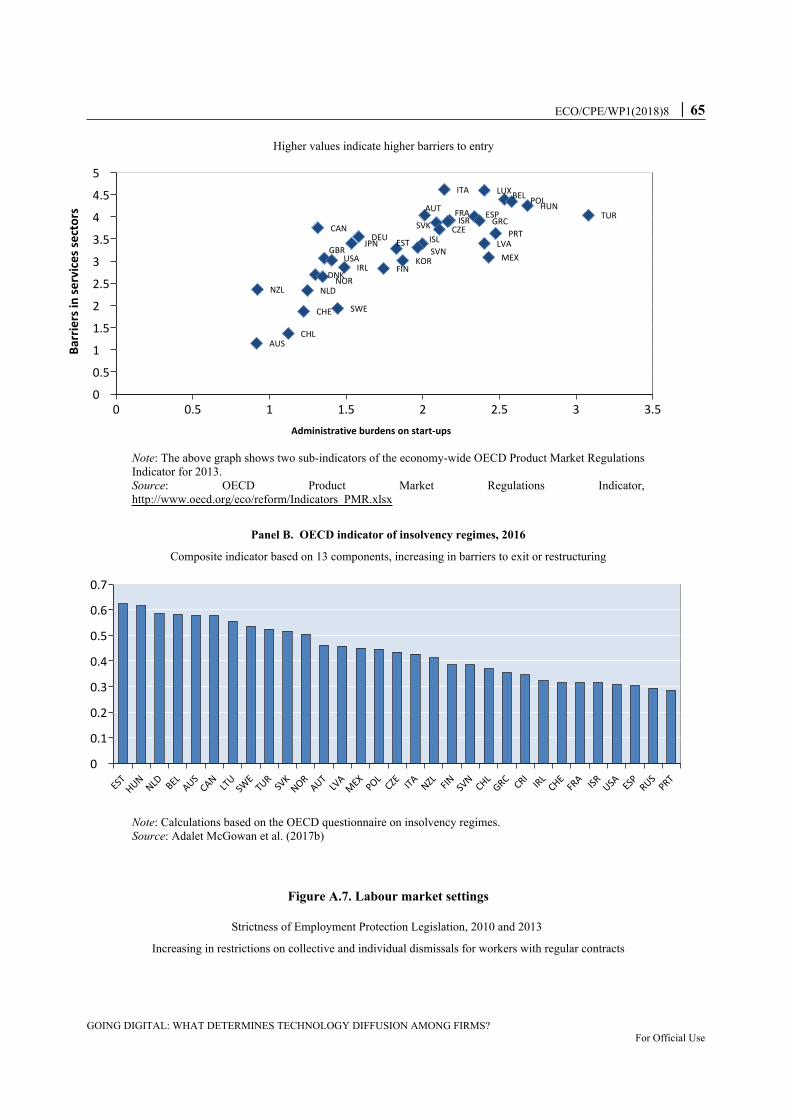
ECO/CPE/WP1(2018)8 │ 65
GOING DIGITAL: WHAT DETERMINES TECHNOLOGY DIFFUSION AMONG FIRMS?For Official Use
Higher values indicate higher barriers to entry
0 0.5 1 1.5 2 2.5 3 3.5Administrative burdens on start-ups
0
0.5
1
1.5
2
2.5
3
3.5
4
4.5
5
Barr
iers
in se
rvic
es se
ctor
s
ITA LUXBEL POLHUNTUR
AUTESP
ISR GRCFRA
SVKCAN CZE PRTDEUJPN LVAISL
SVNEST
MEXGBR
USA KORIRL FIN
DNKNORNZL NLD
SWECHE
CHLAUS
Note: The above graph shows two sub-indicators of the economy-wide OECD Product Market Regulations Indicator for 2013. Source: OECD Product Market Regulations Indicator, http://www.oecd.org/eco/reform/Indicators_PMR.xlsx
Panel B. OECD indicator of insolvency regimes, 2016
Composite indicator based on 13 components, increasing in barriers to exit or restructuring
ESTHUNNLD BELAUSCANLT
USW
ETURSV
KNORAUTLV
AMEXPOLCZE ITANZL FIN SV
NCHLGRC CRIIRL
CHEFR
A ISR USA ESP RUSPRT
0
0.1
0.2
0.3
0.4
0.5
0.6
0.7
Note: Calculations based on the OECD questionnaire on insolvency regimes.Source: Adalet McGowan et al. (2017b)
Figure A.7. Labour market settings
Strictness of Employment Protection Legislation, 2010 and 2013
Increasing in restrictions on collective and individual dismissals for workers with regular contracts

66 │ ECO/CPE/WP1(2018)8
GOING DIGITAL: WHAT DETERMINES TECHNOLOGY DIFFUSION AMONG FIRMS?For Official Use
BEL
NLD LV
AIT
ADE
UFR
ALU
XPR
TSV
NCZ
ESW
EIS
LAU
TGR
CPO
LES
PTU
RDN
KN
OR
SVK
ISR
KOR
FIN
CHE
JPN
HUN IRL
EST
AUS
CHL
GBR
CAN
USA NZL
0
0.5
1
1.5
2
2.5
3
3.5
2013 2010
Source: OECD Indicators of Employment Protection Legislation, see http://www.oecd.org/els/emp/oecdindicatorsofemploymentprotection.htm
Figure A.8. Access to capital, average 2010-2015
Venture Capital as a percentage of GDP
DNK SWE FIN CHE FRA IRL NOR HUN NLD BEL DEU PRT ESP AUT POL CZE ITA0
1
2
3
4
5
6
7
8
9
%
Note: Venture capital investment (VCI) is a subset of a private equity raised for investment in companies not quoted on stock market and developing new products and technologies. It is used to fund an early-stage (seed and start-up) or expansion of venture (later stage venture).Source: Eurostat, Venture Capital Investment, see http://ec.europa.eu/eurostat/web/products-datasets/-/tin00141
Figure A.9. R&D fiscal incentives, 2013
As a percentage of GDP

ECO/CPE/WP1(2018)8 │ 67
GOING DIGITAL: WHAT DETERMINES TECHNOLOGY DIFFUSION AMONG FIRMS?For Official Use
FRA
KORBELCAN IRLNLDHUN JPNAUSAUTSV
NPRTGBRUSA CZE ISLCHNDNKNORGRCBRATURZA
FRUSESP FIN CHLITASV
KSW
EEST DEUNZL CHE
MEX
0.00
0.05
0.10
0.15
0.20
0.25
0.30
Indirect government support through R&D tax incentives
Note: For Belgium, Brazil, Ireland, Israel, South Africa, Spain, Switzerland and the United States, figures refer to 2012. For Australia, Iceland, Mexico and the Russian Federation, figures refer to 2011.Source: OECD, R&D Tax Incentive Indicators, www.oecd.org/sti/rd-tax-stats.htm and Main Science and Technology Indicators, www.oecd.org/sti/msti.htm.
Figure A.10. Digital trade openness
Composite indicator based on four subcomponents; increasing in barriers to digital trade
TURFR
ADEUKORDNKLT
U FIN ITAGBRESP
HUNPOLMEXSW
EAUSCANCHEGRCPRTNZL AUTEST LU
XLV
A IRLSV
KBEL ISL ISR SV
N CZE USA CYPNLD NORJPNCHL
0
0.1
0.2
0.3
0.4
0.5
0.6
0.7
DTRI Restrictions on Data
Note: The European Centre for Internal Political Economy (ECIPE) Digital Trade Restrictiveness Index (DTRI) index captures trade restrictions in four large areas: (1) fiscal restrictions, (2) establishment restrictions, (3) restrictions on data and (4) trading restrictions. Cluster 3, covering the restrictiveness of data policies, intermediaries’ liability and content access restrictions is separately presented in the graph above. Source: ECIPE (2018)

68 │ ECO/CPE/WP1(2018)8
GOING DIGITAL: WHAT DETERMINES TECHNOLOGY DIFFUSION AMONG FIRMS?For Official Use
Annex B. Robustness and additional results
Table B.1. Principal Component Analysis
Dependent variable: PC1 (Broadband, Social Media, High
Speed Internet, ERP, CRM, CC, CC complex, Supply
Chain Management, Big Data)
Dependent variable: PC2 (ERP, CRM, CC, CC complex)
Policy
variable
High-speed
broadbandObs R2
Policy
variable
High-speed
broadbandObs R2
I. Organisational capital
Quality of Management School X
knowledge intensity1.334*** 4.057*** 337 0.933 1.650*** 2.490*** 429 0.918
High performance work practices
X knowledge intensity0.0655** 4.220*** 281 0.934 0.0807*** 2.797*** 338 0.917
II. Talent Pool
Percentage of adults with no ICT
skills X knowledge intensity -0.0741*** 3.817*** 243 0.943 -0.101*** 2.807*** 297 0.926
Low skilled in training X
knowledge intensity0.0484** 4.371*** 253 0.937 0.0897*** 2.986*** 308 0.929
High skilled in training X
knowledge intensity 0.0377* 4.372*** 253 0.937 0.0654*** 3.082*** 308 0.925
Lifelong learning X knowledge
intensity 0.0533*** 3.680*** 243 0.942 0.0897*** 2.570*** 297 0.926
E-Government x knowledge
intensity 0.0500*** 3.943*** 271 0.925 0.0550*** 2.384*** 363 0.911
Skill mismatch X knowledge
intensity -0.109*** 4.439*** 303 0.933 -0.112*** 2.805*** 360 0.914
Incentives
Employment protection legislation
X turnover-0.0919*** 4.283*** 337 0.930 -0.0648*** 2.669*** 429 0.908
PMR Administrative burdens on
start-ups x turnover-0.0839*** 4.335*** 337 0.931 -0.0473*** 2.685*** 429 0.908
PMR Barriers in services sectors
X turnover-0.0439*** 4.329*** 337 0.930 -0.0320*** 2.718*** 429 0.908
Insolvency regime rigidity X
financial dependency-0.418* 4.437*** 293 0.926 -0.392** 2.845*** 371 0.913
Venture capital X financial
dependency4.413*** 2.669*** 211 0.954 5.298*** 2.538*** 265 0.930
Tax incentive support for BERD X
Knowledge Intensity 5.038 4.045*** 293 0.929 3.632 2.782*** 364 0.904
Digital Trade Restrictiveness
Index X Share of Computer
services as input into sector x
-0.367 3.965*** 337 0.928 -0.607** 2.447*** 429 0.908
Note: This table reports baseline estimates of the baseline equation where digital adoption is regressed on the percentage of firms using high-speed broadband connections in a given country-industry cell, one policy variable of interest interacted with the relevant exposure variable (knowledge intensity, industry firm turnover, sector dependency on external finance or the industry share of computer services as inputs) and country and industry fixed effects. Digital adoption is given by the first principal component (i.e. the one associated with the largest eigenvalue) from a principal component analysis of seven (Panel A) and four (Panel B) variables of digital adoption. Regressions are based on a country-industry data for a set of 25 countries 25 industries (NACE Rev 2, 10-83). To maximize coverage, unweighted averages of each variable are used over the time period 2010-2016. ***, ** and * represent p<0.01, p<0.05 and p<0.1 respectively.

ECO/CPE/WP1(2018)8 │ 69
GOING DIGITAL: WHAT DETERMINES TECHNOLOGY DIFFUSION AMONG FIRMS?For Official Use
Source: OECD calculations based on Eurostat, Digital Economy and Society Statistics, Comprehensive Database and national sources, September 2017.
Table B.2. EPL interacted with job turnover
Dependent variable: percentage of firms >10 employees adopting the digital technology ERP CRM Cloud Computing Cloud Computing (high)
High-speed internet 0.205*** 0.236*** 0.161*** 0.102**
(0.0624) (0.0648) (0.0543) (0.0465)
EPL* Job turnover -0.00197** -0.00119* -0.000594 -0.000790*
(0.000806) (0.000659) (0.000562) (0.000417)
Constant 0.576*** 0.503*** 0.181*** 0.139***
(0.0927) (0.0728) (0.0623) (0.0476)
Observations 413 413 394 376
R-squared 0.854 0.881 0.915 0.853
Note: This table reports baseline estimates of the equation where each digital technology is regressed on the percentage of firms using high-speed broadband connections in a given country-industry cell, employment protection legislation interacted with the rate of job turnover by industry and country and industry fixed effects. Regressions are based on a country-industry data for a set of 25 countries 25 industries (NACE Rev 2, 10-83). To maximize coverage, unweighted averages of each variable are used over the time period 2010-2016. ***, ** and * represent p<0.01, p<0.05 and p<0.1 respectively.Source: OECD calculations based on Eurostat, Digital Economy and Society Statistics, Comprehensive Database and national sources, September 2017.
Figure B.1. The correlation between knowledge intensity and the share of high-routine employment
Note: The correlation coefficient between knowledge intensity and the share of high routine employment is stands at -0.49 and is found to be statistically significant at the 1% level.

70 │ ECO/CPE/WP1(2018)8
GOING DIGITAL: WHAT DETERMINES TECHNOLOGY DIFFUSION AMONG FIRMS?For Official Use
Table B.3. Capabilities and digital adoption – robustness to a different exposure variable
Exposure variable: share of high routine employment
Enterprise
Resource
Planning
Customer
Relationship
Managemen
t
Cloud
Computing
Cloud
Computing
(complex)
I. Organisational capital
Quality of Management school x share of routine tasks 0.0840* -0.116*** -0.131*** -0.147***
High-speed broadband access (>30Mbit/s) 0.216*** 0.207*** 0.134** 0.0365
Observations 369 368 352 336
High performance work practices x share of routine tasks 0.00492 -0.00823** -0.00995*** -0.0117***
High-speed broadband access (>30Mbit/s) 0.367*** 0.247*** 0.141* 0.0669
Observations 296 296 280 264
II. Talent Pool
Percentage of adults with no ICT skills x share of routine tasks -0.00670* 0.00222 0.00971*** 0.00993***
High-speed broadband access (>30Mbit/s) 0.334*** 0.210** 0.161** 0.0784
Observations 247 247 248 232
Low skilled in training x share of routine tasks 0.00103 -0.00577** -0.00875*** -0.00996***
High-speed broadband access (>30Mbit/s) 0.338*** 0.333*** 0.209*** 0.114
Observations 271 271 256 240
High skilled in training x share of routine tasks 0.00107 -0.00388 -0.00735*** -0.00873***
High-speed broadband access (>30Mbit/s) 0.339*** 0.329*** 0.205*** 0.109
Observations 271 271 256 240
Lifelong learning x share of routine tasks 0.00339 -0.00245 -0.00832*** -0.00897***
High-speed broadband access (>30Mbit/s) 0.344*** 0.208** 0.149* 0.0655
Observations 247 247 248 232
Skill mismatch x share of routine tasks -0.00591 0.0130** 0.0108** 0.00825**
High-speed broadband access (>30Mbit/s) 0.319*** 0.222** 0.139** 0.0650
Observations 0.314*** 0.365*** 0.0979*** 0.0426**
E-Governent x share of routine tasks 0.000298 -0.00329 -0.00363** -0.00289*
High-speed broadband access (>30Mbit/s) 0.211** 0.205** 0.116* 0.0383
Observations 318 317 301 285
Note: This tables reports baseline estimates of the baseline equation where each digital technology is regressed on the percentage of firms using high-speed broadband connections in a given country-industry cell, one policy variable of interest interacted with the share of high routine employment to proxy for knowledge intensity, and country and industry fixed effects. Regressions are based on a country-industry data for a set of 25 countries 25 industries (NACE Rev 2, 10-83). To maximize coverage, unweighted averages of each variable are used over the time period 2010-2016. ***, ** and * represent p<0.01, p<0.05 and p<0.1 respectively.Source: OECD calculations based on Eurostat, Digital Economy and Society Statistics, Comprehensive Database and national sources, September 2017

ECO/CPE/WP1(2018)8 │ 71
GOING DIGITAL: WHAT DETERMINES TECHNOLOGY DIFFUSION AMONG FIRMS?For Official Use
Table B.4. Univariate regression results: robustness to dropping one sector at a time
ERP CRM CC CC (complex)
I. Organisational capital
Quality of Management School X knowledge intensity Robust Robust Robust
High performance work practices X knowledge
intensity
Robust Robust Robust
II. Talent Pool
Percentage of adults with no ICT skills X knowledge
intensity
Robust Robust Robust
Low skilled in training X knowledge intensity Robust Robust Robust
High skilled in training X knowledge intensity Robust Robust Robust
Lifelong learning X knowledge intensity Robust Robust Robust
Skill mismatch X knowledge intensity Robust Robust Robust
E-government X knowledge intensity
Incentives
Employment protection legislation X turnover 24_25,27_28,35E_39,41_43,
45,49_53,55_56,69_74,77_82
Robust Robust Robust
PMR Administrative burdens on start-ups x turnover 24_25 Robust
PMR Barriers in services sectors X turnover 10_12,13_15,24_25,29_
30,46,58_60,68
Robust Robust
Insolvency regime rigidity X financial dependency Robust 61
Venture capital X financial dependency Robust Robust Robust
Tax incentive support for BERD X Knowledge Intensity Robust Robust
Digital Trade Restrictiveness Index X Share of
Computer services as input into sector x
62_63 Robust 24_25,27_28,29
_30,61,64,77_8
2
Robust
Digital Trade Restrictiveness Index X Knowledge
intensity
Robust 24_25,26,55_56
,58_60,61,77_8
2
Robust
Note: This table displays the robustness of results displayed in Table 3 and Table 4 (univariate regression results). Sectors listed in this table are those which estimation results are sensitive to, i.e. dropping these sectors implies the loss of statistical significance. Grey areas indicate that estimation results were not significant in the first place.

72 │ ECO/CPE/WP1(2018)8
GOING DIGITAL: WHAT DETERMINES TECHNOLOGY DIFFUSION AMONG FIRMS?For Official Use
Table B.5. Univariate regression results: robustness to dropping one country at a time
Enterprise Resource Planning
Customer
Relationship
Management
Cloud
Computing
Cloud Computing
(complex)
I. Organisational capital
Quality of Management School X knowledge
intensity
Robust Robust Robust
High performance work practices X knowledge
intensity
Robust Robust Robust
II. Talent Pool
Percentage of adults with no ICT skills X knowledge
intensity
Robust Robust Robust
Low skilled in training X knowledge intensity Robust Robust Robust
High skilled in training X knowledge intensity Robust PRT Robust
Lifelong learning X knowledge intensity Robust Robust Robust
Skill mismatch X knowledge intensity Robust Robust Robust
E-government X knowledge intensity Robust Robust Robust
Incentives
Employment protection legislation X turnover CZE,DEU,DNK,EST,FRA,GBR,I
RL,ITA,NLD,NOR,PRT,TUR
Robust IRL,PRT Robust
PMR Administrative burdens on start-ups x turnover Robust Robust
PMR Barriers in services sectors X turnover BEL,IRL,ITA,POL Robust Robust
Insolvency regime rigidity X financial dependency GBR GBR
Venture capital X financial dependency Robust Robust Robust
Tax incentive support for BERD X Knowledge
Intensity
Robust FRA, SVK
Digital Trade Restrictiveness Index X Share of
Computer services as input into sector x
DEU Robust DEU,
EST,GBR,ITA,
NLD,NOR,SV
K
NLD
Digital Trade Restrictiveness Index X knowledge
intensity
Robust DEU,GBR,HU
N,IRL,ISL,ITA,
NOR,POL,SV
K
NOR
Note: This table displays the robustness of results displayed in Figure X and X (univariate regression results). Countries listed in this table are those which estimation results are sensitive to, i.e. dropping these countries implies the loss of statistical. Grey areas indicate that estimation results were not significant in the first place.

ECO/CPE/WP1(2018)8 │ 73
GOING DIGITAL: WHAT DETERMINES TECHNOLOGY DIFFUSION AMONG FIRMS?For Official Use
Annex C. Policy initiatives bridging the digital gap
1.1. Policies encouraging the diffusion of high-speed broadband: some examples
1. Governments across the OECD take proactive approaches to close existing inter-regional gaps in access to high-speed broadband networks, notably in the form of national broadband strategies or through coinvestment (OECD, 2017c).
86. In 2014, EU members endorsed (and meanwhile transposed into national law) the broadband targets set out in the Commission’s ‘Digital Agenda for Europe — Driving European growth digitally’ (‘the Digital Agenda’), namely to ensure that, by 2020, all Europeans have access to internet speeds of above 30 Mbps and 50 % or more of EU households subscribe to internet connections above 100 Mbps (European Union Broadband Cost Reduction Directive (2014/61/EU)).28 The directive itself contributes to that aim by proposing various ways to promote competition in communication markets, and reduce costs through the sharing and re-use of existing physical infrastructure.
87. In the context of the EU Digital Strategy, Member States and the Commission also engage in a number of complementary initiatives, including the introduction of: i) a toolkit specifically targeted at rural areas, proposing, among other things, the set-up of Broadband Competence Offices to foster co-operation across the EU, promote knowledge-exchanges, overcome broadband project hurdles and build capacity in the areas of funding, planning and policy” (EC, 2017a); ii) annual European Broadband Awards, one of which in 2017 was awarded to The Rural Broadband – a Greek national project, supported by EU funds and implemented via Public Private Partners, which aimed at closing the “broadband gap” between remote, disadvantaged areas and the rest of the country, by providing good connectivity services at affordable costs.
88. Similar initiatives to rollout high-speed broadband are underway in almost all OECD and key partner economies. In New Zealand, for example, over USD 1.48 billion in funding were allocated to communications infrastructure through the Ultra-Fast Broadband (UFB) programme, the Rural Broadband Initiative (RBI) and the Mobile Black Spot Fund (MBSF), in order to bring fibre-to-the-premises broadband with speeds close to 1,000 Mbps by the end of 2022 to 87 % of the population. Meanwhile, the nascent “Indonesian Broadband Plan” aims to provide fixed broadband with speeds of at least 2 Mbps to all government offices, hotels, hospital, schools and public spaces by 2019.
1.2. Policies initiatives promoting digital skills
Table C.1. Bridging the digital gap
Country Initiative
BrazilCompanies are requested to provide free broadband Internet access (wired, wireless or via satellite) to
rural schools in order to obtain spectrum for commercial operation of mobile 4G services.
European
Union
A range of initiatives with different target groups (e.g. people with cognitive disabilities, or hearing or
visually impaired people) is (co-) funded by the European Union (“EU funded projects on Digital
28 Most countries complied with this obligation, however, early 2018 the Commission referred to Bulgaria and the Netherlands to the Court of Justice of the EU for delay in
transposing the directive (EC, 2018).

74 │ ECO/CPE/WP1(2018)8
GOING DIGITAL: WHAT DETERMINES TECHNOLOGY DIFFUSION AMONG FIRMS?For Official Use
Inclusion”).
Norway
The program, which is run by the Ministry of Local Government and Modernisation in collaboration with
important players in the ICT industry, offers a variety of services to improve the digital competence of
specific disadvantaged groups, including, for instance, web based resources for trainers and educators
MexicoDigital Inclusion Program provides (among other things) training to promote teacher’s ICT skills and
their ability to apply them in pedagogic activities.
Portugal
Under the “National Strategy for Digital Inclusion and Literacy”, the “ICT and Society Network” promotes
digital inclusion and literacy of the population at large. As a multi-stakeholder national platform with
more than 500 members, this network mobilises regions, cities, municipalities, companies, government,
academia, private sector, non-governmental organisations, the media, educators, and citizens, to
introduce non-digital citizens to the Internet
Source: All examples are retrieved from OECD (2017b) or OECD (2016)
Table C.2. Policy initiatives in support of vocational training and higher education in ICT
Country Initiative
Australia The ‘National Innovation and Science Agenda’ supports the improvement of gender equity and
diversity in STEM (science, technology, engineering and mathematics) fields, including ICT, by
increasing opportunities for women.
Czech
Republic
The Ministry of Labor and Social Affairs has allocated USD 100 million strategy to increase digital
literacy and e-skills development among job-seekers, including displaced workers.
Estonia The Ministry of Education and Research cooperates with private sector partners and universities to
support the ‘IT Academy initiative’, which promotes the further development of IT higher education
through scholarships, summer schools, in-service training and IT curricula development, among other
things.
EU As part of its new ‘Skills Agenda for Europe’ the Commission asked all Member States to develop
national digital skills strategies by mid-2017 and to set up national coalitions to support their
implementation. With a view to facilitate the creation of such national strategies, Member State
experts have developed a ‘shared concept’ of challenges to be addressed and potential actions that
could form part of a digital skills strategy as well as collected a set of ‘best practices’.
Israel The Welfare and Social Services Ministry of Israel offers training and job placement in ICT specifically
for disadvantaged populations. It includes grants to employers who give jobs to trainees.
Luxembourg Originally from Finland, Rails Girls – a global, non-profit volunteer community – promotes women-only
coding classes such as app programming and is supported by the Luxembourg government.
Netherlands The ‘Make IT Work’ program retrains highly educated but unemployed people looking for job in ICT
for jobs such as software engineering, business analysis, ICT project management and consulting.
UK Digital degree apprenticeships are offered through a government-backed collaboration between
employers and higher education institutions.
Source: All examples are retrieved from OECD (2017b).

![[PPT]Osmosis, Diffusion, Active Transport - Lake Shore … · Web viewOsmosis, Diffusion, Active Transport Diffusion, Osmosis and Concentration Gradient Diffusion – the movement](https://img.pdfslide.us/doc/110x75/5b257b6a7f8b9ae13b8b469c/pptosmosis-diffusion-active-transport-lake-shore-web-viewosmosis-diffusion.jpg)