Embed Size (px)
Citation preview
1
Technology and Social MediaForesight – issue 152
VisitBritain Research
2
Contents
1. Introduction
2. Summary
3. General social media and technology
use
1. Social networks used
2. Social media activities
3. Technology ownership
4. Technology use on holiday
1. Staying connected on holiday
2. Sharing photos and videos
3. Using location technology
5. Social media use on latest holiday
6. Writing and using reviews
1. Reviews on social media
2. Accessing reviews using a
smartphone
7. Technology barriers
1. Cost of using a smartphone
abroad
All icons used are from flaticon.com
3
1. Introduction
• This edition of Foresight explores how international travellers use social media and technology
when they travel.
• This analysis comes from a research study carried out by VisitBritain and research agency Ipsos
in spring 2016. International travellers from 20 different markets were interviewed, and are either
previous visitors to Britain, or would consider visiting in the future.
• The study took place online, amongst international travellers, residents of the following markets:
Australia, Brazil, Canada, China, Denmark, France, Germany, India, Italy, Japan, Netherlands,
New Zealand, Norway, Russia, Saudi Arabia, South Korea, Spain, Sweden, UAE & USA.
• There are two other Foresight reports from this project, one on Researching and Planning (issue
150) and another on Booking a holiday (issue 151).
4
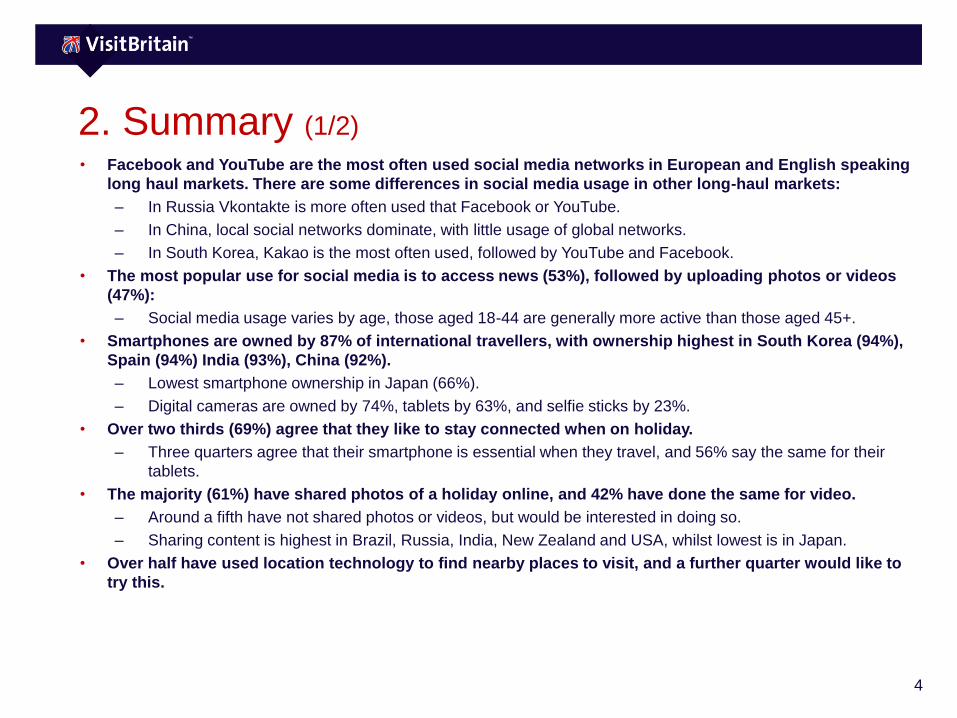
• Facebook and YouTube are the most often used social media networks in European and English speaking
long haul markets. There are some differences in social media usage in other long-haul markets:
– In Russia Vkontakte is more often used that Facebook or YouTube.
– In China, local social networks dominate, with little usage of global networks.
– In South Korea, Kakao is the most often used, followed by YouTube and Facebook.
• The most popular use for social media is to access news (53%), followed by uploading photos or videos
(47%):
– Social media usage varies by age, those aged 18-44 are generally more active than those aged 45+.
• Smartphones are owned by 87% of international travellers, with ownership highest in South Korea (94%),
Spain (94%) India (93%), China (92%).
– Lowest smartphone ownership in Japan (66%).
– Digital cameras are owned by 74%, tablets by 63%, and selfie sticks by 23%.
• Over two thirds (69%) agree that they like to stay connected when on holiday.
– Three quarters agree that their smartphone is essential when they travel, and 56% say the same for their
tablets.
• The majority (61%) have shared photos of a holiday online, and 42% have done the same for video.
– Around a fifth have not shared photos or videos, but would be interested in doing so.
– Sharing content is highest in Brazil, Russia, India, New Zealand and USA, whilst lowest is in Japan.
• Over half have used location technology to find nearby places to visit, and a further quarter would like to
try this.
2. Summary (1/2)
5
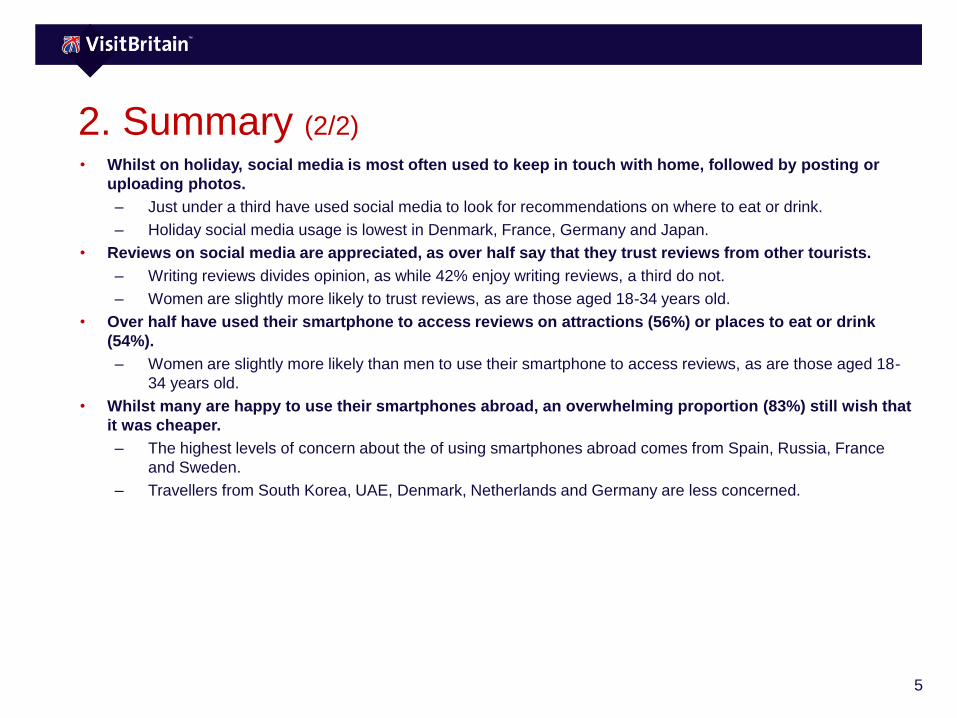
• Whilst on holiday, social media is most often used to keep in touch with home, followed by posting or
uploading photos.
– Just under a third have used social media to look for recommendations on where to eat or drink.
– Holiday social media usage is lowest in Denmark, France, Germany and Japan.
• Reviews on social media are appreciated, as over half say that they trust reviews from other tourists.
– Writing reviews divides opinion, as while 42% enjoy writing reviews, a third do not.
– Women are slightly more likely to trust reviews, as are those aged 18-34 years old.
• Over half have used their smartphone to access reviews on attractions (56%) or places to eat or drink
(54%).
– Women are slightly more likely than men to use their smartphone to access reviews, as are those aged 18-
34 years old.
• Whilst many are happy to use their smartphones abroad, an overwhelming proportion (83%) still wish that
it was cheaper.
– The highest levels of concern about the of using smartphones abroad comes from Spain, Russia, France
and Sweden.
– Travellers from South Korea, UAE, Denmark, Netherlands and Germany are less concerned.
2. Summary (2/2)
6
General social media and
technology use
Footer Friday, October
6, 2017
7
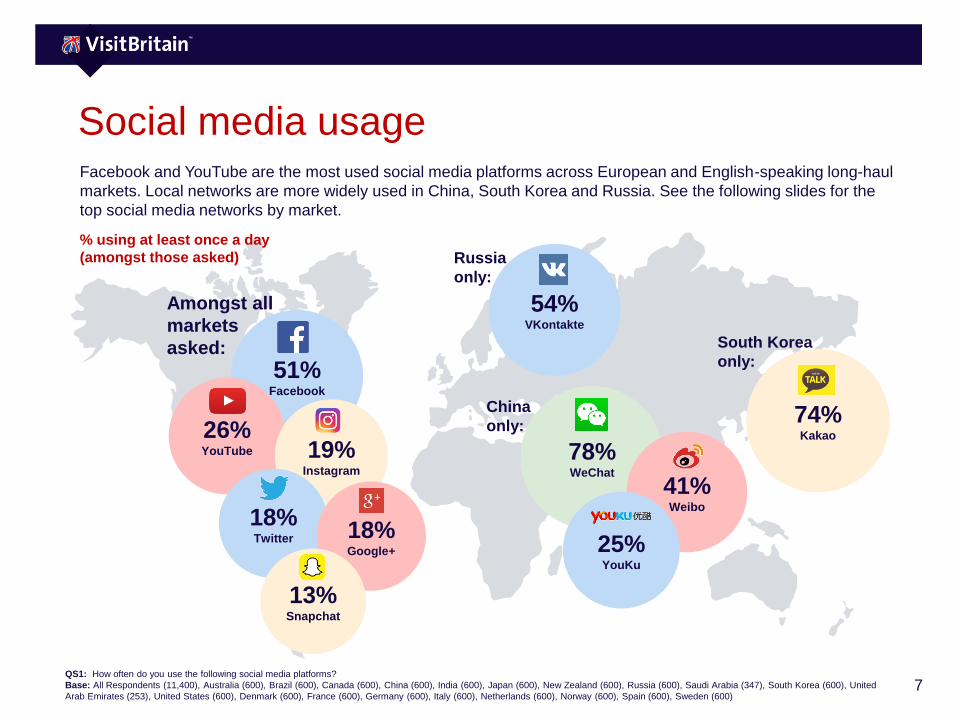
Social media usageFacebook and YouTube are the most used social media platforms across European and English-speaking long-haul
markets. Local networks are more widely used in China, South Korea and Russia. See the following slides for the
top social media networks by market.
% using at least once a day
(amongst those asked)
51%Facebook
26%YouTube 19%
18%Twitter 18%
Google+
13%Snapchat
78%WeChat
41%Weibo
25%YouKu
74%Kakao
54%VKontakte
Amongst all
markets
asked:
Russia
only:
China
only:
South Korea
only:
QS1: How often do you use the following social media platforms?
Base: All Respondents (11,400), Australia (600), Brazil (600), Canada (600), China (600), India (600), Japan (600), New Zealand (600), Russia (600), Saudi Arabia (347), South Korea (600), United
Arab Emirates (253), United States (600), Denmark (600), France (600), Germany (600), Italy (600), Netherlands (600), Norway (600), Spain (600), Sweden (600)
8
26%
33%
18%
10%
13%
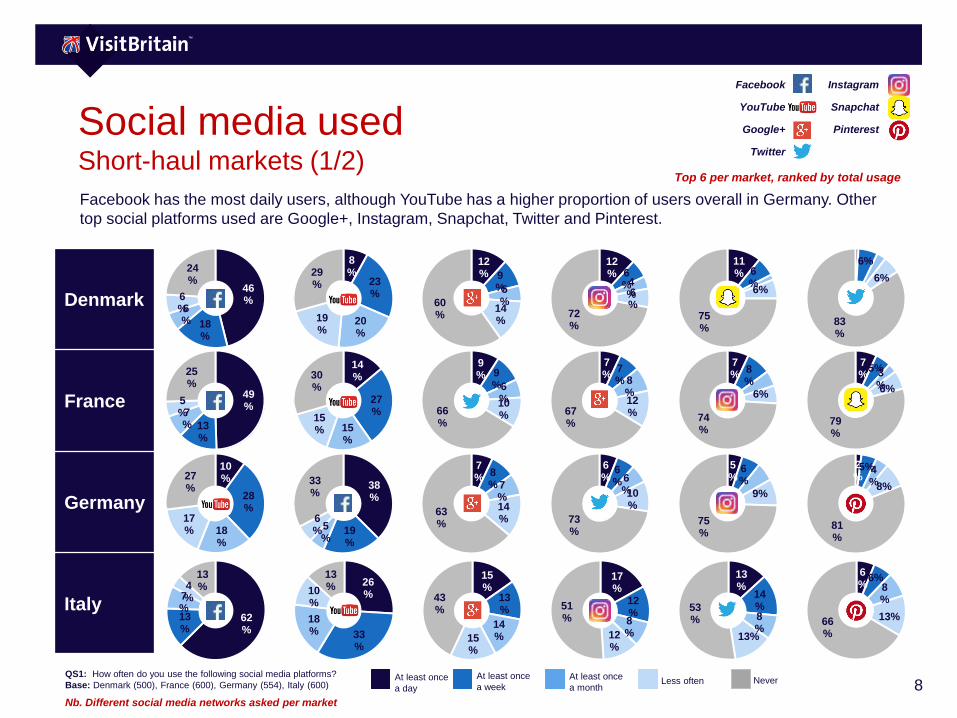
Social media usedShort-haul markets (1/2)
Facebook has the most daily users, although YouTube has a higher proportion of users overall in Germany. Other
top social platforms used are Google+, Instagram, Snapchat, Twitter and Pinterest.
QS1: How often do you use the following social media platforms?
Base: Denmark (500), France (600), Germany (554), Italy (600)
46%
18%
6%
6%
24%
8%
23%
20%
19%
29%
12% 9
%5%
14%
60%
Denmark
France
Germany
Italy
12% 6
%4%6%
72%
11% 6
%6%
75%
6%
6%
83%
49%
13%
7%
5%
25%
14%
27%
15%
15%
30%
9% 9
%6%10%66
%
7%
7% 8
%12%67
%
7%
8%
6%
74%
7%
5%3%6%
79%
10%
28%
18%
17%
27% 38
%
19%
5%
6%
33%
7%
8% 7
%14%
63%
6%
6%6
%10%
73%
5%
6%
9%
75%
2%5%4
%8%
81%
62%
13%
7%
4%
13%
15%
13%
14%15
%
43%
17%
12%8%12
%
51%
13%
14%8%
13%
53%
6%
6%8%
13%66%
At least once
a day
At least once
a weekAt least once
a monthLess often Never
Facebook Instagram
YouTube Snapchat
Google+ Pinterest
Top 6 per market, ranked by total usage
Nb. Different social media networks asked per market
9
29%
29%
18%
11%
14%
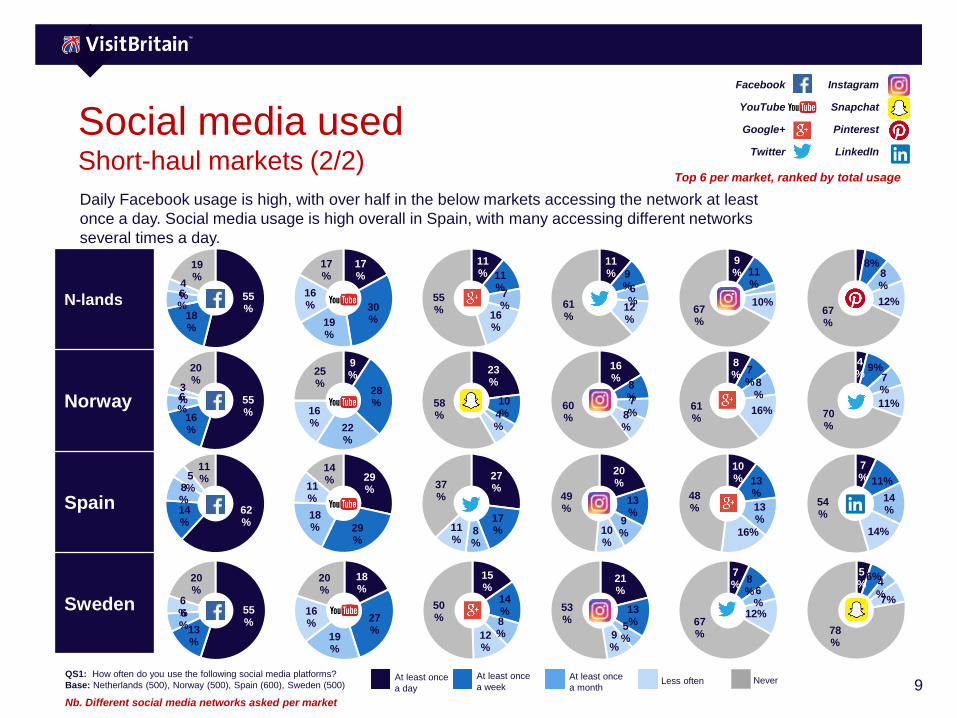
Social media usedShort-haul markets (2/2)
Daily Facebook usage is high, with over half in the below markets accessing the network at least
once a day. Social media usage is high overall in Spain, with many accessing different networks
several times a day.
QS1: How often do you use the following social media platforms?
Base: Netherlands (500), Norway (500), Spain (600), Sweden (500)
Facebook Instagram
YouTube Snapchat
Google+ Pinterest
Twitter LinkedIn
N-lands
Norway
Spain
Sweden
At least once
a day
At least once
a weekAt least once
a monthLess often Never
18%
27%
19%
16%
20%
55%
18%
6%
4%
19%
17%
30%19
%
16%
17%
11% 11
%7%
16%
55%
11% 9
%6%
12%
61%
9% 11
%
10%67%
8%8%
12%67%
55%
16%
6%
3%
20%
9%
28%
22%
16%
25%
23%
10%4
%
58%
16%
8%7%8
%
60%
8% 7
%8%
16%61%
4%
9%7%
11%70%
62%
14%
8%
5%
11% 27
%
17%8
%
11%
37%
20%
13%
9%10
%
49%
10% 13
%
13%
16%
48%
7% 11%
14%
14%
54%
55%
13%
6%
6%
20%
15%
14%8%12
%
50%
21%
13%5
%9%
53%
7%
8%6
%12%
67%
5%
6%4%7%
78%
Top 6 per market, ranked by total usage
Nb. Different social media networks asked per market
10
23%
28%
19%
14%
16%
37%
28%
14%
9%
12%
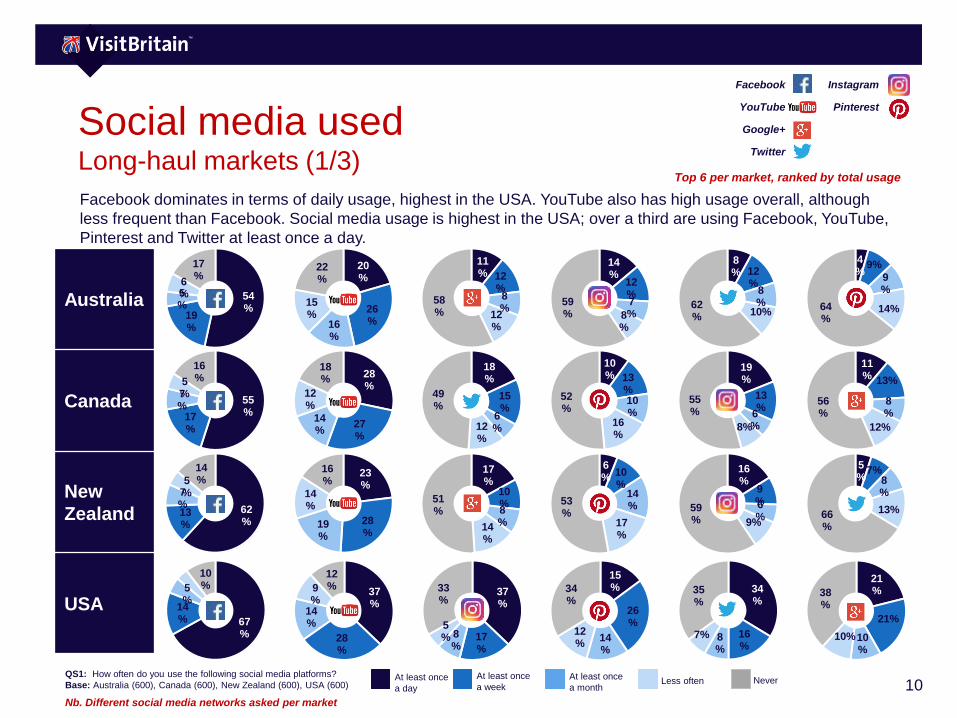
Social media usedLong-haul markets (1/3)
Facebook dominates in terms of daily usage, highest in the USA. YouTube also has high usage overall, although
less frequent than Facebook. Social media usage is highest in the USA; over a third are using Facebook, YouTube,
Pinterest and Twitter at least once a day.
QS1: How often do you use the following social media platforms?
Base: Australia (600), Canada (600), New Zealand (600), USA (600)
54%
19%
5%
6%
17%
20%
26%16
%
15%
22%
11% 12
%8%
12%
58%
Australia
Canada
New
Zealand
USA
14%
12%7%8
%
59%
8% 12
%8%
10%62%
4%
9%
9%
14%64%
55%17
%
7%
5%
16% 28
%
27%
14%
12%
18%
18%
15%
6%12
%
49%
10% 13
%10%
16%
52%
19%
13%
6%8%
55%
11% 13%
8%
12%
56%
62%
13%
7%
5%
14%
17%
10%8%14
%
51%
6%
10%
14%
17%
53%
16%
9%6%
9%
59%
5%
7%8%
13%66%
67%
14%
5%
10%
37%
17%
8%
5%
33%
15%
26%
14%
12%
34%
34%
16%
8%
7%
35%
21%
21%
10%
10%
38%
At least once
a day
At least once
a weekAt least once
a monthLess often Never
Facebook Instagram
YouTube Pinterest
Google+
Top 6 per market, ranked by total usage
Nb. Different social media networks asked per market
11
59%
26%
7%
4%
68%
15%
8%
5%
5%
71%
15%
7%
4%
4%
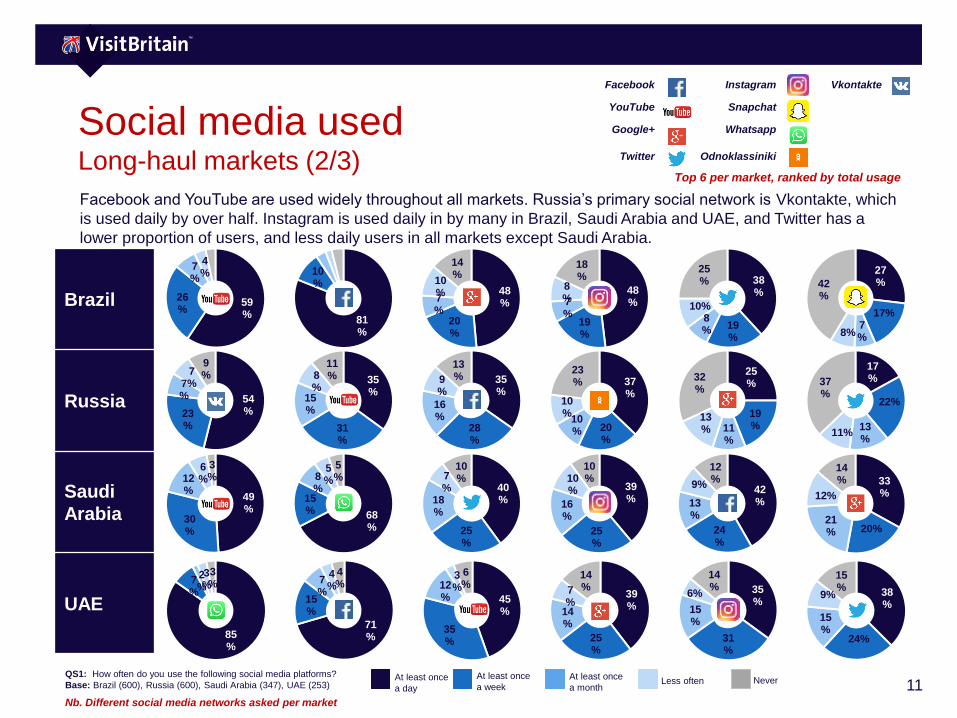
Social media usedLong-haul markets (2/3)
Facebook and YouTube are used widely throughout all markets. Russia’s primary social network is Vkontakte, which
is used daily by over half. Instagram is used daily in by many in Brazil, Saudi Arabia and UAE, and Twitter has a
lower proportion of users, and less daily users in all markets except Saudi Arabia.
QS1: How often do you use the following social media platforms?
Base: Brazil (600), Russia (600), Saudi Arabia (347), UAE (253)
81%
10%
48%
20%
7%
10%
14%
Brazil
Russia
Saudi
Arabia
UAE
48%
19%
7%
8%
18% 38
%
19%
8%
10%
25%
27%
17%7%8%
42%
54%23
%
7%
7%
9% 35
%
31%
15%
8%
11% 35
%
28%
16%
9%
13%
37%
20%
10%
10%
23%
25%
19%11
%
13%
32%
17%
22%
13%
11%
37%
49%
30%
12%
6%
3%
40%
25%
18%
7%
10%
39%
25%
16%
10%
10%
42%
24%
13%
9%
12% 33
%
20%21%
12%
14%
85%
7%
2%
3%
3%
45%
35%
12%
3%
6%
39%
25%
14%
7%
14% 35
%
31%
15%
6%
14%
38%
24%
15%
9%
15%
At least once
a day
At least once
a weekAt least once
a monthLess often Never
Facebook Instagram Vkontakte
YouTube Snapchat
Google+ Whatsapp
Twitter Odnoklassiniki
Top 6 per market, ranked by total usage
Nb. Different social media networks asked per market
12
26%
19%10
%
9%
35%
31%
34%
16%
11%
10%
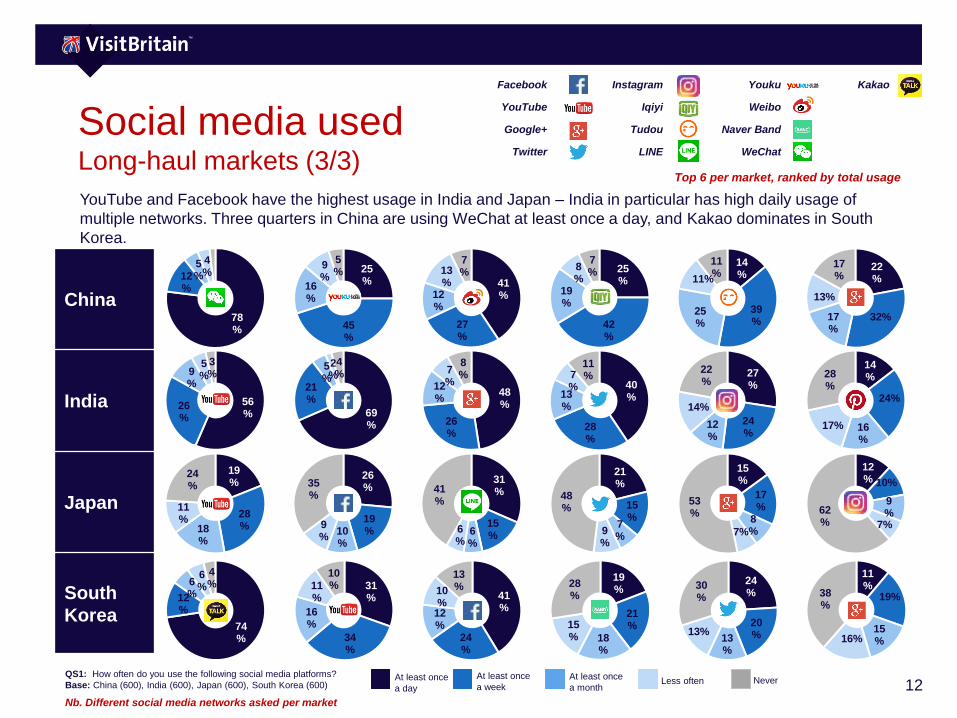
Social media usedLong-haul markets (3/3)
YouTube and Facebook have the highest usage in India and Japan – India in particular has high daily usage of
multiple networks. Three quarters in China are using WeChat at least once a day, and Kakao dominates in South
Korea.
QS1: How often do you use the following social media platforms?
Base: China (600), India (600), Japan (600), South Korea (600)
78%
12%
5%
4% 25
%
45%
16%
9%
5%
41%
27%
12%
13%
7%
China
India
Japan
South
Korea
25%
42%
19%
8%
7%
14%
39%
25%
11%
11%
22%
32%17%
13%
17%
56%
26%
9%
5%
3%
69%
21%
5%
2%
4%
48%
26%
12%
7%
8%
40%
28%
13%
7%
11% 27
%
24%
12%
14%
22%
14%
24%
16%
17%
28%
19%
28%18
%
11%
24%
31%
15%6
%
6%
41%
21%
15%
7%
9%
48%
15%
17%
8%7%
53%
12% 10%
9%
7%
62%
74%
12%
6%
6%
4%
41%
24%
12%
10%
13%
19%
21%
18%
15%
28%
24%
20%13
%
13%
30%
11%
19%
15%16%
38%
At least once
a day
At least once
a weekAt least once
a monthLess often Never
Facebook Instagram Youku Kakao
YouTube Iqiyi Weibo
Google+ Tudou Naver Band
Twitter LINE WeChat
Top 6 per market, ranked by total usage
Nb. Different social media networks asked per market
13
Share posts of
other people
30%
Upload photos / videos
47%
Access blogs
31%
Access news
53%
Look for advice
and help
29%
‘Like’ posts
44%
Enter compete-
tions
22%
Engage in group chats
27%
Play games
26%
Post about thoughts / feelings / opinions
28%
‘Follow’ celebrities
18%
‘Follow’ brands /
companies
26%
Using social media
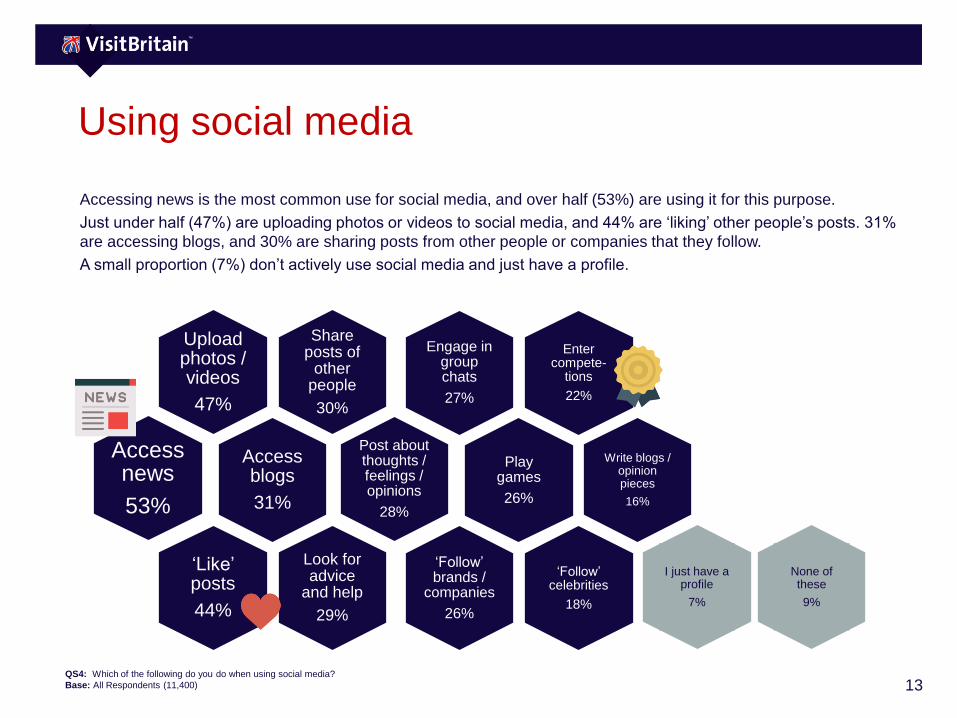
Accessing news is the most common use for social media, and over half (53%) are using it for this purpose.
Just under half (47%) are uploading photos or videos to social media, and 44% are ‘liking’ other people’s posts. 31%
are accessing blogs, and 30% are sharing posts from other people or companies that they follow.
A small proportion (7%) don’t actively use social media and just have a profile.
Write blogs / opinion pieces
16%
I just have a profile
7%
None of these
9%
QS4: Which of the following do you do when using social media?
Base: All Respondents (11,400)
14
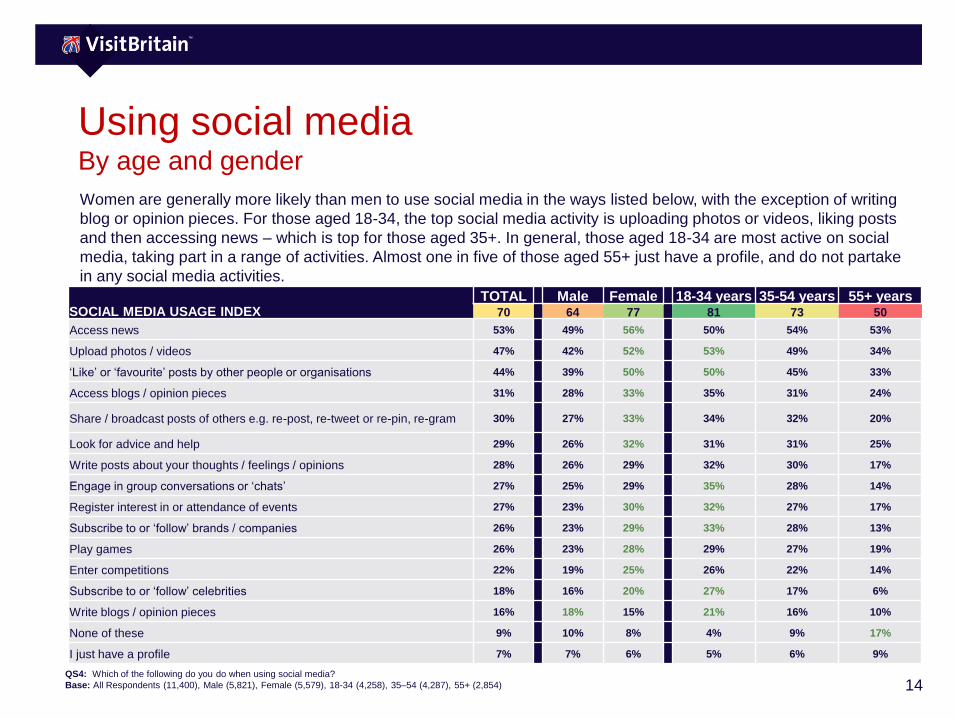
Using social mediaBy age and gender
Women are generally more likely than men to use social media in the ways listed below, with the exception of writing
blog or opinion pieces. For those aged 18-34, the top social media activity is uploading photos or videos, liking posts
and then accessing news – which is top for those aged 35+. In general, those aged 18-34 are most active on social
media, taking part in a range of activities. Almost one in five of those aged 55+ just have a profile, and do not partake
in any social media activities.
SOCIAL MEDIA USAGE INDEXTOTAL Male Female 18-34 years 35-54 years 55+ years
70 64 77 81 73 50
Access news 53% 49% 56% 50% 54% 53%
Upload photos / videos 47% 42% 52% 53% 49% 34%
‘Like’ or ‘favourite’ posts by other people or organisations 44% 39% 50% 50% 45% 33%
Access blogs / opinion pieces 31% 28% 33% 35% 31% 24%
Share / broadcast posts of others e.g. re-post, re-tweet or re-pin, re-gram 30% 27% 33% 34% 32% 20%
Look for advice and help 29% 26% 32% 31% 31% 25%
Write posts about your thoughts / feelings / opinions 28% 26% 29% 32% 30% 17%
Engage in group conversations or ‘chats’ 27% 25% 29% 35% 28% 14%
Register interest in or attendance of events 27% 23% 30% 32% 27% 17%
Subscribe to or ‘follow’ brands / companies 26% 23% 29% 33% 28% 13%
Play games 26% 23% 28% 29% 27% 19%
Enter competitions 22% 19% 25% 26% 22% 14%
Subscribe to or ‘follow’ celebrities 18% 16% 20% 27% 17% 6%
Write blogs / opinion pieces 16% 18% 15% 21% 16% 10%
None of these 9% 10% 8% 4% 9% 17%
I just have a profile 7% 7% 6% 5% 6% 9%
QS4: Which of the following do you do when using social media?
Base: All Respondents (11,400), Male (5,821), Female (5,579), 18-34 (4,258), 35–54 (4,287), 55+ (2,854)
15
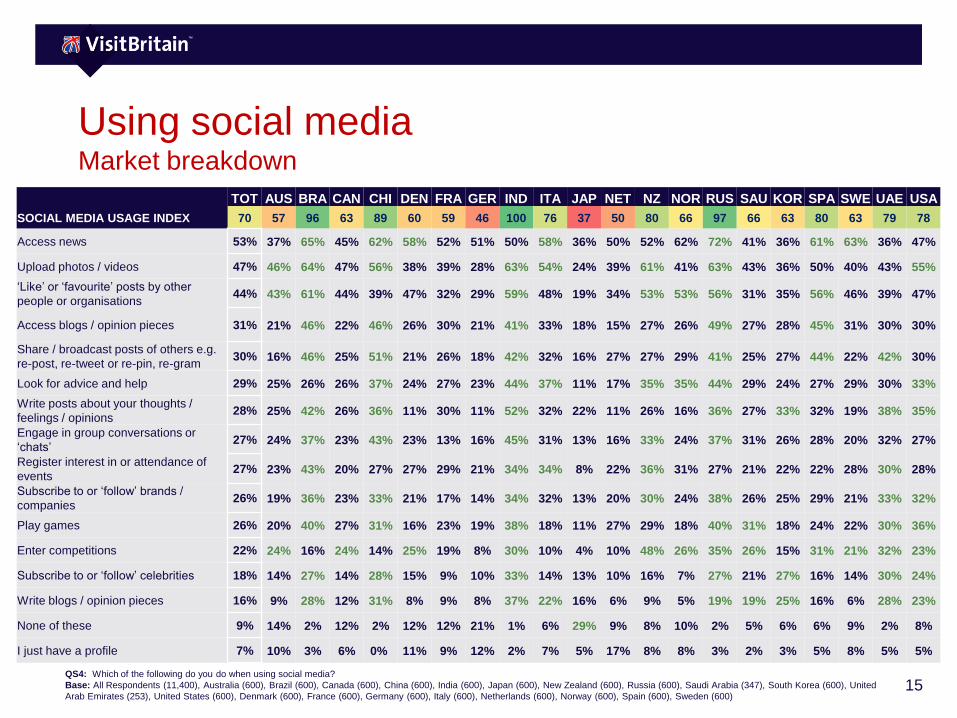
TOT AUS BRA CAN CHI DEN FRA GER IND ITA JAP NET NZ NOR RUS SAU KOR SPA SWE UAE USA
SOCIAL MEDIA USAGE INDEX 70 57 96 63 89 60 59 46 100 76 37 50 80 66 97 66 63 80 63 79 78
Access news 53% 37% 65% 45% 62% 58% 52% 51% 50% 58% 36% 50% 52% 62% 72% 41% 36% 61% 63% 36% 47%
Upload photos / videos 47% 46% 64% 47% 56% 38% 39% 28% 63% 54% 24% 39% 61% 41% 63% 43% 36% 50% 40% 43% 55%
‘Like’ or ‘favourite’ posts by other
people or organisations44% 43% 61% 44% 39% 47% 32% 29% 59% 48% 19% 34% 53% 53% 56% 31% 35% 56% 46% 39% 47%
Access blogs / opinion pieces 31% 21% 46% 22% 46% 26% 30% 21% 41% 33% 18% 15% 27% 26% 49% 27% 28% 45% 31% 30% 30%
Share / broadcast posts of others e.g.
re-post, re-tweet or re-pin, re-gram30% 16% 46% 25% 51% 21% 26% 18% 42% 32% 16% 27% 27% 29% 41% 25% 27% 44% 22% 42% 30%
Look for advice and help 29% 25% 26% 26% 37% 24% 27% 23% 44% 37% 11% 17% 35% 35% 44% 29% 24% 27% 29% 30% 33%
Write posts about your thoughts /
feelings / opinions28% 25% 42% 26% 36% 11% 30% 11% 52% 32% 22% 11% 26% 16% 36% 27% 33% 32% 19% 38% 35%
Engage in group conversations or
‘chats’27% 24% 37% 23% 43% 23% 13% 16% 45% 31% 13% 16% 33% 24% 37% 31% 26% 28% 20% 32% 27%
Register interest in or attendance of
events27% 23% 43% 20% 27% 27% 29% 21% 34% 34% 8% 22% 36% 31% 27% 21% 22% 22% 28% 30% 28%
Subscribe to or ‘follow’ brands /
companies26% 19% 36% 23% 33% 21% 17% 14% 34% 32% 13% 20% 30% 24% 38% 26% 25% 29% 21% 33% 32%
Play games 26% 20% 40% 27% 31% 16% 23% 19% 38% 18% 11% 27% 29% 18% 40% 31% 18% 24% 22% 30% 36%
Enter competitions 22% 24% 16% 24% 14% 25% 19% 8% 30% 10% 4% 10% 48% 26% 35% 26% 15% 31% 21% 32% 23%
Subscribe to or ‘follow’ celebrities 18% 14% 27% 14% 28% 15% 9% 10% 33% 14% 13% 10% 16% 7% 27% 21% 27% 16% 14% 30% 24%
Write blogs / opinion pieces 16% 9% 28% 12% 31% 8% 9% 8% 37% 22% 16% 6% 9% 5% 19% 19% 25% 16% 6% 28% 23%
None of these 9% 14% 2% 12% 2% 12% 12% 21% 1% 6% 29% 9% 8% 10% 2% 5% 6% 6% 9% 2% 8%
I just have a profile 7% 10% 3% 6% 0% 11% 9% 12% 2% 7% 5% 17% 8% 8% 3% 2% 3% 5% 8% 5% 5%
Using social mediaMarket breakdown
QS4: Which of the following do you do when using social media?
Base: All Respondents (11,400), Australia (600), Brazil (600), Canada (600), China (600), India (600), Japan (600), New Zealand (600), Russia (600), Saudi Arabia (347), South Korea (600), United
Arab Emirates (253), United States (600), Denmark (600), France (600), Germany (600), Italy (600), Netherlands (600), Norway (600), Spain (600), Sweden (600)
16
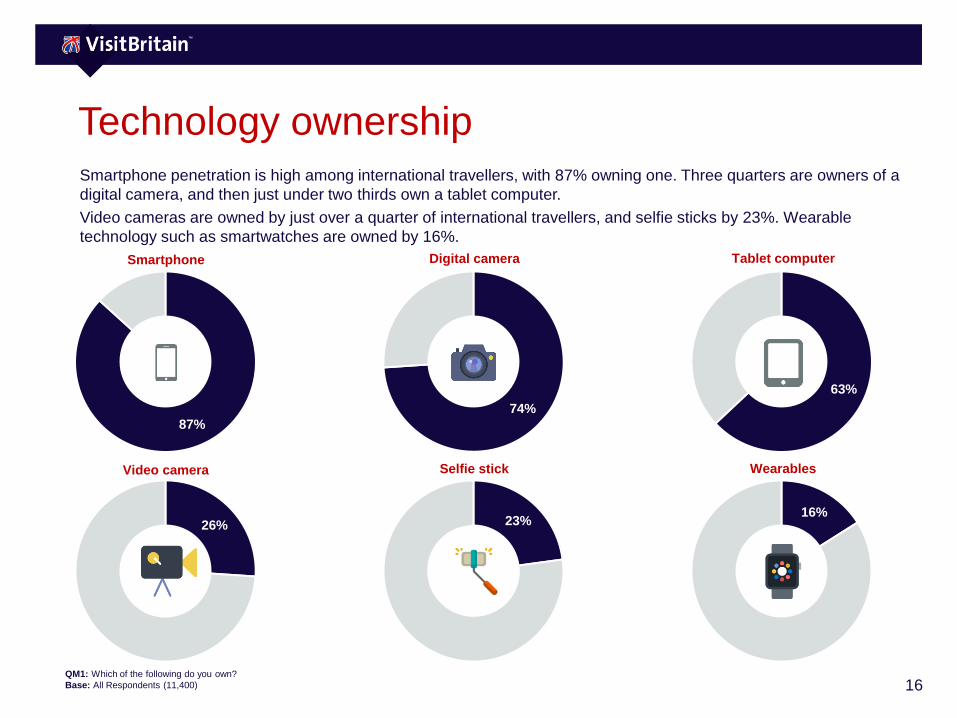
Technology ownership
87%
74%
63%
26% 23%16%
Smartphone penetration is high among international travellers, with 87% owning one. Three quarters are owners of a
digital camera, and then just under two thirds own a tablet computer.
Video cameras are owned by just over a quarter of international travellers, and selfie sticks by 23%. Wearable
technology such as smartwatches are owned by 16%.
QM1: Which of the following do you own?
Base: All Respondents (11,400)
Smartphone
Video camera
Digital camera
Selfie stick
Tablet computer
Wearables
17
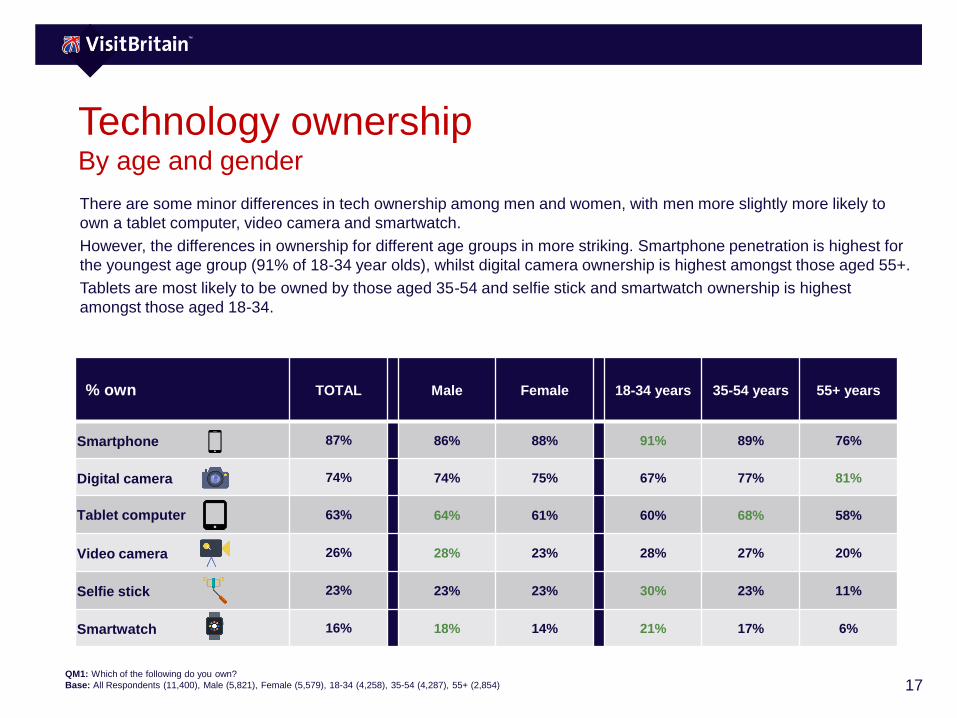
Technology ownershipBy age and gender
% own TOTAL Male Female 18-34 years 35-54 years 55+ years
Smartphone 87% 86% 88% 91% 89% 76%
Digital camera 74% 74% 75% 67% 77% 81%
Tablet computer 63% 64% 61% 60% 68% 58%
Video camera 26% 28% 23% 28% 27% 20%
Selfie stick 23% 23% 23% 30% 23% 11%
Smartwatch 16% 18% 14% 21% 17% 6%
QM1: Which of the following do you own?
Base: All Respondents (11,400), Male (5,821), Female (5,579), 18-34 (4,258), 35-54 (4,287), 55+ (2,854)
There are some minor differences in tech ownership among men and women, with men more slightly more likely to
own a tablet computer, video camera and smartwatch.
However, the differences in ownership for different age groups in more striking. Smartphone penetration is highest for
the youngest age group (91% of 18-34 year olds), whilst digital camera ownership is highest amongst those aged 55+.
Tablets are most likely to be owned by those aged 35-54 and selfie stick and smartwatch ownership is highest
amongst those aged 18-34.
18
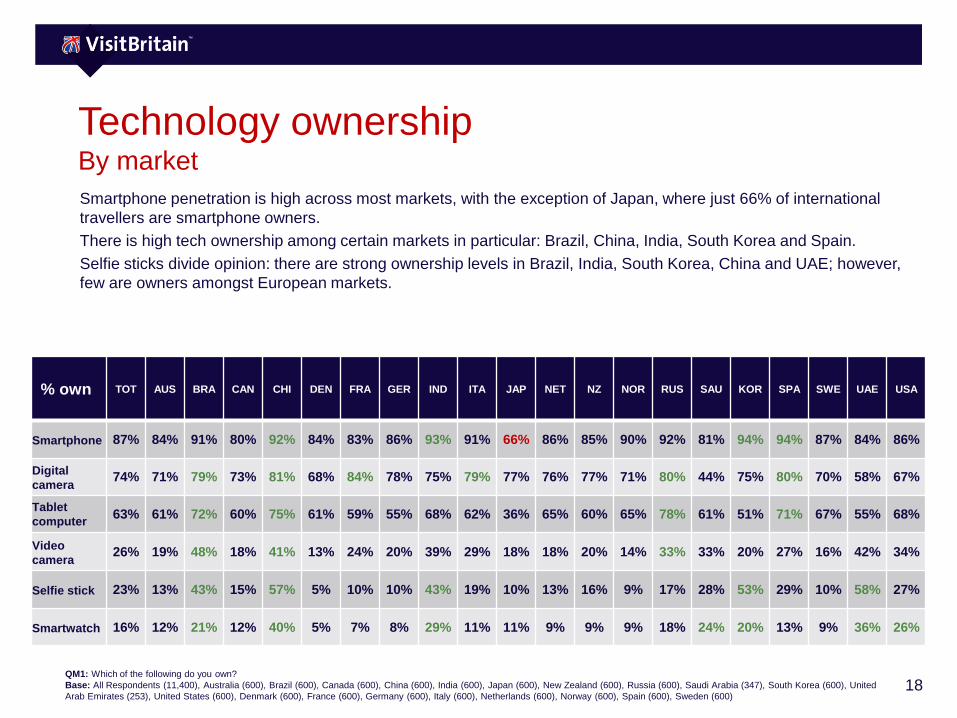
% own TOT AUS BRA CAN CHI DEN FRA GER IND ITA JAP NET NZ NOR RUS SAU KOR SPA SWE UAE USA
Smartphone 87% 84% 91% 80% 92% 84% 83% 86% 93% 91% 66% 86% 85% 90% 92% 81% 94% 94% 87% 84% 86%
Digital
camera74% 71% 79% 73% 81% 68% 84% 78% 75% 79% 77% 76% 77% 71% 80% 44% 75% 80% 70% 58% 67%
Tablet
computer63% 61% 72% 60% 75% 61% 59% 55% 68% 62% 36% 65% 60% 65% 78% 61% 51% 71% 67% 55% 68%
Video
camera26% 19% 48% 18% 41% 13% 24% 20% 39% 29% 18% 18% 20% 14% 33% 33% 20% 27% 16% 42% 34%
Selfie stick 23% 13% 43% 15% 57% 5% 10% 10% 43% 19% 10% 13% 16% 9% 17% 28% 53% 29% 10% 58% 27%
Smartwatch 16% 12% 21% 12% 40% 5% 7% 8% 29% 11% 11% 9% 9% 9% 18% 24% 20% 13% 9% 36% 26%
Technology ownershipBy market
Smartphone penetration is high across most markets, with the exception of Japan, where just 66% of international
travellers are smartphone owners.
There is high tech ownership among certain markets in particular: Brazil, China, India, South Korea and Spain.
Selfie sticks divide opinion: there are strong ownership levels in Brazil, India, South Korea, China and UAE; however,
few are owners amongst European markets.
QM1: Which of the following do you own?
Base: All Respondents (11,400), Australia (600), Brazil (600), Canada (600), China (600), India (600), Japan (600), New Zealand (600), Russia (600), Saudi Arabia (347), South Korea (600), United
Arab Emirates (253), United States (600), Denmark (600), France (600), Germany (600), Italy (600), Netherlands (600), Norway (600), Spain (600), Sweden (600)
19
Technology use on holiday
Footer Friday, October
6, 2017
20
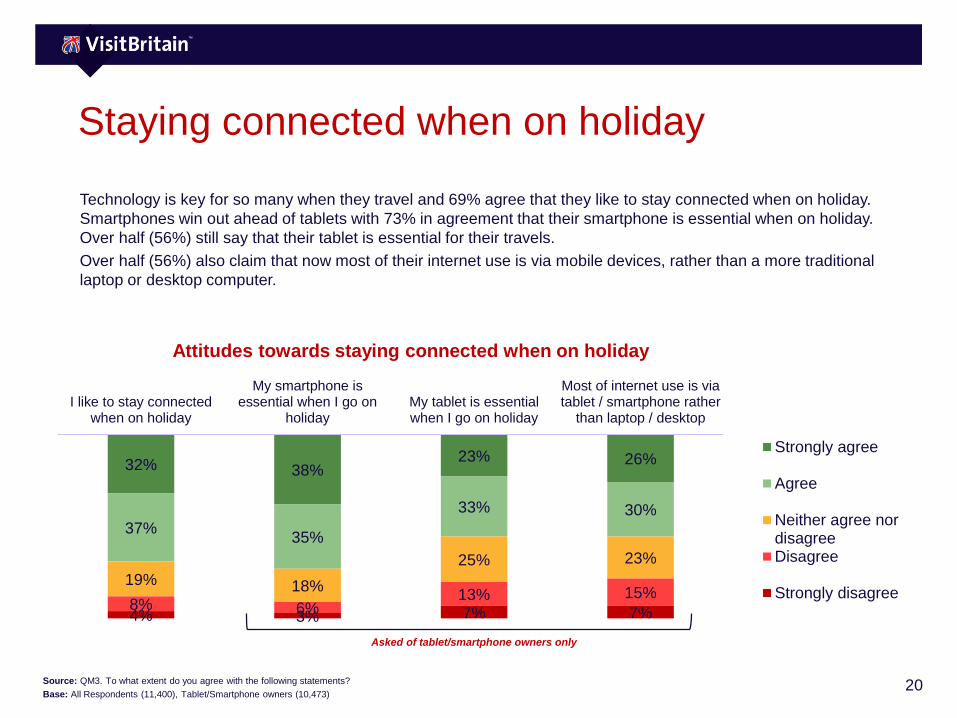
Staying connected when on holiday
Technology is key for so many when they travel and 69% agree that they like to stay connected when on holiday.
Smartphones win out ahead of tablets with 73% in agreement that their smartphone is essential when on holiday.
Over half (56%) still say that their tablet is essential for their travels.
Over half (56%) also claim that now most of their internet use is via mobile devices, rather than a more traditional
laptop or desktop computer.
32% 38%23% 26%
37%35%
33% 30%
19% 18%
25% 23%
8% 6%13% 15%
4% 3% 7% 7%
I like to stay connectedwhen on holiday
My smartphone isessential when I go on
holidayMy tablet is essentialwhen I go on holiday
Most of internet use is viatablet / smartphone rather
than laptop / desktop
Attitudes towards staying connected when on holiday
Strongly agree
Agree
Neither agree nordisagreeDisagree
Strongly disagree
Source: QM3. To what extent do you agree with the following statements?
Base: All Respondents (11,400), Tablet/Smartphone owners (10,473)
Asked of tablet/smartphone owners only
21
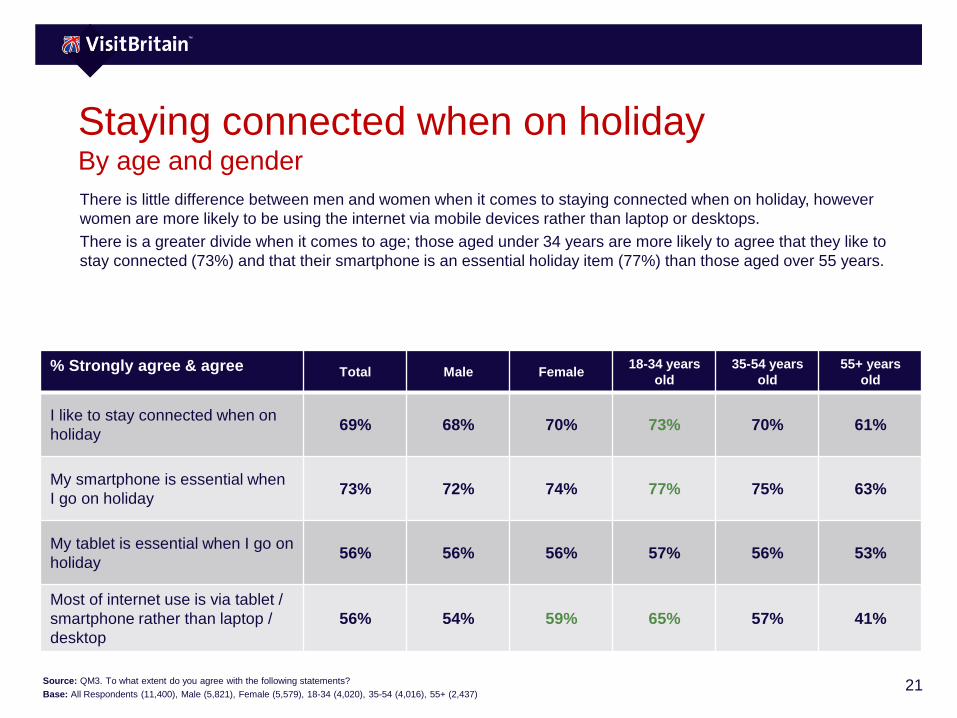
Staying connected when on holidayBy age and gender
There is little difference between men and women when it comes to staying connected when on holiday, however
women are more likely to be using the internet via mobile devices rather than laptop or desktops.
There is a greater divide when it comes to age; those aged under 34 years are more likely to agree that they like to
stay connected (73%) and that their smartphone is an essential holiday item (77%) than those aged over 55 years.
% Strongly agree & agree Total Male Female18-34 years
old
35-54 years
old
55+ years
old
I like to stay connected when on
holiday69% 68% 70% 73% 70% 61%
My smartphone is essential when
I go on holiday73% 72% 74% 77% 75% 63%
My tablet is essential when I go on
holiday56% 56% 56% 57% 56% 53%
Most of internet use is via tablet /
smartphone rather than laptop /
desktop
56% 54% 59% 65% 57% 41%
Source: QM3. To what extent do you agree with the following statements?
Base: All Respondents (11,400), Male (5,821), Female (5,579), 18-34 (4,020), 35-54 (4,016), 55+ (2,437)
22
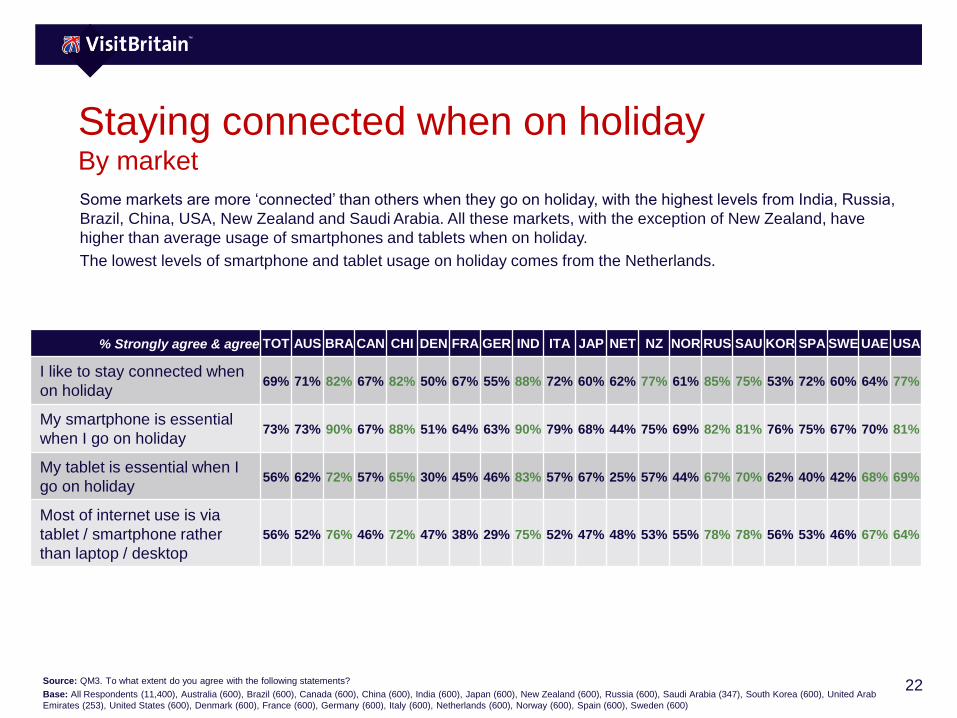
Staying connected when on holidayBy market
Some markets are more ‘connected’ than others when they go on holiday, with the highest levels from India, Russia,
Brazil, China, USA, New Zealand and Saudi Arabia. All these markets, with the exception of New Zealand, have
higher than average usage of smartphones and tablets when on holiday.
The lowest levels of smartphone and tablet usage on holiday comes from the Netherlands.
% Strongly agree & agree TOT AUS BRA CAN CHI DEN FRA GER IND ITA JAP NET NZ NOR RUS SAU KOR SPA SWE UAE USA
I like to stay connected when
on holiday69% 71% 82% 67% 82% 50% 67% 55% 88% 72% 60% 62% 77% 61% 85% 75% 53% 72% 60% 64% 77%
My smartphone is essential
when I go on holiday73% 73% 90% 67% 88% 51% 64% 63% 90% 79% 68% 44% 75% 69% 82% 81% 76% 75% 67% 70% 81%
My tablet is essential when I
go on holiday56% 62% 72% 57% 65% 30% 45% 46% 83% 57% 67% 25% 57% 44% 67% 70% 62% 40% 42% 68% 69%
Most of internet use is via
tablet / smartphone rather
than laptop / desktop
56% 52% 76% 46% 72% 47% 38% 29% 75% 52% 47% 48% 53% 55% 78% 78% 56% 53% 46% 67% 64%
Source: QM3. To what extent do you agree with the following statements?
Base: All Respondents (11,400), Australia (600), Brazil (600), Canada (600), China (600), India (600), Japan (600), New Zealand (600), Russia (600), Saudi Arabia (347), South Korea (600), United Arab
Emirates (253), United States (600), Denmark (600), France (600), Germany (600), Italy (600), Netherlands (600), Norway (600), Spain (600), Sweden (600)
23
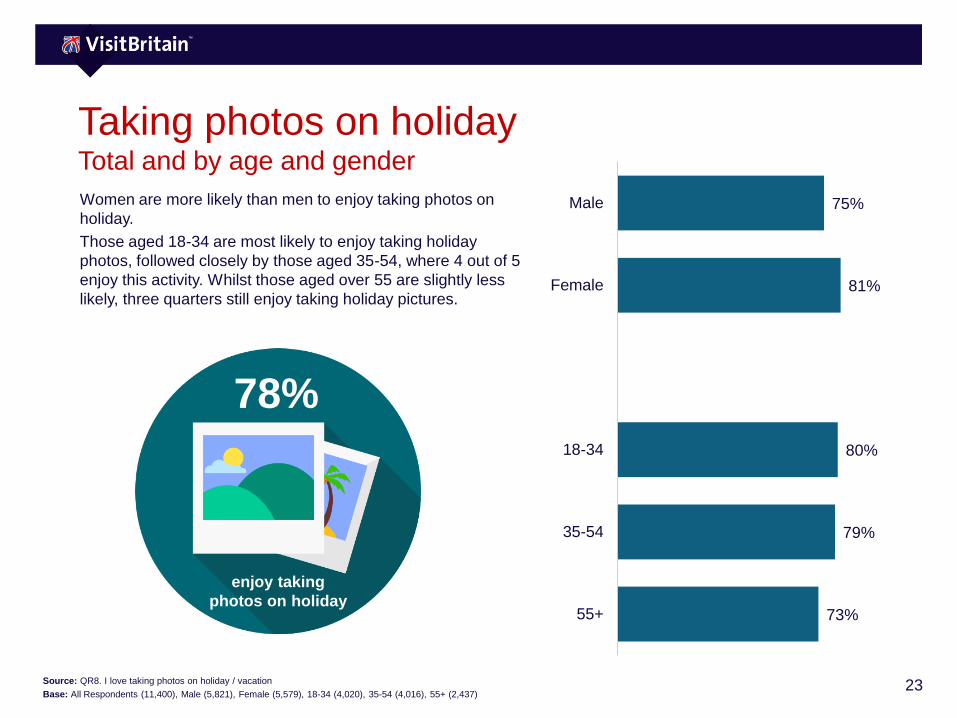
Taking photos on holidayTotal and by age and gender
Women are more likely than men to enjoy taking photos on
holiday.
Those aged 18-34 are most likely to enjoy taking holiday
photos, followed closely by those aged 35-54, where 4 out of 5
enjoy this activity. Whilst those aged over 55 are slightly less
likely, three quarters still enjoy taking holiday pictures.
Source: QR8. I love taking photos on holiday / vacation
Base: All Respondents (11,400), Male (5,821), Female (5,579), 18-34 (4,020), 35-54 (4,016), 55+ (2,437)
75%
81%
80%
79%
73%
Male
Female
18-34
35-54
55+
78%
enjoy taking
photos on holiday
24
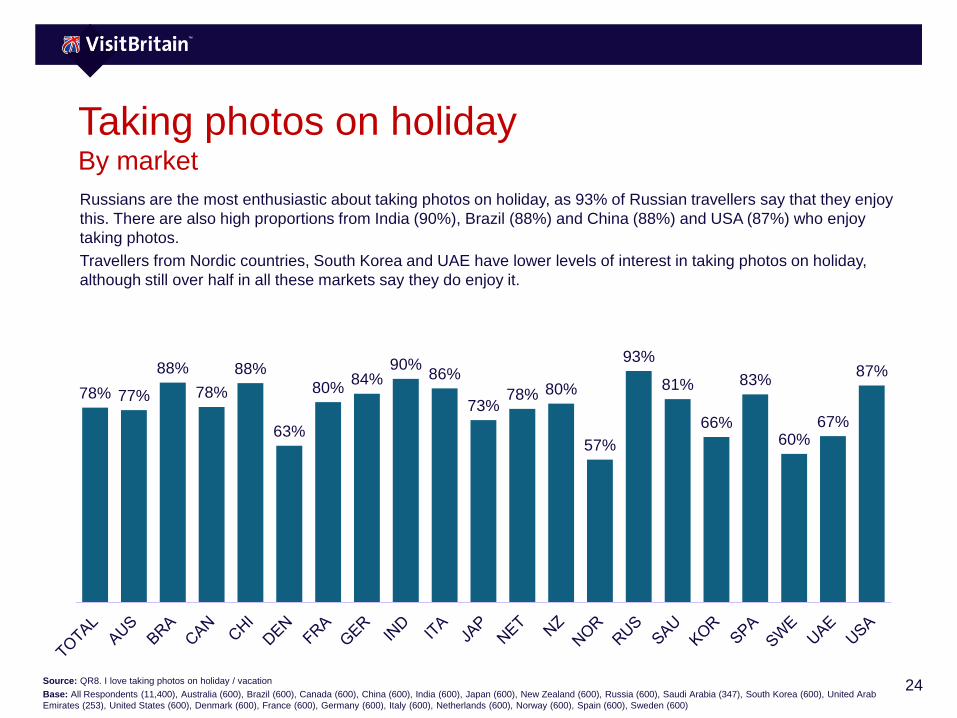
Taking photos on holidayBy market
Russians are the most enthusiastic about taking photos on holiday, as 93% of Russian travellers say that they enjoy
this. There are also high proportions from India (90%), Brazil (88%) and China (88%) and USA (87%) who enjoy
taking photos.
Travellers from Nordic countries, South Korea and UAE have lower levels of interest in taking photos on holiday,
although still over half in all these markets say they do enjoy it.
Source: QR8. I love taking photos on holiday / vacation
Base: All Respondents (11,400), Australia (600), Brazil (600), Canada (600), China (600), India (600), Japan (600), New Zealand (600), Russia (600), Saudi Arabia (347), South Korea (600), United Arab
Emirates (253), United States (600), Denmark (600), France (600), Germany (600), Italy (600), Netherlands (600), Norway (600), Spain (600), Sweden (600)
78% 77%
88%
78%
88%
63%
80%84%
90%86%
73%78% 80%
57%
93%
81%
66%
83%
60%67%
87%
25
Sharing holiday photos and videos online
61%17%
21%
Taken photos on holiday and shared them online
42%
23%
35%
Taken videos on holiday and shared them online
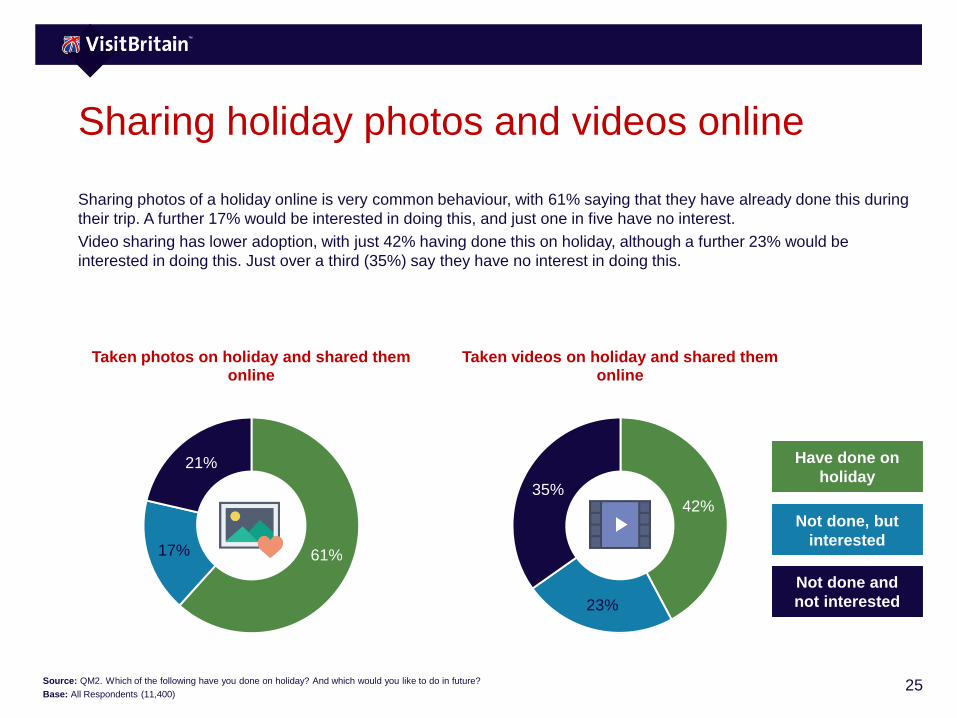
Sharing photos of a holiday online is very common behaviour, with 61% saying that they have already done this during
their trip. A further 17% would be interested in doing this, and just one in five have no interest.
Video sharing has lower adoption, with just 42% having done this on holiday, although a further 23% would be
interested in doing this. Just over a third (35%) say they have no interest in doing this.
Source: QM2. Which of the following have you done on holiday? And which would you like to do in future?
Base: All Respondents (11,400)
Have done on
holiday
Not done, but
interested
Not done and
not interested
26
Sharing holiday photos and videos onlineBy age and gender
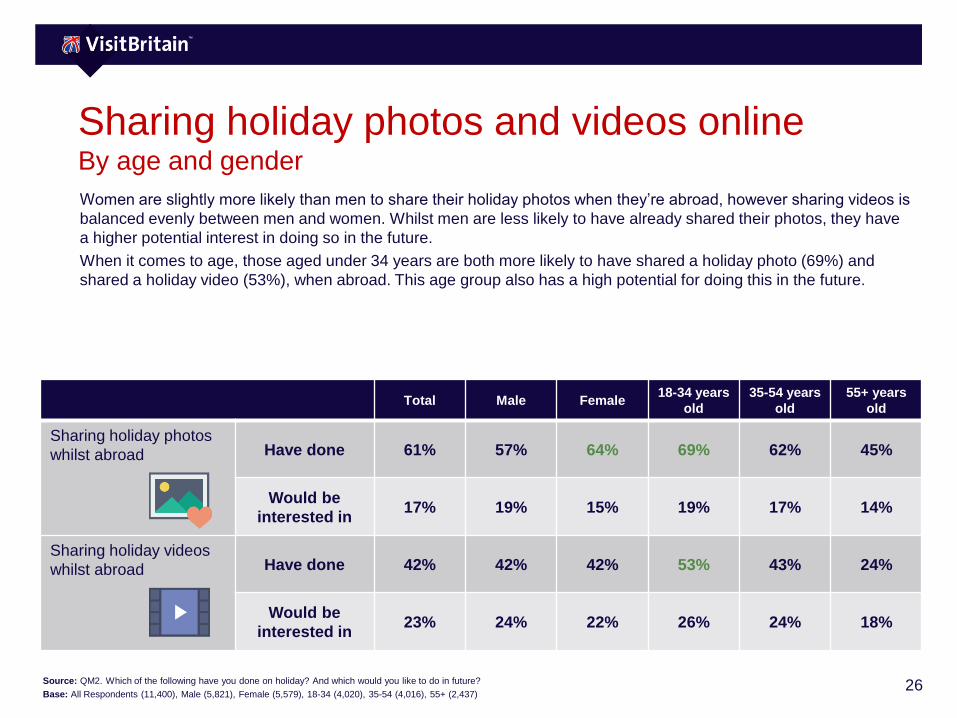
Women are slightly more likely than men to share their holiday photos when they’re abroad, however sharing videos is
balanced evenly between men and women. Whilst men are less likely to have already shared their photos, they have
a higher potential interest in doing so in the future.
When it comes to age, those aged under 34 years are both more likely to have shared a holiday photo (69%) and
shared a holiday video (53%), when abroad. This age group also has a high potential for doing this in the future.
Total Male Female18-34 years
old
35-54 years
old
55+ years
old
Sharing holiday photos
whilst abroad Have done 61% 57% 64% 69% 62% 45%
Would be
interested in17% 19% 15% 19% 17% 14%
Sharing holiday videos
whilst abroad Have done 42% 42% 42% 53% 43% 24%
Would be
interested in23% 24% 22% 26% 24% 18%
Source: QM2. Which of the following have you done on holiday? And which would you like to do in future?
Base: All Respondents (11,400), Male (5,821), Female (5,579), 18-34 (4,020), 35-54 (4,016), 55+ (2,437)
27
Sharing holiday photos onlineBy market
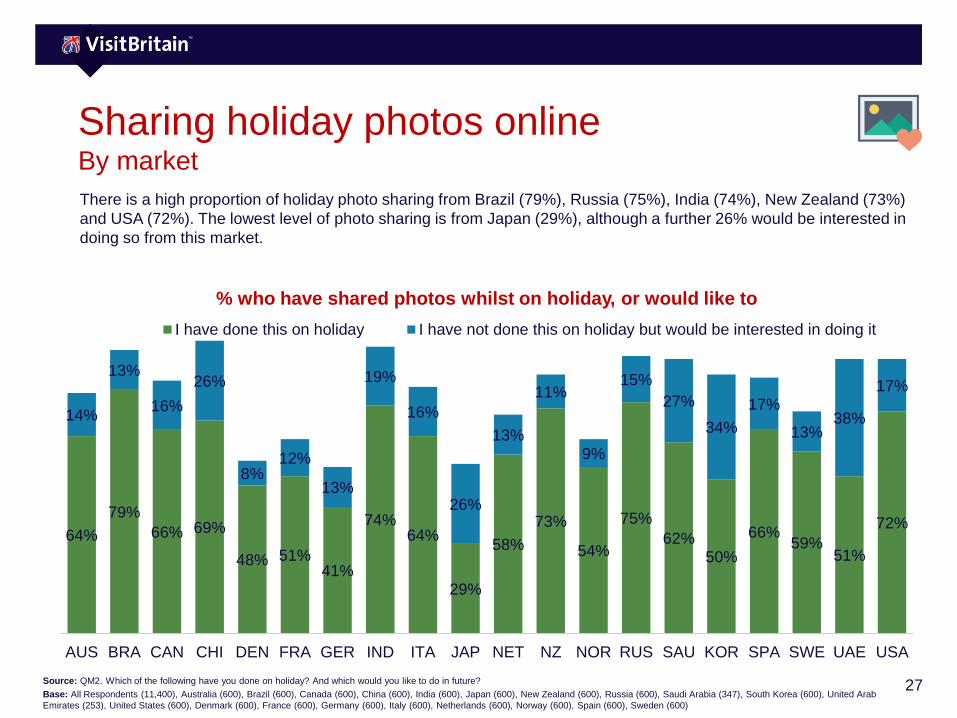
There is a high proportion of holiday photo sharing from Brazil (79%), Russia (75%), India (74%), New Zealand (73%)
and USA (72%). The lowest level of photo sharing is from Japan (29%), although a further 26% would be interested in
doing so from this market.
64%
79%
66% 69%
48% 51%41%
74%64%
29%
58%
73%
54%
75%
62%50%
66%59%
51%
72%
14%
13%
16%
26%
8%12%
13%
19%
16%
26%
13%
11%
9%
15%
27%
34%
17%
13%38%
17%
AUS BRA CAN CHI DEN FRA GER IND ITA JAP NET NZ NOR RUS SAU KOR SPA SWE UAE USA
% who have shared photos whilst on holiday, or would like to
I have done this on holiday I have not done this on holiday but would be interested in doing it
Source: QM2. Which of the following have you done on holiday? And which would you like to do in future?
Base: All Respondents (11,400), Australia (600), Brazil (600), Canada (600), China (600), India (600), Japan (600), New Zealand (600), Russia (600), Saudi Arabia (347), South Korea (600), United Arab
Emirates (253), United States (600), Denmark (600), France (600), Germany (600), Italy (600), Netherlands (600), Norway (600), Spain (600), Sweden (600)
28
Sharing holiday videos onlineBy market
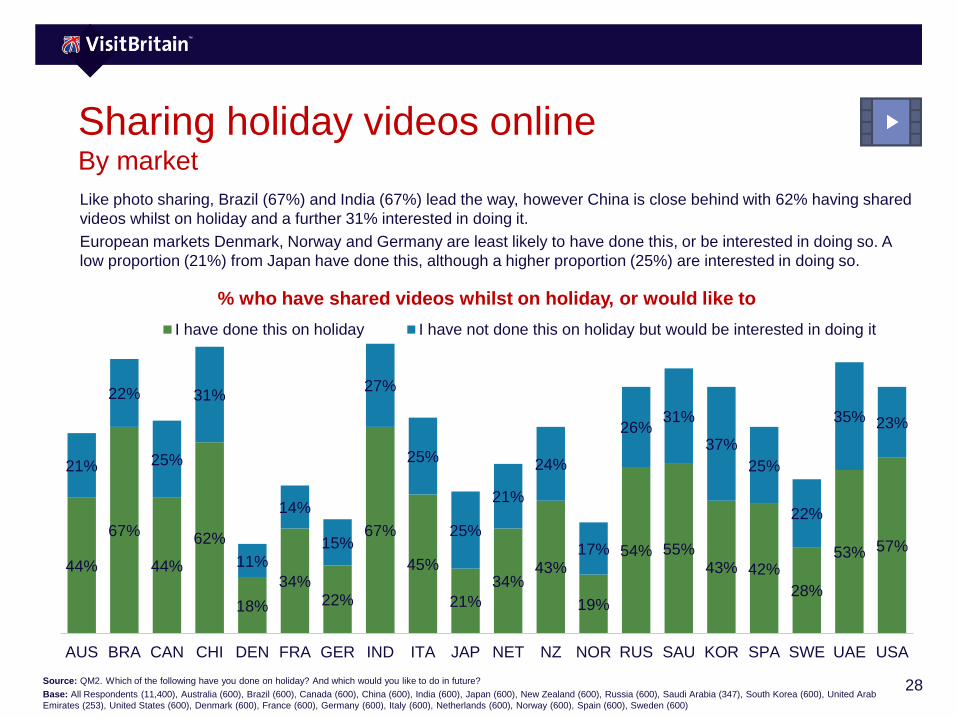
Like photo sharing, Brazil (67%) and India (67%) lead the way, however China is close behind with 62% having shared
videos whilst on holiday and a further 31% interested in doing it.
European markets Denmark, Norway and Germany are least likely to have done this, or be interested in doing so. A
low proportion (21%) from Japan have done this, although a higher proportion (25%) are interested in doing so.
44%
67%
44%
62%
18%
34%22%
67%
45%
21%
34%43%
19%
54% 55%43% 42%
28%
53% 57%
21%
22%
25%
31%
11%
14%
15%
27%
25%
25%
21%
24%
17%
26%31%
37%
25%
22%
35% 23%
AUS BRA CAN CHI DEN FRA GER IND ITA JAP NET NZ NOR RUS SAU KOR SPA SWE UAE USA
% who have shared videos whilst on holiday, or would like to
I have done this on holiday I have not done this on holiday but would be interested in doing it
Source: QM2. Which of the following have you done on holiday? And which would you like to do in future?
Base: All Respondents (11,400), Australia (600), Brazil (600), Canada (600), China (600), India (600), Japan (600), New Zealand (600), Russia (600), Saudi Arabia (347), South Korea (600), United Arab
Emirates (253), United States (600), Denmark (600), France (600), Germany (600), Italy (600), Netherlands (600), Norway (600), Spain (600), Sweden (600)
29
Location technology
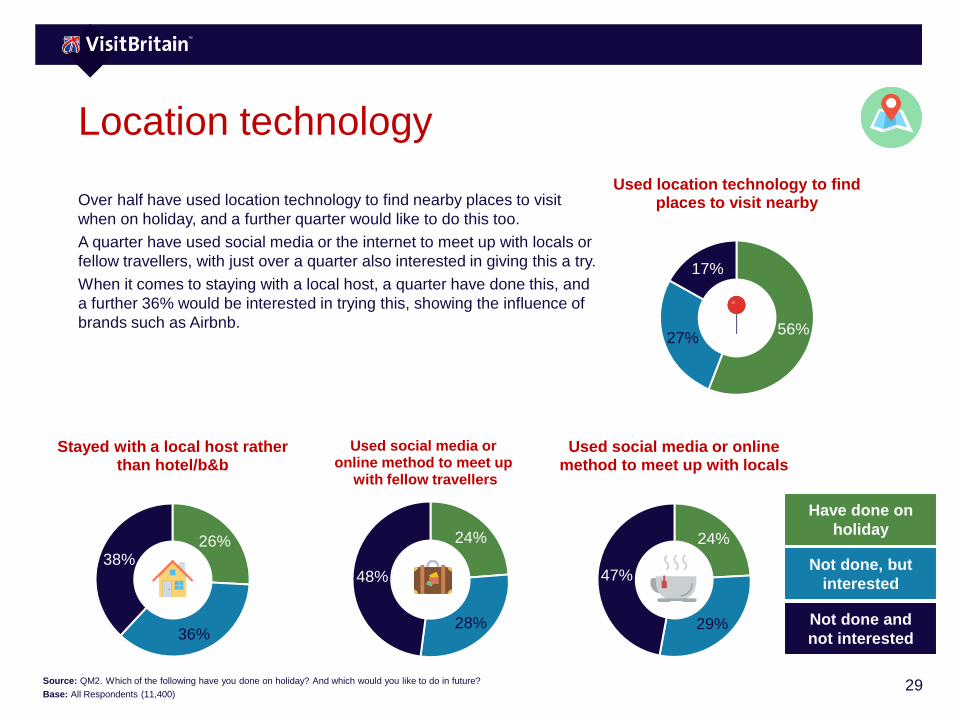
Over half have used location technology to find nearby places to visit
when on holiday, and a further quarter would like to do this too.
A quarter have used social media or the internet to meet up with locals or
fellow travellers, with just over a quarter also interested in giving this a try.
When it comes to staying with a local host, a quarter have done this, and
a further 36% would be interested in trying this, showing the influence of
brands such as Airbnb.
26%
36%
38%
Stayed with a local host rather than hotel/b&b
24%
28%
48%
Used social media or online method to meet up
with fellow travellers
24%
29%
47%
Used social media or online method to meet up with locals
56%27%
17%
Used location technology to find places to visit nearby
Source: QM2. Which of the following have you done on holiday? And which would you like to do in future?
Base: All Respondents (11,400)
Have done on
holiday
Not done, but
interested
Not done and
not interested
30
Location technologyBy age and gender
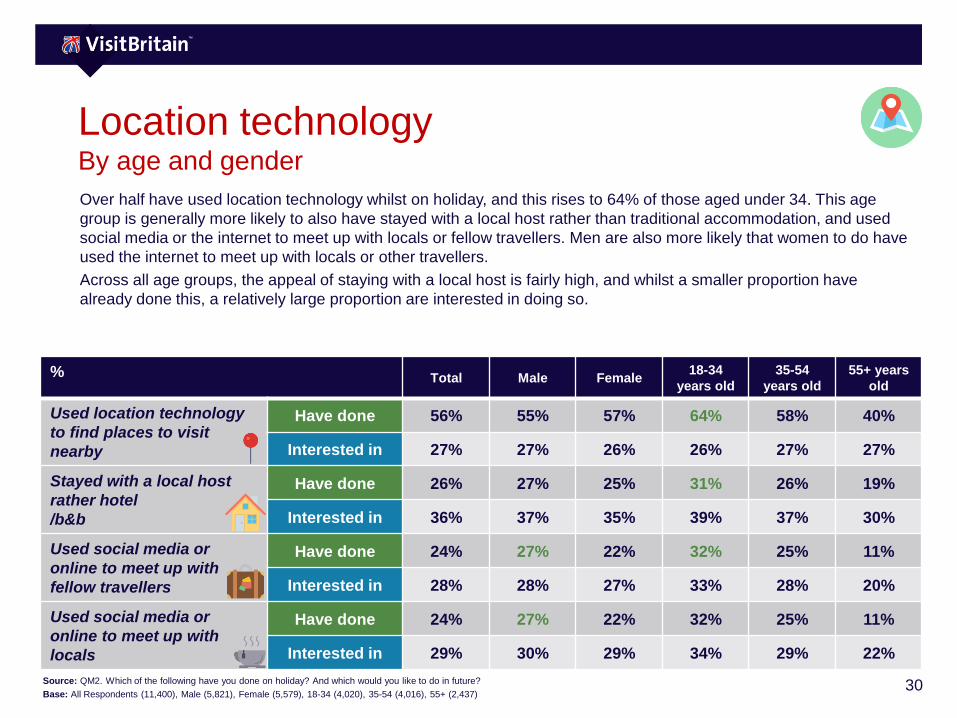
Over half have used location technology whilst on holiday, and this rises to 64% of those aged under 34. This age
group is generally more likely to also have stayed with a local host rather than traditional accommodation, and used
social media or the internet to meet up with locals or fellow travellers. Men are also more likely that women to do have
used the internet to meet up with locals or other travellers.
Across all age groups, the appeal of staying with a local host is fairly high, and whilst a smaller proportion have
already done this, a relatively large proportion are interested in doing so.
% Total Male Female18-34
years old
35-54
years old
55+ years
old
Used location technology
to find places to visit
nearby
Have done 56% 55% 57% 64% 58% 40%
Interested in 27% 27% 26% 26% 27% 27%
Stayed with a local host
rather hotel
/b&b
Have done 26% 27% 25% 31% 26% 19%
Interested in 36% 37% 35% 39% 37% 30%
Used social media or
online to meet up with
fellow travellers
Have done 24% 27% 22% 32% 25% 11%
Interested in 28% 28% 27% 33% 28% 20%
Used social media or
online to meet up with
locals
Have done 24% 27% 22% 32% 25% 11%
Interested in 29% 30% 29% 34% 29% 22%
Source: QM2. Which of the following have you done on holiday? And which would you like to do in future?
Base: All Respondents (11,400), Male (5,821), Female (5,579), 18-34 (4,020), 35-54 (4,016), 55+ (2,437)
31
Location technologyBy market
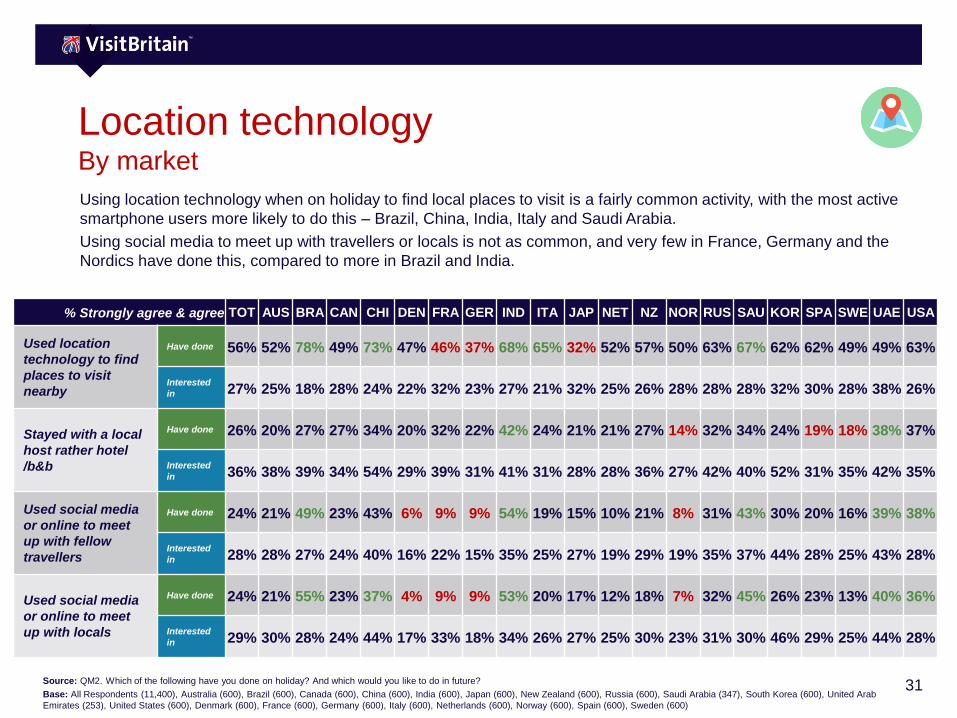
Using location technology when on holiday to find local places to visit is a fairly common activity, with the most active
smartphone users more likely to do this – Brazil, China, India, Italy and Saudi Arabia.
Using social media to meet up with travellers or locals is not as common, and very few in France, Germany and the
Nordics have done this, compared to more in Brazil and India.
% Strongly agree & agree TOT AUS BRA CAN CHI DEN FRA GER IND ITA JAP NET NZ NOR RUS SAU KOR SPA SWE UAE USA
Used location
technology to find
places to visit
nearby
Have done 56% 52% 78% 49% 73% 47% 46% 37% 68% 65% 32% 52% 57% 50% 63% 67% 62% 62% 49% 49% 63%
Interested
in 27% 25% 18% 28% 24% 22% 32% 23% 27% 21% 32% 25% 26% 28% 28% 28% 32% 30% 28% 38% 26%
Stayed with a local
host rather hotel
/b&b
Have done 26% 20% 27% 27% 34% 20% 32% 22% 42% 24% 21% 21% 27% 14% 32% 34% 24% 19% 18% 38% 37%
Interested
in 36% 38% 39% 34% 54% 29% 39% 31% 41% 31% 28% 28% 36% 27% 42% 40% 52% 31% 35% 42% 35%
Used social media
or online to meet
up with fellow
travellers
Have done 24% 21% 49% 23% 43% 6% 9% 9% 54% 19% 15% 10% 21% 8% 31% 43% 30% 20% 16% 39% 38%
Interested
in 28% 28% 27% 24% 40% 16% 22% 15% 35% 25% 27% 19% 29% 19% 35% 37% 44% 28% 25% 43% 28%
Used social media
or online to meet
up with locals
Have done 24% 21% 55% 23% 37% 4% 9% 9% 53% 20% 17% 12% 18% 7% 32% 45% 26% 23% 13% 40% 36%
Interested
in 29% 30% 28% 24% 44% 17% 33% 18% 34% 26% 27% 25% 30% 23% 31% 30% 46% 29% 25% 44% 28%
Source: QM2. Which of the following have you done on holiday? And which would you like to do in future?
Base: All Respondents (11,400), Australia (600), Brazil (600), Canada (600), China (600), India (600), Japan (600), New Zealand (600), Russia (600), Saudi Arabia (347), South Korea (600), United Arab
Emirates (253), United States (600), Denmark (600), France (600), Germany (600), Italy (600), Netherlands (600), Norway (600), Spain (600), Sweden (600)
32
Social media usage on last
holiday
Footer Friday, October
6, 2017
33
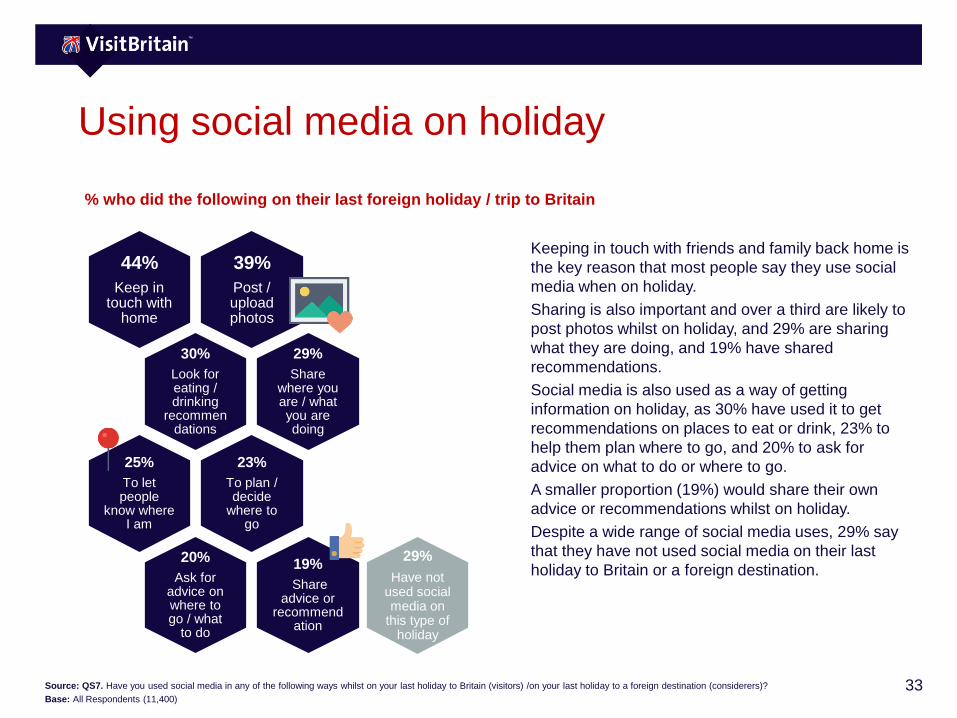
Using social media on holiday
Keeping in touch with friends and family back home is
the key reason that most people say they use social
media when on holiday.
Sharing is also important and over a third are likely to
post photos whilst on holiday, and 29% are sharing
what they are doing, and 19% have shared
recommendations.
Social media is also used as a way of getting
information on holiday, as 30% have used it to get
recommendations on places to eat or drink, 23% to
help them plan where to go, and 20% to ask for
advice on what to do or where to go.
A smaller proportion (19%) would share their own
advice or recommendations whilst on holiday.
Despite a wide range of social media uses, 29% say
that they have not used social media on their last
holiday to Britain or a foreign destination.
39%
Post / upload photos
44%
Keep in touch with
home
30%
Look for eating / drinking
recommendations
29%
Share where you are / what you are doing
23%
To plan / decide
where to go
25%
To let people
know where I am
20%
Ask for advice on where to go / what
to do
19%
Share advice or
recommendation
Source: QS7. Have you used social media in any of the following ways whilst on your last holiday to Britain (visitors) /on your last holiday to a foreign destination (considerers)?
Base: All Respondents (11,400)
29%
Have not used social media on
this type of holiday
% who did the following on their last foreign holiday / trip to Britain
34
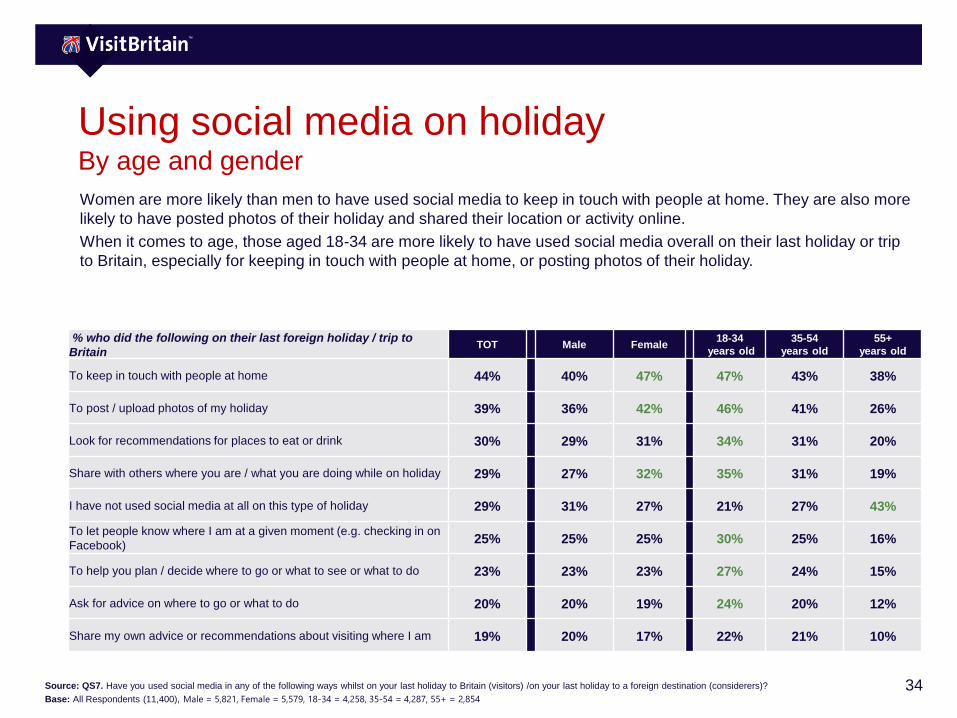
Using social media on holidayBy age and gender
Women are more likely than men to have used social media to keep in touch with people at home. They are also more
likely to have posted photos of their holiday and shared their location or activity online.
When it comes to age, those aged 18-34 are more likely to have used social media overall on their last holiday or trip
to Britain, especially for keeping in touch with people at home, or posting photos of their holiday.
% who did the following on their last foreign holiday / trip to
BritainTOT Male Female
18-34
years old
35-54
years old
55+
years old
To keep in touch with people at home 44% 40% 47% 47% 43% 38%
To post / upload photos of my holiday 39% 36% 42% 46% 41% 26%
Look for recommendations for places to eat or drink 30% 29% 31% 34% 31% 20%
Share with others where you are / what you are doing while on holiday 29% 27% 32% 35% 31% 19%
I have not used social media at all on this type of holiday 29% 31% 27% 21% 27% 43%
To let people know where I am at a given moment (e.g. checking in on
Facebook)25% 25% 25% 30% 25% 16%
To help you plan / decide where to go or what to see or what to do 23% 23% 23% 27% 24% 15%
Ask for advice on where to go or what to do 20% 20% 19% 24% 20% 12%
Share my own advice or recommendations about visiting where I am 19% 20% 17% 22% 21% 10%
Source: QS7. Have you used social media in any of the following ways whilst on your last holiday to Britain (visitors) /on your last holiday to a foreign destination (considerers)?
Base: All Respondents (11,400), Male = 5,821, Female = 5,579, 18-34 = 4,258, 35-54 = 4,287, 55+ = 2,854
35
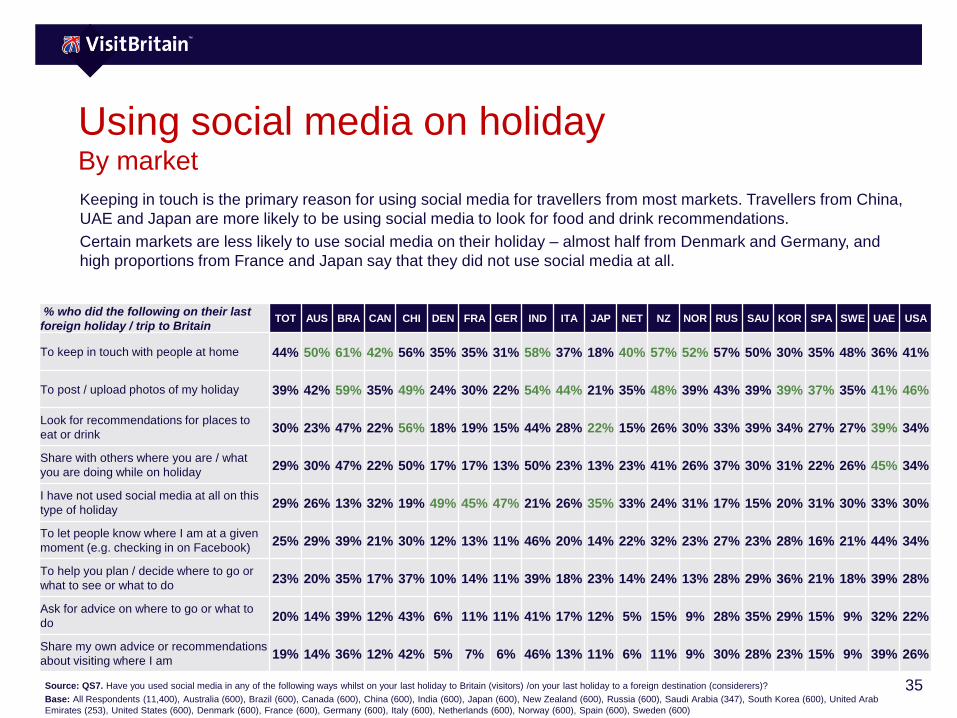
Using social media on holidayBy market
Keeping in touch is the primary reason for using social media for travellers from most markets. Travellers from China,
UAE and Japan are more likely to be using social media to look for food and drink recommendations.
Certain markets are less likely to use social media on their holiday – almost half from Denmark and Germany, and
high proportions from France and Japan say that they did not use social media at all.
% who did the following on their last
foreign holiday / trip to BritainTOT AUS BRA CAN CHI DEN FRA GER IND ITA JAP NET NZ NOR RUS SAU KOR SPA SWE UAE USA
To keep in touch with people at home 44% 50% 61% 42% 56% 35% 35% 31% 58% 37% 18% 40% 57% 52% 57% 50% 30% 35% 48% 36% 41%
To post / upload photos of my holiday 39% 42% 59% 35% 49% 24% 30% 22% 54% 44% 21% 35% 48% 39% 43% 39% 39% 37% 35% 41% 46%
Look for recommendations for places to
eat or drink30% 23% 47% 22% 56% 18% 19% 15% 44% 28% 22% 15% 26% 30% 33% 39% 34% 27% 27% 39% 34%
Share with others where you are / what
you are doing while on holiday29% 30% 47% 22% 50% 17% 17% 13% 50% 23% 13% 23% 41% 26% 37% 30% 31% 22% 26% 45% 34%
I have not used social media at all on this
type of holiday29% 26% 13% 32% 19% 49% 45% 47% 21% 26% 35% 33% 24% 31% 17% 15% 20% 31% 30% 33% 30%
To let people know where I am at a given
moment (e.g. checking in on Facebook)25% 29% 39% 21% 30% 12% 13% 11% 46% 20% 14% 22% 32% 23% 27% 23% 28% 16% 21% 44% 34%
To help you plan / decide where to go or
what to see or what to do23% 20% 35% 17% 37% 10% 14% 11% 39% 18% 23% 14% 24% 13% 28% 29% 36% 21% 18% 39% 28%
Ask for advice on where to go or what to
do20% 14% 39% 12% 43% 6% 11% 11% 41% 17% 12% 5% 15% 9% 28% 35% 29% 15% 9% 32% 22%
Share my own advice or recommendations
about visiting where I am19% 14% 36% 12% 42% 5% 7% 6% 46% 13% 11% 6% 11% 9% 30% 28% 23% 15% 9% 39% 26%
Source: QS7. Have you used social media in any of the following ways whilst on your last holiday to Britain (visitors) /on your last holiday to a foreign destination (considerers)?
Base: All Respondents (11,400), Australia (600), Brazil (600), Canada (600), China (600), India (600), Japan (600), New Zealand (600), Russia (600), Saudi Arabia (347), South Korea (600), United Arab
Emirates (253), United States (600), Denmark (600), France (600), Germany (600), Italy (600), Netherlands (600), Norway (600), Spain (600), Sweden (600)
36
Writing and using reviews
on holiday
Footer Friday, October
6, 2017
37
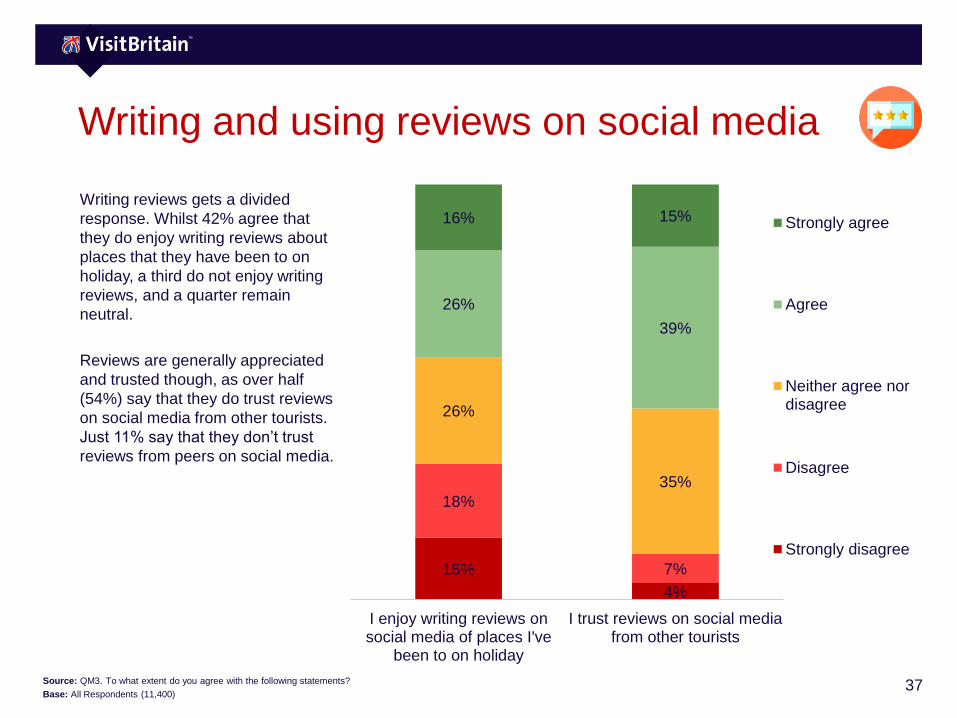
Writing and using reviews on social media
Writing reviews gets a divided
response. Whilst 42% agree that
they do enjoy writing reviews about
places that they have been to on
holiday, a third do not enjoy writing
reviews, and a quarter remain
neutral.
Reviews are generally appreciated
and trusted though, as over half
(54%) say that they do trust reviews
on social media from other tourists.
Just 11% say that they don’t trust
reviews from peers on social media.
15%
4%
18%
7%
26%
35%
26%
39%
16% 15%
I enjoy writing reviews onsocial media of places I've
been to on holiday
I trust reviews on social mediafrom other tourists
Strongly agree
Agree
Neither agree nordisagree
Disagree
Strongly disagree
Source: QM3. To what extent do you agree with the following statements?
Base: All Respondents (11,400)
38
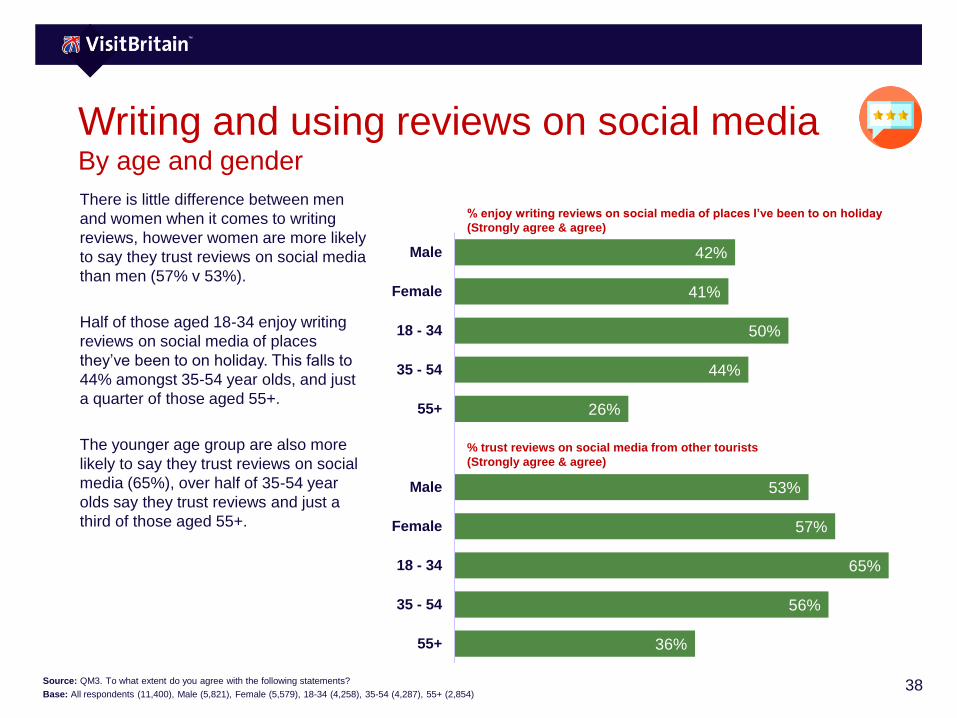
Writing and using reviews on social mediaBy age and gender
There is little difference between men
and women when it comes to writing
reviews, however women are more likely
to say they trust reviews on social media
than men (57% v 53%).
Half of those aged 18-34 enjoy writing
reviews on social media of places
they’ve been to on holiday. This falls to
44% amongst 35-54 year olds, and just
a quarter of those aged 55+.
The younger age group are also more
likely to say they trust reviews on social
media (65%), over half of 35-54 year
olds say they trust reviews and just a
third of those aged 55+.
42%
41%
50%
44%
26%
53%
57%
65%
56%
36%
Male
Female
18 - 34
35 - 54
55+
Male
Female
18 - 34
35 - 54
55+
Source: QM3. To what extent do you agree with the following statements?
Base: All respondents (11,400), Male (5,821), Female (5,579), 18-34 (4,258), 35-54 (4,287), 55+ (2,854)
% enjoy writing reviews on social media of places I’ve been to on holiday
(Strongly agree & agree)
% trust reviews on social media from other tourists
(Strongly agree & agree)
39
36%
74%
39%
72%
8% 35% 18%
79%51%
36% 18% 27% 15%
54%66%
46% 46%19%
60% 53%
AUS BRA CAN CHI DEN FRA GER IND ITA JAP NET NZ NOR RUS SAU KOR SPA SWE UAE USA
Writing and using reviews on social mediaBy market
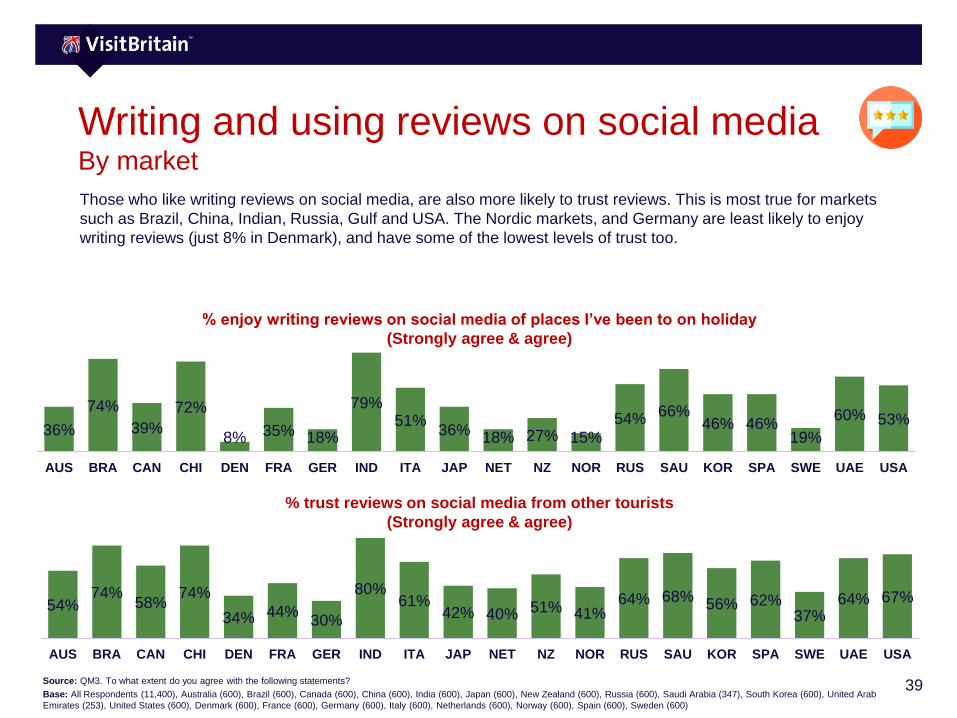
Those who like writing reviews on social media, are also more likely to trust reviews. This is most true for markets
such as Brazil, China, Indian, Russia, Gulf and USA. The Nordic markets, and Germany are least likely to enjoy
writing reviews (just 8% in Denmark), and have some of the lowest levels of trust too.
54%74%
58%74%
34% 44%30%
80%61%
42% 40% 51% 41%64% 68%
56% 62%37%
64% 67%
AUS BRA CAN CHI DEN FRA GER IND ITA JAP NET NZ NOR RUS SAU KOR SPA SWE UAE USA
Source: QM3. To what extent do you agree with the following statements?
Base: All Respondents (11,400), Australia (600), Brazil (600), Canada (600), China (600), India (600), Japan (600), New Zealand (600), Russia (600), Saudi Arabia (347), South Korea (600), United Arab
Emirates (253), United States (600), Denmark (600), France (600), Germany (600), Italy (600), Netherlands (600), Norway (600), Spain (600), Sweden (600)
% enjoy writing reviews on social media of places I’ve been to on holiday
(Strongly agree & agree)
% trust reviews on social media from other tourists
(Strongly agree & agree)
40
Using smartphone to access reviews
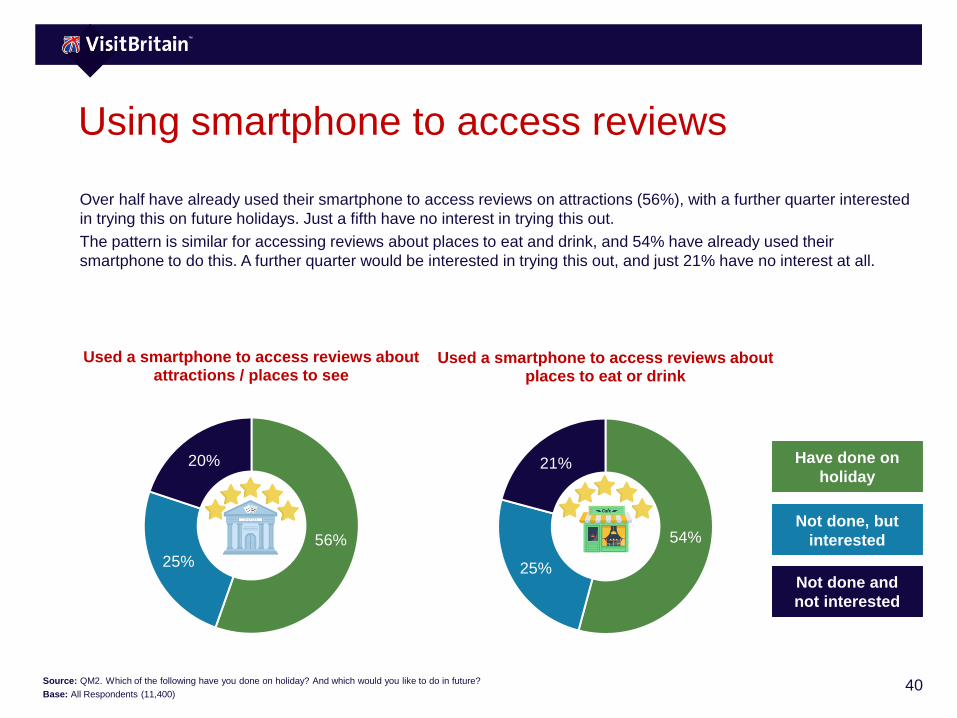
Over half have already used their smartphone to access reviews on attractions (56%), with a further quarter interested
in trying this on future holidays. Just a fifth have no interest in trying this out.
The pattern is similar for accessing reviews about places to eat and drink, and 54% have already used their
smartphone to do this. A further quarter would be interested in trying this out, and just 21% have no interest at all.
Source: QM2. Which of the following have you done on holiday? And which would you like to do in future?
Base: All Respondents (11,400)
56%
25%
20%
Used a smartphone to access reviews about attractions / places to see
54%
25%
21%
Used a smartphone to access reviews about places to eat or drink
Have done on
holiday
Not done, but
interested
Not done and
not interested
41
Using a smartphone to access reviewsBy age and gender
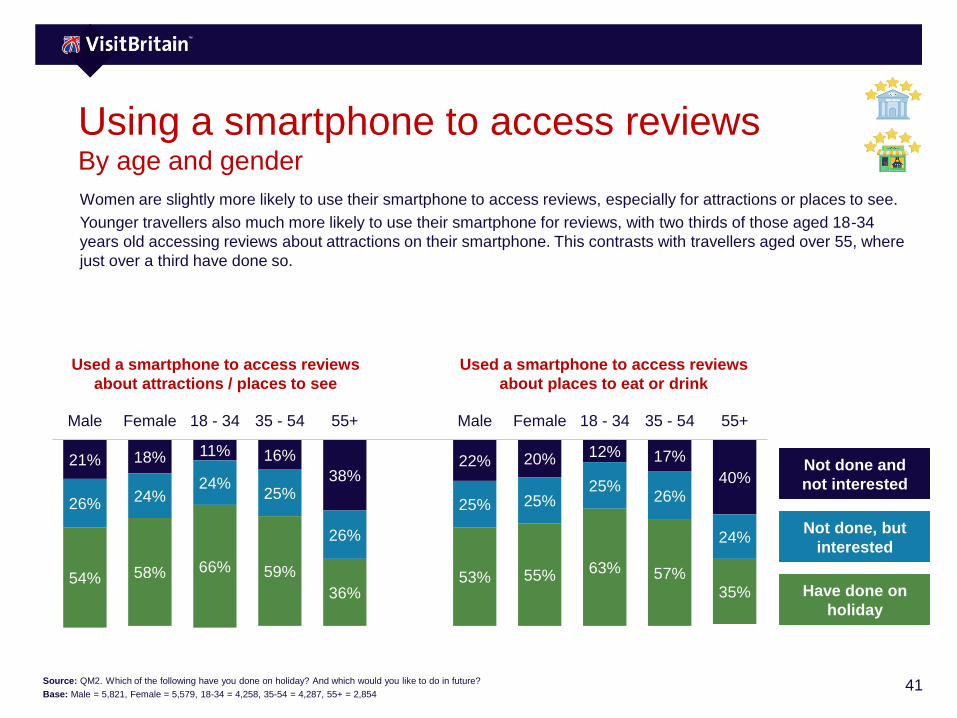
Women are slightly more likely to use their smartphone to access reviews, especially for attractions or places to see.
Younger travellers also much more likely to use their smartphone for reviews, with two thirds of those aged 18-34
years old accessing reviews about attractions on their smartphone. This contrasts with travellers aged over 55, where
just over a third have done so.
21% 18% 11% 16%
38%22% 20% 12% 17%
40%
26% 24%24%
25%
26%
25% 25%25%
26%
24%
54% 58% 66% 59%
36%53% 55% 63% 57%
35%
Male Female 18 - 34 35 - 54 55+ Male Female 18 - 34 35 - 54 55+
Used a smartphone to access reviews
about attractions / places to see
Used a smartphone to access reviews
about places to eat or drink
Source: QM2. Which of the following have you done on holiday? And which would you like to do in future?
Base: Male = 5,821, Female = 5,579, 18-34 = 4,258, 35-54 = 4,287, 55+ = 2,854
Have done on
holiday
Not done, but
interested
Not done and
not interested
42
55%77%
52%71%
41% 50%35%
71% 65%
29%46% 55% 50%
63% 60% 63% 64%51% 52%
66%
22%
18%
25%
25%
25%26%
24%
23%21%
31%
26%25% 28%
22% 30% 30% 22%
22%35%
23%
AUS BRA CAN CHI DEN FRA GER IND ITA JAP NET NZ NOR RUS SAU KOR SPA SWE UAE USA
Using a smartphone to access reviewsBy market
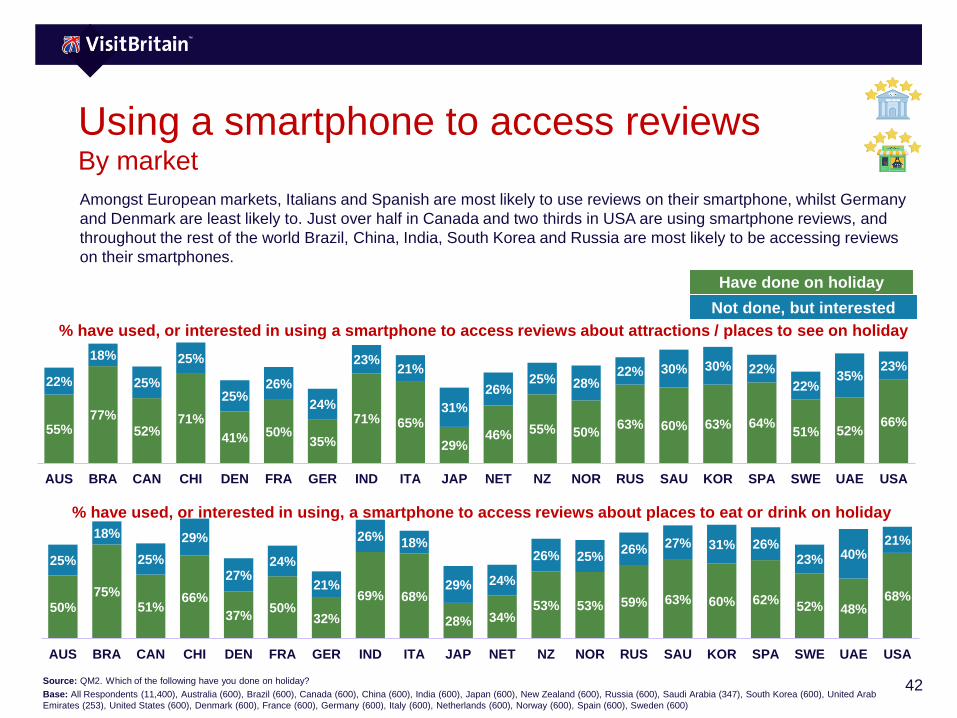
Amongst European markets, Italians and Spanish are most likely to use reviews on their smartphone, whilst Germany
and Denmark are least likely to. Just over half in Canada and two thirds in USA are using smartphone reviews, and
throughout the rest of the world Brazil, China, India, South Korea and Russia are most likely to be accessing reviews
on their smartphones.
50%75%
51%66%
37%50%
32%
69% 68%
28% 34%53% 53% 59% 63% 60% 62%
52% 48%68%
25%
18%
25%
29%
27%24%
21%
26%18%
29% 24%
26% 25%26% 27% 31% 26%
23% 40%21%
AUS BRA CAN CHI DEN FRA GER IND ITA JAP NET NZ NOR RUS SAU KOR SPA SWE UAE USA
Source: QM2. Which of the following have you done on holiday?
Base: All Respondents (11,400), Australia (600), Brazil (600), Canada (600), China (600), India (600), Japan (600), New Zealand (600), Russia (600), Saudi Arabia (347), South Korea (600), United Arab
Emirates (253), United States (600), Denmark (600), France (600), Germany (600), Italy (600), Netherlands (600), Norway (600), Spain (600), Sweden (600)
% have used, or interested in using a smartphone to access reviews about attractions / places to see on holiday
% have used, or interested in using, a smartphone to access reviews about places to eat or drink on holiday
Have done on holiday
Not done, but interested
43
Technology barriers
Footer Friday, October
6, 2017
44
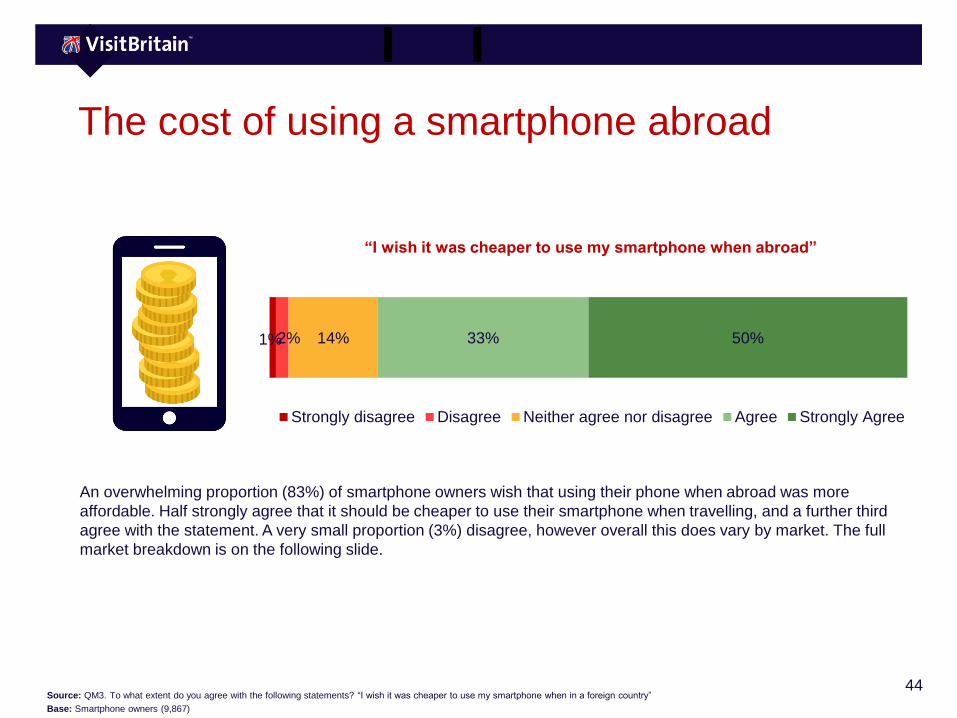
The cost of using a smartphone abroad
An overwhelming proportion (83%) of smartphone owners wish that using their phone when abroad was more
affordable. Half strongly agree that it should be cheaper to use their smartphone when travelling, and a further third
agree with the statement. A very small proportion (3%) disagree, however overall this does vary by market. The full
market breakdown is on the following slide.
1%2% 14% 33% 50%
“I wish it was cheaper to use my smartphone when abroad”
Strongly disagree Disagree Neither agree nor disagree Agree Strongly Agree
Source: QM3. To what extent do you agree with the following statements? “I wish it was cheaper to use my smartphone when in a foreign country”
Base: Smartphone owners (9,867)
45
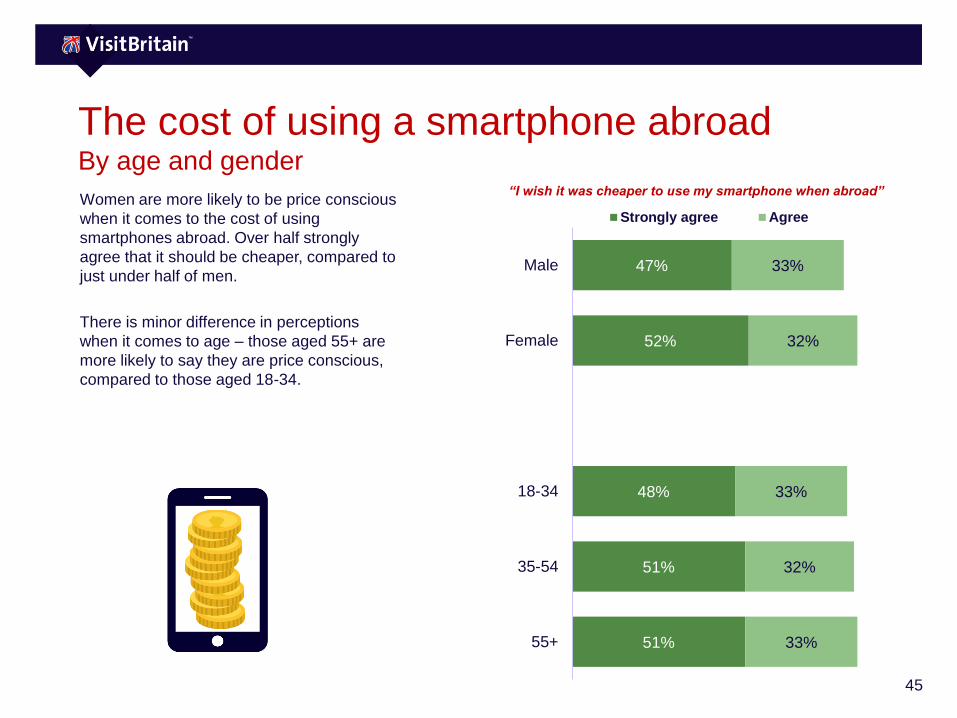
The cost of using a smartphone abroadBy age and gender
47%
52%
48%
51%
51%
33%
32%
33%
32%
33%
Male
Female
18-34
35-54
55+
Strongly agree Agree
Women are more likely to be price conscious
when it comes to the cost of using
smartphones abroad. Over half strongly
agree that it should be cheaper, compared to
just under half of men.
There is minor difference in perceptions
when it comes to age – those aged 55+ are
more likely to say they are price conscious,
compared to those aged 18-34.
“I wish it was cheaper to use my smartphone when abroad”
46
The cost of using a smartphone abroadBy market
Travellers from all markets feel strongly that
the cost of using their smartphone when
abroad is too expensive.
The highest levels of agreement comes from
Spain where 65% strongly agree that the
cost of using smartphones abroad should be
cheaper. Russia (61%), France (59%) and
Sweden (58%) all have strong feelings about
the cost too, although the majority in most
markets strongly agree that the cost is too
high.
Those who don’t have as strong feelings
about the cost are South Korea, UAE,
Denmark, Netherlands and Germany.
50%
55%
57%
49%
45%
59%
44%
40%
51%
39%
43%
52%
54%
61%
52%
32%
65%
58%
30%
44%
31%
31%
26%
38%
30%
29%
33%
42%
34%
43%
33%
32%
32%
32%
27%
43%
22%
25%
39%
36%
Australia
Brazil
Canada
China
Denmark
France
Germany
India
Italy
Japan
Netherlands
New Zealand
Norway
Russia
Saudi Arabia
South Korea
Spain
Sweden
UAE
USA
Strongly agree Agree
Source: QM3. To what extent do you agree with the following statements? “I wish it was cheaper to use my smartphone when in a foreign country”
Base: Smartphone owners (9,867), Australia (600), Brazil (600), Canada (600), China (600), India (600), Japan (600), New Zealand (600), Russia (600), Saudi Arabia (347), South Korea (600), United
Arab Emirates (253), United States (600), Denmark (600), France (600), Germany (600), Italy (600), Netherlands (600), Norway (600), Spain (600), Sweden (600)
“I wish it was cheaper to use my smartphone when abroad”
47
Technology and Social
Media
Foresight - issue 152