Embed Size (px)
Citation preview

WASTEWATER TECHNOLOGY NSF/ANSI Standard 40 - Residential Wastewater Treatment Systems Final Report: Aero-Tech Aerobic Treatment Units Model AT-500 Wastewater Treatment System 07/33/055/0030 NSF International 789 N. Dixboro Road PO Box 130140 Ann Arbor, Michigan 48113-0140 USA

07/33/055/0030 This report may not be reproduced in whole or in part Page 1 of 61 Final Report without the expressed written consent of NSF International. March 2009
Evaluation Report:
Aero-Tech Aerobic Treatment Units Model AT-500
Wastewater Treatment System
Under the provisions of NSF/ANSI Standard 40 Residential Wastewater Treatment Systems
March 2009

EXECUTIVE SUMMARY
07/33/055/0030 This report may not be reproduced in whole or in part Page 2 of 61 Final Report without the expressed written consent of NSF International. March 2009
Testing of the Aero-Tech Model AT-500 was conducted under the provisions of NSF/ANSI Standard 40 for Residential Wastewater Treatment Systems (August 2005 revision). NSF/ANSI Standard 40 was developed by the NSF Joint Committee on Wastewater Technology.
The performance evaluation was conducted at the NSF Wastewater Technology Test Facility located in Waco, Texas using wastewater diverted from the Waco municipal wastewater collection system, which serves a predominantly residential development. The evaluation consisted of sixteen weeks of dosing at design flow, seven and one half weeks of stress testing and two and one half weeks of dosing at design flow. Dosing was initiated on January 14, 2008. After a three-week start up period, sample and data collection for the test was officially started on February 4, 2008. Sampling started in the winter and continued into the summer, covering a range of operating temperatures.
Over the course of the evaluation, the average effluent CBOD
5 was 5 mg/L, ranging between <2 and 39
mg/L, and the average effluent total suspended solids was 6 mg/L, ranging between <2 mg/L and 56 mg/L. The Aero-Tech Model AT-500 produced an effluent that successfully met the performance requirements established by NSF/ANSI Standard 40 for Class I effluent:
The maximum 7-day arithmetic mean was 17 mg/L for CBOD5 and 28 mg/L for total suspended solids, both below the allowed maximums of 40 and 45 mg/L respectively. The maximum 30-day arithmetic mean was 16 mg/L for CBOD5 and 12 mg/L for total suspended solids, both below the allowed maximums of 25 mg/L and 30 mg/L respectively.
The effluent pH during the entire evaluation ranged between, 6.8 and 7.2, within the required range of 6.0 to 9.0. The Model AT-500 met the requirements for noise levels (less than 60 dbA at a distance of 20 feet), color, threshold odor, oily film and foam.

07/33/055/0030 This report may not be reproduced in whole or in part Page 3 of 61 Final Report without the expressed written consent of NSF International. March 2009
Performance evaluation of residential wastewater treatment systems is achieved within the provisions of NSF/ANSI Standard 40: Residential Wastewater Treatment Systems (revised August 2005), prepared by the NSF Joint Committee on Wastewater Technology and adopted by the NSF Board of Trustees.
Conformance with the Standard is recognized by issuance of the NSF Mark. This is not to be construed as an approval of the equipment, but a certification of the data provided by the test and an indication of compliance with the requirements expressed in the Standard.
Plants conforming to Standard 40 are classified as Class I or Class II plants according to the quality of effluent produced by the plant during the performance evaluation. Class I plants must meet the requirements of EPA Secondary Treatment Guidelines
PREFACE
1 for five day carbonaceous biochemical oxygen demand (CBOD5), total suspended solids (TSS) and pH. Class I plants must also demonstrate performance consistent with the effluent color, odor, oily film and foam requirements of the Standard. Class II plant effluent must have no more than 1% of samples exceeding 60 mg/L CBOD5 and 100 mg/L TSS. Permission to use the NSF Mark is granted only after the equipment has been tested and found to perform satisfactorily, and all other requirements of the Standard have been satisfied. Continued use of the Mark is dependent upon evidence of compliance with the Standard and NSF General and Program Specific Policies, as determined by periodic reinspection of the equipment at the factory, distributors and reports from the field. NSF Standard 40 requires the testing laboratory to provide the manufacturer of a residential wastewater treatment system, a report including significant data and appropriate commentary relative to the performance evaluation of the plant. NSF policy specifies provision of performance evaluation reports to appropriate state regulatory agencies at publication. Subsequent direct distribution of the report by NSF is made only at the specific request of or by permission of the manufacturer. The following report contains results of the entire testing program, a description of the plant, its operation and key process control equipment, and a narrative summary of the test program, including test location, procedures and significant occurrences. The plant represented herein reflects the equipment authorized to bear the NSF Mark.

CERTIFICATION
07/33/055/0030 This report may not be reproduced in whole or in part Page 4 of 61 Final Report without the expressed written consent of NSF International. March 2009
NSF International has determined by performance evaluation under the provisions of NSF/ANSI Standard 40 (revised August 2005) that the Aero-Tech Model AT-500 manufactured by Aero-Tech Aerobic Treatment Units has fulfilled the requirements of NSF/ANSI Standard 40. The Model AT-500 has therefore been authorized to bear the NSF Mark so long as Aero-Tech continues to meet the requirements of Standard 40 and NSF General and Program Specific Policies.
General performance evaluation and stress tests were performed at the NSF Wastewater Technology Test Facility located in Waco, Texas. The raw wastewater used in the test was municipal wastewater. The characteristics of the wastewater during the test are included in the tabulated data of this report.
The observations and analyses included in this report are certified to be correct and true copies of the data secured during the performance tests conducted by NSF on the wastewater treatment system described herein. The manufacturer has agreed to present the data in this certification in its entirety whenever it is used in advertising, prospectuses, bids or similar uses.
Thomas J. Bruursema Thomas Stevens General Manager Technical Manager Wastewater Treatment Unit Certification Federal Programs
07/33/055/0030 This report may not be reproduced in whole or in part Page 5 of 61 Final Report without the expressed written consent of NSF International. March 2009
TABLE OF CONTENTS
Page Executive Summary ........................................................................................................ 2 Preface.............................................................................................................................3 Certification ..................................................................................................................... 4 Table of Contents........................................................................................................... 5 1.0 Process Description ........................................................................................... 7 2.0 Performance Evaluation ..................................................................................... 7
2.1 Description of Unit Evaluated....................................................................... 7 2.2 Test Protocol ................................................................................................. 7 2.3 Test Chronology............................................................................................ 9
3.0 Analytical Results ................................................................................................ 9
3.1 Summary ....................................................................................................... 9 3.2 Biochemical Oxygen Demand..................................................................... 10 3.3 Total Suspended Solids ............................................................................. 11 3.4 pH.................................................................................................................15 3.5 Temperature................................................................................................ 15 3.6 Dissolved Oxygen ........................................................................................15 3.7 Color, threshold odor, oily film, foam........................................................... 15 3.8 Noise ........................................................................................................... 15
4.0 References........................................................................................................ 15 Appendices
Appendix A - Plant Specifications and Drawings Appendix B - Standard 40 Section 8 - Performance testing and evaluation Appendix C - Analytical Results Appendix D - Owner’s Manual

07/33/055/0030 This report may not be reproduced in whole or in part Page 6 of 61 Final Report without the expressed written consent of NSF International. March 2009
This page intentionally blank

07/33/055/0030 This report may not be reproduced in whole or in part Page 7 of 61 Final Report without the expressed written consent of NSF International. March 2009
1.0 PROCESS DESCRIPTION The Aero-Tech Model AT-500 is an extended aeration, activated sludge process. In the activated sludge process, microorganisms remove soluble contaminants from the wastewater, utilizing them as sources of energy for growth and production of new microorganisms. The organisms tend to be flocculent and form clumps, or floc that physically entrap particulate organic matter. The organic matter is attacked by extracellular enzymes that solubilize the solids to make them available to the microorganisms as a food source. The conversion of the organic matter from soluble to biological solids allows for the removal of the organic matter by settling of the solids in the treatment process3. Extended aeration is a modification of the activated sludge process in which the microorganisms are allowed to remain in the treatment process for long periods of time. The large inventory of biological solids in the process provides a buffer for shock loading of organic matter. The long aeration period allows for the organisms in the system to consume themselves reducing the total amount of solids produced by the treatment process. The organisms primarily responsible for the degradation of the organic matter are aerobic bacteria. As such, the transfer of oxygen in to the wastewater by an aeration system is critical to the treatment process. The aeration system also provides for the mixing of the wastewater and organisms to provide contact between the organic contaminants in the wastewater and the organisms that provide for removal of the contaminants. For this reason, an activated sludge process is referred to as a suspended growth system. 2.0 PERFORMANCE EVALUATION
2.1 Description of Plant Evaluated The Aero-Tech Model AT-500 system tested in this evaluation has a rated capacity of 500 gallons per day (gpd). Specifications and drawings are included in Appendix A. Raw Sewage enters a 4” inlet pipe from the home. The wastewater is then infused with air from the submersible aerator pump at the bottom of the aerobic treatment plant. This pump mixes air from the surface with wastewater in the bottom of the tank. The venturi created by the pump pulls fresh air from the surface and mixes it with the wastewater from the bottom of the tank. The finely diffused air bubbles are then pushed through the aerator exhaust ports into the mixing chamber in a swirling motion. As the finely diffused air rises, it creates a swirling motion, keeping the sludge in a constant state of suspension. As new wastewater enters the mixing chamber, it hydraulically displaces the mixed liquor into the clarifying cone. In the clarifying chamber, the liquid is suspended in the quiet zone, allowing remaining suspended solids to settle back into the mixing chamber for further treatment. The clear water in the upper clarifying chamber is then discharged through the surge resistant puck. 2.2 Test Protocol

07/33/055/0030 This report may not be reproduced in whole or in part Page 8 of 61 Final Report without the expressed written consent of NSF International. March 2009
Section 8 of NSF/ANSI Standard 40 protocol, “Performance Testing and Evaluation”, is included in Appendix B. Start up of the plant was accomplished by filling the plant with 2/3 water and 1/3 raw sewage. The plant was then dosed at the design loading rate of 500 gpd as follows:
6 a.m. to 9 a.m. - 35 percent of daily rated capacity (175 gallons) 11 a.m. to 2 p.m. - 25 percent of daily rated capacity (125 gallons) 5 p.m. to 8 p.m. - 40 percent of daily rated capacity (200 gallons)
Dosing was accomplished by opening an electrically actuated valve to feed wastewater to the test plant. Five gallon doses were spread uniformly over each dosing period to comprise the total dose volume for the period. After a start up period (up to three weeks at the manufacturer’s discretion), the plant is subjected to the following loading sequence:
Design loading - 16 weeks Stress loading - 7.5 weeks Design loading - 2.5 weeks
During the design loading periods, flow proportioned 24-hour composite influent and effluent samples are collected five days per week. The influent samples are analyzed for five-day biochemical oxygen demand (BOD5) and total suspended solids (TSS) concentrations. The effluent samples are analyzed for carbonaceous five-day biochemical oxygen demand (CBOD5), and total suspended solids (TSS) concentrations. On-site determinations of the effluent temperature and pH are made five days per week. Stress testing is designed to evaluate how the plant performs under non-ideal conditions, including varied hydraulic loadings and electrical or system failure. The test sequence includes (1) Wash Day stress, (2) Working Parent stress, (3) Power/Equipment Failure stress, and (4) Vacation stress. Detailed descriptions of the stress sequences are shown in Appendix B. During the stress test sequences, 24-hour composite samples are collected before and after each stress dosing pattern. The analyses and on-site determinations completed on the samples are the same as described for the design load testing. Each stress is followed by seven consecutive days of dosing at design rated capacity before beginning the next stress test. Sample collection is initiated twenty-four hours after completion of Wash Day, Working Parent, and Vacation stresses, and beginning 48 hours after completion of the Power/Equipment Failure stress. In order for the plant to achieve Class I effluent it is required to produce an effluent, which meets the EPA guidelines for secondary effluent discharge1:
(1) CBOD5: The 30-day average of effluent samples shall not exceed 25 mg/L and each 7-day average of effluent samples shall not exceed 40 mg/L.
(2) TSS: Each 30-day average of effluent samples shall not exceed 30 mg/L and each 7-day average of effluent samples shall not exceed 45 mg/L.

07/33/055/0030 This report may not be reproduced in whole or in part Page 9 of 61 Final Report without the expressed written consent of NSF International. March 2009
(3) pH: Individual effluent values remain between 6.0 and 9.0. Requirements are also specified for effluent color, odor, oily film and foam, as well as maximum noise levels allowed from the plant. 2.3 Test Chronology The system was installed under the direction of the manufacturer on January 7, 2008. The infiltration/exfiltration test, during which the entire system was tested for leaks, was completed on January 9, 2008. The septic tank was filled with 1500 gallons of wastewater and the treatment tank was filled with 2/3 fresh water and 1/3 raw sewage and dosing was initiated at the rate of 500 gallons per day beginning January 14, 2008. Sampling was initiated on February 2, 2008. The stress test sequence was started on May 26, 2008 and ended on July 17, 2008. Testing was completed on August 1, 2008. 3.0 ANALYTICAL RESULTS 3.1 Summary Chemical analyses of samples collected during the evaluation were completed using the procedures in Standard Methods for the Examination of Water and Wastewater2 3 and USEPA methods4. Copies of the data generated during the evaluation are included in Appendix C. Results of the chemical analyses and on-site observations and measurements made during the evaluation are summarized in Table I.
TABLE I. SUMMARY OF ANALYTICAL RESULTS Interquartile Average Std. Dev. Minimum Maximum Median Range Biochemical Oxygen Demand (mg/L) Influent (BOD5) 230 64 90 400 220 190 - 260 Effluent (CBOD5) 5 7 <2 39 2 2 - 4 Total Suspended Solids (mg/L) Influent 210 47 120 390 200 170 - 240 Effluent 6 9 <2 56 3 2 - 6 pH Influent - - 6.8 7.6 6.9 6.9 – 6.9 Effluent - - 6.8 7.2 6.9 6.9 – 6.9 Temperature (°C) Influent 23 2 10 27 23 21 - 25 Effluent 22 3 17 27 21 19 - 25 Dissolved Oxygen (mg/L) Aeration Chamber 4 0.6 3 6.7 3.9 3.7 – 4.3
07/33/055/0030 This report may not be reproduced in whole or in part Page 10 of 61 Final Report without the expressed written consent of NSF International. March 2009
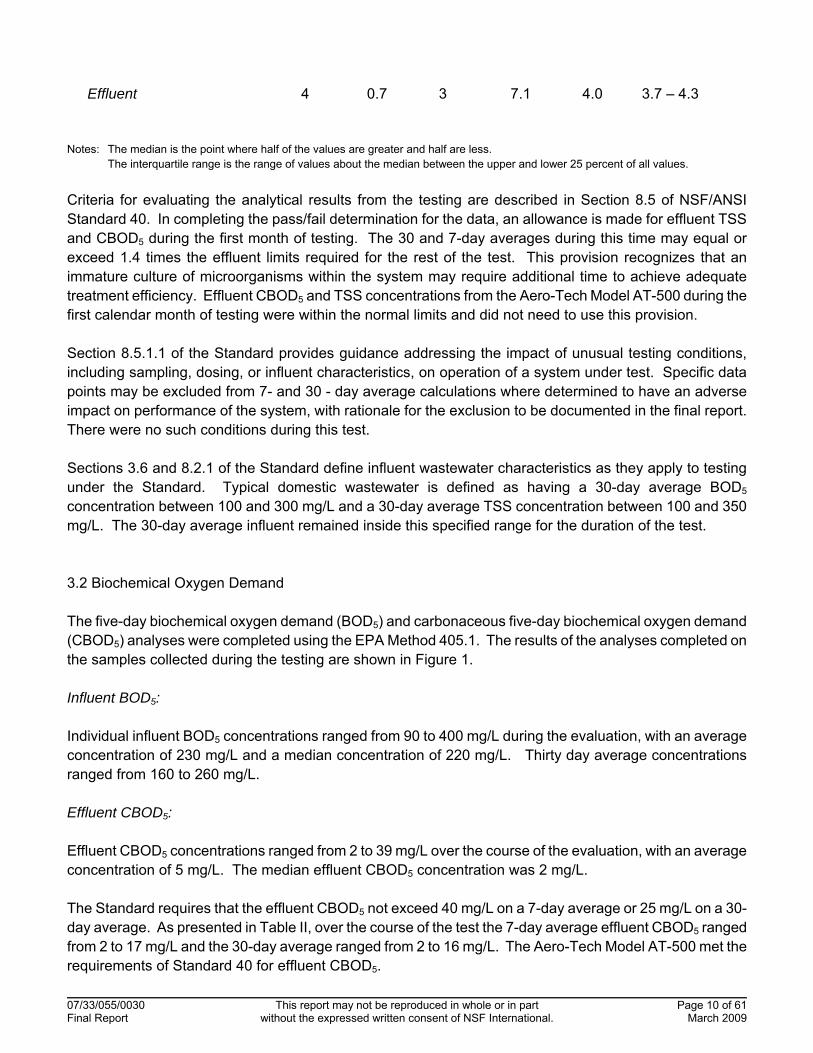
Effluent 4 0.7 3 7.1 4.0 3.7 – 4.3 Notes: The median is the point where half of the values are greater and half are less.
The interquartile range is the range of values about the median between the upper and lower 25 percent of all values.
Criteria for evaluating the analytical results from the testing are described in Section 8.5 of NSF/ANSI Standard 40. In completing the pass/fail determination for the data, an allowance is made for effluent TSS and CBOD5 during the first month of testing. The 30 and 7-day averages during this time may equal or exceed 1.4 times the effluent limits required for the rest of the test. This provision recognizes that an immature culture of microorganisms within the system may require additional time to achieve adequate treatment efficiency. Effluent CBOD5 and TSS concentrations from the Aero-Tech Model AT-500 during the first calendar month of testing were within the normal limits and did not need to use this provision. Section 8.5.1.1 of the Standard provides guidance addressing the impact of unusual testing conditions, including sampling, dosing, or influent characteristics, on operation of a system under test. Specific data points may be excluded from 7- and 30 - day average calculations where determined to have an adverse impact on performance of the system, with rationale for the exclusion to be documented in the final report. There were no such conditions during this test. Sections 3.6 and 8.2.1 of the Standard define influent wastewater characteristics as they apply to testing under the Standard. Typical domestic wastewater is defined as having a 30-day average BOD5 concentration between 100 and 300 mg/L and a 30-day average TSS concentration between 100 and 350 mg/L. The 30-day average influent remained inside this specified range for the duration of the test. 3.2 Biochemical Oxygen Demand The five-day biochemical oxygen demand (BOD5) and carbonaceous five-day biochemical oxygen demand (CBOD5) analyses were completed using the EPA Method 405.1. The results of the analyses completed on the samples collected during the testing are shown in Figure 1. Influent BOD5: Individual influent BOD5 concentrations ranged from 90 to 400 mg/L during the evaluation, with an average concentration of 230 mg/L and a median concentration of 220 mg/L. Thirty day average concentrations ranged from 160 to 260 mg/L. Effluent CBOD5: Effluent CBOD5 concentrations ranged from 2 to 39 mg/L over the course of the evaluation, with an average concentration of 5 mg/L. The median effluent CBOD5 concentration was 2 mg/L. The Standard requires that the effluent CBOD5 not exceed 40 mg/L on a 7-day average or 25 mg/L on a 30-day average. As presented in Table II, over the course of the test the 7-day average effluent CBOD5 ranged from 2 to 17 mg/L and the 30-day average ranged from 2 to 16 mg/L. The Aero-Tech Model AT-500 met the requirements of Standard 40 for effluent CBOD5.

07/33/055/0030 This report may not be reproduced in whole or in part Page 11 of 61 Final Report without the expressed written consent of NSF International. March 2009
BOD5 Loading: Over the course of the evaluation the influent BOD5 loading averaged 0.96 lb/day. The Aero-Tech Model AT-500 achieved an average reduction of 0.94 lbs/day. The system achieved a 98% reduction in biological oxygen demand.
Weeks
0 2 4 6 8 10 12 14 16 18 20 22 24 26
Oxygen Demand (mg/L)
0
100
200
300
400
500
Influent BODEffluent CBOD
Figure 1. Biochemical Oxygen Demand 3.3 Total Suspended Solids TSS and volatile suspended solids (VSS) analyses were completed using Methods 209C and 209D of Standard Methods. The TSS results over the entire evaluation are shown in Figure 2. Data from both analyses are summarized in Table I. Influent TSS:

07/33/055/0030 This report may not be reproduced in whole or in part Page 12 of 61 Final Report without the expressed written consent of NSF International. March 2009
The influent TSS ranged from 120 to 390 mg/L during the evaluation, with an average concentration of 210 mg/L and a median concentration of 200 mg/L. The 30-day average concentrations during the test ranged from 190 to 230 mg/L. Effluent TSS: The effluent TSS concentration ranged from <2 to 56 mg/L during the evaluation, with an average concentration of 6 mg/L and a median concentration of 3 mg/L. Over the course of the evaluation, NSF/ANSI Standard 40 requires that the effluent TSS not exceed 45 mg/L on a 7-day average or 30 mg/L on a 30-day average. Table III shows the 7- and 30-day total suspended solids averages. The 7-day average effluent TSS ranged from 2 to 28 mg/L and the 30-day average ranged from 2 to 12 mg/L during the test. The Aero-Tech Model AT-500 met the requirements of NSF/ANSI Standard 40 for effluent TSS.
Weeks
0 2 4 6 8 10 12 14 16 18 20 22 24 26
TSS (mg/L)
0
100
200
300
400
InfluentEffluent
Figure 2. Total Suspended Solids

07/33/055/0030 This report may not be reproduced in whole or in part Page 13 of 61 Final Report without the expressed written consent of NSF International. March 2009
Table II. 7- and 30-day Average Effluent CBOD5 and 30-day Average Influent BOD5
Month
Week
7-day Average Effluent
CBOD5 (mg/L)
30-day Average Effluent
CBOD5 (mg/L)
30-day Average Influent
BOD5 (mg/L)
1
17
2
12
3
16
1
4
17
16
260
5
14
6
6
7 6
2
8 3
5
250
9
3
10
3
11
2
12
2
3
13
2
2
250
14
2
15
2
16
2
4
17
2
2
230
18
2
19
2
20
2
5
21
2
2
200

07/33/055/0030 This report may not be reproduced in whole or in part Page 14 of 61 Final Report without the expressed written consent of NSF International. March 2009
22
2
23
4
24
2
25
2
6
26
3
3
160
Table III. 7- and 30-day Total Suspended Solids
Month
Week
7-day Average Effluent
TSS (mg/L)
30-day Average Effluent
TSS (mg/L)
30-day Average Influent
TSS (mg/L)
1 11
2 5
3
18
1
4
14
12
210
5
5
6
3
7
3
2
8
3
3
210
9
2
10
2
11
2
12
2
3
13
2
2
220
14
4
15
2
16
2
4
17
7
4
230
18
3
19
4
20
5
5
21
6
5
190

07/33/055/0030 This report may not be reproduced in whole or in part Page 15 of 61 Final Report without the expressed written consent of NSF International. March 2009
22
4
23
8
24
6
25
4
6
26
28
12
200

3.4 pH
07/33/055/0030 This report may not be reproduced in whole or in part Page 16 of 61 Final Report without the expressed written consent of NSF International. March 2009
Over the entire evaluation period, the influent pH ranged from 6.8 to 7.6. (median of 6.9). The effluent pH ranged from 6.8 to 7.2 during the evaluation (median of 6.9); within the 6 to 9 range required by NSF/ANSI Standard 40. The pH data for the evaluation are shown in Appendix C.
3.5 Temperature
Influent temperatures over the evaluation period ranged from 10 to 27°C (median of 23°C). The temperature data are shown in Appendix C.
Dissolved Oxygen (DO) was measured in the aeration chamber and effluent during the evaluation. The aeration chamber DO ranged between 3.0 and 6.7 mg/L (median of 3.9 mg/L), while the effluent DO ranged between 3.0 to 7.1 mg/L (median of 4.0 mg/L). All dissolved oxygen data are shown in Appendix C.
3.6 Dissolved Oxygen
3.7 Color, Threshold Odor, Oily Film, Foam Three samples of the effluent were analyzed for color, odor, oily film and foam as prescribed in NSF Standard 40. The effluent was acceptable according to the requirements in NSF Standard 40, with color less than 15 units, non-offensive threshold odor, no visible evidence of oily film and no foam. 3.8 Noise A reading of the noise level at a distance of 20 feet from the plant was taken while the plant was in operation, using a hand-held decibel meter. The reading was below the 60 dbA required by ANSI/NSF Standard 40. 4.0 REFERENCES 1. "Environmental Protection Agency Guidelines for Secondary Treatment", Federal Register, Volume 28,
No. 159, 1973. 2. APHA, AWWA, WPCF, Standard Methods for the Examination of Water and Wastewater, 20th Edition,
American Public Health Association, Washington, D.C. 3. U.S. EPA, Methods for Chemical Analysis of Water and Wastes, U.S. Environmental Protection Agency,
Washington, D.C.

07/33/055/0030 This report may not be reproduced in whole or in part Page 17 of 61 Final Report without the expressed written consent of NSF International. March 2009
This page intentionally blank

07/33/055/0030 This report may not be reproduced in whole or in part Page 18 of 61 Final Report without the expressed written consent of NSF International. March 2009
APPENDIX A
PLANT SPECIFICATIONS

07/33/055/0030 This report may not be reproduced in whole or in part Page 19 of 61 Final Report without the expressed written consent of NSF International. March 2009
PLANT SPECIFICATIONS
Aero-Tech, Inc. Model AT-500
Plant Capacity
Design Flow 500 gpd
Plant Hydraulic Capacity 1-compartment Pretreatment Tank 500 gallons Process Tank 835 gallons
Average Hydraulic Retention Time (at Design Flow)
1-compartment Pretreatment Tank 24 hours Process Tank 40 hours
Aerator Specifications SA04 Submersible Aerator, manufactured exclusively for Aero-Tech by Gast

07/33/055/0030 This report may not be reproduced in whole or in part Page 20 of 61 Final Report without the expressed written consent of NSF International. March 2009

07/33/055/0030 This report may not be reproduced in whole or in part Page 21 of 61 Final Report without the expressed written consent of NSF International. March 2009
This page intentionally blank

07/33/055/0030 This report may not be reproduced in whole or in part Page 22 of 61 Final Report without the expressed written consent of NSF International. March 2009

07/33/055/0030 This report may not be reproduced in whole or in part Page 23 of 61 Final Report without the expressed written consent of NSF International. March 2009

07/33/055/0030 This report may not be reproduced in whole or in part Page 24 of 61 Final Report without the expressed written consent of NSF International. March 2009
APPENDIX B NSF STANDARD 40 PERFORMANCE EVALUATION METHOD AND REQUIREMENTS

07/33/055/0030 This report may not be reproduced in whole or in part Page 25 of 61 Final Report without the expressed written consent of NSF International. March 2009
8 Performance testing and evaluation
This section describes the methods used to evaluate the performance of residential wastewater treatment systems. Systems shall be designated as Class I or Class II. The performance classification shall be based upon the evaluation of effluent samples collected from the system over a six-month period.
8.1 Preparations for testing and evaluation
8.1.1 The system shall be assembled, installed, and filled in accordance with the manufacturer's instructions.
8.1.2 The manufacturer shall inspect the system for proper installation. If no defects are detected and the system is judged to be structurally sound, it shall be placed into operation in accordance with the manufacturer's start-up procedures. If the manufacturer does not provide a filling procedure, ⅔ of the system's capacity shall be filled with water and the remaining ⅓ shall be filled with residential wastewater.
8.1.3 The system shall undergo design loading (see 8.2.2.1) until testing and evaluations are initiated. Sample collection and analysis shall be initiated within 3 weeks of filling the system and, except as specified in 8.5.1.2, shall continue without interruption until the end of the evaluation period.
8.1.4 If conditions at the testing site preclude installation of the system at its normally prescribed depth, the manufacturer shall be permitted to cover the system with soil to achieve normal installation depth. 8.1.5 Performance testing and evaluation of systems shall not be restricted to specific seasons. 8.1.6 When possible, electrical or mechanical defects shall be repaired to prevent evaluation delays. All repairs made during the performance testing and evaluation shall be documented in the final report. 8.1.7 The system shall be operated in accordance with the manufacturer’s instructions. However, routine service and maintenance of the system shall not be permitted during the performance testing and evaluation period. NOTE – The manufacturer may recommend or offer more frequent service and maintenance of the system but for the purpose of performance testing and evaluation, service and maintenance shall not be performed beyond what is specified in this Standard. 8.2 Testing and evaluation conditions, hydraulic loading, and schedules 8.2.1 Influent wastewater characteristics The 30-d average BOD5 concentration of the wastewater delivered to the system shall be between 100 mg/L and 300 mg/L. The 30-d average TSS concentration of the wastewater delivered to the system shall be between 100 mg/L and 350 mg/L. 8.2.2 Hydraulic loading and schedules The performance of the system shall be evaluated for 26 consecutive weeks. During the testing and evaluation period, the system shall be subjected to 16 weeks of design loading, followed by 7.5 weeks (52 days) of stress loading, and then an additional 2.5 weeks (18 days) of design loading.

8.2.2.1 Design loading
07/33/055/0030 This report may not be reproduced in whole or in part Page 26 of 61 Final Report without the expressed written consent of NSF International. March 2009
The system shall be dosed 7 days a week with a wastewater volume equivalent to the daily hydraulic capacity of the system. The following schedule shall be adhered to for dosing:
Time frame
% rated daily hydraulic capacity
6:00 a.m. to 9:00 a.m. approximately 35 11:00 a.m. to 2:00 p.m. approximately 25 5:00 p.m. to 8:00 p.m. approximately 40
8.2.2.2 Stress loading Stress loading is designed to evaluate a system's performance under four non-ideal conditions. Systems shall be subjected to each stress condition once during the 6-month testing and evaluation period, and each of the four stress conditions shall be separated by 7 days of design loading (see 8.2.2.1). 8.2.2.2.1 Wash-day stress The wash day stress shall consist of 3 wash days in a 5-day period. Each wash day shall be separated by a 24-h period. During a wash-day, the system shall be loaded at times and capacities similar to those delivered during design loading (see 8.2.2.1), however during the first two dosing periods per day, the design loading shall include 3 wash loads (3 wash cycles and 6 rinse cycles). 8.2.2.2.2 Working-parent stress For 5 consecutive days, the system shall be subjected to a working-parent stress. During this stress, the system shall be dosed with 40% of its daily hydraulic capacity between 6:00 a.m. and 9:00 a.m. Between 5:00 p.m. and 8:00 p.m., the system shall be dosed with the remaining 60% of its daily hydraulic capacity, which shall include 1 wash load (1 wash cycle and 2 rinse cycles). 8.2.2.2.3 Power/equipment failure stress The system shall be dosed with 40% of its daily hydraulic capacity between 5:00 p.m. and 8:00 p.m. on the day the power/equipment failure stress is initiated. Power to the system shall then be turned off at 9:00 p.m. and dosing shall be discontinued for 48 hours. After 48 hours, power shall be restored and the system shall be dosed over a 3- h period with 60% of its daily hydraulic capacity, which shall include 1 wash load (1 wash cycle and 2 rinse cycles). 8.2.2.2.4 Vacation stress On the day that the vacation stress is initiated, the system shall be dosed at 35% of its daily hydraulic capacity between 6:00 a.m. and 9:00 a.m. and at 25% between 11:00 a.m. and 2:00 p.m. Dosing shall then be discontinued for 8 consecutive days (power shall continue to be supplied to the system). Between 5:00 p.m. and 8:00 p.m. of the ninth day, the system shall be dosed with 60% of its daily hydraulic capacity, which shall include 3 wash loads (3 wash cycles and 6 rinse cycles). 8.2.3 Dosing volumes The 30-d average volume of the wastewater delivered to the system shall be within 100% ± 10% of the system's rated hydraulic capacity.

NOTE – All dosing days, except those with dosing requirements less than the daily hydraulic capacity, shall be included in the 30-d average calculation. 8.2.4 Color, odor, foam, and oily film assessments
07/33/055/0030 This report may not be reproduced in whole or in part Page 27 of 61 Final Report without the expressed written consent of NSF International. March 2009
During the 6-month testing and evaluation, a total of 3 effluent samples shall be assessed for color, odor, foam, and oily film. The assessments shall be conducted on effluent composite samples selected randomly during the first phase of design loading (weeks 1 – 16), the period of stress loading (weeks 17 – 23.5), and the second phase of design loading (weeks 23.5 – 26).
8.3 Sample collection
8.3.1 General
8.3.1.1 A minimum of 96 data days shall be required during system performance testing and evaluation. No routine service or maintenance shall be performed on the system whether the time period to achieve the 96 data days falls within or exceeds 6 months.
8.3.1.2 All sample collection methods shall be in accordance with APHA's Standard Methods for the Examination of Water and Wastewater unless otherwise specified.
8.3.1.3 Influent wastewater samples shall be flow-proportional, 24-h composites obtained during periods of system dosing. Effluent samples shall be flow-proportional, 24-h composites obtained during periods of system discharge. 8.3.2 Design loading During periods of design loading, daily composite effluent samples shall be collected and analyzed 5 days a week. 8.3.3 Stress loading During stress loading, influent and effluent 24-h composite samples shall be collected on the day each stress condition is initiated. Twenty-four hours after the completion of washday, working-parent, and vacation stresses, influent and effluent 24-h composite samples shall be collected for 6 consecutive days. Forty-eight hours after the completion of the power/equipment failure stress, influent and effluent 24-h composite samples shall be collected for 5 consecutive days. 8.4 Analytical descriptions 8.4.1 pH, TSS, BOD5, and CBOD5 The pH, TSS, and BOD5 of the collected influent and the pH, TSS and CBOD5 of the collected effluent 24-h composite samples shall be determined with the appropriate methods in APHA’s Standard Methods for the Examination of Water and Wastewater. 8.4.2 Color, odor, oily film, and foam 8.4.2.1 General The effluent composite samples shall be diluted 1:1000 with distilled water. Three composite effluent samples shall be tested during the 6-month evaluation period.
07/33/055/0030 This report may not be reproduced in whole or in part Page 28 of 61 Final Report without the expressed written consent of NSF International. March 2009
8.4.2.2 Color
The apparent color of the diluted effluent samples shall be determined with the visual comparison method described in APHA's Standard Methods for the Examination of Water and Wastewater.
8.4.2.3 Odor
A panel consisting of at least 5 evaluators shall qualitatively rate 200 mL aliquots of the diluted effluent samples as offensive or non offensive when compared to odor-free water prepared in accordance with APHA's Standard Methods for the Examination of Water and Wastewater.
8.4.2.4 Oily film and foam Diluted effluent sample aliquots shall be visually evaluated for the presence of an oily film or foaming. 8.5 Criteria 8.5.1 General 8.5.1.1 If conditions during the testing and evaluation period result in system upset, improper sampling, improper dosing, or influent characteristics outside of the ranges specified in 8.2.1, an assessment shall be conducted to determine the extent to which these conditions adversely affected the performance of the system. Based on this assessment, specific data points may be excluded from the 7-d and 30-d averages of effluent measurements. Rationale for all data exclusions shall be documented in the final report. 8.5.1.2 In the event that a catastrophic site problem not described in this Standard including, but not limited to, influent characteristics, malfunctions of test apparatus, and acts of God, jeopardizes the validity of the performance testing and evaluation, manufacturers shall be given the choice to: 1) Perform maintenance on the system, reinitiate system start-up procedures, and restart the performance testing and evaluation; or 2) With no routine maintenance performed, have the system brought back to pre-existing conditions and resume testing within 3 weeks after the site problem has been identified and corrected. Data collected during the system recovery period shall be excluded from 7-d and 30-d averages of effluent measurements. NOTE – Pre-existing conditions shall be defined as the point when the results of 3 consecutive data days are within 15% of the previous 30-d average(s). 8.5.1.3 A 7-d average discharge value shall consist of a minimum of 3 data days. If a calendar week contains less than 3 data days, sufficient data days may be transferred from the preceding calendar week to constitute a 7-d average discharge value. If there are not sufficient data days available in the preceding calendar week, the transfer of data days may take place from the following calendar week to constitute a 7-d average discharge value. No data day shall be included in more than one 7-d average discharge value. 8.5.1.4 A 30-d average discharge value shall consist of a minimum of 50% of the regularly scheduled sampling days per month. If a calendar month contains less than the required number of data days, sufficient data days may be transferred from the preceding calendar month to constitute a 30-d average discharge value. If there are not sufficient data days available in the preceding calendar month, the transfer of data days may take place from the following calendar month to constitute a 30-d average discharge value. No

data day shall be included in more than one 30-d average discharge value.
07/33/055/0030 This report may not be reproduced in whole or in part Page 29 of 61 Final Report without the expressed written consent of NSF International. March 2009
8.5.1.5 During the stress loading sequence, consisting of wash-day, working-parent, power/equipment failure, and vacation stress loading periods, data shall be collected from a minimum of ⅔ of the total scheduled sampling days and from at least 2 of the scheduled sampling days during any single stress loading period.
8.5.2 Class I systems
The following criteria shall be met in order for a system to be classified as a Class I residential wastewater treatment system.
All requirements for each parameter shall be achieved except as provided for in 8.5.2.2.
8.5.2.1 EPA secondary treatment guideline parameters
8.5.2.1.1 CBOD
The 30-d average of CBOD
5
5 concentrations of effluent samples shall not exceed 25 mg/L.
The 7-d average of CBOD5 concentrations of effluent samples shall not exceed 40 mg/L. 8.5.2.1.2 TSS The 30-d average of TSS concentrations of effluent samples shall not exceed 30 mg/L. The 7-d average of TSS concentrations of effluent samples shall not exceed 45 mg/L. 8.5.2.1.3 pH The pH of individual effluent samples shall be between 6.0 and 9.0. 8.5.2.2 Effluent concentration excursions System performance shall not be considered outside the limits established for Class I systems if, during the first calendar month of performance testing and evaluation, 7-d average and 30-d average effluent CBOD5 and TSS concentrations do not equal or exceed 1.4 times the effluent limits specified in 8.5.2.1. NOTE – The technology utilized in many residential wastewater treatment systems is biologically based. The allowance of excursions from the effluent limits established in this Standard during the first calendar month of performance testing and evaluation reflects the fact that an immature culture of microorganisms within the system may require additional time to achieve adequate treatment efficiency. The value of 1.4 is based on the USEPA Technical Review Criteria for Group I Pollutants, including CBOD5 and TSS. 8.5.2.3 Color, odor, oily film, and foam 8.5.2.3.1 Color The color rating of each of the 3 diluted composite effluent samples shall not exceed 15 units.

8.5.2.3.2 Odor
07/33/055/0030 This report may not be reproduced in whole or in part Page 30 of 61 Final Report without the expressed written consent of NSF International. March 2009
The overall rating of each of the three diluted composite effluent samples shall be non offensive. 8.5.2.3.3 Oily film and foam
Oily films and foaming shall not be visually detected in any of the diluted composite effluent samples.
8.5.3 Class II systems
The following criteria shall be met in order for a system to be classified as a Class II residential wastewater treatment system.
8.5.3.1 CBOD
Not more than 10% of the effluent CBOD
TSS
5
5 values shall exceed 60 mg/L.
Not more than 10% of the effluent TSS values shall exceed 100 mg/L.

07/33/055/0030 This report may not be reproduced in whole or in part Page 31 of 61 Final Report without the expressed written consent of NSF International. March 2009
This page intentionally blank

07/33/055/0030 This report may not be reproduced in whole or in part Page 32 of 61 Final Report without the expressed written consent of NSF International. March 2009
APPENDIX C ANALYTICAL RESULTS

07/33/055/0030 This report may not be reproduced in whole or in part Page 33 of 61 Final Report without the expressed written consent of NSF International. March 2009

07/33/055/0030 This report may not be reproduced in whole or in part Page 34 of 61 Final Report without the expressed written consent of NSF International. March 2009

07/33/055/0030 This report may not be reproduced in whole or in part Page 35 of 61 Final Report without the expressed written consent of NSF International. March 2009

07/33/055/0030 This report may not be reproduced in whole or in part Page 36 of 61 Final Report without the expressed written consent of NSF International. March 2009

07/33/055/0030 This report may not be reproduced in whole or in part Page 37 of 61 Final Report without the expressed written consent of NSF International. March 2009

07/33/055/0030 This report may not be reproduced in whole or in part Page 38 of 61 Final Report without the expressed written consent of NSF International. March 2009

07/33/055/0030 This report may not be reproduced in whole or in part Page 39 of 61 Final Report without the expressed written consent of NSF International. March 2009

07/33/055/0030 This report may not be reproduced in whole or in part Page 40 of 61 Final Report without the expressed written consent of NSF International. March 2009

07/33/055/0030 This report may not be reproduced in whole or in part Page 41 of 61 Final Report without the expressed written consent of NSF International. March 2009

07/33/055/0030 This report may not be reproduced in whole or in part Page 42 of 61 Final Report without the expressed written consent of NSF International. March 2009

07/33/055/0030 This report may not be reproduced in whole or in part Page 43 of 61 Final Report without the expressed written consent of NSF International. March 2009

07/33/055/0030 This report may not be reproduced in whole or in part Page 44 of 61 Final Report without the expressed written consent of NSF International. March 2009

07/33/055/0030 This report may not be reproduced in whole or in part Page 45 of 61 Final Report without the expressed written consent of NSF International. March 2009

07/33/055/0030 This report may not be reproduced in whole or in part Page 46 of 61 Final Report without the expressed written consent of NSF International. March 2009
APPENDIX E
OWNER”S MANUAL

07/33/055/0030 This report may not be reproduced in whole or in part Page 47 of 61 Final Report without the expressed written consent of NSF International. March 2009

07/33/055/0030 This report may not be reproduced in whole or in part Page 48 of 61 Final Report without the expressed written consent of NSF International. March 2009

07/33/055/0030 This report may not be reproduced in whole or in part Page 49 of 61 Final Report without the expressed written consent of NSF International. March 2009

07/33/055/0030 This report may not be reproduced in whole or in part Page 50 of 61 Final Report without the expressed written consent of NSF International. March 2009

07/33/055/0030 This report may not be reproduced in whole or in part Page 51 of 61 Final Report without the expressed written consent of NSF International. March 2009

07/33/055/0030 This report may not be reproduced in whole or in part Page 52 of 61 Final Report without the expressed written consent of NSF International. March 2009

07/33/055/0030 This report may not be reproduced in whole or in part Page 53 of 61 Final Report without the expressed written consent of NSF International. March 2009

07/33/055/0030 This report may not be reproduced in whole or in part Page 54 of 61 Final Report without the expressed written consent of NSF International. March 2009
07/33/055/0030 This report may not be reproduced in whole or in part Page 55 of 61 Final Report without the expressed written consent of NSF International. March 2009
07/33/055/0030 This report may not be reproduced in whole or in part Page 56 of 61 Final Report without the expressed written consent of NSF International. March 2009

07/33/055/0030 This report may not be reproduced in whole or in part Page 57 of 61 Final Report without the expressed written consent of NSF International. March 2009

07/33/055/0030 This report may not be reproduced in whole or in part Page 58 of 61 Final Report without the expressed written consent of NSF International. March 2009
07/33/055/0030 This report may not be reproduced in whole or in part Page 59 of 61 Final Report without the expressed written consent of NSF International. March 2009
07/33/055/0030 This report may not be reproduced in whole or in part Page 60 of 61 Final Report without the expressed written consent of NSF International. March 2009

07/33/055/0030 This report may not be reproduced in whole or in part Page 61 of 61 Final Report without the expressed written consent of NSF International. March 2009

07/33/055/0030 This report may not be reproduced in whole or in part Page 62 of 61 Final Report without the expressed written consent of NSF International. March 2009