Embed Size (px)
Citation preview
2004TECHNOLOGIES
THAT WORK...CALFRAC WELL SERVICES LTD. › ANNUAL REPORT
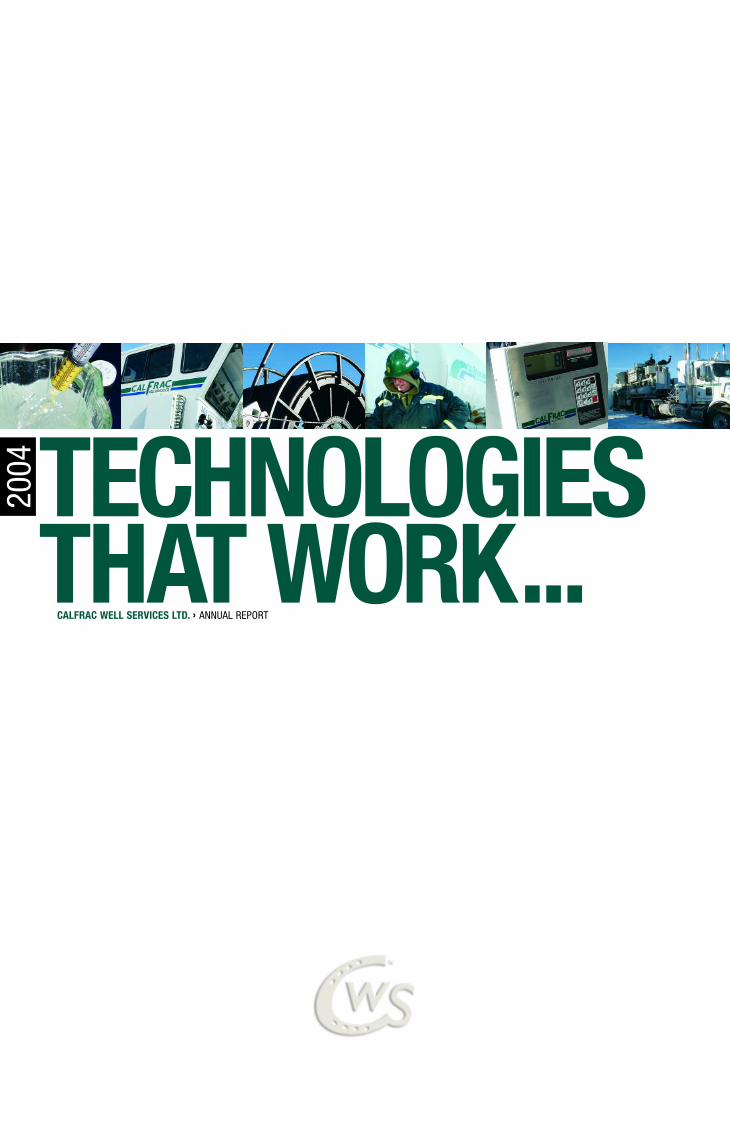
IN THE FIELD
TSX › CFW
Calfrac Well Services Ltd. was founded in June
1999 and has since become a leading provider
of specialized oilfield services, including fracturing,
coiled tubing, cementing and well stimulation serv-
ices, which are designed to increase the production
of hydrocarbons from wells drilled throughout
Western Canada and the Rocky Mountain region
of the United States.
Our goal is the same today as it was when we
began five years ago: to safely and efficiently
provide the highest degree of expertise, innovation
and service to our customers. The concept is simple,
but the implementation is not. Although we compete
in an arena with companies several times our size,
our success is attributable to our ability to meet the
needs of our customers by providing technologies
that work in the field and superior service.
Calfrac is a Canadian corporation headquartered
in Calgary, Alberta with district offices and operat-
ing bases located in Medicine Hat, Red Deer and
Grande Prairie, Alberta as well as Denver and
Platteville, Colorado. The common shares of Calfrac
Well Services Ltd. are listed for trading on the
Toronto Stock Exchange under the symbol CFW.
›

A › COLIN ADAM, WAYNE ADAMS, DUSTIN ADRIAN, KATHLEEN AHEARN, GORDON ALBERT, SEAN D. ALLEN, ALAN ALTON, KENNETH AMERO, GLENN
ANDERSON, JIM ARSCOTT, GARY ARTHUR, BARRY AUGUST, TERRY AVERY B › NEIL BABIAK, RAY BACKER, KIM BACKSTROM, DAVID BAKER, KRISTI
BAKER, RANDY BAKER, SCOTT BAKER, DENNIS BAKULA, BRIAN BALL, MIKE BALL, JOHN BALLEK, TYLER BANK, DANNY BARKMAN, ANDREW BARR,
DAVID BARTHEL, JONATHON BATEMAN, DON BATTENFELDER, KENNETH BEAZLEY, JESSIE BECKWITH, TYLER BEDNASH, GILLES BELZIL, JARED
BERGEN, RANDY BERGESEN, RON BERRY, MARK BEST, ADAM BICKNELL, AARON BISIO, GREG BJORGE, JERRY BLAKE, SCOTT BLOOMFIELD, DWIGNT
BOBIER, TROY BOHNET, VIVIAN BOONE, BRAD BORDELEAU, ALBERT BOSCH, DAVID BOSCH, STEPHAN BOUCHARD, DALE BOWEY, NICK BRADFORD,
RHONDA BRAGLIN, TANNER BRATLAND, AL BREEMERSCH, KELLY BRILZ, JOHN BRISTOW, JODY BROOKS, DOUG BROWN, FLOYD BROWN, JORDON
BROWN, RJKI BROWN, WES BROWN, BOB BROWNLEE, DONALD BRUCE, CHAD BUFFINGTON, BRADY BULBECK, LEE BURLESON, WAYNE BUTLER, MIKE
BYLSMA, JEFFREY BYRD, ROMAN BYRTUS C › CHAD CALDWELL, BRENT CARLSON, GLENN CARRIERE, NICK CARTER, JASON CHADWICK, DAVID
CHAMBERS, RAMON CHARBONNEAU, RYAN CHARLTON, ALAN CHENARD, BORIS CHERVIAKOFF, DARREN CHICOINE, DARCY CHMIL, RYAN
CHRISTOFFERSEN, ARCHIE CLAMPITT, JACK CLEGG, JAMIE CLEMENT, ROBERT CLINE, BOB CLOUTIER, DEREK COATES, MARK COCKS, ELIZABETH
COLBARY, KEN CONWAY, RONNIE COURT, MURRAY CREAM, ROBERT CROPLEY, VALDA CRUMMY, JENNIFER CSIKOS, TREVOR CUMMINS D › STEPHEN
DADGE, GENE DALLAS, MARK DARROW, ANTHONY DAVIS, CHRIS DAVIS, DANIEL DAVISON, LYNDEN DE CECCO, DAVID DEASE, MARC DEBOON, ROBERT
DECK, JAMIE DEFOREST, CHRIS DELAUNAY, DIONE DEMAS, DOUGLAS DENECKY, KEVIN DENT, TREVOR DENTON, DAREN DERKSEN, DANIEL DESANKO,
GORDON DIBB, TERRENCE DICK, BRYCE DIRK, JOHN DOIRON, DERRICK DOLEN, DENNIS DOLL, DWAYNE DONEY, BRYAN DRAKE, DOUG DRAKE,
KENNETH DRAKE, JOSEPH DUBOIS, FRANK DUCHCHERER, TERRY DUFFY, BRENT DUKE, JEREMY DUNAWAY, ANGELA DUNCAN, ANDREW DUNHAM, JIM
DUNLOP, RICHARD DUNN, DOUG DURELL, TROY DURKEE, RICK DURNFORD, JASON DUSSEAULT, JASON DYCK E › MORGAN EDLUND, JOSH EDWARDS,
DEAN EGGERMAN, LES ELGERT, ROSS ELLITHORPE, MARK ELSASSER, RANDALL EMDE, LILA ENSLEN, TED ERICKSON F › JEFF FAHLMAN, JOHN
FARNEL, ERIC FISCHBUCH, MARTY FISCHER, DAN FLAHR, GLENN FLAIG,, MARCUS FLINT, DANIEL FLOCK, NEIL FODE, STACEY FORWARD, RICHARD
FRANK, TREVOR FRENETTE, TREVOR FREY, LARRY FRIESEN, IRWIN FRITZ, MICHAEL FRYKBERG G › ROBERT GALE, ROBERT JR. GALE, REBECCA
GAMBLE, JUAN GARCIA, HUGH GEDDES, HARLEY GIBERSON, CORY GIBSON, SCOTTY GIBSON, WENDY GIBSON, IRA GILL, SANDRA GIVENS, JASON
GOLDADE, IAN GOOD, ARDEN GORMLEY, BRAD GOULD, NATALIA GOUSSEVA, JUSTIN GRABO, LORRAINE GRAHAM, ANDREW GREWAL, JOHN GRISDALE,
DAVID GRYPUIK, KEVIN GRYPUIK, MARTIN GURDIAN, MARK GUY H › DALLAS HALA, BRENDON HAMILTONN, BRENT HANAGHAN, BRETT HANNA, ANDY
HARDER, PAT HARDY, MURRAY HARMON, JENNIFER HARPER, MIKE HARRIS, DAVID HARTLEY, DEREK HARTLING, FRED HARTNELL, JAMES HARVIE,
DARCY HAUCK, ROLF HEINEMANN, DOUGLAS HERRERA, KENNY HO, JASON HOEY, RANDY HOFFER, KEN HOFFMAN, DARYL HOLMES, MICHAEL HOOSE,
DONALD HOOVER, CRAIG HOUGHTON, JACOB HOVIUS, CHAD HOWARD, VERN HRENYK, RYAN HUBL, BLAIR HUMPHREY, ROD HUMPHREY, JAMEY HUNT,
TIMOTHY HUNT, JEFF HUNTER, JAMES HURSON, CHAD HUTCHINGS I › TETYANA ILLICHOVA J › CHRIS JACKMAN, RICHARD JAMES, STEVEN JAMES,
DEAN JAMIESON, DARYL JANSSEN, MICHAEL JARVIS, SCOTT JENSEN, BOYD JETT, MARK E. JOHNSON, WAYNE JOHNSON, LEVI JONES, JAMES JUDSON
K › MORGAN KANE, VAL KARY, ALLEN KAUPP, JORDON KEJR, JEREMY KEMP, CLAYTON KENT, JIM KERR, MATTHEW KERR, RICHARD KERRISON, LONNIE
KEY, BRUCE KIDD, KELVIN KILDEN, JOE KILFORD, ROGER KITT, DAVID KLATT, TED KLAVER, NAOMI KLIMACH, WALTER KOZAK, JASON KRAUSE, ALBERT
KRIZSAN, SHANE KRIZSAN, RICHARD KURTZ, JESSE KUSHNIRUK L › MARCEL LAFERRIERE, SHAWN LAFERRIERE, RICHARD LAFORCE, WARREN
LAGACE, ALLAN LALONDE, KEN LALONDE, MARK LAMONTAGNE, BARB LARSON, RANDALL LASSESEN, ADAM LATOS, ADRIAN LEISMEISTER, DARWIN
LEISMEISTER, LANCE LEWIS, PIERRE L'HOIR, DAVID LINDEMAN, MICHAEL LITTMAN, ERIC LOBBAN, NATHAN LONGMUIR, JASON LONGPRE, CHRIS
LONSON, KELLY LONSON, WARREN LOPUSHINSKY, BRUCE LOUMA, NEIL LOWES, DAVID LUCAS, MARK LUCAS, STEVEN LUCHAK, MICHAEL LUMLEY, KEN
LUPYCZUK, CORY LYONS M › TINA MACDONALD, THERESA MACK, KERRY MAHAR, DWAYNE MANN, DAVID MANTEI, KERRY MANYGUNS, RON MARCEAU,
LARRY MARR, KELLY MASON, KELLY MAST, MARK MAST, CHANTEL MATUSKAL, BRENT MAYO, ROBERT MCBRIDE, RON MCCARTNEY, CHRIS MCCULLEY,
CODY MCDONALD, WARREN MCDONALD, WENDY MCFAWN, BRAD MCKENNA, LINDSAY MCKINSTRY, BRIAN MCLANE, SCOTT MCLEAN, KATE MCNEAL,
DARIAN MCNEE, DEVIN MCNEILL, MALCOM MCNEILL, ROSS MCQUEEN, OLEG MEDVEDEV, TOM MEDVEDIC, DANNY MEIER, KILE MEIKLEJOHN, CRAIG
MEISSNER, BRENT MERCHANT, CHRIS MERKEL, MICHAEL MIEDOWICZ, MATTHEW MIGNAULT, GORD MILGATE, MIKE MILLAR, BRETT MILLER, SHANE
MILLER, SHAUN MILLER, BRYSON MITCHELL, TYLER MITCHELL, PETERSON MODESTE, COLE MONDRAGON, DESMOND MONTGOMERY, ROY MONTOYA,
BETTY ANNE MOORE, RICK MOORE, ALLAN MORGAN, LEO MORIN, EARL MORRISON, BRENT MULNER, RODNEY MUTH, DAVID MYKYTE, WILFRED MYLES
N › AARON NEIFER, JONATHON NELSON, KERRY NERBAS, MIKE NEUFELD, SEAN NEWHOOK, STEVE NICHOLS, DAVE NICHOLSON, BILL NICKEL, CORY
NOSEWORTHY, DWANY NOSEWORTHY O › ROB OBST, ROBERT O'REILLY, RICK ORTIZ, KEVAN OUIMET, BILL OZMUN P › DUSTIN PACHIORKA, TODD
PALEY, KEITH PALMER, JOHN PANEITZ, ROBERT PARANYCH, DEREK PARKER, BRUCE PAYNE, KENNETH PEARCE, QUINTEN PEARCE, RONALD PEDDLE,
CHARLES PEEVER, JAMIE PEIRENS, MICHEL PELLETIER, COLIN PENZ, KELLY PERIARD, DEAN PERRY, WADE PETERS, RYAN PETERSEN, DAVID
PETERSON, DARLENE PETTIT, ABE PETZOLDT, MAURICE PHILIPPOT, STEVE PHIPPS, KURTIS PIDLISNY, RODNEY PIERCEY, PADMA PILLAI, KURTIS
PITULEY, ROLAND POIRIER, GARRY POROCHNAVY, TRACEY POTSKIN, WAYNE POTTER, DOUG POTTS, EDWARD PRATT, HARVEY PRATT, JASON PRATT,
NICOLE PRETTY, TYLER PRICE, BRENDAN PTOLEMY, CURT PUDWELL Q › RODELTA QUEMUEL R › BRADFORD RAEHAL, TODD RAINVILLE, RODDY RAMEY,
DOUG RAMSAY, BRIAN RAMSEY, CURTIS RAUSCH, KEVIN REELIE, ROBERT REELIE, TREVOR REINHARDT, AMBER RICHARD, JOHN RINDAL, WILLIAM
ROBB, FRANCISCO ROBELS, ROBERT ROBERTS, DALE ROBINSON, JOSE ROCHA, JOHN RODRIGUES, GARY ROKOSH, YURI ROMANOV, MIKE ROMANOW,
JASON ROSE, CHRIS ROTH, REENA RUPRAI, KEVIN RUSSELL, JEFF RUSSILL, MERLIN RUUD, DALBER RYCROFT, BRIAN RYDER, LARRY RYDER S › PAUL
SALAZL, CARLOS SALINAS, MITCHELL SANDY, ROSA SCAGNETTO, DERRICK SCHAFER, DON SCHICK, ADAM SCHMALZ, MICHAEL SCHNITMAN, MARK
SCHULTZ, RANDY SCHWABE, GINO SCOTT, MICHAEL SCOTT, CURTIS SEAMAN, YURI SEMENOV, STEVEN SENKIW, COURTNEY SHARPE, ALLA SHEFER,
ROBIN SHELLITO, JAY SHICK, DARWIN SINCENNES, KEVIN SKINKLE, RODNEY SKOMOROH, BRENT SLEEKING, GORD SLEEKING, JEFF SMART, CHRIS
SMETHERS, JASON SMILEY, ANTHONY SMITH, BRAD SMITH, DANNY SMITH, MIKE SMITH, MIKE SMITH, NATHEN SNELSON, KAMEULA SOLOMON, OWEN
SOSTAD, ADAM SOUILLET, RICK SPENCE, JERRED SPENCER, STEPHEN SRUBOWICH, TRAVIS ST. GERMAIN, GARNER STACK, JON STAEHR, DARREN
STAH, MARK STANG, JUSTIN STEELE, ROBERT STEPHENSON, CHANCE STIMSON, STEPHEN STOIKN, DALLAS STOREY, KARL STOREY, GORDON
STRANGE, WADE STRONG, KEVIN SUTHERLAND, ROBERT SUTHERLAND, LAWRENCE SWAINSTON, DAVID SWITNER T › BRETT THERRIAULT, LANE
THERRIAULT, DENNIS THOMAS, ROBERT THOMAS, DAVE THORNTON, LAURIE THORPE, BARRY TILLER, ANDREW TOBLER, CLIFF TOEWS, CAMERON
TOMBS, LANCE TOMSHAK, RICHARD TROST, ALANA TRUNDLE U › MARK UDAL, DWAYNE UNREINER V › BLAKE VANCUREN, JASON VATH, DON
VERMEEREN, LANE VERMUNT, JOSE VILLACORTA, LEO VILLENEUVE, NANCY VITALE W › PRESTON WALD, JAMES WALDNER, JIM WALKER, BEVERLY
WALL, JEFF WARRILOW, VAL WEAVER, RICK WEBSTER, JUSTIN WEISS, JASON WELBOURNE, DAVE WELLS, JANUARY WEST, MURRAY WHENHAM,
KEN WHITE, JOSH WIEDEMANN, TERRY WIELER, KELLY WIESER, LAROY WILLIAMS, B. SCOTT WILSON, ROB WILSON, SCOTT R. WILSON, SHELDON
WINSOR, GLEN WOLFORD, WENDALL WRIGHT, JORDON WUTTUNEE Y › MICHAEL YEWELL, DANNY YOUNG, MIKE YOUNG, STEPHEN YOUNG, BRADLEY
YOUNGS Z › DARYL ZAMKO, SHAWN ZAMKO, DOUGLAS ZATORSKI, HOLLIE ZATZEK, RICHARD ZIEGLER, LLOYD ZMAEFF, WYATT ZOERB, JOE ZUCCATTO
At Calfrac, a strong and experienced manage-ment team leads high-energy employees,working smart to SERVE OUR CUSTOMERS. Weknow achieving our goals and meeting our customers’ expectations depend on strong leaders positioned in critical jobs throughout our organization. From the front lines to ourexecutive offices, our people are self-disciplined,passionate about their work and continuouslyfocused on improvement. Through leadershiptraining and recruiting, we ensure that talentedindividuals continue to power Calfrac’s success.
PG 6 › CALFRAC WELL SERVICES LTD. › 2004 ANNUAL REPORT
TECHNOLOGY
Calfrac has invested heavily
over its five-year history in the
design and development of a wide
range of innovative, cost effective,
efficient and environmentally
sensitive technologies and equip-
ment. Calfrac’s research and
development efforts are focused
on providing specific solutions to
challenges faced by our customers
Delivering TECHNOLOGIES THAT
WORK IN THE FIELD requires the
design acumen of an imaginative
and dedicated technical services
team that puts our customers’
goals first. Using industry-leading
software, we model current reser-
voir conditions to simulate fracture
geometry, forecast production and
perform net present value eco-
nomic analysis, optimize fracture
treatments and analyze post-job
results. Our satellite fracturing
system transmits real-time
operations data from the field
when fracturing and stimulating
oil and gas wells. Our Company’s
success in hydraulic fracturing
has been facilitated by our ability
to provide proprietary chemical
blends and fluid systems that,
together with our technical expert-
ise and innovative equipment, are
highly successful in reducing
downhole residual fluids, thereby
enhancing fracture placement and
fluid recovery and providing our
customers with superior results.
to our Calgary head office for
instant fracture treatment analysis.
Rigorous testing and stringent
quality controls are the pillars of
our consistent field performance.
Oil and gas companies are
continually looking for ways to
maximize returns on their capital
budgets while reducing finding
costs and increasing project
success. Calfrac continues to focus
on equipment innovation, utiliza-
tion and the development of new
technologies and methodologies
in order to increase operating
efficiencies, while at the same
time creating a competitive
advantage.
CALFRAC WELL SERVICES LTD. › 2004 ANNUAL REPORT › PG 7
PG 8 › CALFRAC WELL SERVICES LTD. › 2004 ANNUAL REPORT
MARKETLEADERSHIP
Coal is the most abundant
energy source in the world and
is a significant source of hydro-
carbons, particularly gas. The
coalification process, whereby
plant material is progressively
converted to coal, generates large
quantities of methane-rich gas,
known as natural gas from coal
(“NGC”) or coalbed methane, that
is retained by coalbeds in the
subsurface. The presence of this
gas has been long recognized due
to explosions associated with
underground coal mining. In
Many industry analysts expect
that this figure could approach
10% by 2010, thereby becoming
the fastest growing source of
domestic natural gas supply.
The recovery of NGC has pre-
sented new challenges, resulting
in the development of new tech-
nologies for coalbed stimulation
and well management. Calfrac
has been at the industry’s fore-
front in these efforts by working
with our customers to develop a
new completion technique for
stimulating coalbeds. This tech-
nique requires high injection rates
of gaseous nitrogen into individual
coal seams using a downhole
isolation tool that is run into the
recent years, coal has increasingly
been recognized as a reservoir
rock as well as a source rock,
thereby representing an enormous
undeveloped, unconventional
energy resource. Over the past
several years, interest in develop-
ing NGC has increased significantly
as conventional natural gas
reserves mature, demand for
natural gas increases and product
prices remain strong. In 2004,
NGC production accounted for
approximately 1% of the total
natural gas production in Alberta.
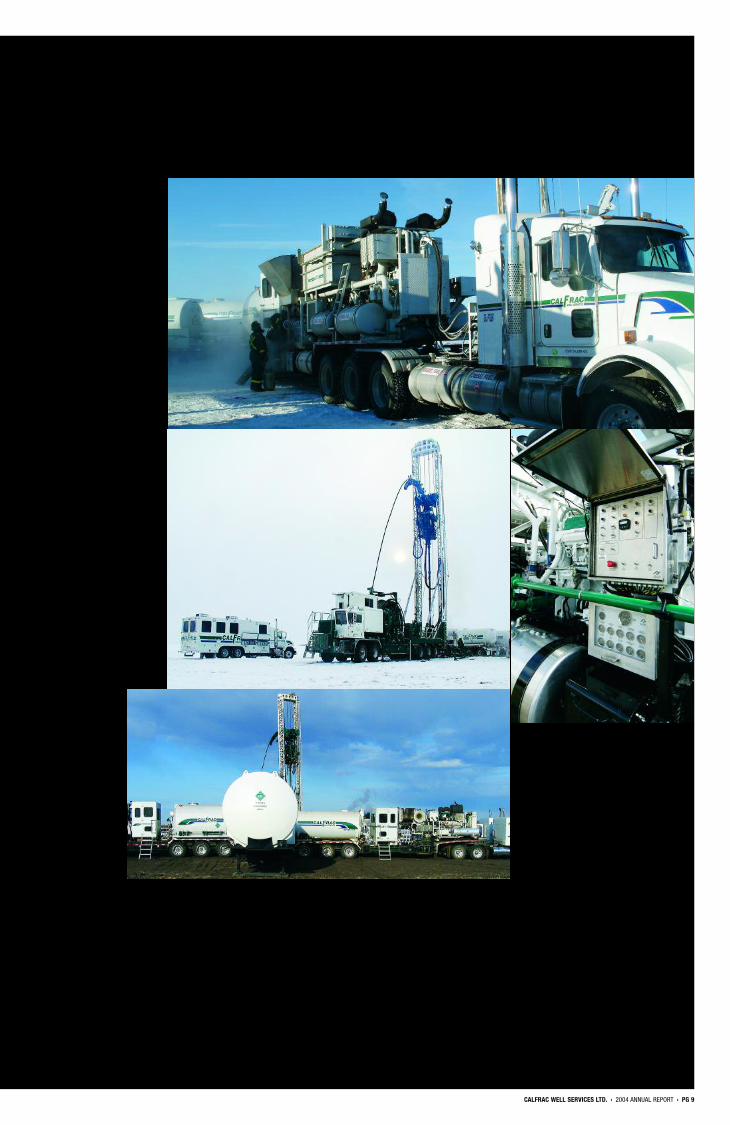
wellbore with coiled tubing. The
downhole isolation tool allows the
treatment to be applied to each
individual coal seam within the
wellbore without having to trip out
of the hole to reset the tool. In the
early development stages of this
technique, Calfrac recognized that
existing triplex nitrogen pumping
equipment could not pump at
sufficiently high rates, and as a
result, constructed the industry’s
first high rate Quintiplex Nitrogen
Pumper that uses state-of-the-art
technology to pump at more than
twice the rate of a conventional
triplex pumper. This unit leaves a
smaller wellsite footprint with less
environmental impact and pro-
vides higher operating efficiency
that requires fewer operators. To
ensure product availability for
these specialty treatments, Calfrac
has secured an exclusive long-
term supply of large volumes of
nitrogen and a preferential right of
use contract with the industry’s
largest service company supplying
fracturing through coil rigs.
CALFRAC WELL SERVICES LTD. › 2004 ANNUAL REPORT › PG 9
PG 10 › CALFRAC WELL SERVICES LTD. › 2004 ANNUAL REPORT
INNOVATION
At Calfrac, our goal is to under-
stand the operational issues our
customers face and then create
advanced technologies that
address them. Through constant
innovation, rapid response times
and service of the highest quality,
we create value for our customers
and contribute to their success.
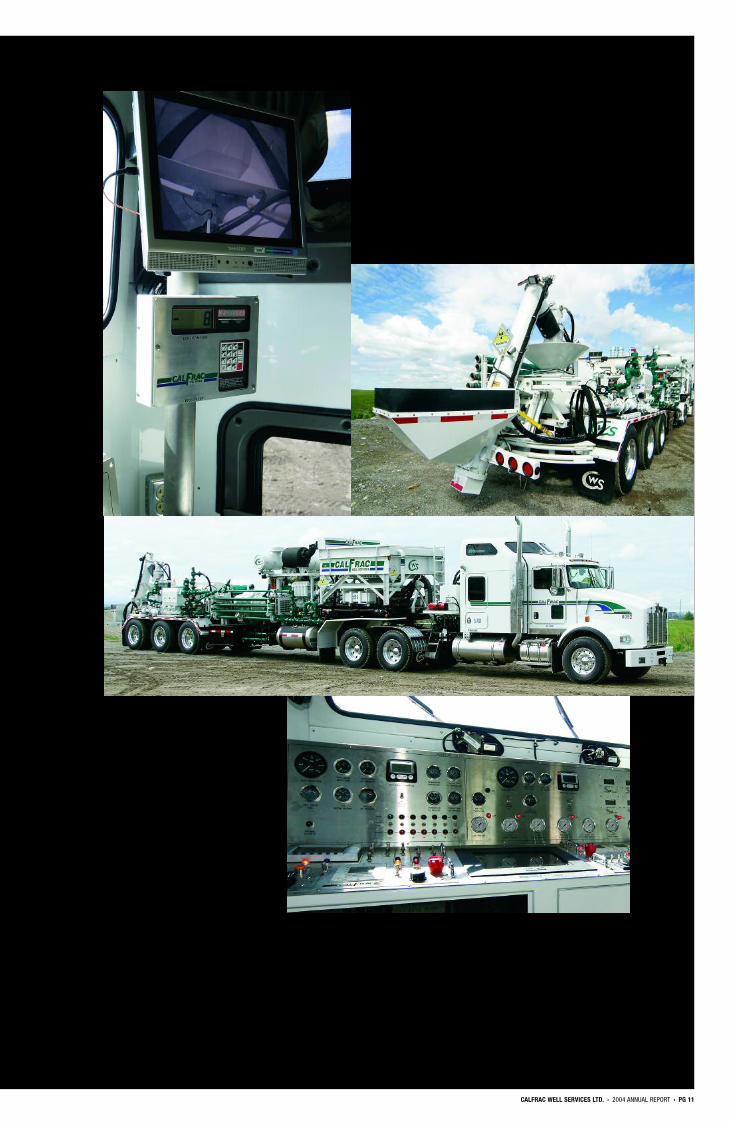
Increasingly, our solutions are
delivered through a combination
of applications. Calfrac’s new
Combination Blender/Pumper
combines the functions of four
units into one including a blender,
high-pressure pumper, data
acquisition unit and an iron
transportation unit. This unique
multi-function unit effectively
reduces operating costs by reduc-
ing the number of field personnel
and pieces of equipment required
to complete a fracture treatment.
The pumping rate and pressure
capabilities have also been opti-
mized so that this unit can be
used on fracturing through coil
treatments, today’s preferred
method of treating shallow natural
gas wells. The design of the
Combination Blender/Pumper
is also suitable for pumping
Calfrac’s proprietary CWS-300
Frac System as well as the
Company’s PolyCO2 Frac System.
CALFRAC WELL SERVICES LTD. › 2004 ANNUAL REPORT › PG 11
PG 12 › CALFRAC WELL SERVICES LTD. › 2004 ANNUAL REPORT
EQUIPMENT
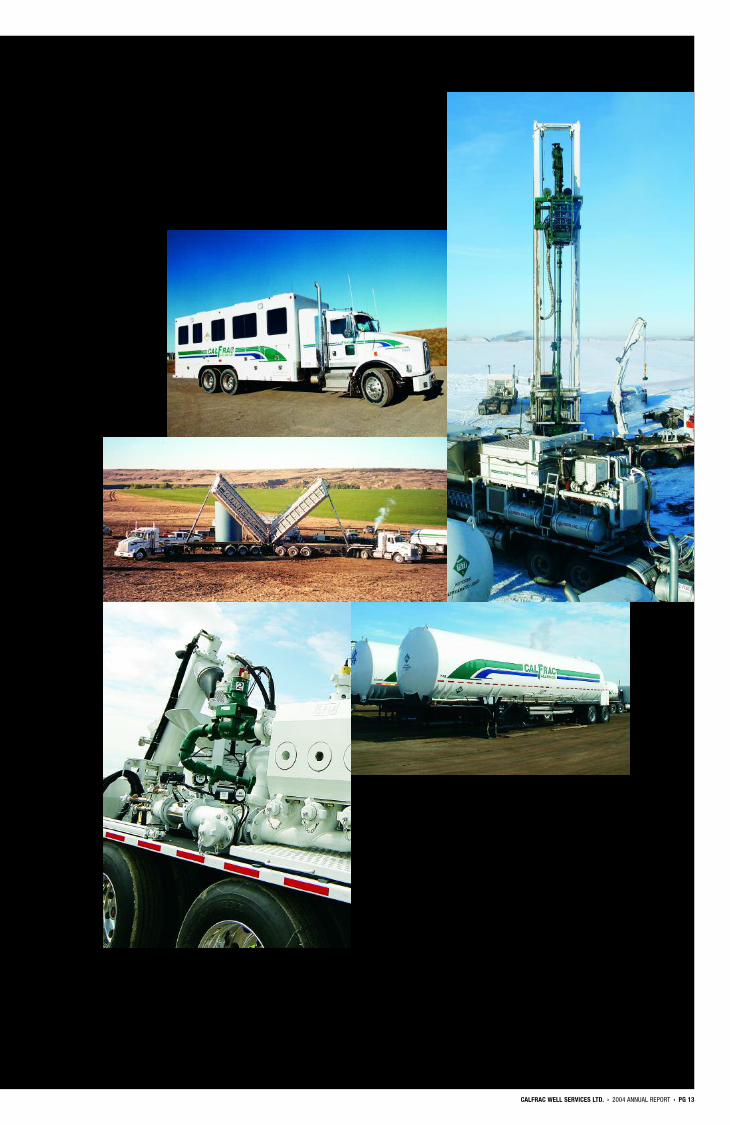
We employ expert technicians
and use leading parts, machinery
and assembly craftsmen from
around the world for the develop-
ment and manufacturing of our
unique fleet of specialty oilfield
services equipment. Each piece of
Calfrac equipment is specifically
designed and manufactured with
four factors in mind: efficiency,
performance, reliability and envi-
ronmental protection. Our quality
state-of-the-art equipment unique-
ly combines several operating
functions on one single unit. This
Currently, our equipment
fleet includes:
› Combination Blender/Pumpers
› Blend Vans
› Frac Pumpers
› Frac Blenders
› Chemical Vans
› Computer Vans
› Quintiplex Nitrogen Pumpers
› Coiled Tubing Units
› Cementing Units
multi-function approach means a
smaller wellsite footprint that
provides higher operating efficien-
cies: fewer units means fewer
operators and less environmental
impact. We work closely with our
customers through each stage of
design and development to ensure
we meet their exacting perform-
ance requirements.
Calfrac employs six distin-
guished manufacturing companies
located throughout North America.
Each manufacturer has the capa-
bility to fully engineer our specific
equipment requirements and has
the capacity to complete each
new build on time and on budget.
Due to the oil and gas industry’s
ongoing high activity levels,
equipment manufacturing capacity
is at a premium, making our vendor
selection even more critical.
Therefore, we work hard to main-
tain strong relationships with each
of our vendors and third party
suppliers.
CALFRAC WELL SERVICES LTD. › 2004 ANNUAL REPORT › PG 13
PG 14 › CALFRAC WELL SERVICES LTD. › 2004 ANNUAL REPORT
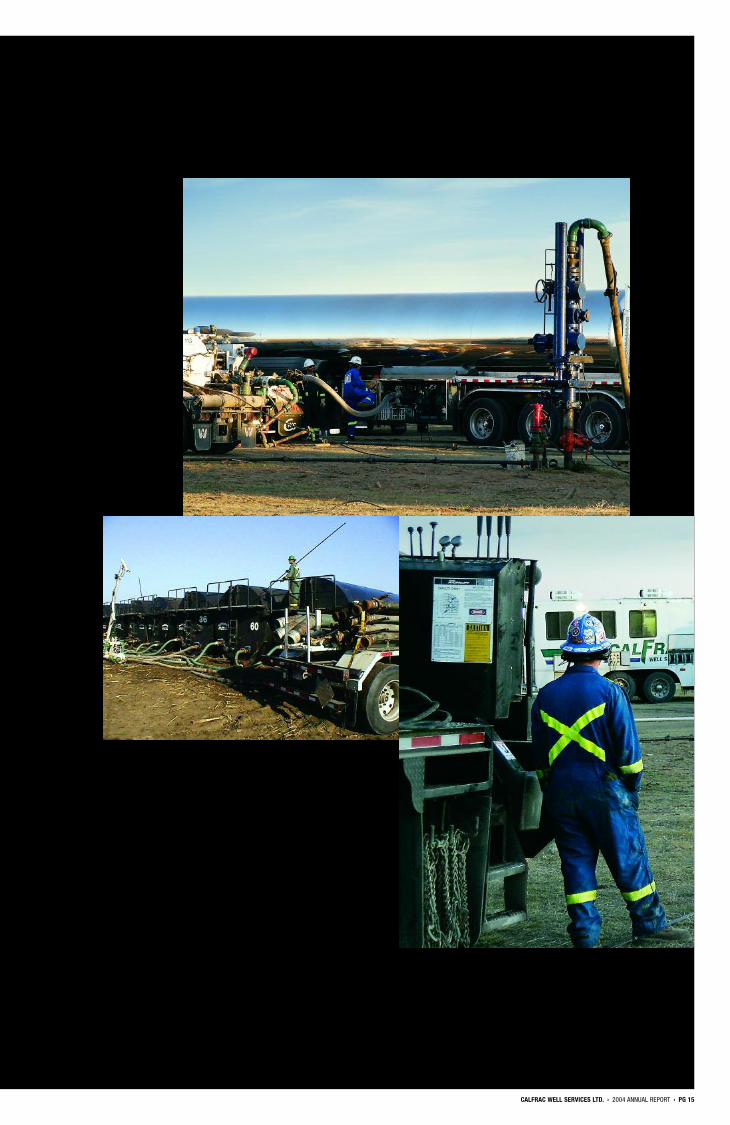
HS&EWe strive to be a leader in
protecting the health, safety,
environmental and quality needs
of our employees, customers,
suppliers and members of the
public who may be affected by
our operations. At Calfrac, no job
is so important that we cannot
take the time to do it safely and
responsibly.
Calfrac has established and
maintains an active, comprehensive
health, safety and environmental
(“HS&E”) management program
based on industry best practices
that meet or exceed all regulatory
standards and guidelines to
ensure a consistent approach
across our various operations and
to stimulate an ongoing search
for improvement. As a result of
our efforts, in 2004 we earned
a Certificate of Recognition from
Alberta Human Resources in part-
nership with the Petroleum
Institute for Training.
Our safety performance demon-
strates our Company’s resolve to
operate safely. Over the past five
years, Calfrac’s average lost-time
injury rate has consistently
bettered that of the “Downhole
and Other Oilfield Service Sector”
as reported by Alberta’s Workers’
Compensation Board and Alberta
Human Resources and Equipment
Board.
Social responsibility at Calfrac
also involves minimizing, as much
as reasonably achievable, the
impact of our operations on the
physical environment. Our Company
achieved a high level of regulatory
compliance in 2004. Through
effective environmental programs,
we have minimized the number of
reportable environmental inci-
dents, none of which had any
significant environmental impact.
In an effort to improve this
performance, Calfrac has adopted
a comprehensive environmental
management system that is
complemented by innovative
process improvements, ongoing
reclamation of disturbed areas,
systematic recycling of byproducts
and minimizing waste generation.
Through ongoing communica-
tion, education and inspection
programs, we continually improve
our policies, which translates to
greater efficiency, less downtime,
and as a result, greater benefit to
our customers.
CALFRAC WELL SERVICES LTD. › 2004 ANNUAL REPORT › PG 15
PG 16 › CALFRAC WELL SERVICES LTD. › 2004 ANNUAL REPORT
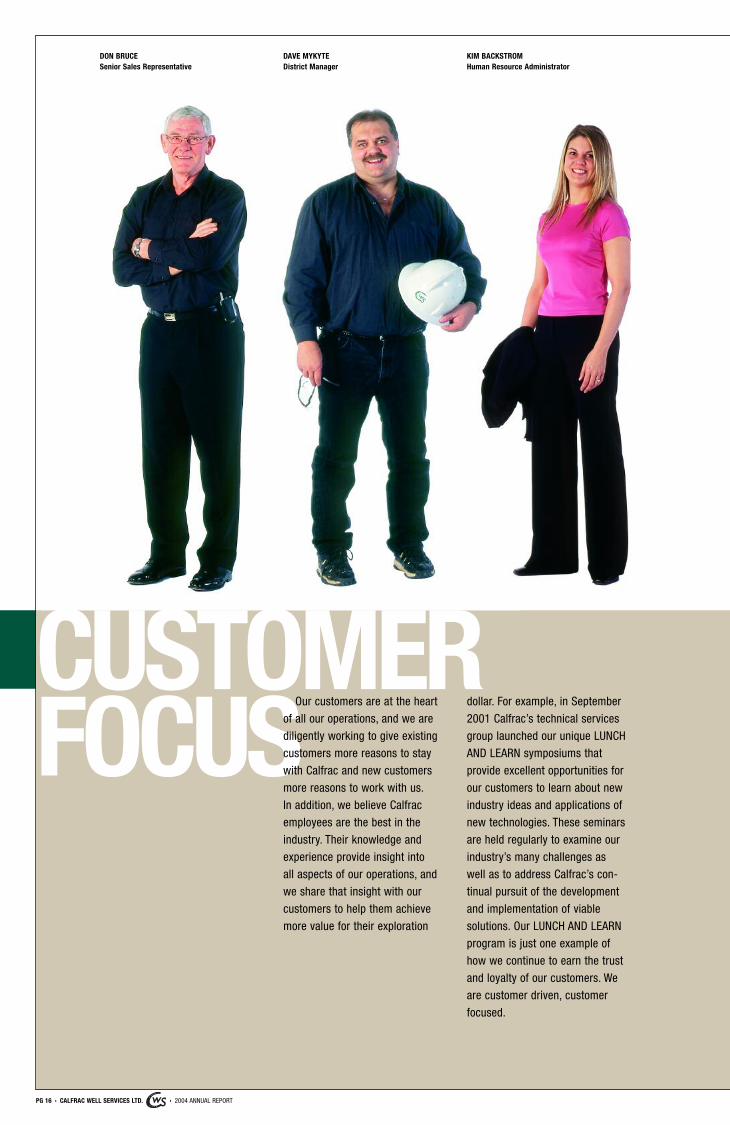
CUSTOMERFOCUS
DON BRUCESenior Sales Representative
Our customers are at the heart
of all our operations, and we are
diligently working to give existing
customers more reasons to stay
with Calfrac and new customers
more reasons to work with us.
In addition, we believe Calfrac
employees are the best in the
industry. Their knowledge and
experience provide insight into
all aspects of our operations, and
we share that insight with our
customers to help them achieve
more value for their exploration
dollar. For example, in September
2001 Calfrac’s technical services
group launched our unique LUNCH
AND LEARN symposiums that
provide excellent opportunities for
our customers to learn about new
industry ideas and applications of
new technologies. These seminars
are held regularly to examine our
industry’s many challenges as
well as to address Calfrac’s con-
tinual pursuit of the development
and implementation of viable
solutions. Our LUNCH AND LEARN
program is just one example of
how we continue to earn the trust
and loyalty of our customers. We
are customer driven, customer
focused.
DAVE MYKYTEDistrict Manager
KIM BACKSTROMHuman Resource Administrator
CALFRAC WELL SERVICES LTD. › 2004 ANNUAL REPORT › PG 17
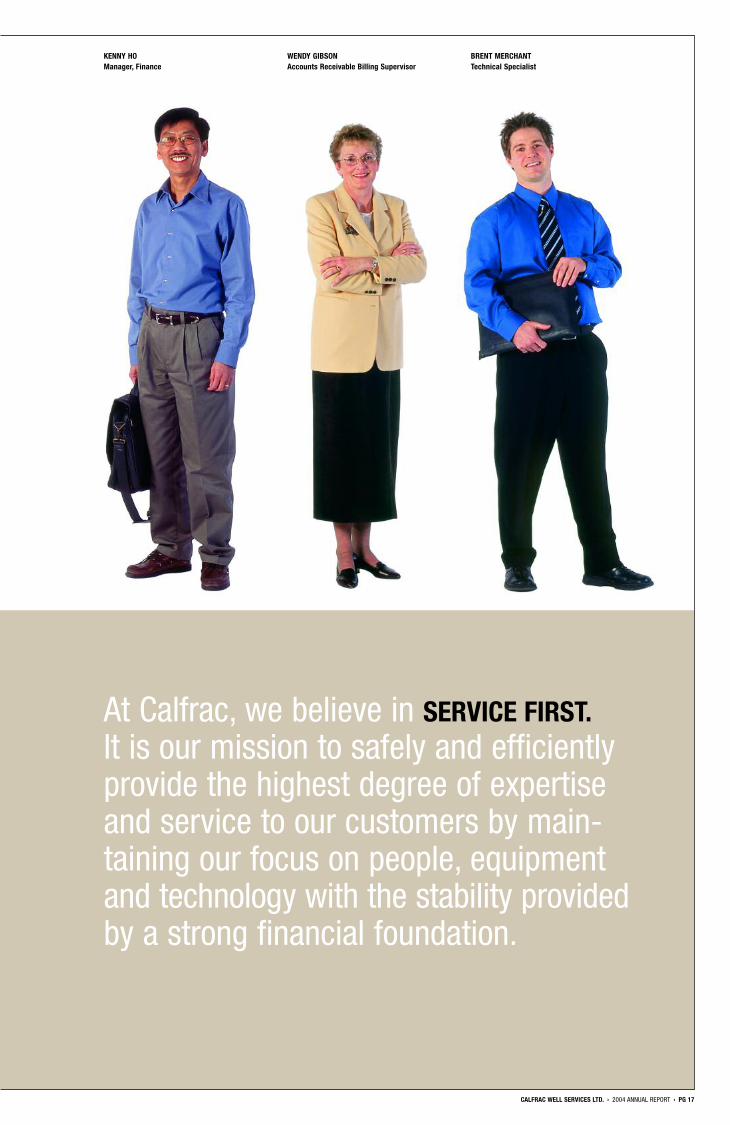
At Calfrac, we believe in SERVICE FIRST.It is our mission to safely and efficientlyprovide the highest degree of expertiseand service to our customers by main-taining our focus on people, equipmentand technology with the stability providedby a strong financial foundation.
KENNY HOManager, Finance
WENDY GIBSONAccounts Receivable Billing Supervisor
BRENT MERCHANTTechnical Specialist
PG 18 › CALFRAC WELL SERVICES LTD. › 2004 ANNUAL REPORT
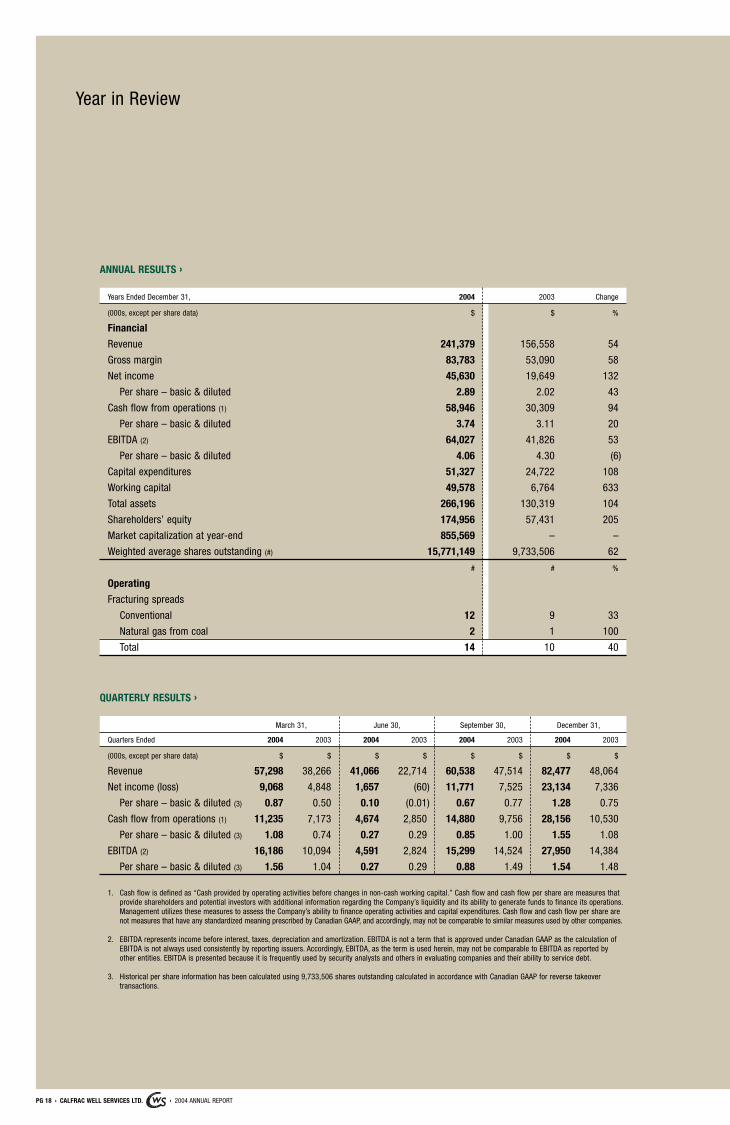
Year in Review
ANNUAL RESULTS ›
Years Ended December 31, 2004 2003 Change
(000s, except per share data) $ $ %
Financial
Revenue 241,379 156,558 54
Gross margin 83,783 53,090 58
Net income 45,630 19,649 132
Per share – basic & diluted 2.89 2.02 43
Cash flow from operations (1) 58,946 30,309 94
Per share – basic & diluted 3.74 3.11 20
EBITDA (2) 64,027 41,826 53
Per share – basic & diluted 4.06 4.30 (6)
Capital expenditures 51,327 24,722 108
Working capital 49,578 6,764 633
Total assets 266,196 130,319 104
Shareholders’ equity 174,956 57,431 205
Market capitalization at year-end 855,569 – –
Weighted average shares outstanding (#) 15,771,149 9,733,506 62
# # %
Operating
Fracturing spreads
Conventional 12 9 33
Natural gas from coal 2 1 100
Total 14 10 40
QUARTERLY RESULTS ›
March 31, June 30, September 30, December 31,
Quarters Ended 2004 2003 2004 2003 2004 2003 2004 2003
(000s, except per share data) $ $ $ $ $ $ $ $
Revenue 57,298 38,266 41,066 22,714 60,538 47,514 82,477 48,064
Net income (loss) 9,068 4,848 1,657 (60) 11,771 7,525 23,134 7,336
Per share – basic & diluted (3) 0.87 0.50 0.10 (0.01) 0.67 0.77 1.28 0.75
Cash flow from operations (1) 11,235 7,173 4,674 2,850 14,880 9,756 28,156 10,530
Per share – basic & diluted (3) 1.08 0.74 0.27 0.29 0.85 1.00 1.55 1.08
EBITDA (2) 16,186 10,094 4,591 2,824 15,299 14,524 27,950 14,384
Per share – basic & diluted (3) 1.56 1.04 0.27 0.29 0.88 1.49 1.54 1.48
1. Cash flow is defined as “Cash provided by operating activities before changes in non-cash working capital.” Cash flow and cash flow per share are measures thatprovide shareholders and potential investors with additional information regarding the Company’s liquidity and its ability to generate funds to finance its operations.Management utilizes these measures to assess the Company’s ability to finance operating activities and capital expenditures. Cash flow and cash flow per share arenot measures that have any standardized meaning prescribed by Canadian GAAP, and accordingly, may not be comparable to similar measures used by other companies.
2. EBITDA represents income before interest, taxes, depreciation and amortization. EBITDA is not a term that is approved under Canadian GAAP as the calculation ofEBITDA is not always used consistently by reporting issuers. Accordingly, EBITDA, as the term is used herein, may not be comparable to EBITDA as reported byother entities. EBITDA is presented because it is frequently used by security analysts and others in evaluating companies and their ability to service debt.
3. Historical per share information has been calculated using 9,733,506 shares outstanding calculated in accordance with Canadian GAAP for reverse takeover transactions.
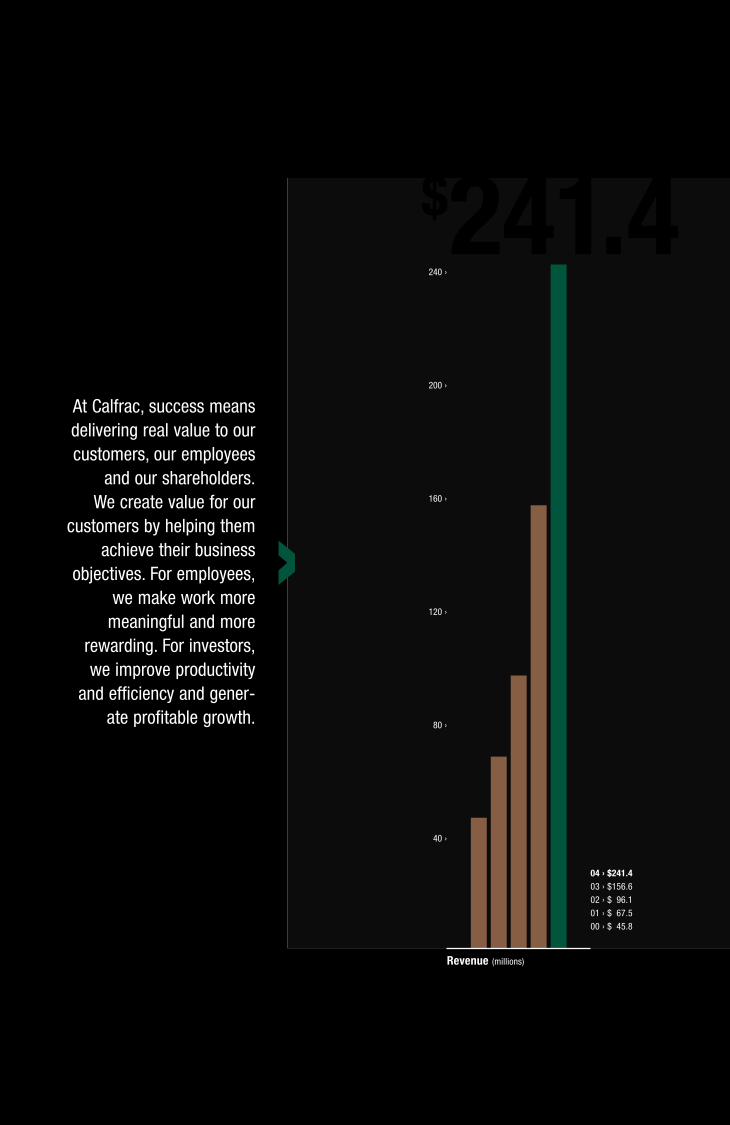
At Calfrac, success meansdelivering real value to ourcustomers, our employees
and our shareholders.We create value for our
customers by helping themachieve their business
objectives. For employees,we make work more
meaningful and morerewarding. For investors,we improve productivity
and efficiency and gener-ate profitable growth.
Revenue (millions)
04 › $241.403 › $156.602 › $096.101 › $067.500 › $045.8
$241.4240 ›
200 ›
160 ›
120 ›
80 ›
40 ›
›
For Calfrac, 2004 was a year of impor-tant milestones. Not only did it mark ourFIFTH ANNIVERSARY as a thriving oilfieldservices company and the year duringwhich record drilling activity contributedto our best ever financial and operatingresults, it was also the year in which ourCompany moved to the public arena.
CALFRAC WELL SERVICES LTD. › 2004 ANNUAL REPORT › PG 15
Letter to Shareholders
team ready to grow the Company.
Through the business combination,
a significant number of tax attrib-
utes became available, our debt
was reduced to nominal levels, an
aggressive growth platform was
funded and a diversified public
shareholder base was developed.
Calfrac’s common shares began
trading on the Toronto Stock
Exchange on March 29, 2004
under the symbol CFW. Calfrac’s
directors and officers currently
own approximately 42% of the
Company.
Today, Calfrac is a leading
provider of specialized oilfield
services, including fracturing,
coiled tubing, cementing and well
stimulation services, throughout
Western Canada and the Rocky
Mountain region of the United
States.
OUR CORPORATE EVOLUTION ›
During 2004, Calfrac Well
Services Ltd. evolved from its
genesis as a private company
established in June 1999 to its
current operating form as a public
entity through the amalgamation
with Denison Energy Inc. on
March 24, 2004. The successor
company continues to operate
as a prominent oilfield services
company, having retained all of
Calfrac’s executive and opera-
tional management as well as
its name and business focus.
Calfrac entered the year with
a capital asset base of $78.4 mil-
lion, cash of approximately $15.0
million, $35.9 million in debt, 10
operating fracturing spreads and a
strong management and technical
MAINTAINING OUR FOCUS ›
Calfrac occupies a solid niche
in the oilfield services landscape.
We focus our efforts on the primary
operating regions best suited to
our equipment and technology
with a combination of customer
focus, exceptional operational
performance and financial
strength.
From our humble beginnings in
1999 with one fracturing spread
and four coiled tubing crews to
our operation today that employs
17 fracturing spreads, 11 coiled
tubing crews and 9 cementing
units, we have always focused on
three key principles – excellent
equipment and technology, well
trained motivated people and solid
finances – under our motto of
SERVICE FIRST and TECHNOLOGIES
THAT WORK IN THE FIELD.
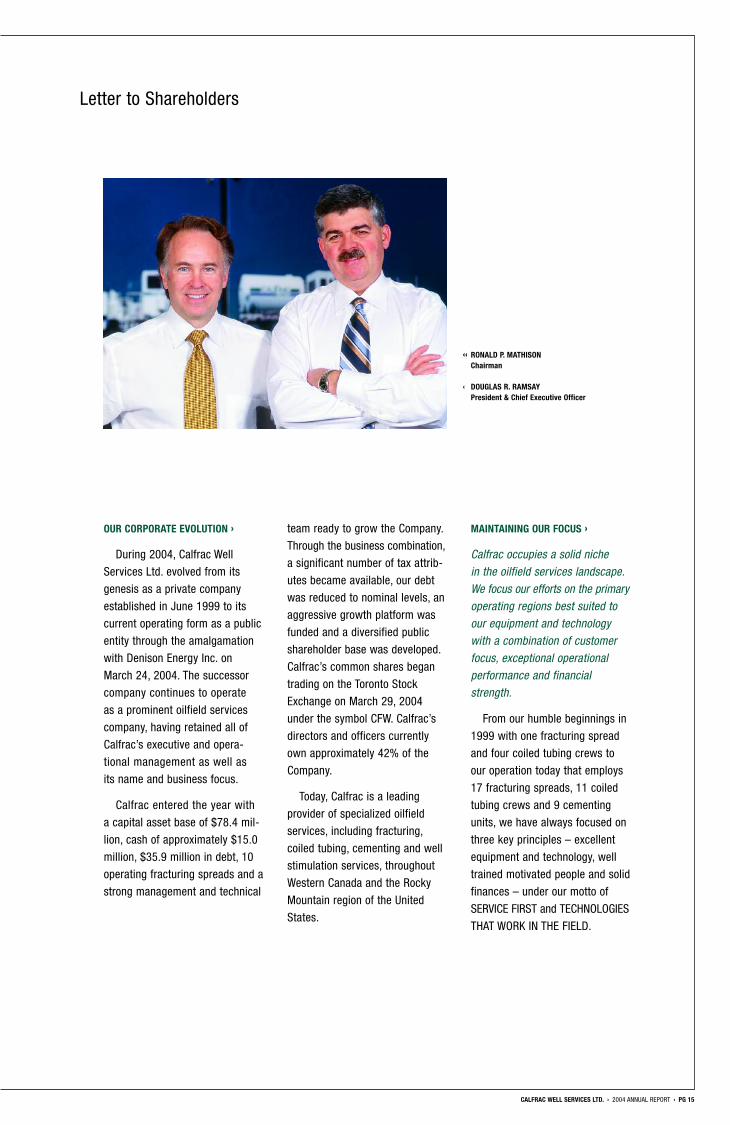
‹‹ RONALD P. MATHISONChairman
‹ DOUGLAS R. RAMSAYPresident & Chief Executive Officer
1999JUNE ›
Calfrac founded as a private corporation byMessrs. Ronald Mathison,Douglas Ramsay, GordonDibb and Robert Roberts.
AUGUST ›
Commenced operationsfrom Medicine Hat, Albertafield facility with 1 coiledtubing unit.
SEPTEMBER ›
Acquired a 2-pumperspread, shallow coiled tub-ing unit, high rate nitrogenpumper and 4 acid pumpersthrough acquisition ofDynaFrac Well Services Ltd.Completed 1st hydraulicfracturing treatment.
NOVEMBER ›
Acquired 1 shallow and 2 deep coiled tubing units,2 combination nitrogen-acidpumpers and support equipment.
DECEMBER ›
Added 2nd and 3rd fracturing spreads.
PG 16 › CALFRAC WELL SERVICES LTD. › 2004 ANNUAL REPORT
Good Equipment and TechnologyStarting as a small oilfield
services company based initially
in Medicine Hat, Alberta with
operations focused on shallow
gas wells, we quickly expanded
into geographic regions known
for deeper, more technical wells.
As a result, over the past five
years we have added operational
bases in Red Deer and Grande
Prairie, Alberta and have entered
into the United States market with
an operating base located in
Platteville, Colorado. In order to
adequately serve our customers’
range of operational needs, we
require quality state-of-the-art
equipment that combines several
functions on a single unit. This
multi-function approach has
numerous benefits such as leaving
a smaller wellsite footprint, pro-
viding higher operating efficiency
that requires fewer qualified
operators, which in turn brings
better value to our customers by
lowering their wellbore costs, and
integrating modern technologies
that improve production results
with little or no impact on the
environment. The complexity of
offering cost effective operations
means that customers increasing-
ly turn to Calfrac for the expertise
we provide. Customers recognize
the strength of our position in the
oilfield services sector and under-
stand the advantages of Calfrac’s
scale of operations and depth of
specialization.
Good PeopleOur Company’s success is
due to the efforts of our people,
a remarkably talented and experi-
enced group of professionals who
together represent Calfrac’s most
important asset. Their dedication
to meeting the needs of our
customers by adhering to our
management principles is the
key to the successful execution
of our strategy.
Good FinancesFinancial strength and flexibility
are imperative and we are dedi-
cated to maintaining solid cash
resources to provide a strong
engine for growth. For the year
ended December 31, 2004, our
revenues totaled $241.4 million,
net income amounted to $45.6
million or $2.89 per share and
operating cash flow before change
in non-cash working capital was
$58.9 million or $3.74 per share
with 18.1 million shares outstand-
ing. At year-end, Calfrac had
working capital of $49.6 million
and little debt. During 2005, it is
expected that internally generated
cash sources will fund the
Company’s $87.0 million capital
expenditures program and we will
exit the year with no additional
debt. Sound business practices
and fiscally responsible decision-
making procedures are part of the
foundation of Calfrac’s financial
strength.
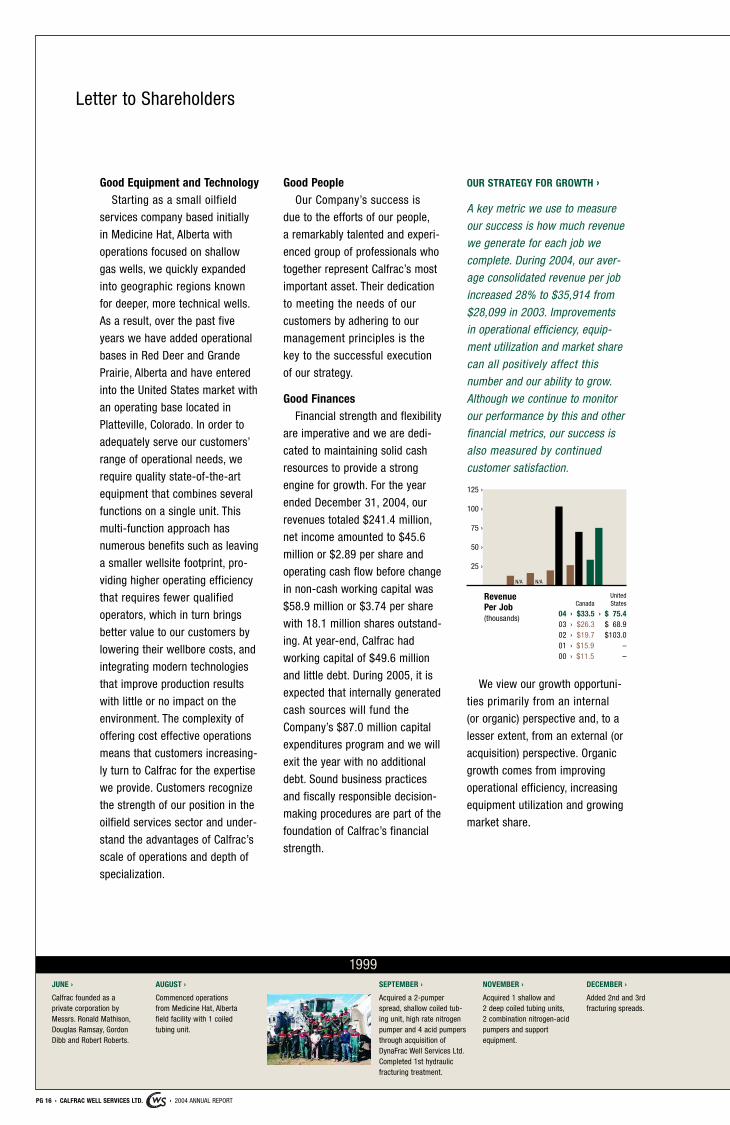
OUR STRATEGY FOR GROWTH ›
A key metric we use to measure
our success is how much revenue
we generate for each job we
complete. During 2004, our aver-
age consolidated revenue per job
increased 28% to $35,914 from
$28,099 in 2003. Improvements
in operational efficiency, equip-
ment utilization and market share
can all positively affect this
number and our ability to grow.
Although we continue to monitor
our performance by this and other
financial metrics, our success is
also measured by continued
customer satisfaction.
We view our growth opportuni-
ties primarily from an internal
(or organic) perspective and, to a
lesser extent, from an external (or
acquisition) perspective. Organic
growth comes from improving
operational efficiency, increasing
equipment utilization and growing
market share.
Letter to Shareholders
Revenue Per Job (thousands)
UnitedCanada States
04 › $33.5 › $075.403 › $26.3 $068.902 › $19.7 $103.001 › $15.9 –00 › $11.5 –
125 ›
100 ›
75 ›
50 ›
25 ›
N/A N/A
2000JANUARY ›
Opened our firstRed Deer, Albertadistrict facility.
FEBRUARY ›
Constructed 4th fractur-ing spread specificallydesigned to stimulateshallow natural gaswells.
OCTOBER ›
Established GrandePrairie, Alberta districtfacility to support expan-sion of operations intonorthern Alberta andBritish Columbia.
DECEMBER ›
Added 5th fracturing spread.
CALFRAC WELL SERVICES LTD. › 2004 ANNUAL REPORT › PG 17
Operational EfficiencyOperational efficiency means
providing more with less – more
unique services and equipment
with less time, cost and environ-
mental threat. Calfrac continues
to successfully grow by offering
our customers the competitive
advantage of operational efficien-
cy. On a daily basis, we continue
to focus our efforts on maximizing
the number of jobs completed per
spread. In the current economic
environment, oilfield service
companies face increasingly
intense competition and pressure
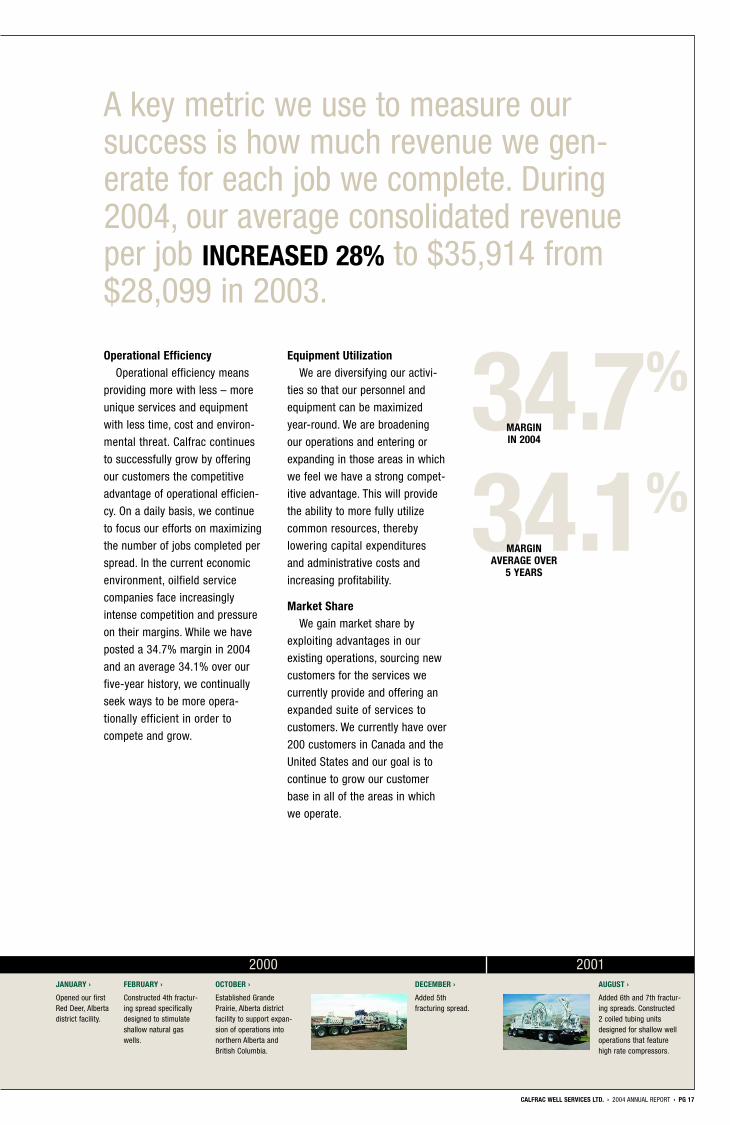
on their margins. While we have
posted a 34.7% margin in 2004
and an average 34.1% over our
five-year history, we continually
seek ways to be more opera-
tionally efficient in order to
compete and grow.
Equipment UtilizationWe are diversifying our activi-
ties so that our personnel and
equipment can be maximized
year-round. We are broadening
our operations and entering or
expanding in those areas in which
we feel we have a strong compet-
itive advantage. This will provide
the ability to more fully utilize
common resources, thereby
lowering capital expenditures
and administrative costs and
increasing profitability.
Market ShareWe gain market share by
exploiting advantages in our
existing operations, sourcing new
customers for the services we
currently provide and offering an
expanded suite of services to
customers. We currently have over
200 customers in Canada and the
United States and our goal is to
continue to grow our customer
base in all of the areas in which
we operate.
A key metric we use to measure oursuccess is how much revenue we gen-erate for each job we complete. During2004, our average consolidated revenueper job INCREASED 28% to $35,914 from$28,099 in 2003.
34.1%MARGIN
AVERAGE OVER5 YEARS
34.7%MARGININ 2004
2001AUGUST ›
Added 6th and 7th fractur-ing spreads. Constructed 2 coiled tubing unitsdesigned for shallow welloperations that featurehigh rate compressors.
2002FEBRUARY ›
Expanded operations to theUnited States and openedPlatteville, Colorado fieldoffice.
NOVEMBER ›
Opened a new 15,000square foot Red Deer,Alberta district facility.
DECEMBER ›
Added 8th and 9th fracturing spreads.
PG 18 › CALFRAC WELL SERVICES LTD. › 2004 ANNUAL REPORT
Domestic OpportunitiesOur domestic business serves
customers throughout the Western
Canadian Sedimentary Basin.
During 2004, we acquired Ram
Cementers Inc., thereby expanding
our suite of services to include
cementing. We added an additional
fracturing spread and constructed
a state-of-the-art warehouse in
Grande Prairie in order to service
growing operations in Canada’s
northern regions. In addition, there
is the potential for significant
growth in central Alberta’s expand-
ing natural gas from coal market.
While we continue to be the
market innovator and leader in
providing fracturing services to
this specialized market, we antici-
pate growing these operations by
adding two additional fracturing
spreads by the summer of 2005.
International OpportunitiesIn our international business,
we are well positioned to serve
customers whose worldwide
reach requires a global partner
that can ensure high quality and
timely oilfield services. We are
particularly excited about our
growth into the United States,
where during 2004 we expanded
our fracturing fleet, customer
base and workforce to support the
U.S. Rocky Mountain region. We
also established a new marketing
and operational team to investi-
gate opportunities in Russia, the
world’s third largest fracturing
market. A formal decision on
whether to move forward with this
initiative is expected in 2005.
Letter to Shareholders
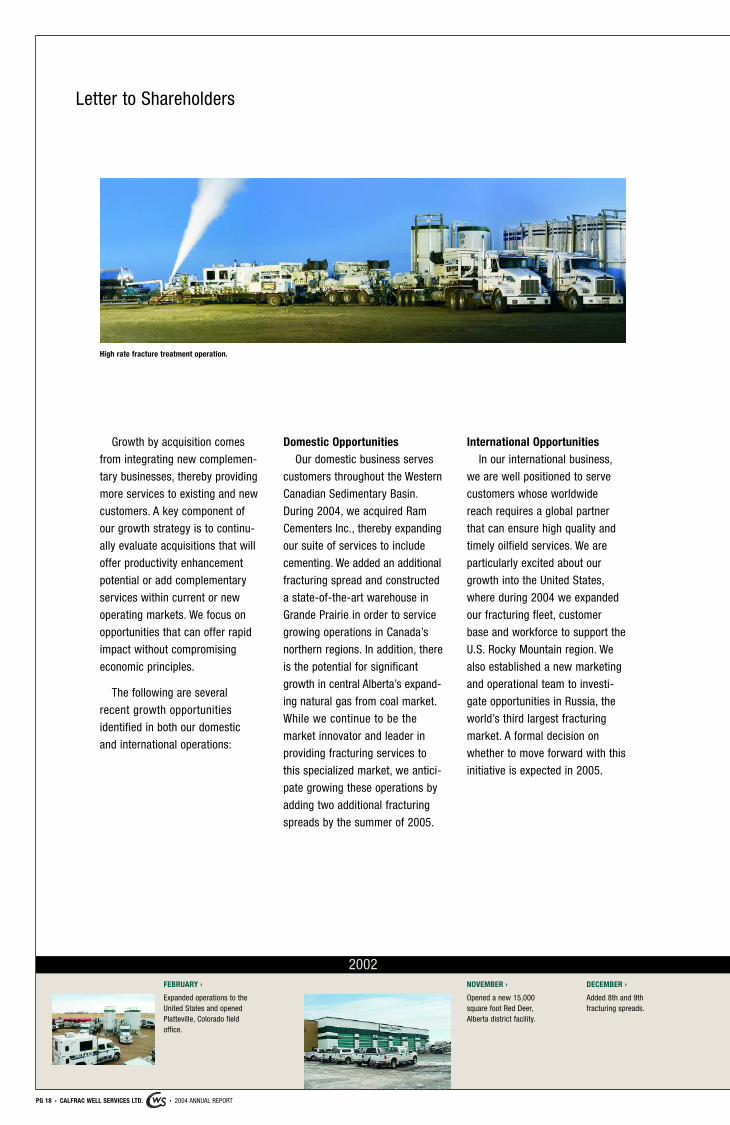
High rate fracture treatment operation.
Growth by acquisition comes
from integrating new complemen-
tary businesses, thereby providing
more services to existing and new
customers. A key component of
our growth strategy is to continu-
ally evaluate acquisitions that will
offer productivity enhancement
potential or add complementary
services within current or new
operating markets. We focus on
opportunities that can offer rapid
impact without compromising
economic principles.
The following are several
recent growth opportunities
identified in both our domestic
and international operations:
2003JANUARY ›
Added 10th fracturingspread representing the 1stspread specifically designedto fracture NGC wells.
MARCH ›
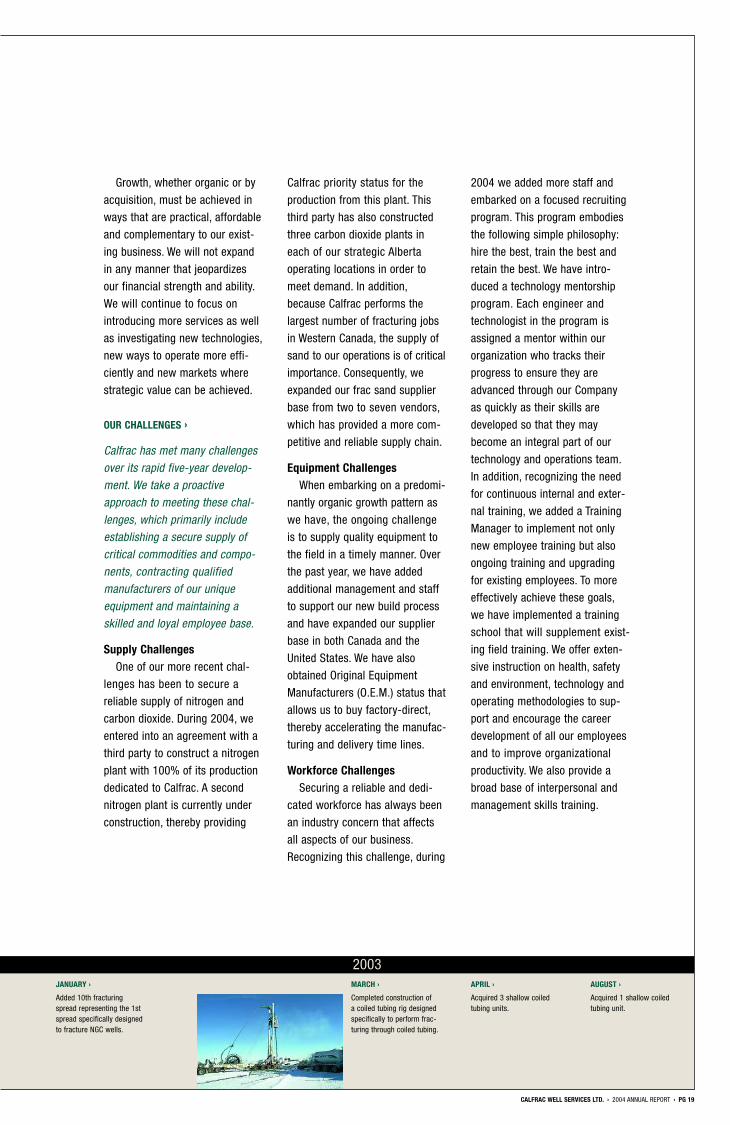
Completed construction of a coiled tubing rig designedspecifically to perform frac-turing through coiled tubing.
APRIL ›
Acquired 3 shallow coiledtubing units.
AUGUST ›
Acquired 1 shallow coiledtubing unit.
CALFRAC WELL SERVICES LTD. › 2004 ANNUAL REPORT › PG 19
Growth, whether organic or by
acquisition, must be achieved in
ways that are practical, affordable
and complementary to our exist-
ing business. We will not expand
in any manner that jeopardizes
our financial strength and ability.
We will continue to focus on
introducing more services as well
as investigating new technologies,
new ways to operate more effi-
ciently and new markets where
strategic value can be achieved.
OUR CHALLENGES ›
Calfrac has met many challenges
over its rapid five-year develop-
ment. We take a proactive
approach to meeting these chal-
lenges, which primarily include
establishing a secure supply of
critical commodities and compo-
nents, contracting qualified
manufacturers of our unique
equipment and maintaining a
skilled and loyal employee base.
Supply ChallengesOne of our more recent chal-
lenges has been to secure a
reliable supply of nitrogen and
carbon dioxide. During 2004, we
entered into an agreement with a
third party to construct a nitrogen
plant with 100% of its production
dedicated to Calfrac. A second
nitrogen plant is currently under
construction, thereby providing
Calfrac priority status for the
production from this plant. This
third party has also constructed
three carbon dioxide plants in
each of our strategic Alberta
operating locations in order to
meet demand. In addition,
because Calfrac performs the
largest number of fracturing jobs
in Western Canada, the supply of
sand to our operations is of critical
importance. Consequently, we
expanded our frac sand supplier
base from two to seven vendors,
which has provided a more com-
petitive and reliable supply chain.
Equipment ChallengesWhen embarking on a predomi-
nantly organic growth pattern as
we have, the ongoing challenge
is to supply quality equipment to
the field in a timely manner. Over
the past year, we have added
additional management and staff
to support our new build process
and have expanded our supplier
base in both Canada and the
United States. We have also
obtained Original Equipment
Manufacturers (O.E.M.) status that
allows us to buy factory-direct,
thereby accelerating the manufac-
turing and delivery time lines.
Workforce ChallengesSecuring a reliable and dedi-
cated workforce has always been
an industry concern that affects
all aspects of our business.
Recognizing this challenge, during
2004 we added more staff and
embarked on a focused recruiting
program. This program embodies
the following simple philosophy:
hire the best, train the best and
retain the best. We have intro-
duced a technology mentorship
program. Each engineer and
technologist in the program is
assigned a mentor within our
organization who tracks their
progress to ensure they are
advanced through our Company
as quickly as their skills are
developed so that they may
become an integral part of our
technology and operations team.
In addition, recognizing the need
for continuous internal and exter-
nal training, we added a Training
Manager to implement not only
new employee training but also
ongoing training and upgrading
for existing employees. To more
effectively achieve these goals,
we have implemented a training
school that will supplement exist-
ing field training. We offer exten-
sive instruction on health, safety
and environment, technology and
operating methodologies to sup-
port and encourage the career
development of all our employees
and to improve organizational
productivity. We also provide a
broad base of interpersonal and
management skills training.
2004FEBRUARY ›
Introduced industry-first quint nitrogenpumper. Signed contract with a majorAlberta supplier of coiled tubing rigservices providing Calfrac right of firstcall on 7 coiled tubing fracturing rigs.Added 11th fracturing spread,Calfrac’s 2nd NGC-dedicated spread.
MARCH ›
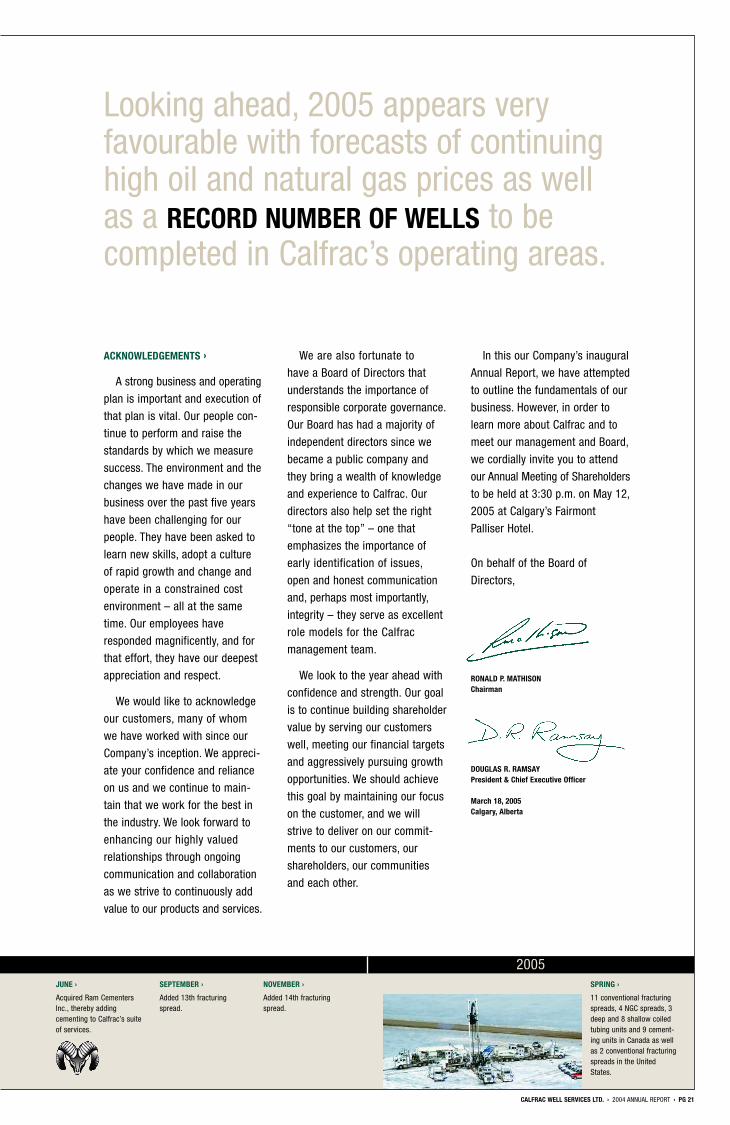
Amalgamated with DenisonEnergy Inc., a public com-pany, and began trading onTSX: trading symbol CFW.
MAY ›
Added 12th fracturingspread, the 2nd spreadfor the U.S. fleet.
PG 20 › CALFRAC WELL SERVICES LTD. › 2004 ANNUAL REPORT
OUR COMMITMENT TO HS&E ›
An integral component of
Calfrac’s plans for growth is our
determination to continue to excel
in the areas of health, safety and
environmental (“HS&E”) responsi-
bility. We have made a serious
commitment to lead the industry
in HS&E practices and perform-
ance, and although our Company
continues to expand, we will not
lose focus on the value of provid-
ing a safe work environment for
our employees, our third party
contractors and customers. During
2004, we expanded our HS&E
team to give coverage to all areas
of operations and to continue to
educate our employees on safe
practice methods and response
to emergencies. We work with a
variety of safety institutions and
related third parties to continually
test and certify our employees on
these procedures. In addition, our
operations and HS&E staff actively
participates with industry partners
to develop standards and accepted
practices to ensure that industry
goals are met or exceeded.
OUTLOOK ›
Looking ahead, 2005 appears
very favourable with forecasts of
continuing high oil and natural
gas prices as well as a record
number of wells to be completed
in Calfrac’s operating areas. Given
these indicators, combined with
a larger fleet of equipment, we
expect to post increases in both
financial and operating results.
Calfrac is well positioned for
further growth having a solid
balance sheet with a healthy level
of cash, state-of-the-art operating
assets and a motivated and ener-
gized team of people. Our 2005
capital program contemplates
the expansion of our operating
capacity in all service areas with
the addition of seven fracturing
spreads, three coiled tubing
crews, eight cementing units
and related support equipment.
Cementing operations, which
currently represent only about 2%
of our Company’s total revenues,
should increase significantly
during 2005 through an expanded
fleet of equipment and augmented
marketing and operational
capabilities.
Letter to Shareholders
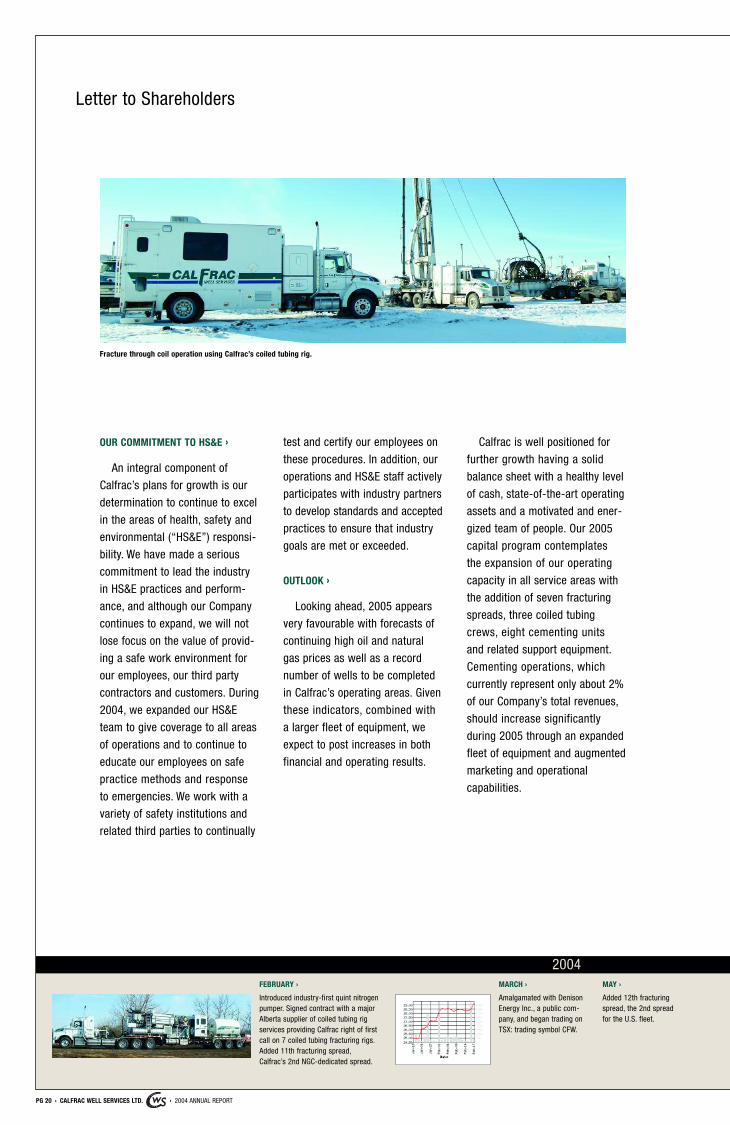
Fracture through coil operation using Calfrac’s coiled tubing rig.
2005SPRING ›
11 conventional fracturingspreads, 4 NGC spreads, 3deep and 8 shallow coiledtubing units and 9 cement-ing units in Canada as wellas 2 conventional fracturingspreads in the UnitedStates.
CALFRAC WELL SERVICES LTD. › 2004 ANNUAL REPORT › PG 21
We are also fortunate to
have a Board of Directors that
understands the importance of
responsible corporate governance.
Our Board has had a majority of
independent directors since we
became a public company and
they bring a wealth of knowledge
and experience to Calfrac. Our
directors also help set the right
“tone at the top” – one that
emphasizes the importance of
early identification of issues,
open and honest communication
and, perhaps most importantly,
integrity – they serve as excellent
role models for the Calfrac
management team.
We look to the year ahead with
confidence and strength. Our goal
is to continue building shareholder
value by serving our customers
well, meeting our financial targets
and aggressively pursuing growth
opportunities. We should achieve
this goal by maintaining our focus
on the customer, and we will
strive to deliver on our commit-
ments to our customers, our
shareholders, our communities
and each other.
In this our Company’s inaugural
Annual Report, we have attempted
to outline the fundamentals of our
business. However, in order to
learn more about Calfrac and to
meet our management and Board,
we cordially invite you to attend
our Annual Meeting of Shareholders
to be held at 3:30 p.m. on May 12,
2005 at Calgary’s Fairmont
Palliser Hotel.
On behalf of the Board of
Directors,
RONALD P. MATHISONChairman
DOUGLAS R. RAMSAYPresident & Chief Executive Officer
March 18, 2005Calgary, Alberta
Looking ahead, 2005 appears veryfavourable with forecasts of continuinghigh oil and natural gas prices as wellas a RECORD NUMBER OF WELLS to be completed in Calfrac’s operating areas.
ACKNOWLEDGEMENTS ›
A strong business and operating
plan is important and execution of
that plan is vital. Our people con-
tinue to perform and raise the
standards by which we measure
success. The environment and the
changes we have made in our
business over the past five years
have been challenging for our
people. They have been asked to
learn new skills, adopt a culture
of rapid growth and change and
operate in a constrained cost
environment – all at the same
time. Our employees have
responded magnificently, and for
that effort, they have our deepest
appreciation and respect.
We would like to acknowledge
our customers, many of whom
we have worked with since our
Company’s inception. We appreci-
ate your confidence and reliance
on us and we continue to main-
tain that we work for the best in
the industry. We look forward to
enhancing our highly valued
relationships through ongoing
communication and collaboration
as we strive to continuously add
value to our products and services.
SEPTEMBER ›
Added 13th fracturingspread.
NOVEMBER ›
Added 14th fracturingspread.
JUNE ›
Acquired Ram CementersInc., thereby addingcementing to Calfrac’s suiteof services.
PG 22 › CALFRAC WELL SERVICES LTD. › 2004 ANNUAL REPORT
Operations Review
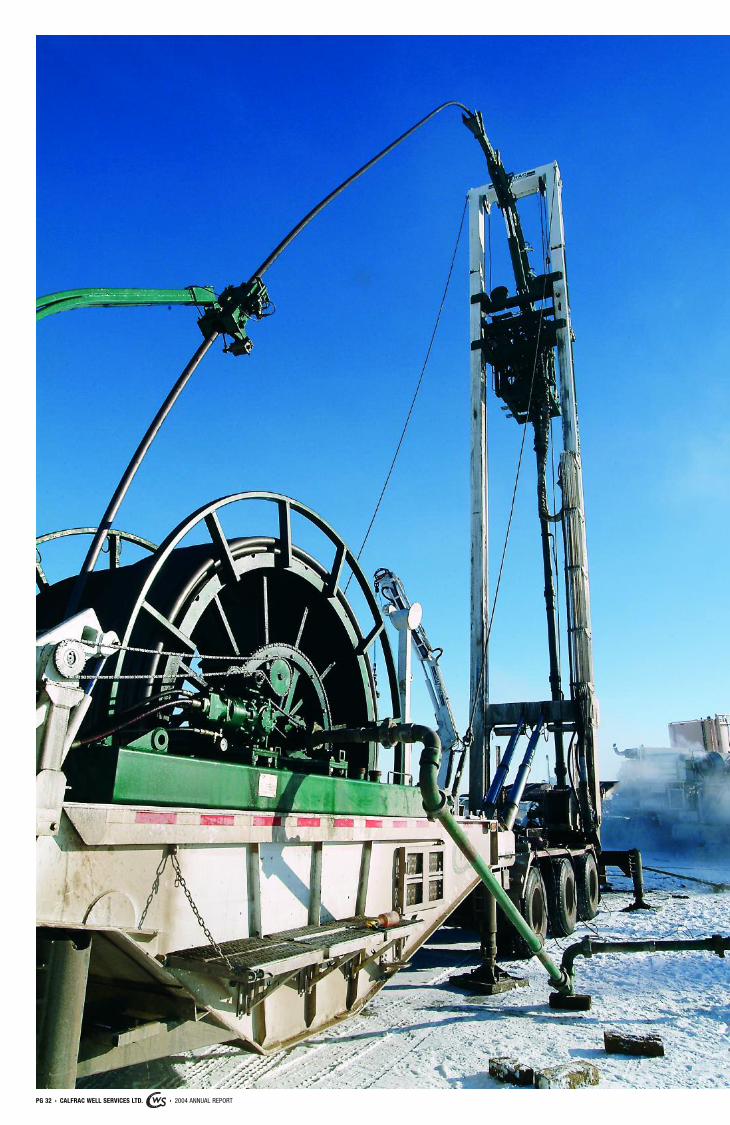
Calfrac provides specialized oil-
field services, including fracturing,
coiled tubing, cementing and well
stimulation services, which are
designed to increase the produc-
tion of hydrocarbons from wells
drilled throughout Western Canada
and the Rocky Mountain region of
the United States. During 2004 in
Canada, the Company provided
its full suite of services utilizing
10 conventional fracturing and
2 natural gas from coal spreads,
3 deep and 8 shallow coiled tub-
ing units and 4 cementing units,
while in the U.S. it provided well
fracturing services utilizing 2
conventional fracturing spreads.
HYDRAULIC FRACTURING ›
The principal focus of Calfrac’s
business is to provide hydraulic
fracturing services to exploration
and production companies. The
objective of hydraulic fracturing is
to increase the conductivity of an
oil or gas zone to the wellbore,
thereby increasing the flow of
hydrocarbons and allowing a
greater proportion of hydrocar-
bons to be extracted or produced
from that zone. The Company
offers both conventional hydraulic
fracturing and hydraulic fracturing
to produce natural gas found in
coal (“NGC”), which is often
referred to as coalbed methane.
Conventional HydraulicFracturing
Conventional hydraulic fractur-
ing is accomplished by pumping
a viscous fluid with suspended
“proppant” (grains of quartz sand
or ceramic material) through the
wellbore and into the reservoir
zone being stimulated. The pump-
ing pressure causes the zone to
fracture and accept the fluid and
proppant. The fluid is designed
to subsequently break or lose
viscosity and be driven out of the
reservoir zone by its pressure,
leaving the proppant suspended
in the fractures.
With a COMPREHENSIVE FLEET of specialtydesigned fracturing, well servicing andcementing units, Calfrac is able torespond quickly to customer demandand new opportunities by mobilizingequipment and personnel to geographicregions as required with minimal timeand cost.
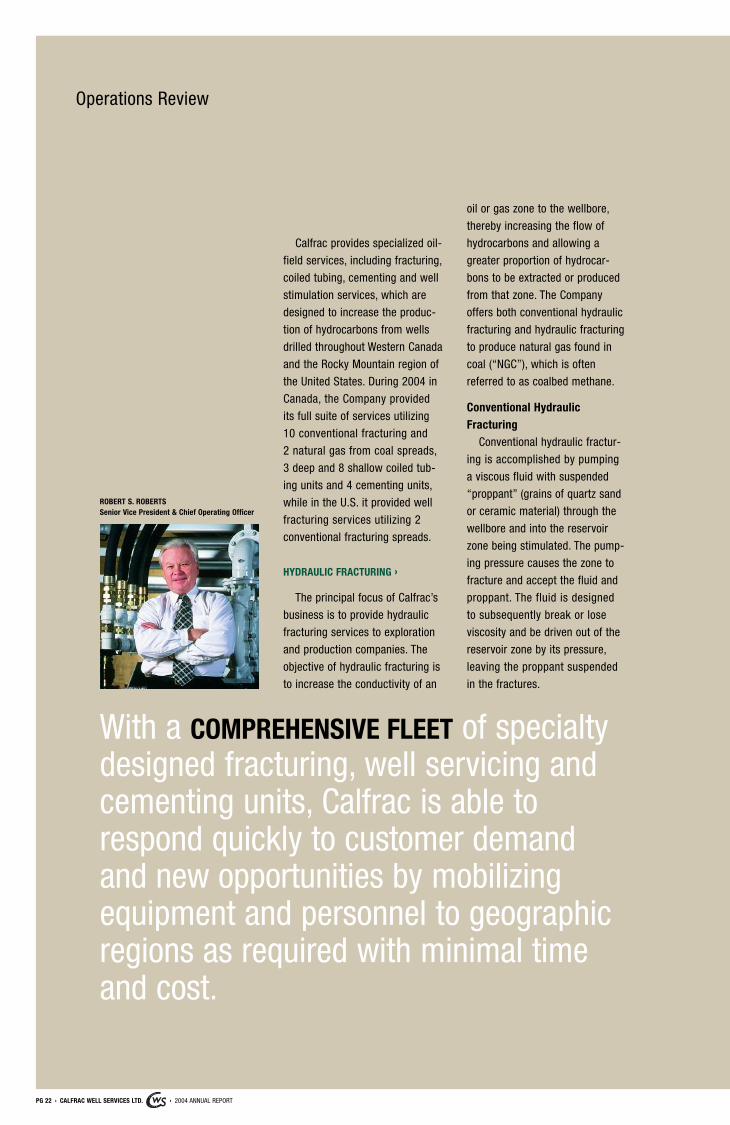
ROBERT S. ROBERTSSenior Vice President & Chief Operating Officer
CALFRAC WELL SERVICES LTD. › 2004 ANNUAL REPORT › PG 23
PG 24 › CALFRAC WELL SERVICES LTD. › 2004 ANNUAL REPORT
Operations Review
NGC FracturingCalfrac has developed a high
level of expertise and experience
in fracturing NGC wells and has
become a leading provider of
hydraulic fracturing services to
customers who stimulate NGC
wells. NGC has significant poten-
tial as an energy source and has
resulted in additional demand for
the Company’s fracturing services.
STIMULATION AND OTHER
WELL SERVICES ›
Coiled TubingCalfrac injects coiled tubing
into wells to perform various well
servicing operations. Coiled tubing
units are often used together with
the appropriate support equipment
to pump nitrogen, acid or air in
order to remove unwanted corro-
sive acids, solids, gels and fluids
from the wellbore and producing
zone. Coiled tubing units can also
be used to set and remove tools,
perform well abandonments and
set siphon or velocity strings,
which promote the production of
natural gas without the accumula-
tion of fluid in the wellbore.
Acidizing ServicesAcidizing involves pumping
varying volumes of specially
formulated acid blends into pro-
ducing oil or gas formations to
remove unwanted materials and
sediments or to dissolve portions
of the producing formation in
order to enhance the production
of hydrocarbons or the disposal
of waste fluids.
Carbon Dioxide ServicesCarbon dioxide is used as an
energizer in the fracturing fluid to
enhance well clean up and as a
base fluid for fracturing. Its unique
physical properties allow it to be
pumped using conventional high
pressure pumps and transported
easily as a liquid.
Nitrogen ServicesNitrogen is added to acid
blends and fracturing fluids to
provide additional energy to assist
in well clean up or to enhance the
well flow rate. Nitrogen is also
used for removing fluids from
wellbores, purging vessels and
pressure testing operations.
Nitrogen services are used pri-
marily in applications supporting
Calfrac's coiled tubing and frac-
turing services. Nitrogen is often
pumped into the wellbore to
safely improve the recovery of
introduced or produced fluids,
while reducing the potential for
damaging the formation. The
newest application is the use of
nitrogen pumped at high rates to
stimulate methane production
from dry coalbeds.
Cementing ServicesDuring 2004, Calfrac expanded
its suite of services to include
cementing through its ownership
in Ram Cementers Inc., which is
located in Lacombe, Alberta. When
a well is drilled, cementing is done
to seal well casing in place.
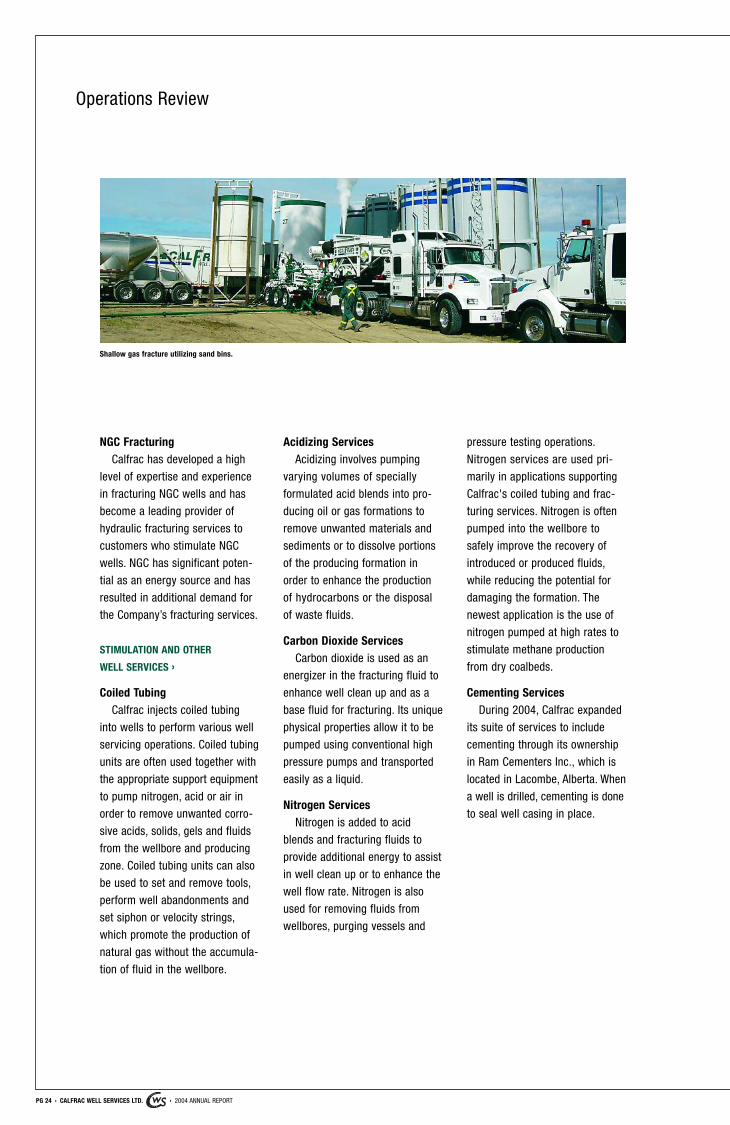
Shallow gas fracture utilizing sand bins.
CALFRAC WELL SERVICES LTD. › 2004 ANNUAL REPORT › PG 25
NEW EQUIPMENT ROLLOUT ›
In 2004, Calfrac put into service
four new fracturing spreads (three
in Canada, one in the U.S.) with
an additional capital commitment
to manufacture another three
spreads that will be rolled out in
the spring of 2005.
Also during 2004, the Company
entered into a three-year agree-
ment with a supplier of coiled
tubing fracturing rigs whereby
Calfrac has the right of first call
on seven of this supplier’s coiled
tubing rigs to be utilized in frac-
turing through coil applications.
Subsequent to year-end, the
Company signed an agreement
to increase this number to 12
coiled tubing fracturing rigs. The
Company anticipates expanding
its presence in this market seg-
ment throughout 2005 and
beyond.
In addition to the new fractur-
ing fleets, during 2004 Calfrac
assisted in the development of
several innovative pieces of
equipment that proved to be very
successful in adding new technol-
ogy and streamlining operations.
Combination Blender/PumperThe Combination Blender/
Pumper was developed primarily
to perform sand fracturing in
Alberta’s southeastern shallow
gas wells. This unique unit
replaces what would traditionally
take four individual units, thereby
leaving a smaller wellsite foot-
print, requiring fewer operators
and lowering capital costs.
Calfrac currently operates three
Combination Blender/Pumpers.
Quintiplex Nitrogen PumperThis specialized nitrogen
pumper was developed to pump
nitrogen at the high rates and
pressures required to stimulate
Alberta’s Horseshoe Canyon coal
formation. This unit pumps more
than twice the rate of a conven-
tional triplex nitrogen pump,
thereby utilizing only two or
three units versus the five units
required previously. The Company
currently operates four Quintiplex
Nitrogen Pumpers with five addi-
tional units to be put into service
during 2005.
Hydration UnitCalfrac’s unique Hydration Unit
couples a high shear slipstream
with 16 cubic metre resident
tanks. Using proprietary technology,
the unit is capable of hydrating
fracturing gels at the high rates
required throughout the United
States Rocky Mountain region.
The unit’s unique suction pump-
ing system reduces total fluid
volumes required on location.
Blend VanThe Blend Van combines four
traditional units (blender, chemical
unit, hydration unit and data van)
into one unit to reduce location
equipment and personnel require-
ments. This unique unit can
transport multiple treatment
systems, thereby allowing for
various treatments in a single day.
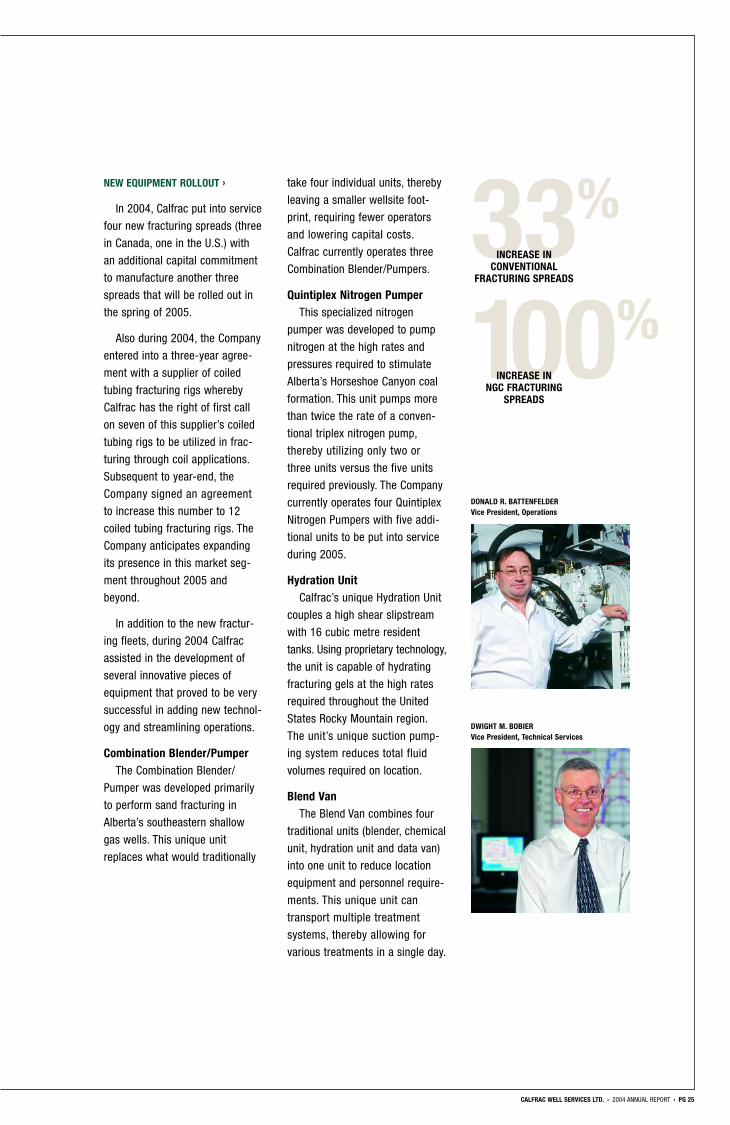
DONALD R. BATTENFELDERVice President, Operations
DWIGHT M. BOBIERVice President, Technical Services
33%INCREASE IN
CONVENTIONAL FRACTURING SPREADS
100%INCREASE IN
NGC FRACTURING SPREADS
PG 26 › CALFRAC WELL SERVICES LTD. › 2004 ANNUAL REPORT
Operations Review
FACILITIES ›
The Company currently main-
tains over 75,000 square feet of
dedicated facilities space in its
five operating base locations in
Medicine Hat, Red Deer, Grande
Prairie and Strathmore, Alberta
as well as Platteville, Colorado.
During 2004, Calfrac expanded
its facilities by 21,000 square feet
in order to meet the Company’s
growing operations and needs of
its customers.
Grande PrairieA state-of-the-art 8,500
square foot chemical warehouse
was erected in the Grande Prairie,
Alberta district on Company-
owned property in September
2004. This warehouse meets all
regulatory requirements for a
chemical storage facility and
provides important containment
environmental protection. A new
24,000 square foot shop facility
will be built on this same site in
2005.
Medicine HatThe Company’s Medicine Hat,
Alberta shop and office expansions
were completed in January 2004,
bringing these facilities to a total
of 22,000 square feet.
StrathmoreIn January 2004, an 8,000
square foot satellite shop was
established near Strathmore,
Alberta to provide the Company
with additional maintenance space
and chemical storage capabilities
for this operating area.
EQUIPMENT ›
The vast majority of Calfrac’s
fleet of equipment is no more
than five years old. In general, the
fleet is in good operating condi-
tion, but has been subject to high
utilization with very little down-
time. Consequently, the Company
has acquired spare equipment
that will arrive in the spring of
2005 in order to undertake major
servicing of its existing units in
a planned and orderly manner.
STEPHEN T. DADGEVice President, Corporate Services
JOHN L. GRISDALEVice President, Business Development
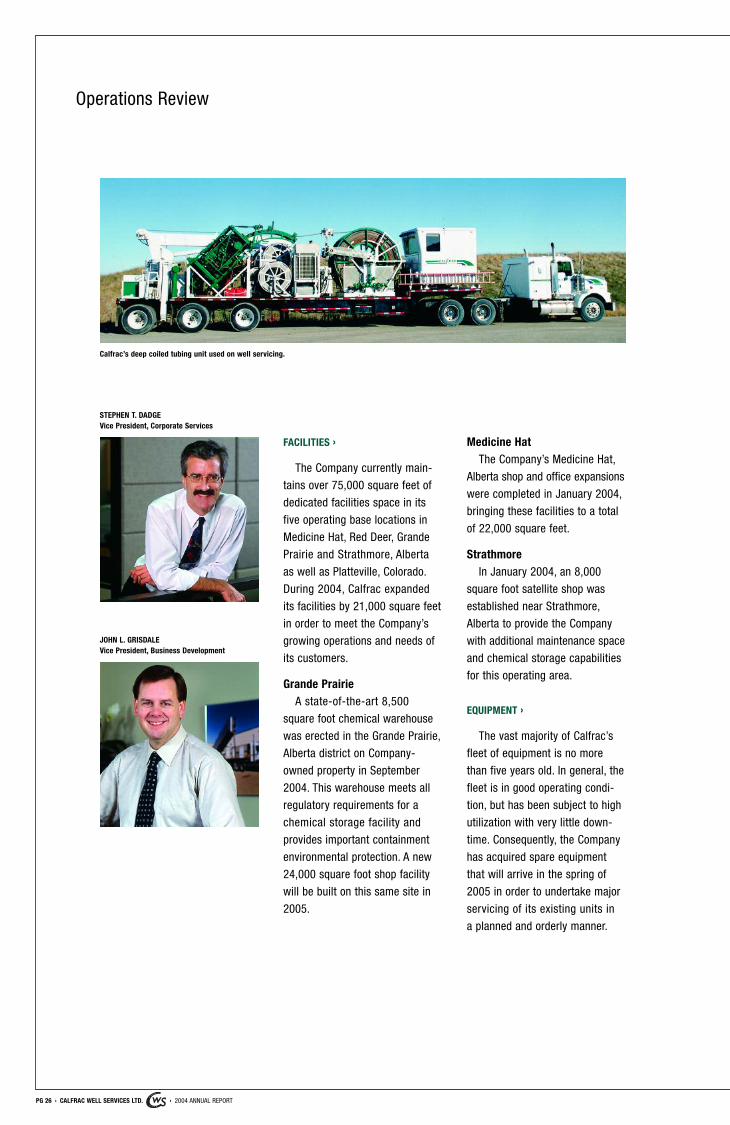
Calfrac’s deep coiled tubing unit used on well servicing.
CALFRAC WELL SERVICES LTD. › 2004 ANNUAL REPORT › PG 27
Recently, manufacturers of
Calfrac’s equipment have had dif-
ficulty in meeting the Company’s
deadlines for constructing units
due to high demand for this
equipment. Calfrac has been
proactive and met with its manu-
facturers and other third party
suppliers to address the situation.
Plans have been put in place to
mitigate future delays.
PRODUCT ›
One of the critical elements
for delivering pressure pumping
services is the supply of product,
primarily nitrogen, carbon dioxide
and proppant. During 2004, Calfrac
established security of supply for
each of these critical products.
NitrogenNitrogen is the key product
used in NGC applications. With the
Company doubling the size of its
NGC fleet to four spreads, it was
important that a supply of this
commodity be secure. Calfrac
entered a three-year agreement
with a major Western Canadian
nitrogen supplier that commenced
February 1, 2005 and guarantees
Calfrac 100% of the nitrogen pro-
duced at its Strathmore, Alberta
plant. Calfrac has the option, with
assistance from this supplier, to
sell surplus volumes on the
spot market.
Calfrac also has a nitrogen
bulk supply agreement with this
supplier relating to its Joffre,
Alberta plant and any additional
nitrogen plants. The contract runs
from October 1, 2004 to February
1, 2008 and provides that the
supplier will ensure that a portion
of the initial volume is available to
Calfrac and does not market into
that volume. Calfrac then makes
quarterly nominations that may
be more or less than the initial
nomination. If Calfrac nominates
a higher volume, the supplier
must endeavor to meet those
nominations but can decline them
if the volumes are unreasonable
or unavailable. The base price for
nitrogen is constant for the term
of the contract other than an
escalation clause based primarily
on the cost of power.
Carbon DioxideCalfrac has a carbon dioxide
bulk supply agreement with its
nitrogen supplier relating to their
Elmworth, Rimbey and Empress,
Alberta plants. This contract, with
the same contractual life as the
Joffre plant nitrogen agreement,
provides that Calfrac will divide
its overall nomination between the
three plants as its requirements
dictate. Included in this agree-
ment is dedicated storage at the
Elmworth and Rimbey plants as
well as a dedicated tank in
Calfrac’s Medicine Hat facility pro-
vided at no cost to the Company.
ProppantWhile Calfrac does not have
formal agreements in place relat-
ing to the supply of proppant,
it has developed and maintains
long-term relationships with
several of the industry’s leading
North American proppant suppli-
ers. As a result, the Company did
not experience any proppant
supply issues in 2004 nor does
it anticipate any supply issues in
2005.
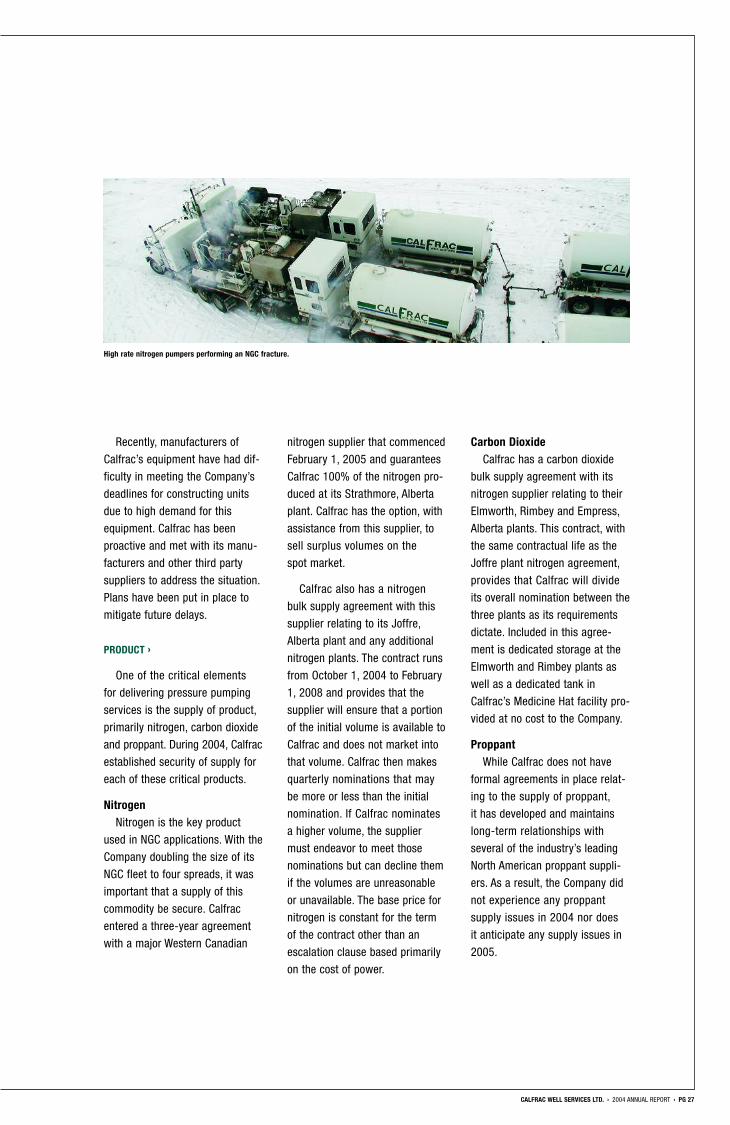
High rate nitrogen pumpers performing an NGC fracture.
PG 28 › CALFRAC WELL SERVICES LTD. › 2004 ANNUAL REPORT
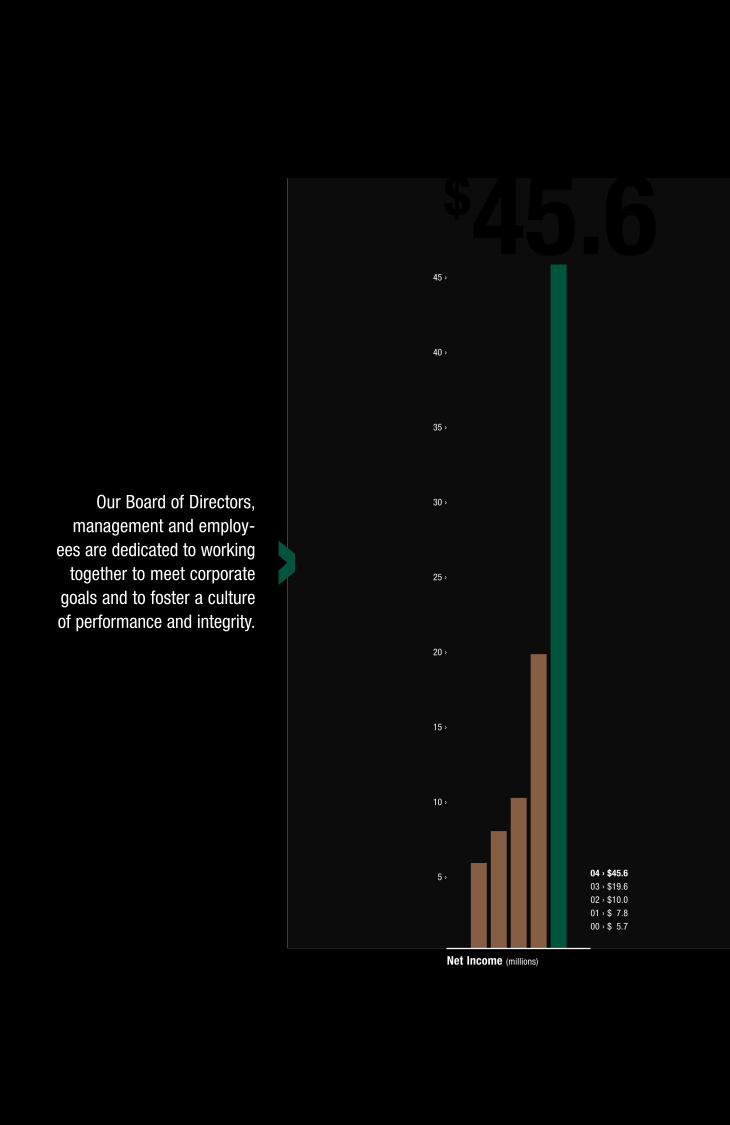
Our Board of Directors,management and employ-
ees are dedicated to workingtogether to meet corporate
goals and to foster a cultureof performance and integrity.
Net Income (millions)
04 › $45.603 › $19.602 › $10.001 › $07.800 › $05.7
$45.645 ›
40 ›
35 ›
30 ›
25 ›
20 ›
15 ›
10 ›
5 ›
›
Our Board of Directors and manage-ment are committed to a high standardof corporate governance. We believeeffective corporate governance calls for the establishment of processes andstructures that contribute to the sounddirection and management of ourCompany’s business, with a view toENHANCING SHAREHOLDER VALUE.
CALFRAC WELL SERVICES LTD. › 2004 ANNUAL REPORT › PG 29
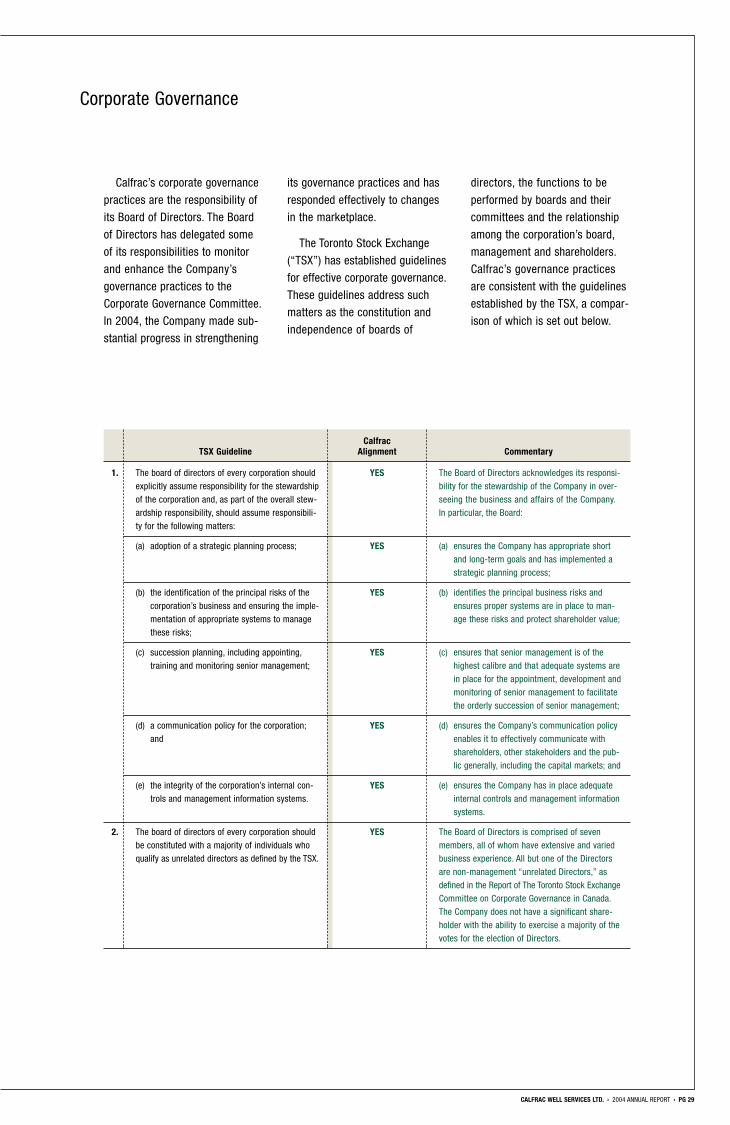
Corporate Governance
Calfrac’s corporate governance
practices are the responsibility of
its Board of Directors. The Board
of Directors has delegated some
of its responsibilities to monitor
and enhance the Company’s
governance practices to the
Corporate Governance Committee.
In 2004, the Company made sub-
stantial progress in strengthening
its governance practices and has
responded effectively to changes
in the marketplace.
The Toronto Stock Exchange
(“TSX”) has established guidelines
for effective corporate governance.
These guidelines address such
matters as the constitution and
independence of boards of
directors, the functions to be
performed by boards and their
committees and the relationship
among the corporation’s board,
management and shareholders.
Calfrac’s governance practices
are consistent with the guidelines
established by the TSX, a compar-
ison of which is set out below.
1. The board of directors of every corporation shouldexplicitly assume responsibility for the stewardshipof the corporation and, as part of the overall stew-ardship responsibility, should assume responsibili-ty for the following matters:
YES The Board of Directors acknowledges its responsi-bility for the stewardship of the Company in over-seeing the business and affairs of the Company.In particular, the Board:
(a) adoption of a strategic planning process; YES (a) ensures the Company has appropriate shortand long-term goals and has implemented astrategic planning process;
(b) the identification of the principal risks of thecorporation’s business and ensuring the imple-mentation of appropriate systems to managethese risks;
YES (b) identifies the principal business risks andensures proper systems are in place to man-age these risks and protect shareholder value;
(c) succession planning, including appointing,training and monitoring senior management;
YES (c) ensures that senior management is of thehighest calibre and that adequate systems arein place for the appointment, development andmonitoring of senior management to facilitatethe orderly succession of senior management;
(d) a communication policy for the corporation;and
YES (d) ensures the Company’s communication policyenables it to effectively communicate withshareholders, other stakeholders and the pub-lic generally, including the capital markets; and
(e) the integrity of the corporation’s internal con-trols and management information systems.
YES (e) ensures the Company has in place adequateinternal controls and management informationsystems.
CalfracTSX Guideline Alignment Commentary
2. The board of directors of every corporation shouldbe constituted with a majority of individuals whoqualify as unrelated directors as defined by the TSX.
YES The Board of Directors is comprised of sevenmembers, all of whom have extensive and variedbusiness experience. All but one of the Directorsare non-management “unrelated Directors,” asdefined in the Report of The Toronto Stock ExchangeCommittee on Corporate Governance in Canada.The Company does not have a significant share-holder with the ability to exercise a majority of thevotes for the election of Directors.
PG 30 › CALFRAC WELL SERVICES LTD. › 2004 ANNUAL REPORT
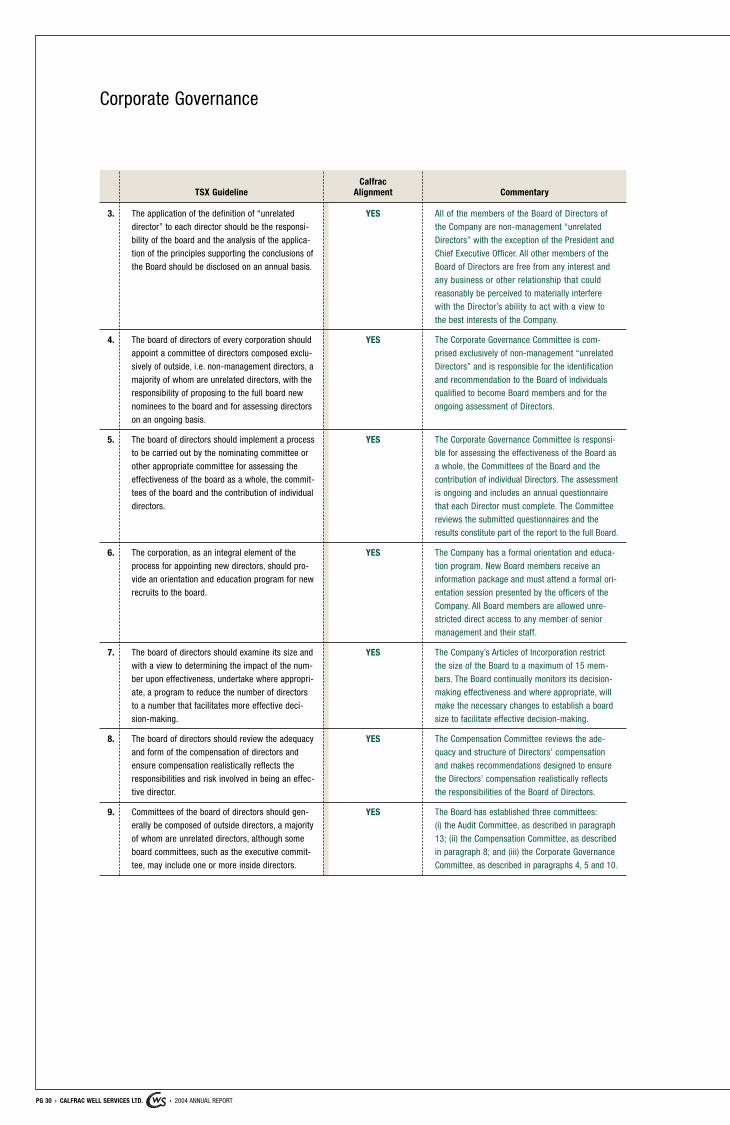
3. The application of the definition of “unrelateddirector” to each director should be the responsi-bility of the board and the analysis of the applica-tion of the principles supporting the conclusions ofthe Board should be disclosed on an annual basis.
YES All of the members of the Board of Directors ofthe Company are non-management “unrelatedDirectors” with the exception of the President andChief Executive Officer. All other members of theBoard of Directors are free from any interest andany business or other relationship that could reasonably be perceived to materially interferewith the Director’s ability to act with a view tothe best interests of the Company.
4. The board of directors of every corporation shouldappoint a committee of directors composed exclu-sively of outside, i.e. non-management directors, amajority of whom are unrelated directors, with theresponsibility of proposing to the full board newnominees to the board and for assessing directorson an ongoing basis.
YES The Corporate Governance Committee is com-prised exclusively of non-management “unrelatedDirectors” and is responsible for the identificationand recommendation to the Board of individualsqualified to become Board members and for theongoing assessment of Directors.
5. The board of directors should implement a processto be carried out by the nominating committee orother appropriate committee for assessing theeffectiveness of the board as a whole, the commit-tees of the board and the contribution of individualdirectors.
YES The Corporate Governance Committee is responsi-ble for assessing the effectiveness of the Board asa whole, the Committees of the Board and thecontribution of individual Directors. The assessmentis ongoing and includes an annual questionnairethat each Director must complete. The Committeereviews the submitted questionnaires and theresults constitute part of the report to the full Board.
6. The corporation, as an integral element of theprocess for appointing new directors, should pro-vide an orientation and education program for newrecruits to the board.
YES The Company has a formal orientation and educa-tion program. New Board members receive aninformation package and must attend a formal ori-entation session presented by the officers of theCompany. All Board members are allowed unre-stricted direct access to any member of seniormanagement and their staff.
7. The board of directors should examine its size andwith a view to determining the impact of the num-ber upon effectiveness, undertake where appropri-ate, a program to reduce the number of directorsto a number that facilitates more effective deci-sion-making.
YES The Company’s Articles of Incorporation restrictthe size of the Board to a maximum of 15 mem-bers. The Board continually monitors its decision-making effectiveness and where appropriate, willmake the necessary changes to establish a boardsize to facilitate effective decision-making.
8. The board of directors should review the adequacyand form of the compensation of directors andensure compensation realistically reflects theresponsibilities and risk involved in being an effec-tive director.
YES The Compensation Committee reviews the ade-quacy and structure of Directors’ compensationand makes recommendations designed to ensurethe Directors’ compensation realistically reflectsthe responsibilities of the Board of Directors.
CalfracTSX Guideline Alignment Commentary
Corporate Governance
9. Committees of the board of directors should gen-erally be composed of outside directors, a majorityof whom are unrelated directors, although someboard committees, such as the executive commit-tee, may include one or more inside directors.
YES The Board has established three committees:(i) the Audit Committee, as described in paragraph13; (ii) the Compensation Committee, as describedin paragraph 8; and (iii) the Corporate GovernanceCommittee, as described in paragraphs 4, 5 and 10.
CALFRAC WELL SERVICES LTD. › 2004 ANNUAL REPORT › PG 31
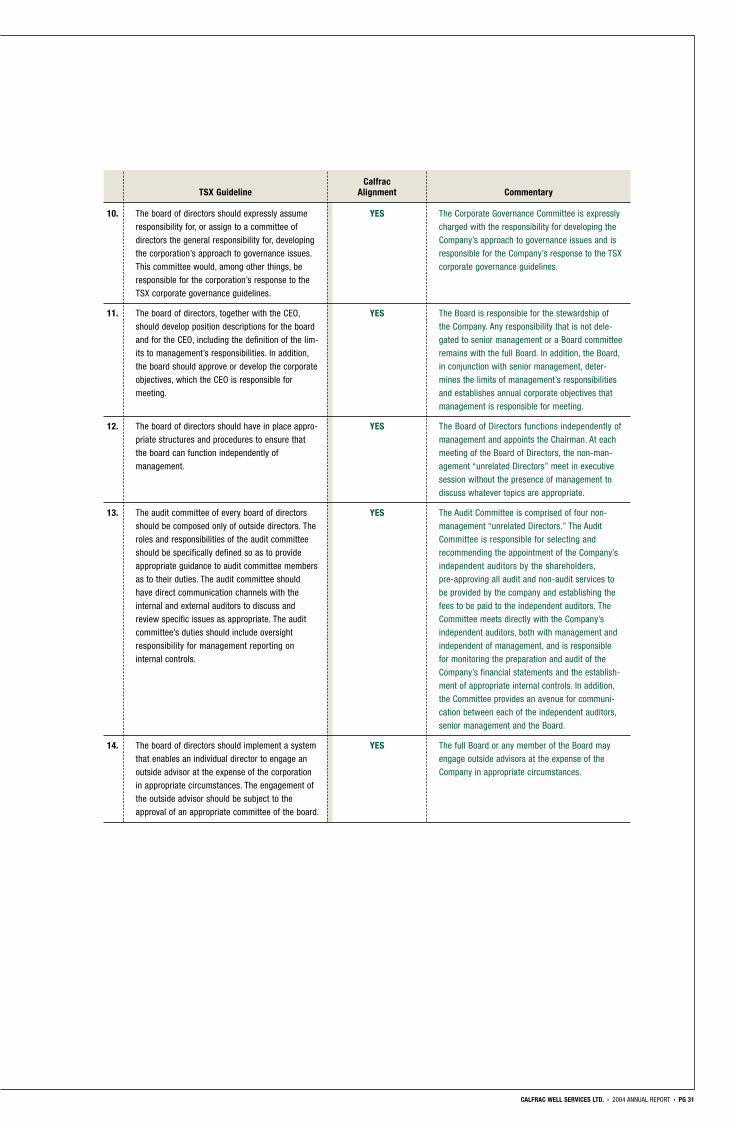
11. The board of directors, together with the CEO,should develop position descriptions for the boardand for the CEO, including the definition of the lim-its to management’s responsibilities. In addition,the board should approve or develop the corporateobjectives, which the CEO is responsible for meeting.
YES The Board is responsible for the stewardship ofthe Company. Any responsibility that is not dele-gated to senior management or a Board committeeremains with the full Board. In addition, the Board,in conjunction with senior management, deter-mines the limits of management’s responsibilitiesand establishes annual corporate objectives thatmanagement is responsible for meeting.
12. The board of directors should have in place appro-priate structures and procedures to ensure thatthe board can function independently of management.
YES The Board of Directors functions independently ofmanagement and appoints the Chairman. At eachmeeting of the Board of Directors, the non-man-agement “unrelated Directors” meet in executivesession without the presence of management todiscuss whatever topics are appropriate.
13. The audit committee of every board of directorsshould be composed only of outside directors. Theroles and responsibilities of the audit committeeshould be specifically defined so as to provideappropriate guidance to audit committee membersas to their duties. The audit committee shouldhave direct communication channels with theinternal and external auditors to discuss andreview specific issues as appropriate. The auditcommittee’s duties should include oversightresponsibility for management reporting on internal controls.
YES The Audit Committee is comprised of four non-management “unrelated Directors.” The AuditCommittee is responsible for selecting and recommending the appointment of the Company’sindependent auditors by the shareholders,pre-approving all audit and non-audit services tobe provided by the company and establishing thefees to be paid to the independent auditors. TheCommittee meets directly with the Company’sindependent auditors, both with management andindependent of management, and is responsiblefor monitoring the preparation and audit of theCompany’s financial statements and the establish-ment of appropriate internal controls. In addition,the Committee provides an avenue for communi-cation between each of the independent auditors,senior management and the Board.
14. The board of directors should implement a systemthat enables an individual director to engage anoutside advisor at the expense of the corporationin appropriate circumstances. The engagement ofthe outside advisor should be subject to theapproval of an appropriate committee of the board.
YES The full Board or any member of the Board mayengage outside advisors at the expense of theCompany in appropriate circumstances.
CalfracTSX Guideline Alignment Commentary
10. The board of directors should expressly assumeresponsibility for, or assign to a committee ofdirectors the general responsibility for, developingthe corporation’s approach to governance issues.This committee would, among other things, beresponsible for the corporation’s response to theTSX corporate governance guidelines.
YES The Corporate Governance Committee is expresslycharged with the responsibility for developing theCompany’s approach to governance issues and isresponsible for the Company’s response to the TSXcorporate governance guidelines.
PG 32 › CALFRAC WELL SERVICES LTD. › 2004 ANNUAL REPORT
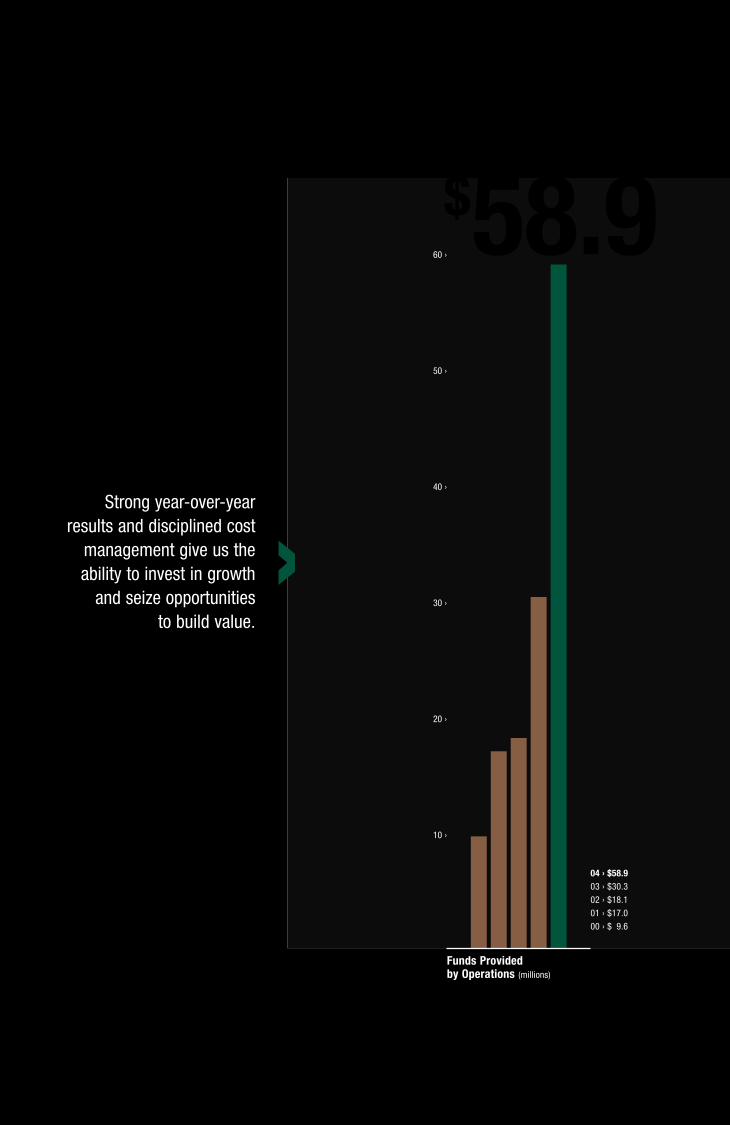
Strong year-over-yearresults and disciplined cost
management give us theability to invest in growth
and seize opportunities to build value.
Funds Providedby Operations (millions)
04 › $58.903 › $30.302 › $18.101 › $17.000 › $09.6
$58.960 ›
50 ›
40 ›
30 ›
20 ›
10 ›
›
Calfrac recorded impressive year-over-year growth in 2004 with significant increases in revenue, netincome and cash flow. Strong activitylevels and a larger fleet of equipmentoperating in both Canada and the UnitedStates attributed to our Company’sRECORD FINANCIAL PERFORMANCE.
CALFRAC WELL SERVICES LTD. › 2004 ANNUAL REPORT › PG 33
Management’s Discussion and Analysis
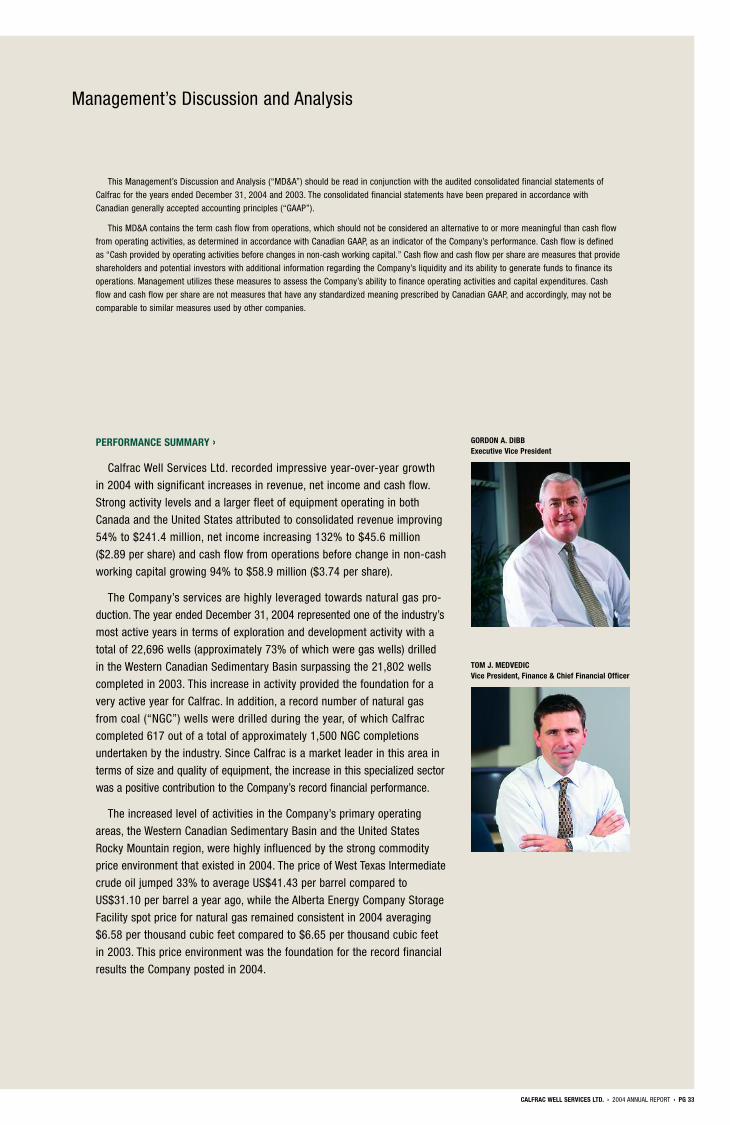
PERFORMANCE SUMMARY ›
Calfrac Well Services Ltd. recorded impressive year-over-year growth
in 2004 with significant increases in revenue, net income and cash flow.
Strong activity levels and a larger fleet of equipment operating in both
Canada and the United States attributed to consolidated revenue improving
54% to $241.4 million, net income increasing 132% to $45.6 million
($2.89 per share) and cash flow from operations before change in non-cash
working capital growing 94% to $58.9 million ($3.74 per share).
The Company’s services are highly leveraged towards natural gas pro-
duction. The year ended December 31, 2004 represented one of the industry’s
most active years in terms of exploration and development activity with a
total of 22,696 wells (approximately 73% of which were gas wells) drilled
in the Western Canadian Sedimentary Basin surpassing the 21,802 wells
completed in 2003. This increase in activity provided the foundation for a
very active year for Calfrac. In addition, a record number of natural gas
from coal (“NGC”) wells were drilled during the year, of which Calfrac
completed 617 out of a total of approximately 1,500 NGC completions
undertaken by the industry. Since Calfrac is a market leader in this area in
terms of size and quality of equipment, the increase in this specialized sector
was a positive contribution to the Company’s record financial performance.
The increased level of activities in the Company’s primary operating
areas, the Western Canadian Sedimentary Basin and the United States
Rocky Mountain region, were highly influenced by the strong commodity
price environment that existed in 2004. The price of West Texas Intermediate
crude oil jumped 33% to average US$41.43 per barrel compared to
US$31.10 per barrel a year ago, while the Alberta Energy Company Storage
Facility spot price for natural gas remained consistent in 2004 averaging
$6.58 per thousand cubic feet compared to $6.65 per thousand cubic feet
in 2003. This price environment was the foundation for the record financial
results the Company posted in 2004.
This Management’s Discussion and Analysis (“MD&A”) should be read in conjunction with the audited consolidated financial statements ofCalfrac for the years ended December 31, 2004 and 2003. The consolidated financial statements have been prepared in accordance withCanadian generally accepted accounting principles (“GAAP”).
This MD&A contains the term cash flow from operations, which should not be considered an alternative to or more meaningful than cash flowfrom operating activities, as determined in accordance with Canadian GAAP, as an indicator of the Company’s performance. Cash flow is definedas “Cash provided by operating activities before changes in non-cash working capital.” Cash flow and cash flow per share are measures that provideshareholders and potential investors with additional information regarding the Company’s liquidity and its ability to generate funds to finance itsoperations. Management utilizes these measures to assess the Company’s ability to finance operating activities and capital expenditures. Cashflow and cash flow per share are not measures that have any standardized meaning prescribed by Canadian GAAP, and accordingly, may not becomparable to similar measures used by other companies.
TOM J. MEDVEDICVice President, Finance & Chief Financial Officer
GORDON A. DIBBExecutive Vice President
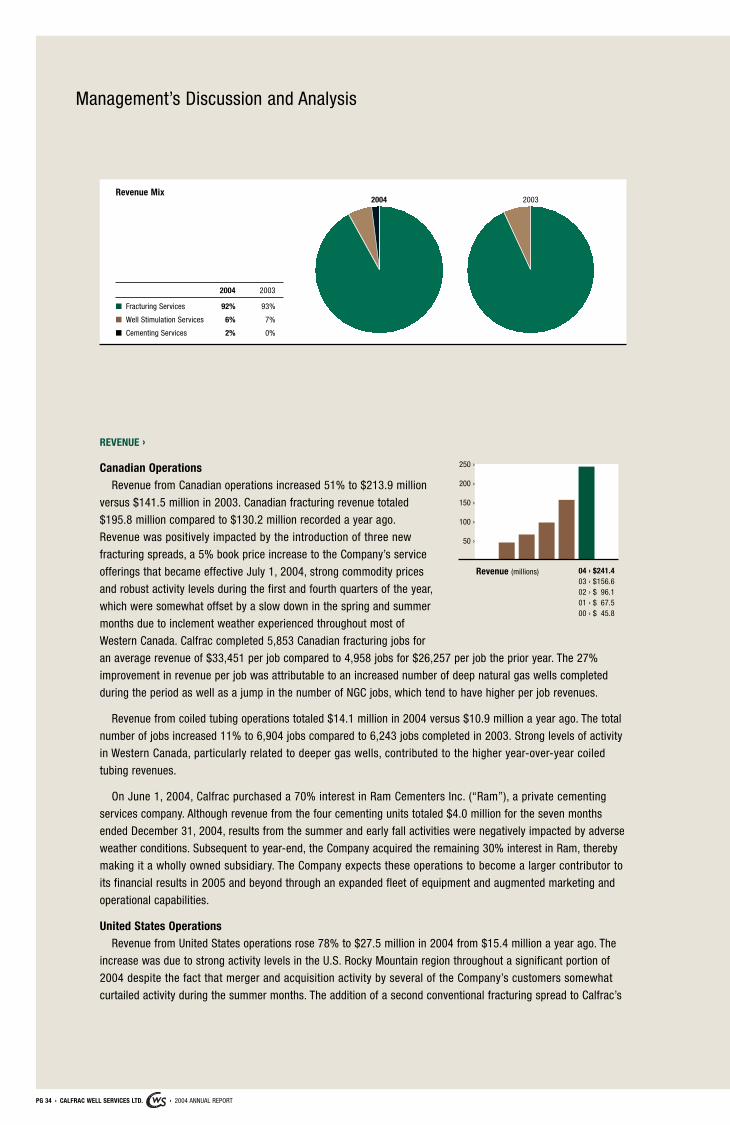
PG 34 › CALFRAC WELL SERVICES LTD. › 2004 ANNUAL REPORT
Revenue Mix20032004
2004 2003
n Fracturing Services 92% 93%
n Well Stimulation Services 6% 7%
n Cementing Services 2% 0%
Management’s Discussion and Analysis
REVENUE ›
Canadian OperationsRevenue from Canadian operations increased 51% to $213.9 million
versus $141.5 million in 2003. Canadian fracturing revenue totaled
$195.8 million compared to $130.2 million recorded a year ago.
Revenue was positively impacted by the introduction of three new
fracturing spreads, a 5% book price increase to the Company’s service
offerings that became effective July 1, 2004, strong commodity prices
and robust activity levels during the first and fourth quarters of the year,
which were somewhat offset by a slow down in the spring and summer
months due to inclement weather experienced throughout most of
Western Canada. Calfrac completed 5,853 Canadian fracturing jobs for
an average revenue of $33,451 per job compared to 4,958 jobs for $26,257 per job the prior year. The 27%
improvement in revenue per job was attributable to an increased number of deep natural gas wells completed
during the period as well as a jump in the number of NGC jobs, which tend to have higher per job revenues.
Revenue from coiled tubing operations totaled $14.1 million in 2004 versus $10.9 million a year ago. The total
number of jobs increased 11% to 6,904 jobs compared to 6,243 jobs completed in 2003. Strong levels of activity
in Western Canada, particularly related to deeper gas wells, contributed to the higher year-over-year coiled
tubing revenues.
On June 1, 2004, Calfrac purchased a 70% interest in Ram Cementers Inc. (“Ram”), a private cementing
services company. Although revenue from the four cementing units totaled $4.0 million for the seven months
ended December 31, 2004, results from the summer and early fall activities were negatively impacted by adverse
weather conditions. Subsequent to year-end, the Company acquired the remaining 30% interest in Ram, thereby
making it a wholly owned subsidiary. The Company expects these operations to become a larger contributor to
its financial results in 2005 and beyond through an expanded fleet of equipment and augmented marketing and
operational capabilities.
United States OperationsRevenue from United States operations rose 78% to $27.5 million in 2004 from $15.4 million a year ago. The
increase was due to strong activity levels in the U.S. Rocky Mountain region throughout a significant portion of
2004 despite the fact that merger and acquisition activity by several of the Company’s customers somewhat
curtailed activity during the summer months. The addition of a second conventional fracturing spread to Calfrac’s
Revenue (millions) 04 › $241.403 › $156.602 › $096.101 › $067.500 › $045.8
250 ›
200 ›
150 ›
100 ›
50 ›
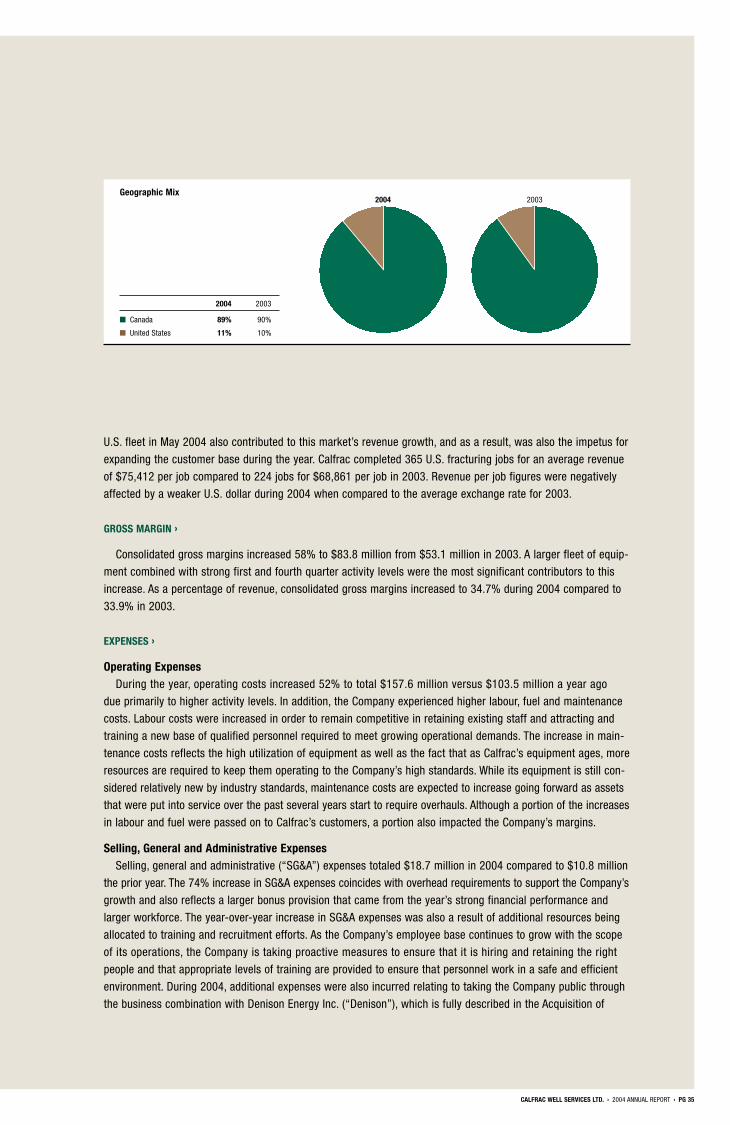
CALFRAC WELL SERVICES LTD. › 2004 ANNUAL REPORT › PG 35
Geographic Mix20032004
2004 2003
n Canada 89% 90%
n United States 11% 10%
U.S. fleet in May 2004 also contributed to this market’s revenue growth, and as a result, was also the impetus for
expanding the customer base during the year. Calfrac completed 365 U.S. fracturing jobs for an average revenue
of $75,412 per job compared to 224 jobs for $68,861 per job in 2003. Revenue per job figures were negatively
affected by a weaker U.S. dollar during 2004 when compared to the average exchange rate for 2003.
GROSS MARGIN ›
Consolidated gross margins increased 58% to $83.8 million from $53.1 million in 2003. A larger fleet of equip-
ment combined with strong first and fourth quarter activity levels were the most significant contributors to this
increase. As a percentage of revenue, consolidated gross margins increased to 34.7% during 2004 compared to
33.9% in 2003.
EXPENSES ›
Operating ExpensesDuring the year, operating costs increased 52% to total $157.6 million versus $103.5 million a year ago
due primarily to higher activity levels. In addition, the Company experienced higher labour, fuel and maintenance
costs. Labour costs were increased in order to remain competitive in retaining existing staff and attracting and
training a new base of qualified personnel required to meet growing operational demands. The increase in main-
tenance costs reflects the high utilization of equipment as well as the fact that as Calfrac’s equipment ages, more
resources are required to keep them operating to the Company’s high standards. While its equipment is still con-
sidered relatively new by industry standards, maintenance costs are expected to increase going forward as assets
that were put into service over the past several years start to require overhauls. Although a portion of the increases
in labour and fuel were passed on to Calfrac’s customers, a portion also impacted the Company’s margins.
Selling, General and Administrative ExpensesSelling, general and administrative (“SG&A”) expenses totaled $18.7 million in 2004 compared to $10.8 million
the prior year. The 74% increase in SG&A expenses coincides with overhead requirements to support the Company’s
growth and also reflects a larger bonus provision that came from the year’s strong financial performance and
larger workforce. The year-over-year increase in SG&A expenses was also a result of additional resources being
allocated to training and recruitment efforts. As the Company’s employee base continues to grow with the scope
of its operations, the Company is taking proactive measures to ensure that it is hiring and retaining the right
people and that appropriate levels of training are provided to ensure that personnel work in a safe and efficient
environment. During 2004, additional expenses were also incurred relating to taking the Company public through
the business combination with Denison Energy Inc. (“Denison”), which is fully described in the Acquisition of
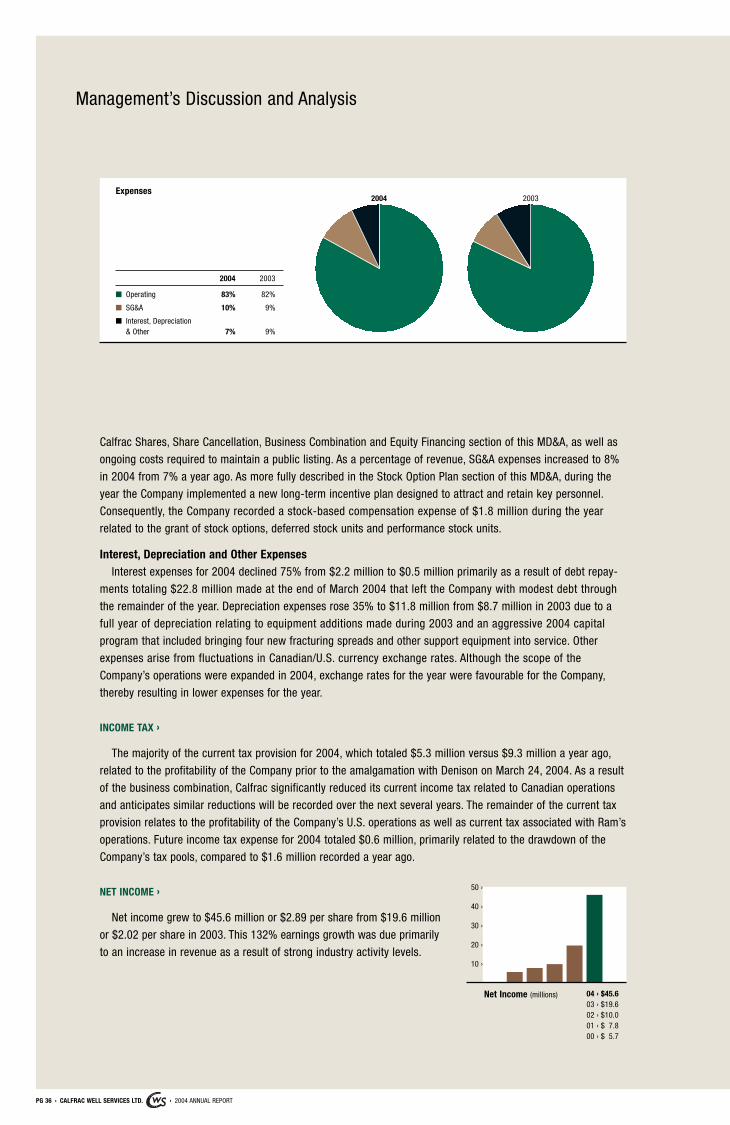
PG 36 › CALFRAC WELL SERVICES LTD. › 2004 ANNUAL REPORT
Management’s Discussion and Analysis
Calfrac Shares, Share Cancellation, Business Combination and Equity Financing section of this MD&A, as well as
ongoing costs required to maintain a public listing. As a percentage of revenue, SG&A expenses increased to 8%
in 2004 from 7% a year ago. As more fully described in the Stock Option Plan section of this MD&A, during the
year the Company implemented a new long-term incentive plan designed to attract and retain key personnel.
Consequently, the Company recorded a stock-based compensation expense of $1.8 million during the year
related to the grant of stock options, deferred stock units and performance stock units.
Interest, Depreciation and Other ExpensesInterest expenses for 2004 declined 75% from $2.2 million to $0.5 million primarily as a result of debt repay-
ments totaling $22.8 million made at the end of March 2004 that left the Company with modest debt through
the remainder of the year. Depreciation expenses rose 35% to $11.8 million from $8.7 million in 2003 due to a
full year of depreciation relating to equipment additions made during 2003 and an aggressive 2004 capital
program that included bringing four new fracturing spreads and other support equipment into service. Other
expenses arise from fluctuations in Canadian/U.S. currency exchange rates. Although the scope of the
Company’s operations were expanded in 2004, exchange rates for the year were favourable for the Company,
thereby resulting in lower expenses for the year.
INCOME TAX ›
The majority of the current tax provision for 2004, which totaled $5.3 million versus $9.3 million a year ago,
related to the profitability of the Company prior to the amalgamation with Denison on March 24, 2004. As a result
of the business combination, Calfrac significantly reduced its current income tax related to Canadian operations
and anticipates similar reductions will be recorded over the next several years. The remainder of the current tax
provision relates to the profitability of the Company’s U.S. operations as well as current tax associated with Ram’s
operations. Future income tax expense for 2004 totaled $0.6 million, primarily related to the drawdown of the
Company’s tax pools, compared to $1.6 million recorded a year ago.
NET INCOME ›
Net income grew to $45.6 million or $2.89 per share from $19.6 million
or $2.02 per share in 2003. This 132% earnings growth was due primarily
to an increase in revenue as a result of strong industry activity levels.
Expenses20032004
2004 2003
n Operating 83% 82%
n SG&A 10% 9%
n Interest, Depreciationn & Other 7% 9%
Net Income (millions) 04 › $45.603 › $19.602 › $10.001 › $07.800 › $05.7
50 ›
40 ›
30 ›
20 ›
10 ›
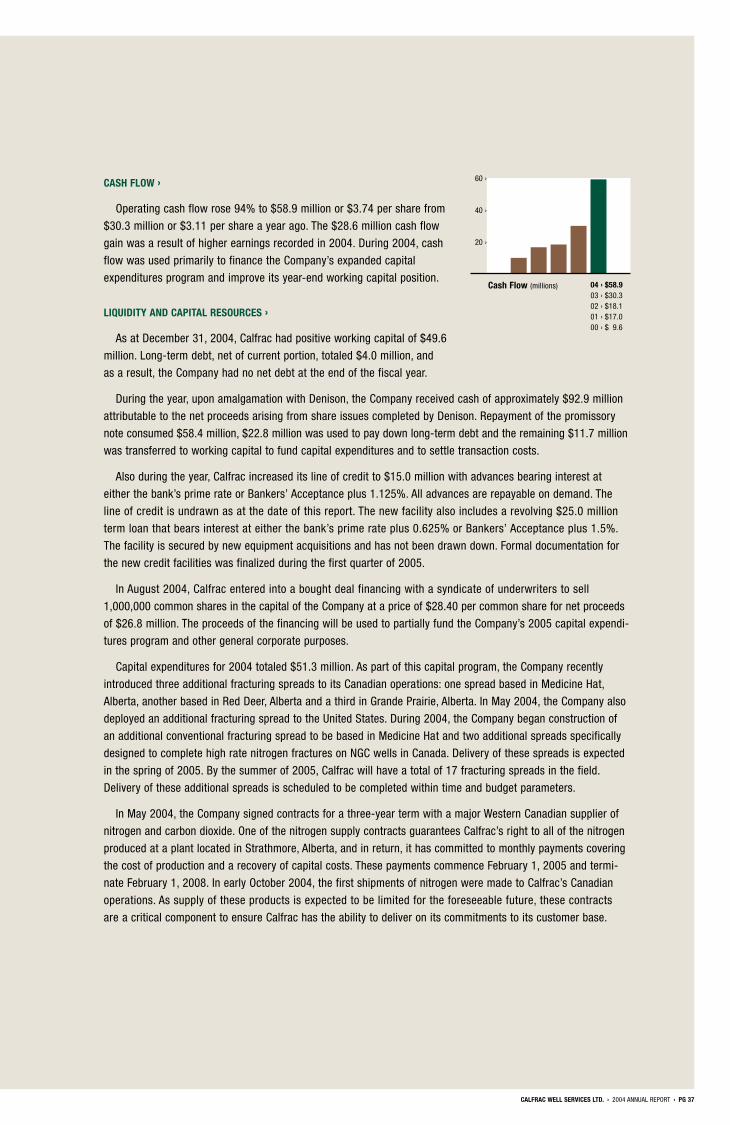
CALFRAC WELL SERVICES LTD. › 2004 ANNUAL REPORT › PG 37
CASH FLOW ›
Operating cash flow rose 94% to $58.9 million or $3.74 per share from
$30.3 million or $3.11 per share a year ago. The $28.6 million cash flow
gain was a result of higher earnings recorded in 2004. During 2004, cash
flow was used primarily to finance the Company’s expanded capital
expenditures program and improve its year-end working capital position.
LIQUIDITY AND CAPITAL RESOURCES ›
As at December 31, 2004, Calfrac had positive working capital of $49.6
million. Long-term debt, net of current portion, totaled $4.0 million, and
as a result, the Company had no net debt at the end of the fiscal year.
During the year, upon amalgamation with Denison, the Company received cash of approximately $92.9 million
attributable to the net proceeds arising from share issues completed by Denison. Repayment of the promissory
note consumed $58.4 million, $22.8 million was used to pay down long-term debt and the remaining $11.7 million
was transferred to working capital to fund capital expenditures and to settle transaction costs.
Also during the year, Calfrac increased its line of credit to $15.0 million with advances bearing interest at
either the bank’s prime rate or Bankers’ Acceptance plus 1.125%. All advances are repayable on demand. The
line of credit is undrawn as at the date of this report. The new facility also includes a revolving $25.0 million
term loan that bears interest at either the bank’s prime rate plus 0.625% or Bankers’ Acceptance plus 1.5%.
The facility is secured by new equipment acquisitions and has not been drawn down. Formal documentation for
the new credit facilities was finalized during the first quarter of 2005.
In August 2004, Calfrac entered into a bought deal financing with a syndicate of underwriters to sell
1,000,000 common shares in the capital of the Company at a price of $28.40 per common share for net proceeds
of $26.8 million. The proceeds of the financing will be used to partially fund the Company’s 2005 capital expendi-
tures program and other general corporate purposes.
Capital expenditures for 2004 totaled $51.3 million. As part of this capital program, the Company recently
introduced three additional fracturing spreads to its Canadian operations: one spread based in Medicine Hat,
Alberta, another based in Red Deer, Alberta and a third in Grande Prairie, Alberta. In May 2004, the Company also
deployed an additional fracturing spread to the United States. During 2004, the Company began construction of
an additional conventional fracturing spread to be based in Medicine Hat and two additional spreads specifically
designed to complete high rate nitrogen fractures on NGC wells in Canada. Delivery of these spreads is expected
in the spring of 2005. By the summer of 2005, Calfrac will have a total of 17 fracturing spreads in the field.
Delivery of these additional spreads is scheduled to be completed within time and budget parameters.
In May 2004, the Company signed contracts for a three-year term with a major Western Canadian supplier of
nitrogen and carbon dioxide. One of the nitrogen supply contracts guarantees Calfrac’s right to all of the nitrogen
produced at a plant located in Strathmore, Alberta, and in return, it has committed to monthly payments covering
the cost of production and a recovery of capital costs. These payments commence February 1, 2005 and termi-
nate February 1, 2008. In early October 2004, the first shipments of nitrogen were made to Calfrac’s Canadian
operations. As supply of these products is expected to be limited for the foreseeable future, these contracts
are a critical component to ensure Calfrac has the ability to deliver on its commitments to its customer base.
Cash Flow (millions) 04 › $58.903 › $30.302 › $18.101 › $17.000 › $09.6
60 ›
40 ›
20 ›
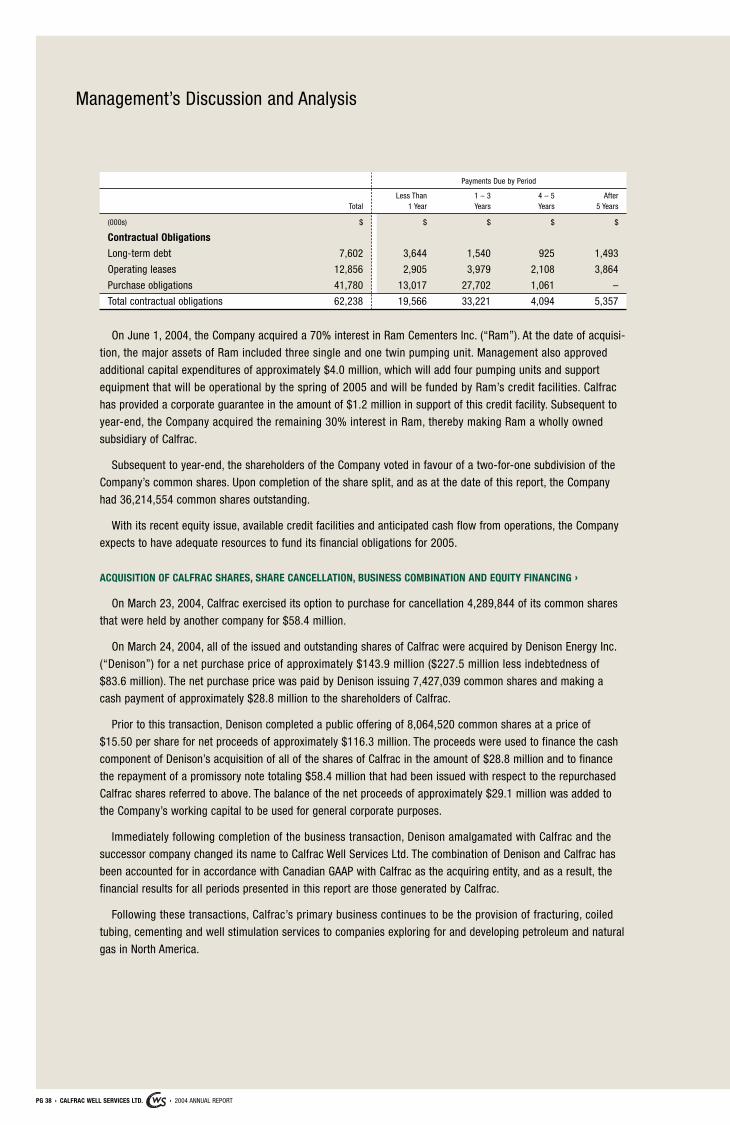
PG 38 › CALFRAC WELL SERVICES LTD. › 2004 ANNUAL REPORT
Payments Due by Period
Less Than 1 – 3 4 – 5 AfterTotal 1 Year Years Years 5 Years
(000s) $ $ $ $ $
Contractual Obligations
Long-term debt 7,602 3,644 1,540 925 1,493
Operating leases 12,856 2,905 3,979 2,108 3,864
Purchase obligations 41,780 13,017 27,702 1,061 –
Total contractual obligations 62,238 19,566 33,221 4,094 5,357
On June 1, 2004, the Company acquired a 70% interest in Ram Cementers Inc. (“Ram”). At the date of acquisi-
tion, the major assets of Ram included three single and one twin pumping unit. Management also approved
additional capital expenditures of approximately $4.0 million, which will add four pumping units and support
equipment that will be operational by the spring of 2005 and will be funded by Ram’s credit facilities. Calfrac
has provided a corporate guarantee in the amount of $1.2 million in support of this credit facility. Subsequent to
year-end, the Company acquired the remaining 30% interest in Ram, thereby making Ram a wholly owned
subsidiary of Calfrac.
Subsequent to year-end, the shareholders of the Company voted in favour of a two-for-one subdivision of the
Company’s common shares. Upon completion of the share split, and as at the date of this report, the Company
had 36,214,554 common shares outstanding.
With its recent equity issue, available credit facilities and anticipated cash flow from operations, the Company
expects to have adequate resources to fund its financial obligations for 2005.
ACQUISITION OF CALFRAC SHARES, SHARE CANCELLATION, BUSINESS COMBINATION AND EQUITY FINANCING ›
On March 23, 2004, Calfrac exercised its option to purchase for cancellation 4,289,844 of its common shares
that were held by another company for $58.4 million.
On March 24, 2004, all of the issued and outstanding shares of Calfrac were acquired by Denison Energy Inc.
(“Denison”) for a net purchase price of approximately $143.9 million ($227.5 million less indebtedness of
$83.6 million). The net purchase price was paid by Denison issuing 7,427,039 common shares and making a
cash payment of approximately $28.8 million to the shareholders of Calfrac.
Prior to this transaction, Denison completed a public offering of 8,064,520 common shares at a price of
$15.50 per share for net proceeds of approximately $116.3 million. The proceeds were used to finance the cash
component of Denison’s acquisition of all of the shares of Calfrac in the amount of $28.8 million and to finance
the repayment of a promissory note totaling $58.4 million that had been issued with respect to the repurchased
Calfrac shares referred to above. The balance of the net proceeds of approximately $29.1 million was added to
the Company’s working capital to be used for general corporate purposes.
Immediately following completion of the business transaction, Denison amalgamated with Calfrac and the
successor company changed its name to Calfrac Well Services Ltd. The combination of Denison and Calfrac has
been accounted for in accordance with Canadian GAAP with Calfrac as the acquiring entity, and as a result, the
financial results for all periods presented in this report are those generated by Calfrac.
Following these transactions, Calfrac’s primary business continues to be the provision of fracturing, coiled
tubing, cementing and well stimulation services to companies exploring for and developing petroleum and natural
gas in North America.
Management’s Discussion and Analysis
CALFRAC WELL SERVICES LTD. › 2004 ANNUAL REPORT › PG 39
TAX ATTRIBUTES ›
As reflected in note 4 to the consolidated financial statements, upon amalgamation with Denison, the
Company assumed estimated tax attributes of approximately $220.0 million for federal income tax purposes and
$170.0 million for provincial income tax purposes. These amounts included non-capital losses of approximately
$69.0 million, of which $51.1 million was utilized in the current year. Of the remaining amount, $6.3 million and
$11.6 million are scheduled to expire on December 31, 2008 and December 31, 2009, respectively. The Company
expects to fully utilize all tax non-capital losses prior to the expiration dates. At December 31, 2004, the Company
had total tax attributes of approximately $279.6 million for federal income tax purposes and $225.8 million for
provincial income tax purposes.
STOCK OPTION PLAN ›
The Compensation Committee of the Board of Directors, in conjunction with senior management, undertook
a comprehensive review of alternatives for long-term incentive plans. The objective of the Committee was to
develop a cost effective incentive plan that focuses on the profitable growth of the Company and will assist in the
retention and motivation of the Company’s key employees. As a result, an initial grant of 388,100 stock options
at $31.45 per option was made to existing employees during the third quarter of 2004. An additional grant of
32,000 options at an exercise price of $40.50 was made on December 14, 2004. Based on this grant price and
current assumptions, the weighted average fair value of each option, as per the Black-Scholes pricing model, is
approximately $8.89 per option. Stock-based compensation expense of $0.7 million was booked in the year related
to the grant of these options.
The Company believes that due to the increasing responsibilities placed on its directors and the complexities
of performing those obligations, directors must be appropriately compensated in order to attract and retain board
members who have sufficient knowledge, experience and expertise. As a result, the Company granted, in aggre-
gate, 30,000 deferred stock units to the Company’s six outside directors. In addition, the Company’s three most
senior officers were not included in the employee stock option plan, and therefore, a grant of 17,000 performance
stock units was made in October 2004. The amount of the grant earned by senior officers was linked to the 2004
corporate performance and consequently a “mark to market” calculation was completed on the entire allotment
of performance stock units to determine the expense for the year. At the option of the Company, both the deferred
and performance stock units can be settled in either cash or Company shares purchased on the open market. For
the deferred stock units, the Company is required to “mark these units to market” to determine the expense to be
recognized in its financial statements for the expired portion of the applicable vesting period. For the year ended
December 31, 2004, the Company recorded an expense of $1.1 million related to the deferred and performance
stock units.
CRITICAL ACCOUNTING ESTIMATES ›
This MD&A is based on Calfrac’s consolidated financial statements that have been prepared in accordance
with Canadian GAAP. The Company’s significant accounting policies are described in note 2 to the annual consoli-
dated financial statements as at December 31, 2004. The preparation of the consolidated financial statements
requires that certain estimates and judgements be made concerning the reported amount of revenues and
expenses and the carrying values of assets and liabilities. These estimates are based on historical experience
and management’s judgement. Anticipating future events involves uncertainty, and consequently, the estimates
PG 40 › CALFRAC WELL SERVICES LTD. › 2004 ANNUAL REPORT
used by management in the preparation of the consolidated financial statements may change as future events
unfold, additional experience is acquired or the environment in which the Company operates changes. The
accounting estimates that have the greatest impact on the Company’s financial results are depreciation, results
of legal action, taxation, and valuation of stock option benefits.
Depreciation of the Company’s property and equipment incorporates estimates of useful lives and residual
values. These estimates may change as more experience is obtained or as general market conditions change
impacting the operation of the Company’s property and equipment.
As described in note 4 to the consolidated financial statements, the amount of the future tax asset and
deferred tax credit in respect of the income tax pools available to the Company were based on tax filings to
date. The income tax rates used to calculate the amount of the asset are based on available information on future
income tax rates. The income tax authorities have not audited any of these pools so far as they relate to the
Company.
As described in note 15 to the consolidated financial statements for the year ended December 31, 2004,
the Company is involved in a number of legal actions in Greece and a potential claim in the State of Maine.
Management evaluates the likelihood of potential liabilities being incurred and the amount of such liabilities after
careful examination of available information and discussions with its legal advisors. As these actions have yet to
reach a status where the direction of a court’s decision can be determined with any reliability, management is
unable to evaluate its potential exposure to these legal actions at this time. The Company does not expect these
claims to be material. Denison Mines Inc. has provided an indemnity to the Company relating to the mining claim.
RISKS AND UNCERTAINTIES ›
Volatility of Industry ConditionsThe demand for fracturing, cementing and well stimulation services largely depends on the level of industry
activity for Canadian natural gas and, to a lesser extent, oil exploration and development. Conditions are influ-
enced by numerous factors over which the Company has no control, including: the level of oil and gas prices,
government legislation, regulatory and economic conditions, global political and military events, international
trade barriers or disputes and fuel and environmental conservation measures such as the Kyoto Protocol.
SeasonalityIn Canada, the level of activity in the oilfield services industry is influenced by seasonal weather patterns.
During the second quarter, soft ground conditions curtail oilfield activity in all of the Company’s operating areas.
This period, commonly referred to as “spring breakup,” occurs earlier in the year in southeastern Alberta than it
does in northern Alberta and British Columbia. The Company mitigates the effect of these seasonal cycles by
moving equipment to the areas where activity is still continuing. Finally, inclement weather can affect oilfield
activity at any time of the year.
Dependence on Major CustomerAlthough the Company’s customer base consists of over 200 oil and gas exploration and production compa-
nies, up to 50% of its revenue has historically come from one major customer. This customer was also an equity
shareholder of the Company, but during 2004 disposed of its equity interest. The Company has no reason to
believe that there will be any change to the amount of work undertaken with this customer. Notwithstanding the
foregoing, no assurance can be given that Calfrac’s relationship with this customer will continue.
Management’s Discussion and Analysis
CALFRAC WELL SERVICES LTD. › 2004 ANNUAL REPORT › PG 41
Sources, Pricing and Availability of Material and ManpowerThe Company sources its raw materials, such as proppant, chemicals, nitrogen, carbon dioxide and coiled
tubing, from a variety of suppliers. In addition, its customers require products such as steel, water, methanol and
other oilfield equipment such as drilling, well service, well flow back and well testing equipment. Should the
supply of these commodities, products and services become restricted, their scarcity could hamper oilfield activity.
The Company requires a complement of skilled and trained individuals to operate its business. Although the
Company has not suffered from a shortage of personnel in the past, no assurance can be given that this will
continue in the future.
Operating Risks and InsuranceCalfrac’s operations are subject to hazards inherent in the oil and gas industry. Risks could expose the
Company to substantial liability for personal injury, wrongful death, property damage, loss of oil and gas produc-
tion, pollution and other environmental damages. The Company operates a loss prevention program in accordance
with industry standards and maintains insurance coverage that it believes to be adequate, however, there can be
no assurance that such insurance will be adequate to cover potential liabilities.
Greece Legal ActionsThe Company is involved in several legal actions with former employees of a Denison subsidiary relating
to the shut down of its oil and gas operations in Greece during 1998 and 1999. The Company intends to defend
itself against the claims of the employees, however, the direction and financial consequences of decisions in
these actions cannot be determined at this time.
Liabilities from Prior OperationsThe Company has distributed the former uranium mining, environmental services and Canadian oil and gas
development and exploration businesses to two new public companies. Despite the indemnity provided to Calfrac
by these companies, it is possible that claims or losses filed against Calfrac may not be within the scope of the
indemnities or the indemnifying party may lack sufficient financial resources to satisfy its obligations pursuant
to the indemnities.
CompetitionThe Company competes with large national and multi-national companies that have greater financial and other
resources than Calfrac.
Currency Exchange Rate RiskThe Company’s expenditures for equipment and a significant proportion of proppant are denominated in
United States dollars and these expenditures are therefore directly affected by the Canadian/United States dollar
exchange rate. This exposure is somewhat mitigated by the Company’s operations in the U.S., however these
operations are currently not of sufficient size to offset the exchange rate risk for Canadian operations.
Mitigation of Risks and UncertaintiesThe Company expects that its strong financial position, seasoned management, innovative equipment, products
and strong contractual relationships with customers will enhance its ability to weather downturns in industry
activity and unforeseen adverse events.
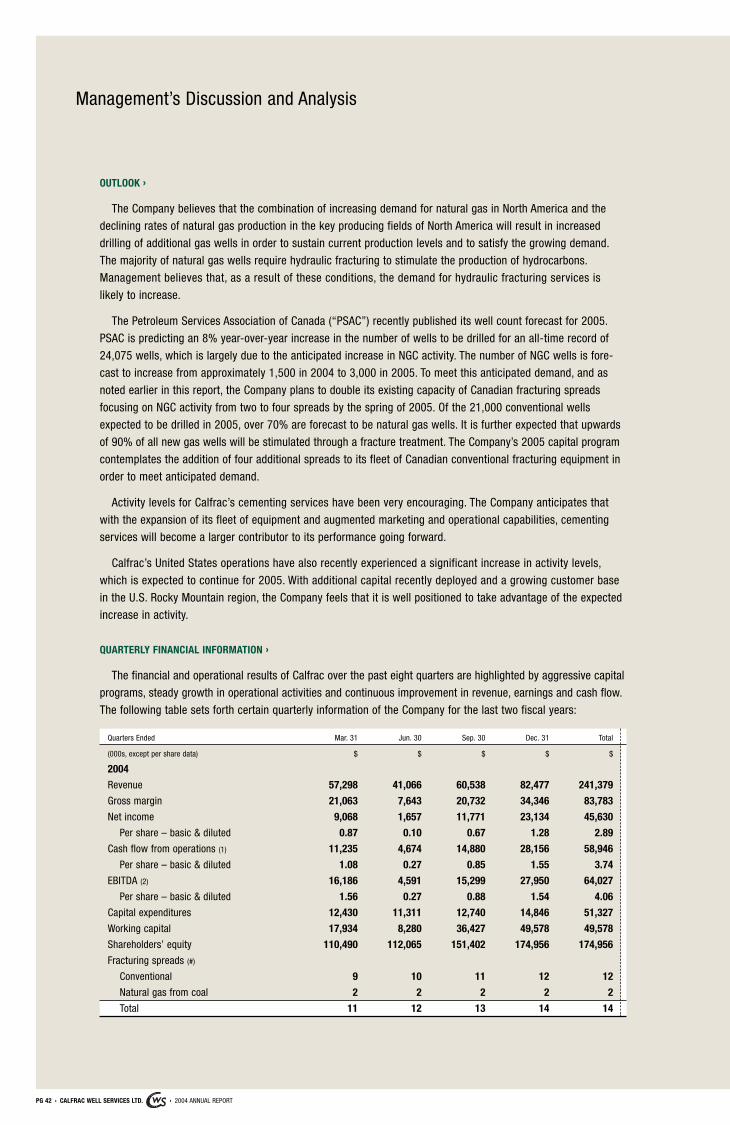
PG 42 › CALFRAC WELL SERVICES LTD. › 2004 ANNUAL REPORT
OUTLOOK ›
The Company believes that the combination of increasing demand for natural gas in North America and the
declining rates of natural gas production in the key producing fields of North America will result in increased
drilling of additional gas wells in order to sustain current production levels and to satisfy the growing demand.
The majority of natural gas wells require hydraulic fracturing to stimulate the production of hydrocarbons.
Management believes that, as a result of these conditions, the demand for hydraulic fracturing services is
likely to increase.
The Petroleum Services Association of Canada (“PSAC”) recently published its well count forecast for 2005.
PSAC is predicting an 8% year-over-year increase in the number of wells to be drilled for an all-time record of
24,075 wells, which is largely due to the anticipated increase in NGC activity. The number of NGC wells is fore-
cast to increase from approximately 1,500 in 2004 to 3,000 in 2005. To meet this anticipated demand, and as
noted earlier in this report, the Company plans to double its existing capacity of Canadian fracturing spreads
focusing on NGC activity from two to four spreads by the spring of 2005. Of the 21,000 conventional wells
expected to be drilled in 2005, over 70% are forecast to be natural gas wells. It is further expected that upwards
of 90% of all new gas wells will be stimulated through a fracture treatment. The Company’s 2005 capital program
contemplates the addition of four additional spreads to its fleet of Canadian conventional fracturing equipment in
order to meet anticipated demand.
Activity levels for Calfrac’s cementing services have been very encouraging. The Company anticipates that
with the expansion of its fleet of equipment and augmented marketing and operational capabilities, cementing
services will become a larger contributor to its performance going forward.
Calfrac’s United States operations have also recently experienced a significant increase in activity levels,
which is expected to continue for 2005. With additional capital recently deployed and a growing customer base
in the U.S. Rocky Mountain region, the Company feels that it is well positioned to take advantage of the expected
increase in activity.
QUARTERLY FINANCIAL INFORMATION ›
The financial and operational results of Calfrac over the past eight quarters are highlighted by aggressive capital
programs, steady growth in operational activities and continuous improvement in revenue, earnings and cash flow.
The following table sets forth certain quarterly information of the Company for the last two fiscal years:
Quarters Ended Mar. 31 Jun. 30 Sep. 30 Dec. 31 Total
(000s, except per share data) $ $ $ $ $
2004
Revenue 57,298 41,066 60,538 82,477 241,379
Gross margin 21,063 7,643 20,732 34,346 83,783
Net income 9,068 1,657 11,771 23,134 45,630
Per share – basic & diluted 0.87 0.10 0.67 1.28 2.89
Cash flow from operations (1) 11,235 4,674 14,880 28,156 58,946
Per share – basic & diluted 1.08 0.27 0.85 1.55 3.74
EBITDA (2) 16,186 4,591 15,299 27,950 64,027
Per share – basic & diluted 1.56 0.27 0.88 1.54 4.06
Capital expenditures 12,430 11,311 12,740 14,846 51,327
Working capital 17,934 8,280 36,427 49,578 49,578
Shareholders’ equity 110,490 112,065 151,402 174,956 174,956
Fracturing spreads (#)
Conventional 9 10 11 12 12
Natural gas from coal 2 2 2 2 2
Total 11 12 13 14 14
Management’s Discussion and Analysis
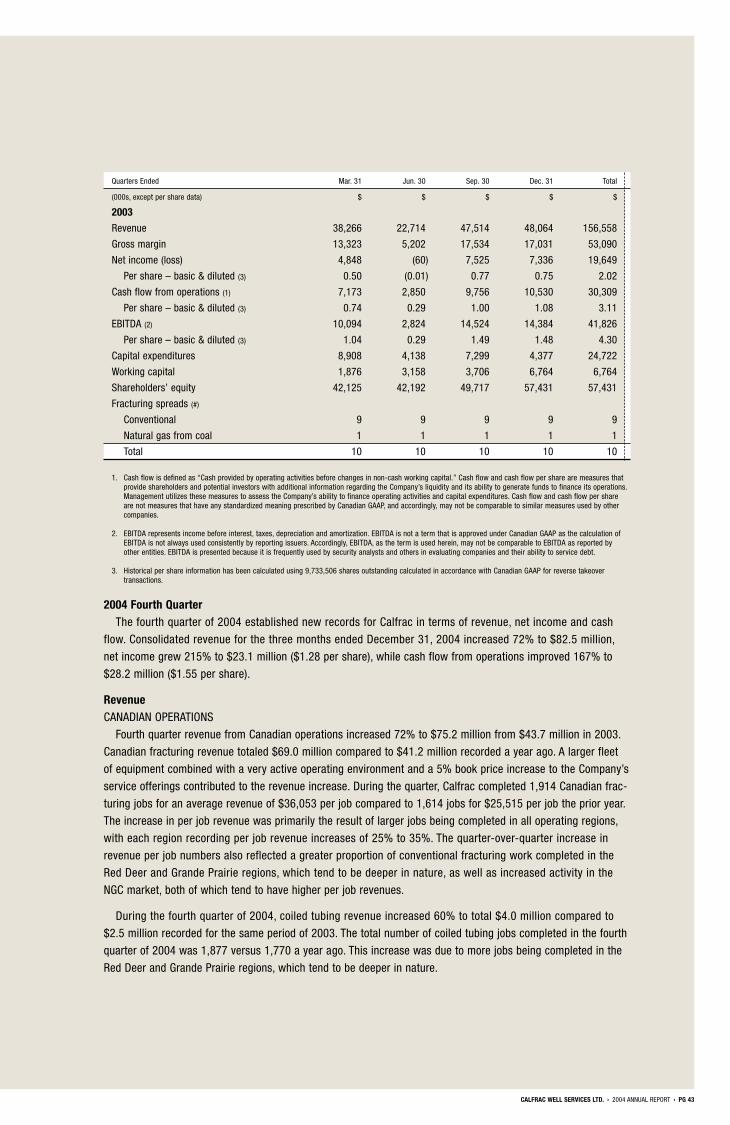
CALFRAC WELL SERVICES LTD. › 2004 ANNUAL REPORT › PG 43
Quarters Ended Mar. 31 Jun. 30 Sep. 30 Dec. 31 Total
(000s, except per share data) $ $ $ $ $
2003
Revenue 38,266 22,714 47,514 48,064 156,558
Gross margin 13,323 5,202 17,534 17,031 53,090
Net income (loss) 4,848 (60) 7,525 7,336 19,649
Per share – basic & diluted (3) 0.50 (0.01) 0.77 0.75 2.02
Cash flow from operations (1) 7,173 2,850 9,756 10,530 30,309
Per share – basic & diluted (3) 0.74 0.29 1.00 1.08 3.11
EBITDA (2) 10,094 2,824 14,524 14,384 41,826
Per share – basic & diluted (3) 1.04 0.29 1.49 1.48 4.30
Capital expenditures 8,908 4,138 7,299 4,377 24,722
Working capital 1,876 3,158 3,706 6,764 6,764
Shareholders’ equity 42,125 42,192 49,717 57,431 57,431
Fracturing spreads (#)
Conventional 9 9 9 9 9
Natural gas from coal 1 1 1 1 1
Total 10 10 10 10 10
1. Cash flow is defined as “Cash provided by operating activities before changes in non-cash working capital.” Cash flow and cash flow per share are measures thatprovide shareholders and potential investors with additional information regarding the Company’s liquidity and its ability to generate funds to finance its operations.Management utilizes these measures to assess the Company’s ability to finance operating activities and capital expenditures. Cash flow and cash flow per shareare not measures that have any standardized meaning prescribed by Canadian GAAP, and accordingly, may not be comparable to similar measures used by othercompanies.
2. EBITDA represents income before interest, taxes, depreciation and amortization. EBITDA is not a term that is approved under Canadian GAAP as the calculation ofEBITDA is not always used consistently by reporting issuers. Accordingly, EBITDA, as the term is used herein, may not be comparable to EBITDA as reported byother entities. EBITDA is presented because it is frequently used by security analysts and others in evaluating companies and their ability to service debt.
3. Historical per share information has been calculated using 9,733,506 shares outstanding calculated in accordance with Canadian GAAP for reverse takeover transactions.
2004 Fourth QuarterThe fourth quarter of 2004 established new records for Calfrac in terms of revenue, net income and cash
flow. Consolidated revenue for the three months ended December 31, 2004 increased 72% to $82.5 million,
net income grew 215% to $23.1 million ($1.28 per share), while cash flow from operations improved 167% to
$28.2 million ($1.55 per share).
RevenueCANADIAN OPERATIONS
Fourth quarter revenue from Canadian operations increased 72% to $75.2 million from $43.7 million in 2003.
Canadian fracturing revenue totaled $69.0 million compared to $41.2 million recorded a year ago. A larger fleet
of equipment combined with a very active operating environment and a 5% book price increase to the Company’s
service offerings contributed to the revenue increase. During the quarter, Calfrac completed 1,914 Canadian frac-
turing jobs for an average revenue of $36,053 per job compared to 1,614 jobs for $25,515 per job the prior year.
The increase in per job revenue was primarily the result of larger jobs being completed in all operating regions,
with each region recording per job revenue increases of 25% to 35%. The quarter-over-quarter increase in
revenue per job numbers also reflected a greater proportion of conventional fracturing work completed in the
Red Deer and Grande Prairie regions, which tend to be deeper in nature, as well as increased activity in the
NGC market, both of which tend to have higher per job revenues.
During the fourth quarter of 2004, coiled tubing revenue increased 60% to total $4.0 million compared to
$2.5 million recorded for the same period of 2003. The total number of coiled tubing jobs completed in the fourth
quarter of 2004 was 1,877 versus 1,770 a year ago. This increase was due to more jobs being completed in the
Red Deer and Grande Prairie regions, which tend to be deeper in nature.

PG 44 › CALFRAC WELL SERVICES LTD. › 2004 ANNUAL REPORT
Revenue from the Company’s cementing operations increased 56% to $2.2 million for the fourth quarter of
2004 from $1.4 million recorded in the year’s third quarter. Combining this positive momentum with a larger fleet
of equipment in 2005, the Company expects cementing services to become a more significant contributor to its
financial results in the future.
UNITED STATES OPERATIONS
Revenue from United States operations improved 65% to $7.3 million in the 2004 fourth quarter versus
$4.4 million recorded a year ago. The year-over-year improvement was impacted by the deployment of a second
fracturing spread in May 2004, growth in the Company’s customer base and near record levels of oil and gas
activity in the U.S. Rocky Mountain region. During the fourth quarter, Calfrac completed 94 U.S. fracturing jobs
for an average revenue of $77,943 per job compared to 63 jobs for $70,442 per job in 2003. The jobs completed
in 2004 were slightly larger, thereby providing higher revenues although this was somewhat offset by a weaker
U.S. dollar, which had a negative affect on the per job figures.
Gross MarginFor the fourth quarter of 2004, consolidated gross margins increased 102% to $34.3 million from $17.0 million
in 2003. The increase was due to higher activity levels, an expanded fleet of equipment, the commencement of
nitrogen shipments from a new facility located in Strathmore, which resulted in decreased product costs, a larger
proportion of revenue being earned in the Grande Prairie region, an increase in NGC jobs and improved margins
from the Company’s U.S. operations. As a percentage of revenue, consolidated gross margins increased to 41.6%
from 35.4% in the fourth quarter of 2003 due primarily to larger job sizes in all operating regions.
SG&AFor the three months ended December 31, 2004, SG&A expenses totaled $6.3 million compared to $2.6 million
the prior year. As a percentage of revenue, SG&A expenses increased to 8% for the fourth quarter of 2004
compared to 5% in 2003. Higher provisions for performance bonuses payable to employees combined with a
$1.6 million charge related to the recently introduced stock-based compensation plan contributed to the year-
over-year increase. The higher SG&A expense was also required to support the Company’s growth experienced
in the latter part of 2004 as well as costs associated with being a public company.
Interest, Depreciation and Other ExpensesInterest revenue for the three months ended December 31, 2004 totaled $0.07 million compared to an expense
of $0.5 million a year ago due primarily to debt repayments made earlier in the year. Interest was earned on
gross proceeds from a public offering of the Company’s capital stock that totaled $28.4 million. Conversely,
depreciation expenses increased 43% to $3.4 million from $2.4 million recorded in the 2003 three-month period
as a result of depreciation relating to equipment additions made late in 2003 and an aggressive 2004 capital
program. Other expenses arise from fluctuations in Canadian/U.S. currency exchange rates.
Income TaxIncome tax expense for the quarter totaled $1.5 million compared to $4.1 million a year ago. Current tax
expense for the fourth quarter dropped to $0.4 million from $3.4 million in 2003 due to the income tax attributes
acquired in the Denison amalgamation. Consequently, the provision for current tax was related almost entirely to
the profitability of the Company’s cementing and U.S. operations. Future income tax expense for the fourth quarter
of 2004 totaled $1.0 million, which resulted primarily from the drawdown of the Company’s tax pools as a result
of the profitability during the quarter.
Management’s Discussion and Analysis
CALFRAC WELL SERVICES LTD. › 2004 ANNUAL REPORT › PG 45
Net IncomeNet income increased to $23.1 million or $1.28 per share from $7.3 million or $0.75 per share in the 2003
three-month period. This 215% improvement in earnings was due primarily to an increase in revenue as a result
of strong industry activity levels combined with a lower effective tax rate resulting from the tax attributes
acquired as part of the transaction with Denison.
Cash FlowDuring the fourth quarter of 2004, cash flow from operations excluding change in non-cash working capital
improved 167% to $28.2 million or $1.55 per share from $10.5 million or $1.08 per share recorded a year ago.
This $17.7 million cash flow gain was a result of higher earnings for the quarter.
SEDAR ›
Additional information relating to the Company, including its Annual Information Form, can be accessed on
the Company’s website at www.calfrac.com and on the Canadian Securities Administrators’ System for Electronic
Document Analysis and Retrieval (SEDAR) at www.sedar.com.
FORWARD-LOOKING STATEMENTS ›
Certain statements contained in this report, including statements that may contain words such as “anticipates,”
“can,” “may,” “expect,” “believe or believes” and “will” and similar expressions are forward-looking statements.
These statements may include, but are not limited to, future capital expenditures, future financial resources,
future oil and gas well activity, outcome of specific events, and trends in the oil and gas industry. These state-
ments are derived from certain assumptions and analyses made by the Company based on its experience and
interpretation of historical trends, current conditions and expected future developments, and other factors that it
believes are appropriate in the circumstances. These statements or predictions are subject to a number of known
and unknown risks and uncertainties, which are discussed previously in this report, that could cause actual
results to differ materially from the Company’s expectations. Consequently, all of the forward-looking statements
made in this report are qualified by these cautionary statements and there can be no assurance that actual
results or developments anticipated by the Company will be realized, or that they will have the expected conse-
quences or effects on the Company or its business or operations. The Company assumes no obligation to update
publicly any such forward-looking statements, whether as a result of new information, future events or otherwise.
DOUGLAS R. RAMSAYPresident & Chief Executive Officer
TOM J. MEDVEDICVice President, Finance & Chief Financial Officer
February 18, 2005Calgary, Alberta
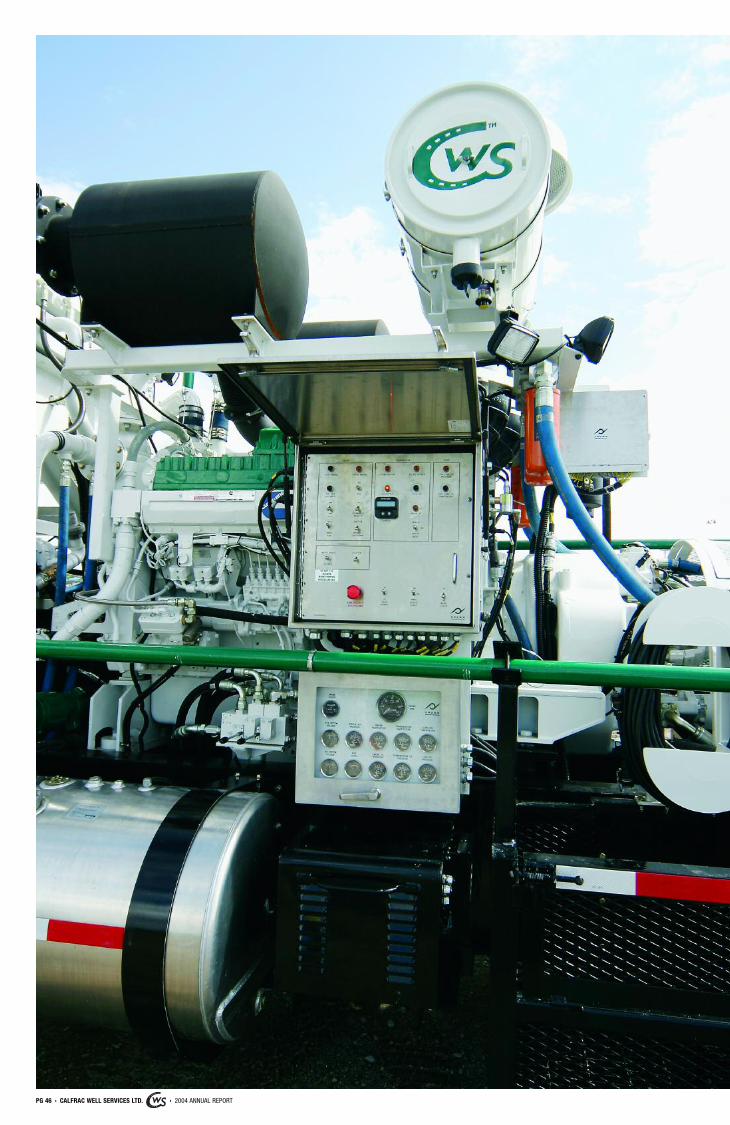
PG 46 › CALFRAC WELL SERVICES LTD. › 2004 ANNUAL REPORT
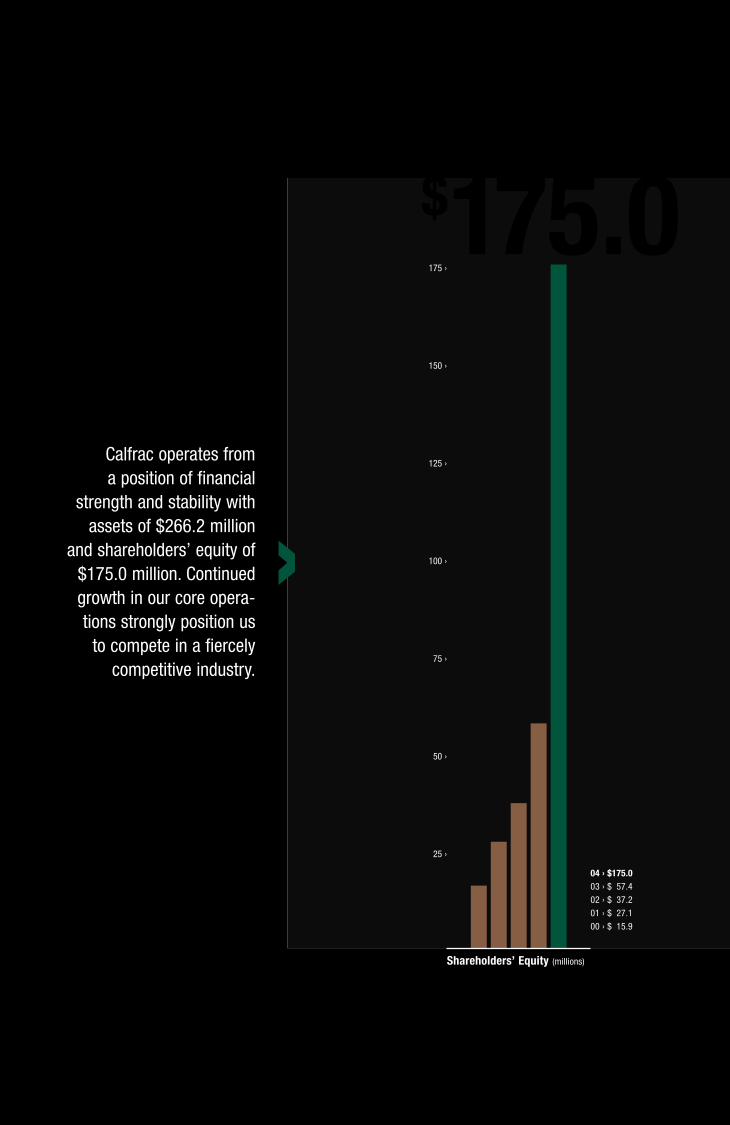
Calfrac operates from a position of financial
strength and stability withassets of $266.2 million
and shareholders’ equity of$175.0 million. Continuedgrowth in our core opera-tions strongly position us
to compete in a fiercelycompetitive industry.
Shareholders’ Equity (millions)
04 › $175.003 › $057.402 › $037.201 › $027.100 › $015.9
$175.0175 ›
150 ›
125 ›
100 ›
75 ›
50 ›
25 ›
›
Our management maintains appropriatesystems of INTERNAL CONTROL. Policies and procedures are designed to givereasonable assurance that transactionsare properly authorized, assets are safe-guarded and financial records properlymaintained to provide reliable informa-tion for the preparation of financialstatements.
CALFRAC WELL SERVICES LTD. › 2004 ANNUAL REPORT › PG 47
Management’s Report
To the Shareholders of Calfrac Well Services Ltd.
The accompanying consolidated financial statements and all information in the Annual Report are the responsi-
bility of management. The consolidated financial statements have been prepared by management in accordance
with the accounting policies set out in the accompanying notes to the consolidated financial statements. When
necessary, management has made informed judgements and estimates in accounting for transactions that were
not complete at the balance sheet date. In the opinion of management, the consolidated financial statements
have been prepared within acceptable limits of materiality and are in accordance with Canadian generally accepted
accounting principles (“GAAP”) appropriate in the circumstances. The financial information elsewhere in the
Annual Report has been reviewed to ensure consistency with that in the consolidated financial statements.
Management has prepared the Management’s Discussion and Analysis (“MD&A”). The MD&A is based on
the Company’s financial results prepared in accordance with Canadian GAAP. The MD&A compares the audited
financial results for the year ended December 31, 2004 to December 31, 2003.
Management maintains appropriate systems of internal control. Policies and procedures are designed to give
reasonable assurance that transactions are properly authorized, assets are safeguarded and financial records
properly maintained to provide reliable information for the preparation of financial statements.
PricewaterhouseCoopers LLP, an independent firm of Chartered Accountants, was engaged, as approved by a
vote of shareholders at the Company’s most recent Annual Meeting, to audit the consolidated financial statements
in accordance with generally accepted auditing standards in Canada and provide an independent professional
opinion.
The Audit Committee of the Board of Directors, which is comprised of four independent and unrelated directors
who are not employees of the Company, has discussed the consolidated financial statements, including the notes
thereto, with management and external Auditors. The consolidated financial statements have been approved by
the Board of Directors on the recommendation of the Audit Committee.
DOUGLAS R. RAMSAYPresident & Chief Executive Officer
TOM J. MEDVEDICVice President, Finance & Chief Financial Officer
February 18, 2005Calgary, Alberta
PG 48 › CALFRAC WELL SERVICES LTD. › 2004 ANNUAL REPORT
Auditors’ Report
To the Shareholders of Calfrac Well Services Ltd.
We have audited the consolidated balance sheets of Calfrac Well Services Ltd. as at December 31, 2004 and
2003 and the consolidated statements of operations and retained earnings and of cash flows for the years then
ended. These consolidated financial statements are the responsibility of the Company’s management. Our respon-
sibility is to express an opinion on these consolidated financial statements based on our audits.
We conducted our audits in accordance with Canadian generally accepted auditing standards. Those standards
require that we plan and perform an audit to obtain reasonable assurance whether the financial statements are
free of material misstatement. An audit includes examining, on a test basis, evidence supporting the amounts
and disclosures in the financial statements. An audit also includes assessing the accounting principles used and
significant estimates made by management, as well as evaluating the overall financial statement presentation.
In our opinion, these consolidated financial statements present fairly, in all material respects, the financial
position of the Company as at December 31, 2004 and 2003 and the results of its operations and its cash flows
for the years then ended in accordance with Canadian generally accepted accounting principles.
Chartered Accountants
February 18, 2005Calgary, Alberta
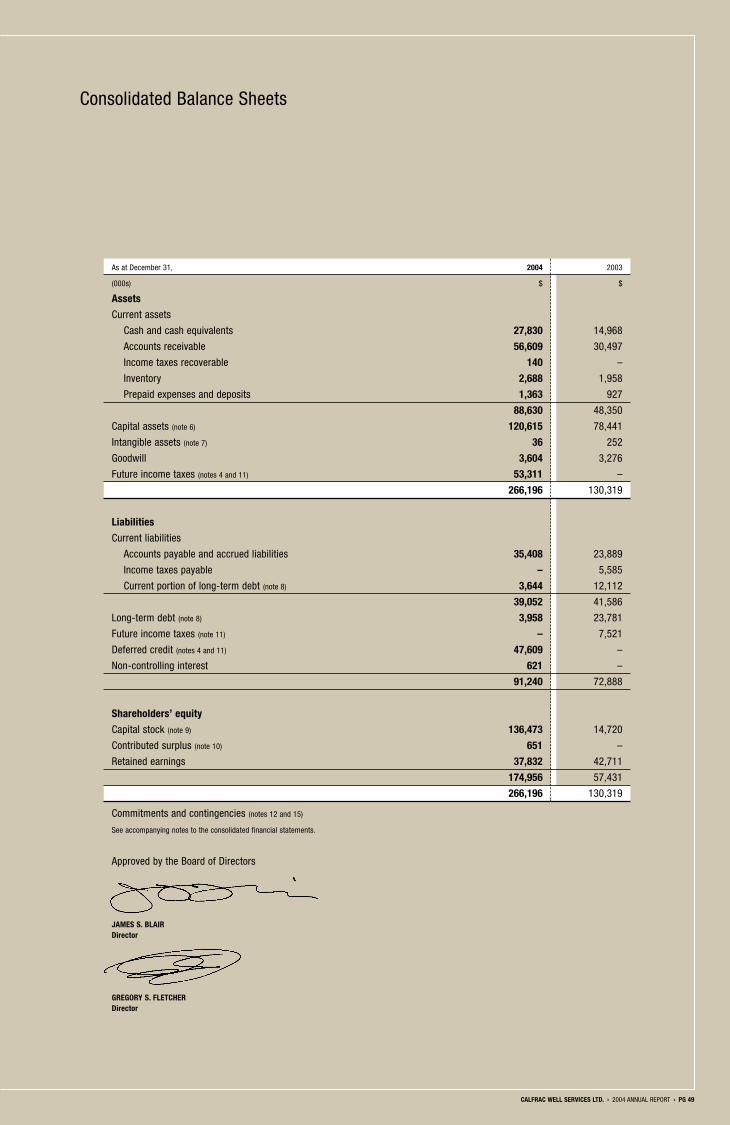
CALFRAC WELL SERVICES LTD. › 2004 ANNUAL REPORT › PG 49
As at December 31, 2004 2003
(000s) $ $
Assets
Current assets
Cash and cash equivalents 27,830 14,968
Accounts receivable 56,609 30,497
Income taxes recoverable 140 –
Inventory 2,688 1,958
Prepaid expenses and deposits 1,363 927
88,630 48,350
Capital assets (note 6) 120,615 78,441
Intangible assets (note 7) 36 252
Goodwill 3,604 3,276
Future income taxes (notes 4 and 11) 53,311 –
266,196 130,319
Liabilities
Current liabilities
Accounts payable and accrued liabilities 35,408 23,889
Income taxes payable – 5,585
Current portion of long-term debt (note 8) 3,644 12,112
39,052 41,586
Long-term debt (note 8) 3,958 23,781
Future income taxes (note 11) – 7,521
Deferred credit (notes 4 and 11) 47,609 –
Non-controlling interest 621 –
91,240 72,888
Shareholders’ equity
Capital stock (note 9) 136,473 14,720
Contributed surplus (note 10) 651 –
Retained earnings 37,832 42,711
174,956 57,431
266,196 130,319
Commitments and contingencies (notes 12 and 15)
See accompanying notes to the consolidated financial statements.
Approved by the Board of Directors
JAMES S. BLAIRDirector
GREGORY S. FLETCHERDirector
Consolidated Balance Sheets
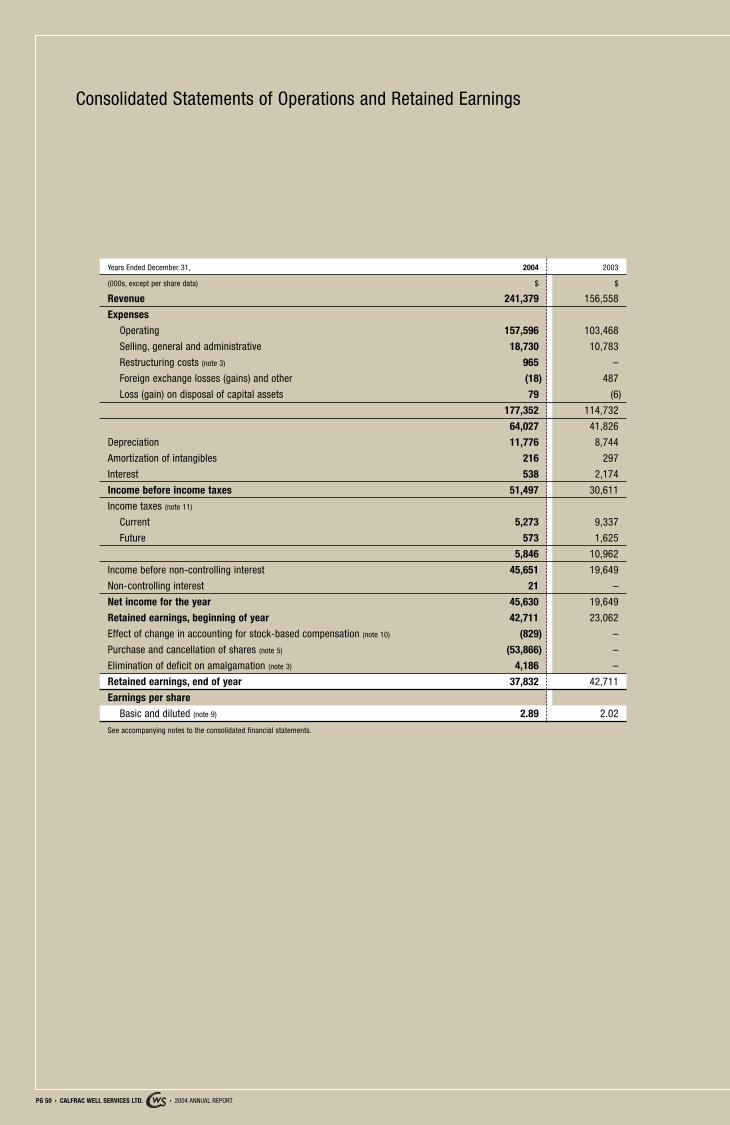
PG 50 › CALFRAC WELL SERVICES LTD. › 2004 ANNUAL REPORT
Years Ended December 31, 2004 2003
(000s, except per share data) $ $
Revenue 241,379 156,558
Expenses
Operating 157,596 103,468
Selling, general and administrative 18,730 10,783
Restructuring costs (note 3) 965 –
Foreign exchange losses (gains) and other (18) 487
Loss (gain) on disposal of capital assets 79 (6)
177,352 114,732
64,027 41,826
Depreciation 11,776 8,744
Amortization of intangibles 216 297
Interest 538 2,174
Income before income taxes 51,497 30,611
Income taxes (note 11)
Current 5,273 9,337
Future 573 1,625
5,846 10,962
Income before non-controlling interest 45,651 19,649
Non-controlling interest 21 –
Net income for the year 45,630 19,649
Retained earnings, beginning of year 42,711 23,062
Effect of change in accounting for stock-based compensation (note 10) (829) –
Purchase and cancellation of shares (note 5) (53,866) –
Elimination of deficit on amalgamation (note 3) 4,186 –
Retained earnings, end of year 37,832 42,711
Earnings per share
Basic and diluted (note 9) 2.89 2.02
See accompanying notes to the consolidated financial statements.
Consolidated Statements of Operations and Retained Earnings
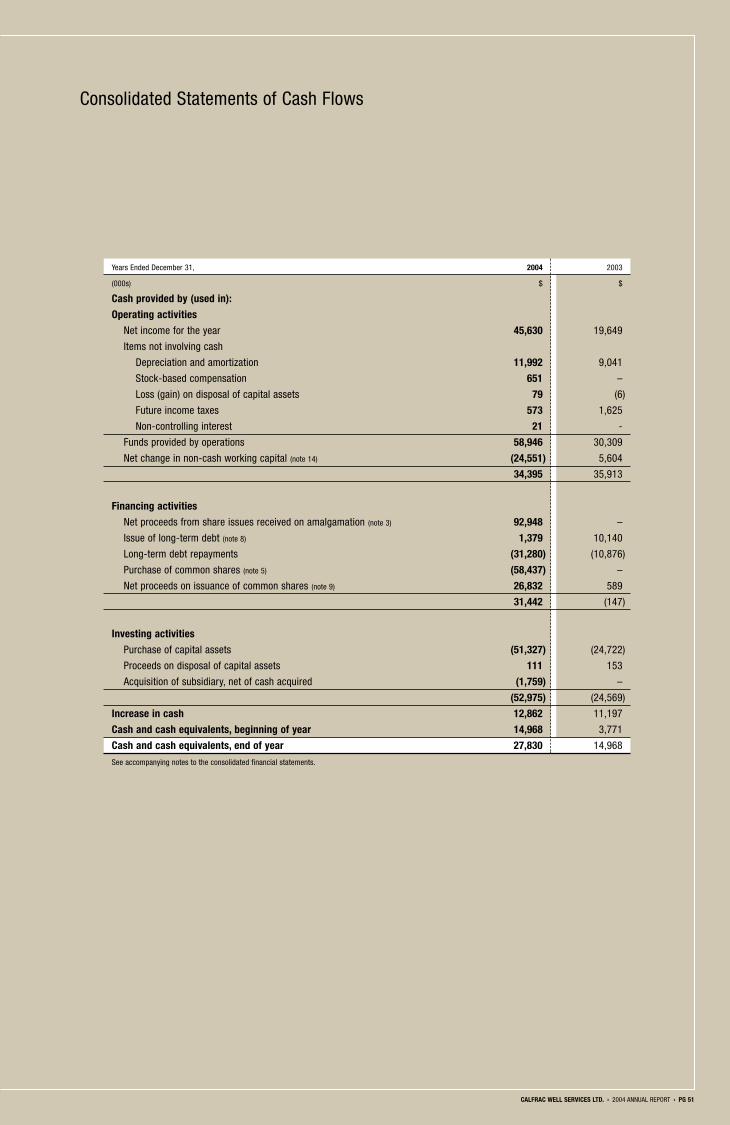
CALFRAC WELL SERVICES LTD. › 2004 ANNUAL REPORT › PG 51
Years Ended December 31, 2004 2003
(000s) $ $
Cash provided by (used in):
Operating activities
Net income for the year 45,630 19,649
Items not involving cash
Depreciation and amortization 11,992 9,041
Stock-based compensation 651 –
Loss (gain) on disposal of capital assets 79 (6)
Future income taxes 573 1,625
Non-controlling interest 21 -
Funds provided by operations 58,946 30,309
Net change in non-cash working capital (note 14) (24,551) 5,604
34,395 35,913
Financing activities
Net proceeds from share issues received on amalgamation (note 3) 92,948 –
Issue of long-term debt (note 8) 1,379 10,140
Long-term debt repayments (31,280) (10,876)
Purchase of common shares (note 5) (58,437) –
Net proceeds on issuance of common shares (note 9) 26,832 589
31,442 (147)
Investing activities
Purchase of capital assets (51,327) (24,722)
Proceeds on disposal of capital assets 111 153
Acquisition of subsidiary, net of cash acquired (1,759) –
(52,975) (24,569)
Increase in cash 12,862 11,197
Cash and cash equivalents, beginning of year 14,968 3,771
Cash and cash equivalents, end of year 27,830 14,968
See accompanying notes to the consolidated financial statements.
Consolidated Statements of Cash Flows
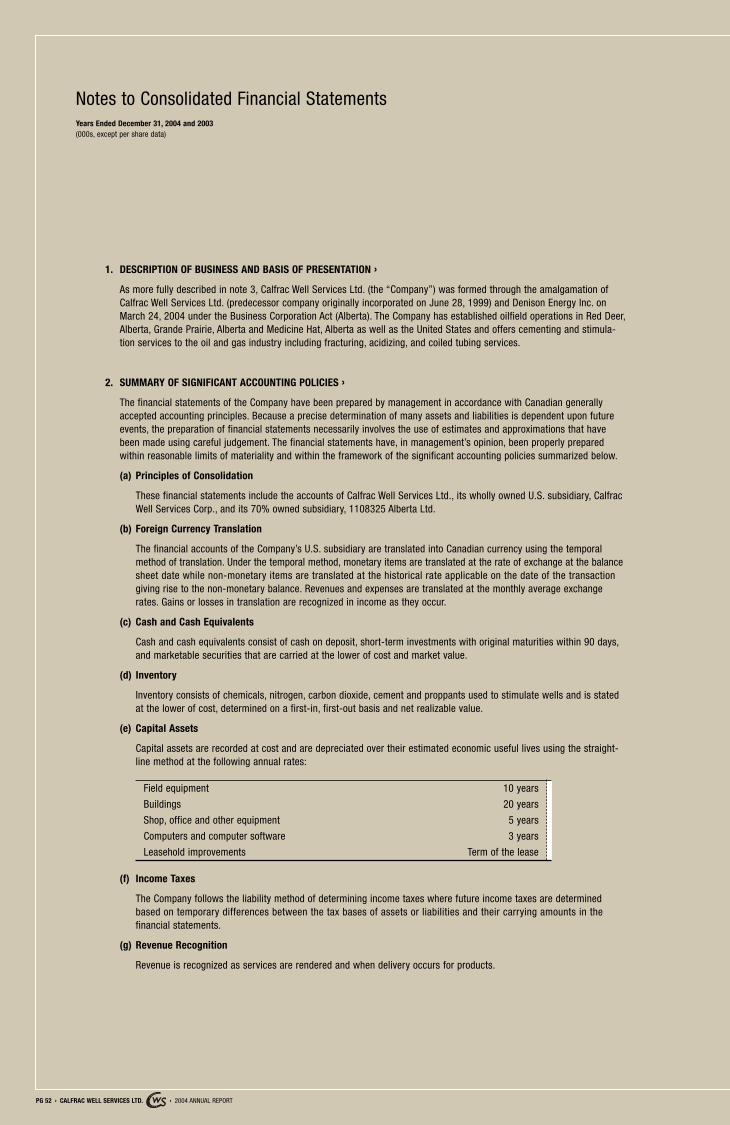
PG 52 › CALFRAC WELL SERVICES LTD. › 2004 ANNUAL REPORT
Notes to Consolidated Financial StatementsYears Ended December 31, 2004 and 2003(000s, except per share data)
1. DESCRIPTION OF BUSINESS AND BASIS OF PRESENTATION ›
As more fully described in note 3, Calfrac Well Services Ltd. (the “Company”) was formed through the amalgamation ofCalfrac Well Services Ltd. (predecessor company originally incorporated on June 28, 1999) and Denison Energy Inc. onMarch 24, 2004 under the Business Corporation Act (Alberta). The Company has established oilfield operations in Red Deer,Alberta, Grande Prairie, Alberta and Medicine Hat, Alberta as well as the United States and offers cementing and stimula-tion services to the oil and gas industry including fracturing, acidizing, and coiled tubing services.
2. SUMMARY OF SIGNIFICANT ACCOUNTING POLICIES ›
The financial statements of the Company have been prepared by management in accordance with Canadian generallyaccepted accounting principles. Because a precise determination of many assets and liabilities is dependent upon futureevents, the preparation of financial statements necessarily involves the use of estimates and approximations that havebeen made using careful judgement. The financial statements have, in management’s opinion, been properly preparedwithin reasonable limits of materiality and within the framework of the significant accounting policies summarized below.
(a) Principles of Consolidation
These financial statements include the accounts of Calfrac Well Services Ltd., its wholly owned U.S. subsidiary, CalfracWell Services Corp., and its 70% owned subsidiary, 1108325 Alberta Ltd.
(b) Foreign Currency Translation
The financial accounts of the Company’s U.S. subsidiary are translated into Canadian currency using the temporalmethod of translation. Under the temporal method, monetary items are translated at the rate of exchange at the balancesheet date while non-monetary items are translated at the historical rate applicable on the date of the transactiongiving rise to the non-monetary balance. Revenues and expenses are translated at the monthly average exchangerates. Gains or losses in translation are recognized in income as they occur.
(c) Cash and Cash Equivalents
Cash and cash equivalents consist of cash on deposit, short-term investments with original maturities within 90 days,and marketable securities that are carried at the lower of cost and market value.
(d) Inventory
Inventory consists of chemicals, nitrogen, carbon dioxide, cement and proppants used to stimulate wells and is statedat the lower of cost, determined on a first-in, first-out basis and net realizable value.
(e) Capital Assets
Capital assets are recorded at cost and are depreciated over their estimated economic useful lives using the straight-line method at the following annual rates:
Field equipment 10 years
Buildings 20 years
Shop, office and other equipment 5 years
Computers and computer software 3 years
Leasehold improvements Term of the lease
(f) Income Taxes
The Company follows the liability method of determining income taxes where future income taxes are determinedbased on temporary differences between the tax bases of assets or liabilities and their carrying amounts in thefinancial statements.
(g) Revenue Recognition
Revenue is recognized as services are rendered and when delivery occurs for products.
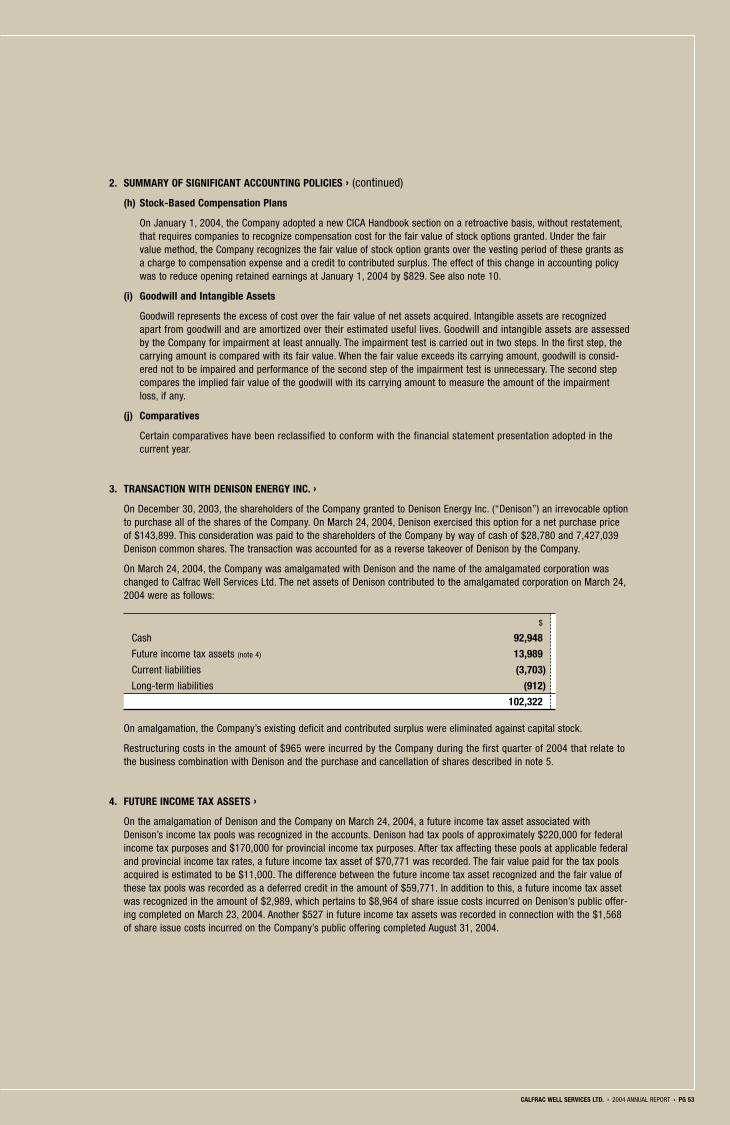
CALFRAC WELL SERVICES LTD. › 2004 ANNUAL REPORT › PG 53
2. SUMMARY OF SIGNIFICANT ACCOUNTING POLICIES › (continued)
(h) Stock-Based Compensation Plans
On January 1, 2004, the Company adopted a new CICA Handbook section on a retroactive basis, without restatement,that requires companies to recognize compensation cost for the fair value of stock options granted. Under the fairvalue method, the Company recognizes the fair value of stock option grants over the vesting period of these grants asa charge to compensation expense and a credit to contributed surplus. The effect of this change in accounting policywas to reduce opening retained earnings at January 1, 2004 by $829. See also note 10.
(i) Goodwill and Intangible Assets
Goodwill represents the excess of cost over the fair value of net assets acquired. Intangible assets are recognizedapart from goodwill and are amortized over their estimated useful lives. Goodwill and intangible assets are assessedby the Company for impairment at least annually. The impairment test is carried out in two steps. In the first step, thecarrying amount is compared with its fair value. When the fair value exceeds its carrying amount, goodwill is consid-ered not to be impaired and performance of the second step of the impairment test is unnecessary. The second stepcompares the implied fair value of the goodwill with its carrying amount to measure the amount of the impairmentloss, if any.
(j) Comparatives
Certain comparatives have been reclassified to conform with the financial statement presentation adopted in thecurrent year.
3. TRANSACTION WITH DENISON ENERGY INC. ›
On December 30, 2003, the shareholders of the Company granted to Denison Energy Inc. (“Denison”) an irrevocable optionto purchase all of the shares of the Company. On March 24, 2004, Denison exercised this option for a net purchase priceof $143,899. This consideration was paid to the shareholders of the Company by way of cash of $28,780 and 7,427,039Denison common shares. The transaction was accounted for as a reverse takeover of Denison by the Company.
On March 24, 2004, the Company was amalgamated with Denison and the name of the amalgamated corporation waschanged to Calfrac Well Services Ltd. The net assets of Denison contributed to the amalgamated corporation on March 24,2004 were as follows:
$
Cash 92,948
Future income tax assets (note 4) 13,989
Current liabilities (3,703)
Long-term liabilities (912)
102,322
On amalgamation, the Company’s existing deficit and contributed surplus were eliminated against capital stock.
Restructuring costs in the amount of $965 were incurred by the Company during the first quarter of 2004 that relate tothe business combination with Denison and the purchase and cancellation of shares described in note 5.
4. FUTURE INCOME TAX ASSETS ›
On the amalgamation of Denison and the Company on March 24, 2004, a future income tax asset associated withDenison’s income tax pools was recognized in the accounts. Denison had tax pools of approximately $220,000 for federalincome tax purposes and $170,000 for provincial income tax purposes. After tax affecting these pools at applicable federaland provincial income tax rates, a future income tax asset of $70,771 was recorded. The fair value paid for the tax poolsacquired is estimated to be $11,000. The difference between the future income tax asset recognized and the fair value ofthese tax pools was recorded as a deferred credit in the amount of $59,771. In addition to this, a future income tax assetwas recognized in the amount of $2,989, which pertains to $8,964 of share issue costs incurred on Denison’s public offer-ing completed on March 23, 2004. Another $527 in future income tax assets was recorded in connection with the $1,568of share issue costs incurred on the Company’s public offering completed August 31, 2004.
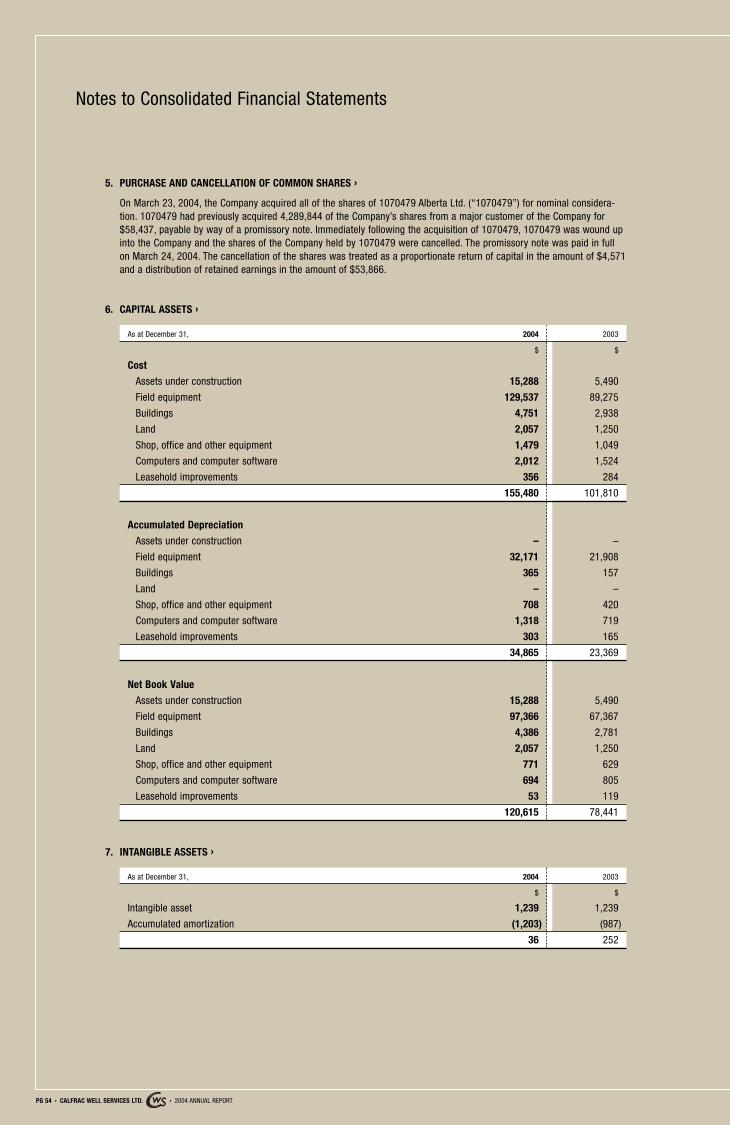
PG 54 › CALFRAC WELL SERVICES LTD. › 2004 ANNUAL REPORT
Notes to Consolidated Financial Statements
5. PURCHASE AND CANCELLATION OF COMMON SHARES ›
On March 23, 2004, the Company acquired all of the shares of 1070479 Alberta Ltd. (“1070479”) for nominal considera-tion. 1070479 had previously acquired 4,289,844 of the Company’s shares from a major customer of the Company for$58,437, payable by way of a promissory note. Immediately following the acquisition of 1070479, 1070479 was wound upinto the Company and the shares of the Company held by 1070479 were cancelled. The promissory note was paid in fullon March 24, 2004. The cancellation of the shares was treated as a proportionate return of capital in the amount of $4,571and a distribution of retained earnings in the amount of $53,866.
6. CAPITAL ASSETS ›
As at December 31, 2004 2003
$ $
Cost
Assets under construction 15,288 5,490
Field equipment 129,537 89,275
Buildings 4,751 2,938
Land 2,057 1,250
Shop, office and other equipment 1,479 1,049
Computers and computer software 2,012 1,524
Leasehold improvements 356 284
155,480 101,810
Accumulated Depreciation
Assets under construction – –
Field equipment 32,171 21,908
Buildings 365 157
Land – –
Shop, office and other equipment 708 420
Computers and computer software 1,318 719
Leasehold improvements 303 165
34,865 23,369
Net Book Value
Assets under construction 15,288 5,490
Field equipment 97,366 67,367
Buildings 4,386 2,781
Land 2,057 1,250
Shop, office and other equipment 771 629
Computers and computer software 694 805
Leasehold improvements 53 119
120,615 78,441
7. INTANGIBLE ASSETS ›
As at December 31, 2004 2003
$ $
Intangible asset 1,239 1,239
Accumulated amortization (1,203) (987)
36 252
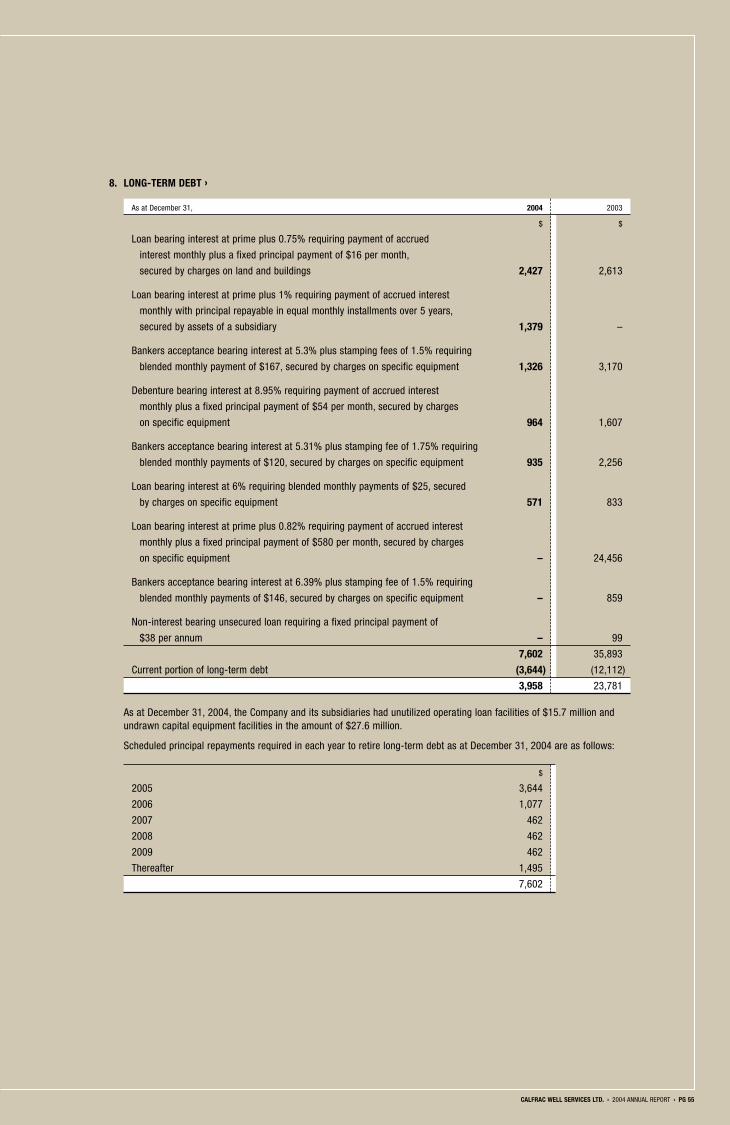
CALFRAC WELL SERVICES LTD. › 2004 ANNUAL REPORT › PG 55
8. LONG-TERM DEBT ›
As at December 31, 2004 2003
$ $
Loan bearing interest at prime plus 0.75% requiring payment of accrued
interest monthly plus a fixed principal payment of $16 per month,
secured by charges on land and buildings 2,427 2,613
Loan bearing interest at prime plus 1% requiring payment of accrued interest
monthly with principal repayable in equal monthly installments over 5 years,
secured by assets of a subsidiary 1,379 –
Bankers acceptance bearing interest at 5.3% plus stamping fees of 1.5% requiring
blended monthly payment of $167, secured by charges on specific equipment 1,326 3,170
Debenture bearing interest at 8.95% requiring payment of accrued interest
monthly plus a fixed principal payment of $54 per month, secured by charges
on specific equipment 964 1,607
Bankers acceptance bearing interest at 5.31% plus stamping fee of 1.75% requiring
blended monthly payments of $120, secured by charges on specific equipment 935 2,256
Loan bearing interest at 6% requiring blended monthly payments of $25, secured
by charges on specific equipment 571 833
Loan bearing interest at prime plus 0.82% requiring payment of accrued interest
monthly plus a fixed principal payment of $580 per month, secured by charges
on specific equipment – 24,456
Bankers acceptance bearing interest at 6.39% plus stamping fee of 1.5% requiring
blended monthly payments of $146, secured by charges on specific equipment – 859
Non-interest bearing unsecured loan requiring a fixed principal payment of
$38 per annum – 99
7,602 35,893
Current portion of long-term debt (3,644) (12,112)
3,958 23,781
As at December 31, 2004, the Company and its subsidiaries had unutilized operating loan facilities of $15.7 million andundrawn capital equipment facilities in the amount of $27.6 million.
Scheduled principal repayments required in each year to retire long-term debt as at December 31, 2004 are as follows:
$
2005 3,644
2006 1,077
2007 462
2008 462
2009 462
Thereafter 1,495
7,602
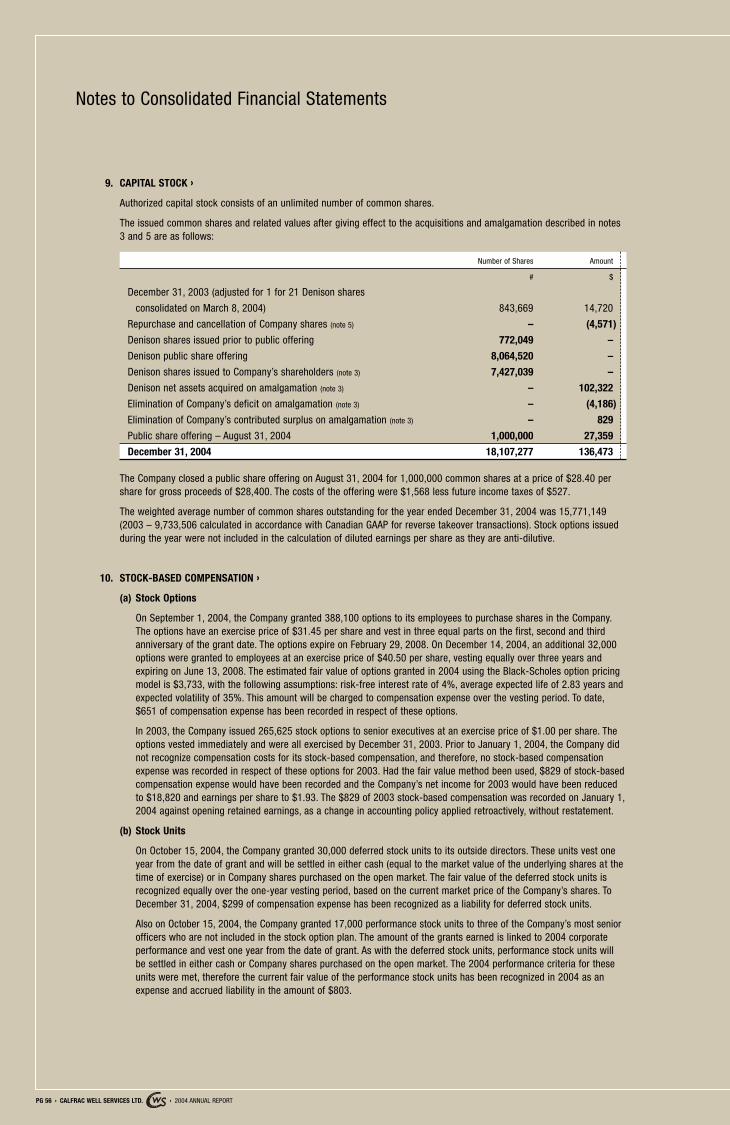
PG 56 › CALFRAC WELL SERVICES LTD. › 2004 ANNUAL REPORT
Notes to Consolidated Financial Statements
9. CAPITAL STOCK ›
Authorized capital stock consists of an unlimited number of common shares.
The issued common shares and related values after giving effect to the acquisitions and amalgamation described in notes3 and 5 are as follows:
Number of Shares Amount
# $
December 31, 2003 (adjusted for 1 for 21 Denison shares
consolidated on March 8, 2004) 843,669 14,720
Repurchase and cancellation of Company shares (note 5) – (4,571)
Denison shares issued prior to public offering 772,049 –
Denison public share offering 8,064,520 –
Denison shares issued to Company’s shareholders (note 3) 7,427,039 –
Denison net assets acquired on amalgamation (note 3) – 102,322
Elimination of Company’s deficit on amalgamation (note 3) – (4,186)
Elimination of Company’s contributed surplus on amalgamation (note 3) – 829
Public share offering – August 31, 2004 1,000,000 27,359
December 31, 2004 18,107,277 136,473
The Company closed a public share offering on August 31, 2004 for 1,000,000 common shares at a price of $28.40 pershare for gross proceeds of $28,400. The costs of the offering were $1,568 less future income taxes of $527.
The weighted average number of common shares outstanding for the year ended December 31, 2004 was 15,771,149(2003 – 9,733,506 calculated in accordance with Canadian GAAP for reverse takeover transactions). Stock options issuedduring the year were not included in the calculation of diluted earnings per share as they are anti-dilutive.
10. STOCK-BASED COMPENSATION ›
(a) Stock Options
On September 1, 2004, the Company granted 388,100 options to its employees to purchase shares in the Company.The options have an exercise price of $31.45 per share and vest in three equal parts on the first, second and thirdanniversary of the grant date. The options expire on February 29, 2008. On December 14, 2004, an additional 32,000options were granted to employees at an exercise price of $40.50 per share, vesting equally over three years andexpiring on June 13, 2008. The estimated fair value of options granted in 2004 using the Black-Scholes option pricingmodel is $3,733, with the following assumptions: risk-free interest rate of 4%, average expected life of 2.83 years andexpected volatility of 35%. This amount will be charged to compensation expense over the vesting period. To date,$651 of compensation expense has been recorded in respect of these options.
In 2003, the Company issued 265,625 stock options to senior executives at an exercise price of $1.00 per share. Theoptions vested immediately and were all exercised by December 31, 2003. Prior to January 1, 2004, the Company didnot recognize compensation costs for its stock-based compensation, and therefore, no stock-based compensationexpense was recorded in respect of these options for 2003. Had the fair value method been used, $829 of stock-basedcompensation expense would have been recorded and the Company’s net income for 2003 would have been reducedto $18,820 and earnings per share to $1.93. The $829 of 2003 stock-based compensation was recorded on January 1,2004 against opening retained earnings, as a change in accounting policy applied retroactively, without restatement.
(b) Stock Units
On October 15, 2004, the Company granted 30,000 deferred stock units to its outside directors. These units vest oneyear from the date of grant and will be settled in either cash (equal to the market value of the underlying shares at thetime of exercise) or in Company shares purchased on the open market. The fair value of the deferred stock units isrecognized equally over the one-year vesting period, based on the current market price of the Company’s shares. ToDecember 31, 2004, $299 of compensation expense has been recognized as a liability for deferred stock units.
Also on October 15, 2004, the Company granted 17,000 performance stock units to three of the Company’s most seniorofficers who are not included in the stock option plan. The amount of the grants earned is linked to 2004 corporateperformance and vest one year from the date of grant. As with the deferred stock units, performance stock units willbe settled in either cash or Company shares purchased on the open market. The 2004 performance criteria for theseunits were met, therefore the current fair value of the performance stock units has been recognized in 2004 as anexpense and accrued liability in the amount of $803.
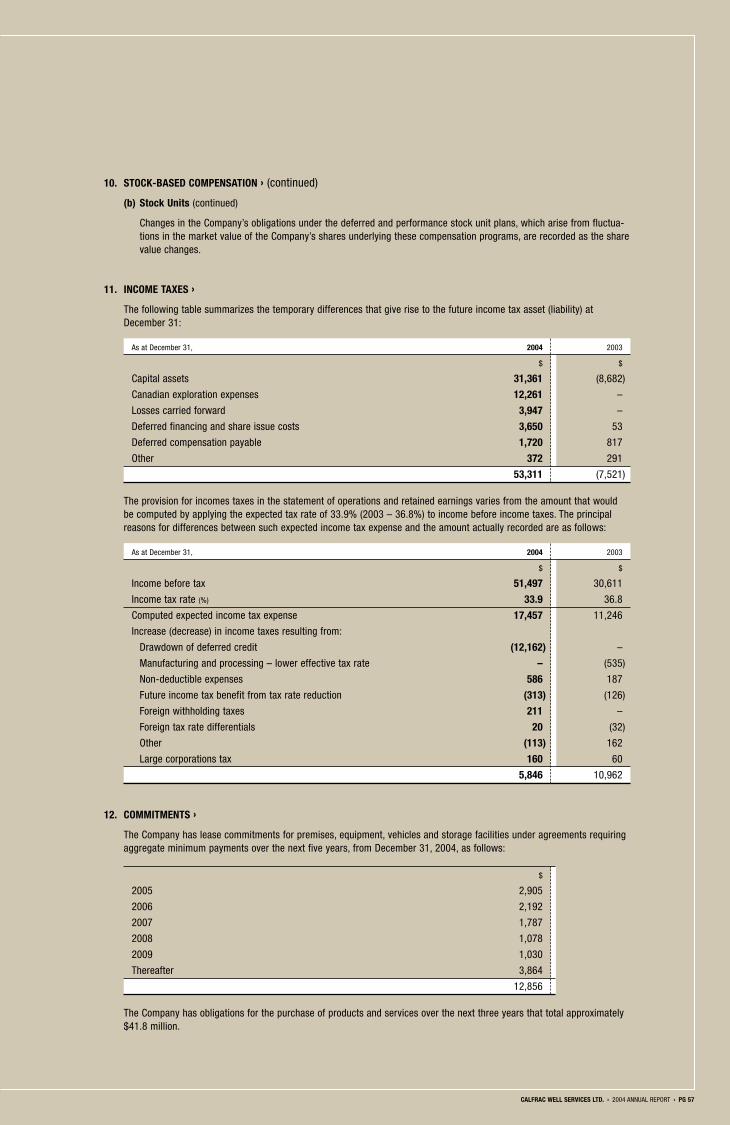
CALFRAC WELL SERVICES LTD. › 2004 ANNUAL REPORT › PG 57
10. STOCK-BASED COMPENSATION › (continued)
(b) Stock Units (continued)
Changes in the Company’s obligations under the deferred and performance stock unit plans, which arise from fluctua-tions in the market value of the Company’s shares underlying these compensation programs, are recorded as the sharevalue changes.
11. INCOME TAXES ›
The following table summarizes the temporary differences that give rise to the future income tax asset (liability) atDecember 31:
As at December 31, 2004 2003
$ $
Capital assets 31,361 (8,682)
Canadian exploration expenses 12,261 –
Losses carried forward 3,947 –
Deferred financing and share issue costs 3,650 53
Deferred compensation payable 1,720 817
Other 372 291
53,311 (7,521)
The provision for incomes taxes in the statement of operations and retained earnings varies from the amount that wouldbe computed by applying the expected tax rate of 33.9% (2003 – 36.8%) to income before income taxes. The principalreasons for differences between such expected income tax expense and the amount actually recorded are as follows:
As at December 31, 2004 2003
$ $
Income before tax 51,497 30,611
Income tax rate (%) 33.9 36.8
Computed expected income tax expense 17,457 11,246
Increase (decrease) in income taxes resulting from:
Drawdown of deferred credit (12,162) –
Manufacturing and processing – lower effective tax rate – (535)
Non-deductible expenses 586 187
Future income tax benefit from tax rate reduction (313) (126)
Foreign withholding taxes 211 –
Foreign tax rate differentials 20 (32)
Other (113) 162
Large corporations tax 160 60
5,846 10,962
12. COMMITMENTS ›
The Company has lease commitments for premises, equipment, vehicles and storage facilities under agreements requiringaggregate minimum payments over the next five years, from December 31, 2004, as follows:
$
2005 2,905
2006 2,192
2007 1,787
2008 1,078
2009 1,030
Thereafter 3,864
12,856
The Company has obligations for the purchase of products and services over the next three years that total approximately$41.8 million.
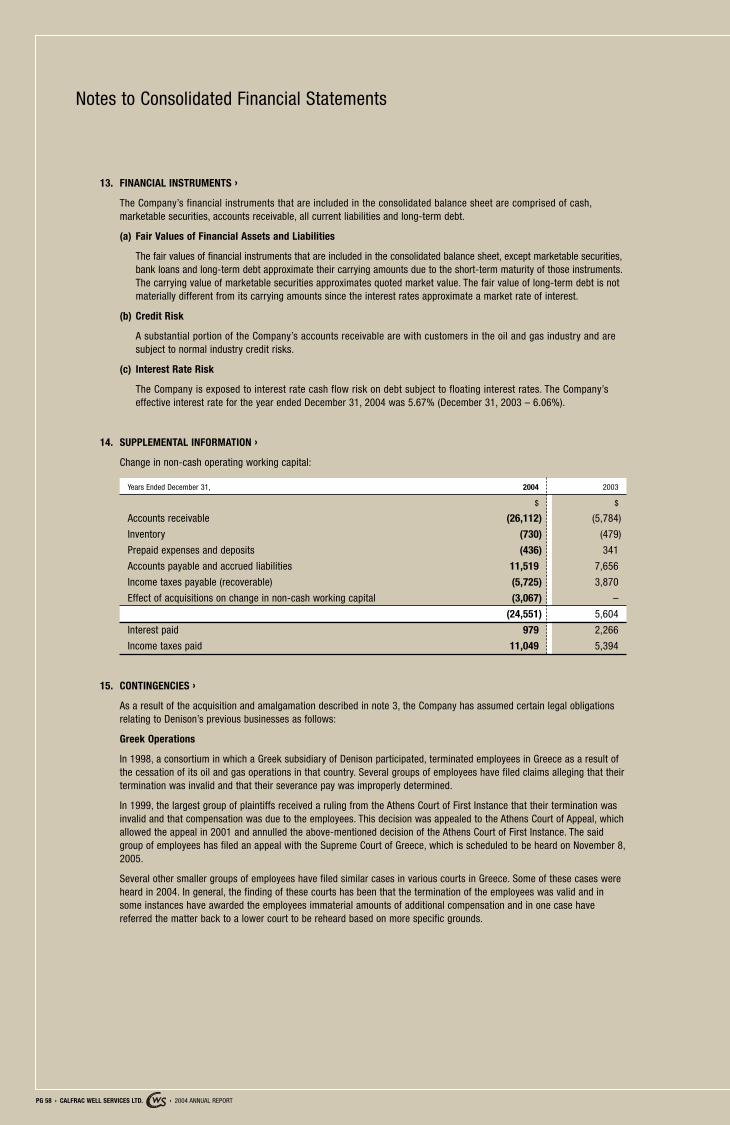
PG 58 › CALFRAC WELL SERVICES LTD. › 2004 ANNUAL REPORT
Notes to Consolidated Financial Statements
13. FINANCIAL INSTRUMENTS ›
The Company’s financial instruments that are included in the consolidated balance sheet are comprised of cash,marketable securities, accounts receivable, all current liabilities and long-term debt.
(a) Fair Values of Financial Assets and Liabilities
The fair values of financial instruments that are included in the consolidated balance sheet, except marketable securities,bank loans and long-term debt approximate their carrying amounts due to the short-term maturity of those instruments.The carrying value of marketable securities approximates quoted market value. The fair value of long-term debt is notmaterially different from its carrying amounts since the interest rates approximate a market rate of interest.
(b) Credit Risk
A substantial portion of the Company’s accounts receivable are with customers in the oil and gas industry and aresubject to normal industry credit risks.
(c) Interest Rate Risk
The Company is exposed to interest rate cash flow risk on debt subject to floating interest rates. The Company’seffective interest rate for the year ended December 31, 2004 was 5.67% (December 31, 2003 – 6.06%).
14. SUPPLEMENTAL INFORMATION ›
Change in non-cash operating working capital:
Years Ended December 31, 2004 2003
$ $
Accounts receivable (26,112) (5,784)
Inventory (730) (479)
Prepaid expenses and deposits (436) 341
Accounts payable and accrued liabilities 11,519 7,656
Income taxes payable (recoverable) (5,725) 3,870
Effect of acquisitions on change in non-cash working capital (3,067) –
(24,551) 5,604
Interest paid 979 2,266
Income taxes paid 11,049 5,394
15. CONTINGENCIES ›
As a result of the acquisition and amalgamation described in note 3, the Company has assumed certain legal obligationsrelating to Denison’s previous businesses as follows:
Greek Operations
In 1998, a consortium in which a Greek subsidiary of Denison participated, terminated employees in Greece as a result ofthe cessation of its oil and gas operations in that country. Several groups of employees have filed claims alleging that theirtermination was invalid and that their severance pay was improperly determined.
In 1999, the largest group of plaintiffs received a ruling from the Athens Court of First Instance that their termination wasinvalid and that compensation was due to the employees. This decision was appealed to the Athens Court of Appeal, whichallowed the appeal in 2001 and annulled the above-mentioned decision of the Athens Court of First Instance. The saidgroup of employees has filed an appeal with the Supreme Court of Greece, which is scheduled to be heard on November 8,2005.
Several other smaller groups of employees have filed similar cases in various courts in Greece. Some of these cases wereheard in 2004. In general, the finding of these courts has been that the termination of the employees was valid and insome instances have awarded the employees immaterial amounts of additional compensation and in one case havereferred the matter back to a lower court to be reheard based on more specific grounds.
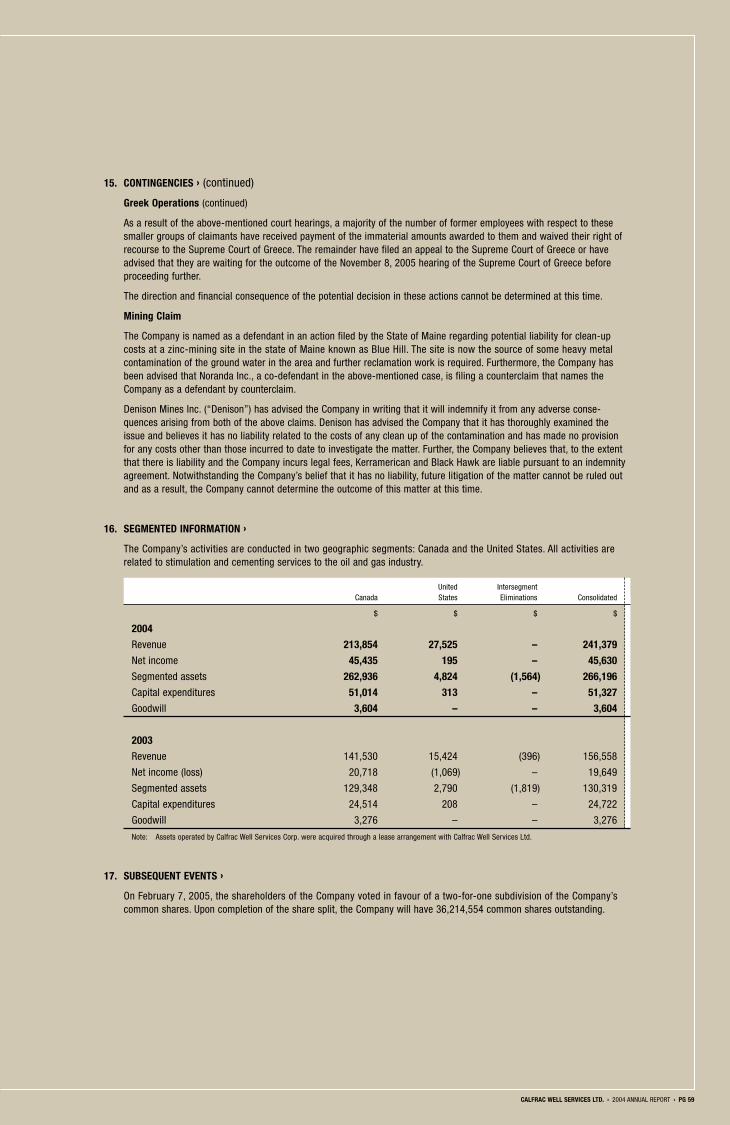
CALFRAC WELL SERVICES LTD. › 2004 ANNUAL REPORT › PG 59
15. CONTINGENCIES › (continued)
Greek Operations (continued)
As a result of the above-mentioned court hearings, a majority of the number of former employees with respect to thesesmaller groups of claimants have received payment of the immaterial amounts awarded to them and waived their right ofrecourse to the Supreme Court of Greece. The remainder have filed an appeal to the Supreme Court of Greece or haveadvised that they are waiting for the outcome of the November 8, 2005 hearing of the Supreme Court of Greece beforeproceeding further.
The direction and financial consequence of the potential decision in these actions cannot be determined at this time.
Mining Claim
The Company is named as a defendant in an action filed by the State of Maine regarding potential liability for clean-upcosts at a zinc-mining site in the state of Maine known as Blue Hill. The site is now the source of some heavy metalcontamination of the ground water in the area and further reclamation work is required. Furthermore, the Company hasbeen advised that Noranda Inc., a co-defendant in the above-mentioned case, is filing a counterclaim that names theCompany as a defendant by counterclaim.
Denison Mines Inc. (“Denison”) has advised the Company in writing that it will indemnify it from any adverse conse-quences arising from both of the above claims. Denison has advised the Company that it has thoroughly examined theissue and believes it has no liability related to the costs of any clean up of the contamination and has made no provisionfor any costs other than those incurred to date to investigate the matter. Further, the Company believes that, to the extentthat there is liability and the Company incurs legal fees, Kerramerican and Black Hawk are liable pursuant to an indemnityagreement. Notwithstanding the Company’s belief that it has no liability, future litigation of the matter cannot be ruled outand as a result, the Company cannot determine the outcome of this matter at this time.
16. SEGMENTED INFORMATION ›
The Company’s activities are conducted in two geographic segments: Canada and the United States. All activities arerelated to stimulation and cementing services to the oil and gas industry.
United IntersegmentCanada States Eliminations Consolidated
$ $ $ $
2004
Revenue 213,854 27,525 – 241,379
Net income 45,435 195 – 45,630
Segmented assets 262,936 4,824 (1,564) 266,196
Capital expenditures 51,014 313 – 51,327
Goodwill 3,604 – – 3,604
2003
Revenue 141,530 15,424 (396) 156,558
Net income (loss) 20,718 (1,069) – 19,649
Segmented assets 129,348 2,790 (1,819) 130,319
Capital expenditures 24,514 208 – 24,722
Goodwill 3,276 – – 3,276
Note: Assets operated by Calfrac Well Services Corp. were acquired through a lease arrangement with Calfrac Well Services Ltd.
17. SUBSEQUENT EVENTS ›
On February 7, 2005, the shareholders of the Company voted in favour of a two-for-one subdivision of the Company’scommon shares. Upon completion of the share split, the Company will have 36,214,554 common shares outstanding.
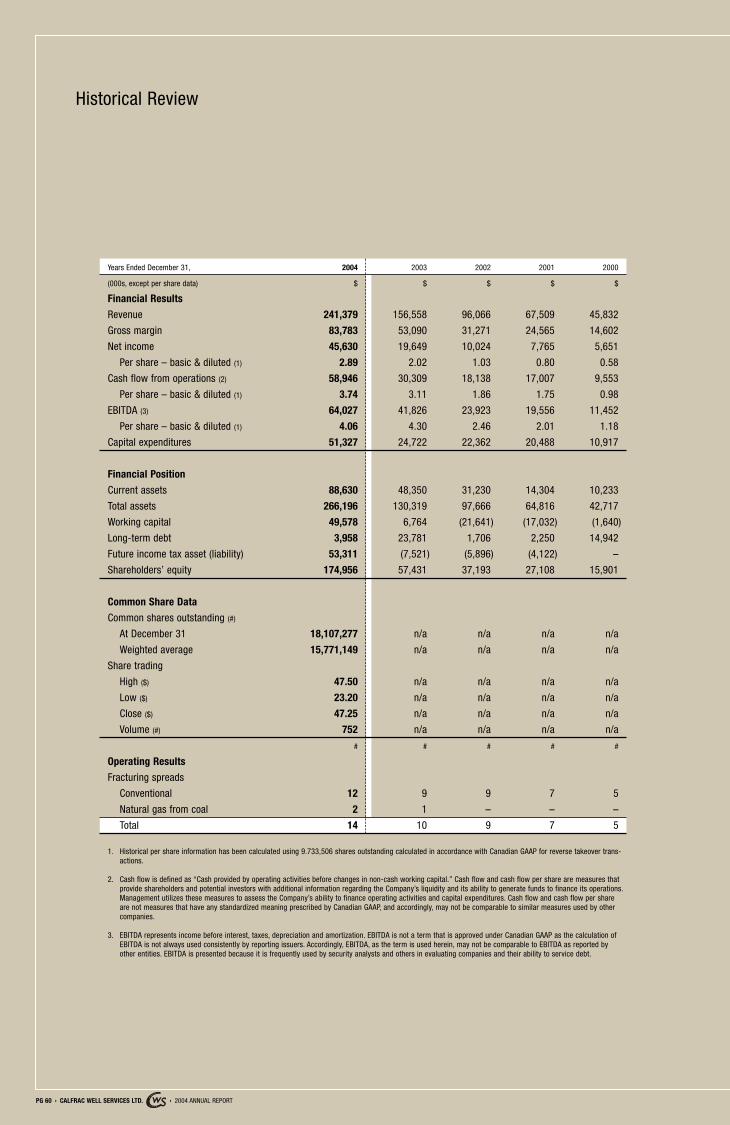
PG 60 › CALFRAC WELL SERVICES LTD. › 2004 ANNUAL REPORT
Historical Review
Years Ended December 31, 2004 2003 2002 2001 2000
(000s, except per share data) $ $ $ $ $
Financial Results
Revenue 241,379 156,558 96,066 67,509 45,832
Gross margin 83,783 53,090 31,271 24,565 14,602
Net income 45,630 19,649 10,024 7,765 5,651
Per share – basic & diluted (1) 2.89 2.02 1.03 0.80 0.58
Cash flow from operations (2) 58,946 30,309 18,138 17,007 9,553
Per share – basic & diluted (1) 3.74 3.11 1.86 1.75 0.98
EBITDA (3) 64,027 41,826 23,923 19,556 11,452
Per share – basic & diluted (1) 4.06 4.30 2.46 2.01 1.18
Capital expenditures 51,327 24,722 22,362 20,488 10,917
Financial Position
Current assets 88,630 48,350 31,230 14,304 10,233
Total assets 266,196 130,319 97,666 64,816 42,717
Working capital 49,578 6,764 (21,641) (17,032) (1,640)
Long-term debt 3,958 23,781 1,706 2,250 14,942
Future income tax asset (liability) 53,311 (7,521) (5,896) (4,122) –
Shareholders’ equity 174,956 57,431 37,193 27,108 15,901
Common Share Data
Common shares outstanding (#)
At December 31 18,107,277 n/a n/a n/a n/a
Weighted average 15,771,149 n/a n/a n/a n/a
Share trading
High ($) 47.50 n/a n/a n/a n/a
Low ($) 23.20 n/a n/a n/a n/a
Close ($) 47.25 n/a n/a n/a n/a
Volume (#) 752 n/a n/a n/a n/a
# # # # #
Operating Results
Fracturing spreads
Conventional 12 9 9 7 5
Natural gas from coal 2 1 – – –
Total 14 10 9 7 5
1. Historical per share information has been calculated using 9.733,506 shares outstanding calculated in accordance with Canadian GAAP for reverse takeover trans-actions.
2. Cash flow is defined as “Cash provided by operating activities before changes in non-cash working capital.” Cash flow and cash flow per share are measures thatprovide shareholders and potential investors with additional information regarding the Company’s liquidity and its ability to generate funds to finance its operations.Management utilizes these measures to assess the Company’s ability to finance operating activities and capital expenditures. Cash flow and cash flow per shareare not measures that have any standardized meaning prescribed by Canadian GAAP, and accordingly, may not be comparable to similar measures used by othercompanies.
3. EBITDA represents income before interest, taxes, depreciation and amortization. EBITDA is not a term that is approved under Canadian GAAP as the calculation ofEBITDA is not always used consistently by reporting issuers. Accordingly, EBITDA, as the term is used herein, may not be comparable to EBITDA as reported byother entities. EBITDA is presented because it is frequently used by security analysts and others in evaluating companies and their ability to service debt.
Corporate Information
OFFICERS ›
Douglas R. Ramsay President & Chief Executive Officer
Gordon A. DibbExecutive Vice President
Robert S. RobertsSenior Vice President & Chief Operating Officer
Donald R. BattenfelderVice President, Operations
Dwight M. BobierVice President, Technical Services
John L. GrisdaleVice President,Business Development
Stephen T. DadgeVice President, Corporate Service
Tom J. MedvedicVice President, Finance & Chief Financial Officer
Matthew L. MignaultController
HEAD OFFICE ›
Calfrac Well Services Ltd.411 Eighth Avenue S.W.Calgary, Alberta T2P 1E3Phone: (403) 266-6000Toll Free: 1-866-770-3722Fax: (403) 266-7381E-Mail: [email protected]: www.calfrac.com
OPERATING BASES ›
Alberta, CanadaCalgary – Head OfficeMedicine HatRed DeerGrande Prairie
Colorado, United StatesDenver – Regional OfficePlatteville
AUDITOR ›
PricewaterhouseCoopers LLPCalgary, Alberta
BANKER ›
HSBC Bank CanadaCalgary, Alberta
LEGAL COUNSEL ›
Bennett Jones LLPCalgary, Alberta
REGISTRAR AND TRANSFER AGENT ›
For information concerning lostshare certificates and estate transfers or for a change in shareregistration or address, please contact the transfer agent and registrar at 1-800-564-6253 or(403) 267-6800, or by e-mail [email protected], orwrite to:
Computershare Trust Company of CanadaSuite 600, 530 Eighth Avenue S.W.Calgary, Alberta T2P 3S8
STOCK EXCHANGE LISTING ›
Toronto Stock ExchangeTrading Symbol: CFW
ANNUAL MEETING ›
The Annual Meeting ofShareholders of Calfrac WellServices Ltd. will be held on May 12, 2005 at 3:30 p.m.(Calgary time) in the Turner ValleyRoom at the Fairmont PalliserHotel, Calgary, Alberta. All share-holders are cordially invited andencouraged to attend. Shareholderswho are unable to attend theMeeting are requested to completeand return the Instrument of Proxyto Computershare Trust Company of Canada at their earliest convenience.
Created by CORPORATE IMAGE MAKERS – CALGARY, ALBERTA \ Personnel Photography by MARK VITARIS PRODUCTIONS – CALGARY, ALBERTA
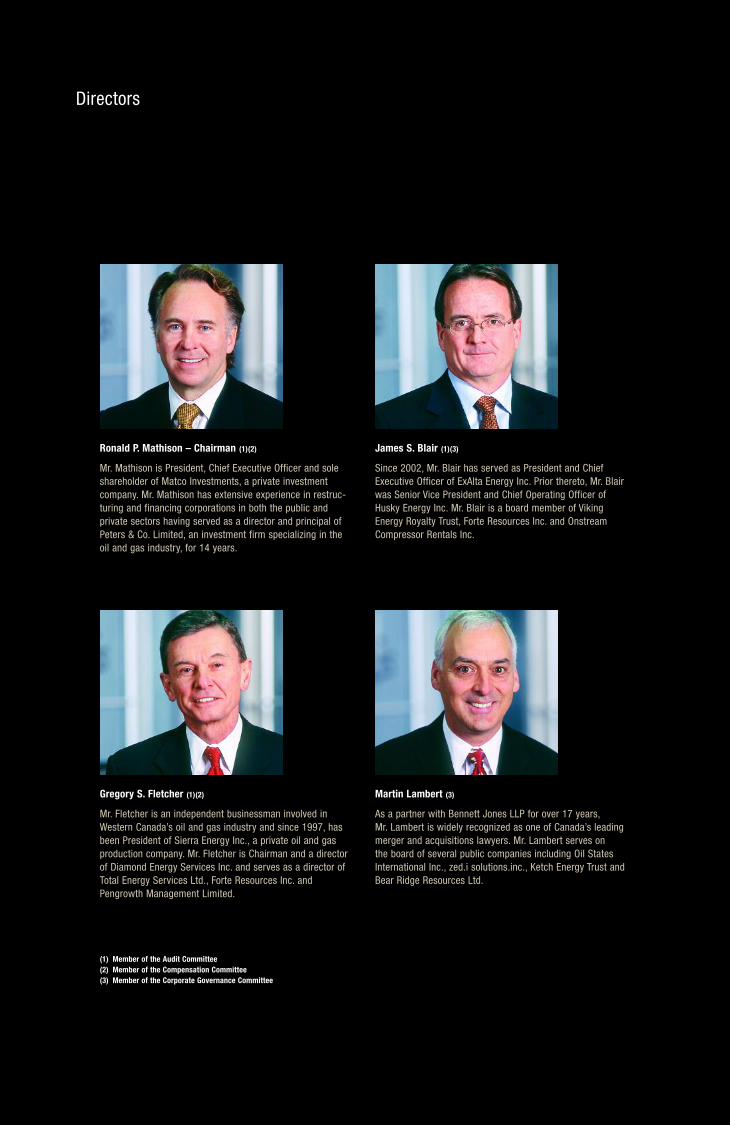
Directors
Ronald P. Mathison – Chairman (1)(2)
Mr. Mathison is President, Chief Executive Officer and soleshareholder of Matco Investments, a private investmentcompany. Mr. Mathison has extensive experience in restruc-turing and financing corporations in both the public and private sectors having served as a director and principal ofPeters & Co. Limited, an investment firm specializing in theoil and gas industry, for 14 years.
James S. Blair (1)(3)
Since 2002, Mr. Blair has served as President and ChiefExecutive Officer of ExAlta Energy Inc. Prior thereto, Mr. Blairwas Senior Vice President and Chief Operating Officer ofHusky Energy Inc. Mr. Blair is a board member of VikingEnergy Royalty Trust, Forte Resources Inc. and OnstreamCompressor Rentals Inc.
Gregory S. Fletcher (1)(2)
Mr. Fletcher is an independent businessman involved inWestern Canada’s oil and gas industry and since 1997, hasbeen President of Sierra Energy Inc., a private oil and gasproduction company. Mr. Fletcher is Chairman and a directorof Diamond Energy Services Inc. and serves as a director ofTotal Energy Services Ltd., Forte Resources Inc. andPengrowth Management Limited.
Martin Lambert (3)
As a partner with Bennett Jones LLP for over 17 years,Mr. Lambert is widely recognized as one of Canada’s leadingmerger and acquisitions lawyers. Mr. Lambert serves on the board of several public companies including Oil StatesInternational Inc., zed.i solutions.inc., Ketch Energy Trust andBear Ridge Resources Ltd.
(1) Member of the Audit Committee(2) Member of the Compensation Committee(3) Member of the Corporate Governance Committee
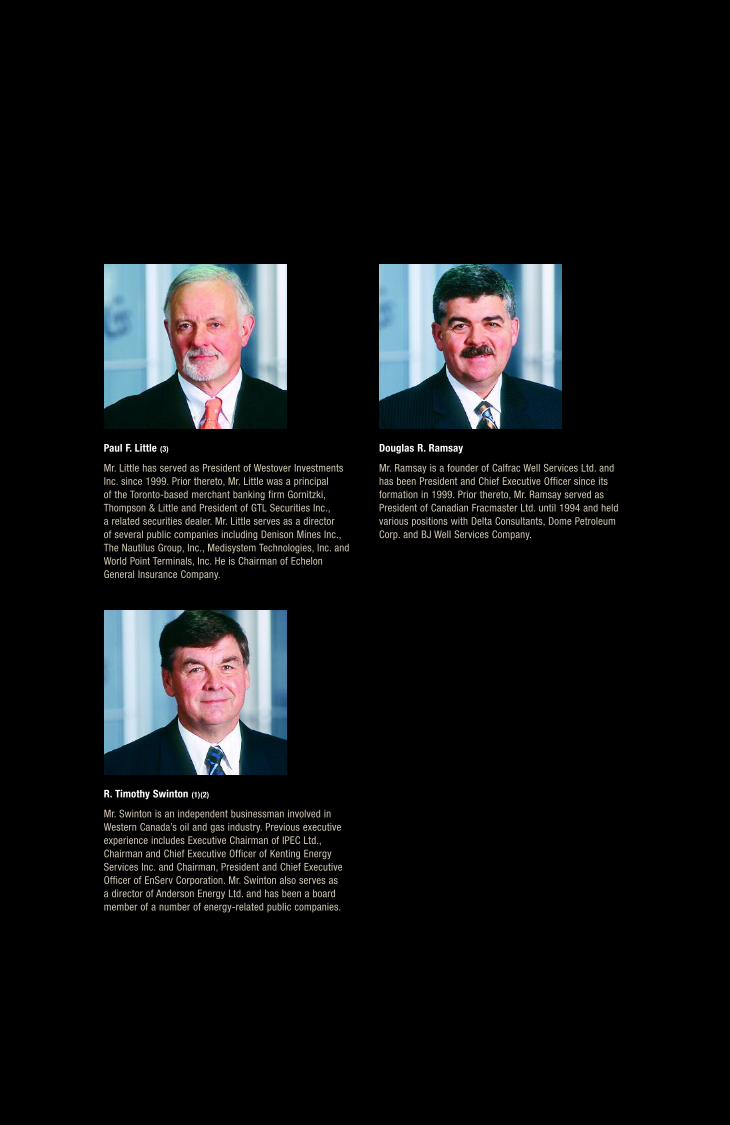
Paul F. Little (3)
Mr. Little has served as President of Westover InvestmentsInc. since 1999. Prior thereto, Mr. Little was a principal of the Toronto-based merchant banking firm Gornitzki,Thompson & Little and President of GTL Securities Inc.,a related securities dealer. Mr. Little serves as a director of several public companies including Denison Mines Inc.,The Nautilus Group, Inc., Medisystem Technologies, Inc. andWorld Point Terminals, Inc. He is Chairman of EchelonGeneral Insurance Company.
Douglas R. Ramsay
Mr. Ramsay is a founder of Calfrac Well Services Ltd. andhas been President and Chief Executive Officer since its formation in 1999. Prior thereto, Mr. Ramsay served asPresident of Canadian Fracmaster Ltd. until 1994 and heldvarious positions with Delta Consultants, Dome PetroleumCorp. and BJ Well Services Company.
R. Timothy Swinton (1)(2)
Mr. Swinton is an independent businessman involved inWestern Canada’s oil and gas industry. Previous executiveexperience includes Executive Chairman of IPEC Ltd.,Chairman and Chief Executive Officer of Kenting EnergyServices Inc. and Chairman, President and Chief ExecutiveOfficer of EnServ Corporation. Mr. Swinton also serves as a director of Anderson Energy Ltd. and has been a boardmember of a number of energy-related public companies.

www.calfrac.com


![COMPUTERSHARE TRUST COMPANY OF CANADAcalfrac.investorroom.com/download/Calfrac+-+Shareholder+Rights+… · COMPUTERSHARE TRUST COMPANY OF CANADA Dated as of [ ]1, 2020 1 ... 2.5 Execution,](https://img.pdfslide.us/doc/110x75/601a6821e12e5e0c597f55e3/computershare-trust-company-of-shareholderrights-computershare-trust-company.jpg)