Embed Size (px)
Citation preview


1897
Technologies of the future for the re-use of the past: the electrochromic glass.
D. Ludoni, G. Loddo, G. P. Cossu, M. Pittaluga Civil and Environment Engineering and Architecture Department, Cagliari University, Italy
ABSTRACT: The changing needs related to ecosustainability issues stimulate all actors of the construction process to the organization of envelopes and more efficient building systems. This performance must be required not only in new buildings, but also in the conversion of part of existing heritage. This re-using sustainable vision, must go through a careful analysis and selection of building materials and systems, related to them and their overall performance level of the building's energy performance must be achieved. The study concerns the city hall of Cagliari: a large Art Nouveau building, (1897-1914), characterized, on all facades, by the presence of large glazing surfaces. In the specific case study, it applies a computer simulation to compare the energetic performance of the current glazing system with those achieveble with the use of EC glass. Ultimate goal of research is the verification of the energy behavior and the level of indoor comfort reachable in traditional construction buildings with the application of innovative materials, combining the architectural value, functional recovery and environmental sustainability.
1 INTRODUCTION For years now the established success of sustainable design induces to organize more targeted building processes. This fact is conditioned by always -new and different needs, related to the difficult economic situation that, overall size, has strongly affected the construction industry. Sustainable design goes through a careful analysis and selection of building materials and their performance-related system functions that the building must comply.
This premise becomes a critical step in the, more and more frequently, recovery project and reuse of historic building heritage, designed and built in times very far from the standards and the energy input of eco sustainability. The central problem is then connected to the need to keep within these buildings, comfort conditions and, together, to limit energy consumption that is essential to their maintenance. This requirement is necessary in order that the work of conver-sion becomes economically comparable to the historical and architectural value of the building.
Many studies and research on energy issues have now validated the argument that 47% of heat loss in a building envelope occurs through the transparent surfaces. It 'obvious then re-search, with parallel study of the thermal performance of building elements, should point at the testing of glazing elements can reversibly change the thermal characteristics, depending on the requirement specification. For several years, our research group is concerned with innovative materials in the field of saving energy, with particular interest in building transparent compo-nents, most of all, electrochromic glass (EC). The EC glass are able to modify, to user com-mand, the intensity of colouring of the glass itself which, passing from the light state to the fully
1898
tinted state, can screen 97% of the visible light transmission and 99% of the incoming solar ra-diation.
This change in colour gradation occurs through a reversible chemical process of oxidation-reduction that appreciably changes, and in a dynamic way, the factor g (Solar Heat Gain Coeffi-cient) and it allows, at the same time, to maintain the visibility and the outdoor relationship.
Experiences of EC glass, are conducted in parallel, both conducting experimentations on a 1:1 scale model test, and simulation, with the help of specific software on existing buildings, historical or otherwise, to verify the energetic performance in envelopes with design features not conforming to current standards. This will, ultimately, to assess the possibility of redevel-opment of the built heritage of our cities, in a more wide view of recovery of the already con-structed.
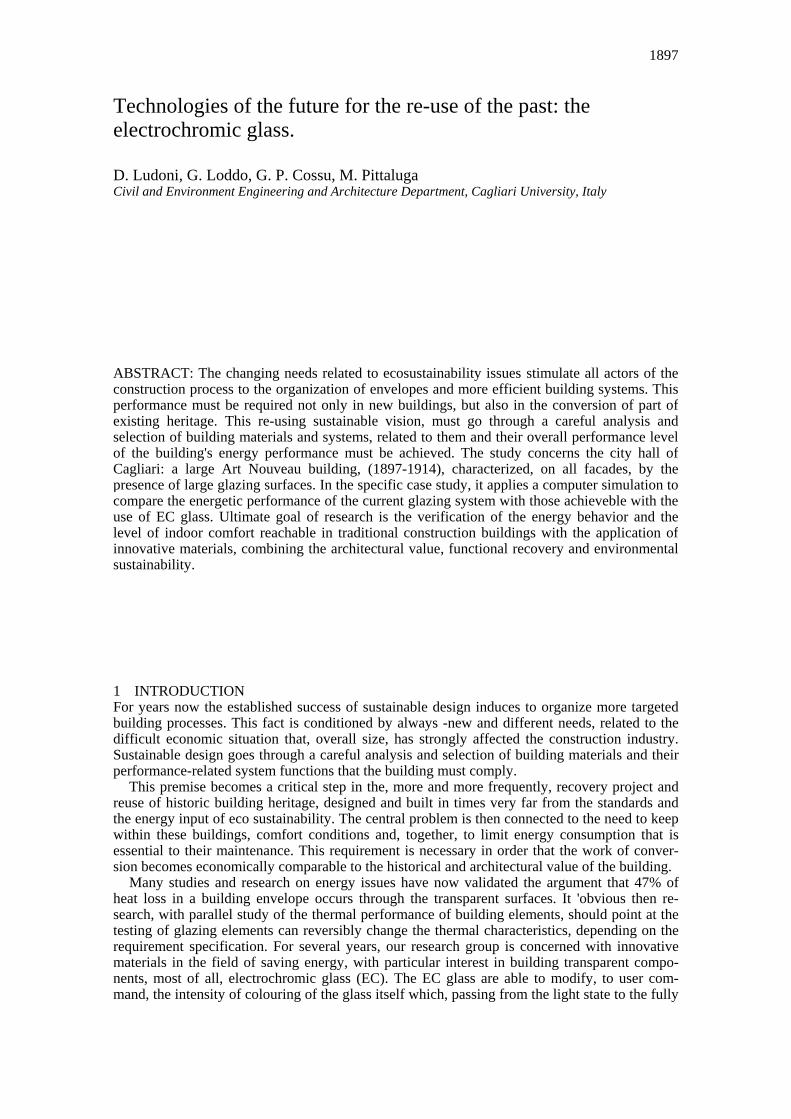
The present study concerns the city hall building of Cagliari (Fig.1). The construction, Art Nouveau (1897-1914), of considerable size, is characterized, on all façades, by large window surfaces. The current system causes, because of the intense sunshine, under great un-comfort in the workplace.
Figure 1. The city hall building façade and detail.
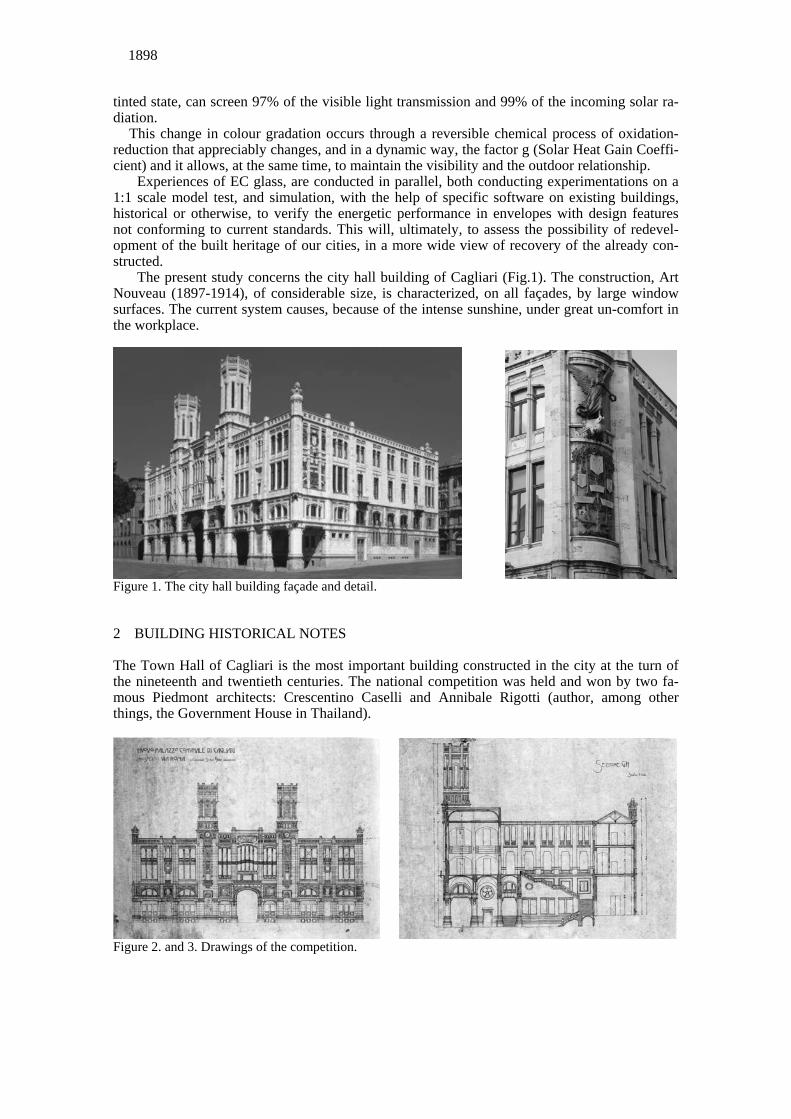
2 BUILDING HISTORICAL NOTES The Town Hall of Cagliari is the most important building constructed in the city at the turn of the nineteenth and twentieth centuries. The national competition was held and won by two fa-mous Piedmont architects: Crescentino Caselli and Annibale Rigotti (author, among other things, the Government House in Thailand).
Figure 2. and 3. Drawings of the competition.
1899
The building occupies an entire block and measures about 65 x 40 m., the foundation stone was laid in the 1899 year, in the presence of the King of Italy Umberto I and Margherita Queen of Savoy. The building was initially too large for the needs of the city, which then had about 70,000 inhabitants; it could hold even a collection of Malaysian art and zoological museum. The building is a good example of eclectic style (Fig. 2, 3, 4) in which different architectural lan-guages are used: from the classical one to the medieval Catalan Gothic with clear influences of the emerging Liberty, and particular reference to Victor Horta. The volume is developed around the perimeter of the lot, an area of 2,400 square meters, while the centre is a large courtyard which, in the original project was planned to cover with a glass skylight. It took eight years to carry out building work and a further seven years for the finishing and decoration. The structure is made of local stone, the cladding façades is a white limestone slab, while the baseboard is in Sardinian dark gray granite. Particularly interesting is the whole exterior decoration, bronze coating, with allegories that represent agriculture, industry and commerce. At four vertices, on columns, blindfolded Moorishes of the Sardinian flag are carved. Inside, despite the severe damage suffered during the bombing of the Second War, frescoes and paintings by local artists are still preserved. (Fig. 5)
Even today, in addition to hosting offices, plays a role in representing and meetings of the City Council are held there.
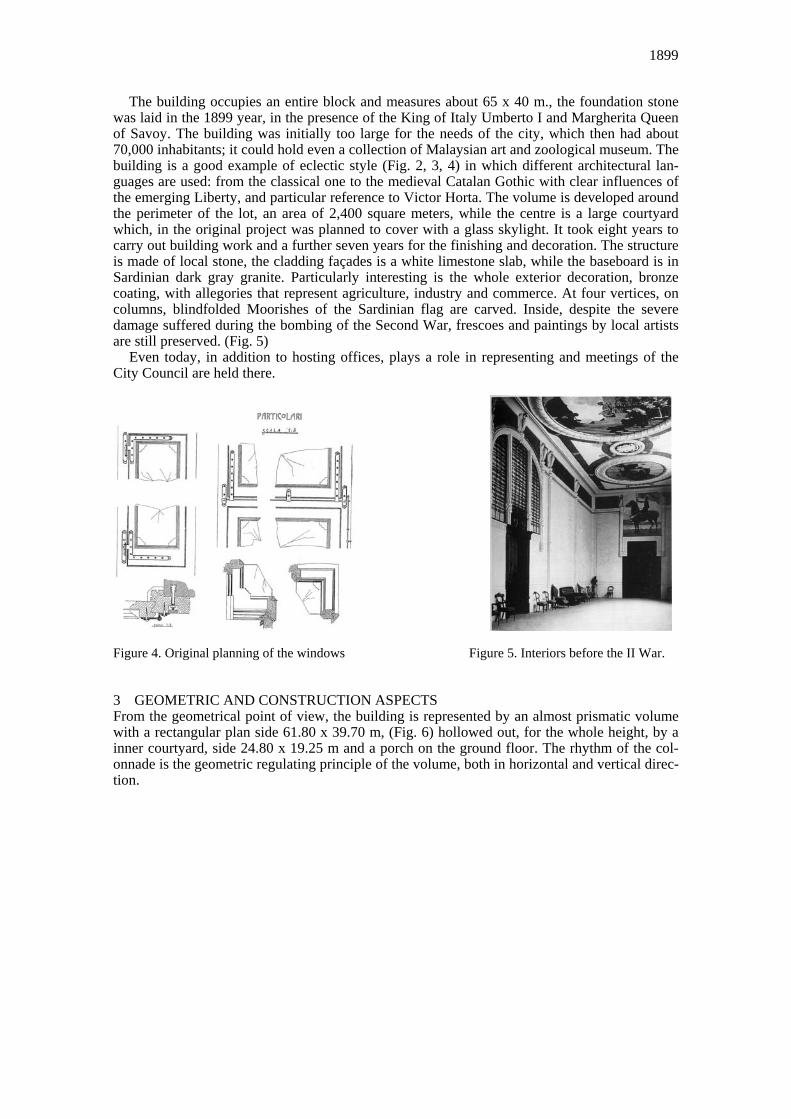
Figure 4. Original planning of the windows Figure 5. Interiors before the II War.
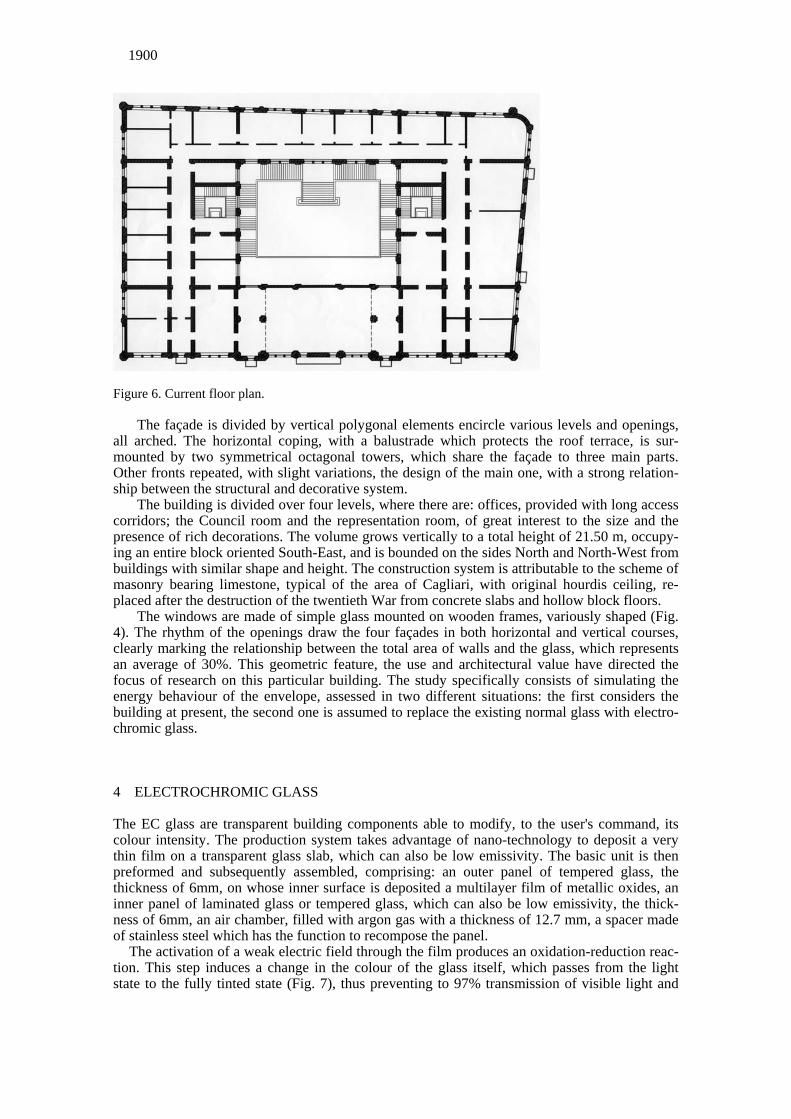
3 GEOMETRIC AND CONSTRUCTION ASPECTS From the geometrical point of view, the building is represented by an almost prismatic volume with a rectangular plan side 61.80 x 39.70 m, (Fig. 6) hollowed out, for the whole height, by a inner courtyard, side 24.80 x 19.25 m and a porch on the ground floor. The rhythm of the col-onnade is the geometric regulating principle of the volume, both in horizontal and vertical direc-tion.
1900
Figure 6. Current floor plan.
The façade is divided by vertical polygonal elements encircle various levels and openings, all arched. The horizontal coping, with a balustrade which protects the roof terrace, is sur-mounted by two symmetrical octagonal towers, which share the façade to three main parts. Other fronts repeated, with slight variations, the design of the main one, with a strong relation-ship between the structural and decorative system.
The building is divided over four levels, where there are: offices, provided with long access corridors; the Council room and the representation room, of great interest to the size and the presence of rich decorations. The volume grows vertically to a total height of 21.50 m, occupy-ing an entire block oriented South-East, and is bounded on the sides North and North-West from buildings with similar shape and height. The construction system is attributable to the scheme of masonry bearing limestone, typical of the area of Cagliari, with original hourdis ceiling, re-placed after the destruction of the twentieth War from concrete slabs and hollow block floors.
The windows are made of simple glass mounted on wooden frames, variously shaped (Fig. 4). The rhythm of the openings draw the four façades in both horizontal and vertical courses, clearly marking the relationship between the total area of walls and the glass, which represents an average of 30%. This geometric feature, the use and architectural value have directed the focus of research on this particular building. The study specifically consists of simulating the energy behaviour of the envelope, assessed in two different situations: the first considers the building at present, the second one is assumed to replace the existing normal glass with electro-chromic glass.
4 ELECTROCHROMIC GLASS The EC glass are transparent building components able to modify, to the user's command, its colour intensity. The production system takes advantage of nano-technology to deposit a very thin film on a transparent glass slab, which can also be low emissivity. The basic unit is then preformed and subsequently assembled, comprising: an outer panel of tempered glass, the thickness of 6mm, on whose inner surface is deposited a multilayer film of metallic oxides, an inner panel of laminated glass or tempered glass, which can also be low emissivity, the thick-ness of 6mm, an air chamber, filled with argon gas with a thickness of 12.7 mm, a spacer made of stainless steel which has the function to recompose the panel.
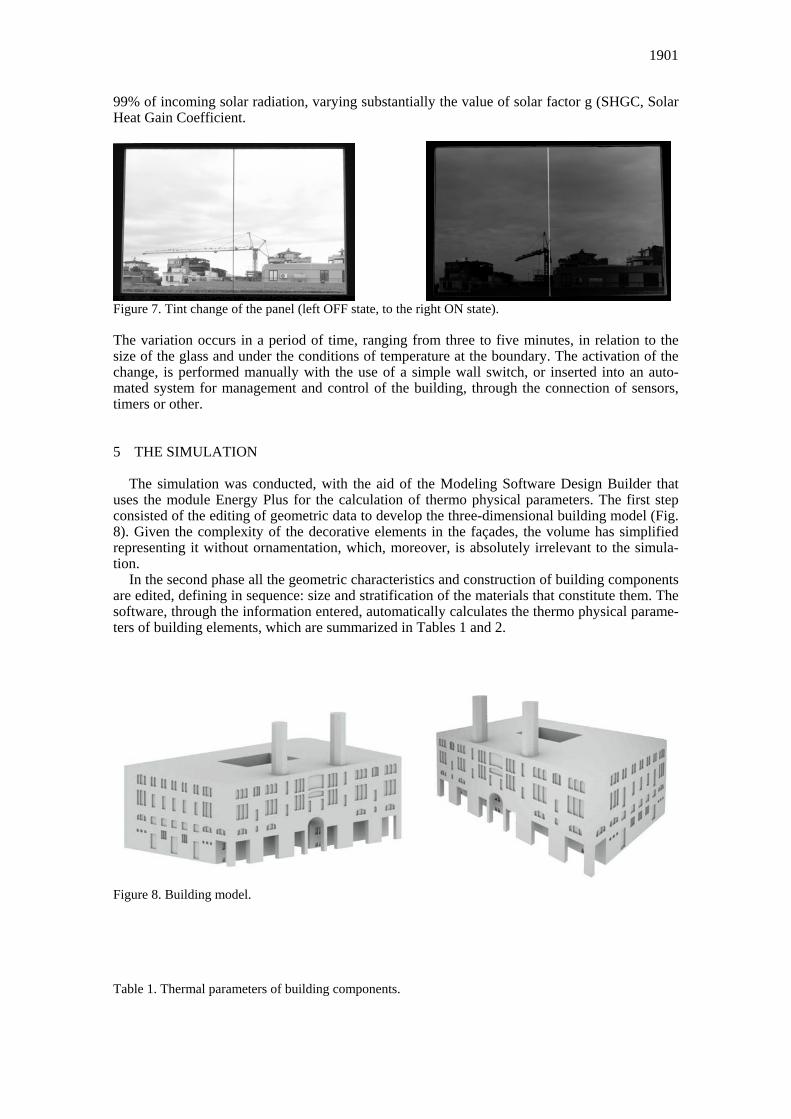
The activation of a weak electric field through the film produces an oxidation-reduction reac-tion. This step induces a change in the colour of the glass itself, which passes from the light state to the fully tinted state (Fig. 7), thus preventing to 97% transmission of visible light and
1901
99% of incoming solar radiation, varying substantially the value of solar factor g (SHGC, Solar Heat Gain Coefficient.
Figure 7. Tint change of the panel (left OFF state, to the right ON state). The variation occurs in a period of time, ranging from three to five minutes, in relation to the size of the glass and under the conditions of temperature at the boundary. The activation of the change, is performed manually with the use of a simple wall switch, or inserted into an auto-mated system for management and control of the building, through the connection of sensors, timers or other.
5 THE SIMULATION
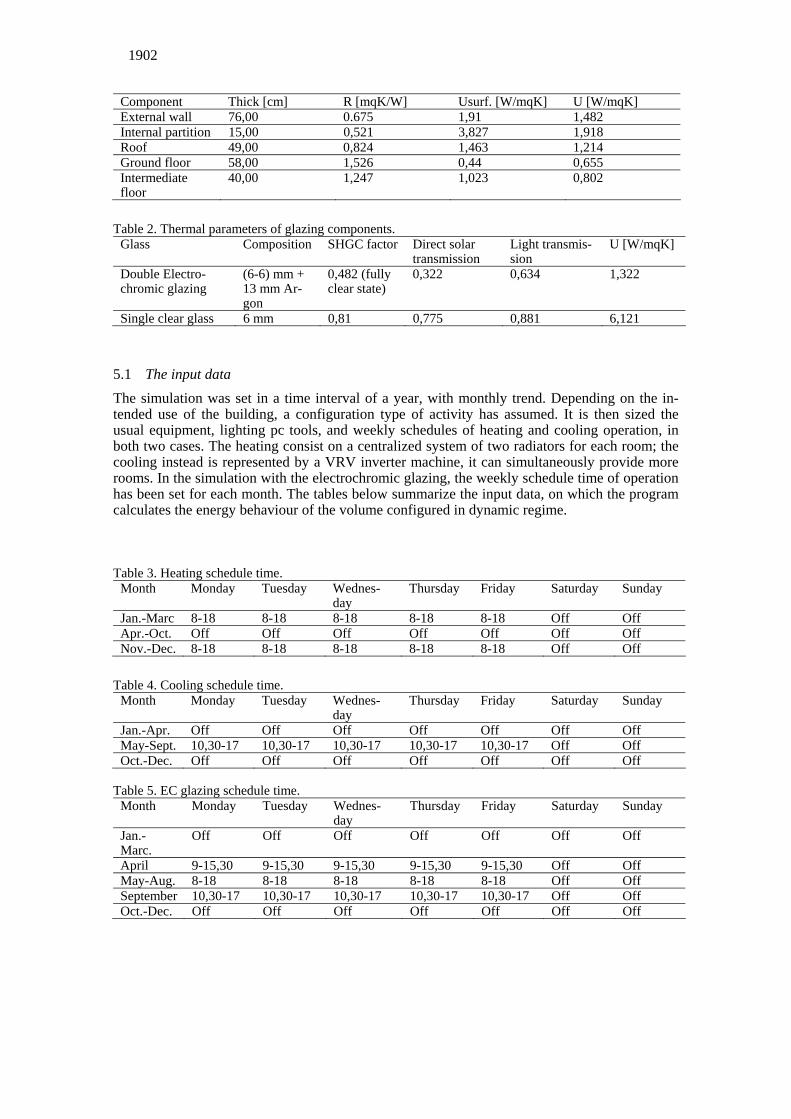
The simulation was conducted, with the aid of the Modeling Software Design Builder that uses the module Energy Plus for the calculation of thermo physical parameters. The first step consisted of the editing of geometric data to develop the three-dimensional building model (Fig. 8). Given the complexity of the decorative elements in the façades, the volume has simplified representing it without ornamentation, which, moreover, is absolutely irrelevant to the simula-tion.
In the second phase all the geometric characteristics and construction of building components are edited, defining in sequence: size and stratification of the materials that constitute them. The software, through the information entered, automatically calculates the thermo physical parame-ters of building elements, which are summarized in Tables 1 and 2.
Figure 8. Building model.
T able 1. Thermal parameters of building components.
1902
Component Thick [cm] R [mqK/W] Usurf. [W/mqK] U [W/mqK] External wall 76,00 0.675 1,91 1,482 Internal partition 15,00 0,521 3,827 1,918 Roof 49,00 0,824 1,463 1,214 Ground floor 58,00 1,526 0,44 0,655 Intermediate floor
40,00 1,247 1,023 0,802 Table 2. Thermal parameters of glazing components.
Glass Composition SHGC factor Direct solar transmission
Light transmis-sion
U [W/mqK]
Double Electro-chromic glazing
(6-6) mm + 13 mm Ar-gon
0,482 (fully clear state)
0,322 0,634 1,322
Single clear glass 6 mm 0,81 0,775 0,881 6,121
5.1 The input data The simulation was set in a time interval of a year, with monthly trend. Depending on the in-tended use of the building, a configuration type of activity has assumed. It is then sized the usual equipment, lighting pc tools, and weekly schedules of heating and cooling operation, in both two cases. The heating consist on a centralized system of two radiators for each room; the cooling instead is represented by a VRV inverter machine, it can simultaneously provide more rooms. In the simulation with the electrochromic glazing, the weekly schedule time of operation has been set for each month. The tables below summarize the input data, on which the program calculates the energy behaviour of the volume configured in dynamic regime.
Table 3. Heating schedule time. Month Monday Tuesday Wednes-
day Thursday Friday Saturday Sunday
Jan.-Marc 8-18 8-18 8-18 8-18 8-18 Off Off Apr.-Oct. Off Off Off Off Off Off Off Nov.-Dec. 8-18 8-18 8-18 8-18 8-18 Off Off
Table 4. Cooling schedule time.
Month Monday Tuesday Wednes-day
Thursday Friday Saturday Sunday
Jan.-Apr. Off Off Off Off Off Off Off May-Sept. 10,30-17 10,30-17 10,30-17 10,30-17 10,30-17 Off Off Oct.-Dec. Off Off Off Off Off Off Off
Table 5. EC glazing schedule time.
Month Monday Tuesday Wednes-day
Thursday Friday Saturday Sunday
Jan.-Marc.
Off Off Off Off Off Off Off
April 9-15,30 9-15,30 9-15,30 9-15,30 9-15,30 Off Off May-Aug. 8-18 8-18 8-18 8-18 8-18 Off Off September 10,30-17 10,30-17 10,30-17 10,30-17 10,30-17 Off Off Oct.-Dec. Off Off Off Off Off Off Off
1903
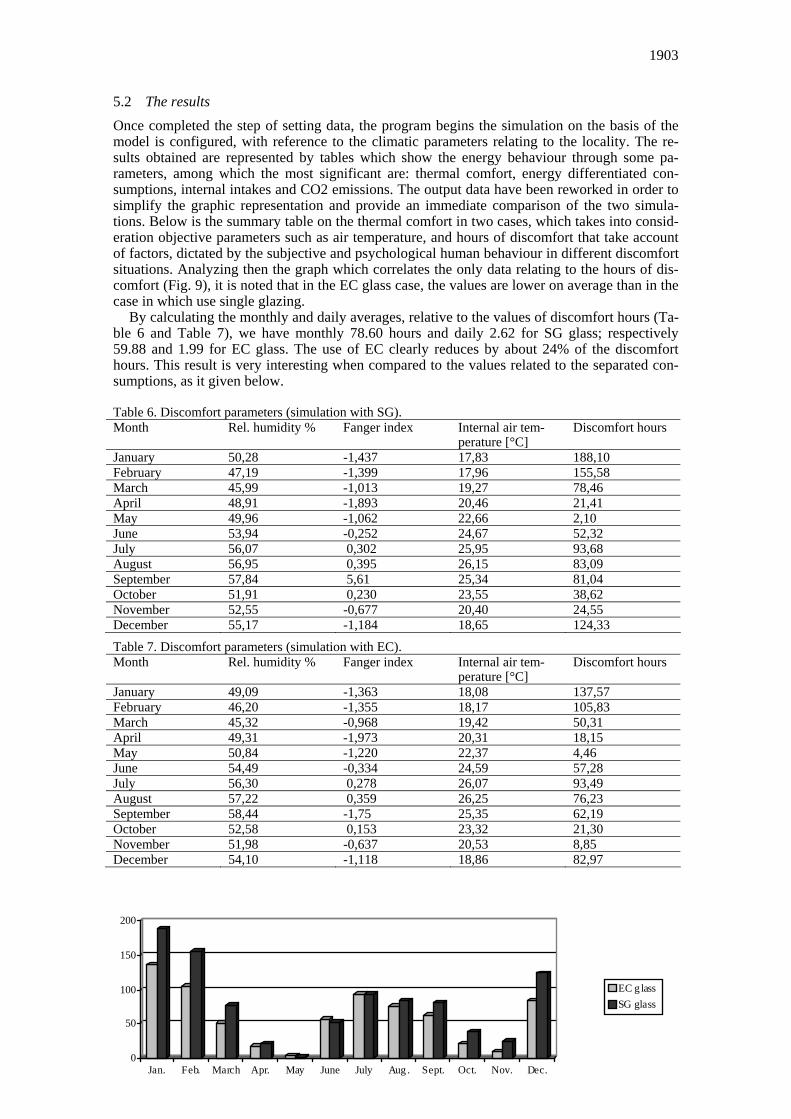
5.2 The results Once completed the step of setting data, the program begins the simulation on the basis of the model is configured, with reference to the climatic parameters relating to the locality. The re-sults obtained are represented by tables which show the energy behaviour through some pa-rameters, among which the most significant are: thermal comfort, energy differentiated con-sumptions, internal intakes and CO2 emissions. The output data have been reworked in order to simplify the graphic representation and provide an immediate comparison of the two simula-tions. Below is the summary table on the thermal comfort in two cases, which takes into consid-eration objective parameters such as air temperature, and hours of discomfort that take account of factors, dictated by the subjective and psychological human behaviour in different discomfort situations. Analyzing then the graph which correlates the only data relating to the hours of dis-comfort (Fig. 9), it is noted that in the EC glass case, the values are lower on average than in the case in which use single glazing.
By calculating the monthly and daily averages, relative to the values of discomfort hours (Ta-ble 6 and Table 7), we have monthly 78.60 hours and daily 2.62 for SG glass; respectively 59.88 and 1.99 for EC glass. The use of EC clearly reduces by about 24% of the discomfort hours. This result is very interesting when compared to the values related to the separated con-sumptions, as it given below.
Table 6. Discomfort parameters (simulation with SG). Month Rel. humidity % Fanger index Internal air tem-
perature [°C] Discomfort hours
January 50,28 -1,437 17,83 188,10 February 47,19 -1,399 17,96 155,58 March 45,99 -1,013 19,27 78,46 April 48,91 -1,893 20,46 21,41 May 49,96 -1,062 22,66 2,10 June 53,94 -0,252 24,67 52,32 July 56,07 0,302 25,95 93,68 August 56,95 0,395 26,15 83,09 September 57,84 5,61 25,34 81,04 October 51,91 0,230 23,55 38,62 November 52,55 -0,677 20,40 24,55 December 55,17 -1,184 18,65 124,33 Table 7. Discomfort parameters (simulation with EC). Month Rel. humidity % Fanger index Internal air tem-
perature [°C] Discomfort hours
January 49,09 -1,363 18,08 137,57 February 46,20 -1,355 18,17 105,83 March 45,32 -0,968 19,42 50,31 April 49,31 -1,973 20,31 18,15 May 50,84 -1,220 22,37 4,46 June 54,49 -0,334 24,59 57,28 July 56,30 0,278 26,07 93,49 August 57,22 0,359 26,25 76,23 September 58,44 -1,75 25,35 62,19 October 52,58 0,153 23,32 21,30 November 51,98 -0,637 20,53 8,85 December 54,10 -1,118 18,86 82,97
0
50
100
150
200
Jan. Feb. March Apr. May June July Aug . Sept. Oct. Nov. Dec.
EC g lassSG glass
1904
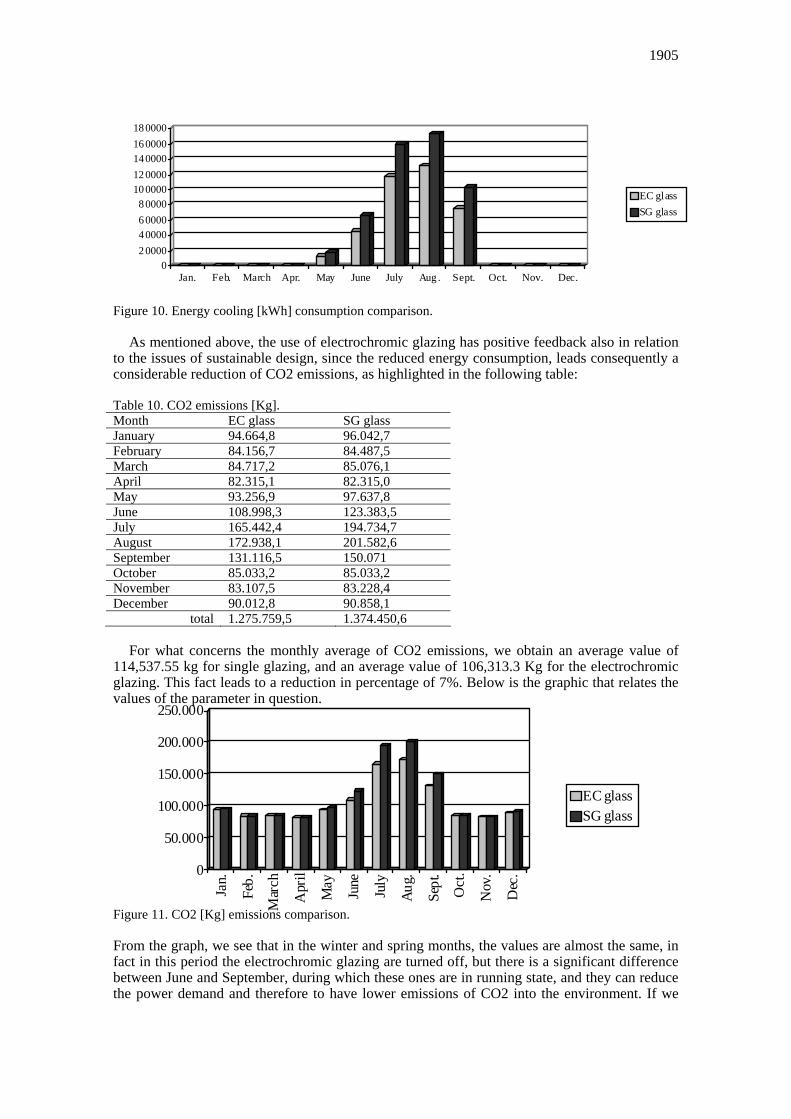
Figure 9. Discomfort hours comparison It 'interesting to note that consumptions, which are not influenced by the envelopes’ characteris-tics and its constructive elements, remain unchanged, while there are considerable variations as regards the consumption of energy used for cooling, in which the use of electrochromic glazing reduces these values by 27% compared to the case of single glazing (Fig. 10). The values of consumption for heating reduced in a less evident way, because the gain, due to the contribution of solar radiant energy, is greater in the case of single glazing. In the case of EC, the lower gain, due to the contribution of radiant energy, is compensated by the lower dispersion of heat flow, due to the good performance of double glazing. Deepening the analysis, it appears, finally, that the reduction of energy is reflected positively in terms of costs, internal intakes, and not least of reductions in CO2 emissions in the environment. If we would to extrapolate the speech to the activity and use of the building, we can say that a higher comfort in the workplace positively reflects in terms of psychological well-being of users, thus increased efficiency and productiv-ity.
Table 8. Consumptions (simulation with SG). Month Aux. Energy [kWh] Boiler [kWh] Chiller [kWh] Lighting [kWh] January 14.007,29 17.072,74 0 34.754,54 February 15.508,07 12.108,16 0 30.397,97 March 15.507,81 7.410,473 0 32.186,37 April 15.508,07 0 0 33.302,05 May 15.507,81 0 18.400,77 34.754,54 June 15.508,07 0 67,301,8 30.733,88 July 15.508,07 0 159.647,8 34.754,54 August 15.507,81 0 173.192,9 33.470,45 September 15.508,07 0 103.213,7 32.017,96 October 15.507,81 0 0 34.754,54 November 15.508,07 4.381,22 0 32.017,96 December 15.508,07 12.03,13 0 33.470,45 Table 9 Consumptions (simulation with EC). Month Aux. Energy [kWh] Boiler [kWh] Chiller [kWh] Lighting [kWh] January 14.007,29 15.061,24 0 34.754,54 February 15.508,07 11.625,23 0 30.397,97 March 15.507,81 6.886,561 0 32.186,37 April 15.508,07 0 0 33.302,05 May 15.507,81 0 12.005,37 34.754,54 June 15.508,07 0 46.301,55 30.733,88 July 15.508,07 0 116.885,4 34.754,54 August 15.507,81 0 131.376,2 33.470,45 September 15.508,07 0 75.542,91 32.017,96 October 15.507,81 0 0 34.754,54 November 15.508,07 4.204,681 0 32.017,96 December 15.508,07 11.069,18 0 33.470,45 Below is the graphic for the comparison, in two cases of simulation, the energy consumption required for the cooling system. This allows us to highlight what the above said.
1905
02 00004 00006 00008 0000
10 000012 000014 000016 000018 0000
Jan. Feb. March Apr. May June July Aug . Sept. Oct. Nov. Dec.
EC glass SG glass
Figure 10. Energy cooling [kWh] consumption comparison.
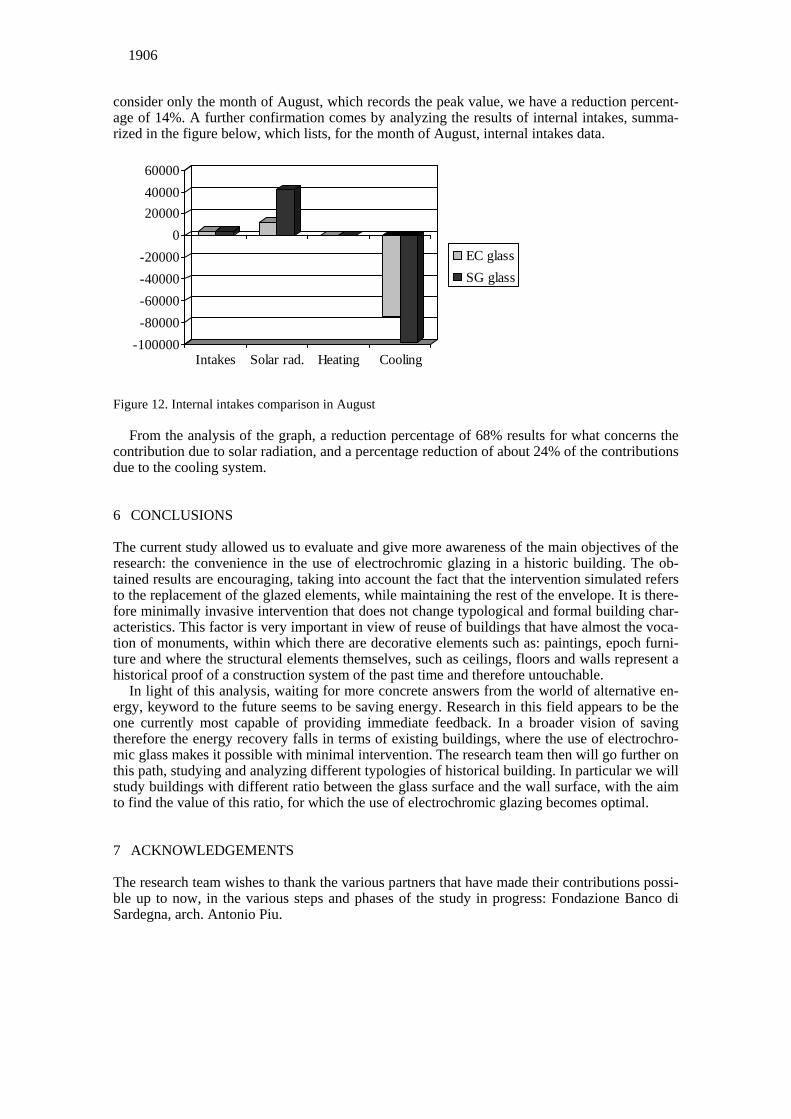
As mentioned above, the use of electrochromic glazing has positive feedback also in relation to the issues of sustainable design, since the reduced energy consumption, leads consequently a considerable reduction of CO2 emissions, as highlighted in the following table: Table 10. CO2 emissions [Kg]. Month EC glass SG glass January 94.664,8 96.042,7 February 84.156,7 84.487,5 March 84.717,2 85.076,1 April 82.315,1 82.315,0 May 93.256,9 97.637,8 June 108.998,3 123.383,5 July 165.442,4 194.734,7 August 172.938,1 201.582,6 September 131.116,5 150.071 October 85.033,2 85.033,2 November 83.107,5 83.228,4 December 90.012,8 90.858,1
total 1.275.759,5 1.374.450,6
For what concerns the monthly average of CO2 emissions, we obtain an average value of 114,537.55 kg for single glazing, and an average value of 106,313.3 Kg for the electrochromic glazing. This fact leads to a reduction in percentage of 7%. Below is the graphic that relates the values of the parameter in question. Figure 11. CO2 [Kg] emissions comparison.
0
50.000
100.000
150.000
200.000
250.000
Jan.
Feb.
Mar
ch
Apr
il
May
June
July
Aug.
Sept
.
Oct
.
Nov
.
Dec
.
EC glassSG glass
From the graph, we see that in the winter and spring months, the values are almost the same, in fact in this period the electrochromic glazing are turned off, but there is a significant difference between June and September, during which these ones are in running state, and they can reduce the power demand and therefore to have lower emissions of CO2 into the environment. If we
1906
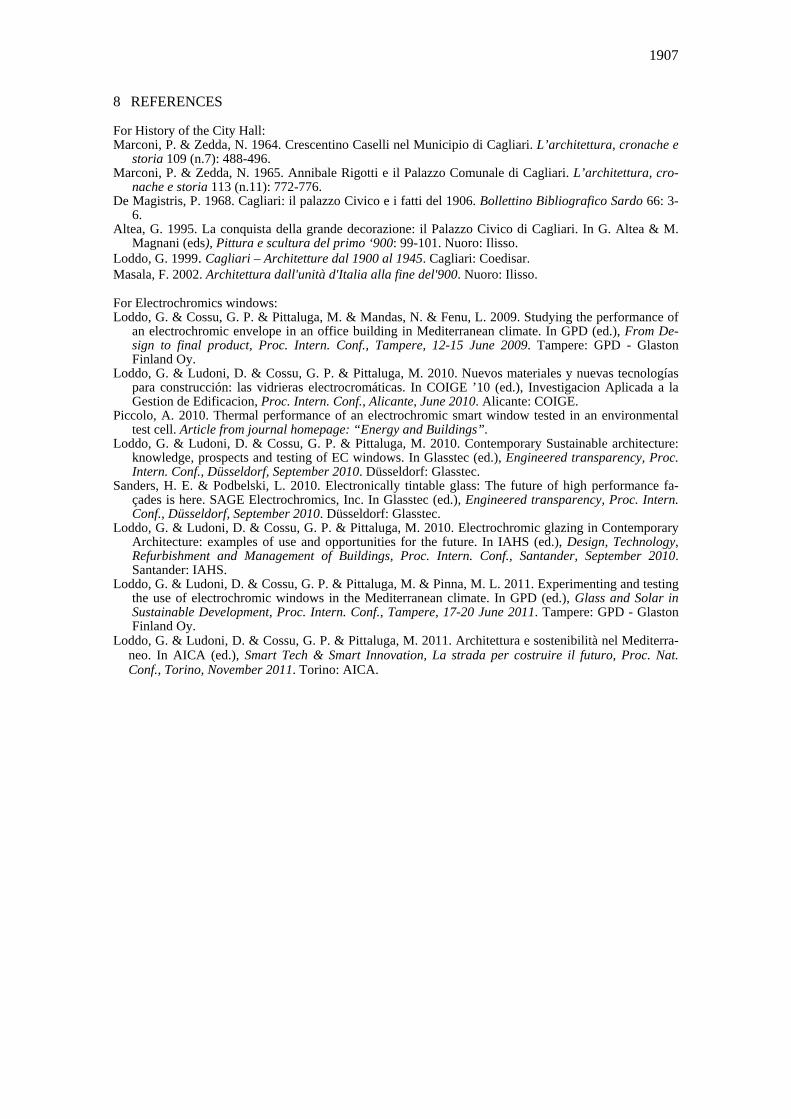
consider only the month of August, which records the peak value, we have a reduction percent-age of 14%. A further confirmation comes by analyzing the results of internal intakes, summa-rized in the figure below, which lists, for the month of August, internal intakes data.
-100000-80000-60000-40000-20000
0200004000060000
Intakes Solar rad. Heating Cooling
EC glassSG glass
Figure 12. Internal intakes comparison in August
From the analysis of the graph, a reduction percentage of 68% results for what concerns the contribution due to solar radiation, and a percentage reduction of about 24% of the contributions due to the cooling system.
6 CONCLUSIONS The current study allowed us to evaluate and give more awareness of the main objectives of the research: the convenience in the use of electrochromic glazing in a historic building. The ob-tained results are encouraging, taking into account the fact that the intervention simulated refers to the replacement of the glazed elements, while maintaining the rest of the envelope. It is there-fore minimally invasive intervention that does not change typological and formal building char-acteristics. This factor is very important in view of reuse of buildings that have almost the voca-tion of monuments, within which there are decorative elements such as: paintings, epoch furni-ture and where the structural elements themselves, such as ceilings, floors and walls represent a historical proof of a construction system of the past time and therefore untouchable.
In light of this analysis, waiting for more concrete answers from the world of alternative en-ergy, keyword to the future seems to be saving energy. Research in this field appears to be the one currently most capable of providing immediate feedback. In a broader vision of saving therefore the energy recovery falls in terms of existing buildings, where the use of electrochro-mic glass makes it possible with minimal intervention. The research team then will go further on this path, studying and analyzing different typologies of historical building. In particular we will study buildings with different ratio between the glass surface and the wall surface, with the aim to find the value of this ratio, for which the use of electrochromic glazing becomes optimal.
7 ACKNOWLEDGEMENTS The research team wishes to thank the various partners that have made their contributions possi-ble up to now, in the various steps and phases of the study in progress: Fondazione Banco di Sardegna, arch. Antonio Piu.
1907
8 REFERENCES For History of the City Hall: Marconi, P. & Zedda, N. 1964. Crescentino Caselli nel Municipio di Cagliari. L’architettura, cronache e
storia 109 (n.7): 488-496. Marconi, P. & Zedda, N. 1965. Annibale Rigotti e il Palazzo Comunale di Cagliari. L’architettura, cro-
nache e storia 113 (n.11): 772-776. De Magistris, P. 1968. Cagliari: il palazzo Civico e i fatti del 1906. Bollettino Bibliografico Sardo 66: 3-
6. Altea, G. 1995. La conquista della grande decorazione: il Palazzo Civico di Cagliari. In G. Altea & M.
Magnani (eds), Pittura e scultura del primo ‘900: 99-101. Nuoro: Ilisso. Loddo, G. 1999. Cagliari – Architetture dal 1900 al 1945. Cagliari: Coedisar. Masala, F. 2002. Architettura dall'unità d'Italia alla fine del'900. Nuoro: Ilisso. For Electrochromics windows: Loddo, G. & Cossu, G. P. & Pittaluga, M. & Mandas, N. & Fenu, L. 2009. Studying the performance of
an electrochromic envelope in an office building in Mediterranean climate. In GPD (ed.), From De-sign to final product, Proc. Intern. Conf., Tampere, 12-15 June 2009. Tampere: GPD - Glaston Finland Oy.
Loddo, G. & Ludoni, D. & Cossu, G. P. & Pittaluga, M. 2010. Nuevos materiales y nuevas tecnologías para construcción: las vidrieras electrocromáticas. In COIGE ’10 (ed.), Investigacion Aplicada a la Gestion de Edificacion, Proc. Intern. Conf., Alicante, June 2010. Alicante: COIGE.
Piccolo, A. 2010. Thermal performance of an electrochromic smart window tested in an environmental test cell. Article from journal homepage: “Energy and Buildings”.
Loddo, G. & Ludoni, D. & Cossu, G. P. & Pittaluga, M. 2010. Contemporary Sustainable architecture: knowledge, prospects and testing of EC windows. In Glasstec (ed.), Engineered transparency, Proc. Intern. Conf., Düsseldorf, September 2010. Düsseldorf: Glasstec.
Sanders, H. E. & Podbelski, L. 2010. Electronically tintable glass: The future of high performance fa-çades is here. SAGE Electrochromics, Inc. In Glasstec (ed.), Engineered transparency, Proc. Intern. Conf., Düsseldorf, September 2010. Düsseldorf: Glasstec.
Loddo, G. & Ludoni, D. & Cossu, G. P. & Pittaluga, M. 2010. Electrochromic glazing in Contemporary Architecture: examples of use and opportunities for the future. In IAHS (ed.), Design, Technology, Refurbishment and Management of Buildings, Proc. Intern. Conf., Santander, September 2010. Santander: IAHS.
Loddo, G. & Ludoni, D. & Cossu, G. P. & Pittaluga, M. & Pinna, M. L. 2011. Experimenting and testing the use of electrochromic windows in the Mediterranean climate. In GPD (ed.), Glass and Solar in Sustainable Development, Proc. Intern. Conf., Tampere, 17-20 June 2011. Tampere: GPD - Glaston Finland Oy.
Loddo, G. & Ludoni, D. & Cossu, G. P. & Pittaluga, M. 2011. Architettura e sostenibilità nel Mediterra-neo. In AICA (ed.), Smart Tech & Smart Innovation, La strada per costruire il futuro, Proc. Nat. Conf., Torino, November 2011. Torino: AICA.