Embed Size (px)
Citation preview
Ceat Ltd is part of the RPG group and is the fourth largest tyre manufacturer in India with Domestic market share of 11.0% during FY 2010. The company sold 8.9 mn tyres during FY 2010 achieving growth of 19.2% over FY 2009 volumes. Ceat has good brand equity and has presence in Domestic and Export markets. Promising Auto Industry growth outlook to boost demand for tyres During April 10 to Feb 11, the Domestic Auto Sales registered 26.9% y‐o‐y volume growth and exports volumes grew 30.6% y‐o‐y during the same period. As per Society of Indian Automobile Manufacturers (SIAM), Auto industry is expected to grow by approximately 15‐20% y‐o‐y for the period CY10‐CY12 after taking into consideration higher interest rate scenario and rise in fuel costs. The rise in Auto demand would increase the demand for tyres from OEM’s and the replacement market. Increasing presence in Replacement market to help improve margins During FY10, Ceat Ltd generated approximately 75.0% (66.0% in FY09) of its topline from Replacement market whereas balance was divided between OEM market and Exports. Ceat has been able to increase the replacement market share due to higher reach towards end consumers through CEAT Shoppes and CEAT Hubs. Ceat Shoppes are exclusive dealer outlets for Passenger Car (PC) segment whereas Ceat hubs exclusively cater to Trucks and Buses (T&B) segment. Margins from OEM’s are lower as compared to replacement segment due to lower bargaining power of tyre manufacturers with OEM’s. The increasing shift towards high margin replacement market would help Ceat improve overall margin performance. Capacity Expansion to drive growth going forward Ceat Ltd is ramping up its production facilities to cash in on the huge growth expected in the Auto industry. The company has current capacity of 410 tonnes per day (TPD) in the Bias tyres at Nashik and Bhandup. Ceat has invested in a greenfield radial manufacturing facility at Halol in Gujarat with a capacity of 150 TPD for Truck and Buses, Light trucks & passenger car radials. It is also looking to expand its Nashik capacity by 35 TPD. These capacities are expected to be operational by Q4 FY11. Post expansion the total capacity would be 595 TPD. Relocation of Bhandup Plant to improve margins Ceat Ltd has procured 50 acre land at Ambernath in Thane, Maharashtra and will be shifting its Bhandup facility to that plant. Currently the finished goods produced at Bhandup face heavy Octroi duty as applicable in Mumbai. The Bhandup plant is Ceat’s oldest manufacturing facility and has now become less Energy efficient. As the Company shifts its facility to Ambernath, it would significantly save on Octroi duty and energy costs which would improve its overall margins going forward.
OUTLOOK & VALUATION Ceat Ltd is part of the RPG group and is the fourth largest tyre manufacturer in India. It has facilities in Bhandup and Nashik and it is setting up Radial Tyre Greenfield facility in Halol, Gujarat. With huge growth expected in Auto sector, the OEM’s and the replacement market are expected to grow significantly during the next few years. During the last few quarters, Ceat has been impacted due to rising costs of Natural rubber which is a key input material for manufacturing of tyres. However Ceat expects prices of Natural rubber to decline going forward which would sharply improve margins for tyre manufacturers like Ceat. Going forward, we expect its Revenues and APAT to grow by 19.8% & 85.8% y‐o‐y respectively in FY12E; and by 16.3% & 29.7% respectively in FY13E. At CMP of ` 112, the stock is available at an attractive valuation of 3.0x its FY13E EPS of ` 37.1. At price of ` 101, we had recommended investors to Accumulate the stock. We continue to recommend investors to ACCUMULATE the stock for target price of ` 141 (3.8x FY13E EPS).
KEY FINANCIALS (Consolidated) Y/E Mar. Revenue
(` mn)APAT(` mn)
AEPS(`)
AEPS (% Ch.)
P/E (x)
ROCE (%)
ROE (%)
P/Sales(x)
FY10 28,504.3 1,624.8 47.4 NA 2.4 23.2 25.8 0.1FY11E 35,255.3 527.4 15.4 (67.5) 7.3 8.2 7.8 0.1FY12E 42,240.7 979.8 28.6 85.8 3.9 11.5 12.8 0.1FY13E 49,130.7 1,271.2 37.1 29.7 3.0 13.6 14.5 0.1
Please refer to important disclosures at the end of the report For private Circulation Only.
Sushil Financial Services Private Limited Member : BSEL, SEBI Regn.No. INB/F010982338 | NSEIL, SEBI Regn.No.INB/F230607435. Office : 12, Homji Street, Fort, Mumbai 400 001. Phone: +91 22 40936000 Fax: +91 22 22665758 Email : [email protected]
April 06, 2011 ACCUMULATE PRICE ` 112 TARGET ` 141
Techno Speak
Auto Ancillary
EARLIER RECO Accumulate Price ` 101* Date Mar 23, 2011 *Short Note
SHARE HOLDING (%) Promoters 48.59 FII 2.11 FI / MF 21.59 Body Corporates 5.79 Public & Others 21.92
STOCK DATA
Reuters Code Bloomberg Code
CEAT.BO CEAT IN
BSE Code NSE Symbol
500878 CEATLTD
Market Capitalization*
` 3,835.3 mn US$ 85.8 mn
Shares Outstanding* 34.24 Mn
52 Weeks (H/L) ` 195/86 Avg. Daily Volume (6m) 67,113 Shares
Price Performance (%)
1M 3M 6M
14 (18) (36)
200 Days EMA: ` 127
*On fully diluted equity shares
EQUITY ANALYST Alok Deora | +91 22 4093 4014 [email protected]
RESEARCH ASSOCIATE Shilpi Jain | +91 22 4093 4004 [email protected]
Ceat Ltd.Initiating Coverage (Detailed)
April 06, 2011 2
Ceat Ltd.
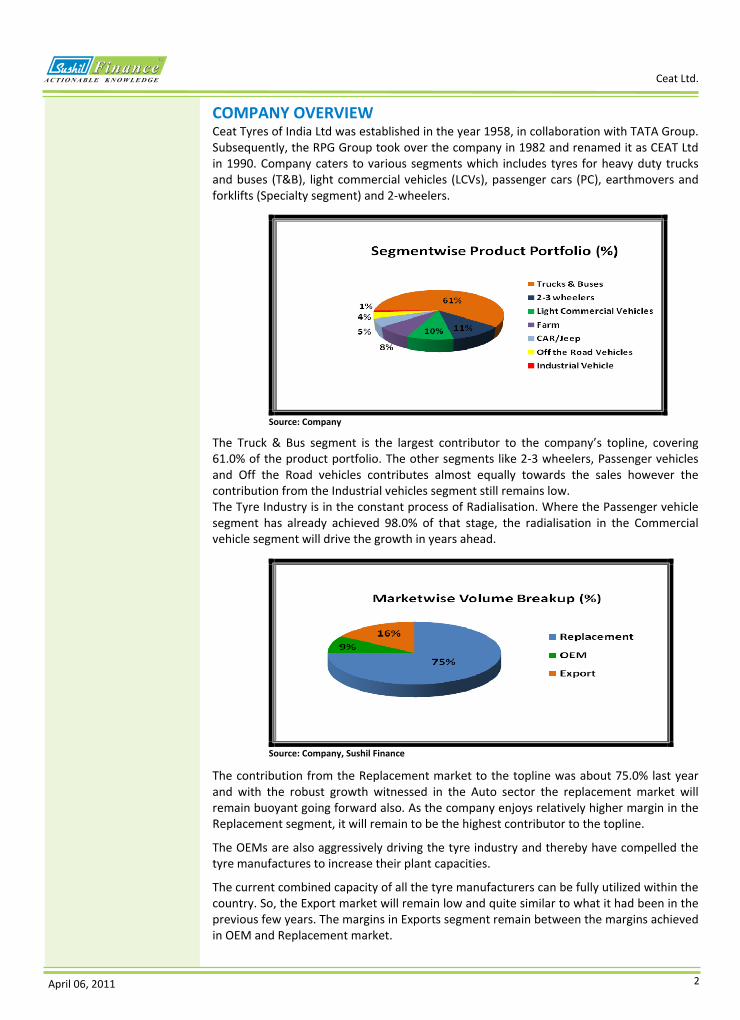
COMPANY OVERVIEW Ceat Tyres of India Ltd was established in the year 1958, in collaboration with TATA Group. Subsequently, the RPG Group took over the company in 1982 and renamed it as CEAT Ltd in 1990. Company caters to various segments which includes tyres for heavy duty trucks and buses (T&B), light commercial vehicles (LCVs), passenger cars (PC), earthmovers and forklifts (Specialty segment) and 2‐wheelers.
Source: Company
The Truck & Bus segment is the largest contributor to the company’s topline, covering 61.0% of the product portfolio. The other segments like 2‐3 wheelers, Passenger vehicles and Off the Road vehicles contributes almost equally towards the sales however the contribution from the Industrial vehicles segment still remains low. The Tyre Industry is in the constant process of Radialisation. Where the Passenger vehicle segment has already achieved 98.0% of that stage, the radialisation in the Commercial vehicle segment will drive the growth in years ahead.
Source: Company, Sushil Finance
The contribution from the Replacement market to the topline was about 75.0% last year and with the robust growth witnessed in the Auto sector the replacement market will remain buoyant going forward also. As the company enjoys relatively higher margin in the Replacement segment, it will remain to be the highest contributor to the topline.
The OEMs are also aggressively driving the tyre industry and thereby have compelled the tyre manufactures to increase their plant capacities.
The current combined capacity of all the tyre manufacturers can be fully utilized within the country. So, the Export market will remain low and quite similar to what it had been in the previous few years. The margins in Exports segment remain between the margins achieved in OEM and Replacement market.
April 06, 2011 3
Ceat Ltd.
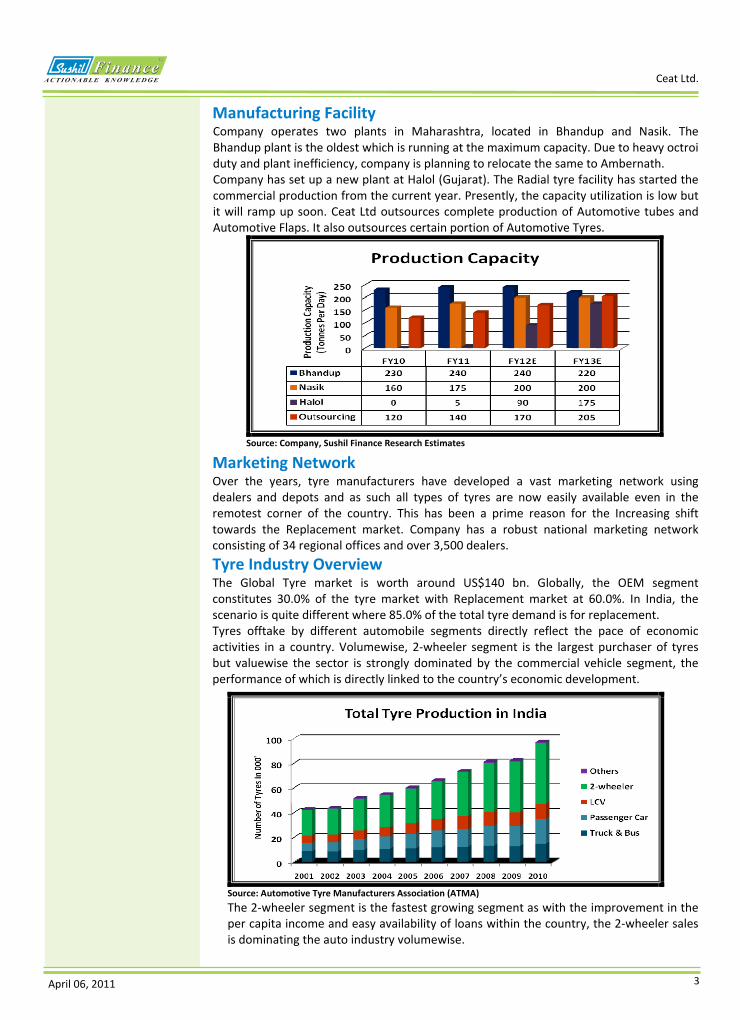
Manufacturing Facility Company operates two plants in Maharashtra, located in Bhandup and Nasik. The Bhandup plant is the oldest which is running at the maximum capacity. Due to heavy octroi duty and plant inefficiency, company is planning to relocate the same to Ambernath. Company has set up a new plant at Halol (Gujarat). The Radial tyre facility has started the commercial production from the current year. Presently, the capacity utilization is low but it will ramp up soon. Ceat Ltd outsources complete production of Automotive tubes and Automotive Flaps. It also outsources certain portion of Automotive Tyres.
Source: Company, Sushil Finance Research Estimates
Marketing Network Over the years, tyre manufacturers have developed a vast marketing network using dealers and depots and as such all types of tyres are now easily available even in the remotest corner of the country. This has been a prime reason for the Increasing shift towards the Replacement market. Company has a robust national marketing network consisting of 34 regional offices and over 3,500 dealers. Tyre Industry Overview The Global Tyre market is worth around US$140 bn. Globally, the OEM segment constitutes 30.0% of the tyre market with Replacement market at 60.0%. In India, the scenario is quite different where 85.0% of the total tyre demand is for replacement. Tyres offtake by different automobile segments directly reflect the pace of economic activities in a country. Volumewise, 2‐wheeler segment is the largest purchaser of tyres but valuewise the sector is strongly dominated by the commercial vehicle segment, the performance of which is directly linked to the country’s economic development.
Source: Automotive Tyre Manufacturers Association (ATMA) The 2‐wheeler segment is the fastest growing segment as with the improvement in the per capita income and easy availability of loans within the country, the 2‐wheeler sales is dominating the auto industry volumewise.
April 06, 2011 4
Ceat Ltd.
The demand for commercial vehicles has recorded sluggish growth due to the weak performance of infrastructure, construction, manufacturing and other sectors. However, the commercial vehicle segment regained its growth in FY 2010 both in terms of production and sales. The main reason for revival of growth in the commercial vehicle segment is improving demand from almost all prominent sectors. It was reflected in increasing tyres offtake during FY 2010 and tyre production grew around 18.3% over FY 2009.
Indian Tyre Market profile The Indian Tyre Industry is approximately worth Rs.250 bn. It is highly raw material intensive and predominantly a Cross Ply (or Bias) tyre manufacturing industry. It produces all categories of tyres, except Snow Tyres and Aero Tyre for which there is no demand domestically. The industry is highly concentrated wherein 10 large manufacturers account for over 95.0% of the total tonnage production of 1.35 mn M.T. The industry is mainly dominated by the organised sector while the unorganised sector holds control in bicycle tyres. The major players in the organised tyre segment are MRF, Apollo Tyres, Ceat and JK Industries, Bridgestone which account for 63.0% of the organised tyre market. The other key players include Kesoram Industries, Goodyear, Dunlop, Falcon and Balkrishna Tyres.
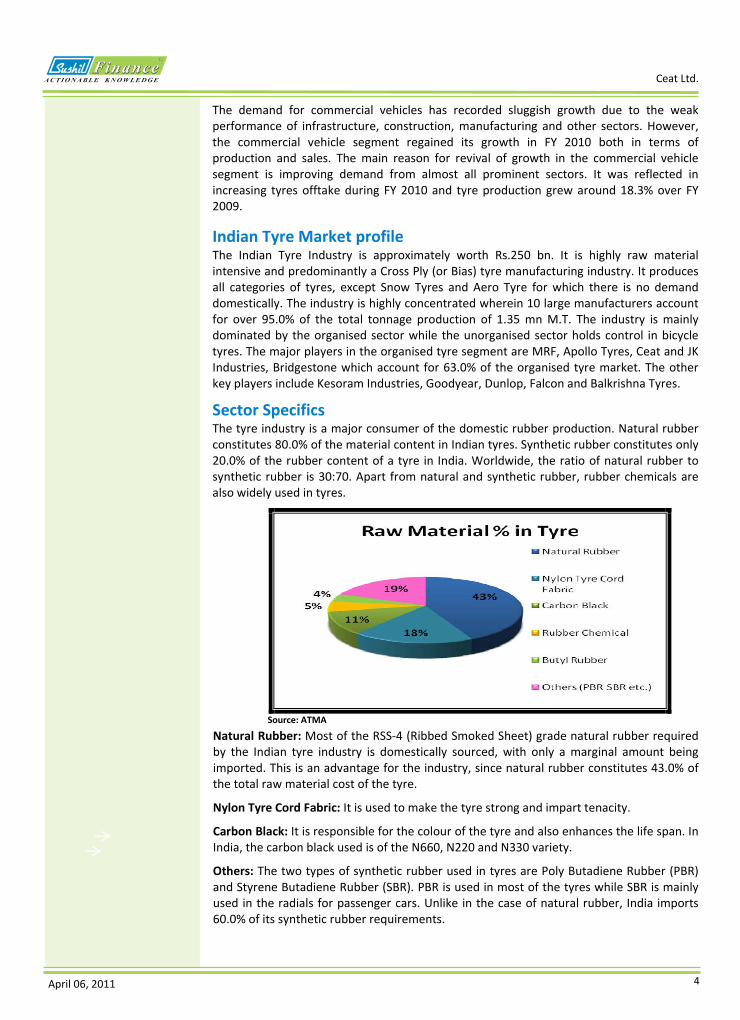
Sector Specifics The tyre industry is a major consumer of the domestic rubber production. Natural rubber constitutes 80.0% of the material content in Indian tyres. Synthetic rubber constitutes only 20.0% of the rubber content of a tyre in India. Worldwide, the ratio of natural rubber to synthetic rubber is 30:70. Apart from natural and synthetic rubber, rubber chemicals are also widely used in tyres.
Source: ATMA
Natural Rubber: Most of the RSS‐4 (Ribbed Smoked Sheet) grade natural rubber required by the Indian tyre industry is domestically sourced, with only a marginal amount being imported. This is an advantage for the industry, since natural rubber constitutes 43.0% of the total raw material cost of the tyre.
Nylon Tyre Cord Fabric: It is used to make the tyre strong and impart tenacity.
Carbon Black: It is responsible for the colour of the tyre and also enhances the life span. In India, the carbon black used is of the N660, N220 and N330 variety.
Others: The two types of synthetic rubber used in tyres are Poly Butadiene Rubber (PBR) and Styrene Butadiene Rubber (SBR). PBR is used in most of the tyres while SBR is mainly used in the radials for passenger cars. Unlike in the case of natural rubber, India imports 60.0% of its synthetic rubber requirements.
April 06, 2011 5
Ceat Ltd.
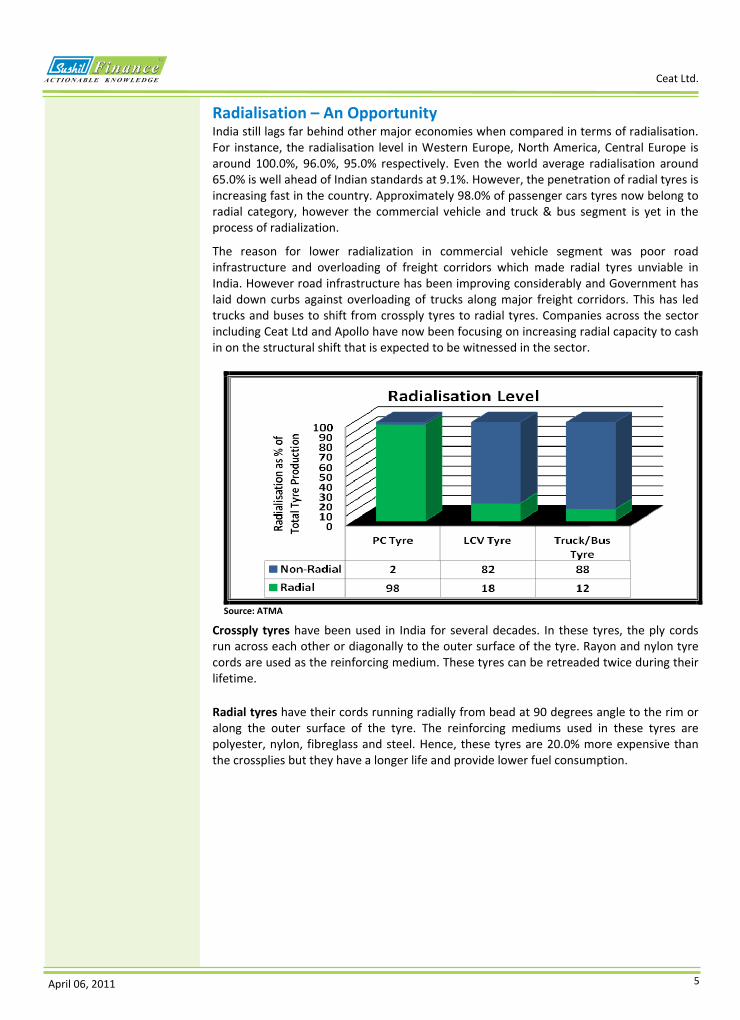
Radialisation – An Opportunity India still lags far behind other major economies when compared in terms of radialisation. For instance, the radialisation level in Western Europe, North America, Central Europe is around 100.0%, 96.0%, 95.0% respectively. Even the world average radialisation around 65.0% is well ahead of Indian standards at 9.1%. However, the penetration of radial tyres is increasing fast in the country. Approximately 98.0% of passenger cars tyres now belong to radial category, however the commercial vehicle and truck & bus segment is yet in the process of radialization.
The reason for lower radialization in commercial vehicle segment was poor road infrastructure and overloading of freight corridors which made radial tyres unviable in India. However road infrastructure has been improving considerably and Government has laid down curbs against overloading of trucks along major freight corridors. This has led trucks and buses to shift from crossply tyres to radial tyres. Companies across the sector including Ceat Ltd and Apollo have now been focusing on increasing radial capacity to cash in on the structural shift that is expected to be witnessed in the sector.
Source: ATMA Crossply tyres have been used in India for several decades. In these tyres, the ply cords run across each other or diagonally to the outer surface of the tyre. Rayon and nylon tyre cords are used as the reinforcing medium. These tyres can be retreaded twice during their lifetime.
Radial tyres have their cords running radially from bead at 90 degrees angle to the rim or along the outer surface of the tyre. The reinforcing mediums used in these tyres are polyester, nylon, fibreglass and steel. Hence, these tyres are 20.0% more expensive than the crossplies but they have a longer life and provide lower fuel consumption.
April 06, 2011 6
Ceat Ltd.
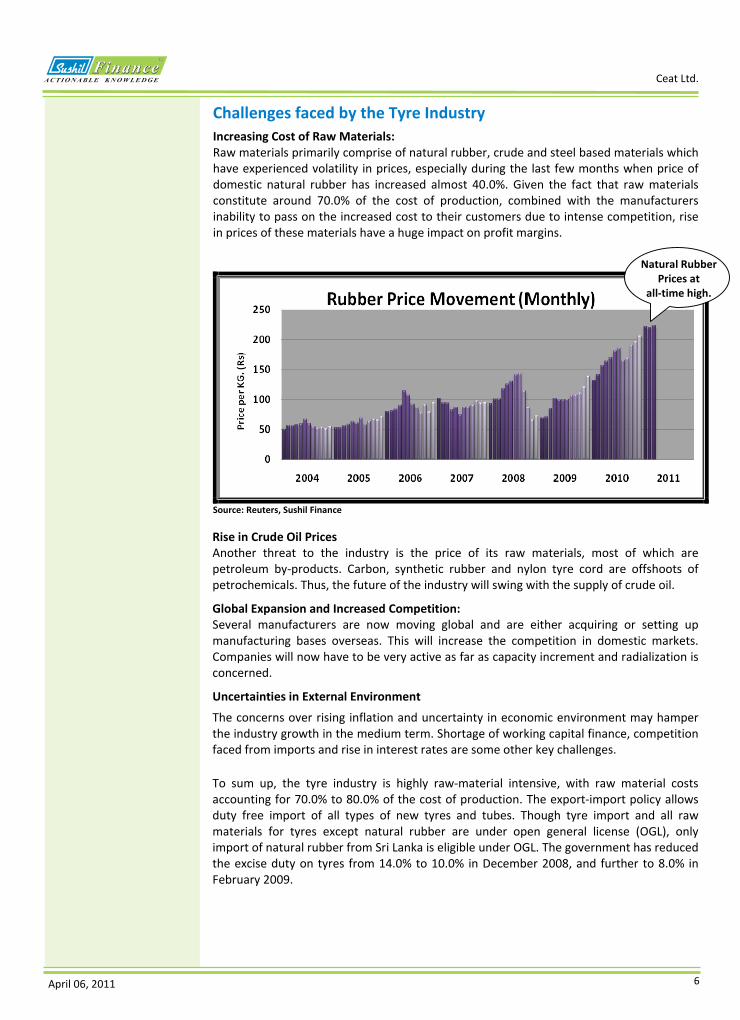
Challenges faced by the Tyre Industry Increasing Cost of Raw Materials: Raw materials primarily comprise of natural rubber, crude and steel based materials which have experienced volatility in prices, especially during the last few months when price of domestic natural rubber has increased almost 40.0%. Given the fact that raw materials constitute around 70.0% of the cost of production, combined with the manufacturers inability to pass on the increased cost to their customers due to intense competition, rise in prices of these materials have a huge impact on profit margins.
Source: Reuters, Sushil Finance
Rise in Crude Oil Prices Another threat to the industry is the price of its raw materials, most of which are petroleum by‐products. Carbon, synthetic rubber and nylon tyre cord are offshoots of petrochemicals. Thus, the future of the industry will swing with the supply of crude oil.
Global Expansion and Increased Competition: Several manufacturers are now moving global and are either acquiring or setting up manufacturing bases overseas. This will increase the competition in domestic markets. Companies will now have to be very active as far as capacity increment and radialization is concerned.
Uncertainties in External Environment
The concerns over rising inflation and uncertainty in economic environment may hamper the industry growth in the medium term. Shortage of working capital finance, competition faced from imports and rise in interest rates are some other key challenges.
To sum up, the tyre industry is highly raw‐material intensive, with raw material costs accounting for 70.0% to 80.0% of the cost of production. The export‐import policy allows duty free import of all types of new tyres and tubes. Though tyre import and all raw materials for tyres except natural rubber are under open general license (OGL), only import of natural rubber from Sri Lanka is eligible under OGL. The government has reduced the excise duty on tyres from 14.0% to 10.0% in December 2008, and further to 8.0% in February 2009.
Natural Rubber Prices at
all‐time high.
April 06, 2011 7
Ceat Ltd.
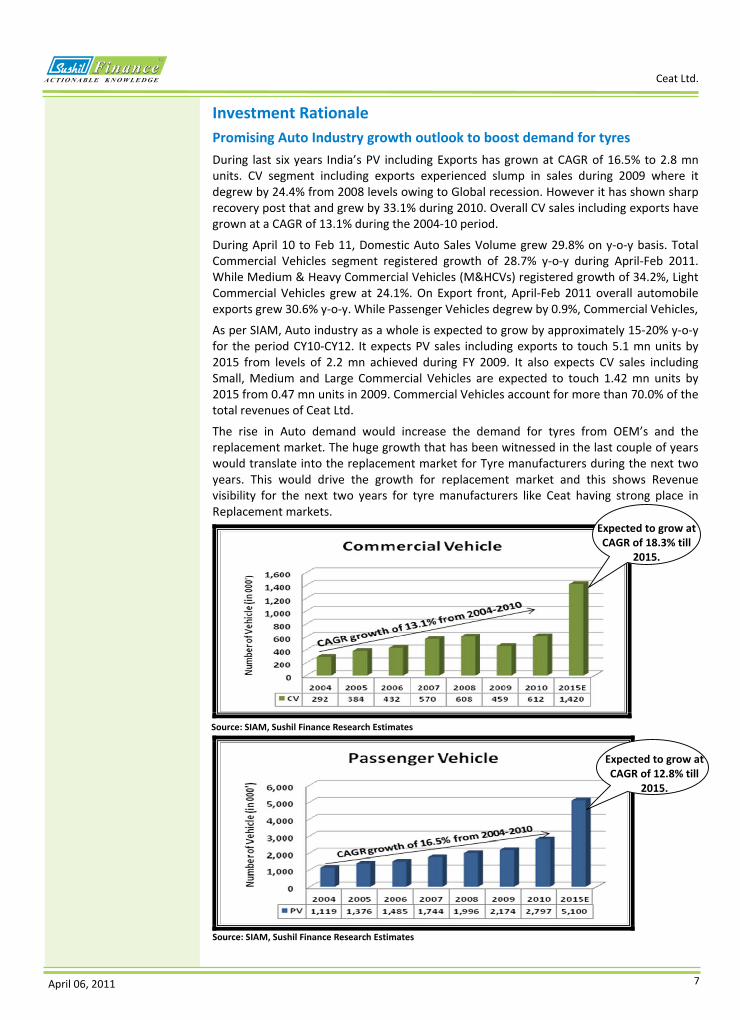
Investment Rationale Promising Auto Industry growth outlook to boost demand for tyres During last six years India’s PV including Exports has grown at CAGR of 16.5% to 2.8 mn units. CV segment including exports experienced slump in sales during 2009 where it degrew by 24.4% from 2008 levels owing to Global recession. However it has shown sharp recovery post that and grew by 33.1% during 2010. Overall CV sales including exports have grown at a CAGR of 13.1% during the 2004‐10 period.
During April 10 to Feb 11, Domestic Auto Sales Volume grew 29.8% on y‐o‐y basis. Total Commercial Vehicles segment registered growth of 28.7% y‐o‐y during April‐Feb 2011. While Medium & Heavy Commercial Vehicles (M&HCVs) registered growth of 34.2%, Light Commercial Vehicles grew at 24.1%. On Export front, April‐Feb 2011 overall automobile exports grew 30.6% y‐o‐y. While Passenger Vehicles degrew by 0.9%, Commercial Vehicles,
As per SIAM, Auto industry as a whole is expected to grow by approximately 15‐20% y‐o‐y for the period CY10‐CY12. It expects PV sales including exports to touch 5.1 mn units by 2015 from levels of 2.2 mn achieved during FY 2009. It also expects CV sales including Small, Medium and Large Commercial Vehicles are expected to touch 1.42 mn units by 2015 from 0.47 mn units in 2009. Commercial Vehicles account for more than 70.0% of the total revenues of Ceat Ltd.
The rise in Auto demand would increase the demand for tyres from OEM’s and the replacement market. The huge growth that has been witnessed in the last couple of years would translate into the replacement market for Tyre manufacturers during the next two years. This would drive the growth for replacement market and this shows Revenue visibility for the next two years for tyre manufacturers like Ceat having strong place in Replacement markets.
Source: SIAM, Sushil Finance Research Estimates
Source: SIAM, Sushil Finance Research Estimates
Expected to grow at CAGR of 18.3% till
2015.
Expected to grow at CAGR of 12.8% till
2015.
April 06, 2011 8
Ceat Ltd.
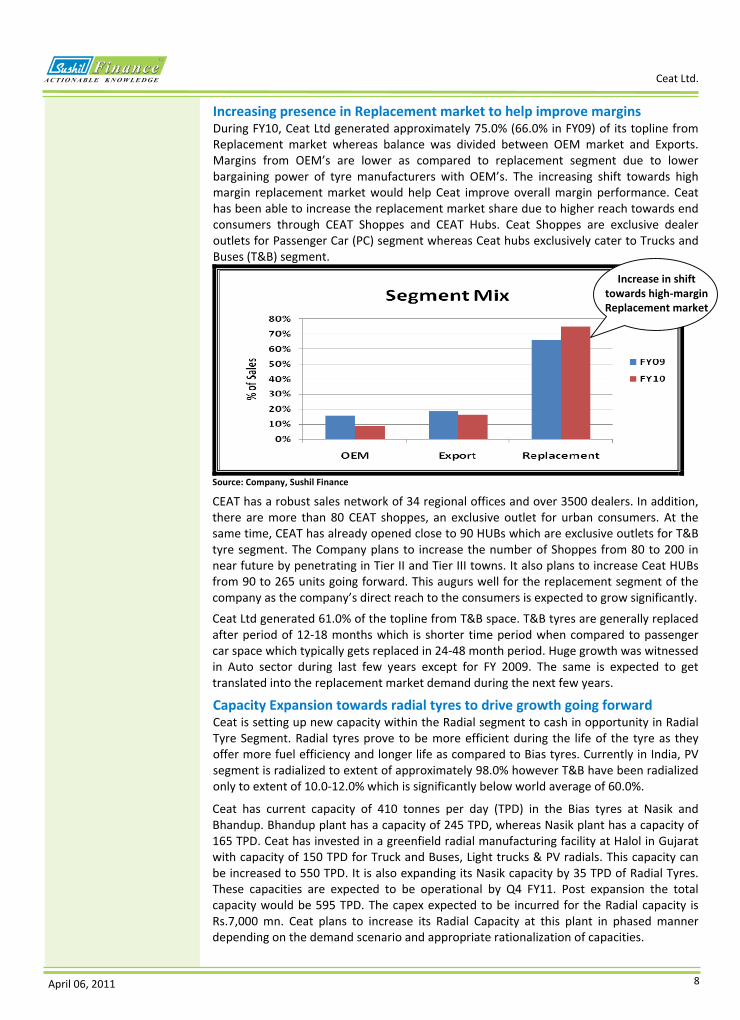
Increasing presence in Replacement market to help improve margins During FY10, Ceat Ltd generated approximately 75.0% (66.0% in FY09) of its topline from Replacement market whereas balance was divided between OEM market and Exports. Margins from OEM’s are lower as compared to replacement segment due to lower bargaining power of tyre manufacturers with OEM’s. The increasing shift towards high margin replacement market would help Ceat improve overall margin performance. Ceat has been able to increase the replacement market share due to higher reach towards end consumers through CEAT Shoppes and CEAT Hubs. Ceat Shoppes are exclusive dealer outlets for Passenger Car (PC) segment whereas Ceat hubs exclusively cater to Trucks and Buses (T&B) segment.
Source: Company, Sushil Finance CEAT has a robust sales network of 34 regional offices and over 3500 dealers. In addition, there are more than 80 CEAT shoppes, an exclusive outlet for urban consumers. At the same time, CEAT has already opened close to 90 HUBs which are exclusive outlets for T&B tyre segment. The Company plans to increase the number of Shoppes from 80 to 200 in near future by penetrating in Tier II and Tier III towns. It also plans to increase Ceat HUBs from 90 to 265 units going forward. This augurs well for the replacement segment of the company as the company’s direct reach to the consumers is expected to grow significantly.
Ceat Ltd generated 61.0% of the topline from T&B space. T&B tyres are generally replaced after period of 12‐18 months which is shorter time period when compared to passenger car space which typically gets replaced in 24‐48 month period. Huge growth was witnessed in Auto sector during last few years except for FY 2009. The same is expected to get translated into the replacement market demand during the next few years.
Capacity Expansion towards radial tyres to drive growth going forward Ceat is setting up new capacity within the Radial segment to cash in opportunity in Radial Tyre Segment. Radial tyres prove to be more efficient during the life of the tyre as they offer more fuel efficiency and longer life as compared to Bias tyres. Currently in India, PV segment is radialized to extent of approximately 98.0% however T&B have been radialized only to extent of 10.0‐12.0% which is significantly below world average of 60.0%.
Ceat has current capacity of 410 tonnes per day (TPD) in the Bias tyres at Nasik and Bhandup. Bhandup plant has a capacity of 245 TPD, whereas Nasik plant has a capacity of 165 TPD. Ceat has invested in a greenfield radial manufacturing facility at Halol in Gujarat with capacity of 150 TPD for Truck and Buses, Light trucks & PV radials. This capacity can be increased to 550 TPD. It is also expanding its Nasik capacity by 35 TPD of Radial Tyres. These capacities are expected to be operational by Q4 FY11. Post expansion the total capacity would be 595 TPD. The capex expected to be incurred for the Radial capacity is Rs.7,000 mn. Ceat plans to increase its Radial Capacity at this plant in phased manner depending on the demand scenario and appropriate rationalization of capacities.
Increase in shift towards high‐margin Replacement market
April 06, 2011 9
Ceat Ltd.
Relocation of Bhandup Plant to improve margins Ceat Ltd has procured 50 acre land at Ambernath in Thane, Maharashtra and is shifting its Bhandup facility to that plant. It held 31 Acre plant in Bhandup and has sold 7 acre during 2007 for Rs.1,300 mn and the funds were utilized to finance their Halol Capex. Finished goods that are manufactured at Bhandup face Octroi duty applicable in Mumbai which affects the margins performance. The Bhandup facility is a very old plant and is therefore faces higher energy costs and lower efficiency in production which increases the overall cost of production. Ceat plans to relocate its facility to Ambernath in a phased manner and it would take approximately two years for the complete relocation. Ceat expects to generate cash of Rs.4,000 mn to 5,000 mn by the sale of Bhandup Land which is likely to be utilized towards the Ambernath facility.
Ceat also plans to increase more of Automation and cut down on number of workers as they shift to the new plant. The Company has started offering Voluntary Retirement System (VRS) to the Employees. With work force coming down, the company reduces expenses to certain extent. Ceat also plans to rationalize its capacity and with this shift where it would try and align capacities segment wise which would also help it reduce its operational cost. All these measures put together would most likely help the Company to improve its margins at the operating level.
Other Investment Rationale Acquisition of Brand Rights from Pirelli For expanding its international exposure, Ceat acquired global rights of brand ‘Ceat’ from Italian tyre maker Pirelli for Rs.550 mn during 2010. This acquisition is expected to double exports revenue to Rs.10 bn in the next 3 years.
Until now, Ceat owned the brand Ceat in nine South‐Asian countries and used to export to Europe and Latin America under the ‘Altura’ brand. Pirelli will hold exclusive rights for radial tyres in Europe, Latin America, Turkey and Mexico up to CY 2011. Ceat can enter these markets using Ceat Brand post CY 2011. Pirelli will completely stop sales of tyres under Ceat brand after CY 2012 when Ceat Ltd will have all exclusive rights for the brand.
Increase in stake in high growth Srilankan JV During the year, Ceat acquired entire stake in its Sri Lankan investment arm, Associated CEAT Holdings Company Ltd (ACHL), to make it wholly owned subsidiary. Associated CEAT Holdings (ACHL) holds 50% stake in CEAT Kelani Associated Holdings Pvt. Ltd, Colombo which is a JV between ACHL and its Sri Lankan Partner, Kelani Tyres Ltd. CEAT Kelani Associated Holdings has three wholly owned subsidiaries which are engaged in manufacturing of tyres under 'Ceat' brand.
The JV enjoys market share of over 60.0% in the Truck and light truck sector in Srilanka. It is also a market leader in the farm and 3 wheeler space in Sri Lanka, and has the largest dealer network. The JV grew by 26.0% on y‐o‐y basis during FY10 and had topline of Rs.2,160 mn with PAT margins of approximately 10.0%. Till now Ceat held approximately 27.0% stake in the JV with remaining 23.0% of the total 50.0% stake in JV was held by other RPG companies. With the purchase of remaining stake, Ceat Ltd now holds 50.0% in the JV. The increase in stake would have a significant positive impact on topline and bottomline front.
April 06, 2011 10
Ceat Ltd.
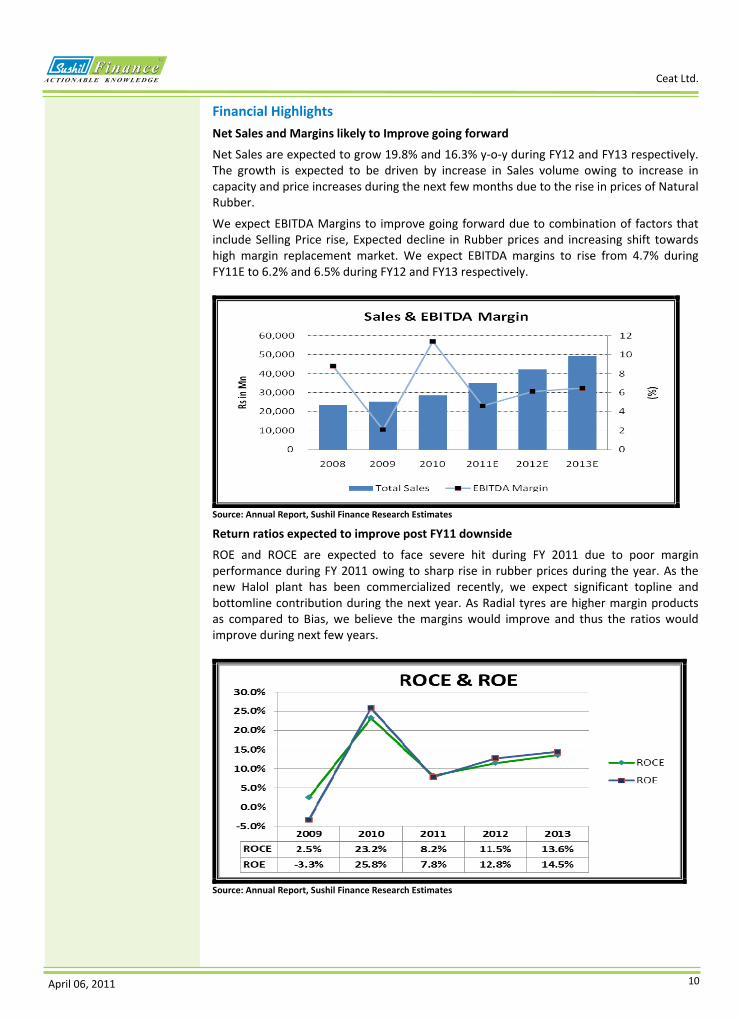
Financial Highlights Net Sales and Margins likely to Improve going forward
Net Sales are expected to grow 19.8% and 16.3% y‐o‐y during FY12 and FY13 respectively. The growth is expected to be driven by increase in Sales volume owing to increase in capacity and price increases during the next few months due to the rise in prices of Natural Rubber.
We expect EBITDA Margins to improve going forward due to combination of factors that include Selling Price rise, Expected decline in Rubber prices and increasing shift towards high margin replacement market. We expect EBITDA margins to rise from 4.7% during FY11E to 6.2% and 6.5% during FY12 and FY13 respectively.
Source: Annual Report, Sushil Finance Research Estimates Return ratios expected to improve post FY11 downside
ROE and ROCE are expected to face severe hit during FY 2011 due to poor margin performance during FY 2011 owing to sharp rise in rubber prices during the year. As the new Halol plant has been commercialized recently, we expect significant topline and bottomline contribution during the next year. As Radial tyres are higher margin products as compared to Bias, we believe the margins would improve and thus the ratios would improve during next few years.
Source: Annual Report, Sushil Finance Research Estimates
April 06, 2011 11
Ceat Ltd.
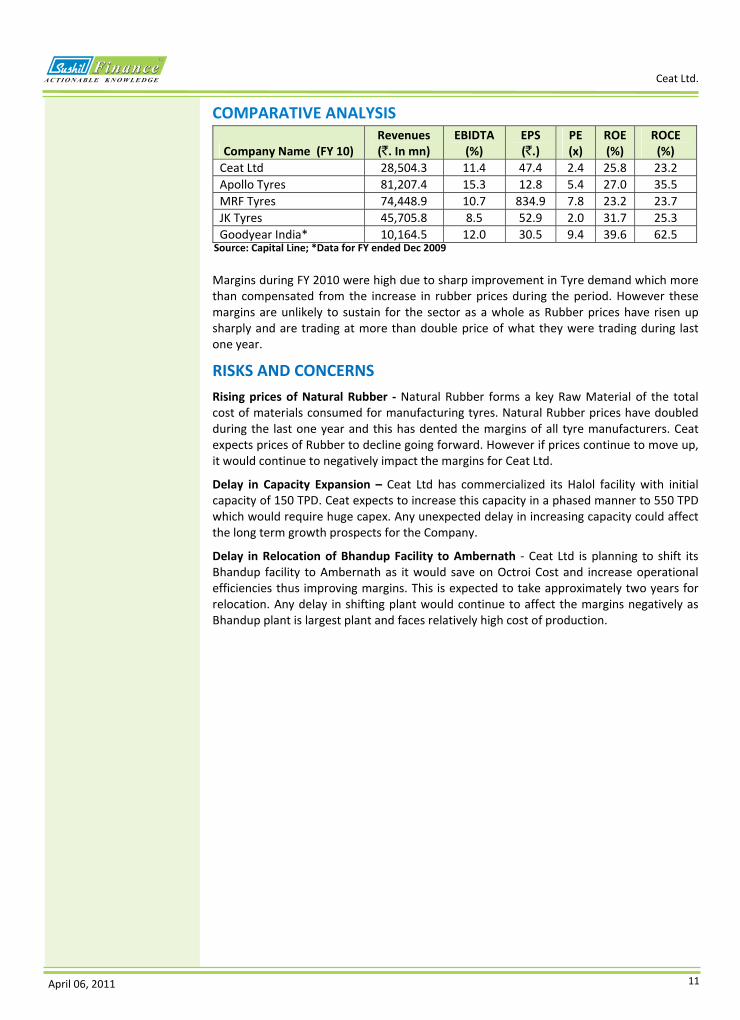
COMPARATIVE ANALYSIS
Company Name (FY 10) Revenues (`. In mn)
EBIDTA (%)
EPS (`.)
PE (x)
ROE (%)
ROCE (%)
Ceat Ltd 28,504.3 11.4 47.4 2.4 25.8 23.2Apollo Tyres 81,207.4 15.3 12.8 5.4 27.0 35.5MRF Tyres 74,448.9 10.7 834.9 7.8 23.2 23.7JK Tyres 45,705.8 8.5 52.9 2.0 31.7 25.3Goodyear India* 10,164.5 12.0 30.5 9.4 39.6 62.5
Source: Capital Line; *Data for FY ended Dec 2009
Margins during FY 2010 were high due to sharp improvement in Tyre demand which more than compensated from the increase in rubber prices during the period. However these margins are unlikely to sustain for the sector as a whole as Rubber prices have risen up sharply and are trading at more than double price of what they were trading during last one year.
RISKS AND CONCERNS Rising prices of Natural Rubber ‐ Natural Rubber forms a key Raw Material of the total cost of materials consumed for manufacturing tyres. Natural Rubber prices have doubled during the last one year and this has dented the margins of all tyre manufacturers. Ceat expects prices of Rubber to decline going forward. However if prices continue to move up, it would continue to negatively impact the margins for Ceat Ltd.
Delay in Capacity Expansion – Ceat Ltd has commercialized its Halol facility with initial capacity of 150 TPD. Ceat expects to increase this capacity in a phased manner to 550 TPD which would require huge capex. Any unexpected delay in increasing capacity could affect the long term growth prospects for the Company.
Delay in Relocation of Bhandup Facility to Ambernath ‐ Ceat Ltd is planning to shift its Bhandup facility to Ambernath as it would save on Octroi Cost and increase operational efficiencies thus improving margins. This is expected to take approximately two years for relocation. Any delay in shifting plant would continue to affect the margins negatively as Bhandup plant is largest plant and faces relatively high cost of production.
April 06, 2011 12
Ceat Ltd.
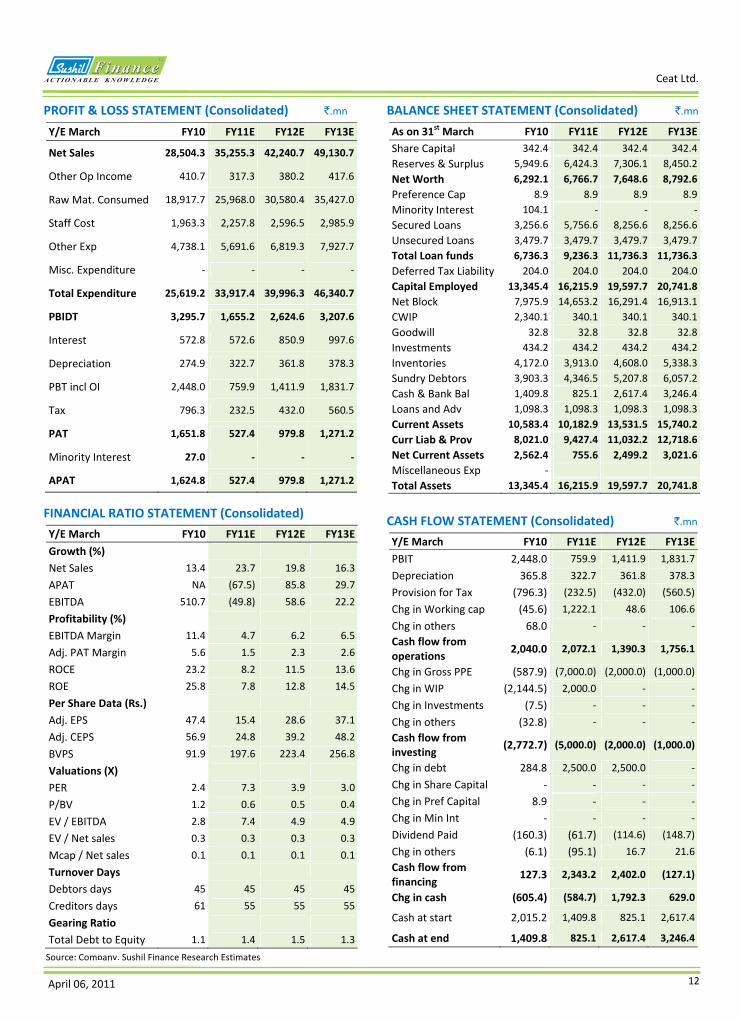
FINANCIAL RATIO STATEMENT (Consolidated) Y/E March FY10 FY11E FY12E FY13EGrowth (%) Net Sales 13.4 23.7 19.8 16.3APAT NA (67.5) 85.8 29.7EBITDA 510.7 (49.8) 58.6 22.2Profitability (%) EBITDA Margin 11.4 4.7 6.2 6.5Adj. PAT Margin 5.6 1.5 2.3 2.6ROCE 23.2 8.2 11.5 13.6ROE 25.8 7.8 12.8 14.5Per Share Data (Rs.) Adj. EPS 47.4 15.4 28.6 37.1Adj. CEPS 56.9 24.8 39.2 48.2BVPS 91.9 197.6 223.4 256.8Valuations (X) PER 2.4 7.3 3.9 3.0P/BV 1.2 0.6 0.5 0.4EV / EBITDA 2.8 7.4 4.9 4.9EV / Net sales 0.3 0.3 0.3 0.3Mcap / Net sales 0.1 0.1 0.1 0.1Turnover Days Debtors days 45 45 45 45Creditors days 61 55 55 55Gearing Ratio Total Debt to Equity 1.1 1.4 1.5 1.3
Source: Company, Sushil Finance Research Estimates
PROFIT & LOSS STATEMENT (Consolidated) `.mn
Y/E March FY10 FY11E FY12E FY13E
Net Sales 28,504.3 35,255.3 42,240.7 49,130.7
Other Op Income 410.7 317.3 380.2 417.6
Raw Mat. Consumed 18,917.7 25,968.0 30,580.4 35,427.0
Staff Cost 1,963.3 2,257.8 2,596.5 2,985.9
Other Exp 4,738.1 5,691.6 6,819.3 7,927.7
Misc. Expenditure ‐ ‐ ‐ ‐
Total Expenditure 25,619.2 33,917.4 39,996.3 46,340.7
PBIDT 3,295.7 1,655.2 2,624.6 3,207.6
Interest 572.8 572.6 850.9 997.6
Depreciation 274.9 322.7 361.8 378.3
PBT incl OI 2,448.0 759.9 1,411.9 1,831.7
Tax 796.3 232.5 432.0 560.5
PAT 1,651.8 527.4 979.8 1,271.2
Minority Interest 27.0 ‐ ‐ ‐
APAT 1,624.8 527.4 979.8 1,271.2
BALANCE SHEET STATEMENT (Consolidated) `.mn
As on 31st March FY10 FY11E FY12E FY13EShare Capital 342.4 342.4 342.4 342.4Reserves & Surplus 5,949.6 6,424.3 7,306.1 8,450.2Net Worth 6,292.1 6,766.7 7,648.6 8,792.6Preference Cap 8.9 8.9 8.9 8.9Minority Interest 104.1 ‐ ‐ ‐Secured Loans 3,256.6 5,756.6 8,256.6 8,256.6Unsecured Loans 3,479.7 3,479.7 3,479.7 3,479.7Total Loan funds 6,736.3 9,236.3 11,736.3 11,736.3Deferred Tax Liability 204.0 204.0 204.0 204.0Capital Employed 13,345.4 16,215.9 19,597.7 20,741.8Net Block 7,975.9 14,653.2 16,291.4 16,913.1CWIP 2,340.1 340.1 340.1 340.1Goodwill 32.8 32.8 32.8 32.8Investments 434.2 434.2 434.2 434.2Inventories 4,172.0 3,913.0 4,608.0 5,338.3Sundry Debtors 3,903.3 4,346.5 5,207.8 6,057.2Cash & Bank Bal 1,409.8 825.1 2,617.4 3,246.4Loans and Adv 1,098.3 1,098.3 1,098.3 1,098.3Current Assets 10,583.4 10,182.9 13,531.5 15,740.2Curr Liab & Prov 8,021.0 9,427.4 11,032.2 12,718.6Net Current Assets 2,562.4 755.6 2,499.2 3,021.6Miscellaneous Exp ‐ Total Assets 13,345.4 16,215.9 19,597.7 20,741.8
CASH FLOW STATEMENT (Consolidated) `.mn Y/E March FY10 FY11E FY12E FY13EPBIT 2,448.0 759.9 1,411.9 1,831.7Depreciation 365.8 322.7 361.8 378.3Provision for Tax (796.3) (232.5) (432.0) (560.5)Chg in Working cap (45.6) 1,222.1 48.6 106.6Chg in others 68.0 ‐ ‐ ‐Cash flow from operations 2,040.0 2,072.1 1,390.3 1,756.1
Chg in Gross PPE (587.9) (7,000.0) (2,000.0) (1,000.0)Chg in WIP (2,144.5) 2,000.0 ‐ ‐Chg in Investments (7.5) ‐ ‐ ‐Chg in others (32.8) ‐ ‐ ‐Cash flow from investing (2,772.7) (5,000.0) (2,000.0) (1,000.0)
Chg in debt 284.8 2,500.0 2,500.0 ‐Chg in Share Capital ‐ ‐ ‐ ‐Chg in Pref Capital 8.9 ‐ ‐ ‐Chg in Min Int ‐ ‐ ‐ ‐Dividend Paid (160.3) (61.7) (114.6) (148.7)Chg in others (6.1) (95.1) 16.7 21.6Cash flow from financing 127.3 2,343.2 2,402.0 (127.1)
Chg in cash (605.4) (584.7) 1,792.3 629.0
Cash at start 2,015.2 1,409.8 825.1 2,617.4
Cash at end 1,409.8 825.1 2,617.4 3,246.4
April 06, 2011 13
Ceat Ltd.
OUTLOOK & VALUATION Ceat Ltd is part of the RPG group and is the fourth largest tyre manufacturer in India. It has facilities in Bhandup and Nasik and it is setting up Radial Tyre Greenfield facility in Halol, Gujarat. With huge growth expected in Auto sector, the OEM’s and the replacement market are expected to grow significantly during the next few years. During the last few quarters, the Company has been impacted due to rising costs of Natural rubber which is a key input material for manufacturing of tyres. However Ceat expects prices of Natural rubber to decline going forward which would sharply improve margins for tyre manufacturers like Ceat. Going forward, we expect its Revenues and APAT to grow by 19.8% & 85.8% y‐o‐y respectively in FY12E; and by 16.3% & 29.7% respectively in FY13E. At CMP of ` 112, the stock is available at an attractive valuation of 3.0x its FY13E EPS of ` 37.1. At price of ` 101 we had recommended investors to Accumulate the stock. We continue to recommend investors to ACCUMULATE the stock for target price of ` 141 (3.8x FY13E EPS).
Please Note that our technical calls are totally independent of our fundamental calls.
Additional information with respect to any securities referred to herein will be available upon request. Sushil Financial Services Private Limited and its connected companies, and their respective directors, Officers and employees (to be collectively known as SFSPL), may, from time to time, have a long or short position in the securities mentioned and may sell or buy such securities. SFSPL may act upon or make use of information contained herein prior to the publication thereof.
This sheet is for private circulation only and the said document does not constitute an offer to buy or sell any securities mentioned herein. While utmost care has been taken in preparing the above, We claim no responsibility for its accuracy. We shall not be liable for any direct or indirect losses arising from the use thereof and the investors are requested to use the information contained herein at their own risk.