Embed Size (px)
Citation preview
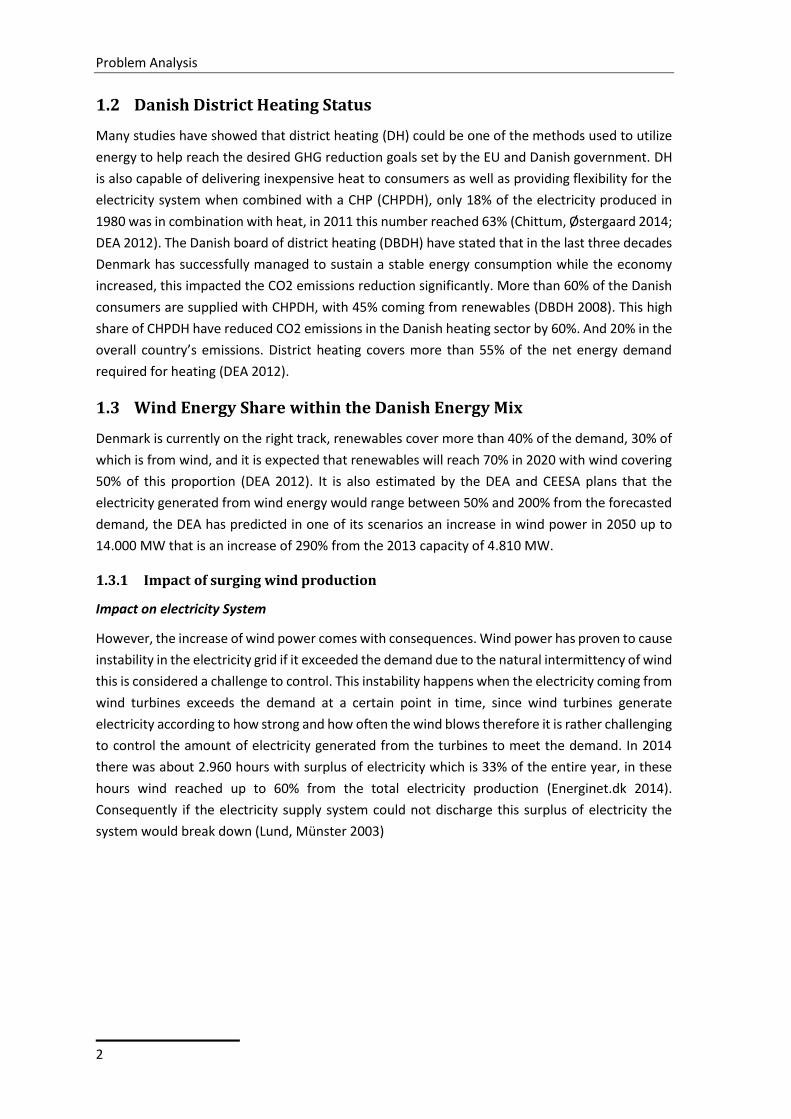
Techno-Economic Optimization of Danish Decentralized
Combined Heat and Power District Heating Plants
A Comparative Analysis of a Retrofitted District Heating Plant &
Modification of Institutional levies
M.Sc. Thesis in Sustainable Energy Planning & Management
4th Semester
Gamal Eldin Massoud
23rd May 2015


This thesis is dedicated to my parents Tahani & Ahmed Massoud,
and my siblings Sherif and Amani for their undivided support and
guidance. In addition to my partner in life Sandy for her ongoing
motivation and assistance.

Synopsis
I
Synopsis
Aalborg University
Msc. (Eng) in Sustainable Energy Planning and
Management
Project Title
Techno-Economic Optimization of Danish
Decentralized Combined Heat and Power
District Heating Plants
Project Period
February 2nd 2015 – June 3rd 2015
Author
Gamal Massoud
Supervisor
Frede Hvelplund
Number of Printed Copies
3
Page Count
86
Additives
1 CD per copy
The report’s contents are free for use, but publication, with references, must be authorized by the author.
Abstract
The increasing share of wind power in the
Danish energy system is causing
decentralized combined heat and power
district heating plants to shut down. This
forces the system to export the surplus wind
power then there is not enough demand to
match it. On the other hand this decrease in
CHPDH plants comes as an issue of a
decrease in security of energy supply when
there is not enough wind power in the
system. Especially that using interconnectors
to balance the energy system is no always a
viable solution, for that these connectors
might not have the capacity needed.
Therefore an analysis is made to determine
the potential of survival of the CHPDH
plants. Focusing on improved operation of
the plant through optimizing trading,
investing in a heat pump to absorb the
excess wind power, further more
modification of the current institutional
levies applied on heat pumps took part of
the analysis to investigate further potential
of the DH plants.
This project shown that there is high
potential of survival for CHPDH plant, since
there is still room for operation
improvement, additionally investing in a
heat pump absorbed the surplus electricity
in the system adding to the importance of
CHPDH, finally modification of institutional
levies further enhanced the plant’s
operation, hence offering a positive business
case for CHPDH.
Preface
II
Preface
This master’s thesis project was written by a 4th semester individual student at Aalborg University
at the study program of Sustainable Energy Planning and Management as part of the department
of Development and Urban Planning. The project was part of a one year internship at EMD
International A/S in Aalborg.
The title of the project is Techno-Economic Optimization of Decentralized Combined Heat and
Power plants in Denmark. The starting and ending period of the project was from the 1st of
February 2015 to the 23rd of May 2015.
The main focus of the internship is to strengthen the business case of decentralized CHP plants in
Denmark and finding better improved intuitional conditions, this was combined by an inspiration
from Prof. Poul Alberg Østergaard’s inauguration lecture about “Energy Planning and the
Transition Towards Renewable Energy Systems”
Numbering styles in the project was according to the Danish style, where the “,” represented the
decimal point and the “.” represented the tens, thousands, etc.
Conversions were calculated according to the exchange rate given at Google.com and is an
approximate.
The energyPRO version where the analysis was carried is in beta mode and is not made available
to the public yet, the author had access to the beta version due to his status as an intern at EMD
International A/S, the major constraint in the beta version was its inability to model one whole
year all together, therefore the modeling took place divided into half yearly basis, nonetheless a
quality check was made on the half yearly data to check its reliability and it passed. Meaning there
is no difference between two calculation methods. Pictures found on the front page are taken
from the following sources:
http://www.digitaljournal.com/article/319723
http://www.friotherm.com/en/district-heating/
Acknowledgments
In preparation of this master’s thesis special appreciation goes to Anders N. Andersen and Kasper
Nagel from EMD for their continuous support and guidance. Also exclusive thanks goes to Aalborg
Forsyning and Jens Bovbjerg for their collaboration. Finally, deep gratitude goes for Frede
Hvelplund for his exception supervision and advice throughout the entire project.
List of Abbreviation
III
List of Abbreviation
CHPDH District Heating Plant with a Combined Heat and Power Unit
COP Coefficient of Performance
DEA Danish Energy Agency
DH District Heating
DKK Danish Kroner
DSO Distributer System Operator
EB Electric Boiler
EBP Electricity Balancing Price
EU European Union
GHG Green House Gas
HP Heat Production
IDA Danish Society of Engineers
LTMC Long Term Marginal Cost
MOE Merit Order Effect
MWh Megawatt hour
MWhel Megawatt hour Electrical
MWhth Megawatt hour Thermal
NG Natural Gas
NHPC Net Heat Production Cost
NHPC Net Heat Production Cost
Nm3 Normal Cubic Meter
OPEX Operation Expenditures
PJ Petajoule
PSO Public Service Obligation
R&D Research and Development
RE Renewable Energy
RES Renewable Energy Share
STMC Short Term Marginal Cost
TSO Transmitter System Operator
Contents
IV
Contents Table of Figures ............................................................................................................... VI
List of Tables ................................................................................................................. VIII
List of Equations .............................................................................................................. IX
1 Problem Analysis ...................................................................................................................... 1
1.1 Transition within the Danish energy sector ..................................................................... 1
1.2 Danish District Heating Status.......................................................................................... 2
1.3 Wind Energy Share within the Danish Energy Mix .......................................................... 2
1.3.1 Impact of surging wind production .......................................................................... 2
1.4 Available viable solutions to reduce price impact ........................................................... 6
1.5 Problem Summary ........................................................................................................... 7
1.6 Research Question ........................................................................................................... 8
1.7 Project Overview .............................................................................................................. 9
2 Theoretical Framework .......................................................................................................... 11
2.1 Concrete Institutional Economy/Innovation Democracy .............................................. 11
2.2 Choice Awareness .......................................................................................................... 13
2.3 Theoretical Approach ..................................................................................................... 15
2.3.1 Actor and institutional delimitation. ...................................................................... 16
2.3.2 Technical and environmental Delimitations .......................................................... 17
2.4 Forecasting, Scenario Planning and Backcasting framework......................................... 19
2.5 Stakeholder analysis ...................................................................................................... 20
3 Methodological Framework ................................................................................................... 25
3.1.1 Literature Study ..................................................................................................... 25
3.1.2 Data gathering........................................................................................................ 26
3.1.3 Correspondence ..................................................................................................... 27
3.1.4 energyPRO Modelling Software ............................................................................. 28
4 Stakeholder Analysis .............................................................................................................. 31
4.1 Influence/Engagement Matrix ....................................................................................... 31
5 Description of Danish Energy Market .................................................................................... 35
5.1 Main actors within the market ...................................................................................... 35
5.2 Interchanging price throughout the electricity market ................................................. 37
5.3 Power to Heat Technologies Participation in Electricity Market ................................... 39
6 Technical and Legislative Description for Heat Pumps .......................................................... 41
Contents
V
6.1 Technical characteristics of a Heat Pump....................................................................... 41
6.2 Current status and advancement of Heat Pumps .......................................................... 42
6.3 Taxes and Levies applied on DH plants .......................................................................... 43
6.3.1 Energy tax ............................................................................................................... 44
6.3.2 PSO-tariff ................................................................................................................ 44
6.3.3 Grid Tariff ................................................................................................................ 46
7 Model Analysis ....................................................................................................................... 49
7.1 Description of Hou’s Fjernvarme .................................................................................... 49
7.2 Description of Analysis ................................................................................................... 49
7.3 Market Simulation Analysis ............................................................................................ 51
7.4 Technical Investment Simulation Analysis ..................................................................... 52
7.5 Leviable Simulation Analysis........................................................................................... 54
7.6 Sensitivity Analysis.......................................................................................................... 56
8 Solutions and reflections ........................................................................................................ 59
8.1 Discussions ..................................................................................................................... 59
8.2 Summary of Discussion................................................................................................... 60
8.3 Limitations in Discussion ................................................................................................ 61
9 Conclusion .............................................................................................................................. 63
9.1 Recommendations .......................................................................................................... 63
9.2 Summary of Results ........................................................................................................ 64
10 Publication bibliography ..................................................................................................... 65
Appendix A: Historic Policy Making .................................................................................... 69
Appendix B: Emails ............................................................................................................. 71
Appendix C: Net Heat Production Cost (NHPC) calculations .............................................. 73
Appendix D: Overview of Finances ..................................................................................... 83
Content of CD Appendix ..................................................................................................... 85
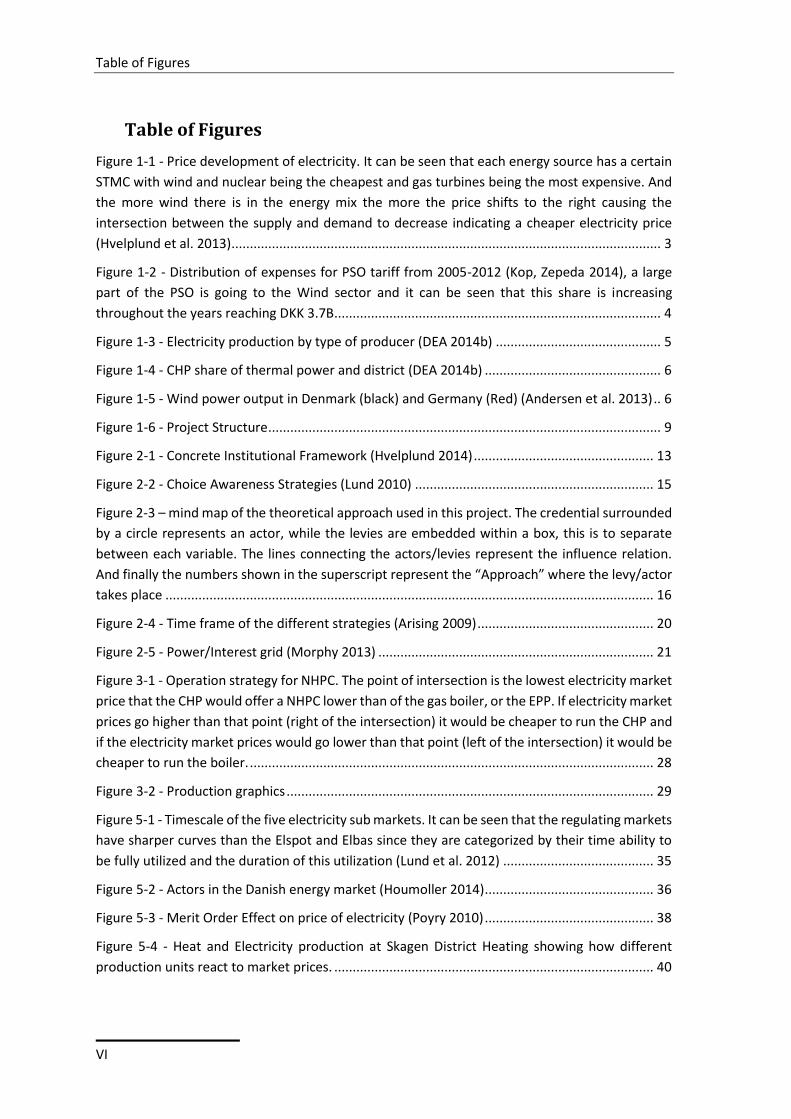
Table of Figures
VI
Table of Figures
Figure 1-1 - Price development of electricity. It can be seen that each energy source has a certain
STMC with wind and nuclear being the cheapest and gas turbines being the most expensive. And
the more wind there is in the energy mix the more the price shifts to the right causing the
intersection between the supply and demand to decrease indicating a cheaper electricity price
(Hvelplund et al. 2013) ..................................................................................................................... 3
Figure 1-2 - Distribution of expenses for PSO tariff from 2005-2012 (Kop, Zepeda 2014), a large
part of the PSO is going to the Wind sector and it can be seen that this share is increasing
throughout the years reaching DKK 3.7B ......................................................................................... 4
Figure 1-3 - Electricity production by type of producer (DEA 2014b) ............................................. 5
Figure 1-4 - CHP share of thermal power and district (DEA 2014b) ................................................ 6
Figure 1-5 - Wind power output in Denmark (black) and Germany (Red) (Andersen et al. 2013) .. 6
Figure 1-6 - Project Structure ........................................................................................................... 9
Figure 2-1 - Concrete Institutional Framework (Hvelplund 2014) ................................................. 13
Figure 2-2 - Choice Awareness Strategies (Lund 2010) ................................................................. 15
Figure 2-3 – mind map of the theoretical approach used in this project. The credential surrounded
by a circle represents an actor, while the levies are embedded within a box, this is to separate
between each variable. The lines connecting the actors/levies represent the influence relation.
And finally the numbers shown in the superscript represent the “Approach” where the levy/actor
takes place ..................................................................................................................................... 16
Figure 2-4 - Time frame of the different strategies (Arising 2009) ................................................ 20
Figure 2-5 - Power/Interest grid (Morphy 2013) ........................................................................... 21
Figure 3-1 - Operation strategy for NHPC. The point of intersection is the lowest electricity market
price that the CHP would offer a NHPC lower than of the gas boiler, or the EPP. If electricity market
prices go higher than that point (right of the intersection) it would be cheaper to run the CHP and
if the electricity market prices would go lower than that point (left of the intersection) it would be
cheaper to run the boiler. .............................................................................................................. 28
Figure 3-2 - Production graphics .................................................................................................... 29
Figure 5-1 - Timescale of the five electricity sub markets. It can be seen that the regulating markets
have sharper curves than the Elspot and Elbas since they are categorized by their time ability to
be fully utilized and the duration of this utilization (Lund et al. 2012) ......................................... 35
Figure 5-2 - Actors in the Danish energy market (Houmoller 2014) .............................................. 36
Figure 5-3 - Merit Order Effect on price of electricity (Poyry 2010) .............................................. 38
Figure 5-4 - Heat and Electricity production at Skagen District Heating showing how different
production units react to market prices. ....................................................................................... 40
Table of Figures
VII
Figure 6-1 - Operation strategy used in simulating showing how the different units on site operate
(partial load/full load) and which are selected to fill the thermal store. ....................................... 42
Figure 6-2 – Location of HPs in Denmark (Grøn Energi et al. 2014a) ............................................. 43
Figure 6-3 - Direct relation of PSO to electricity prices (Energistyrelsen 2012) ............................. 45
Figure 6-4 - PSO progression (Energistyrelsen 2012) ..................................................................... 46
Figure 7-1 - Layout of Hou’s DH plant as it stands today. .............................................................. 49
Figure 7-2 - Balance Sheet of Operation ........................................................................................ 50
Figure 7-3 - Market Optimization Heat Production amount .......................................................... 52
Figure 7-4 - Technical Optimization Heat Production amount ...................................................... 54
Figure 7-5 - Leviable Optimization Heat Production amount ........................................................ 55
Figure 7-6 - sensitivity analysis graph representing the impact of PSO on the OPEX. ................... 56
Figure 7-7 - sensitivity analysis graph representing the impact of PSO on the heat production from
the HP. ............................................................................................................................................ 56
Figure 9-1 - NHPC of different units installed in the DH plant. The gas boiler is at a constant price
since the heat price depends on the natrual gas cost which a fixed cost based on a contract. As for
the CHP and HP the diagonal line is due to the change in electricity prices, according to each hour
a different NHPC for the CHP and HP is set. The point where the two lines intersect is the minimum
biding price for the sale/purchace of electrcity or in other words the break even point (BEP) from
the CHP and HP. ............................................................................................................................. 73
Figure 9-2 - Overview of taxes paid by DH plants .......................................................................... 83
Figure 9-3 - Percentage of difference between scenarios ............................................................. 84
List of Tables
VIII
List of Tables
Table 1-1 - (table on left) How NHPC for producing 1 MWhth (table on right) EBP for producing 1
MWhel (Sievers et al. 2005) .............................................................................................................. 4
Table 3-1 - Overview on the methods used to solve the research question. ................................ 25
Table 5-1 - Action to Market Decision Making .............................................................................. 39
Table 6-1 - Taxes and levies paid by each fuel used on a DH plant (Dansk Fjernvarme 2015c) .... 44
Table 7-1 - Description of the scenarios analyzed, the “" represents the attribute included in the
scenario. The percentages under the “levy/tax” column represent the amount of levy/tax included
in the analysis from the total amount of levy/tax. ........................................................................ 51
Table 7-2 - Market Analysis comparison table............................................................................... 51
Table 7-3 - Market Analysis Energy Conversion Units ................................................................... 52
Table 7-4 - Technical Analysis Comparison Table .......................................................................... 53
Table 7-5 - Technical Analysis Energy Conversion units ................................................................ 53
Table 7-6 - Leviable Analysis Comparison Table ............................................................................ 55
Table 7-7 - Leviable Analysis Energy Conversion Units .................................................................. 55
Table 7-8 – Accumulative Percentage of Change between Scenarios ........................................... 57
Table 9-1 – NHPC of 1 MWhth from the boiler ............................................................................... 75
Table 9-2 - Balance of electricity price between CHP and boiler (point of intersection) .............. 75
Table 9-3 - NHPC of 1 MWhth from the CHP gas engine ................................................................ 76
Table 9-4 - NHPC of 1 MWhth from the HP unit ............................................................................. 77
List of Equations
IX
List of Equations
Equation 9-1 – Method used in calculating the fuel consumption by each unit in to produce 1
MWhth ............................................................................................................................................. 74
Equation 9-2 – “E-formel” Percentage of fuel taxed in CHP (Ea Energianalyse 2010, p. 6) ........... 76
Equation 9-3 - Fuel (electricity) consumption of HP ...................................................................... 77

Problem Analysis
1
1 Problem Analysis
1.1 Transition within the Danish energy sector
For decades now countries and organizations around the world have been actively setting goals
and plans in orders to reduce greenhouse gas (GHG) emissions, secure a better supply for energy
and increase energy efficiency (Chittum, Østergaard 2014). With the European Union (EU) setting
ambitious goals for such as the 2020 Climate and Energy Package which ensures that all EU
member states to meet three key targets by the year 2020; The reduction of GHG emissions by
20% from the levels measured in 1990, increase in the energy consumed from renewables by 20%,
and 20% increase in energy efficiency. Also known as the 20-20-20 targets. (European Commission
2007). Therefore the Danish Government has committed itself to reduce the national’s GHG
emissions by 40% by the year 2020. Nonetheless The Danish Energy agency (DEA) has decided on
more ambitious goals which is inspired by the Danish Government’s goals and plans, some of the
these objectives is that around 50% of electricity consumption by 2020 should be supplied from
wind power, and that by 2050 Denmark should be 100% fossil free and self-sufficient from
renewables these objectives are often known as the Energy Agreement.
Danish institutions started designing future scenarios in order to assist in reaching the desired
goals, and allow this high penetration of renewable energy share (RES) in the system. Where
extensive efforts have been put into setting plans and agendas.
The DEA has devolved four scenarios for the future of the Danish Energy system, the purpose
behind these scenarios is to design a framework for the energy agreement, the scenarios clear the
picture on some of the technologies that would be viable to achieve such target under realistic
assumption, as well as layout some of the challenges that could be met thought the transition
(DEA 2014a).
The Danish Society of Engineers (IDA) have developed a plan known as “The IDA Climate Plan
2050”, the objectives of this plan is to ensure that there are technical and economical feasible
solutions to reach the desired goal while still evolving an economic development and security of
supply (Brian Vad Mathiesen et al. 2009)
Similarly, the Coherent Energy and Environmental System Analysis (CEESA) which is a project
designed by a spectrum of professionals from different universities and Danish research
institutions specializing in the field of energy systems, the purpose of this project was to use the
current technologies and methods and integrate them into a coherent energy and environmental
design for achieving the future renewable energy system. This research also took into
consideration socioeconomic, political and technical measures (Pernille Sylvest Andersen 2011).
Problem Analysis
2
1.2 Danish District Heating Status
Many studies have showed that district heating (DH) could be one of the methods used to utilize
energy to help reach the desired GHG reduction goals set by the EU and Danish government. DH
is also capable of delivering inexpensive heat to consumers as well as providing flexibility for the
electricity system when combined with a CHP (CHPDH), only 18% of the electricity produced in
1980 was in combination with heat, in 2011 this number reached 63% (Chittum, Østergaard 2014;
DEA 2012). The Danish board of district heating (DBDH) have stated that in the last three decades
Denmark has successfully managed to sustain a stable energy consumption while the economy
increased, this impacted the CO2 emissions reduction significantly. More than 60% of the Danish
consumers are supplied with CHPDH, with 45% coming from renewables (DBDH 2008). This high
share of CHPDH have reduced CO2 emissions in the Danish heating sector by 60%. And 20% in the
overall country’s emissions. District heating covers more than 55% of the net energy demand
required for heating (DEA 2012).
1.3 Wind Energy Share within the Danish Energy Mix
Denmark is currently on the right track, renewables cover more than 40% of the demand, 30% of
which is from wind, and it is expected that renewables will reach 70% in 2020 with wind covering
50% of this proportion (DEA 2012). It is also estimated by the DEA and CEESA plans that the
electricity generated from wind energy would range between 50% and 200% from the forecasted
demand, the DEA has predicted in one of its scenarios an increase in wind power in 2050 up to
14.000 MW that is an increase of 290% from the 2013 capacity of 4.810 MW.
1.3.1 Impact of surging wind production
Impact on electricity System
However, the increase of wind power comes with consequences. Wind power has proven to cause
instability in the electricity grid if it exceeded the demand due to the natural intermittency of wind
this is considered a challenge to control. This instability happens when the electricity coming from
wind turbines exceeds the demand at a certain point in time, since wind turbines generate
electricity according to how strong and how often the wind blows therefore it is rather challenging
to control the amount of electricity generated from the turbines to meet the demand. In 2014
there was about 2.960 hours with surplus of electricity which is 33% of the entire year, in these
hours wind reached up to 60% from the total electricity production (Energinet.dk 2014).
Consequently if the electricity supply system could not discharge this surplus of electricity the
system would break down (Lund, Münster 2003)
Problem Analysis
3
Impact on Price:
Another issue facing the surplus of wind production is the decrease in the wholesale electricity
prices, due to the low short term marginal cost (STMC) of wind compared to other technologies
such as oil or coal. This increase in wind production cause the supply curve in a typical supply and
demand graph to shift to the right side and while the demand for electricity is rather inelastic
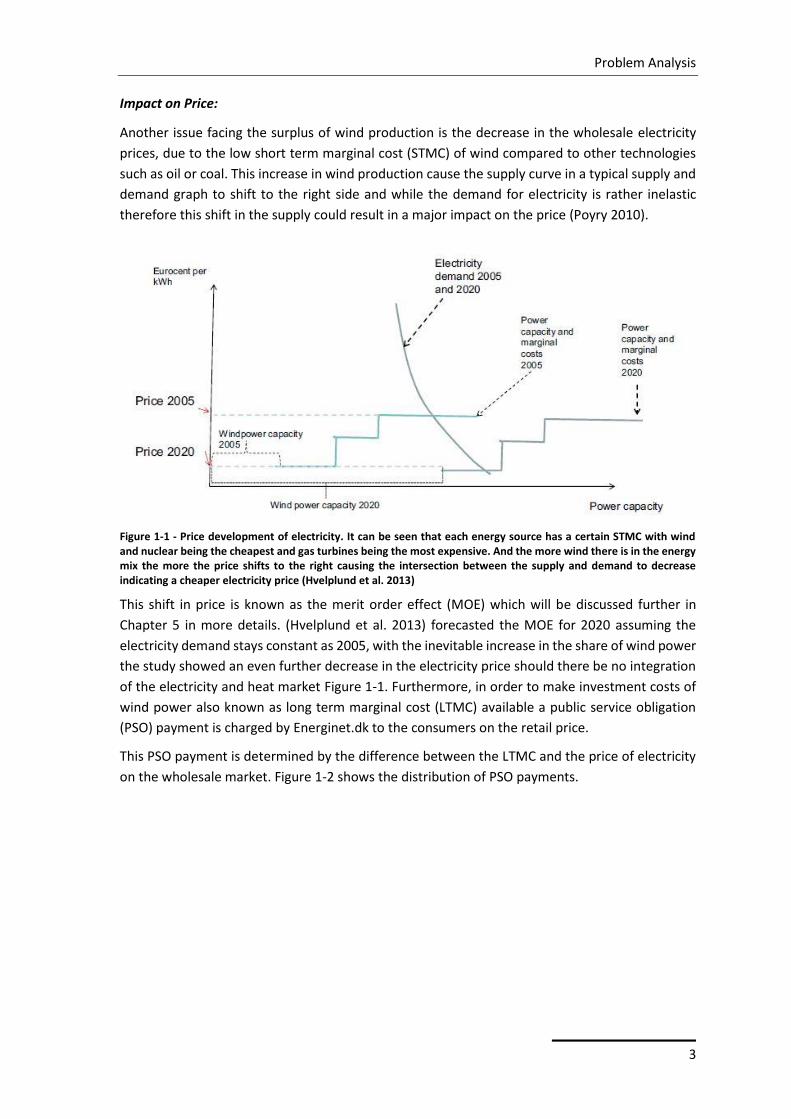
therefore this shift in the supply could result in a major impact on the price (Poyry 2010).
Figure 1-1 - Price development of electricity. It can be seen that each energy source has a certain STMC with wind and nuclear being the cheapest and gas turbines being the most expensive. And the more wind there is in the energy mix the more the price shifts to the right causing the intersection between the supply and demand to decrease indicating a cheaper electricity price (Hvelplund et al. 2013)
This shift in price is known as the merit order effect (MOE) which will be discussed further in
Chapter 5 in more details. (Hvelplund et al. 2013) forecasted the MOE for 2020 assuming the
electricity demand stays constant as 2005, with the inevitable increase in the share of wind power
the study showed an even further decrease in the electricity price should there be no integration
of the electricity and heat market Figure 1-1. Furthermore, in order to make investment costs of
wind power also known as long term marginal cost (LTMC) available a public service obligation
(PSO) payment is charged by Energinet.dk to the consumers on the retail price.
This PSO payment is determined by the difference between the LTMC and the price of electricity
on the wholesale market. Figure 1-2 shows the distribution of PSO payments.
Problem Analysis
4
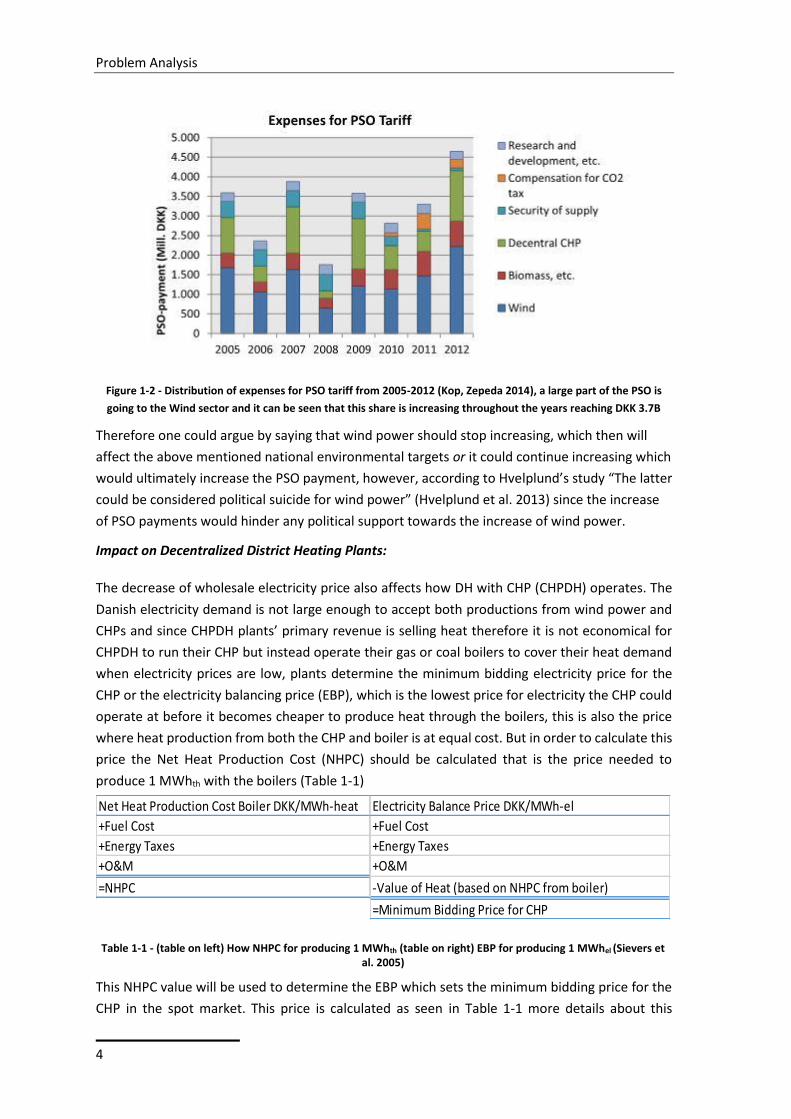
Figure 1-2 - Distribution of expenses for PSO tariff from 2005-2012 (Kop, Zepeda 2014), a large part of the PSO is
going to the Wind sector and it can be seen that this share is increasing throughout the years reaching DKK 3.7B
Therefore one could argue by saying that wind power should stop increasing, which then will
affect the above mentioned national environmental targets or it could continue increasing which
would ultimately increase the PSO payment, however, according to Hvelplund’s study “The latter
could be considered political suicide for wind power” (Hvelplund et al. 2013) since the increase
of PSO payments would hinder any political support towards the increase of wind power.
Impact on Decentralized District Heating Plants:
The decrease of wholesale electricity price also affects how DH with CHP (CHPDH) operates. The
Danish electricity demand is not large enough to accept both productions from wind power and
CHPs and since CHPDH plants’ primary revenue is selling heat therefore it is not economical for
CHPDH to run their CHP but instead operate their gas or coal boilers to cover their heat demand
when electricity prices are low, plants determine the minimum bidding electricity price for the
CHP or the electricity balancing price (EBP), which is the lowest price for electricity the CHP could
operate at before it becomes cheaper to produce heat through the boilers, this is also the price
where heat production from both the CHP and boiler is at equal cost. But in order to calculate this
price the Net Heat Production Cost (NHPC) should be calculated that is the price needed to
produce 1 MWhth with the boilers (Table 1-1)
This NHPC value will be used to determine the EBP which sets the minimum bidding price for the
CHP in the spot market. This price is calculated as seen in Table 1-1 more details about this
Net Heat Production Cost Boiler DKK/MWh-heat
+Fuel Cost
+Energy Taxes
+O&M
=NHPC
Electricity Balance Price DKK/MWh-el
+Fuel Cost
+Energy Taxes
+O&M
-Value of Heat (based on NHPC from boiler)
=Minimum Bidding Price for CHP
Table 1-1 - (table on left) How NHPC for producing 1 MWhth (table on right) EBP for producing 1 MWhel (Sievers et al. 2005)
Problem Analysis
5
calculation and how it’s linked to this project is found in Appendix C. Since the NHPC from the CHP
is dependent on the electricity price therefore the NHPC of the CHP would vary each hour.
It is now possible for the CHPDH scheme to decide when it is economically profitable to operate
each unit. If the spot price is lower than the EBP it is then cheaper to produce heat using the
boilers, while if the spot price is higher than the EBP it is cheaper to operate the CHP.
As seen in Table 1-1 the sale of electricity plays an essential role for plants when deciding whether
to run their CHP or not, for that if the price of wholesale electricity is low it would cost the plant
more to run the CHP therefore its economically profitable for them to run the boiler. This Decrease
in operating hours of a CHP affects their long term marginal cost, this will result in CHP plants
being phased out of the energy market or forced to shut down (Andersen et al. 2014; Paul-Fredrik
Bach 2011).
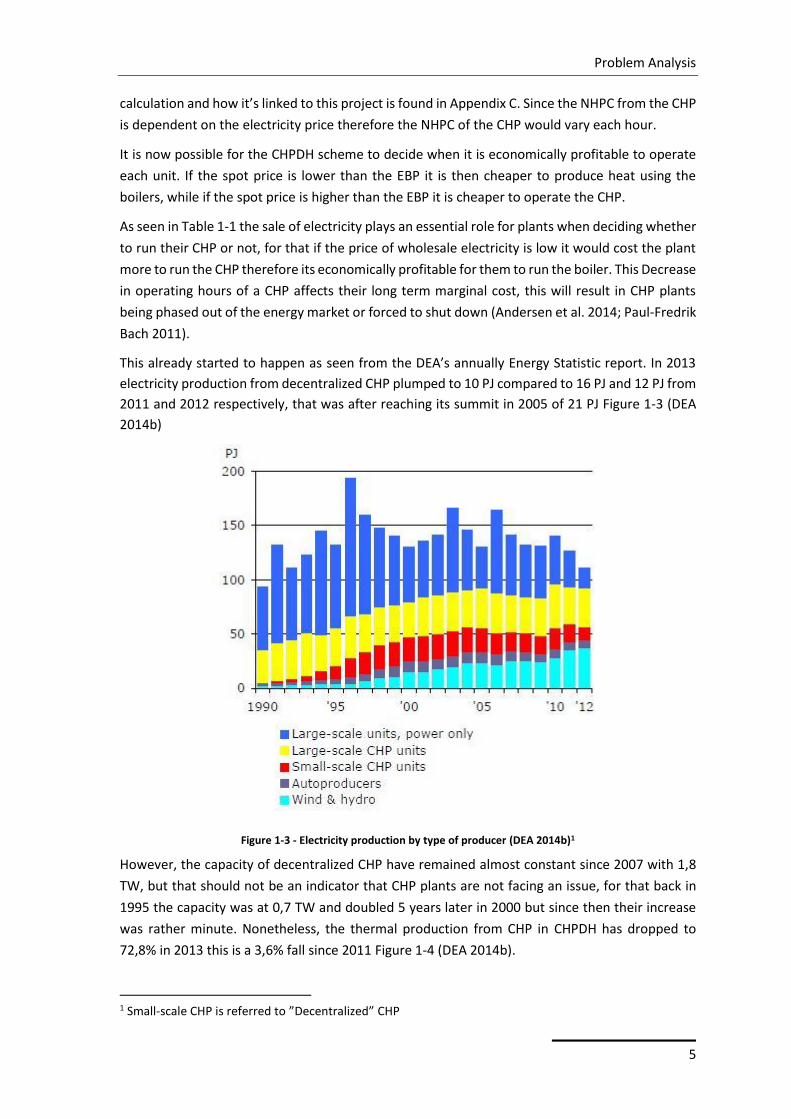
This already started to happen as seen from the DEA’s annually Energy Statistic report. In 2013
electricity production from decentralized CHP plumped to 10 PJ compared to 16 PJ and 12 PJ from
2011 and 2012 respectively, that was after reaching its summit in 2005 of 21 PJ Figure 1-3 (DEA
2014b)
Figure 1-3 - Electricity production by type of producer (DEA 2014b)1
However, the capacity of decentralized CHP have remained almost constant since 2007 with 1,8
TW, but that should not be an indicator that CHP plants are not facing an issue, for that back in
1995 the capacity was at 0,7 TW and doubled 5 years later in 2000 but since then their increase
was rather minute. Nonetheless, the thermal production from CHP in CHPDH has dropped to
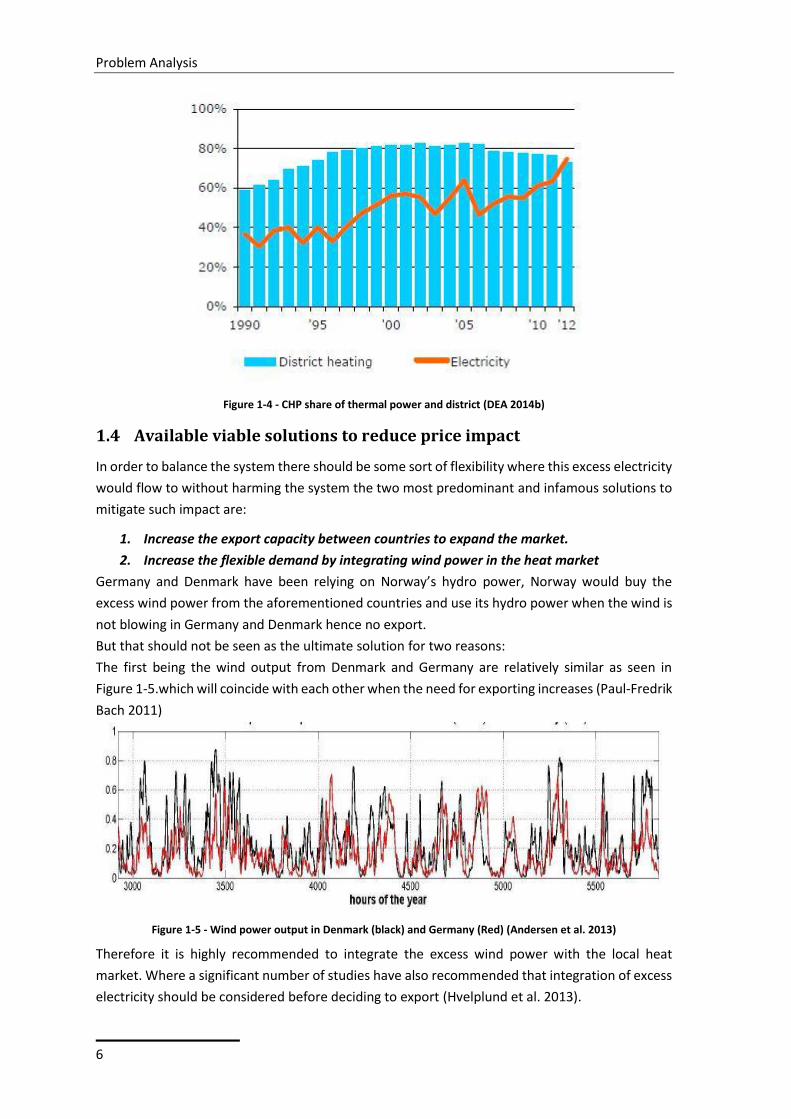
72,8% in 2013 this is a 3,6% fall since 2011 Figure 1-4 (DEA 2014b).
1 Small-scale CHP is referred to ”Decentralized” CHP
Problem Analysis
6
Figure 1-4 - CHP share of thermal power and district (DEA 2014b)
1.4 Available viable solutions to reduce price impact
In order to balance the system there should be some sort of flexibility where this excess electricity
would flow to without harming the system the two most predominant and infamous solutions to
mitigate such impact are:
1. Increase the export capacity between countries to expand the market.
2. Increase the flexible demand by integrating wind power in the heat market
Germany and Denmark have been relying on Norway’s hydro power, Norway would buy the
excess wind power from the aforementioned countries and use its hydro power when the wind is
not blowing in Germany and Denmark hence no export.
But that should not be seen as the ultimate solution for two reasons:
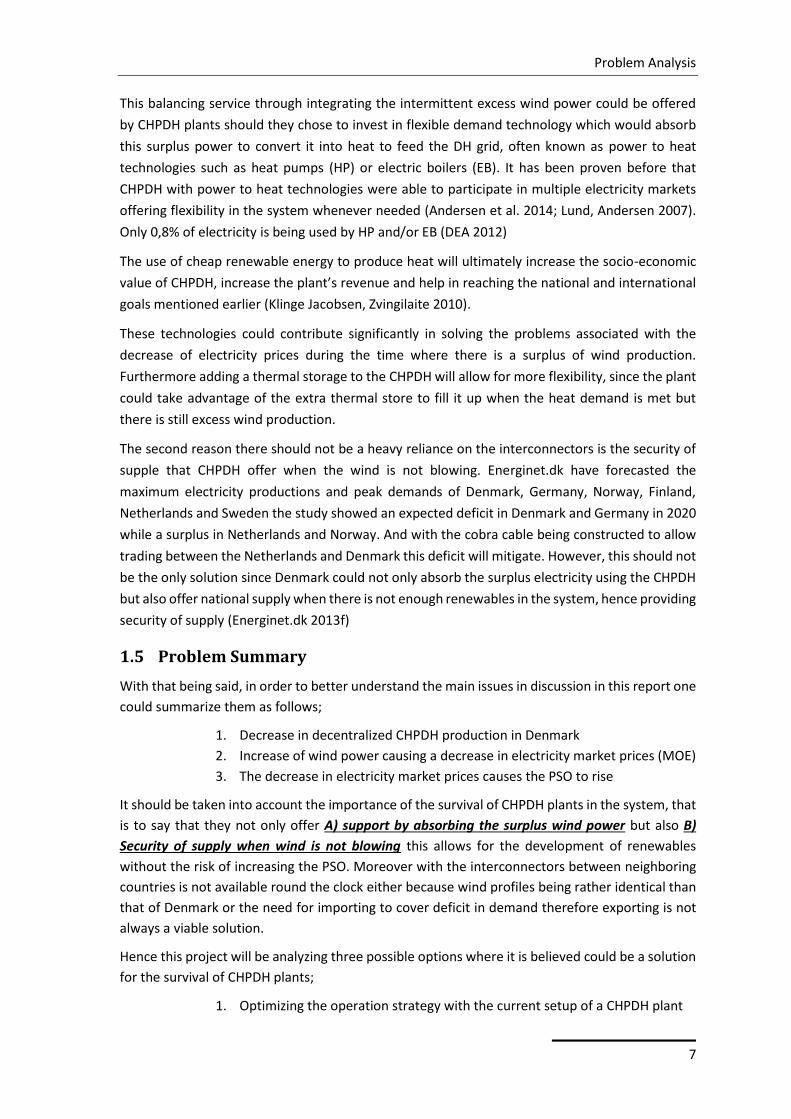
The first being the wind output from Denmark and Germany are relatively similar as seen in
Figure 1-5.which will coincide with each other when the need for exporting increases (Paul-Fredrik
Bach 2011)
Figure 1-5 - Wind power output in Denmark (black) and Germany (Red) (Andersen et al. 2013)
Therefore it is highly recommended to integrate the excess wind power with the local heat
market. Where a significant number of studies have also recommended that integration of excess
electricity should be considered before deciding to export (Hvelplund et al. 2013).
Problem Analysis
7
This balancing service through integrating the intermittent excess wind power could be offered
by CHPDH plants should they chose to invest in flexible demand technology which would absorb
this surplus power to convert it into heat to feed the DH grid, often known as power to heat
technologies such as heat pumps (HP) or electric boilers (EB). It has been proven before that
CHPDH with power to heat technologies were able to participate in multiple electricity markets
offering flexibility in the system whenever needed (Andersen et al. 2014; Lund, Andersen 2007).
Only 0,8% of electricity is being used by HP and/or EB (DEA 2012)
The use of cheap renewable energy to produce heat will ultimately increase the socio-economic
value of CHPDH, increase the plant’s revenue and help in reaching the national and international
goals mentioned earlier (Klinge Jacobsen, Zvingilaite 2010).
These technologies could contribute significantly in solving the problems associated with the
decrease of electricity prices during the time where there is a surplus of wind production.
Furthermore adding a thermal storage to the CHPDH will allow for more flexibility, since the plant
could take advantage of the extra thermal store to fill it up when the heat demand is met but
there is still excess wind production.
The second reason there should not be a heavy reliance on the interconnectors is the security of
supple that CHPDH offer when the wind is not blowing. Energinet.dk have forecasted the
maximum electricity productions and peak demands of Denmark, Germany, Norway, Finland,
Netherlands and Sweden the study showed an expected deficit in Denmark and Germany in 2020
while a surplus in Netherlands and Norway. And with the cobra cable being constructed to allow
trading between the Netherlands and Denmark this deficit will mitigate. However, this should not
be the only solution since Denmark could not only absorb the surplus electricity using the CHPDH
but also offer national supply when there is not enough renewables in the system, hence providing
security of supply (Energinet.dk 2013f)
1.5 Problem Summary
With that being said, in order to better understand the main issues in discussion in this report one
could summarize them as follows;
1. Decrease in decentralized CHPDH production in Denmark
2. Increase of wind power causing a decrease in electricity market prices (MOE)
3. The decrease in electricity market prices causes the PSO to rise
It should be taken into account the importance of the survival of CHPDH plants in the system, that
is to say that they not only offer A) support by absorbing the surplus wind power but also B)
Security of supply when wind is not blowing this allows for the development of renewables
without the risk of increasing the PSO. Moreover with the interconnectors between neighboring
countries is not available round the clock either because wind profiles being rather identical than
that of Denmark or the need for importing to cover deficit in demand therefore exporting is not
always a viable solution.
Hence this project will be analyzing three possible options where it is believed could be a solution
for the survival of CHPDH plants;
1. Optimizing the operation strategy with the current setup of a CHPDH plant
Problem Analysis
8
2. Retrofitting the setup by investing in a HP while using the current institutional
payments (ex. taxes, tariffs, levies, etc.) in the analysis
3. Investing in a power to heat technology meanwhile modifying the current
institutional payments applied on the power to heat technologies
1.6 Research Question
With the expected increase in wind production and the current status of CHPDH it should be noted
that it is of great importance to keep CHPDH in the market, especially that a great number of
studies have shown the importance of having power to heat technologies in a DH network in the
energy system. It is also due to note that the previously mentioned plans and goals as well as other
future plans rely on the importance of having flexible demand in the DH network.
On this basis an analysis is made to determine the optimum operational strategy for CHPDH. As
well as the type of technologies municipalities should invest in to support their DH networks.
Where the following research question is raised:
How can CHPDH strategically optimize their operation strategy to decrease their operation
expenditure by participating on multiple markets? And will investing in a power to heat
technology further decrease the plant’s operation expenditure? And what modifications could
be applied to the current institutional levies to promote power to heat investments?
In order to find a solution for the above mentioned research question three approaches will be
used in this project to aid in reaching a solution.
A brief description of these approaches is as follows;
Approach1: Optimizing the operation strategy of the current setup of a CHPDH plant, by
comparing the results from participating on a single market (Day-ahead) or multiple market (day-
ahead + RPM) and analyzing which strategy is optimum.
Approach2: Upgrading the current setup of the plant by investing in a power to heat technology,
the analysis will also be compared between participation on a single or multiple markets. This
analysis will use the current institutional levies applied on HP (PSO, energy tax, grid tariff2).
Approach3: Upgrading the current setup of the plant (same as 2nd approach) nonetheless the
institutional levies mentioned will be adjusted, this will be done to study the impact of applying
such levies on power to heat technologies.
In order to thoroughly explain the solution for the above mentioned research questions, a real
life CHPDH plant will be analyzed, where one of Aalborg Forsyning’s plants in Hou will be
modeled. There the actual previous electricity revenue in 2014 will be compared to what could
have been earned should the plant have operated optimally. This will be done by simulating the
plant via the software tool energyPRO. Then alternative scenarios will be simulated, a power to
heat technology will be retrofitted with the current levies for power to heat technologies, and
2 There are two grid tariffs applied on electricity consumers for using the electricity grid in Denmark. The local electricity grid charged by the local distributer, and the national grid charged by Energinet.dk.
Problem Analysis
9
finally scenarios analyzing the impact of modifying these levies from the power to heat
technologies.
1.7 Project Overview
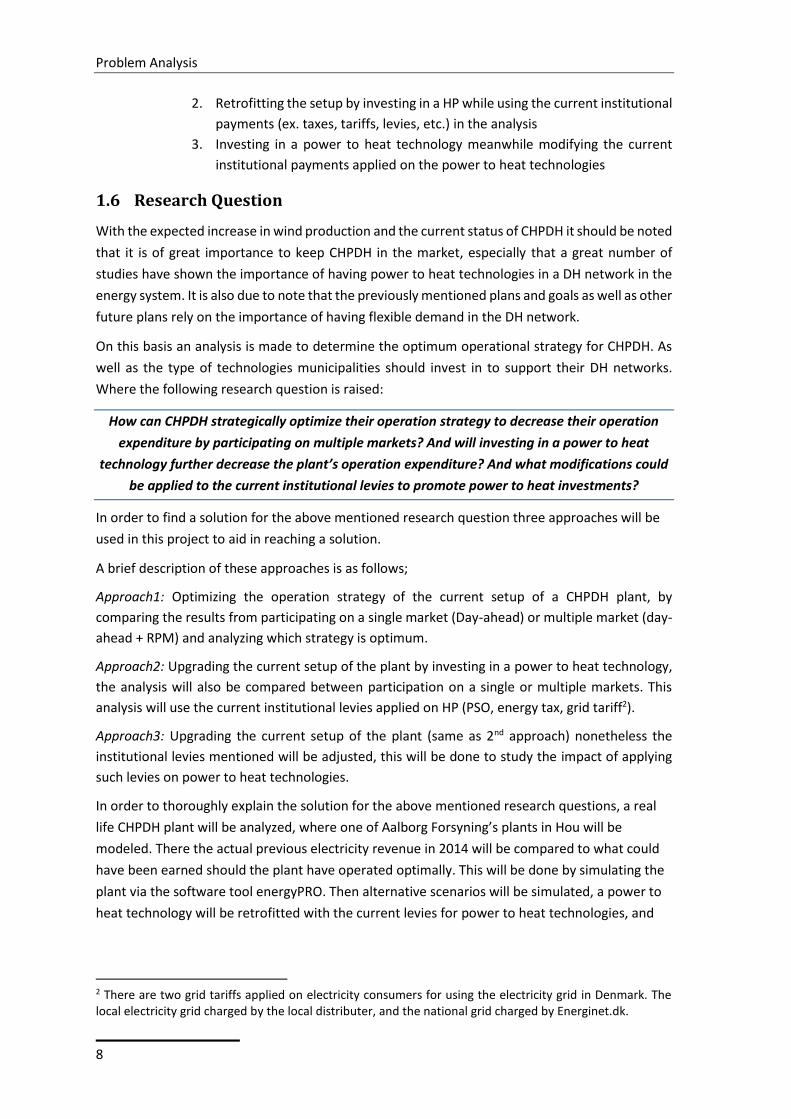
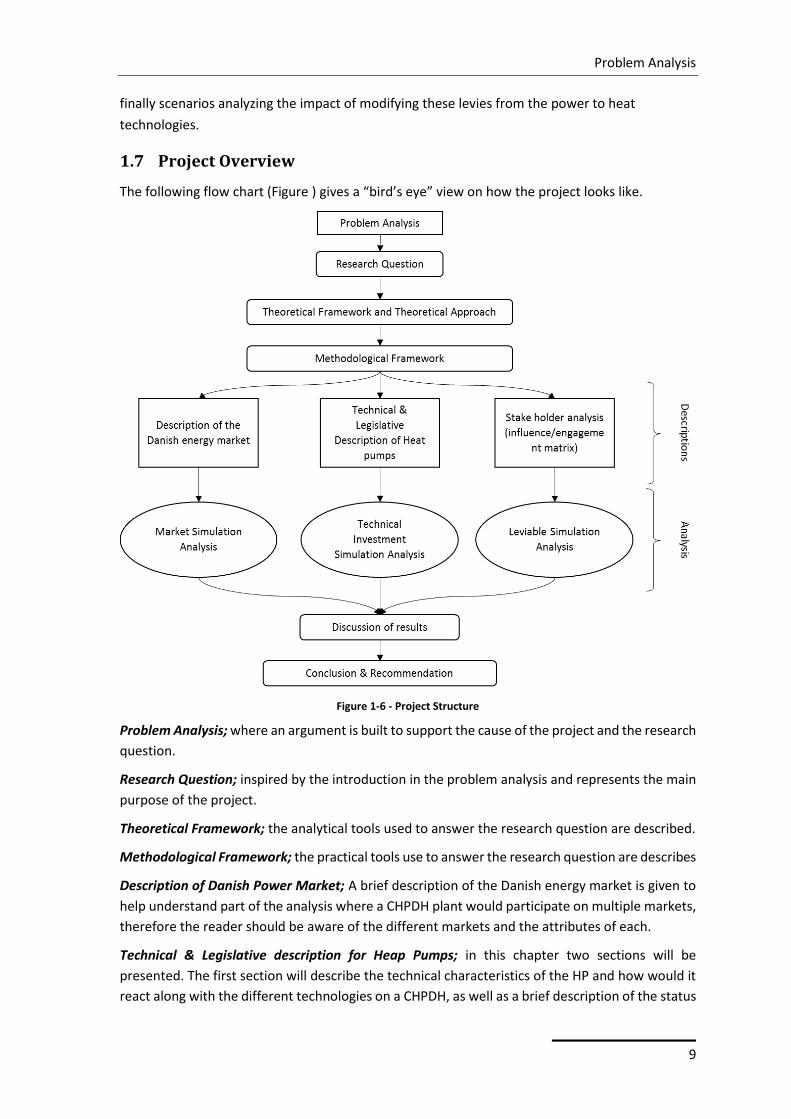
The following flow chart (Figure ) gives a “bird’s eye” view on how the project looks like.
Figure 1-6 - Project Structure
Problem Analysis; where an argument is built to support the cause of the project and the research
question.
Research Question; inspired by the introduction in the problem analysis and represents the main
purpose of the project.
Theoretical Framework; the analytical tools used to answer the research question are described.
Methodological Framework; the practical tools use to answer the research question are describes
Description of Danish Power Market; A brief description of the Danish energy market is given to
help understand part of the analysis where a CHPDH plant would participate on multiple markets,
therefore the reader should be aware of the different markets and the attributes of each.
Technical & Legislative description for Heap Pumps; in this chapter two sections will be
presented. The first section will describe the technical characteristics of the HP and how would it
react along with the different technologies on a CHPDH, as well as a brief description of the status
Problem Analysis
10
and development of HPs within the DH sector. As for the second part it will discuss the different
levies analyzed in this project which are required by the HP installed in a CHPDH, it is essential to
understand these levies in order to get a better understanding of the analysis made in this project.
The information is based on literature studies and interviews.
Stakeholder Analysis; The most influential actors and stakeholders are deployed in an
influence/engagement matrix to get a clearer picture on this influential power affecting the levies
paid by the DH plant owning a HP. This analysis does not discuss how these actors affect the levies
it simply portrays their position of power.
Market Simulation Analysis This subchapter simulates the current layout of the plant for the year
2014 with two scenarios one of which the plant operates on the spot (Elspot) market and the
other where the plant operates on the Elspot and the regulating power market (RPM). These
scenarios are compared with the operation expenditure (OPEX) of what they actually earned in
2014.
Technical Investment Simulation Analysis; The scenarios in this subchapter will simulate the
forecasted OPEX of 2015 with the current layout of the plant without a HP and compare it to the
forecast of the same year but after retrofitting a HP, the scenarios will include the current levies
applied on HP and will consists of scenarios on the Elspot and Elspot+RPM participation.
Leviable Simulation Analysis; The final section of the simulation will analyze the potential of the
HP should the levies be modified, the same participation strategy will be simulated
Elspot/Elspot+RPM, while maintaining the same forecasted OPEX of the year 2015
Discussion; A layout of the results is shown to summarize the analysis and compare the relevant3
scenarios together.
Conclusion and Recommendations; finally this chapter will conclude the answer to the research
question and some recommendations will be suggested that are believed would be of assistance
to the analysis.
It should be noted that the main purpose of this project is to study the economic and technical
potential of decentralized CHPDH plants by optimizing the operation strategy of the plant, this will
be done by studying Aalborg Forsyning’s CHPDH plant in the Danish town of Hou.
3 Relevant scenarios refer to parameters that include the same comparable attributes so as to represent a realistic connection.
Theoretical Framework
11
2 Theoretical Framework
This chapter will present the theories used to get a better understanding about the problem
formulation and the methods needed to solve the research question. It also represents the
“theoretical approach” which explains the author’s own theory in understanding the scope of the
project.
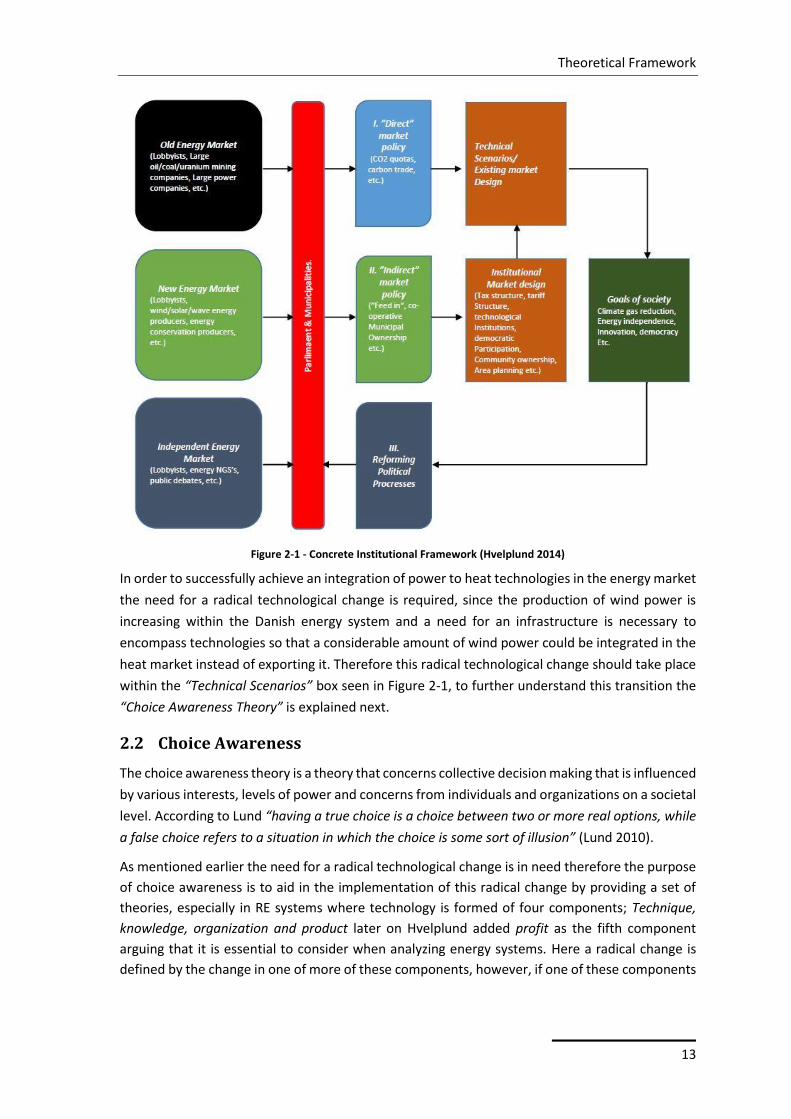
2.1 Concrete Institutional Economy/Innovation Democracy
To get a clear picture about how the energy market is understood and should be seen in this report
Figure 2-1 depicts the paradigm of the concrete institutional economy and innovation democracy
the policies, actors, goals, etc. and their position in the market. The layout also shows how these
parameters influence each other.
It is essential to consider all the political and economic theories that form the energy polices when
examining the Danish energy sector, especially the ones in relation with the political designed
institution and market condition as well as the addressed technological change. The political and
market designed institutions and technologies addressed in this project would be the actors
controlling the levies paid by the CHPDH and paid to use power to heat technologies.
Since the Neoclassical Economy is based on assumptions which are not necessary in reality true
such as all actors in the market have rational preferences, sellers and buyers optimize utility and
profits respectively, and organizations and individuals act independently (Hvelplund, Lund 1998)
these assumption would be true in an optimum market therefore one could say that the
Neoclassical Economy looks at the market as a “free” market that does not consider the difference
between technologies and the different political and economic change accompanied with this
change, on the contrary, according to the assumptions, it considers these technologies to be
purely capital and that they should not take part in the market unless they will be competitive to
the existing technologies (Hvelplund 2013).
Therefore the Concrete Institutional Economy and innovative democracy approach is used in this
project, since it focuses on economic behaviors shaped by “manmade” institutions which is define
by (Hvelplund 2014) “as the economics that deals with the concrete institutional conditions which
form the development of a specific society”. The concrete institutional economy argues that the
conventional neoclassical approach is too simple to use in energy planning. This theory is applied
in this project to depict how some of these actors affect payments made by the CHPDH companies
specially companies with flexible demand technologies on site, it will then assist in the stakeholder
analysis made to identify these actors and what policies and levies they influence finally after
determining these levies alternative seniors will be designed in the “Analysis” chapter to study the
effect of these payments.
It is believed in this project that is it possible to find a better economic situation than the current.
It is also important to consider that lobbyists whom are both economically dependent and
independent influence the political process, therefore, it is believed that this type of
understanding would build the change necessary towards the 100% renewable goal (Hvelplund
2014).

Theoretical Framework
12
This economic framework is incorporated with the Innovative Democracy approach, which argues
that political processes form the market rules, unlike the neoclassical approach, it also argues that
with the current political status the fossil fuel industry shapes a strong resistance towards the
transformation to more renewable energy technologies.
Hvelplund supports the innovative democracy approach by stating that a successful transition
from fossil fuels to renewable energy (RE) requires innovative democracy, he also states that a
high level of understanding and engagement from consumers is required to overcome the
technical difficulties linked to the integrating of increased wind power (Hvelplund 2013). In this
project this kind of understanding and engagement is seen as the consumer’s participation and
understating that there is a need for an increase in power heat technologies to integrate the
fluctuations from wind power. Therefore this necessity for establishing this technical flexible
demand adds to the competition between the fossil fuel industry and the RE development which
supports the application of the concrete institutional and innovative democracy.
As can be seen in the illustration (Figure 2-1) there is no superior actor that controls the economic
system, assuming that three actors in the energy market have the same weight, the actors in the
energy markets all affect the decision taken by the Danish state or parliament, the Danish state
then decides on the direct and indirect market policies and levies, the indirect policies then affect
the market institutions4, these market institutions and direct market policies then affect the
current market status as well as the technologies within, which ultimately affects the goals of the
society, however, the society has the chance to influence this market status and the technologies
by political reforming through voting and elections.
4 According to Lund 2010 Institutions is defined as “organizations including all of the written laws and regulations and all of the unwritten codes of culture regulating them” (Lund 2010)
Theoretical Framework
13
Figure 2-1 - Concrete Institutional Framework (Hvelplund 2014)
In order to successfully achieve an integration of power to heat technologies in the energy market
the need for a radical technological change is required, since the production of wind power is
increasing within the Danish energy system and a need for an infrastructure is necessary to
encompass technologies so that a considerable amount of wind power could be integrated in the
heat market instead of exporting it. Therefore this radical technological change should take place
within the “Technical Scenarios” box seen in Figure 2-1, to further understand this transition the
“Choice Awareness Theory” is explained next.
2.2 Choice Awareness
The choice awareness theory is a theory that concerns collective decision making that is influenced
by various interests, levels of power and concerns from individuals and organizations on a societal
level. According to Lund “having a true choice is a choice between two or more real options, while
a false choice refers to a situation in which the choice is some sort of illusion” (Lund 2010).
As mentioned earlier the need for a radical technological change is in need therefore the purpose
of choice awareness is to aid in the implementation of this radical change by providing a set of
theories, especially in RE systems where technology is formed of four components; Technique,
knowledge, organization and product later on Hvelplund added profit as the fifth component
arguing that it is essential to consider when analyzing energy systems. Here a radical change is
defined by the change in one of more of these components, however, if one of these components
Theoretical Framework
14
experienced a radical change it is necessary for another component to follow this change or else
this initial change will depreciate over time.
This theory is seen most suitable for this project since it address the technological change needed
within the heat market, which takes place in the implementation and expansion of power to heat
technologies (Lund 2010).
That being said it is first believed that the initial implementation of such change are expected to
have taken place within the CHPDH network, where a number of CHPDH plants have EB and HP
installed, that represents the “product” component. Following with the knowledge that the Danish
consumers, CHPDH owners and policy makers need to be aware of, that represents the
“knowledge”, further down the line it will be necessary for operators to familiarize themselves
with how to run the new technology, bringing us to the “technique” component, ultimately after
one or more of these components have been changed, as mentioned before, the “organizational”
component will be altered, that is to say that organizations affected by and affecting this new
change will adapt, finally it is assumed in this project that this radical technological change within
the heat sector will bring further opportunities for the CHPDH plants offering extra “profit”.
The choice awareness theory addresses two theses. The first choice awareness thesis states that
the influence and arguments from the existing institutions will stand against the society’s
implementation of the objectives leading to the radical technological change, since this change
poses a threat towards their status and business, therefore they will use their current power to
defy this change. This defiance will bring any implementation of new solutions to a halt and phase
out any alternative, it will also attempt to present to society that it has no choice and that the only
choice they have is to continue with the existing technology giving society the “false choice” or
the “choice/no choice”. Concerning the development of a flexible heat demand market these
institutions are assumed in this project to be the actors in favor of the expansion of
interconnectors and export of surplus electricity as well as the fossil fuel cartels.
This project will not discuss the details about how this resistance is implemented, however, a brief
overview is given. This defiance could take various forms, such as;
Institutions will try to exclude the technical alternatives offered to the public which alters
their decision making in the institutions favor.
Institutions will try to castigate the new technology in question by criticizing its relevance
to solve the problem and not having the suitable requirements for the fit.
Institutions will try to design feasibility studies in their favor, which evaluates these new
technologies as “economically unfeasible” to society
(Lund 2010)
It can be concluded that these forms of resistance originates from the neoclassical approach
mentioned earlier, that the market is what forms the current institutional and technological
framework and that market will automatically determine and utilize the optimum solution.
Therefore the Concreter Institutional Economy previously mentioned is used in this project to
support the choice awareness theories.
Theoretical Framework
15
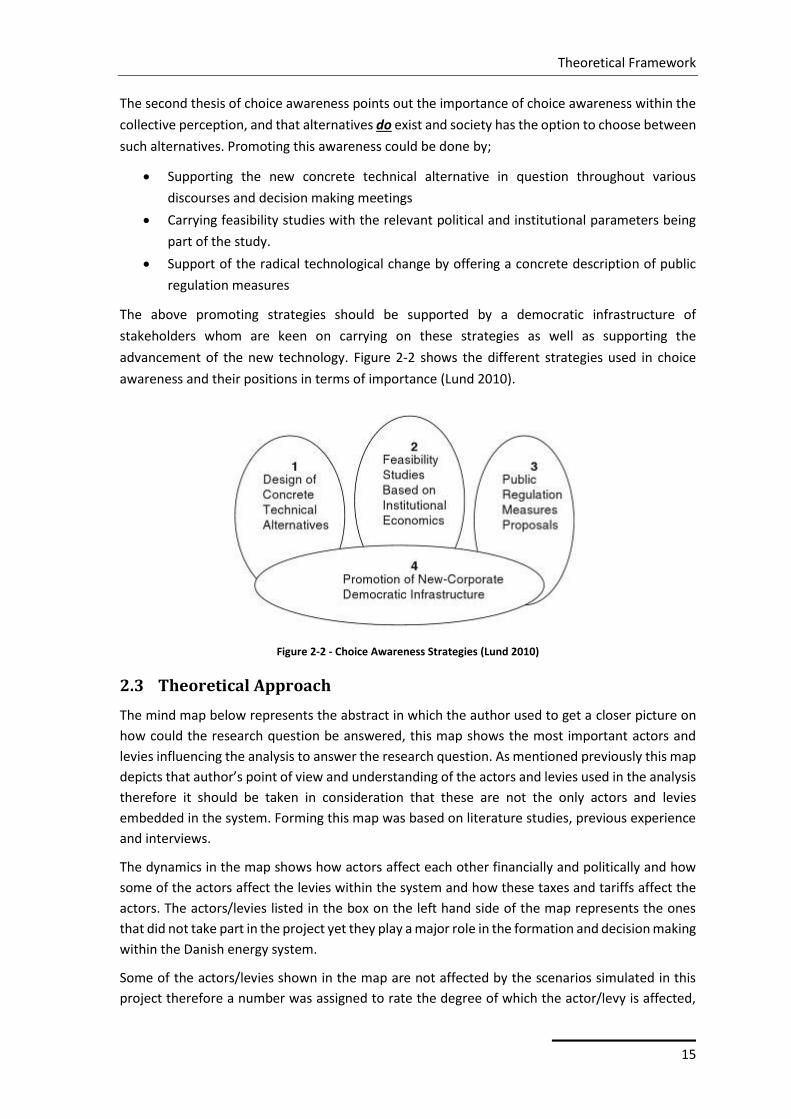
The second thesis of choice awareness points out the importance of choice awareness within the
collective perception, and that alternatives do exist and society has the option to choose between
such alternatives. Promoting this awareness could be done by;
Supporting the new concrete technical alternative in question throughout various
discourses and decision making meetings
Carrying feasibility studies with the relevant political and institutional parameters being
part of the study.
Support of the radical technological change by offering a concrete description of public
regulation measures
The above promoting strategies should be supported by a democratic infrastructure of
stakeholders whom are keen on carrying on these strategies as well as supporting the
advancement of the new technology. Figure 2-2 shows the different strategies used in choice
awareness and their positions in terms of importance (Lund 2010).
Figure 2-2 - Choice Awareness Strategies (Lund 2010)
2.3 Theoretical Approach
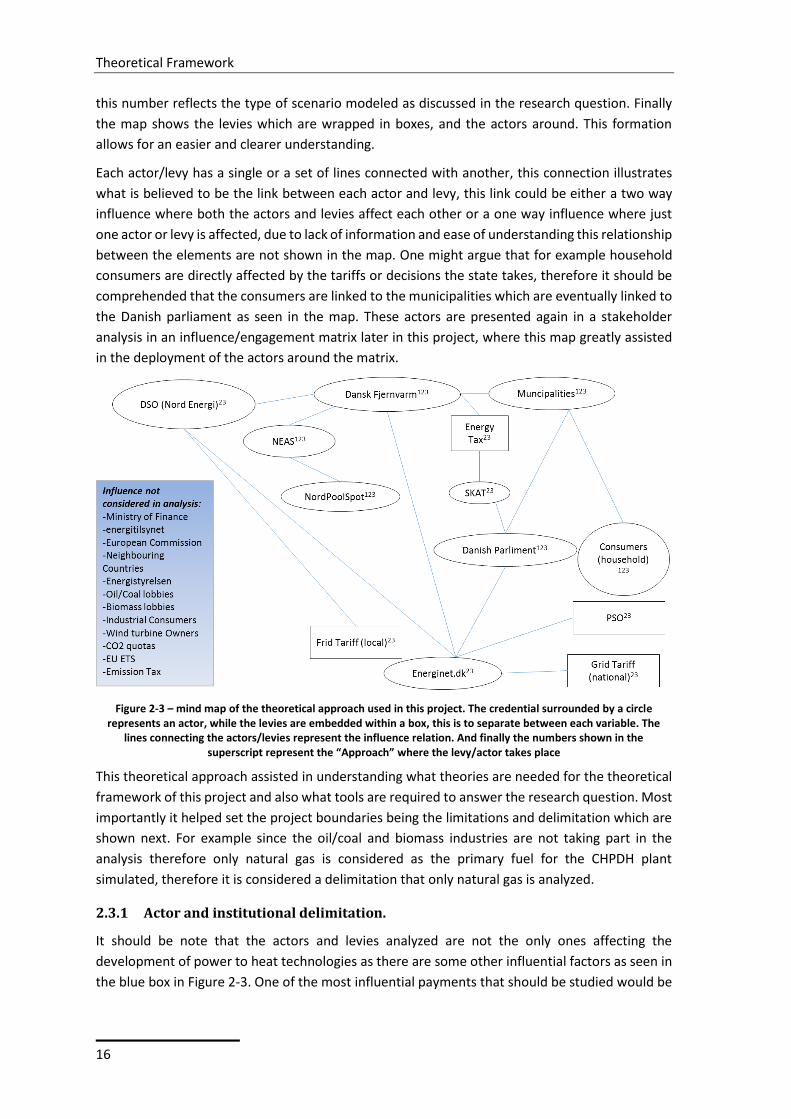
The mind map below represents the abstract in which the author used to get a closer picture on
how could the research question be answered, this map shows the most important actors and
levies influencing the analysis to answer the research question. As mentioned previously this map
depicts that author’s point of view and understanding of the actors and levies used in the analysis
therefore it should be taken in consideration that these are not the only actors and levies
embedded in the system. Forming this map was based on literature studies, previous experience
and interviews.
The dynamics in the map shows how actors affect each other financially and politically and how
some of the actors affect the levies within the system and how these taxes and tariffs affect the
actors. The actors/levies listed in the box on the left hand side of the map represents the ones
that did not take part in the project yet they play a major role in the formation and decision making
within the Danish energy system.
Some of the actors/levies shown in the map are not affected by the scenarios simulated in this
project therefore a number was assigned to rate the degree of which the actor/levy is affected,
Theoretical Framework
16
this number reflects the type of scenario modeled as discussed in the research question. Finally
the map shows the levies which are wrapped in boxes, and the actors around. This formation
allows for an easier and clearer understanding.
Each actor/levy has a single or a set of lines connected with another, this connection illustrates
what is believed to be the link between each actor and levy, this link could be either a two way
influence where both the actors and levies affect each other or a one way influence where just
one actor or levy is affected, due to lack of information and ease of understanding this relationship
between the elements are not shown in the map. One might argue that for example household
consumers are directly affected by the tariffs or decisions the state takes, therefore it should be
comprehended that the consumers are linked to the municipalities which are eventually linked to
the Danish parliament as seen in the map. These actors are presented again in a stakeholder
analysis in an influence/engagement matrix later in this project, where this map greatly assisted
in the deployment of the actors around the matrix.
Figure 2-3 – mind map of the theoretical approach used in this project. The credential surrounded by a circle represents an actor, while the levies are embedded within a box, this is to separate between each variable. The
lines connecting the actors/levies represent the influence relation. And finally the numbers shown in the superscript represent the “Approach” where the levy/actor takes place
This theoretical approach assisted in understanding what theories are needed for the theoretical
framework of this project and also what tools are required to answer the research question. Most
importantly it helped set the project boundaries being the limitations and delimitation which are
shown next. For example since the oil/coal and biomass industries are not taking part in the
analysis therefore only natural gas is considered as the primary fuel for the CHPDH plant
simulated, therefore it is considered a delimitation that only natural gas is analyzed.
2.3.1 Actor and institutional delimitation.
It should be note that the actors and levies analyzed are not the only ones affecting the
development of power to heat technologies as there are some other influential factors as seen in
the blue box in Figure 2-3. One of the most influential payments that should be studied would be
Theoretical Framework
17
the CO2 quotas (Jens Bovbjerg 2015), however, due to time limitations and the framework of this
project it was not taken into the analysis.
It is believed that some of the actors excluded from the analysis play a vital role in the
development and decision making affecting the DH plants and the potential investment of power
to heat technologies. According to (John Tang 2015) there are a number of institutions and
politicians responsible for the decision making regarding the levies and taxes paid by the DH plants
and it is not entirely based on a decision of one party, therefore it is pretty complex to clarify it
and even more complex to analyze the entire impact of changing one levy on the energy system
as well as the procedure of the decision making, hence details on how these levies are set is not
part of this project, however, the analysis will show the effect that happens on the DH plant should
these levies change. Therefore this mind map has been formed in order to set realistic boundaries
for the analysis as well as guidance for the project.
As part of the discussion of the results it is assumed that the electricity used in the power to heat
technology is from the surplus electricity from wind power, however, it should be taken in
consideration that in reality it is not an indicator that low electricity market prices are from wind
power since it depends on the bids/offers.
Suggestion on the electricity market construction or reform is not part of this analysis, nonetheless
according to John Tang the market should be more homogenous offering as much hours as high
priced electricity as low priced electricity, arguing that NordPoolSpot should reconstruct the
market in order to allow for more CHPDH plants to operate making the market more stable
2.3.2 Technical and environmental Delimitations
Electric Boilers as a technology will not be considered from this point forward since
Denmark has a capacity of 447 MWTH of EBs in 2014 (Grøn Energi et al. 2014b), and even
though Energinet.dk is assuming that this capacity will reach 450 MWTH in 2015
(Energinet.dk 2013a), it is now passed the 500 MWTH line after Studstrupværket in Aarhus
recently installed an 80 MWTH EB (Dansk Fjernvarme 2015a). Therefore this project will
focus more on the expansion of HPs since technically HPs are more efficient than EBs for
using less electricity to produce up to 3 times the heat output, and the capacity for HPs in
Denmark is at a mere 37 MWTH (Grøn Energi et al. 2014b)
The CHPDH plant modeled at Hou can only utilize 40% of its fuel as biomass from wood
pallets, however, Aalborg Forsyning is not planning on using biomass as fuel in the plant
therefore only natural gas is used in the analysis, it should also be noted that an analysis
have been carried to measure the results of converting into biomass and it was found that
the capacity of the grinding mills would be an obstacle (Jens Bovbjerg 2015).
Environmental emissions (ex: NOx, CO2, SO2) are not evaluated, since the analyzed plant
has a relatively small demand (5000 MWhth/year) therefore the amount of emissions will
be complicated to study.
The only other energy planning software investigated was energyPLAN, however, it was
not appropriate for the analysis since enrgyPLAN optimizes entire energy systems unlike
energyPRO which optimized economical and technical parameters in a specific power
plant. Nonetheless no other small scale optimization software were investigated.

Theoretical Framework
18
Individual HPs and EBs as well as the transportation sector (ex: electric vehicles) are not
included. Even though integration of these technologies would result in a better
incorporation towards the development of renewables.
The analysis focus on the day ahead market and regulating power market only.
Theoretical Framework
19
2.4 Forecasting, Scenario Planning and Backcasting framework
Forecasting
The forecasting method was chosen in this project to for its ability to use the information from a
current condition and estimate the short-term or mid-term future status of the plan bearing in
mind that no changes have happened from the current condition status. To simplify this
explanation one could say that “forecasting is drawing expectations out of expectations applied
on present circumstances” (Fazal 2011)
There are a number of forecasting methods, however, in this project only the Quantitative
Forecast is being used therefore no further explanation about the other methods will be made.
The key element of the quantitative forecasting is that is relies on historical data from the scenario
intended to predict its future status. (Inc.com 2015)
Since this project analysis the future status of decentralized CHP plants, the Forecasting method
is applied in parts of the analysis in order to determine the outcome of a given plant within a time
frame of one year in case no alterations or retrofitting to the plant has been made. The forecasting
done will be based on a CHPDH without a power to heat technology, and the same operation
strategy and market participation as used today, a variety of historical data will be used to
determine the most like possible future OPEX of this plant should no changes in the operation
strategy or retrofitting have been made to the current plant, these data will be discussed later on
in this project. The result of this forecast is then compared later on with other scenarios to analyze
the difference.
Scenario Planning:
While forecasting is proved to be a reliable technique to predict the short to mid-term future
status of a project, since, it lacks the ability to notice changes within the data it uses, especially if
these changes are significant and rapid. Therefore “scenario planning” is intended to deal with
these major changes within the data that takes place after longer periods of time (mid-term to
long-term). The scenario planning technique is used to study alternative mid to long-term futures,
their complications and viability, and also to choose between the most suitable scenarios that fits
the needs of the organization, client, individual, etc. it projects the future according to interpreted
past and present events and data, according to Bummell and MacGillvray the objective of scenario
planning is “to identify the major uncertainties affecting the strategic decisions facing a business
or the policy issues facing governments” (Brummell, MacGillivray 2011)
Backcasting:
Backcasting is known as the opposite method of forecasting, where the desired future goals or
status is defined and then adjusting the current conditions according to this target, usually these
goals are seen as long-term goals, this desired far future should be clearly identified so as the
planning and steps taken towards this future would lead towards it, this planning stage would also
confirm the feasibility of reaching this future target (Fazal 2011; Arising 2009; Quist 2008).
Therefore Backcasting is seen as “inventing the future” contrary to forecasting which “adapts to
the future” (Arising 2009). Backcasting is desirable for complex and long-term issues, since longer
time frames are often associated with uncertainty and eruption of events (Dreborg 1996).
Theoretical Framework
20
There are three key elements of Backcasting (Quist et al. 2013):
1. Involving and communicating with stakeholders and knowing which stakeholders and
needed for the success of this vision.
2. Visualizing the future desirable goals, by knowing what changes should be made and how
to achieve them
3. Learning through knowledge and the right tools needed to reach this future goal.
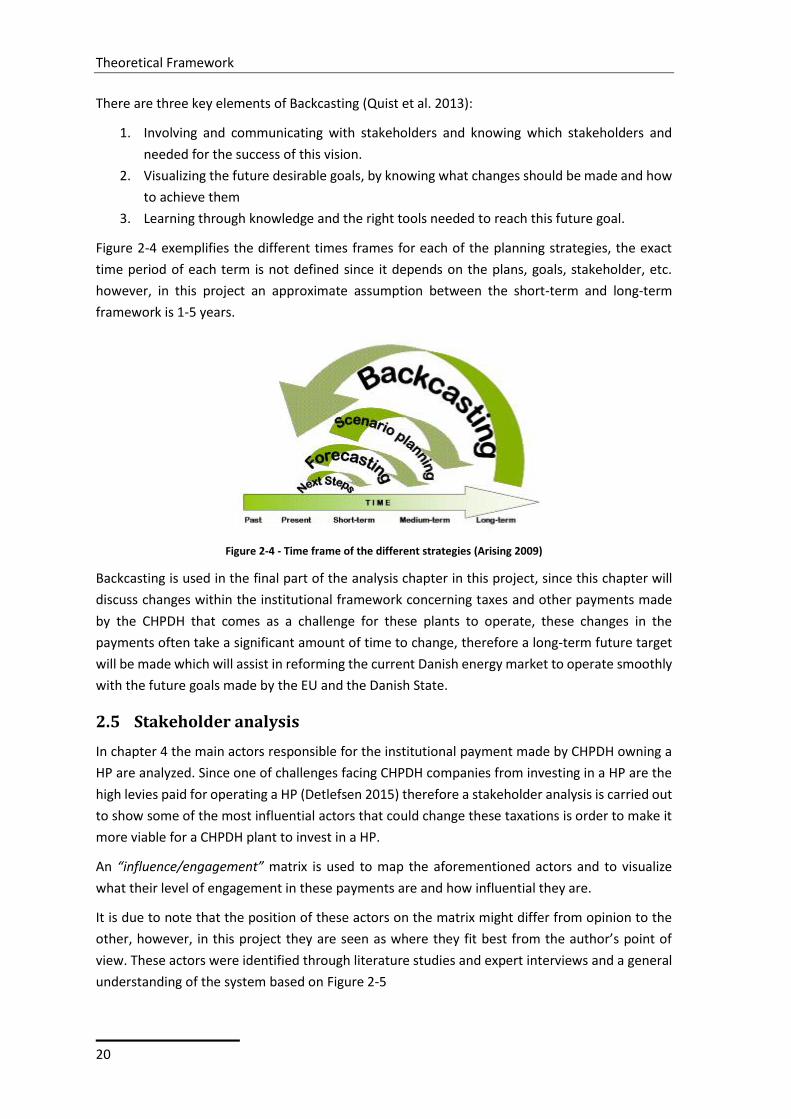
Figure 2-4 exemplifies the different times frames for each of the planning strategies, the exact
time period of each term is not defined since it depends on the plans, goals, stakeholder, etc.
however, in this project an approximate assumption between the short-term and long-term
framework is 1-5 years.
Figure 2-4 - Time frame of the different strategies (Arising 2009)
Backcasting is used in the final part of the analysis chapter in this project, since this chapter will
discuss changes within the institutional framework concerning taxes and other payments made
by the CHPDH that comes as a challenge for these plants to operate, these changes in the
payments often take a significant amount of time to change, therefore a long-term future target
will be made which will assist in reforming the current Danish energy market to operate smoothly
with the future goals made by the EU and the Danish State.
2.5 Stakeholder analysis
In chapter 4 the main actors responsible for the institutional payment made by CHPDH owning a
HP are analyzed. Since one of challenges facing CHPDH companies from investing in a HP are the
high levies paid for operating a HP (Detlefsen 2015) therefore a stakeholder analysis is carried out
to show some of the most influential actors that could change these taxations is order to make it
more viable for a CHPDH plant to invest in a HP.
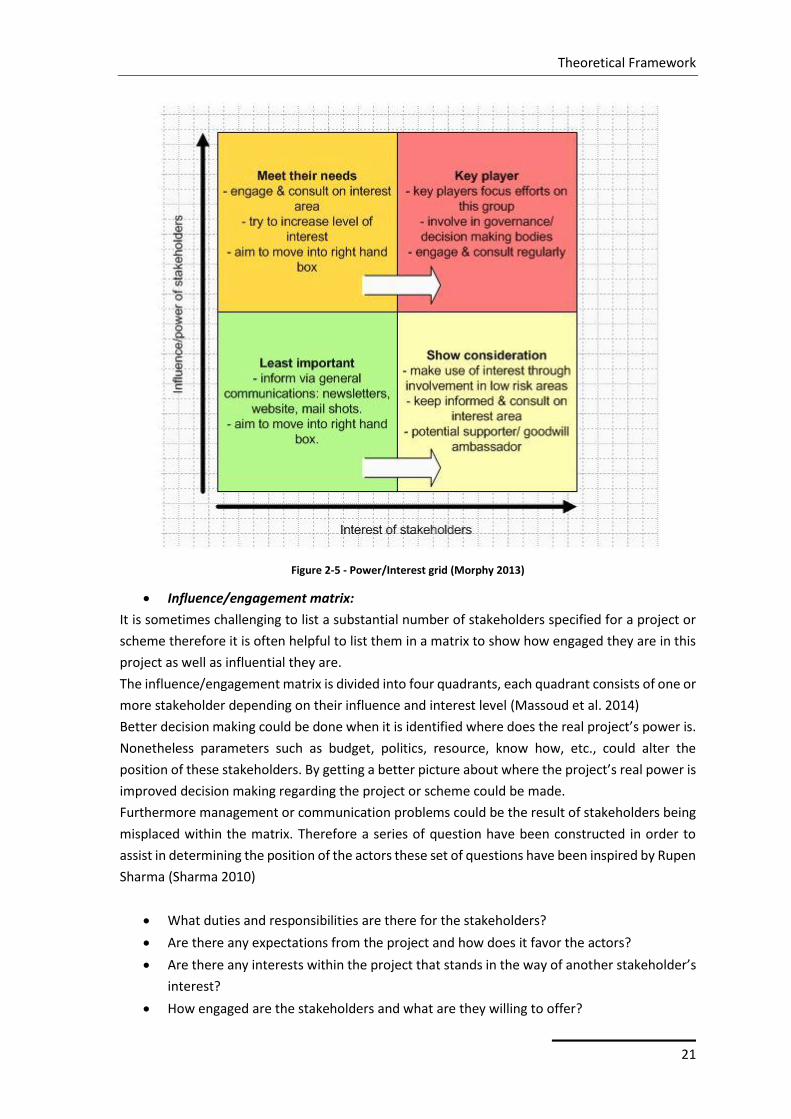
An “influence/engagement” matrix is used to map the aforementioned actors and to visualize
what their level of engagement in these payments are and how influential they are.
It is due to note that the position of these actors on the matrix might differ from opinion to the
other, however, in this project they are seen as where they fit best from the author’s point of
view. These actors were identified through literature studies and expert interviews and a general
understanding of the system based on Figure 2-5
Theoretical Framework
21
Figure 2-5 - Power/Interest grid (Morphy 2013)
Influence/engagement matrix:
It is sometimes challenging to list a substantial number of stakeholders specified for a project or
scheme therefore it is often helpful to list them in a matrix to show how engaged they are in this
project as well as influential they are.
The influence/engagement matrix is divided into four quadrants, each quadrant consists of one or
more stakeholder depending on their influence and interest level (Massoud et al. 2014)
Better decision making could be done when it is identified where does the real project’s power is.
Nonetheless parameters such as budget, politics, resource, know how, etc., could alter the
position of these stakeholders. By getting a better picture about where the project’s real power is
improved decision making regarding the project or scheme could be made.
Furthermore management or communication problems could be the result of stakeholders being
misplaced within the matrix. Therefore a series of question have been constructed in order to
assist in determining the position of the actors these set of questions have been inspired by Rupen
Sharma (Sharma 2010)
What duties and responsibilities are there for the stakeholders?
Are there any expectations from the project and how does it favor the actors?
Are there any interests within the project that stands in the way of another stakeholder’s
interest?
How engaged are the stakeholders and what are they willing to offer?
Theoretical Framework
22
How will a stakeholder react if not managed correctly or delegated?
Whom are the most powerful stakeholders that could affect others?
With that being said the four quadrants are then briefly describes below;
Key Player Quadrant:
Decision making, project’s whereabouts and regular updates should be discussed with the
stakeholders within this quarter, priority in time should be considered with this category since it
could affect the outcome of the project. This group of Stakeholders could be of that with high
political or financial power.
Meet their Needs:
This section of the matrix contains the stakeholders whom are not as interested as the “key
players” however they do possess a high level of influence. Therefore it is recommended to
increase the level of interest for these stakeholders.
Show Consideration:
Stakeholders within this quadrant have high interest as much as the “key players” but they do not
influence the project as much. It is recommended to keep them involved in low risk decision
making.
Least Important:
Finally stakeholders falling in this quarter of the matrix have limited influence and are also not
highly interested within the parameters of the project.
Depending on the actors position within the matrix one could priorities the efforts needed to
engage the actors and how much each actor will affect the momentum of the project. The position
of the stakeholders could move about the matrix depending on a variety of factors, these factors
will not be discussed further sine it is outside the scope of this project.
This chapter concluded the theories used in this project, it should be taken in consideration before
proceeding that the “concrete institutional economy” and the “choice awareness” theories were
not used directly in the report, nonetheless they were included to present the method of thinking
used by the author in this project and how the scope of the project should be perceived which is
supported by these two theories, that is imbedded in their argument stating that;
A. There has to be a realistic economic structure, that reflects the current economy in order
to support the increase of wind power
B. The choice of exporting the surplus wind power should not be considered the only choice,
but there lies other alternatives to utilize this surplus more efficiently and sustainably.
Then the “theoretical approach” was explained which depicts the main stakeholders influencing
the four main payments analyzed in this report, the stakeholders chosen were based on the
author’s point of view, and this theory is included to simplify the understanding of how the levies
applied on power to heat technologies are controlled which is used in Chapters 4 and 6.
Furthermore, the “forecasting, backcasting and scenario planning” theory was included in the

Theoretical Framework
23
analysis in Chapter 7, it was used to aid in the understanding of the different alternatives and the
type of scenario simulated. Finally the “stakeholder analysis” was used in Chapter 4 rather candidly
and explicitly, it was included to assist in the comprehension of engagement and influence power
within the stakeholders.
It should not be mistaken that even though the theories used in this project address organizations
and institutions that surround the development of renewables, however, the primary analysis in
this project is the technical and economical optimization of CHPDH plants. Therefore analysis
about whom are the actors responsible for the survival of CHPDH in the system is outside the scope
of this project.

Theoretical Framework
24
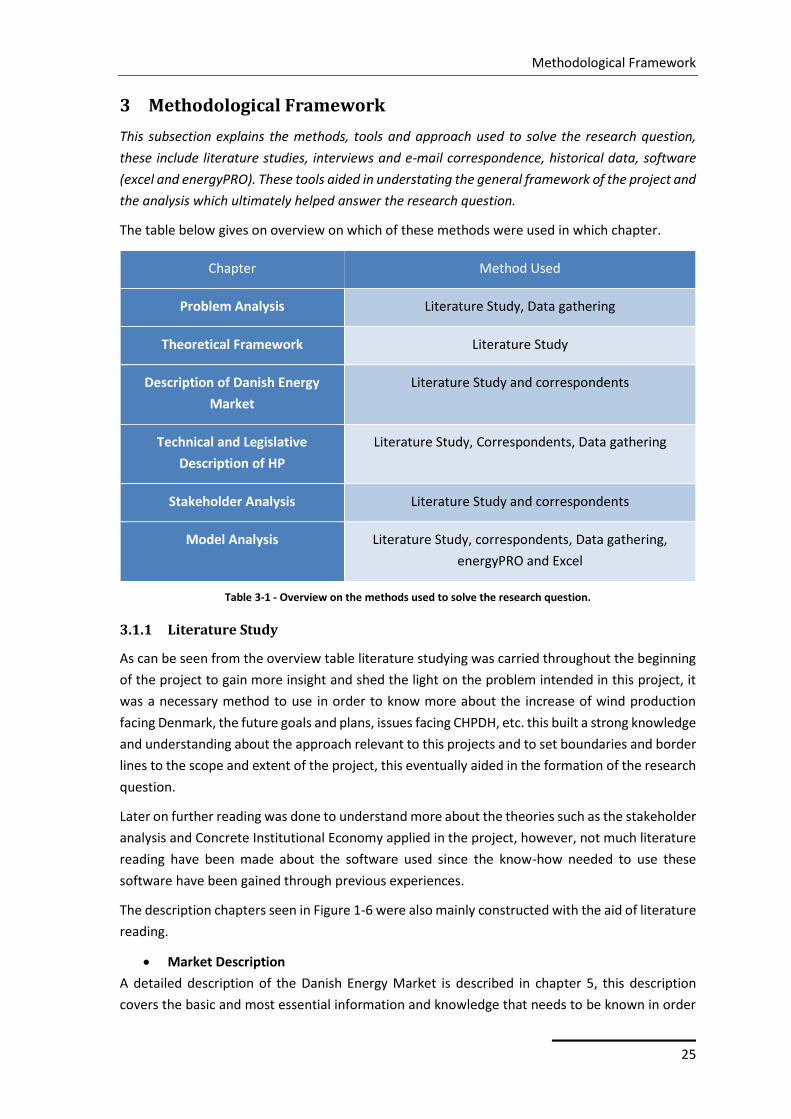
Methodological Framework
25
3 Methodological Framework
This subsection explains the methods, tools and approach used to solve the research question,
these include literature studies, interviews and e-mail correspondence, historical data, software
(excel and energyPRO). These tools aided in understating the general framework of the project and
the analysis which ultimately helped answer the research question.
The table below gives on overview on which of these methods were used in which chapter.
Chapter Method Used
Problem Analysis Literature Study, Data gathering
Theoretical Framework Literature Study
Description of Danish Energy
Market
Literature Study and correspondents
Technical and Legislative
Description of HP
Literature Study, Correspondents, Data gathering
Stakeholder Analysis Literature Study and correspondents
Model Analysis Literature Study, correspondents, Data gathering,
energyPRO and Excel
Table 3-1 - Overview on the methods used to solve the research question.
3.1.1 Literature Study
As can be seen from the overview table literature studying was carried throughout the beginning
of the project to gain more insight and shed the light on the problem intended in this project, it
was a necessary method to use in order to know more about the increase of wind production
facing Denmark, the future goals and plans, issues facing CHPDH, etc. this built a strong knowledge
and understanding about the approach relevant to this projects and to set boundaries and border
lines to the scope and extent of the project, this eventually aided in the formation of the research
question.
Later on further reading was done to understand more about the theories such as the stakeholder
analysis and Concrete Institutional Economy applied in the project, however, not much literature
reading have been made about the software used since the know-how needed to use these
software have been gained through previous experiences.
The description chapters seen in Figure 1-6 were also mainly constructed with the aid of literature
reading.
Market Description
A detailed description of the Danish Energy Market is described in chapter 5, this description
covers the basic and most essential information and knowledge that needs to be known in order
Methodological Framework
26
to understand how the market is structured and operated. These information cover points such
as the different markets, their capacities, gate closure, methods of trading, etc. It is essential to
know these kind of information before going forth with the remainder of the project since the
modelling chapter will analyze the possibility of a CHPDH to participate in these markets and
whether or not it is profitable for them. This description will also cover the basis of how electricity
prices shift in the market and how this affects the operation of a CHPDH plant owning a CHP.
Technical Description for HP & EB:
Since part of the analysis would discuss the possibility and potential of CHPDH investing in a
flexible demand technology, therefore it is necessary to understand how these technologies
integrate within the CHPDH system and the energy market as well as their efficiencies, investment
costs and O&M costs. Where most of these information was gathered through literature reading.
Stakeholder Analysis:
The stakeholder analysis carried in this project is to identify the key actors within the energy
sector, the focus of this analysis was on the actors whom have a strong influence on the levies
applied on the CHPDH networks, it should be noted that the sole purpose behind this analysis is
the identification and pointing out of the most influential stakeholders, further explanation about
these stakeholders as to how they affect these levies and their role within the market is outside
the scope of this project. For further understanding of these actors, the barriers they impose on
the market and their role, a study made by a group of students at Aalborg University covered this
analysis in a project called “Transition towards a More Flexible Energy System in Denmark”. Most
of the information gathered here was made through literature readings.
Levies & Legislative Analysis:
The final part of the description group of chapters discuss the payments made by a CHPDH plant
and also the payments that will occur on these plants should they install a HP or EB
And finally some data gathering was done to acquire information such as electricity market prices,
taxes, fuel prices, technology prices and O&M costs, etc.
It is important for this information and knowledge to be based on reliable and trustworthy
sources, especially with the lack of supervision on the data found on the internet, it is crucial to
be analytical and cautious before relying on these data, hence information from sites such as the
Danish Energy Agency, The European Commission Dansk Fjernvarm and academic writings from
experts and professors within the field of energy systems.
3.1.2 Data gathering
Most of the data gathered in this project were primarily for the modelling analysis chapters,
however, some data gathering was made to determine the hours of surplus wind power, the share
of CHPDH and the size of the different electricity market. The data used were acquired through
the Danish TSO’s site “Energinet.dk”, while some of the other data were gathered through reliable
online sources, email correspondence or interviews especially with CHPDH operators. Some of the
data gathered were heat demand for the modelled CHPDH plant, annual electricity and heat
production, etc.
Methodological Framework
27
3.1.3 Correspondence
The single email correspondence made in this project was between Jens Bovbjerg at Aalborg
Forsyning, the email communication was about the data needed for the analysis such as heat
demand, fuel used, unit capacity and efficiency, etc. as well as details on how the operation
strategy of the plant is currently set. One of the most essential emails discussed is attached in
Appendix B, the email shows the revenues of the plant in the past years, the sale of electricity was
used as an indicator for the analysis.
Interview
Multiple interviews were carried with a variety of actors within the field of energy systems as well
as CHPDH operators. Some of these interviews were done in the beginning as an explorative
interview to gain more insight in the topic of this project, other explorative interviews were carried
to shed the light on the most relevant stakeholders influencing the levies around operating a HP
otherwise it would have been time consuming and rather difficult acquiring such information
through literature studies.
Interviews such as the one made with Jens Bovbjerg from Aalborg Forsyning this was carried to
obtain more accurate and comprehensive data such as heat demands, the CHPDH plant’s layout
and operation strategy, etc. which later on aided in the modeling of this plant. Consultancies were
also interviewed such as head of the Strategy and Planning department in Planenergi Per Alex
Sørensen to get a better picture around the type of taxes, payments and levies the CHPDH have
to pay in order to install and operate a HP and what are the recommendations of these
consultancies’ around eliminating or decreasing such levies, the recommendation of these
companies was an essential step since they would have better knowledge around this topic and
they would know what would be a realistic decrease within these payments.
Another detailed interview with John Tang chief consultant at DanskFjernvarme was essential and
aided in the construction of the stakeholder analysis chapter, since the interview shed the light on
the dynamics between the different actors within the market and the ones studied in this project
and how these actors communicate to manage the institutional levies paid by the HPs
Finally, a phone interview was made with Daniil Plotnikov a CHP business developer at NEAS
Energy, this interview was carried to understand more how traders affect levies paid by HPs and
how would modifications of these levies affect their trading.
Preparation for the interviews was done according to their type (explorative/detailed) for the
explorative interviews general questions about the topic of the projects was asked which were
prepared beforehand, as for the detailed interviews more concrete and concise questions were
also prepared beforehand these questions were used as a guideline for the interviewee where
they were prone to alternations and other questions which were not originally considered would
be asked according to the flow of the conversation.
All audio files and transcription of interviews could be found attached on the CD Appendix G.
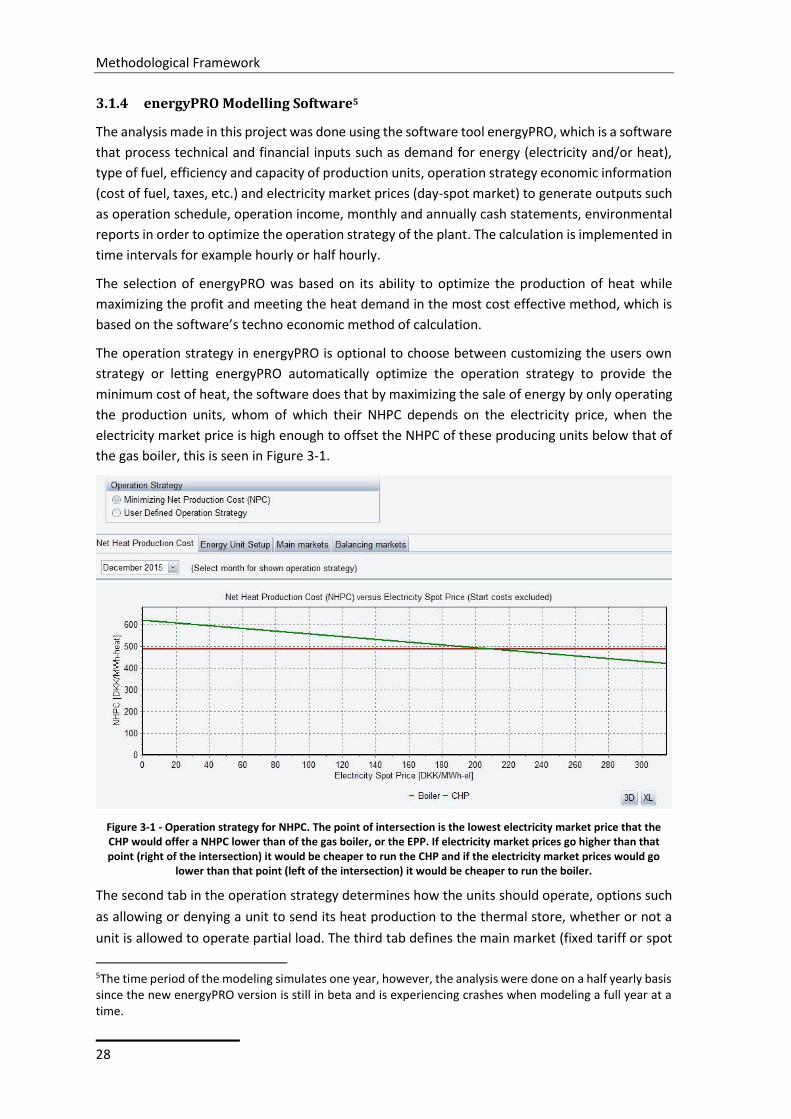
Methodological Framework
28
3.1.4 energyPRO Modelling Software5
The analysis made in this project was done using the software tool energyPRO, which is a software
that process technical and financial inputs such as demand for energy (electricity and/or heat),
type of fuel, efficiency and capacity of production units, operation strategy economic information
(cost of fuel, taxes, etc.) and electricity market prices (day-spot market) to generate outputs such
as operation schedule, operation income, monthly and annually cash statements, environmental
reports in order to optimize the operation strategy of the plant. The calculation is implemented in
time intervals for example hourly or half hourly.
The selection of energyPRO was based on its ability to optimize the production of heat while
maximizing the profit and meeting the heat demand in the most cost effective method, which is
based on the software’s techno economic method of calculation.
The operation strategy in energyPRO is optional to choose between customizing the users own
strategy or letting energyPRO automatically optimize the operation strategy to provide the
minimum cost of heat, the software does that by maximizing the sale of energy by only operating
the production units, whom of which their NHPC depends on the electricity price, when the
electricity market price is high enough to offset the NHPC of these producing units below that of
the gas boiler, this is seen in Figure 3-1.
Figure 3-1 - Operation strategy for NHPC. The point of intersection is the lowest electricity market price that the CHP would offer a NHPC lower than of the gas boiler, or the EPP. If electricity market prices go higher than that point (right of the intersection) it would be cheaper to run the CHP and if the electricity market prices would go
lower than that point (left of the intersection) it would be cheaper to run the boiler.
The second tab in the operation strategy determines how the units should operate, options such
as allowing or denying a unit to send its heat production to the thermal store, whether or not a
unit is allowed to operate partial load. The third tab defines the main market (fixed tariff or spot
5The time period of the modeling simulates one year, however, the analysis were done on a half yearly basis since the new energyPRO version is still in beta and is experiencing crashes when modeling a full year at a time.
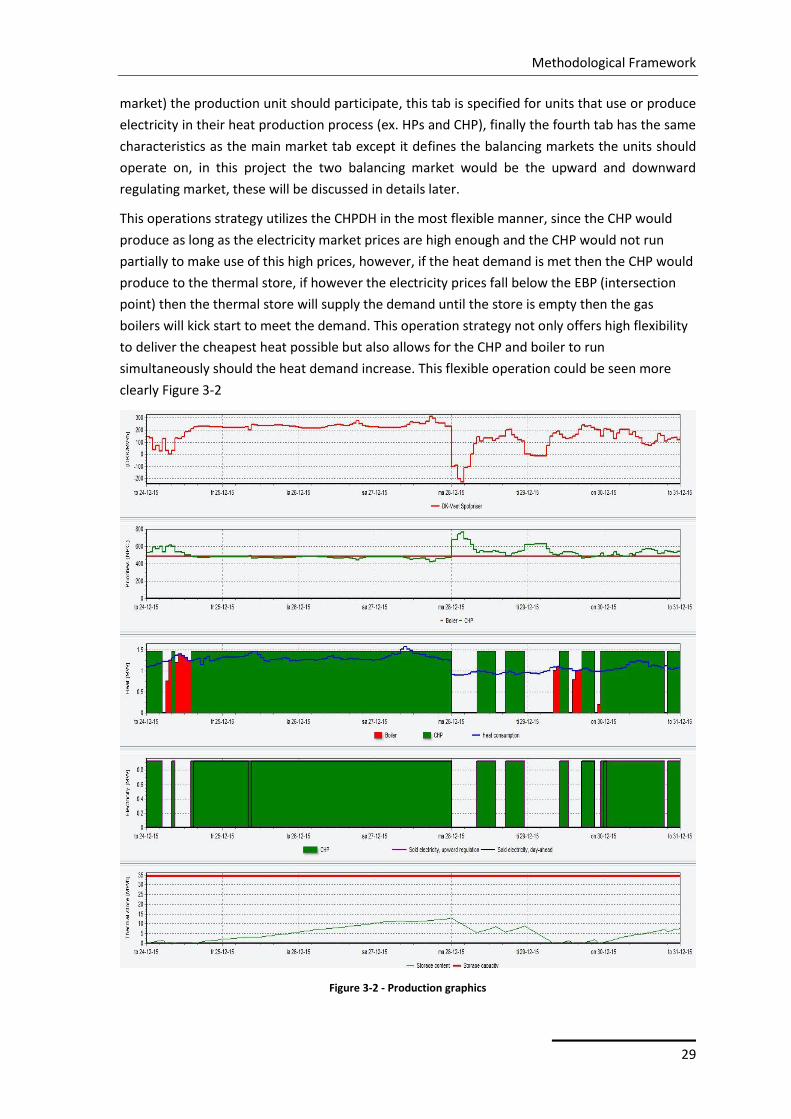
Methodological Framework
29
market) the production unit should participate, this tab is specified for units that use or produce
electricity in their heat production process (ex. HPs and CHP), finally the fourth tab has the same
characteristics as the main market tab except it defines the balancing markets the units should
operate on, in this project the two balancing market would be the upward and downward
regulating market, these will be discussed in details later.
This operations strategy utilizes the CHPDH in the most flexible manner, since the CHP would
produce as long as the electricity market prices are high enough and the CHP would not run
partially to make use of this high prices, however, if the heat demand is met then the CHP would
produce to the thermal store, if however the electricity prices fall below the EBP (intersection
point) then the thermal store will supply the demand until the store is empty then the gas
boilers will kick start to meet the demand. This operation strategy not only offers high flexibility
to deliver the cheapest heat possible but also allows for the CHP and boiler to run
simultaneously should the heat demand increase. This flexible operation could be seen more
clearly Figure 3-2
Figure 3-2 - Production graphics
Methodological Framework
30
The figure shows the trading strategy modeled by the software in the last week of 2015 (24th of
December 2015 to the 31st of December 2015) the first two graphs represent the spot market
electricity prices in west Denmark and the priority production of the units respectively, it can be
seen clearly the production of the CHP varies according to the market prices, the lower the market
prices are the cheaper it is to run the gas boiler and vice versa. The third graph represents the
heat production it can also be seen the activity of the CHP in relation to the boiler, at times when
both units are not running the thermal store would supply to the demand. The fourth graph shows
the trading activity of the CHP where it participated on the upward regulating market and the spot
market.
As mentioned previously no small scale energy planning software were investigated, the only
other software considered was energyPLAN, however, its criteria would not fit into the analysis
since energyPLAN models the energy system as a whole and not specific power plants.
Later on a sensitivity analysis is made to study the weight of some of the inputs to shed the light
on impact and degree of change in the outcome should these inputs change. The analysis will
study the relation of the PSO change to the amount of OPEX as well as amount of production from
the HP.
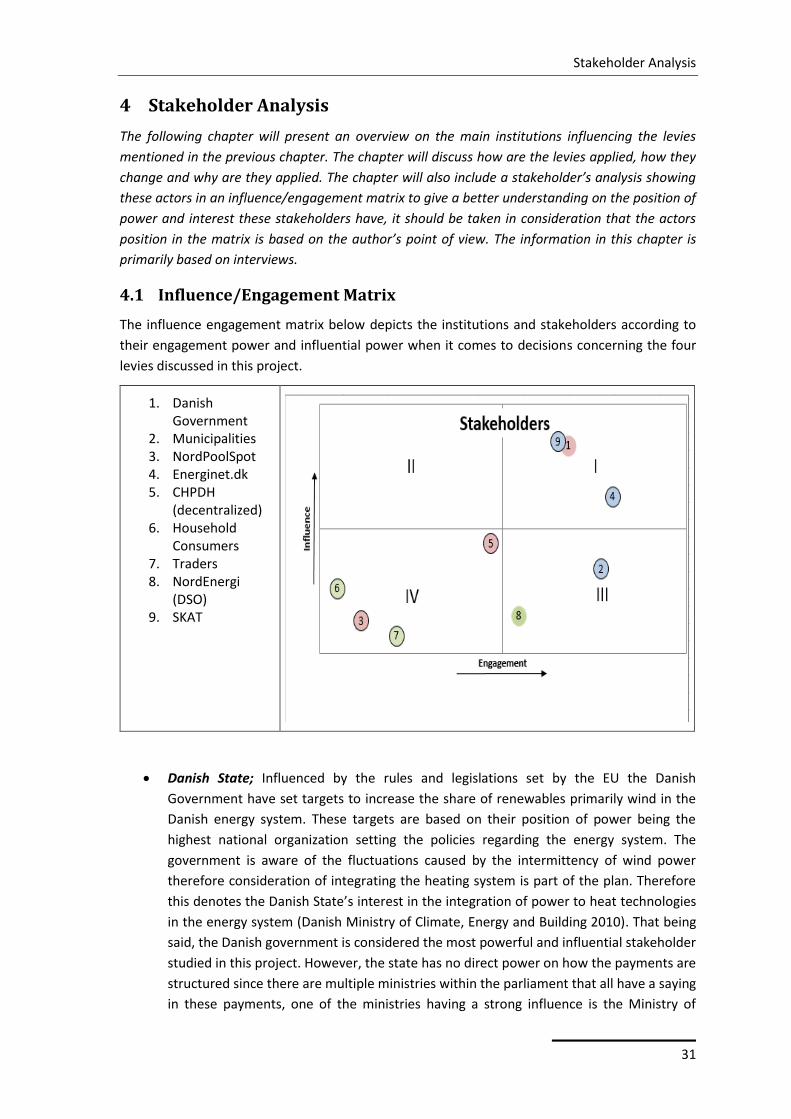
Stakeholder Analysis
31
4 Stakeholder Analysis
The following chapter will present an overview on the main institutions influencing the levies
mentioned in the previous chapter. The chapter will discuss how are the levies applied, how they
change and why are they applied. The chapter will also include a stakeholder’s analysis showing
these actors in an influence/engagement matrix to give a better understanding on the position of
power and interest these stakeholders have, it should be taken in consideration that the actors
position in the matrix is based on the author’s point of view. The information in this chapter is
primarily based on interviews.
4.1 Influence/Engagement Matrix
The influence engagement matrix below depicts the institutions and stakeholders according to
their engagement power and influential power when it comes to decisions concerning the four
levies discussed in this project.
1. Danish Government
2. Municipalities 3. NordPoolSpot 4. Energinet.dk 5. CHPDH
(decentralized) 6. Household
Consumers 7. Traders 8. NordEnergi
(DSO) 9. SKAT
Danish State; Influenced by the rules and legislations set by the EU the Danish
Government have set targets to increase the share of renewables primarily wind in the
Danish energy system. These targets are based on their position of power being the
highest national organization setting the policies regarding the energy system. The
government is aware of the fluctuations caused by the intermittency of wind power
therefore consideration of integrating the heating system is part of the plan. Therefore
this denotes the Danish State’s interest in the integration of power to heat technologies
in the energy system (Danish Ministry of Climate, Energy and Building 2010). That being
said, the Danish government is considered the most powerful and influential stakeholder
studied in this project. However, the state has no direct power on how the payments are
structured since there are multiple ministries within the parliament that all have a saying
in these payments, one of the ministries having a strong influence is the Ministry of
Stakeholder Analysis
32
Taxations (SKAT). According to (John Tang 2015) the state cannot completely eliminate
the taxes and levies paid by the HP since that will cause the state to lose income which of
course is something not favorable for the government therefore there should be a balance
between how much these payments should decrease and how can the government
compensate. Furthermore the Danish government is highly interested in investing in HP
since they are well aware that it is a promising technology to absorb the surplus wind
power. Therefore this puts the government in a 1st quadrant having a high power and
interest in the development of HP and how they affect the levies applied to it.
Municipalities; As the Danish heating sector is controlled and managed by the
municipalities that the DH network is located within, therefore that makes them a highly
interested stakeholder yet not possessing the same amount of power the Danish State
has, hence the polices set by the municipalities and how they manage the DH plants are
bound by the framework of the policies set by the state. Nonetheless they should start
investigating and investing in HPs to comply with the nations goals of being fossil free in
30 years specially that there would not be enough biomass to cover the entire CHP
demand (John Tang 2015). That puts the municipalities in the 3rd quadrant as being highly
engaged regarding how HP levies should be more favorable towards HPs yet they have
limited influence.
NordPoolSpot; Since NordPoolSpot is not a governmental institution and is more of an
organization owned by the Scandinavian and Baltic TSO’s (Nord Pool Spot 2015a)
therefore it does not poses influential power on whether or not an energy system would
invest in power to heat technologies or interconnectors, nonetheless their interest would
be leaning more towards interconnectors in order to link the above mentioned countries
together. However experts believe that they do have some influence in convincing the
TSO’s that the market is not functioning properly now as the hours with low electricity
prices are more than the hours with high electricity prices, and this could be solved by
integrating HPs in the electricity system to stabilize the system making it more stable (John
Tang 2015) this puts them in the fourth quadrant with the least power and influence
among the actors analyzed
Energinet.dk; they are the grid operators their decisions would have an effect on the
development of HPs and the levies applied on HPs. Nonetheless their primary objective is
the security of supply of electricity and gas (Energinet.dk 2013d), they do not poses power
as the politicians do, however they are obliged to increase the share of renewable energy
in the system as well as R&D projects as mentioned in Chapter 4 therefore applying the
PSO as a financial support for such goals. And since they are obliged by the government
to comply with such objectives therefore they do not have a direct saying in the
adjustment of these levies. On the other hand they should be informed that if the share
of HPs within the heating sector increased then this would offer a more stable
intermittency of the electricity system, which will ultimately decrease their need to
purchase regulating capacity making the energy system run less expensive They face an
issue when it comes to decision making since there are multiple parties in control the
decision making process which affects their argument with Dansk Fjernvarme on whom
should pay for the power to heat technologies which offer flexibility(John Tang 2015). This
Stakeholder Analysis
33
puts Enerinet.dk in the 3rd quadrant where they present high interest and influence yet
not as much as the Danish state.
CHPDH (decentralized); it is expected that the owners of the DH plants whom of which
Dansk Fjernvarme represents them, would be interested in investing in a power to heat
technology, however, their main concern would be a promising investment which
increases their profit hence delivering cheaper heat to their consumers. DH companies
are aware of the expensive levies and taxes they have to pay to operate a HP and there
this acts as a barrier (Massoud et al. 2014) nonetheless they do not have the power to
change these payments, but they could discuss their interest with Dansk Fjernvarme
which would send the message to the higher authorities. It should be noted that the
political decisions in Denmark are rather complex and vague therefore as mentioned
earlier the stakeholders (Dansk Fjernvarme being one of these stakeholders) would
communicate their interests with the politicians within the government which later on
will try to find a balanced solution (John Tang 2015) even so it should be noted that for
CHPDH that invested in a biomass CHP or boiler would not be interested in investing in a
HP, on the contrary it would rather not invest in a HP as that would produce even cheaper
heat (assuming the HP absorbed the surplus wind power at cheap prices) hence taking
away the investment paid in the biomass units killing the sunk costs.
Household Consumers; it is quiet complicated to identify the position of consumers, for
that depending on the location of the DH plant and the units installed onsite will affect
the heat price delivered, i.e. some costumers would get cheaper heat than others which
will not affect their engagement in taking an action towards changing the levies on HPs.
Not to mention most DH consumers are not aware of the different technologies and
strategies that could be used to offer them cheaper heat, therefore the consumers are
considered rather interested yet not highly engaged due to their lack of awareness and
knowledge.
Traders; traders such as NEAS and Dansk commodities would solely act as a trading
representative for the DH plant, they have no clear interest on the development of
power to heat technologies, nor do they have the power to influence the levies.
However, they would have an interest in the increase of HPs within the system since
they would provide the trading services for these HP which allows them to earn more
money. Therefore is could be seen from the matric that traders are slightly engaged yet
have no influence.
NordEnergi (DSO); as Dansk Energi is the association in control of the local grid
companies therefore an individual DSO would not have the power to affect these
payments. It could be noticed from the payments that the local grid tariff is more than
double of the national grid tariff this is due to the sensitivity of the low voltage grid
TEXT BOX: Dansk Fjernvarme
Dansk Fjernvarme is an association that organizes Danish DH plants, manages relations
between the members being the DH plants, and communicates their interests and objectives
with the other organizations and members of political authority (Dansk Fjernvarme 2014).
Stakeholder Analysis
34
operated by the DSO, since the low voltage power lines are more affected to the small
intermittencies that the high voltage line, therefore it requires more maintenance.
Therefore the local grid tariff is not subject to change, moreover it applies to all
electricity consumers. This sets the DSO’s (NordEnergi) in the 3rd quadrant possessing
low influence yet relatively highly engaged.
SKAT; as mentioned previously the Danish state has several ministries in each having
their own different interests therefore it is rather complex to alter the value of one
payment. The SKAT is the party responsible for the energy tax paid by the HP which
levies a high tax of 39 øre/KWh this also acts a barrier in the development of HP. It is a
topic of controversy in the parliament and between other stakeholders such as Dansk
Fjernvarme to adjust these payments, since the state and the ministry would have to
make up for the income so called lost should the taxes on HP decrease, this way of
thinking is believed to be due to the lack of knowledge that power to heat technologies
would offer flexibility in the energy system hence delivering cheap electricity for citizens
instead of exporting the surplus power with cheap prices to neighboring countries and
buying it back more expensive than it was sold in moments when the wind is not
blowing and the sun is not shining (John Tang 2015) Finally this puts the SKAT in the 1st
quadrant since they poses high influence on the payments and also highly engaged.
This chapter concluded a description to some of the stakeholders influencing the institutional
levies applied on HPs, it also provides an understanding on how the stakeholders were perceived
in this project which is based on expert interviews and literature studies, however, it should be
taken into account the deep and complicated dynamics that goes within the political arena and
the main purpose for choosing just a number of the stakeholders is embedded in the complexity
of politics between the entire energy market which has a magnitude of actors and parties
controlling it, this deep and complex nature of the market restrained the analysis to the above
described actors only. It should also be noted that only how the levies would affect the HPs was
studied, the adjustment of these payments might have an impact in different parameters within
the energy system and different stakeholders.
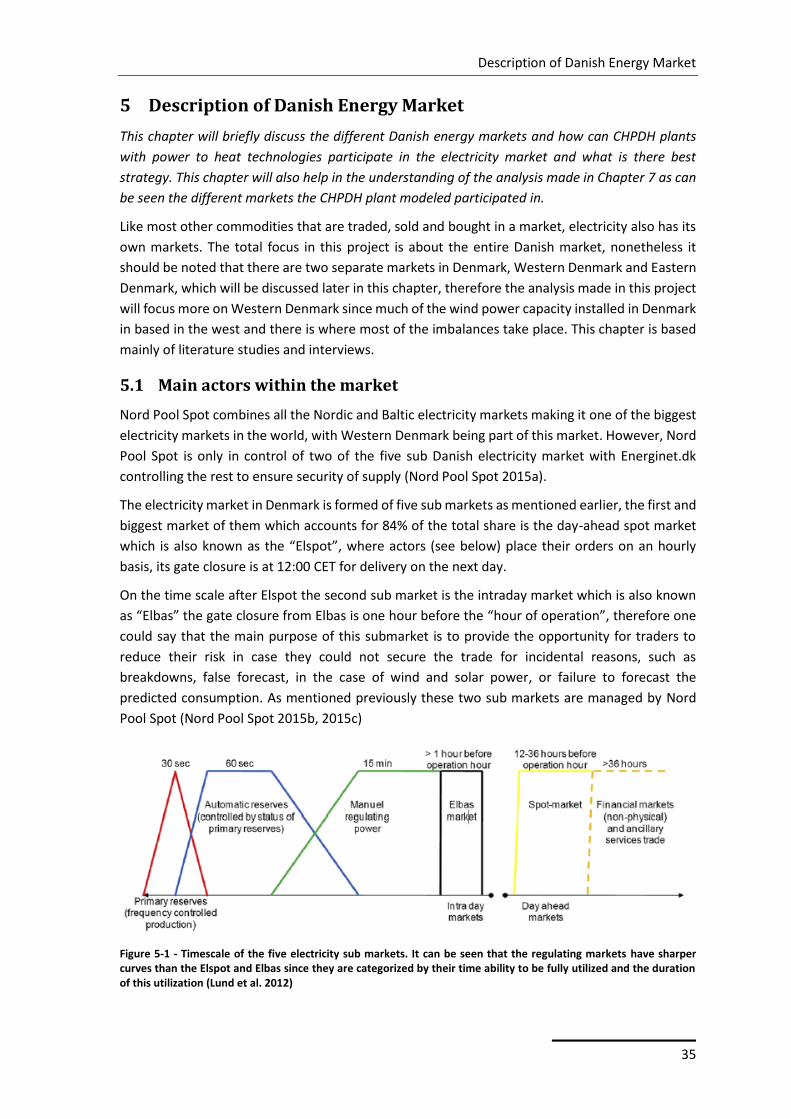
Description of Danish Energy Market
35
5 Description of Danish Energy Market
This chapter will briefly discuss the different Danish energy markets and how can CHPDH plants
with power to heat technologies participate in the electricity market and what is there best
strategy. This chapter will also help in the understanding of the analysis made in Chapter 7 as can
be seen the different markets the CHPDH plant modeled participated in.
Like most other commodities that are traded, sold and bought in a market, electricity also has its
own markets. The total focus in this project is about the entire Danish market, nonetheless it
should be noted that there are two separate markets in Denmark, Western Denmark and Eastern
Denmark, which will be discussed later in this chapter, therefore the analysis made in this project
will focus more on Western Denmark since much of the wind power capacity installed in Denmark
in based in the west and there is where most of the imbalances take place. This chapter is based
mainly of literature studies and interviews.
5.1 Main actors within the market
Nord Pool Spot combines all the Nordic and Baltic electricity markets making it one of the biggest
electricity markets in the world, with Western Denmark being part of this market. However, Nord
Pool Spot is only in control of two of the five sub Danish electricity market with Energinet.dk
controlling the rest to ensure security of supply (Nord Pool Spot 2015a).
The electricity market in Denmark is formed of five sub markets as mentioned earlier, the first and
biggest market of them which accounts for 84% of the total share is the day-ahead spot market
which is also known as the “Elspot”, where actors (see below) place their orders on an hourly
basis, its gate closure is at 12:00 CET for delivery on the next day.
On the time scale after Elspot the second sub market is the intraday market which is also known
as “Elbas” the gate closure from Elbas is one hour before the “hour of operation”, therefore one
could say that the main purpose of this submarket is to provide the opportunity for traders to
reduce their risk in case they could not secure the trade for incidental reasons, such as
breakdowns, false forecast, in the case of wind and solar power, or failure to forecast the
predicted consumption. As mentioned previously these two sub markets are managed by Nord
Pool Spot (Nord Pool Spot 2015b, 2015c)
Figure 5-1 - Timescale of the five electricity sub markets. It can be seen that the regulating markets have sharper curves than the Elspot and Elbas since they are categorized by their time ability to be fully utilized and the duration of this utilization (Lund et al. 2012)
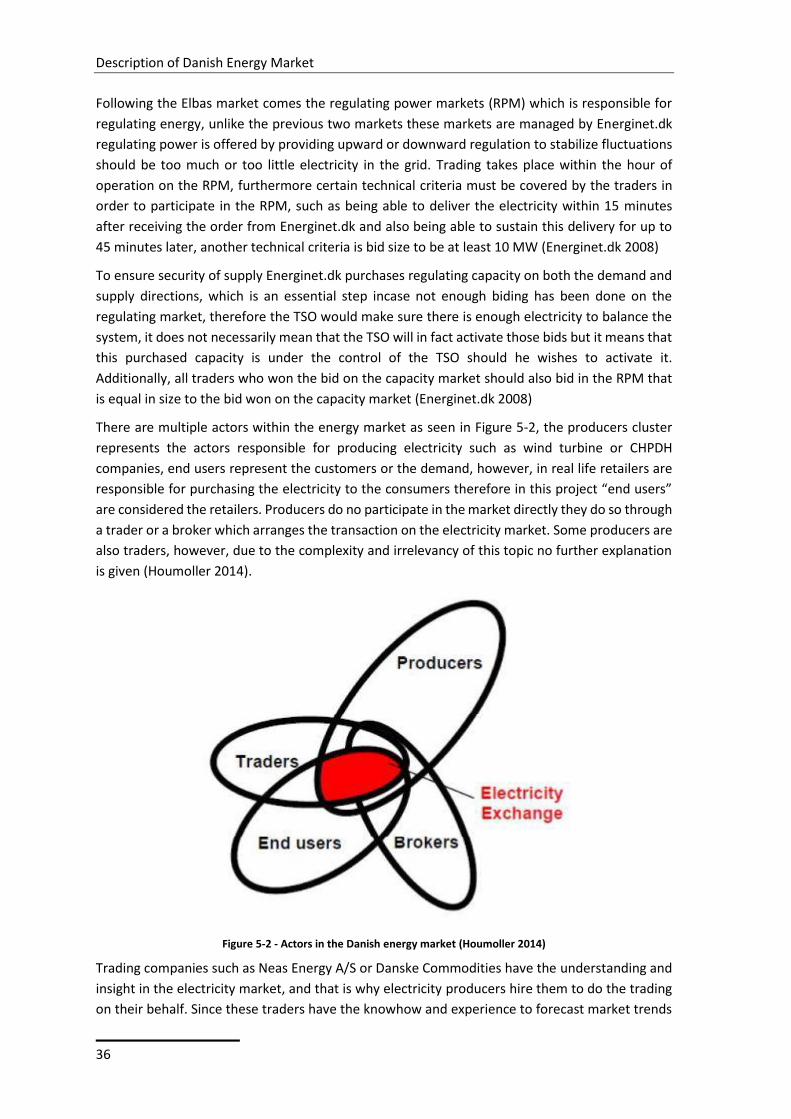
Description of Danish Energy Market
36
Following the Elbas market comes the regulating power markets (RPM) which is responsible for
regulating energy, unlike the previous two markets these markets are managed by Energinet.dk
regulating power is offered by providing upward or downward regulation to stabilize fluctuations
should be too much or too little electricity in the grid. Trading takes place within the hour of
operation on the RPM, furthermore certain technical criteria must be covered by the traders in
order to participate in the RPM, such as being able to deliver the electricity within 15 minutes
after receiving the order from Energinet.dk and also being able to sustain this delivery for up to
45 minutes later, another technical criteria is bid size to be at least 10 MW (Energinet.dk 2008)
To ensure security of supply Energinet.dk purchases regulating capacity on both the demand and
supply directions, which is an essential step incase not enough biding has been done on the
regulating market, therefore the TSO would make sure there is enough electricity to balance the
system, it does not necessarily mean that the TSO will in fact activate those bids but it means that
this purchased capacity is under the control of the TSO should he wishes to activate it.
Additionally, all traders who won the bid on the capacity market should also bid in the RPM that
is equal in size to the bid won on the capacity market (Energinet.dk 2008)
There are multiple actors within the energy market as seen in Figure 5-2, the producers cluster
represents the actors responsible for producing electricity such as wind turbine or CHPDH
companies, end users represent the customers or the demand, however, in real life retailers are
responsible for purchasing the electricity to the consumers therefore in this project “end users”
are considered the retailers. Producers do no participate in the market directly they do so through
a trader or a broker which arranges the transaction on the electricity market. Some producers are
also traders, however, due to the complexity and irrelevancy of this topic no further explanation
is given (Houmoller 2014).
Figure 5-2 - Actors in the Danish energy market (Houmoller 2014)
Trading companies such as Neas Energy A/S or Danske Commodities have the understanding and
insight in the electricity market, and that is why electricity producers hire them to do the trading
on their behalf. Since these traders have the knowhow and experience to forecast market trends
Description of Danish Energy Market
37
and price deviations as well as the knowledge in optimizing a plant’s production therefore
producers and specially plants small in capacity trust them with trading and give them full
responsibility whether if it is responsibility to fully operate the CHPDH plant or advice and
consultation on how the CHPDH plant should operate, where contracts between the two parties
define the parameters of the responsibility and the financial payments (Jens Bovbjerg 2015).
However, if the trader has full control over the CHPs and boiler units in the CHPDH plant the
producers has no say on what size of bids and offers the trader makes and on which market.
Another reason why some CHPDH companies give trading control to traders is cause of the biding
size, for that in some markets the biding size should not be below 10 MWel, therefore the trader
would gather a set of individual Units (specifically HPs) and “pool” them in one combined bid size
ensuring the sum of the capacity of units exceeds 10 MWel.
This defines the trader as the balancing responsible party (BRP), this is done by sending an
agreement to the TSO assuring the responsibility for producing or consuming the actual amounts
as the bids or offers, by entering this agreement the BRP is financially responsible for the
imbalances that might happen in case of a deviation from the actual and produced/consumed
amounts.
This basic and brief description of the energy market in Denmark should allow for a better
understanding of the following explanation on how CHPDH companies especially the ones with a
power to heat unit can participate in the market.
5.2 Interchanging price throughout the electricity market
As mention in the problem formulation chapter, as a general rule the price of electricity is
determined by where the supply and demand curves intersect, where the MOE takes place in all
submarkets which obliges Energinet.dk to activate the cheapest available order first (Houmøller
2014). In Figure 5-3 the MOE is shown for a given hour, the straight lines in the light blue represent
the demand and the intermittent solid and dotted lines in dark blue represent the supply curve.
The reason behind having two supply curves is to illustrate the effect of the two scenarios (high
wind and low wind) on the electricity price.
The less wind there is in the system the more the supply curve moves to the left causing the
electricity price to increase shown on the X-axis as Price A. On the other hand the more wind more
there is in the system the more the supply curve shifts to the right causing a decrease in the
electricity price in that hour which is shown on the X-axis as Price B, since this allows wind power
to take over more expensive conventional power units (Poyry 2010).
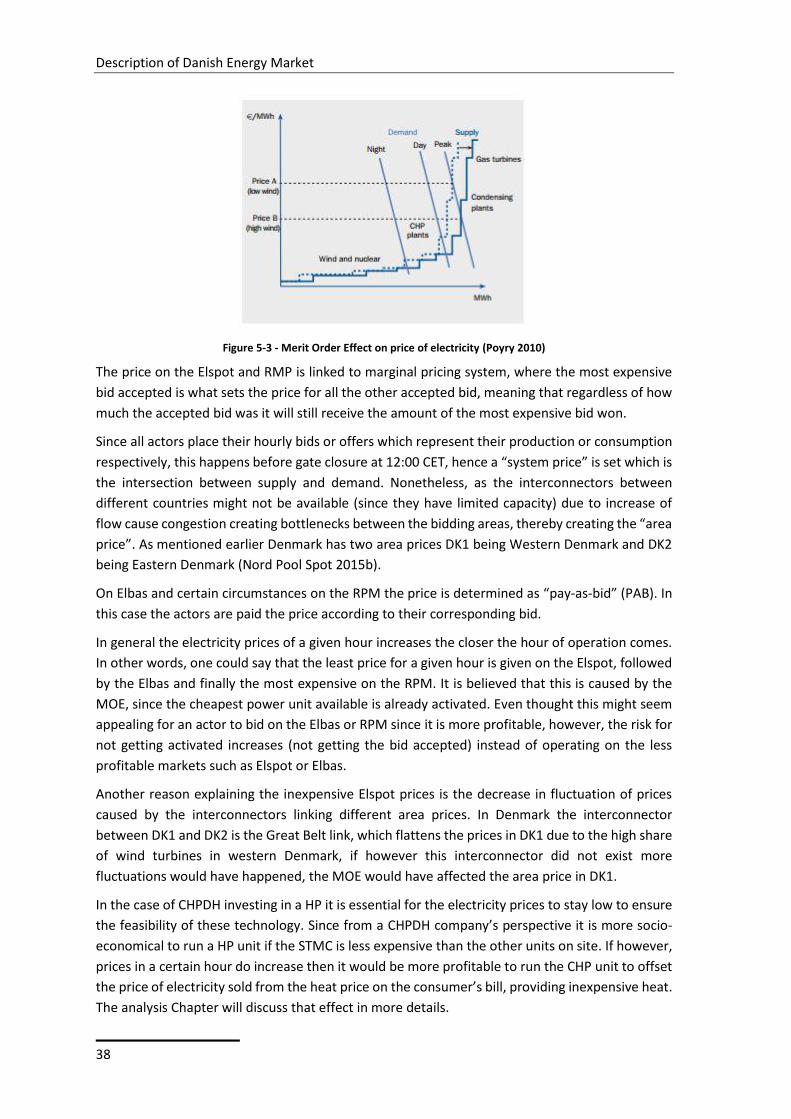
Description of Danish Energy Market
38
Figure 5-3 - Merit Order Effect on price of electricity (Poyry 2010)
The price on the Elspot and RMP is linked to marginal pricing system, where the most expensive
bid accepted is what sets the price for all the other accepted bid, meaning that regardless of how
much the accepted bid was it will still receive the amount of the most expensive bid won.
Since all actors place their hourly bids or offers which represent their production or consumption
respectively, this happens before gate closure at 12:00 CET, hence a “system price” is set which is
the intersection between supply and demand. Nonetheless, as the interconnectors between
different countries might not be available (since they have limited capacity) due to increase of
flow cause congestion creating bottlenecks between the bidding areas, thereby creating the “area
price”. As mentioned earlier Denmark has two area prices DK1 being Western Denmark and DK2
being Eastern Denmark (Nord Pool Spot 2015b).
On Elbas and certain circumstances on the RPM the price is determined as “pay-as-bid” (PAB). In
this case the actors are paid the price according to their corresponding bid.
In general the electricity prices of a given hour increases the closer the hour of operation comes.
In other words, one could say that the least price for a given hour is given on the Elspot, followed
by the Elbas and finally the most expensive on the RPM. It is believed that this is caused by the
MOE, since the cheapest power unit available is already activated. Even thought this might seem
appealing for an actor to bid on the Elbas or RPM since it is more profitable, however, the risk for
not getting activated increases (not getting the bid accepted) instead of operating on the less
profitable markets such as Elspot or Elbas.
Another reason explaining the inexpensive Elspot prices is the decrease in fluctuation of prices
caused by the interconnectors linking different area prices. In Denmark the interconnector
between DK1 and DK2 is the Great Belt link, which flattens the prices in DK1 due to the high share
of wind turbines in western Denmark, if however this interconnector did not exist more
fluctuations would have happened, the MOE would have affected the area price in DK1.
In the case of CHPDH investing in a HP it is essential for the electricity prices to stay low to ensure
the feasibility of these technology. Since from a CHPDH company’s perspective it is more socio-
economical to run a HP unit if the STMC is less expensive than the other units on site. If however,
prices in a certain hour do increase then it would be more profitable to run the CHP unit to offset
the price of electricity sold from the heat price on the consumer’s bill, providing inexpensive heat.
The analysis Chapter will discuss that effect in more details.
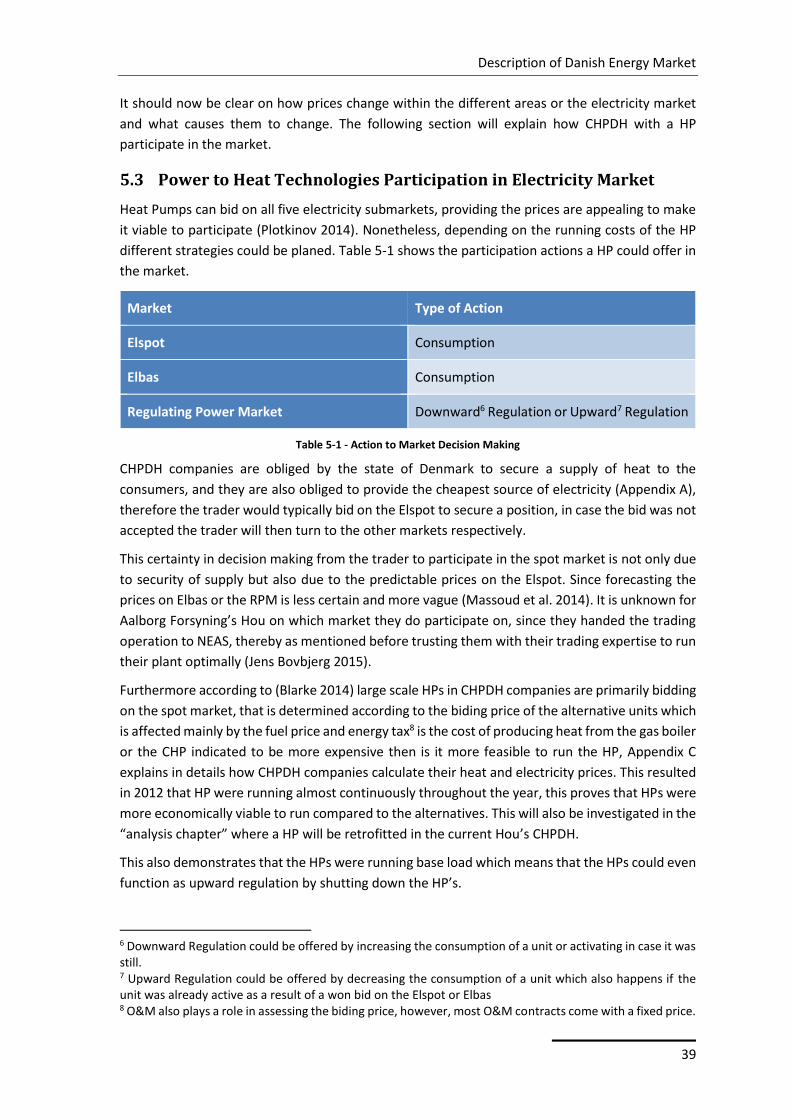
Description of Danish Energy Market
39
It should now be clear on how prices change within the different areas or the electricity market
and what causes them to change. The following section will explain how CHPDH with a HP
participate in the market.
5.3 Power to Heat Technologies Participation in Electricity Market
Heat Pumps can bid on all five electricity submarkets, providing the prices are appealing to make
it viable to participate (Plotkinov 2014). Nonetheless, depending on the running costs of the HP
different strategies could be planed. Table 5-1 shows the participation actions a HP could offer in
the market.
Market Type of Action
Elspot Consumption
Elbas Consumption
Regulating Power Market Downward6 Regulation or Upward7 Regulation
Table 5-1 - Action to Market Decision Making
CHPDH companies are obliged by the state of Denmark to secure a supply of heat to the
consumers, and they are also obliged to provide the cheapest source of electricity (Appendix A),
therefore the trader would typically bid on the Elspot to secure a position, in case the bid was not
accepted the trader will then turn to the other markets respectively.
This certainty in decision making from the trader to participate in the spot market is not only due
to security of supply but also due to the predictable prices on the Elspot. Since forecasting the
prices on Elbas or the RPM is less certain and more vague (Massoud et al. 2014). It is unknown for
Aalborg Forsyning’s Hou on which market they do participate on, since they handed the trading
operation to NEAS, thereby as mentioned before trusting them with their trading expertise to run
their plant optimally (Jens Bovbjerg 2015).
Furthermore according to (Blarke 2014) large scale HPs in CHPDH companies are primarily bidding
on the spot market, that is determined according to the biding price of the alternative units which
is affected mainly by the fuel price and energy tax8 is the cost of producing heat from the gas boiler
or the CHP indicated to be more expensive then is it more feasible to run the HP, Appendix C
explains in details how CHPDH companies calculate their heat and electricity prices. This resulted
in 2012 that HP were running almost continuously throughout the year, this proves that HPs were
more economically viable to run compared to the alternatives. This will also be investigated in the
“analysis chapter” where a HP will be retrofitted in the current Hou’s CHPDH.
This also demonstrates that the HPs were running base load which means that the HPs could even
function as upward regulation by shutting down the HP’s.
6 Downward Regulation could be offered by increasing the consumption of a unit or activating in case it was still. 7 Upward Regulation could be offered by decreasing the consumption of a unit which also happens if the unit was already active as a result of a won bid on the Elspot or Elbas 8 O&M also plays a role in assessing the biding price, however, most O&M contracts come with a fixed price.
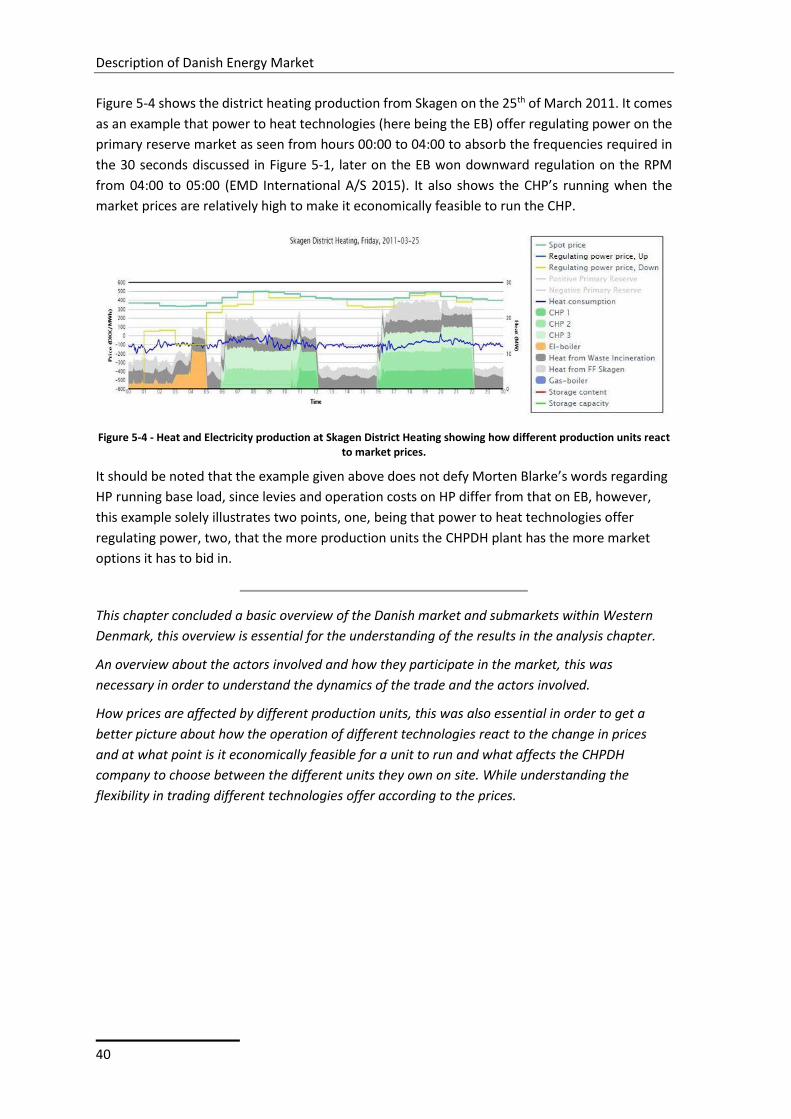
Description of Danish Energy Market
40
Figure 5-4 shows the district heating production from Skagen on the 25th of March 2011. It comes
as an example that power to heat technologies (here being the EB) offer regulating power on the
primary reserve market as seen from hours 00:00 to 04:00 to absorb the frequencies required in
the 30 seconds discussed in Figure 5-1, later on the EB won downward regulation on the RPM
from 04:00 to 05:00 (EMD International A/S 2015). It also shows the CHP’s running when the
market prices are relatively high to make it economically feasible to run the CHP.
Figure 5-4 - Heat and Electricity production at Skagen District Heating showing how different production units react to market prices.
It should be noted that the example given above does not defy Morten Blarke’s words regarding
HP running base load, since levies and operation costs on HP differ from that on EB, however,
this example solely illustrates two points, one, being that power to heat technologies offer
regulating power, two, that the more production units the CHPDH plant has the more market
options it has to bid in.
This chapter concluded a basic overview of the Danish market and submarkets within Western
Denmark, this overview is essential for the understanding of the results in the analysis chapter.
An overview about the actors involved and how they participate in the market, this was
necessary in order to understand the dynamics of the trade and the actors involved.
How prices are affected by different production units, this was also essential in order to get a
better picture about how the operation of different technologies react to the change in prices
and at what point is it economically feasible for a unit to run and what affects the CHPDH
company to choose between the different units they own on site. While understanding the
flexibility in trading different technologies offer according to the prices.
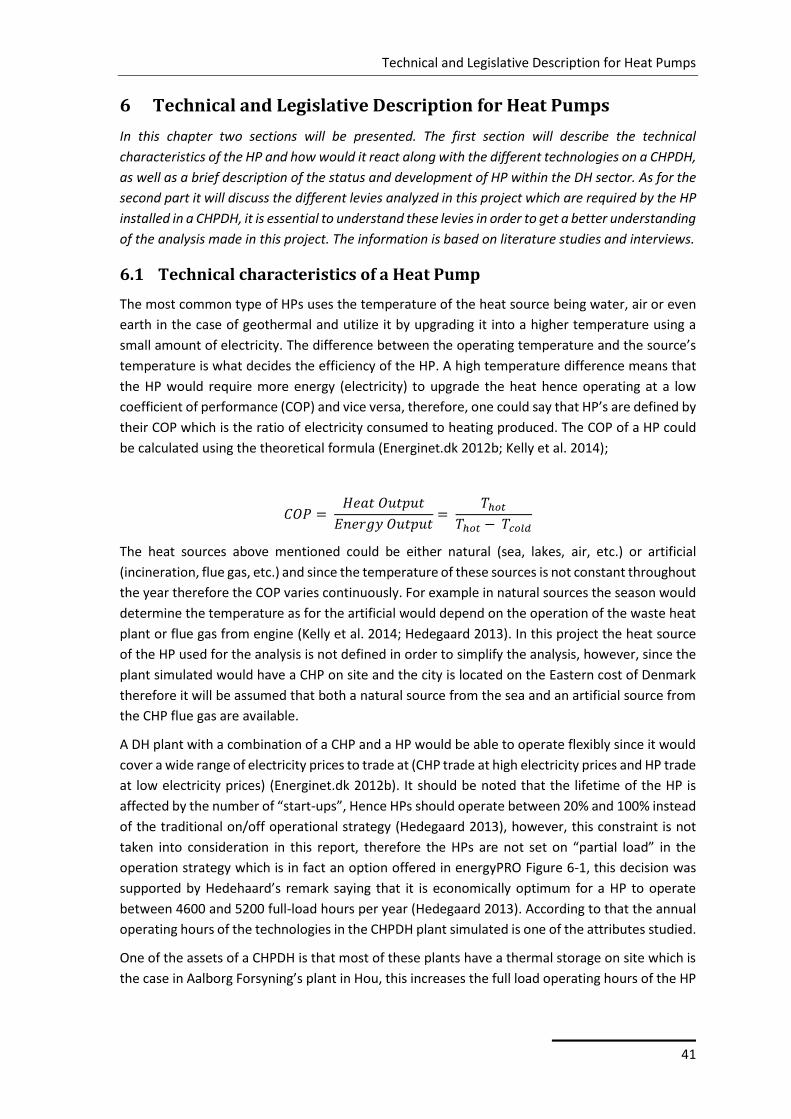
Technical and Legislative Description for Heat Pumps
41
6 Technical and Legislative Description for Heat Pumps
In this chapter two sections will be presented. The first section will describe the technical
characteristics of the HP and how would it react along with the different technologies on a CHPDH,
as well as a brief description of the status and development of HP within the DH sector. As for the
second part it will discuss the different levies analyzed in this project which are required by the HP
installed in a CHPDH, it is essential to understand these levies in order to get a better understanding
of the analysis made in this project. The information is based on literature studies and interviews.
6.1 Technical characteristics of a Heat Pump
The most common type of HPs uses the temperature of the heat source being water, air or even
earth in the case of geothermal and utilize it by upgrading it into a higher temperature using a
small amount of electricity. The difference between the operating temperature and the source’s
temperature is what decides the efficiency of the HP. A high temperature difference means that
the HP would require more energy (electricity) to upgrade the heat hence operating at a low
coefficient of performance (COP) and vice versa, therefore, one could say that HP’s are defined by
their COP which is the ratio of electricity consumed to heating produced. The COP of a HP could
be calculated using the theoretical formula (Energinet.dk 2012b; Kelly et al. 2014);
𝐶𝑂𝑃 = 𝐻𝑒𝑎𝑡 𝑂𝑢𝑡𝑝𝑢𝑡
𝐸𝑛𝑒𝑟𝑔𝑦 𝑂𝑢𝑡𝑝𝑢𝑡=
𝑇ℎ𝑜𝑡
𝑇ℎ𝑜𝑡 − 𝑇𝑐𝑜𝑙𝑑
The heat sources above mentioned could be either natural (sea, lakes, air, etc.) or artificial
(incineration, flue gas, etc.) and since the temperature of these sources is not constant throughout
the year therefore the COP varies continuously. For example in natural sources the season would
determine the temperature as for the artificial would depend on the operation of the waste heat
plant or flue gas from engine (Kelly et al. 2014; Hedegaard 2013). In this project the heat source
of the HP used for the analysis is not defined in order to simplify the analysis, however, since the
plant simulated would have a CHP on site and the city is located on the Eastern cost of Denmark
therefore it will be assumed that both a natural source from the sea and an artificial source from
the CHP flue gas are available.
A DH plant with a combination of a CHP and a HP would be able to operate flexibly since it would
cover a wide range of electricity prices to trade at (CHP trade at high electricity prices and HP trade
at low electricity prices) (Energinet.dk 2012b). It should be noted that the lifetime of the HP is
affected by the number of “start-ups”, Hence HPs should operate between 20% and 100% instead
of the traditional on/off operational strategy (Hedegaard 2013), however, this constraint is not
taken into consideration in this report, therefore the HPs are not set on “partial load” in the
operation strategy which is in fact an option offered in energyPRO Figure 6-1, this decision was
supported by Hedehaard’s remark saying that it is economically optimum for a HP to operate
between 4600 and 5200 full-load hours per year (Hedegaard 2013). According to that the annual
operating hours of the technologies in the CHPDH plant simulated is one of the attributes studied.
One of the assets of a CHPDH is that most of these plants have a thermal storage on site which is
the case in Aalborg Forsyning’s plant in Hou, this increases the full load operating hours of the HP
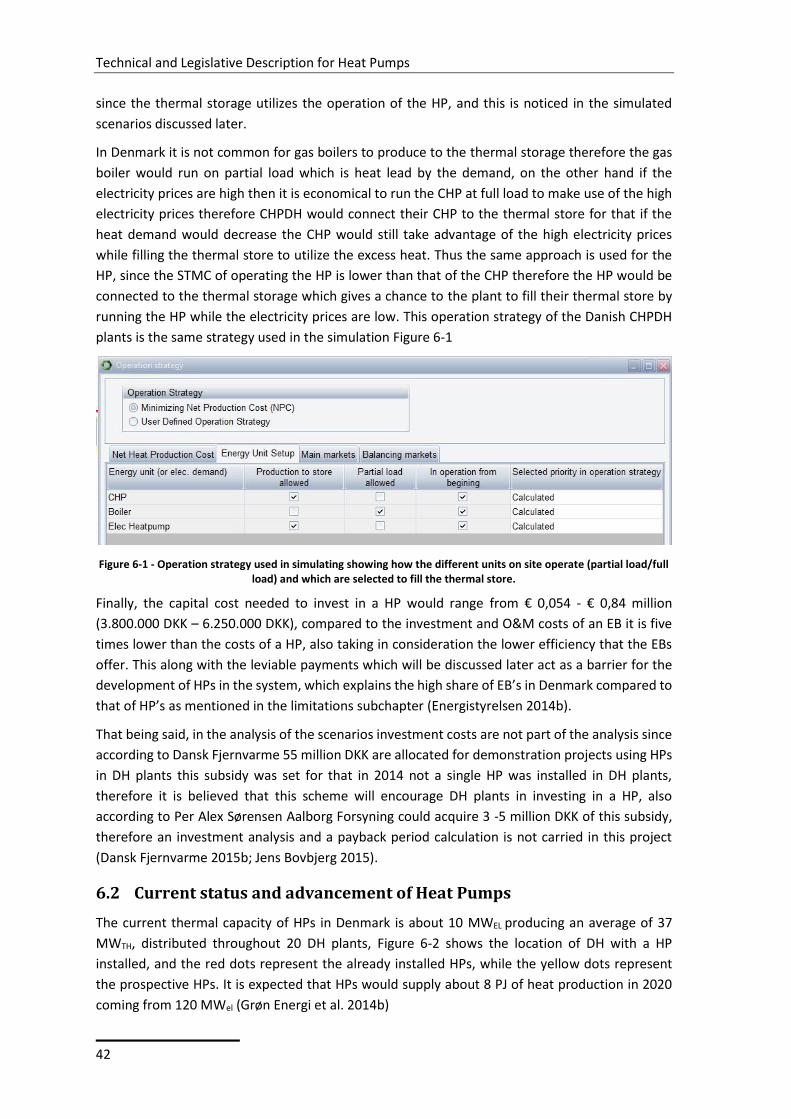
Technical and Legislative Description for Heat Pumps
42
since the thermal storage utilizes the operation of the HP, and this is noticed in the simulated
scenarios discussed later.
In Denmark it is not common for gas boilers to produce to the thermal storage therefore the gas
boiler would run on partial load which is heat lead by the demand, on the other hand if the
electricity prices are high then it is economical to run the CHP at full load to make use of the high
electricity prices therefore CHPDH would connect their CHP to the thermal store for that if the
heat demand would decrease the CHP would still take advantage of the high electricity prices
while filling the thermal store to utilize the excess heat. Thus the same approach is used for the
HP, since the STMC of operating the HP is lower than that of the CHP therefore the HP would be
connected to the thermal storage which gives a chance to the plant to fill their thermal store by
running the HP while the electricity prices are low. This operation strategy of the Danish CHPDH
plants is the same strategy used in the simulation Figure 6-1
Figure 6-1 - Operation strategy used in simulating showing how the different units on site operate (partial load/full load) and which are selected to fill the thermal store.
Finally, the capital cost needed to invest in a HP would range from € 0,054 - € 0,84 million
(3.800.000 DKK – 6.250.000 DKK), compared to the investment and O&M costs of an EB it is five
times lower than the costs of a HP, also taking in consideration the lower efficiency that the EBs
offer. This along with the leviable payments which will be discussed later act as a barrier for the
development of HPs in the system, which explains the high share of EB’s in Denmark compared to
that of HP’s as mentioned in the limitations subchapter (Energistyrelsen 2014b).
That being said, in the analysis of the scenarios investment costs are not part of the analysis since
according to Dansk Fjernvarme 55 million DKK are allocated for demonstration projects using HPs
in DH plants this subsidy was set for that in 2014 not a single HP was installed in DH plants,
therefore it is believed that this scheme will encourage DH plants in investing in a HP, also
according to Per Alex Sørensen Aalborg Forsyning could acquire 3 -5 million DKK of this subsidy,
therefore an investment analysis and a payback period calculation is not carried in this project
(Dansk Fjernvarme 2015b; Jens Bovbjerg 2015).
6.2 Current status and advancement of Heat Pumps
The current thermal capacity of HPs in Denmark is about 10 MWEL producing an average of 37
MWTH, distributed throughout 20 DH plants, Figure 6-2 shows the location of DH with a HP
installed, and the red dots represent the already installed HPs, while the yellow dots represent
the prospective HPs. It is expected that HPs would supply about 8 PJ of heat production in 2020
coming from 120 MWel (Grøn Energi et al. 2014b)
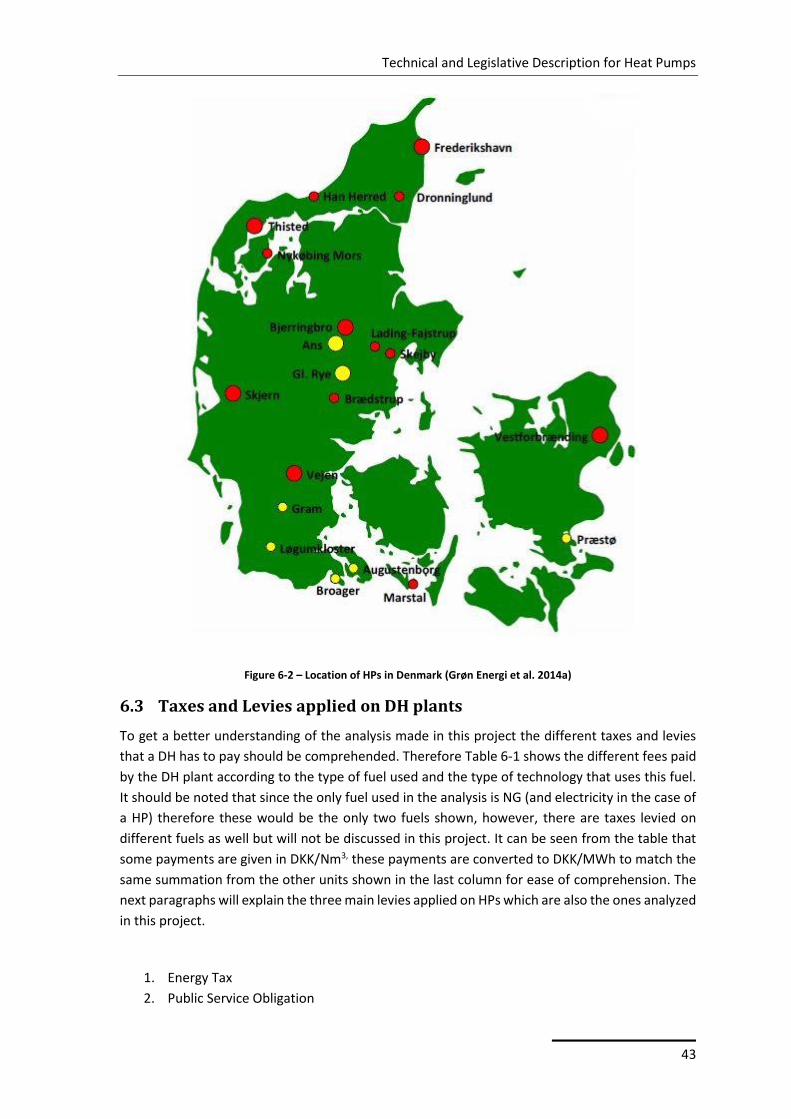
Technical and Legislative Description for Heat Pumps
43
Figure 6-2 – Location of HPs in Denmark (Grøn Energi et al. 2014a)
6.3 Taxes and Levies applied on DH plants
To get a better understanding of the analysis made in this project the different taxes and levies
that a DH has to pay should be comprehended. Therefore Table 6-1 shows the different fees paid
by the DH plant according to the type of fuel used and the type of technology that uses this fuel.
It should be noted that since the only fuel used in the analysis is NG (and electricity in the case of
a HP) therefore these would be the only two fuels shown, however, there are taxes levied on
different fuels as well but will not be discussed in this project. It can be seen from the table that
some payments are given in DKK/Nm3, these payments are converted to DKK/MWh to match the
same summation from the other units shown in the last column for ease of comprehension. The
next paragraphs will explain the three main levies applied on HPs which are also the ones analyzed
in this project.
1. Energy Tax
2. Public Service Obligation
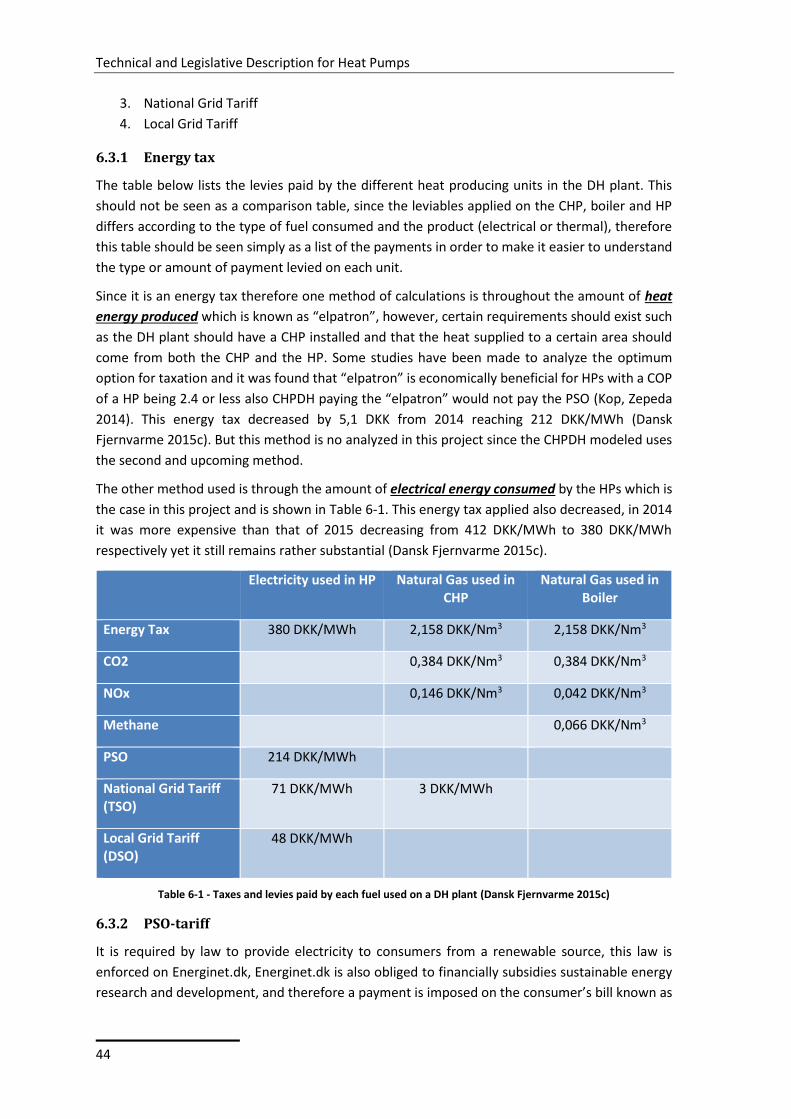
Technical and Legislative Description for Heat Pumps
44
3. National Grid Tariff
4. Local Grid Tariff
6.3.1 Energy tax
The table below lists the levies paid by the different heat producing units in the DH plant. This
should not be seen as a comparison table, since the leviables applied on the CHP, boiler and HP
differs according to the type of fuel consumed and the product (electrical or thermal), therefore
this table should be seen simply as a list of the payments in order to make it easier to understand
the type or amount of payment levied on each unit.
Since it is an energy tax therefore one method of calculations is throughout the amount of heat
energy produced which is known as “elpatron”, however, certain requirements should exist such
as the DH plant should have a CHP installed and that the heat supplied to a certain area should
come from both the CHP and the HP. Some studies have been made to analyze the optimum
option for taxation and it was found that “elpatron” is economically beneficial for HPs with a COP
of a HP being 2.4 or less also CHPDH paying the “elpatron” would not pay the PSO (Kop, Zepeda
2014). This energy tax decreased by 5,1 DKK from 2014 reaching 212 DKK/MWh (Dansk
Fjernvarme 2015c). But this method is no analyzed in this project since the CHPDH modeled uses
the second and upcoming method.
The other method used is through the amount of electrical energy consumed by the HPs which is
the case in this project and is shown in Table 6-1. This energy tax applied also decreased, in 2014
it was more expensive than that of 2015 decreasing from 412 DKK/MWh to 380 DKK/MWh
respectively yet it still remains rather substantial (Dansk Fjernvarme 2015c).
Electricity used in HP Natural Gas used in CHP
Natural Gas used in Boiler
Energy Tax 380 DKK/MWh 2,158 DKK/Nm3 2,158 DKK/Nm3
CO2 0,384 DKK/Nm3 0,384 DKK/Nm3
NOx 0,146 DKK/Nm3 0,042 DKK/Nm3
Methane 0,066 DKK/Nm3
PSO 214 DKK/MWh
National Grid Tariff (TSO)
71 DKK/MWh 3 DKK/MWh
Local Grid Tariff (DSO)
48 DKK/MWh
Table 6-1 - Taxes and levies paid by each fuel used on a DH plant (Dansk Fjernvarme 2015c)
6.3.2 PSO-tariff
It is required by law to provide electricity to consumers from a renewable source, this law is
enforced on Energinet.dk, Energinet.dk is also obliged to financially subsidies sustainable energy
research and development, and therefore a payment is imposed on the consumer’s bill known as
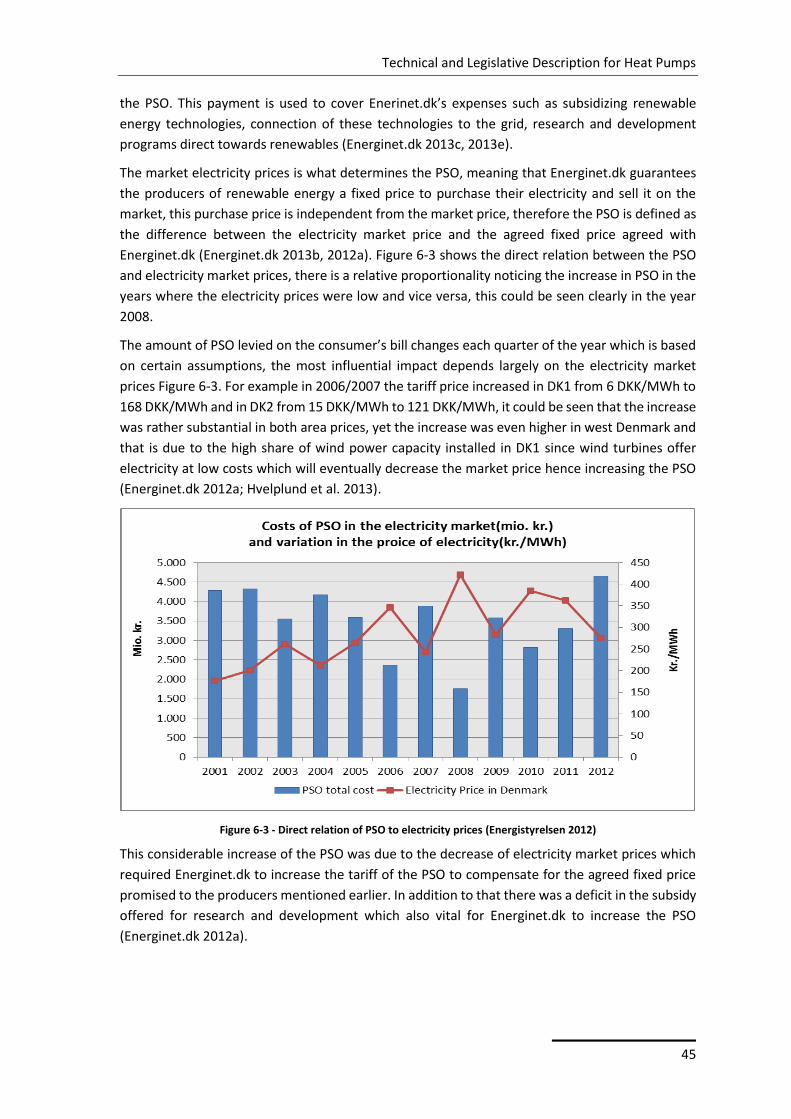
Technical and Legislative Description for Heat Pumps
45
the PSO. This payment is used to cover Enerinet.dk’s expenses such as subsidizing renewable
energy technologies, connection of these technologies to the grid, research and development
programs direct towards renewables (Energinet.dk 2013c, 2013e).
The market electricity prices is what determines the PSO, meaning that Energinet.dk guarantees
the producers of renewable energy a fixed price to purchase their electricity and sell it on the
market, this purchase price is independent from the market price, therefore the PSO is defined as
the difference between the electricity market price and the agreed fixed price agreed with
Energinet.dk (Energinet.dk 2013b, 2012a). Figure 6-3 shows the direct relation between the PSO
and electricity market prices, there is a relative proportionality noticing the increase in PSO in the
years where the electricity prices were low and vice versa, this could be seen clearly in the year
2008.
The amount of PSO levied on the consumer’s bill changes each quarter of the year which is based
on certain assumptions, the most influential impact depends largely on the electricity market
prices Figure 6-3. For example in 2006/2007 the tariff price increased in DK1 from 6 DKK/MWh to
168 DKK/MWh and in DK2 from 15 DKK/MWh to 121 DKK/MWh, it could be seen that the increase
was rather substantial in both area prices, yet the increase was even higher in west Denmark and
that is due to the high share of wind power capacity installed in DK1 since wind turbines offer
electricity at low costs which will eventually decrease the market price hence increasing the PSO
(Energinet.dk 2012a; Hvelplund et al. 2013).
Figure 6-3 - Direct relation of PSO to electricity prices (Energistyrelsen 2012)
This considerable increase of the PSO was due to the decrease of electricity market prices which
required Energinet.dk to increase the tariff of the PSO to compensate for the agreed fixed price
promised to the producers mentioned earlier. In addition to that there was a deficit in the subsidy
offered for research and development which also vital for Energinet.dk to increase the PSO
(Energinet.dk 2012a).
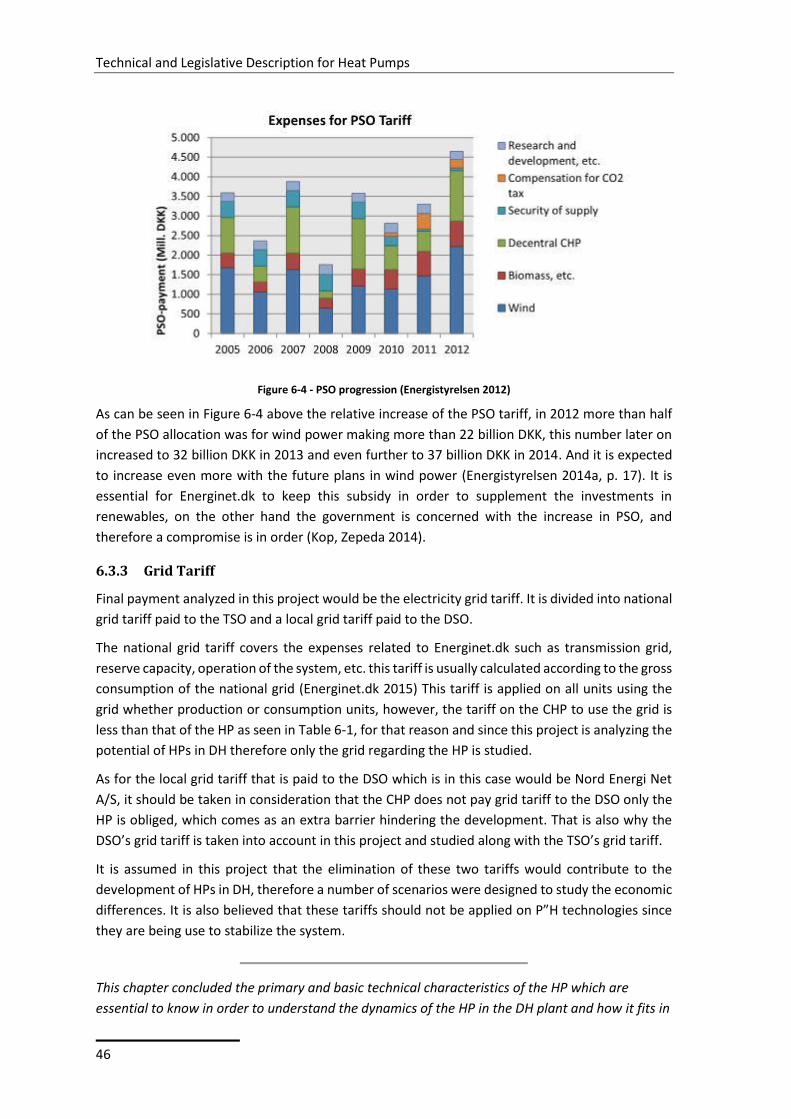
Technical and Legislative Description for Heat Pumps
46
Figure 6-4 - PSO progression (Energistyrelsen 2012)
As can be seen in Figure 6-4 above the relative increase of the PSO tariff, in 2012 more than half
of the PSO allocation was for wind power making more than 22 billion DKK, this number later on
increased to 32 billion DKK in 2013 and even further to 37 billion DKK in 2014. And it is expected
to increase even more with the future plans in wind power (Energistyrelsen 2014a, p. 17). It is
essential for Energinet.dk to keep this subsidy in order to supplement the investments in
renewables, on the other hand the government is concerned with the increase in PSO, and
therefore a compromise is in order (Kop, Zepeda 2014).
6.3.3 Grid Tariff
Final payment analyzed in this project would be the electricity grid tariff. It is divided into national
grid tariff paid to the TSO and a local grid tariff paid to the DSO.
The national grid tariff covers the expenses related to Energinet.dk such as transmission grid,
reserve capacity, operation of the system, etc. this tariff is usually calculated according to the gross
consumption of the national grid (Energinet.dk 2015) This tariff is applied on all units using the
grid whether production or consumption units, however, the tariff on the CHP to use the grid is
less than that of the HP as seen in Table 6-1, for that reason and since this project is analyzing the
potential of HPs in DH therefore only the grid regarding the HP is studied.
As for the local grid tariff that is paid to the DSO which is in this case would be Nord Energi Net
A/S, it should be taken in consideration that the CHP does not pay grid tariff to the DSO only the
HP is obliged, which comes as an extra barrier hindering the development. That is also why the
DSO’s grid tariff is taken into account in this project and studied along with the TSO’s grid tariff.
It is assumed in this project that the elimination of these two tariffs would contribute to the
development of HPs in DH, therefore a number of scenarios were designed to study the economic
differences. It is also believed that these tariffs should not be applied on P”H technologies since
they are being use to stabilize the system.
This chapter concluded the primary and basic technical characteristics of the HP which are
essential to know in order to understand the dynamics of the HP in the DH plant and how it fits in

Technical and Legislative Description for Heat Pumps
47
the analysis. Later, a brief description of the current status of HPs was laid out, this was shown
just to shed the light on the capacity and locations of HPs in Denmark. Finally, institutional levies
paid by the CHPDH Company, the levies included the ones applied on the CHP, gas boiler and
most importantly the HP. The four main levies analyzed in this project were thoroughly explained
to make it easier to comprehend the analysis and understand the scenarios analyzed.

Technical and Legislative Description for Heat Pumps
48
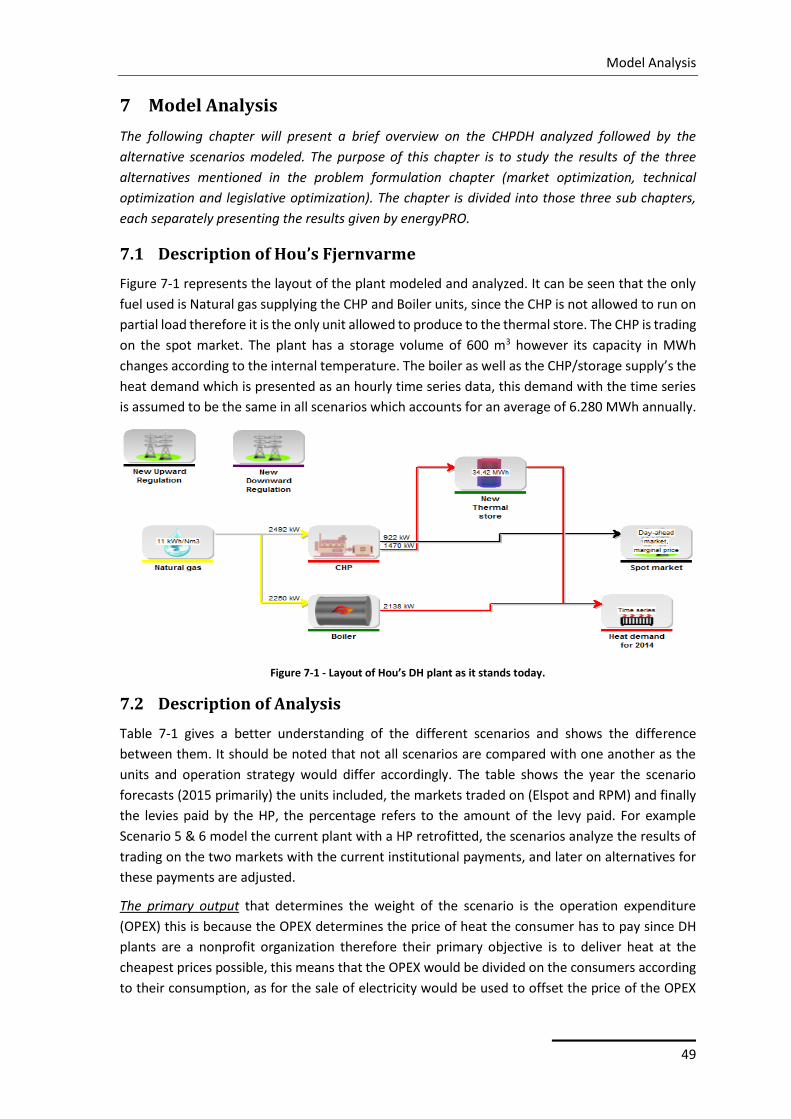
Model Analysis
49
7 Model Analysis
The following chapter will present a brief overview on the CHPDH analyzed followed by the
alternative scenarios modeled. The purpose of this chapter is to study the results of the three
alternatives mentioned in the problem formulation chapter (market optimization, technical
optimization and legislative optimization). The chapter is divided into those three sub chapters,
each separately presenting the results given by energyPRO.
7.1 Description of Hou’s Fjernvarme
Figure 7-1 represents the layout of the plant modeled and analyzed. It can be seen that the only
fuel used is Natural gas supplying the CHP and Boiler units, since the CHP is not allowed to run on
partial load therefore it is the only unit allowed to produce to the thermal store. The CHP is trading
on the spot market. The plant has a storage volume of 600 m3 however its capacity in MWh
changes according to the internal temperature. The boiler as well as the CHP/storage supply’s the
heat demand which is presented as an hourly time series data, this demand with the time series
is assumed to be the same in all scenarios which accounts for an average of 6.280 MWh annually.
Figure 7-1 - Layout of Hou’s DH plant as it stands today.
7.2 Description of Analysis
Table 7-1 gives a better understanding of the different scenarios and shows the difference
between them. It should be noted that not all scenarios are compared with one another as the
units and operation strategy would differ accordingly. The table shows the year the scenario
forecasts (2015 primarily) the units included, the markets traded on (Elspot and RPM) and finally
the levies paid by the HP, the percentage refers to the amount of the levy paid. For example
Scenario 5 & 6 model the current plant with a HP retrofitted, the scenarios analyze the results of
trading on the two markets with the current institutional payments, and later on alternatives for
these payments are adjusted.
The primary output that determines the weight of the scenario is the operation expenditure
(OPEX) this is because the OPEX determines the price of heat the consumer has to pay since DH
plants are a nonprofit organization therefore their primary objective is to deliver heat at the
cheapest prices possible, this means that the OPEX would be divided on the consumers according
to their consumption, as for the sale of electricity would be used to offset the price of the OPEX
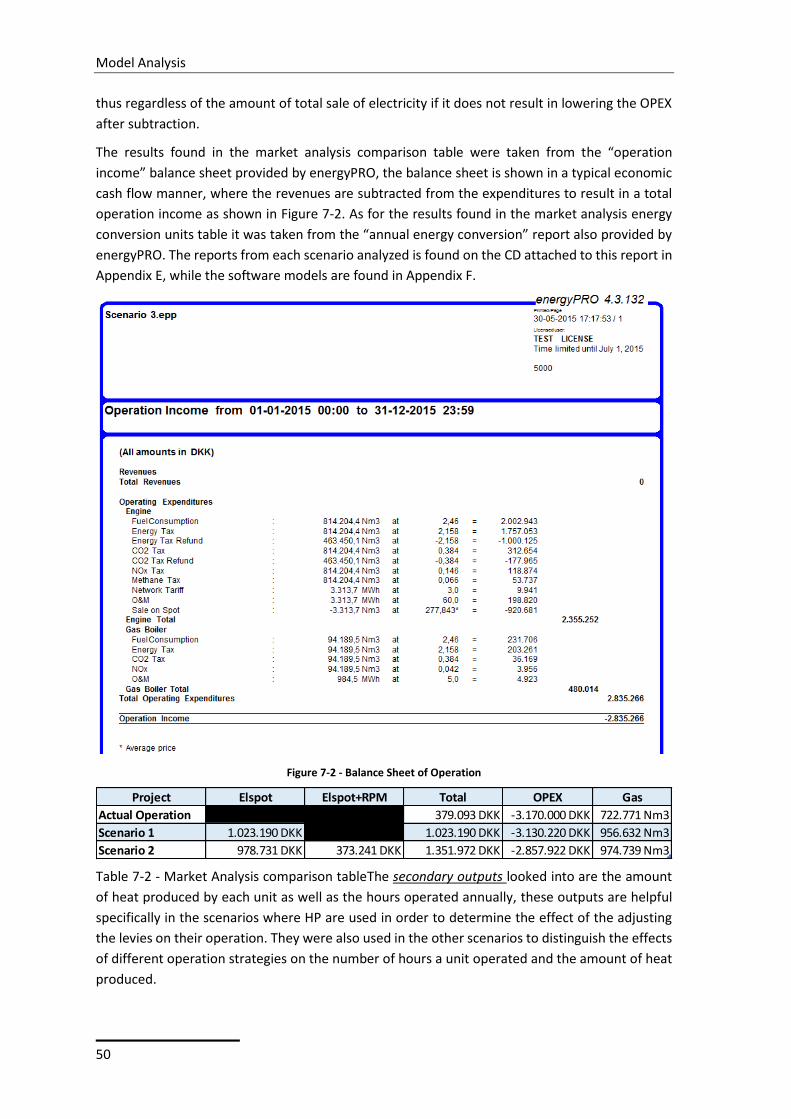
Model Analysis
50
thus regardless of the amount of total sale of electricity if it does not result in lowering the OPEX
after subtraction.
The results found in the market analysis comparison table were taken from the “operation
income” balance sheet provided by energyPRO, the balance sheet is shown in a typical economic
cash flow manner, where the revenues are subtracted from the expenditures to result in a total
operation income as shown in Figure 7-2. As for the results found in the market analysis energy
conversion units table it was taken from the “annual energy conversion” report also provided by
energyPRO. The reports from each scenario analyzed is found on the CD attached to this report in
Appendix E, while the software models are found in Appendix F.
Figure 7-2 - Balance Sheet of Operation
Table 7-2 - Market Analysis comparison tableThe secondary outputs looked into are the amount
of heat produced by each unit as well as the hours operated annually, these outputs are helpful
specifically in the scenarios where HP are used in order to determine the effect of the adjusting
the levies on their operation. They were also used in the other scenarios to distinguish the effects
of different operation strategies on the number of hours a unit operated and the amount of heat
produced.
Project Elspot Elspot+RPM Total OPEX Gas
Actual Operation 445.242 DKK 379.093 DKK -3.170.000 DKK 722.771 Nm3
Scenario 1 1.023.190 DKK 1.023.190 DKK -3.130.220 DKK 956.632 Nm3
Scenario 2 978.731 DKK 373.241 DKK 1.351.972 DKK -2.857.922 DKK 974.739 Nm3
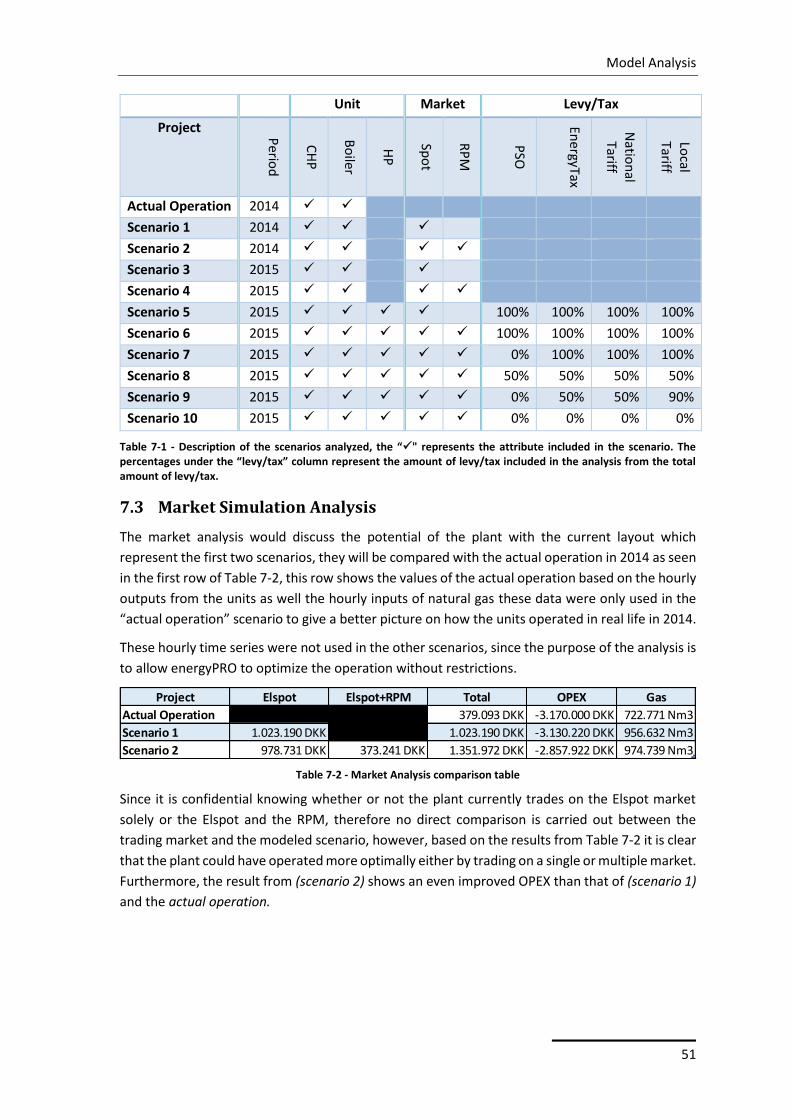
Model Analysis
51
Unit Market Levy/Tax
Project Perio
d
CH
P
Bo
iler
HP
Spo
t
RP
M
PSO
EnergyTax
Natio
nal
Tariff
Local
Tariff
Actual Operation 2014
Scenario 1 2014
Scenario 2 2014
Scenario 3 2015
Scenario 4 2015
Scenario 5 2015 100% 100% 100% 100%
Scenario 6 2015 100% 100% 100% 100%
Scenario 7 2015 0% 100% 100% 100%
Scenario 8 2015 50% 50% 50% 50%
Scenario 9 2015 0% 50% 50% 90%
Scenario 10 2015 0% 0% 0% 0%
Table 7-1 - Description of the scenarios analyzed, the “" represents the attribute included in the scenario. The percentages under the “levy/tax” column represent the amount of levy/tax included in the analysis from the total amount of levy/tax.
7.3 Market Simulation Analysis
The market analysis would discuss the potential of the plant with the current layout which
represent the first two scenarios, they will be compared with the actual operation in 2014 as seen
in the first row of Table 7-2, this row shows the values of the actual operation based on the hourly
outputs from the units as well the hourly inputs of natural gas these data were only used in the
“actual operation” scenario to give a better picture on how the units operated in real life in 2014.
These hourly time series were not used in the other scenarios, since the purpose of the analysis is
to allow energyPRO to optimize the operation without restrictions.
Table 7-2 - Market Analysis comparison table
Since it is confidential knowing whether or not the plant currently trades on the Elspot market
solely or the Elspot and the RPM, therefore no direct comparison is carried out between the
trading market and the modeled scenario, however, based on the results from Table 7-2 it is clear
that the plant could have operated more optimally either by trading on a single or multiple market.
Furthermore, the result from (scenario 2) shows an even improved OPEX than that of (scenario 1)
and the actual operation.
Project Elspot Elspot+RPM Total OPEX Gas
Actual Operation 445.242 DKK 379.093 DKK -3.170.000 DKK 722.771 Nm3
Scenario 1 1.023.190 DKK 1.023.190 DKK -3.130.220 DKK 956.632 Nm3
Scenario 2 978.731 DKK 373.241 DKK 1.351.972 DKK -2.857.922 DKK 974.739 Nm3
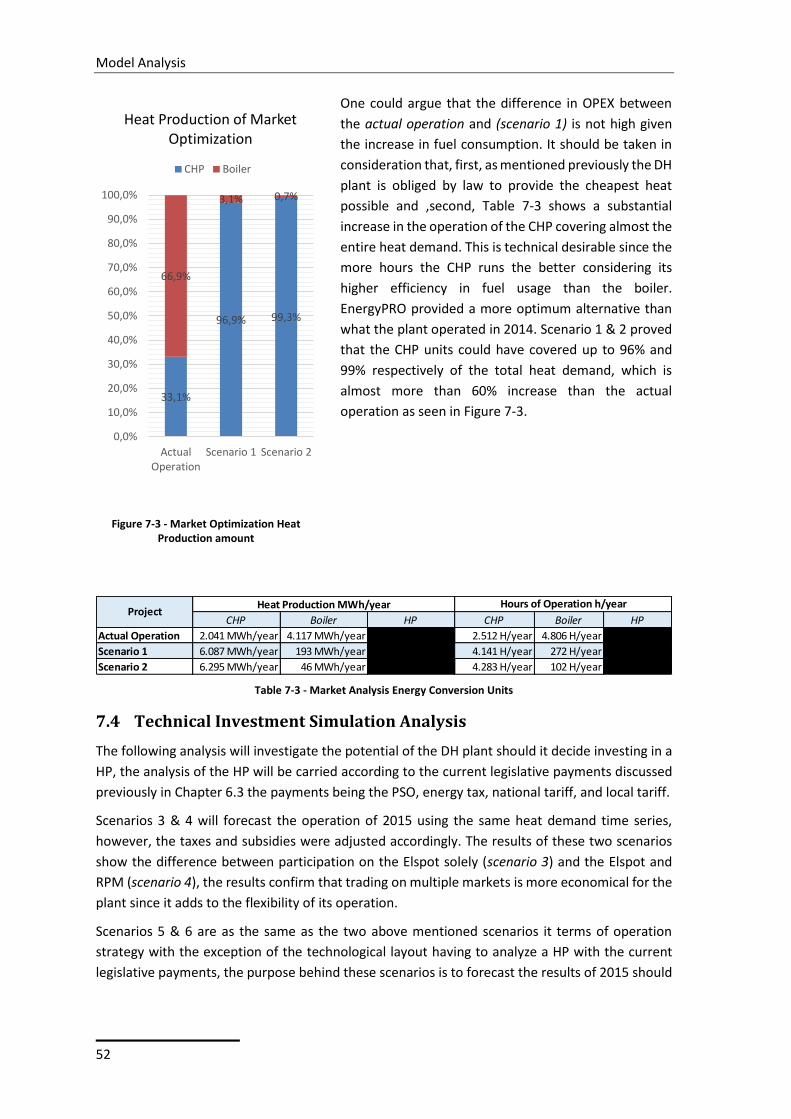
Model Analysis
52
One could argue that the difference in OPEX between
the actual operation and (scenario 1) is not high given
the increase in fuel consumption. It should be taken in
consideration that, first, as mentioned previously the DH
plant is obliged by law to provide the cheapest heat
possible and ,second, Table 7-3 shows a substantial
increase in the operation of the CHP covering almost the
entire heat demand. This is technical desirable since the
more hours the CHP runs the better considering its
higher efficiency in fuel usage than the boiler.
EnergyPRO provided a more optimum alternative than
what the plant operated in 2014. Scenario 1 & 2 proved
that the CHP units could have covered up to 96% and
99% respectively of the total heat demand, which is
almost more than 60% increase than the actual
operation as seen in Figure 7-3.
Table 7-3 - Market Analysis Energy Conversion Units
7.4 Technical Investment Simulation Analysis
The following analysis will investigate the potential of the DH plant should it decide investing in a
HP, the analysis of the HP will be carried according to the current legislative payments discussed
previously in Chapter 6.3 the payments being the PSO, energy tax, national tariff, and local tariff.
Scenarios 3 & 4 will forecast the operation of 2015 using the same heat demand time series,
however, the taxes and subsidies were adjusted accordingly. The results of these two scenarios
show the difference between participation on the Elspot solely (scenario 3) and the Elspot and
RPM (scenario 4), the results confirm that trading on multiple markets is more economical for the
plant since it adds to the flexibility of its operation.
Scenarios 5 & 6 are as the same as the two above mentioned scenarios it terms of operation
strategy with the exception of the technological layout having to analyze a HP with the current
legislative payments, the purpose behind these scenarios is to forecast the results of 2015 should
CHP Boiler HP CHP Boiler HP
Actual Operation 2.041 MWh/year 4.117 MWh/year 2.512 H/year 4.806 H/year
Scenario 1 6.087 MWh/year 193 MWh/year 4.141 H/year 272 H/year
Scenario 2 6.295 MWh/year 46 MWh/year 4.283 H/year 102 H/year
ProjectHeat Production MWh/year Hours of Operation h/year
Figure 7-3 - Market Optimization Heat Production amount
33,1%
96,9% 99,3%
66,9%
3,1% 0,7%
0,0%
10,0%
20,0%
30,0%
40,0%
50,0%
60,0%
70,0%
80,0%
90,0%
100,0%
ActualOperation
Scenario 1 Scenario 2
Heat Production of Market Optimization
CHP Boiler
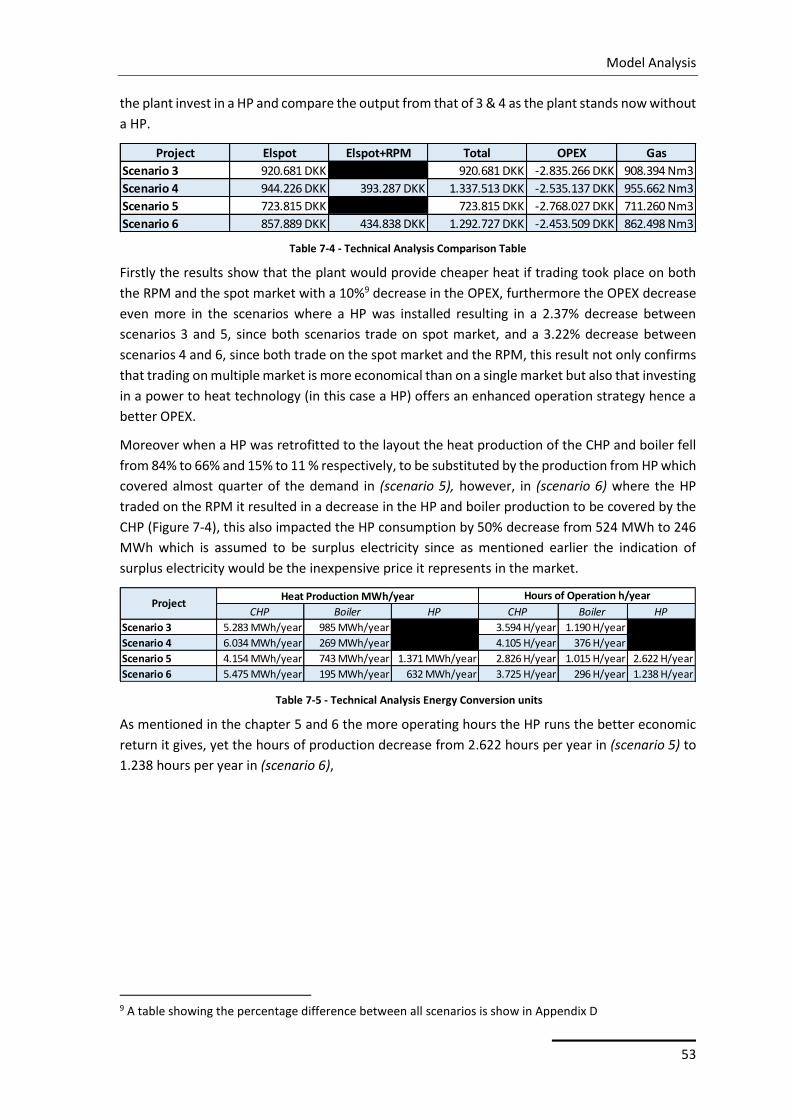
Model Analysis
53
the plant invest in a HP and compare the output from that of 3 & 4 as the plant stands now without
a HP.
Table 7-4 - Technical Analysis Comparison Table
Firstly the results show that the plant would provide cheaper heat if trading took place on both
the RPM and the spot market with a 10%9 decrease in the OPEX, furthermore the OPEX decrease
even more in the scenarios where a HP was installed resulting in a 2.37% decrease between
scenarios 3 and 5, since both scenarios trade on spot market, and a 3.22% decrease between
scenarios 4 and 6, since both trade on the spot market and the RPM, this result not only confirms
that trading on multiple market is more economical than on a single market but also that investing
in a power to heat technology (in this case a HP) offers an enhanced operation strategy hence a
better OPEX.
Moreover when a HP was retrofitted to the layout the heat production of the CHP and boiler fell
from 84% to 66% and 15% to 11 % respectively, to be substituted by the production from HP which
covered almost quarter of the demand in (scenario 5), however, in (scenario 6) where the HP
traded on the RPM it resulted in a decrease in the HP and boiler production to be covered by the
CHP (Figure 7-4), this also impacted the HP consumption by 50% decrease from 524 MWh to 246
MWh which is assumed to be surplus electricity since as mentioned earlier the indication of
surplus electricity would be the inexpensive price it represents in the market.
Table 7-5 - Technical Analysis Energy Conversion units
As mentioned in the chapter 5 and 6 the more operating hours the HP runs the better economic
return it gives, yet the hours of production decrease from 2.622 hours per year in (scenario 5) to
1.238 hours per year in (scenario 6),
9 A table showing the percentage difference between all scenarios is show in Appendix D
Project Elspot Elspot+RPM Total OPEX Gas
Scenario 3 920.681 DKK = 920.681 DKK -2.835.266 DKK 908.394 Nm3
Scenario 4 944.226 DKK 393.287 DKK 1.337.513 DKK -2.535.137 DKK 955.662 Nm3
Scenario 5 723.815 DKK 723.815 DKK -2.768.027 DKK 711.260 Nm3
Scenario 6 857.889 DKK 434.838 DKK 1.292.727 DKK -2.453.509 DKK 862.498 Nm3
CHP Boiler HP CHP Boiler HP
Scenario 3 5.283 MWh/year 985 MWh/year 3.594 H/year 1.190 H/year
Scenario 4 6.034 MWh/year 269 MWh/year 4.105 H/year 376 H/year
Scenario 5 4.154 MWh/year 743 MWh/year 1.371 MWh/year 2.826 H/year 1.015 H/year 2.622 H/year
Scenario 6 5.475 MWh/year 195 MWh/year 632 MWh/year 3.725 H/year 296 H/year 1.238 H/year
ProjectHeat Production MWh/year Hours of Operation h/year
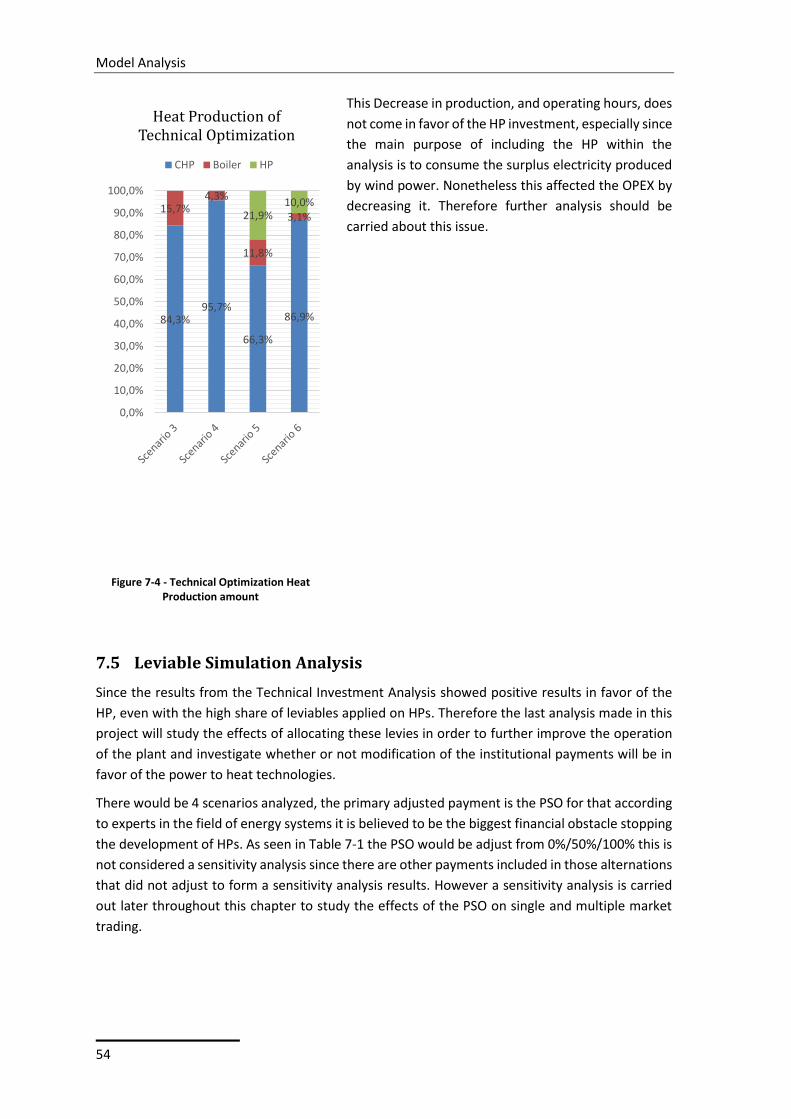
Model Analysis
54
This Decrease in production, and operating hours, does
not come in favor of the HP investment, especially since
the main purpose of including the HP within the
analysis is to consume the surplus electricity produced
by wind power. Nonetheless this affected the OPEX by
decreasing it. Therefore further analysis should be
carried about this issue.
7.5 Leviable Simulation Analysis
Since the results from the Technical Investment Analysis showed positive results in favor of the
HP, even with the high share of leviables applied on HPs. Therefore the last analysis made in this
project will study the effects of allocating these levies in order to further improve the operation
of the plant and investigate whether or not modification of the institutional payments will be in
favor of the power to heat technologies.
There would be 4 scenarios analyzed, the primary adjusted payment is the PSO for that according
to experts in the field of energy systems it is believed to be the biggest financial obstacle stopping
the development of HPs. As seen in Table 7-1 the PSO would be adjust from 0%/50%/100% this is
not considered a sensitivity analysis since there are other payments included in those alternations
that did not adjust to form a sensitivity analysis results. However a sensitivity analysis is carried
out later throughout this chapter to study the effects of the PSO on single and multiple market
trading.
Figure 7-4 - Technical Optimization Heat Production amount
84,3%95,7%
66,3%
86,9%
15,7%4,3%
11,8%
3,1%21,9%10,0%
0,0%
10,0%
20,0%
30,0%
40,0%
50,0%
60,0%
70,0%
80,0%
90,0%
100,0%
Heat Production of Technical Optimization
CHP Boiler HP
Model Analysis
55
Table 7-6 - Leviable Analysis Comparison Table
The above comparison table lists the scenarios in order of OPEX (high to low) scenario 7 introduces
the first allocated payment with a decrease in the PSO of 100% (complete elimination). The
analysis from this scenario shows a decrease in the OPEX by almost 170.000 DKK compared to
scenario 6 and a substantial difference of almost 500.000 DKK when compared to the OPEX from
scenario 5. This decrease in OPEX proves that the operation of the plant running a HP is directly
related to the amount of PSO paid, even with the remainder of the payments (energy tax, national
& local tariff) still fully paid.
Table 7-7 - Leviable Analysis Energy Conversion Units
Not only does the decrease in the PSO improve the OPEX but also increased the production of the
HP as seen in Figure 7-5 accounting for a consumption of 603 MWh in (scenario 7).
On the other hand the scenarios 8 & 9 also show more
promising results as further decrease of the rest of the
payments was applied (see Table 7-1), nonetheless their
results are rather similar. Both showed a further
decrease in the OPEX by almost 10% (75.000 DKK)
decrease, and almost double the heat production from
the HP in (scenario 7) reaching up to 37,7% in (scenario
8) consuming more than 1.000 MWh on the electricity
market. The most intriguing observation would be the
decrease in the gas boiler production reaching almost
zero percent.
These scenarios (8 and 9) have further proven the belief
that the taxes and levies applied on HP act as a barrier in
the development.
Furthermore scenario 10 represents a radical approach
which according to John Tang is “not realistic” (John Tang
2015). However, this scenario was represented in order
to give a better picture on the most radical idealistic
scenario. Even though the results does not show a high
share in the revenue of sale of electricity, however, it provides the least OPEX amongst all the
scenarios with more than 1.000.000 DKK difference than the current OPEX. Not only an
Project Elspot Elspot+RPM Total OPEX Gas
Scenario 7 753.522 DKK 483.677 DKK 1.237.199 DKK -2.282.226 DKK 748.303 Nm3
Scenario 8 643.916 DKK 497.164 DKK 1.141.080 DKK -2.068.703 DKK 628.577 Nm3
Scenario 9 620.841 DKK 488.493 DKK 1.109.334 DKK -1.992.996 DKK 604.241 Nm3
Scenario 10 513.672 DKK 379.662 DKK 893.334 DKK -1.482.819 DKK 504.842 Nm3
CHP Boiler HP CHP Boiler HP
Scenario 7 4.805 MWh/year 81 MWh/year 1.408 MWh/year 3.269 H/year 121 H/year 3.014 H/year
Scenario 8 4.071 MWh/year 11 MWh/year 2.221 MWh/year 2.770 H/year 25 H/year 5.197 H/year
Scenario 9 3.910 MWh/year 15 MWh/year 2.377 MWh/year 2.661 H/year 41 H/year 5.594 H/year
Scenario 10 3.264 MWh/year 18 MWh/year 3.025 MWh/year 2.221 H/year 67 H/year 7.242 H/year
ProjectHeat Production MWh/year Hours of Operation h/year
Figure 7-5 - Leviable Optimization Heat Production amount
76,3%64,6% 62,0%
51,8%
1,3%
0,2% 0,2%
0,3%
22,4%35,2% 37,7%
48,0%
0,0%
10,0%
20,0%
30,0%
40,0%
50,0%
60,0%
70,0%
80,0%
90,0%
100,0%
Heat Production of Legislative Optimization
CHP Boiler HP
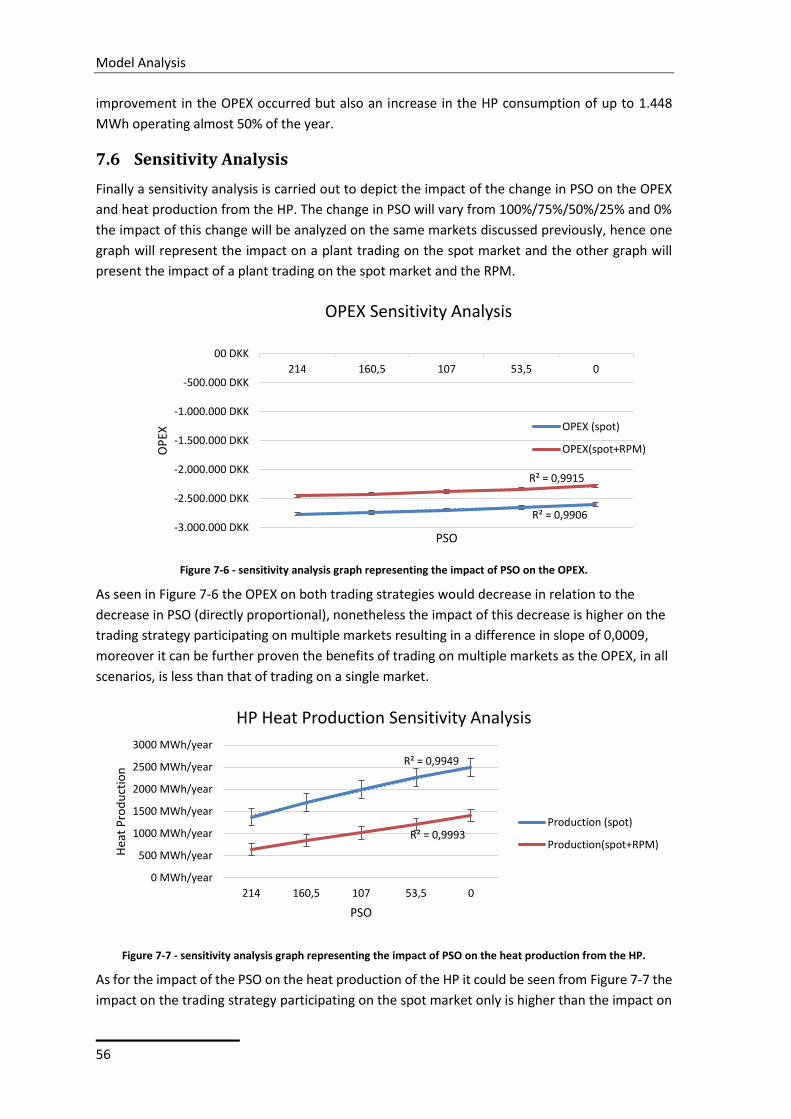
Model Analysis
56
improvement in the OPEX occurred but also an increase in the HP consumption of up to 1.448
MWh operating almost 50% of the year.
7.6 Sensitivity Analysis
Finally a sensitivity analysis is carried out to depict the impact of the change in PSO on the OPEX
and heat production from the HP. The change in PSO will vary from 100%/75%/50%/25% and 0%
the impact of this change will be analyzed on the same markets discussed previously, hence one
graph will represent the impact on a plant trading on the spot market and the other graph will
present the impact of a plant trading on the spot market and the RPM.
Figure 7-6 - sensitivity analysis graph representing the impact of PSO on the OPEX.
As seen in Figure 7-6 the OPEX on both trading strategies would decrease in relation to the
decrease in PSO (directly proportional), nonetheless the impact of this decrease is higher on the
trading strategy participating on multiple markets resulting in a difference in slope of 0,0009,
moreover it can be further proven the benefits of trading on multiple markets as the OPEX, in all
scenarios, is less than that of trading on a single market.
Figure 7-7 - sensitivity analysis graph representing the impact of PSO on the heat production from the HP.
As for the impact of the PSO on the heat production of the HP it could be seen from Figure 7-7 the
impact on the trading strategy participating on the spot market only is higher than the impact on
R² = 0,9906
R² = 0,9915
-3.000.000 DKK
-2.500.000 DKK
-2.000.000 DKK
-1.500.000 DKK
-1.000.000 DKK
-500.000 DKK
00 DKK
214 160,5 107 53,5 0
OP
EX
PSO
OPEX Sensitivity Analysis
OPEX (spot)
OPEX(spot+RPM)
R² = 0,9949
R² = 0,9993
0 MWh/year
500 MWh/year
1000 MWh/year
1500 MWh/year
2000 MWh/year
2500 MWh/year
3000 MWh/year
214 160,5 107 53,5 0
Hea
t P
rod
uct
ion
PSO
HP Heat Production Sensitivity Analysis
Production (spot)
Production(spot+RPM)
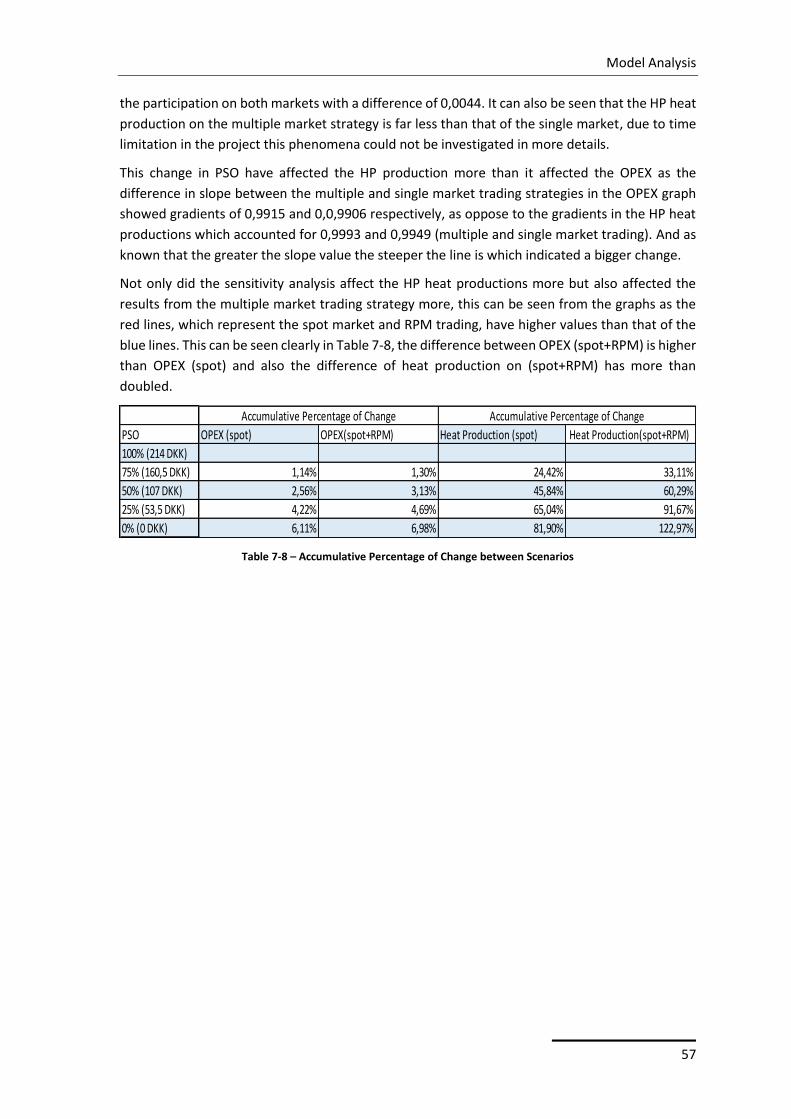
Model Analysis
57
the participation on both markets with a difference of 0,0044. It can also be seen that the HP heat
production on the multiple market strategy is far less than that of the single market, due to time
limitation in the project this phenomena could not be investigated in more details.
This change in PSO have affected the HP production more than it affected the OPEX as the
difference in slope between the multiple and single market trading strategies in the OPEX graph
showed gradients of 0,9915 and 0,0,9906 respectively, as oppose to the gradients in the HP heat
productions which accounted for 0,9993 and 0,9949 (multiple and single market trading). And as
known that the greater the slope value the steeper the line is which indicated a bigger change.
Not only did the sensitivity analysis affect the HP heat productions more but also affected the
results from the multiple market trading strategy more, this can be seen from the graphs as the
red lines, which represent the spot market and RPM trading, have higher values than that of the
blue lines. This can be seen clearly in Table 7-8, the difference between OPEX (spot+RPM) is higher
than OPEX (spot) and also the difference of heat production on (spot+RPM) has more than
doubled.
Table 7-8 – Accumulative Percentage of Change between Scenarios
PSO OPEX (spot) OPEX(spot+RPM) Heat Production (spot) Heat Production(spot+RPM)
100% (214 DKK)
75% (160,5 DKK) 1,14% 1,30% 24,42% 33,11%
50% (107 DKK) 2,56% 3,13% 45,84% 60,29%
25% (53,5 DKK) 4,22% 4,69% 65,04% 91,67%
0% (0 DKK) 6,11% 6,98% 81,90% 122,97%
Accumulative Percentage of Change Accumulative Percentage of Change

Model Analysis
58
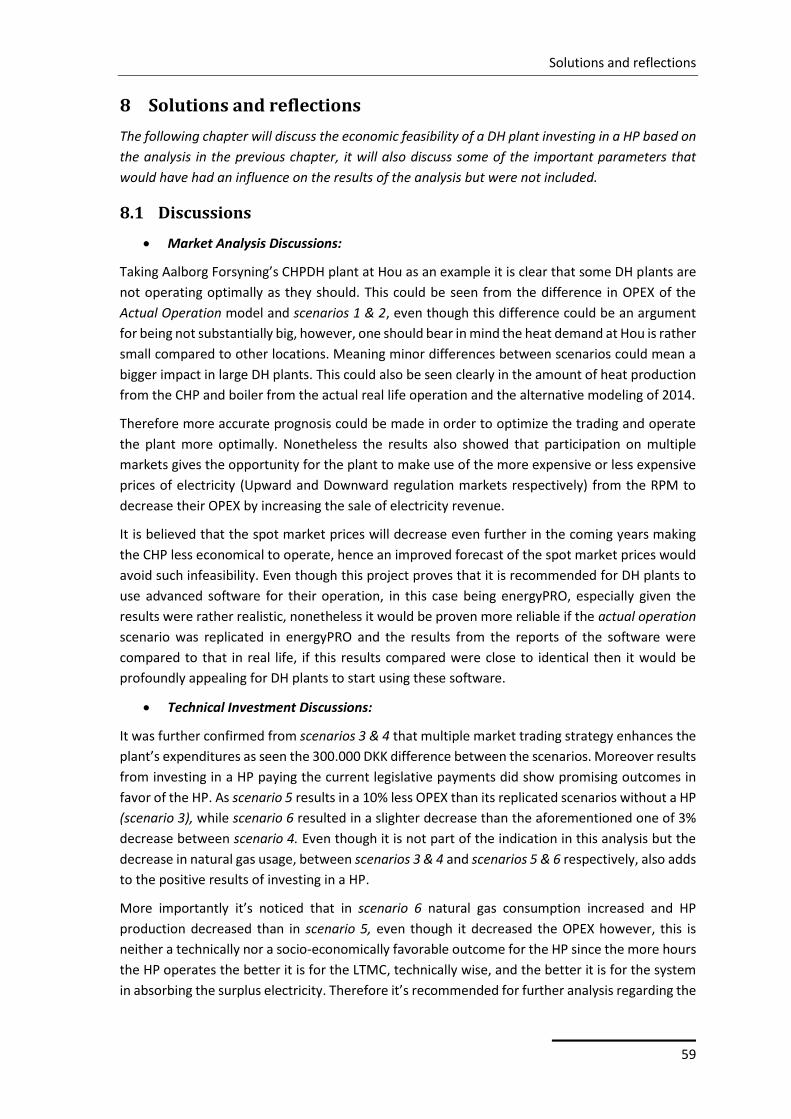
Solutions and reflections
59
8 Solutions and reflections
The following chapter will discuss the economic feasibility of a DH plant investing in a HP based on
the analysis in the previous chapter, it will also discuss some of the important parameters that
would have had an influence on the results of the analysis but were not included.
8.1 Discussions
Market Analysis Discussions:
Taking Aalborg Forsyning’s CHPDH plant at Hou as an example it is clear that some DH plants are
not operating optimally as they should. This could be seen from the difference in OPEX of the
Actual Operation model and scenarios 1 & 2, even though this difference could be an argument
for being not substantially big, however, one should bear in mind the heat demand at Hou is rather
small compared to other locations. Meaning minor differences between scenarios could mean a
bigger impact in large DH plants. This could also be seen clearly in the amount of heat production
from the CHP and boiler from the actual real life operation and the alternative modeling of 2014.
Therefore more accurate prognosis could be made in order to optimize the trading and operate
the plant more optimally. Nonetheless the results also showed that participation on multiple
markets gives the opportunity for the plant to make use of the more expensive or less expensive
prices of electricity (Upward and Downward regulation markets respectively) from the RPM to
decrease their OPEX by increasing the sale of electricity revenue.
It is believed that the spot market prices will decrease even further in the coming years making
the CHP less economical to operate, hence an improved forecast of the spot market prices would
avoid such infeasibility. Even though this project proves that it is recommended for DH plants to
use advanced software for their operation, in this case being energyPRO, especially given the
results were rather realistic, nonetheless it would be proven more reliable if the actual operation
scenario was replicated in energyPRO and the results from the reports of the software were
compared to that in real life, if this results compared were close to identical then it would be
profoundly appealing for DH plants to start using these software.
Technical Investment Discussions:
It was further confirmed from scenarios 3 & 4 that multiple market trading strategy enhances the
plant’s expenditures as seen the 300.000 DKK difference between the scenarios. Moreover results
from investing in a HP paying the current legislative payments did show promising outcomes in
favor of the HP. As scenario 5 results in a 10% less OPEX than its replicated scenarios without a HP
(scenario 3), while scenario 6 resulted in a slighter decrease than the aforementioned one of 3%
decrease between scenario 4. Even though it is not part of the indication in this analysis but the
decrease in natural gas usage, between scenarios 3 & 4 and scenarios 5 & 6 respectively, also adds
to the positive results of investing in a HP.
More importantly it’s noticed that in scenario 6 natural gas consumption increased and HP
production decreased than in scenario 5, even though it decreased the OPEX however, this is
neither a technically nor a socio-economically favorable outcome for the HP since the more hours
the HP operates the better it is for the LTMC, technically wise, and the better it is for the system
in absorbing the surplus electricity. Therefore it’s recommended for further analysis regarding the
Solutions and reflections
60
operating hours of the HP and investigate what caused this change and also further study how to
mitigate or even avoid this unfavorable change. Especially that this phenomena1011 accrued in all
other scenarios (7-10) whom of which had a HP trading on multiple markets. It was believed that
this was due to the high share of levis applied on HPs but the scenarios 7-10 proved that this was
not the case, therefore it could be due to software errors or it could be in fact that the HP
decreases due to CHP participation on multiple markets, and since energyPRO is obliged to
minimize the cost of operation therefore it, the software, would not take into account the
technical optimization but the socio economic optimization.
Legislative Analysis Discussions:
Lastly, allocation of the payments was made where realistic discounts were applied to the levies
inspired by recommendations from expert interviews and literature readings. The first
adjustments was made by completely eliminating the PSO payments on the HP (scenario 7) since
the purpose of investing in a HP unit was to absorb the surplus electricity and such payment would
act as an obstacle and increase the expenditures. The results showed that the PSO plays a major
role in the outcome of the OPEX as well as the operating hours of the HP, this removal of the PSO
is believed to be a realistic and necessary step towards the development of HPs in the system.
This was further proven in the sensitivity analysis carried on later in the chapter where the OPEX
and heat production of the HP were directly proportional to the decrease in PSO
Further alternations were done to the payments in order to study their impact on the operation
of the plant and economic outcome. The results showed an even further improvement in the
results, the less levies and taxation the HP paid the more the OPEX improved and the more
operating hours the HP ran. Where scenario 8 modified the payments by decreasing all the
payments by 50% (see Table 6-1) and scenario 9 decreased the PSO by 100%, energy tax by 50%,
and national grid tariff by 50% and the local grid tariff by 10%. It is recommended to investigate
further the realistic feasibility of change of these payments and the boundaries facing these levies
from changing and also what can be done in order to modify these levies at least for decentralized
HPs installed in DH plants.
Later on scenario 10 showed a radical approach by eliminating all four levies on the HP, the
analysis resulted in a substantial decrease in the OPEX and a higher share of heat production from
the HP.
As mentioned earlier since the spot market prices will decrease in the future this would improve
the business case of the HPs within the heating sector, therefore it is recommended to investigate
the effects of these payments on the development of HP before moving into action and changing
the policies towards HP.
8.2 Summary of Discussion
In general the results have shown that there is more potential for CHPDH to improve their trading,
moreover the results also showed that investing in a HP would offer cheaper heat providing that
10 The phenomena mentioned here is the decrease in HP production in the multiple market trading strategy compared to that of the single trading strategy 11 The results from scenarios 7-10 trading on a single market are not included in this project, however, their results were investigated to study the impact of HP production.
Solutions and reflections
61
the HP would absorb surplus wind power. The trading strategy causing the heat production of the
HP to decrease, when operating on multiple markets, is not a positive outcome since one of the
main objectives to invest in the HP was to absorb the surplus electricity. Therefore this leaves the
plant with two choices:
1. Trade on both markets, Elspot & RPM, and risk the decrease in HP operating hours. Hence
not absorbing enough surplus electricity, yet providing cheaper heat
2. Trade on a single market, Elspot, and consume as much surplus electricity as economically
possible risking the increase in OPEX, hence providing more expensive heat
The OPEX from the modified institutional payments have decreased which shows that the
expenditures of the HP affects the total balance sheet and the primary payments are what causes
this effect. The same phenomena where the heat production from the HP decreases in the
multiple market trading also happens in the scenarios where the levies were modified. However,
this minor consumption of electricity from the HP could ripple into a major positive impact if many
DH networks would invest in a HP.
Finally, more investigation should be carried out to study the effect of environmental emissions
from the CHP and boiler since these were left out of the analysis, and would the change in taxes
applied on these emissions affect the operation of the plant.
8.3 Limitations in Discussion
The results from the analysis indicate that there could be further improvement in trading with the
current layout, however, it is as economically feasible to participate on the spot market and the
RPM simultaneously, this is believed to be linked to the limitation in this project, which are
summarized as follows;
1. Assumptions made about the exclusion of investment analysis
2. Segregation of some of the stakeholders and legislative payments (shown in Figure 2-3)
3. Focus on the economic/business case of decentralized CHPDH plants
4. Perfect prognosis of heat demand and market prices
These limitations could very well affect the results. Assuming that Hou’s CHPDH plant would not
be able to acquire the investment needed from the pilot project of 55 million Danish kroner set
for DH plants willing to experiment in HPs, then the municipality would need to fund the HP,
meaning an investment analysis with the current discount rates and interest rate should be carried
to determine the net present value of the project as well as the dynamic payback time, since these
parameters could affect the outcome of the results hence the decision taken to invest in the HP.
Fixing the analysis on the stakeholders discussed previously as well as the four leviables included,
is believed to impact the results. Since environmental emissions were not studied in the analysis,
it could very well have a significant effect on the decision making of the investment of HPs. On the
other hand more stakeholders should be analyzed to study the possibility of the alternations of
these payments even further, it is recommended to interview representatives from the SKAT or
ministry of taxations and discuss the possibilities of decreasing the energy tax on HPs installed in
decentralized CHPDH, and what are the barriers facing the SKAT from taking action towards
modification of this payment. Nonetheless concentrating on a small scale DH plant could also
affect the outcome, since a larger DH plant with a different layout and heat demand profile could

Solutions and reflections
62
show different results, therefore it is also recommended to apply the analysis on different CHPDH
with a larger scale. Additionally it could be seen that some of the scenarios took a rather unrealistic
radical approach, this was due to the theoretical concept described in chapter 2, and therefore
the feasibility in real life of these scenarios should be investigated in more details.
Focusing on the economic feasibility and the business case of the plant did not allow to look at
the impact of the results on the system perspective. Which could have a major impact should all
DH plants in Denmark invest in a HP, and how would that affect the energy market and
infrastructure, and is it beneficial for the system or would it have an opposite effect, therefore
further investigation about the systems perspective should be made.
Lastly it should be noted that the analysis made were based on perfect predictions on the spot
and regulating power markets prices, heat demands and outdoor temperatures. These perfect
assumptions do not happen in real life, as there are some imbalances that accrue due to imperfect
forecasting of prices and temperature or unexpected change in heat demand.
Conclusion
63
9 Conclusion
The focus in this project was on the survival of Danish decentralized CHPDH in the energy system
but use of better operation strategy through enhanced trading, retrofitting the plant with a power
to heat technology and adjustment of the institutional payments to help develop power to heat
technologies in the DH system.
The following research question was made:
How can CHPDH strategically optimize their operation strategy to decrease their operation
expenditure by participating on multiple markets? And will investing in a power to heat
technology further decrease the plant’s operation expenditure? And what modifications could
be applied to the current institutional levies to promote power to heat investments?
In order to answer this research question three approaches were taken:
1. Optimization of operation strategy
The approach concluded that there is significant potential of improvement in the operation of the
CHPDH plant, the OPEX numbers forecasted shows a lower outcome than what is estimated to
have been the plant’s operation expenditures. This decrease came through strong prognosis of
electricity market price and heat demand, as well as flexible trading strategy through multiple
markets.
2. Investment in power to heat technology
The second approach concluded that there would be a clear difference between the OPEX of the
plant as it currently stands and the HP retrofitted simulated model. This improvement in OPEX
came with the technical advantage of the HP making use of the inexpensive electricity, assuming
it’s from surplus wind power, and converted it into heat supplying the DH network. This ultimately
decreased the OPEX since the NHPC from the HP using this inexpensive wind was less than the
NHPC of the other units. However, participating on multiple markets with the retrofitted model
decreased the operation of the HP yet improved the OPEX even further. Either way investing in
the HP resulted in an enhanced OPEX
3. Adjustment of legislative payments levied on the power to heat technologies
Finally, the third approach also showed promising results when levies were modified with
additional decrease in OPEX of the plant and more operating hours from the HP absorbing the
surplus wind power. The analysis showed a direct proportional relation between the modified PSO
scenarios proving that the less the PSO applied on the HP the more hours it ran and the less OPEX
resulted.
9.1 Recommendations
It is recommended to further investigate the following:
1. Reasons behind decreasing of HP heat production, and operating hours, when trading on
multiple market.
2. Analysis on whether or not the electricity used in the HP is from surplus wind power or
did the HP used fossil based electricity.
Conclusion
64
3. Should the plant not acquire the subsidy needed from the pilot project an investment
analysis should be made, with dynamic pay back times to show the feasibility of the
project
4. Application of the analysis on other CHPDH plants to validate its feasibility
5. Interview more actors to uncover more of the dynamics on how leviables change, and
maybe discuss the results from this project to prove the socio economic feasibility and the
potential development of HPs
6. Investigate the impact should the price of fuel or environmental emissions change, and
will that affect the results
9.2 Summary of Results
The analysis from this project have proven to show that there could be further improvements to
the current trading strategies of a CHPDH plant, where trading on multiple markets and an
enhanced prognosis would assist the plant in achieving such objective.
It also showed that even with the current high legislative levies applied on HPs, should the DH
plant invest in a HP, the HP in fact would absorb surplus electricity this added flexibility in the
energy system will result in
1. Giving CHPDH plants the opportunity of survival in the market, which will provide the
security of supply needed when there is a deficit in wind power.
2. Less reliance on exporting surplus wind power at cheap prices, especially that
interconnectors are not regularly available.
These optimum utilization of CHPDH retrofitted with a HP will result in further development of
renewables in the energy system. Additionally, modification of legislative payments will support
the investment in HPs.
Publication bibliography
65
10 Publication bibliography
Energy Strategy 2050 (2011).
Andersen, Anders; Sorknæs, Peter; Lund, Henrik (2014): Future power market and sustainable
energy solutions, pp. 2–4.
Andersen, Anders; Sorknæs, Peter; Mæng, Henning; Weiss, Thomas (2013): Facilitating energy
storage to allow high penetration of intermittent renewable energy.
Arising (2009): Backcasting. Available online at
http://wearearising.org/2009/01/13/backcasting/, updated on 3/23/2015, checked on
3/23/2015.
Blarke, Morten (2014): Morten Blarke Interview.
Brian Vad Mathiesen; Henrik Lund; Kenneth Karlsson (2009): The Ida climate plan 2050.
Brummell, Arden; MacGillivray, Greg (2011): INTRODUCTION TO SCENARIOS. Scenarios to
Strategy Inc.
Chittum, Anna; Østergaard, Poul Alberg (2014): How Danish communal heat planning empowers
municipalities and benefits individual consumers. In Energy Policy 74, pp. 465–474. DOI:
10.1016/j.enpol.2014.08.001.
Consolidated Act No. 1184 of 14 December 2011.
Danish Ministry of Climate, Energy and Building (2010): The Smart Grid Network's.
Dansk Fjernvarme (2015a): Elkedel indviet i Aarhus. Available online at
http://www.danskfjernvarme.dk/nyheder/nyt-fra-dansk-fjernvarme/150409elkedel-indviet-i-
aarhus, checked on 4/9/2015.
Dansk Fjernvarme (2015b): Ikke en eneste ny stor varmepumpe i 2014. Available online at
http://www.danskfjernvarme.dk/groen-energi/nyheder/150128ikke-en-eneste-ny-stor-
varmepumpe-i-2014, checked on 5/4/2015.
Dansk Fjernvarme (2015c): Oversigt 2015 - 2017.
DBDH (2008): the Danish Experience Conference in London. Available online at
http://dbdh.dk/district-energy-the-danish-experience-conference-in-london/, checked on
3/5/2015.
DEA (2010): Danish Energy Policy 1970-2010.
DEA (2012): Energy Policy in Denmark.
DEA (2014a): Energy scenarios for 2020, 2035 and 2050.
DEA (2014b): Energy Statistics 2012.
Detlefsen, Nina (2015): Ikke en eneste ny stor varmepumpe i 2014. Grøn Energi. Available online
at http://www.danskfjernvarme.dk/groen-energi/nyheder/150128ikke-en-eneste-ny-stor-
varmepumpe-i-2014, checked on 3/19/2015.
Publication bibliography
66
Dreborg, Karl H. (1996): Essence of backcasting. In Futures 28 (9), pp. 813–828. DOI:
10.1016/S0016-3287(96)00044-4.
Ea Energianalyse (2010): Afgifter på varmepumper til fjernvarme, p. 6.
EMD International A/S (2015): Elpriser og estimeret elproduktion og forbrug i vest-Danmark
(Jylland/Fyn). Available online at http://www.emd.dk/el/, checked on 4/20/2015.
Energinet.dk (2008): Reg C2 - The balancing market and balance settlement.
Energinet.dk (2012a): Spørgsmål og svar om PSO-tariffen. Available online at
http://energinet.dk/DA/El/Engrosmarked/Tariffer-og-priser/PSO-tariffen/Sider/Spoergsmaal-og-
svar-om-PSO-tariffen.aspx, checked on 5/6/2015.
Energinet.dk (2012b): TECHNOLOGY DATA FOR ENERGY PLANTS.
Energinet.dk (2013a): Energinet.dk's analysis assumptions 2013-2035.
Energinet.dk (2013b): PSO-tariffen. Available online at
http://energinet.dk/DA/El/Engrosmarked/Tariffer-og-priser/PSO-tariffen/Sider/default.aspx,
checked on 5/6/2015.
Energinet.dk (2013c): PSO-tariffen. Available online at
http://energinet.dk/DA/El/Engrosmarked/Tariffer-og-priser/PSO-tariffen/Sider/default.aspx,
checked on 5/6/2015.
Energinet.dk (2013d): Roles. Available online at
http://www.energinet.dk/EN/El/Engrosmarked/Viden-om-engrosmarkedet/Sider/Roller.aspx,
checked on 4/16/2015.
Energinet.dk (2013e): Subsidies for renewable energy. Available online at
http://energinet.dk/EN/KLIMA-OG-MILJOE/Energi-og-klima/Sider/Tilskud-til-vedvarende-
energi.aspx, checked on 5/6/2015.
Energinet.dk (2013f): Systemplan 2013.
Energinet.dk (2014): Download of market data. Available online at
http://www.energinet.dk/EN/El/Engrosmarked/Udtraek-af-markedsdata/Sider/default.aspx,
checked on 3/11/2015.
Energinet.dk (2015): Current tariffs. Available online at
http://energinet.dk/EN/El/Engrosmarked/Tariffer-og-priser/Sider/Aktuelle-tariffer-og-
gebyrer.aspx, checked on 5/6/2015.
Energistyrelsen (2012): Udgifter til PSO. Available online at http://www.ens.dk/undergrund-
forsyning/el-naturgas-varmeforsyning/elforsyning/elproduktion/udgifter-pso, checked on
5/6/2015.
Energistyrelsen (2014a): Fremskrivning af PSO-Udgifter, p. 17.
Energistyrelsen (2014b): Projekt Teknologikatalog – kort introduktion.
Euroheat and Power (2011): Overview of National DHC Market.
Publication bibliography
67
European Commission (2007): The 2020 climate and energy package - European Commission.
Available online at http://ec.europa.eu/clima/policies/package/index_en.htm, updated on
12/11/2014, checked on 3/6/2015.
Fazal, Hasaan (2011): What is Backcasting? How is it different from Forecasting? |
PakAccountants.com | Free accountancy resources | Video Lectures | Online Forums | Notes |
Past papers | Mock exams |. Available online at http://pakaccountants.com/what-is-
backcasting-and-difference-forecasting/, checked on 3/22/2015.
Grøn Energi; Energistyrelsen; PlanEnergi; Ramboll; Teknologisk Institut (2014a):
Inspirationskatalog for store varmepumpeprojekter i fjernvarmesystemet.
Grøn Energi; PlanEnergi; Ramboll; Teknologisk Institut (2014b): Drejebog til store
varmepumpeprojekter i fjernvarmesystemet, p. 2.
Hedegaard, K. (2013): Wind power integration with heat pumps, heat storages, and electric
vehicles.
Houmoller, Anders (2014): The Liberalized Electricity Market.
Houmøller, Anders (2014): Interview with Anders Houmøller. Interview with Guddat Max.
Hvelplund, Frede (2013): Innovative Democracy, Renewable Energy Strategies and political
economy.
Hvelplund, Frede (2014): Energy Policy and Innovative Democracy.
Hvelplund, Frede; Lund, Henrik (1998): Feasibility Studies and Public Regulation in a Market
Economy.
Hvelplund, Frede; Möller, Bernd; Sperling, Karl (2013): Local ownership, smart energy systems
and better wind power economy. In Energy Strategy Reviews 1 (3), pp. 164–170. DOI:
10.1016/j.esr.2013.02.001.
Inc.com (2015): Forecasting. Available online at
http://www.inc.com/encyclopedia/forecasting.html, checked on 3/23/2015.
Jens Bovbjerg (2015): Jens Bovbjerg Interview.
John Tang (2015): John Tang Interview.
Kelly, Nicolas J.; Tuohy, Paul G.; Hawkes, Adam D. (2014): Performance assessment of tariff-
based air source heat pump load shifting in a UK detached dwelling featuring phase change-
enhanced buffering. In Applied Thermal Engineering 71 (2), pp. 809–820. DOI:
10.1016/j.applthermaleng.2013.12.019.
Klinge Jacobsen, Henrik; Zvingilaite, Erika (2010): Reducing the market impact of large shares of
intermittent energy in Denmark. In Energy Policy 38 (7), pp. 3403–3413. DOI:
10.1016/j.enpol.2010.02.014.
Kop, Stefan; Zepeda, Maya (2014): Integration of Large Scale Heat Pumps in District Heating,
pp. 5–11.
Publication bibliography
68
Lund, H.; Münster, E. (2003): Management of surplus electricity-production from a fluctuating
renewable-energy source. In Applied Energy 76 (1-3), pp. 65–74. DOI: 10.1016/S0306-
2619(03)00048-5.
Lund, Henrik (2010): Renewable energy systems. The choice and modeling of 100% renewable
solutions. London: Academic; Elsevier.
Lund, Henrik; Andersen, Anders (2007): New CHP Partnerships offering balancing of fluctuating
Renewable Electricity Productions.
Lund, Henrik; Andersen, Anders N.; Østergaard, Poul Alberg; Mathiesen, Brian Vad; Connolly,
David (2012): From electricity smart grids to smart energy systems – A market operation based
approach and understanding. In Energy 42 (1), pp. 96–102. DOI: 10.1016/j.energy.2012.04.003.
Massoud, Gamal; Corinna, Bosl; Max, Guddat; Rasmus, Bjergegaard; Stefan, Kop (2014):
Transition Towards a More Flexible Energy System in Denmark.
Morphy (2013): Stakeholder Analysis | How to analyse Stakeholders. Available online at
http://www.stakeholdermap.com/stakeholder-analysis.html, updated on 3/31/2015, checked
on 4/9/2015.
Nord Pool Spot (2015a): About us. Available online at http://www.nordpoolspot.com/About-us/,
checked on 4/14/2015.
Nord Pool Spot (2015b): DAY-AHEAD MARKET ELSPOT. Available online at
http://www.nordpoolspot.com/TAS/Day-ahead-market-Elspot/.
Nord Pool Spot (2015c): INTRADAY MARKET ELBAS. Available online at
http://www.nordpoolspot.com/TAS/Intraday-market-Elbas/.
Paul-Fredrik Bach (2011): Wind Power and District Heating.
Pernille Sylvest Andersen (2011): Coherent Energy and Environmental System Analysis.
Plotkinov, Danill (2014): Danill Plotkinov. Interview with Guddat Max.
Poyry (2010): Wind Energy and Electricity Prices.
Quist, Jaco (2008): Backcasting for sustainability in the Netherlands: impacts after ten years,
policy relevance and a methodological framework.
Quist, Jaco; Wittmayer, Julia; Steenbergen, Frank; Loorback, Derk (2013): Combining backcasting
and transition management in the community arena.
Sharma, Rupen (2010): What is the Power/Influence Grid (Power/Influence Matrix)? Available
online at http://www.brighthubpm.com/resource-management/81140-what-is-the-power-
influence-grid-or-matrix/, checked on 3/19/2015.
Sievers, John; Stadler, Ingo; Schmid, Jürgen (2005): Concepts for small scale CHP units to be
integrated into buildings or industry and medium scale CHP units with district heating.
Appendix A: Historic Policy Making
69
Appendix A: Historic Policy Making
District Heating Policy making
Past
In order to get a better understating around how the Danish CHPDH has gained such importance.
It is essential to perceive how the legislating framework of the Danish heating plan started. And
to do so a brief historical explanations about the policy, current and past legislations, and energy
plans is described.
Nevertheless the substantial Danish CHPDH share did not happen overnight, but was rather
influenced by the economic situation in Denmark. It started back in the 70’s after the oil crises
where dwellings were relied heavily on individual oil heating, 90% of the of the country’s energy
supply was imported, before that Denmark had no sector specified for energy regulation (DEA
2012, 2010; Euroheat and Power 2011) Denmark then decided to funnel its focus on domestic fuel
supply and increase energy efficiency. Kicking off with the Electricity Supply Act of 1976 which
stated that all new electricity production must be CHP based, since then about 60% of the Danish
power plants have switched to CHP.
An energy tax was released in 1977 to support the investments in energy conservation, expansion
of DH networks and economic feasibility of natural gas. These energy taxations were substantially
increased in 1986 due to the pluming of oil prices, the aim behind this further increase of taxation
was to maintain the energy prices at a high level to ensure a stable support towards reduction in
energy demand and further expansion of the DH network.
The heat supply act of 1979 was responsible to regulate the heating sector, developing heat
network areas, and call for municipalities to carry analysis about their space heating need and
resources available locally –supply and demand-. Also regional analysis where certain heating
potential and further expansion of the heating grid as well as future heat demand was the
municipality’s responsibility (DEA 2012; Chittum, Østergaard 2014) This heat plan gave local
agencies the authority either to approve or reject changes concerning the DH network, along with
the Heat supply act it pointed out the importance of local authorities when it comes to taking
decisions towards the energy infrastructure, and which resources should be prioritized, and
promote CHP whenever possible. The non-profit principle came along the heat supply act, its
purpose was to put the management of the DH network into the municipality’s control, which also
turned out to be a feasible solution to overcome the monopoly that would have been associated
with the network (Euroheat and Power 2011).
Around 1990 the national government developed an energy plan explicitly pointing out that any
energy plan project should include a full socio-economic accounting of costs and benefits. Through
the years of 1990 and 2000 further adjustments were made to these plans which allowed
municipalities to determine who should be connected to the heat network and how should the
Danish DH infrastructure develop, Therefore one could say that the Heat Supply Act was directed
towards the local authorities and the municipalities (Euroheat and Power 2011, 2011).
This political framework formed the bases of which the current decision making ideology in
municipalities is that only projects that show promising results in terms of socio-economics are to
Appendix A: Historic Policy Making
70
be considered and that the full societal costs of energy are calculated, just like individual
businesses would run a cost benefit analysis on a project which evaluates whether or not the
company separately will benefit from it or not, nonetheless, DH companies and municipalities
must seek projects that has a high social-economic and cost-benefit.
Current
Around 2000 these ongoing plans were not required anymore, today municipalities and DH
companies develop their own plans and are entitled to manage the local heat strategies, they also
have authority to oblige heat suppliers to use certain fuel, technologies or undertake certain
projects. The heat supply act is however still in force today with its primary objectives being to
maximize CHP usage, support CHPDH plans that benefit the socio-economic and environment
while reducing fossil fuel usage (Consolidated Act No. 1184 of 14 December 2011) Today Denmark
has an official goal which was set in 2012 of being 100% self-sufficient through renewable energy
resources throughout all sectors by 2050, and increasing the renewable energy share within the
CHPDH sector (Energy Strategy 2050 2011; DEA 2012). While the future role of DH in the Danish
energy system seems to be uncertain, a number of studies have shown that DH plays a significant
and comprehensive role. A separate study made on the DH’s effect on the 20-20-20 targets
mentioned earlier, this study showed that DH is an essential element for the EU to cost-effectively
reach their carbon reduction targets.(Chittum, Østergaard 2014)
While these policies were relatively important to form a general framework for individuals and
organizations, it is rather more important to realize the political consensus of the Danish tradition
that the majority of the political parties agree on the three most important factors affecting the
country’s reduction of CO2, being; steady energy policy since 1976, municipal planning, and the
co-operation of people with the governments. Additionally, about 10% of the voting population
think that the most important concern facing Danish politicians are the environmental issues, this
traditional political consensus also produced the goals of being 100% reliant on renewable energy
by 2050 where more than 95% of the parliament members joined the agreement, this habit
supports the public and private sectors and gives them the confidence to invest into more efficient
and cleaner energy systems.(Chittum, Østergaard 2014)
Denmark is currently on the right track, renewables cover more than 40% of the demand, 30% of
which is from wind, and it is expected that renewables will reach 70% in 2020 with wind covering
50% of this proportion (DEA 2012). It is also estimated by the DEA and CEESA plans that the
electricity generated from wind energy would range between 50% and 200% from the forecasted
demand, the DEA has predicted in one of its scenarios an increase in wind power in 2050 up to
14,000 MW that is an increase of 290% from the 2013 capacity of 4,810 MW
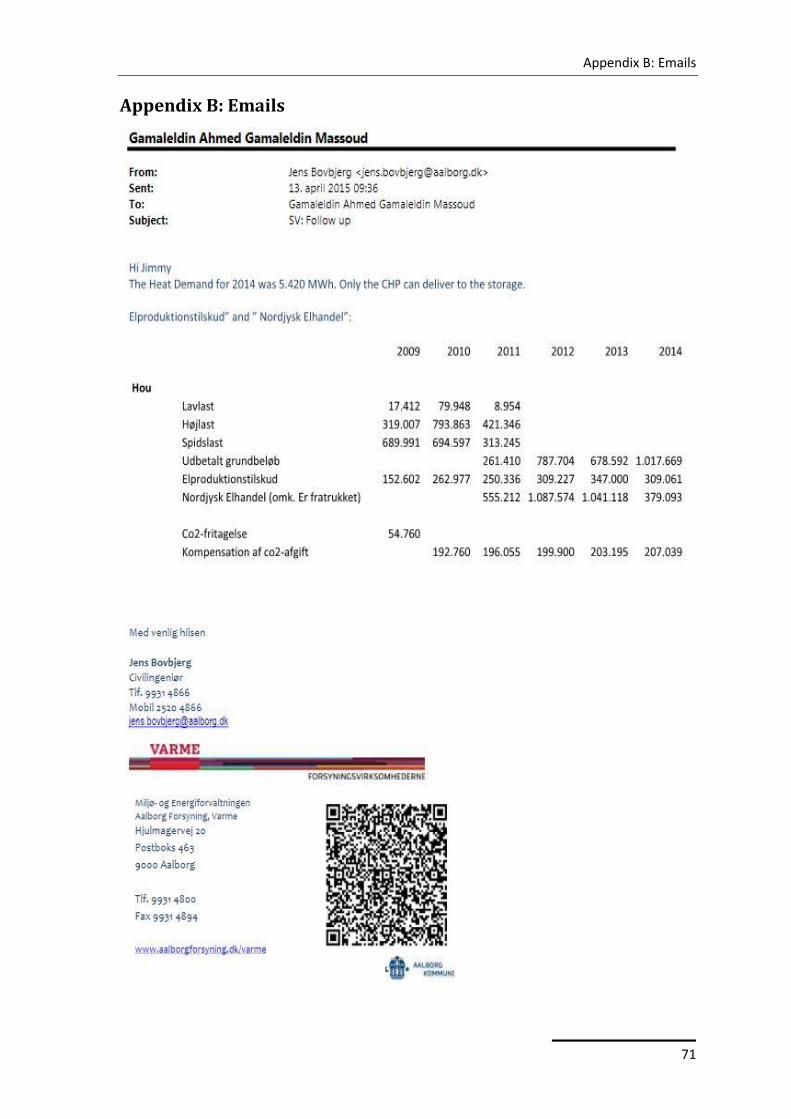
Appendix B: Emails
71
Appendix B: Emails

Appendix B: Emails
72
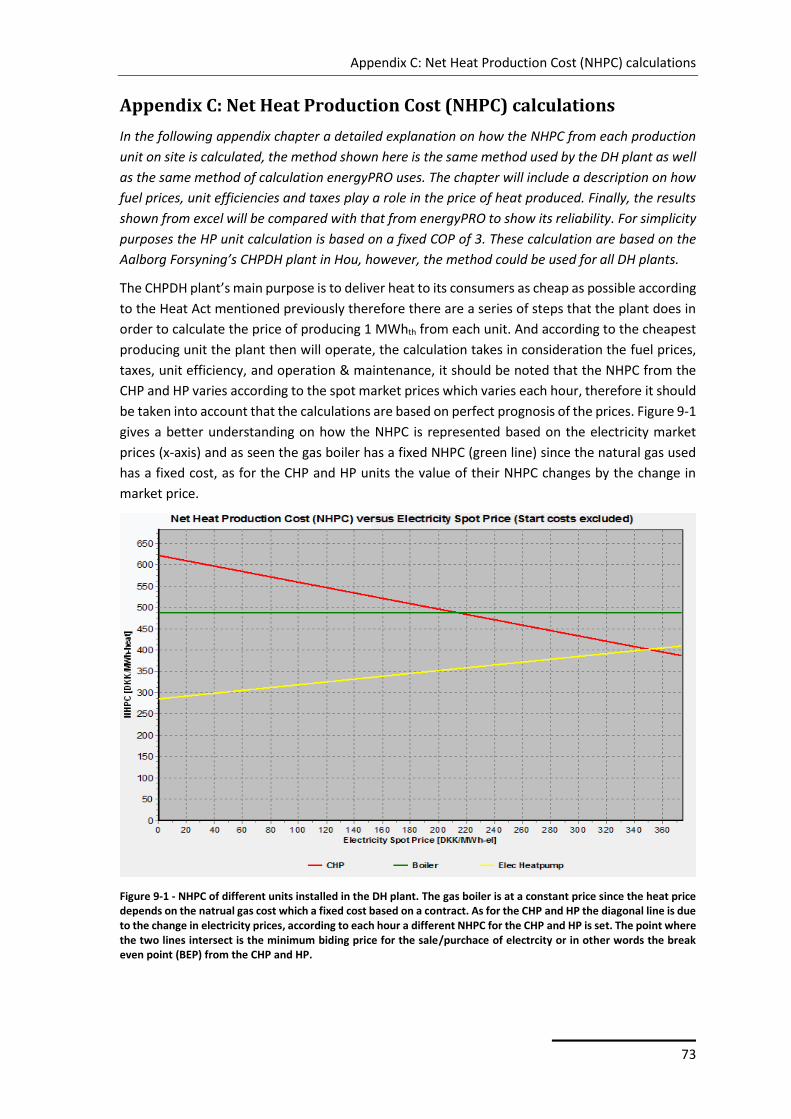
Appendix C: Net Heat Production Cost (NHPC) calculations
73
Appendix C: Net Heat Production Cost (NHPC) calculations
In the following appendix chapter a detailed explanation on how the NHPC from each production
unit on site is calculated, the method shown here is the same method used by the DH plant as well
as the same method of calculation energyPRO uses. The chapter will include a description on how
fuel prices, unit efficiencies and taxes play a role in the price of heat produced. Finally, the results
shown from excel will be compared with that from energyPRO to show its reliability. For simplicity
purposes the HP unit calculation is based on a fixed COP of 3. These calculation are based on the
Aalborg Forsyning’s CHPDH plant in Hou, however, the method could be used for all DH plants.
The CHPDH plant’s main purpose is to deliver heat to its consumers as cheap as possible according
to the Heat Act mentioned previously therefore there are a series of steps that the plant does in
order to calculate the price of producing 1 MWhth from each unit. And according to the cheapest
producing unit the plant then will operate, the calculation takes in consideration the fuel prices,
taxes, unit efficiency, and operation & maintenance, it should be noted that the NHPC from the
CHP and HP varies according to the spot market prices which varies each hour, therefore it should
be taken into account that the calculations are based on perfect prognosis of the prices. Figure 9-1
gives a better understanding on how the NHPC is represented based on the electricity market
prices (x-axis) and as seen the gas boiler has a fixed NHPC (green line) since the natural gas used
has a fixed cost, as for the CHP and HP units the value of their NHPC changes by the change in
market price.
Figure 9-1 - NHPC of different units installed in the DH plant. The gas boiler is at a constant price since the heat price depends on the natrual gas cost which a fixed cost based on a contract. As for the CHP and HP the diagonal line is due to the change in electricity prices, according to each hour a different NHPC for the CHP and HP is set. The point where the two lines intersect is the minimum biding price for the sale/purchace of electrcity or in other words the break even point (BEP) from the CHP and HP.
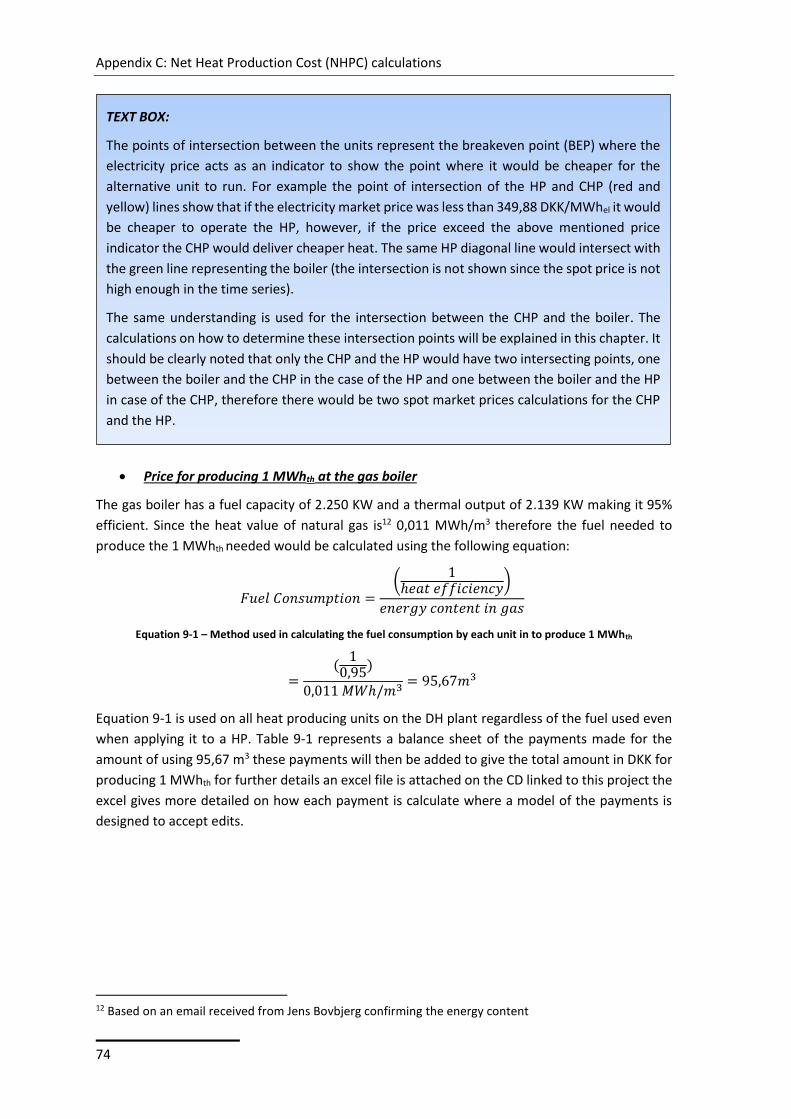
Appendix C: Net Heat Production Cost (NHPC) calculations
74
Price for producing 1 MWhth at the gas boiler
The gas boiler has a fuel capacity of 2.250 KW and a thermal output of 2.139 KW making it 95%
efficient. Since the heat value of natural gas is12 0,011 MWh/m3 therefore the fuel needed to
produce the 1 MWhth needed would be calculated using the following equation:
𝐹𝑢𝑒𝑙 𝐶𝑜𝑛𝑠𝑢𝑚𝑝𝑡𝑖𝑜𝑛 =(
1ℎ𝑒𝑎𝑡 𝑒𝑓𝑓𝑖𝑐𝑖𝑒𝑛𝑐𝑦
)
𝑒𝑛𝑒𝑟𝑔𝑦 𝑐𝑜𝑛𝑡𝑒𝑛𝑡 𝑖𝑛 𝑔𝑎𝑠
Equation 9-1 – Method used in calculating the fuel consumption by each unit in to produce 1 MWhth
=(
10,95
)
0,011 𝑀𝑊ℎ/𝑚3= 95,67𝑚3
Equation 9-1 is used on all heat producing units on the DH plant regardless of the fuel used even
when applying it to a HP. Table 9-1 represents a balance sheet of the payments made for the
amount of using 95,67 m3 these payments will then be added to give the total amount in DKK for
producing 1 MWhth for further details an excel file is attached on the CD linked to this project the
excel gives more detailed on how each payment is calculate where a model of the payments is
designed to accept edits.
12 Based on an email received from Jens Bovbjerg confirming the energy content
TEXT BOX:
The points of intersection between the units represent the breakeven point (BEP) where the
electricity price acts as an indicator to show the point where it would be cheaper for the
alternative unit to run. For example the point of intersection of the HP and CHP (red and
yellow) lines show that if the electricity market price was less than 349,88 DKK/MWhel it would
be cheaper to operate the HP, however, if the price exceed the above mentioned price
indicator the CHP would deliver cheaper heat. The same HP diagonal line would intersect with
the green line representing the boiler (the intersection is not shown since the spot price is not
high enough in the time series).
The same understanding is used for the intersection between the CHP and the boiler. The
calculations on how to determine these intersection points will be explained in this chapter. It
should be clearly noted that only the CHP and the HP would have two intersecting points, one
between the boiler and the CHP in the case of the HP and one between the boiler and the HP
in case of the CHP, therefore there would be two spot market prices calculations for the CHP
and the HP.
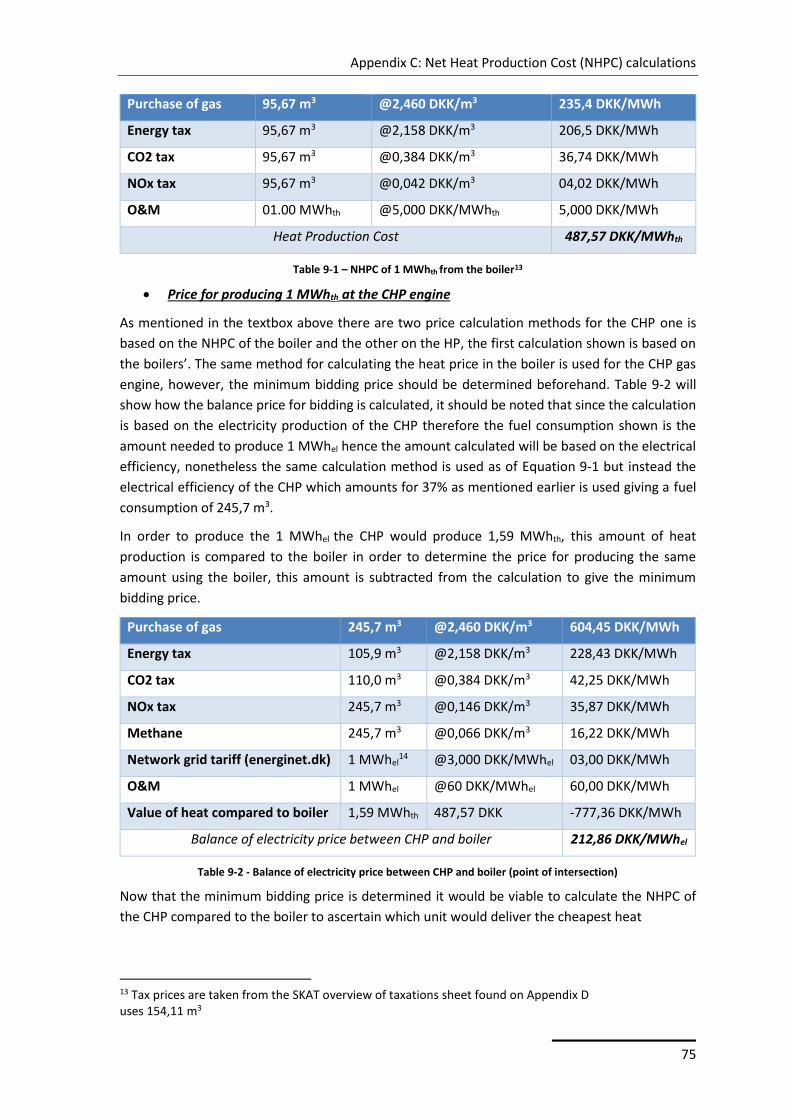
Appendix C: Net Heat Production Cost (NHPC) calculations
75
Purchase of gas 95,67 m3 @2,460 DKK/m3 235,4 DKK/MWh
Energy tax 95,67 m3 @2,158 DKK/m3 206,5 DKK/MWh
CO2 tax 95,67 m3 @0,384 DKK/m3 36,74 DKK/MWh
NOx tax 95,67 m3 @0,042 DKK/m3 04,02 DKK/MWh
O&M 01.00 MWhth @5,000 DKK/MWhth 5,000 DKK/MWh
Heat Production Cost 487,57 DKK/MWhth
Table 9-1 – NHPC of 1 MWhth from the boiler13
Price for producing 1 MWhth at the CHP engine
As mentioned in the textbox above there are two price calculation methods for the CHP one is
based on the NHPC of the boiler and the other on the HP, the first calculation shown is based on
the boilers’. The same method for calculating the heat price in the boiler is used for the CHP gas
engine, however, the minimum bidding price should be determined beforehand. Table 9-2 will
show how the balance price for bidding is calculated, it should be noted that since the calculation
is based on the electricity production of the CHP therefore the fuel consumption shown is the
amount needed to produce 1 MWhel hence the amount calculated will be based on the electrical
efficiency, nonetheless the same calculation method is used as of Equation 9-1 but instead the
electrical efficiency of the CHP which amounts for 37% as mentioned earlier is used giving a fuel
consumption of 245,7 m3.
In order to produce the 1 MWhel the CHP would produce 1,59 MWhth, this amount of heat
production is compared to the boiler in order to determine the price for producing the same
amount using the boiler, this amount is subtracted from the calculation to give the minimum
bidding price.
Purchase of gas 245,7 m3 @2,460 DKK/m3 604,45 DKK/MWh
Energy tax 105,9 m3 @2,158 DKK/m3 228,43 DKK/MWh
CO2 tax 110,0 m3 @0,384 DKK/m3 42,25 DKK/MWh
NOx tax 245,7 m3 @0,146 DKK/m3 35,87 DKK/MWh
Methane 245,7 m3 @0,066 DKK/m3 16,22 DKK/MWh
Network grid tariff (energinet.dk) 1 MWhel14 @3,000 DKK/MWhel 03,00 DKK/MWh
O&M 1 MWhel @60 DKK/MWhel 60,00 DKK/MWh
Value of heat compared to boiler 1,59 MWhth 487,57 DKK -777,36 DKK/MWh
Balance of electricity price between CHP and boiler 212,86 DKK/MWhel
Table 9-2 - Balance of electricity price between CHP and boiler (point of intersection)
Now that the minimum bidding price is determined it would be viable to calculate the NHPC of
the CHP compared to the boiler to ascertain which unit would deliver the cheapest heat
13 Tax prices are taken from the SKAT overview of taxations sheet found on Appendix D uses 154,11 m3
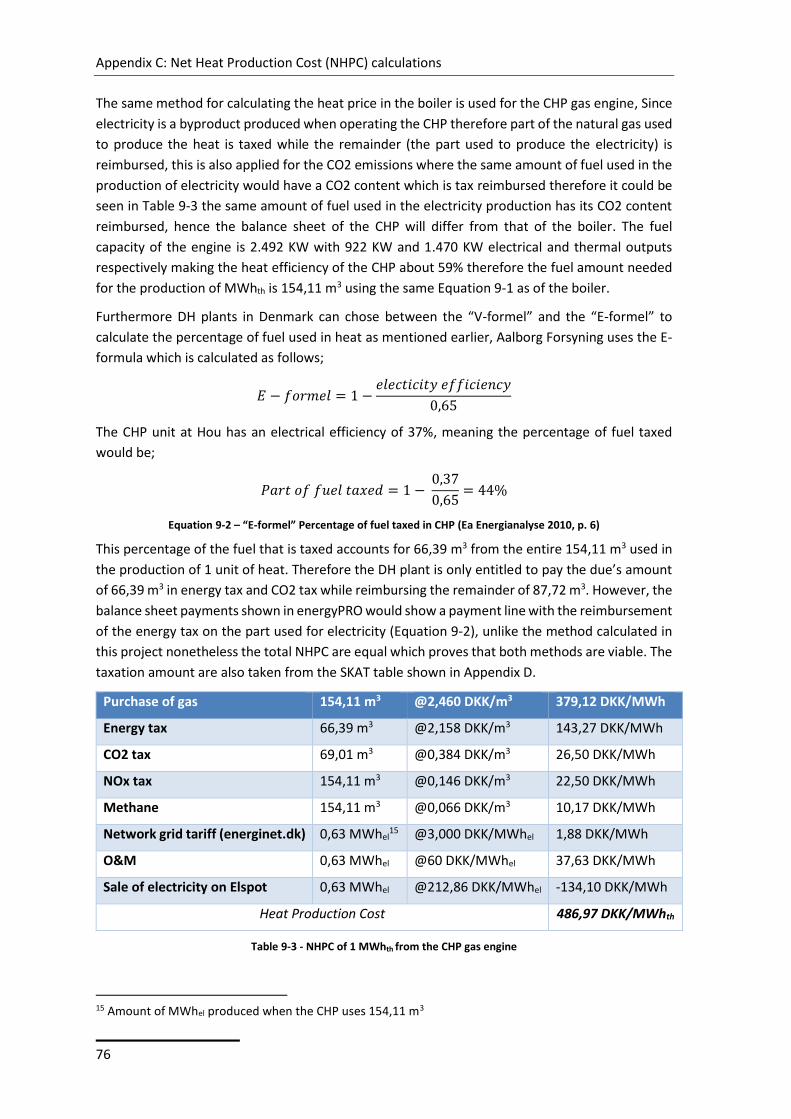
Appendix C: Net Heat Production Cost (NHPC) calculations
76
The same method for calculating the heat price in the boiler is used for the CHP gas engine, Since
electricity is a byproduct produced when operating the CHP therefore part of the natural gas used
to produce the heat is taxed while the remainder (the part used to produce the electricity) is
reimbursed, this is also applied for the CO2 emissions where the same amount of fuel used in the
production of electricity would have a CO2 content which is tax reimbursed therefore it could be
seen in Table 9-3 the same amount of fuel used in the electricity production has its CO2 content
reimbursed, hence the balance sheet of the CHP will differ from that of the boiler. The fuel
capacity of the engine is 2.492 KW with 922 KW and 1.470 KW electrical and thermal outputs
respectively making the heat efficiency of the CHP about 59% therefore the fuel amount needed
for the production of MWhth is 154,11 m3 using the same Equation 9-1 as of the boiler.
Furthermore DH plants in Denmark can chose between the “V-formel” and the “E-formel” to
calculate the percentage of fuel used in heat as mentioned earlier, Aalborg Forsyning uses the E-
formula which is calculated as follows;
𝐸 − 𝑓𝑜𝑟𝑚𝑒𝑙 = 1 −𝑒𝑙𝑒𝑐𝑡𝑖𝑐𝑖𝑡𝑦 𝑒𝑓𝑓𝑖𝑐𝑖𝑒𝑛𝑐𝑦
0,65
The CHP unit at Hou has an electrical efficiency of 37%, meaning the percentage of fuel taxed
would be;
𝑃𝑎𝑟𝑡 𝑜𝑓 𝑓𝑢𝑒𝑙 𝑡𝑎𝑥𝑒𝑑 = 1 − 0,37
0,65= 44%
Equation 9-2 – “E-formel” Percentage of fuel taxed in CHP (Ea Energianalyse 2010, p. 6)
This percentage of the fuel that is taxed accounts for 66,39 m3 from the entire 154,11 m3 used in
the production of 1 unit of heat. Therefore the DH plant is only entitled to pay the due’s amount
of 66,39 m3 in energy tax and CO2 tax while reimbursing the remainder of 87,72 m3. However, the
balance sheet payments shown in energyPRO would show a payment line with the reimbursement
of the energy tax on the part used for electricity (Equation 9-2), unlike the method calculated in
this project nonetheless the total NHPC are equal which proves that both methods are viable. The
taxation amount are also taken from the SKAT table shown in Appendix D.
Purchase of gas 154,11 m3 @2,460 DKK/m3 379,12 DKK/MWh
Energy tax 66,39 m3 @2,158 DKK/m3 143,27 DKK/MWh
CO2 tax 69,01 m3 @0,384 DKK/m3 26,50 DKK/MWh
NOx tax 154,11 m3 @0,146 DKK/m3 22,50 DKK/MWh
Methane 154,11 m3 @0,066 DKK/m3 10,17 DKK/MWh
Network grid tariff (energinet.dk) 0,63 MWhel15 @3,000 DKK/MWhel 1,88 DKK/MWh
O&M 0,63 MWhel @60 DKK/MWhel 37,63 DKK/MWh
Sale of electricity on Elspot 0,63 MWhel @212,86 DKK/MWhel -134,10 DKK/MWh
Heat Production Cost 486,97 DKK/MWhth
Table 9-3 - NHPC of 1 MWhth from the CHP gas engine
15 Amount of MWhel produced when the CHP uses 154,11 m3
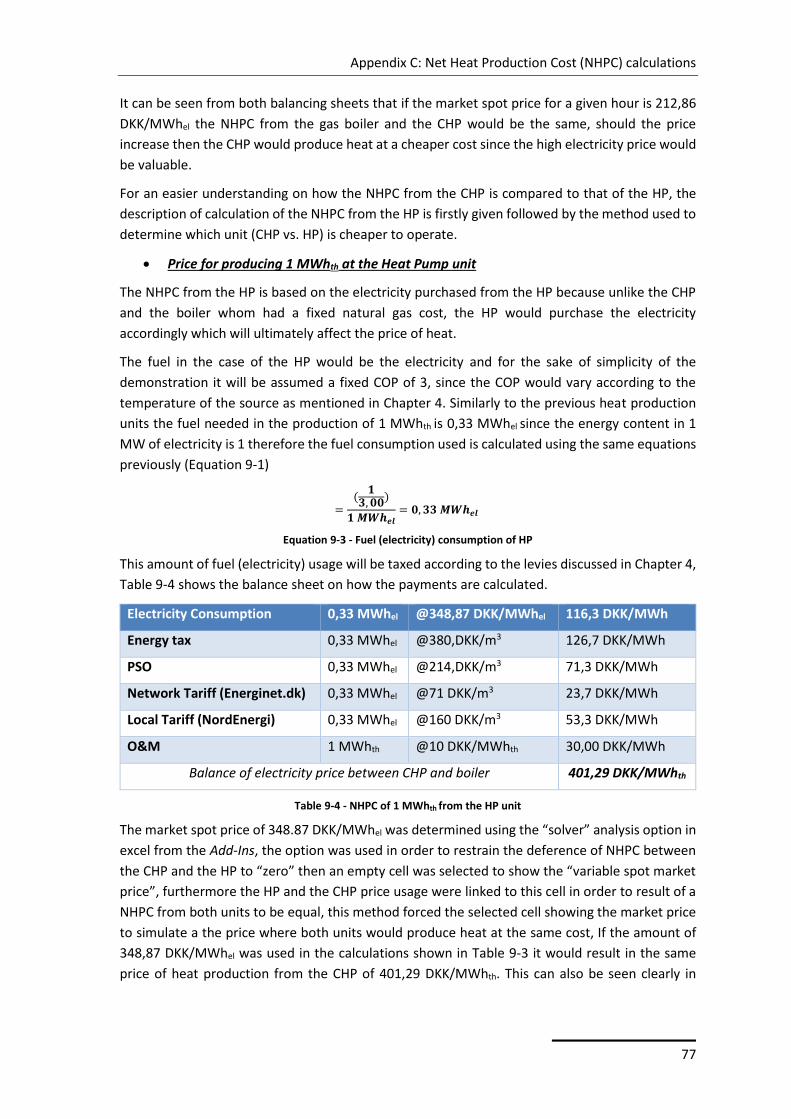
Appendix C: Net Heat Production Cost (NHPC) calculations
77
It can be seen from both balancing sheets that if the market spot price for a given hour is 212,86
DKK/MWhel the NHPC from the gas boiler and the CHP would be the same, should the price
increase then the CHP would produce heat at a cheaper cost since the high electricity price would
be valuable.
For an easier understanding on how the NHPC from the CHP is compared to that of the HP, the
description of calculation of the NHPC from the HP is firstly given followed by the method used to
determine which unit (CHP vs. HP) is cheaper to operate.
Price for producing 1 MWhth at the Heat Pump unit
The NHPC from the HP is based on the electricity purchased from the HP because unlike the CHP
and the boiler whom had a fixed natural gas cost, the HP would purchase the electricity
accordingly which will ultimately affect the price of heat.
The fuel in the case of the HP would be the electricity and for the sake of simplicity of the
demonstration it will be assumed a fixed COP of 3, since the COP would vary according to the
temperature of the source as mentioned in Chapter 4. Similarly to the previous heat production
units the fuel needed in the production of 1 MWhth is 0,33 MWhel since the energy content in 1
MW of electricity is 1 therefore the fuel consumption used is calculated using the same equations
previously (Equation 9-1)
=(
𝟏𝟑, 𝟎𝟎
)
𝟏 𝑴𝑾𝒉𝒆𝒍= 𝟎, 𝟑𝟑 𝑴𝑾𝒉𝒆𝒍
Equation 9-3 - Fuel (electricity) consumption of HP
This amount of fuel (electricity) usage will be taxed according to the levies discussed in Chapter 4,
Table 9-4 shows the balance sheet on how the payments are calculated.
Electricity Consumption 0,33 MWhel @348,87 DKK/MWhel 116,3 DKK/MWh
Energy tax 0,33 MWhel @380,DKK/m3 126,7 DKK/MWh
PSO 0,33 MWhel @214,DKK/m3 71,3 DKK/MWh
Network Tariff (Energinet.dk) 0,33 MWhel @71 DKK/m3 23,7 DKK/MWh
Local Tariff (NordEnergi) 0,33 MWhel @160 DKK/m3 53,3 DKK/MWh
O&M 1 MWhth @10 DKK/MWhth 30,00 DKK/MWh
Balance of electricity price between CHP and boiler 401,29 DKK/MWhth
Table 9-4 - NHPC of 1 MWhth from the HP unit
The market spot price of 348.87 DKK/MWhel was determined using the “solver” analysis option in
excel from the Add-Ins, the option was used in order to restrain the deference of NHPC between
the CHP and the HP to “zero” then an empty cell was selected to show the “variable spot market
price”, furthermore the HP and the CHP price usage were linked to this cell in order to result of a
NHPC from both units to be equal, this method forced the selected cell showing the market price
to simulate a the price where both units would produce heat at the same cost, If the amount of
348,87 DKK/MWhel was used in the calculations shown in Table 9-3 it would result in the same
price of heat production from the CHP of 401,29 DKK/MWhth. This can also be seen clearly in
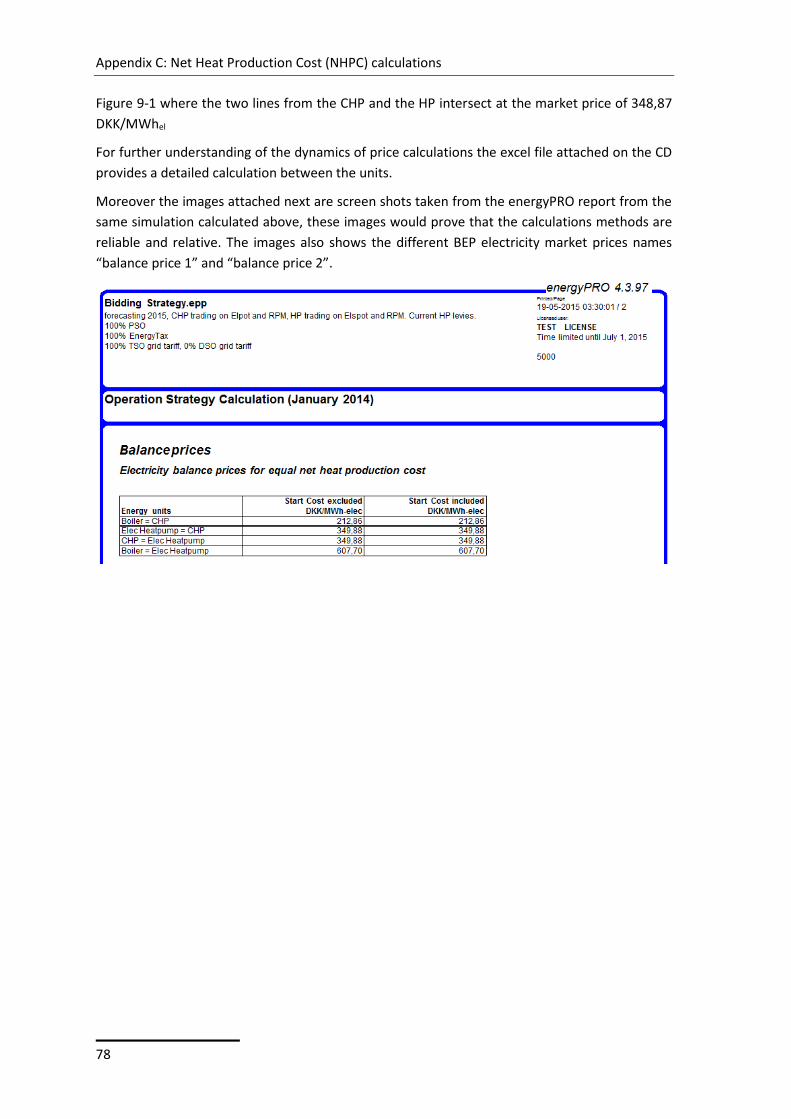
Appendix C: Net Heat Production Cost (NHPC) calculations
78
Figure 9-1 where the two lines from the CHP and the HP intersect at the market price of 348,87
DKK/MWhel
For further understanding of the dynamics of price calculations the excel file attached on the CD
provides a detailed calculation between the units.
Moreover the images attached next are screen shots taken from the energyPRO report from the
same simulation calculated above, these images would prove that the calculations methods are
reliable and relative. The images also shows the different BEP electricity market prices names
“balance price 1” and “balance price 2”.
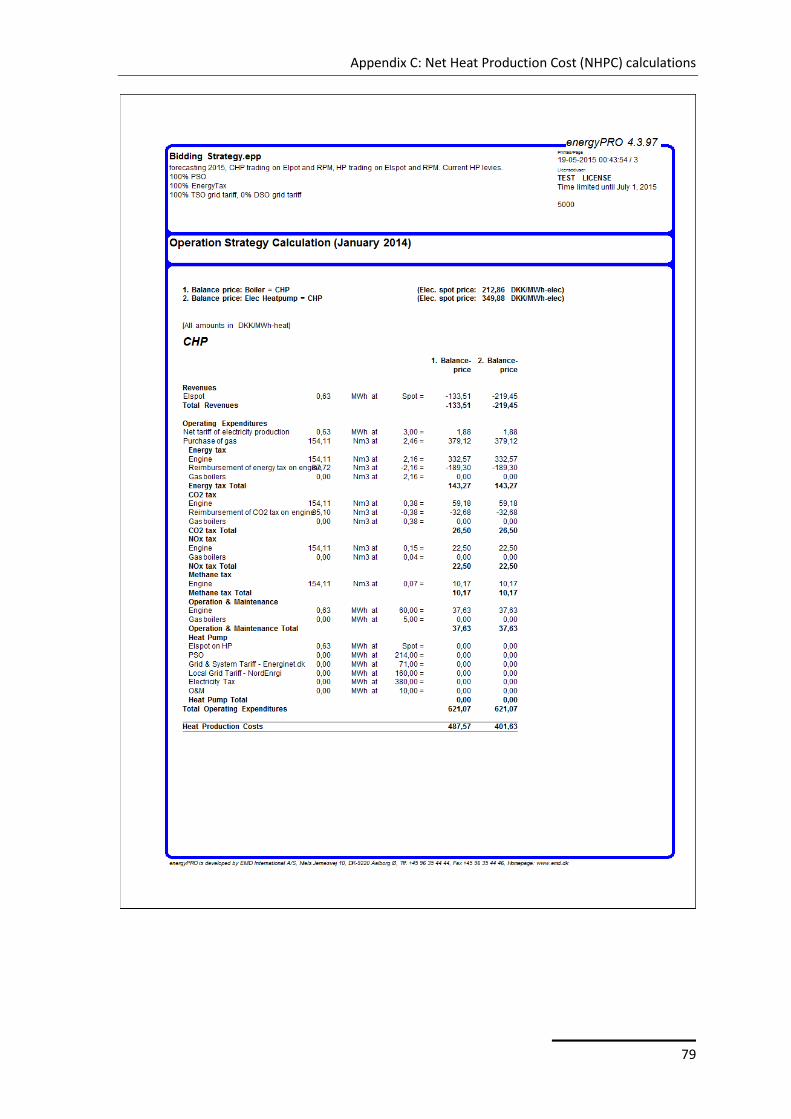
Appendix C: Net Heat Production Cost (NHPC) calculations
79
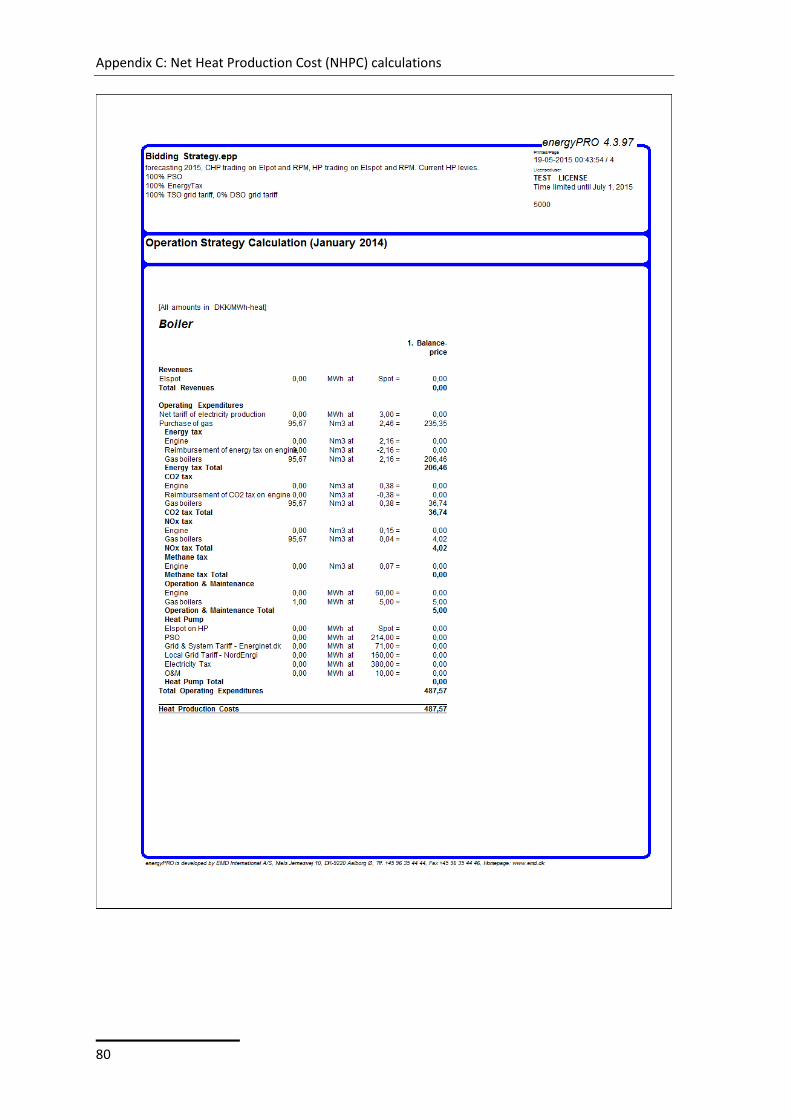
Appendix C: Net Heat Production Cost (NHPC) calculations
80
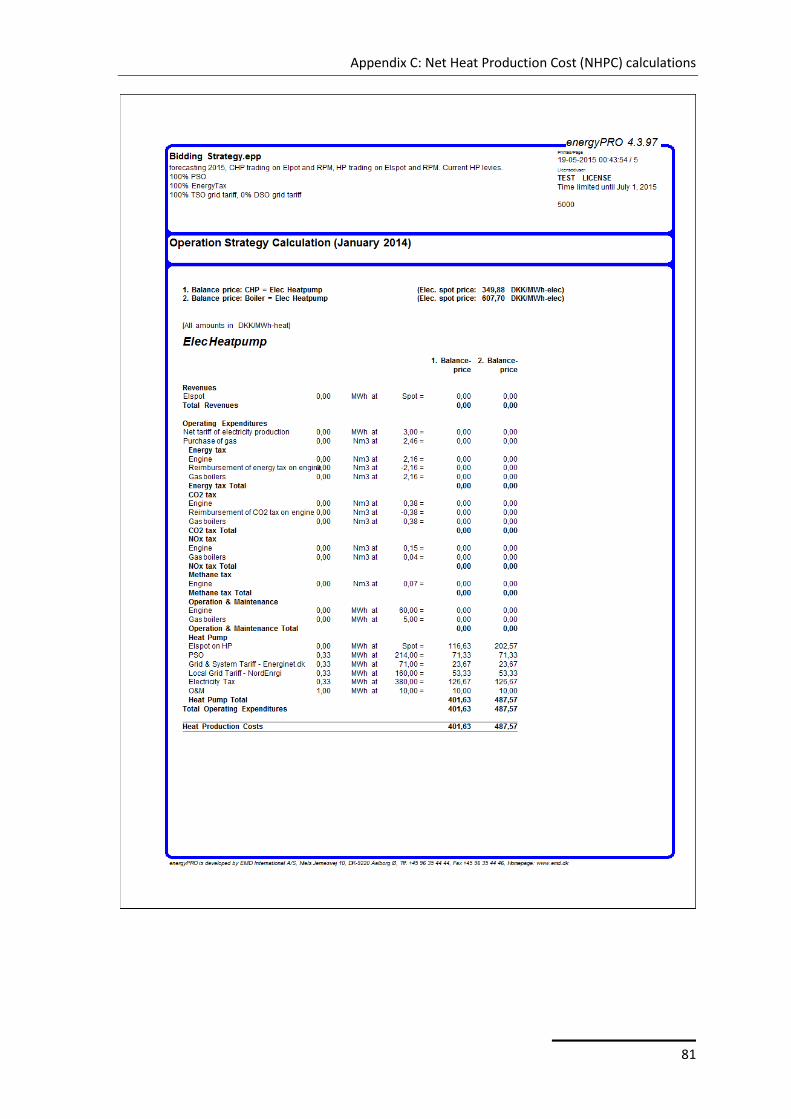
Appendix C: Net Heat Production Cost (NHPC) calculations
81

Appendix C: Net Heat Production Cost (NHPC) calculations
82
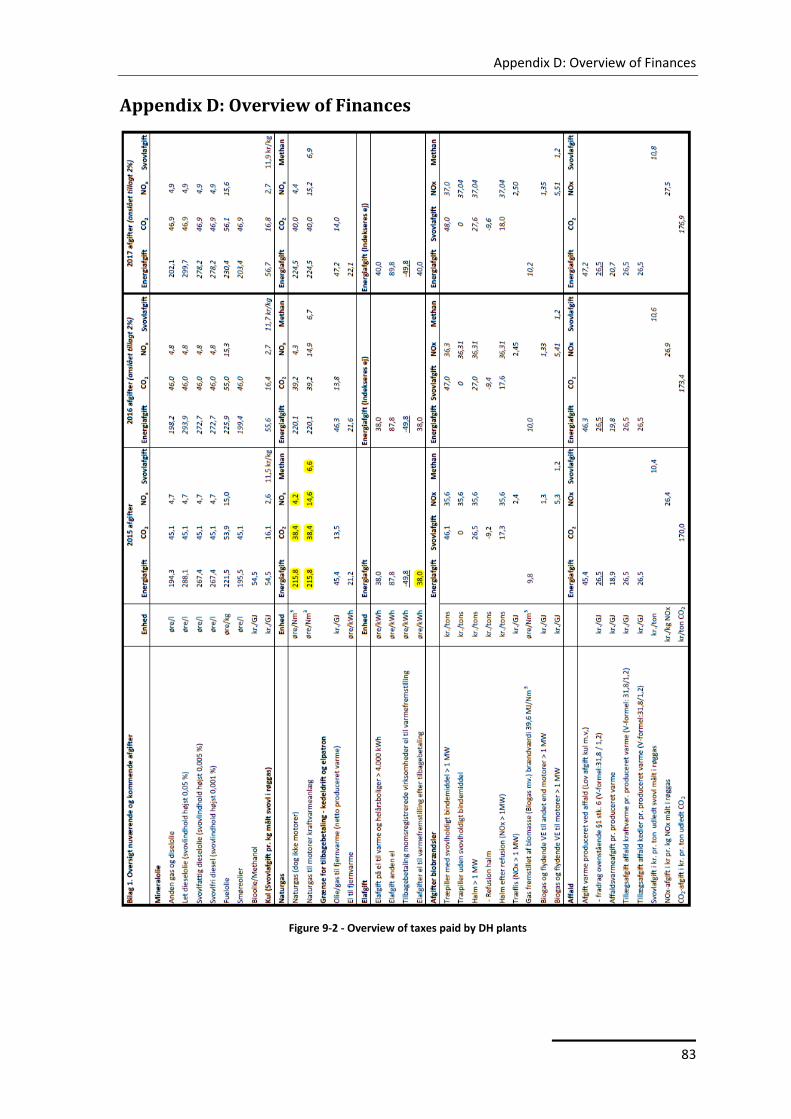
Appendix D: Overview of Finances
83
Appendix D: Overview of Finances
Figure 9-2 - Overview of taxes paid by DH plants
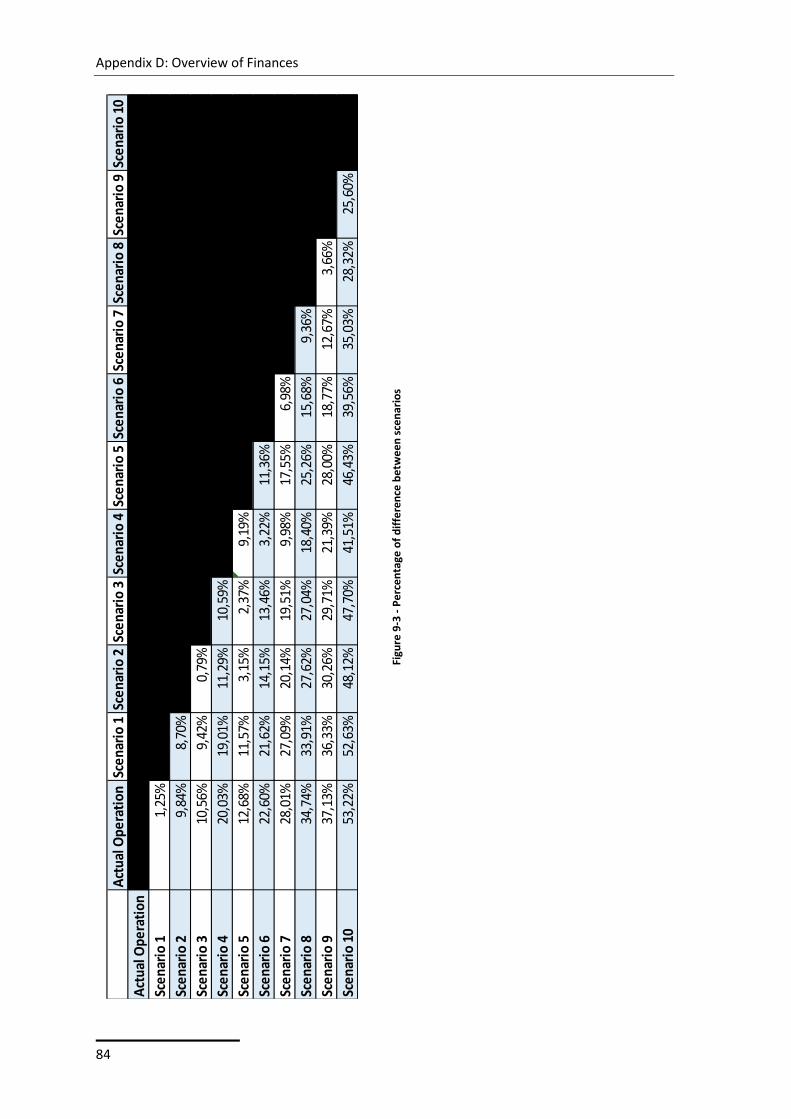
Appendix D: Overview of Finances
84
Act
ual O
pera
tion
Scen
ario
1Sc
enar
io 2
Scen
ario
3Sc
enar
io 4
Scen
ario
5Sc
enar
io 6
Scen
ario
7Sc
enar
io 8
Scen
ario
9Sc
enar
io 1
0
Act
ual O
pera
tion
0,00
%-1
,27%
-10,
92%
-11,
81%
-25,
04%
-14,
52%
-29,
20%
-38,
90%
-53,
24%
-59,
06%
-113
,78%
Scen
ario
11,
25%
0,00
%-9
,53%
-10,
40%
-23,
47%
-13,
08%
-27,
58%
-37,
16%
-51,
31%
-57,
06%
-111
,10%
Scen
ario
29,
84%
8,70
%0,
00%
-0,8
0%-1
2,73
%-3
,25%
-16,
48%
-25,
23%
-38,
15%
-43,
40%
-92,
74%
Scen
ario
310
,56%
9,42
%0,
79%
0,00
%-1
1,84
%-2
,43%
-15,
56%
-24,
23%
-37,
06%
-42,
26%
-91,
21%
Scen
ario
420
,03%
19,0
1%11
,29%
10,5
9%0,
00%
8,41
%-3
,33%
-11,
08%
-22,
55%
-27,
20%
-70,
97%
Scen
ario
512
,68%
11,5
7%3,
15%
2,37
%9,
19%
0,00
%-1
2,82
%-2
1,29
%-3
3,80
%-3
8,89
%-8
6,67
%
Scen
ario
622
,60%
21,6
2%14
,15%
13,4
6%3,
22%
11,3
6%0,
00%
-7,5
1%-1
8,60
%-2
3,11
%-6
5,46
%
Scen
ario
728
,01%
27,0
9%20
,14%
19,5
1%9,
98%
17,5
5%6,
98%
0,00
%-1
0,32
%-1
4,51
%-5
3,91
%
Scen
ario
834
,74%
33,9
1%27
,62%
27,0
4%18
,40%
25,2
6%15
,68%
9,36
%0,
00%
-3,8
0%-3
9,51
%
Scen
ario
937
,13%
36,3
3%30
,26%
29,7
1%21
,39%
28,0
0%18
,77%
12,6
7%3,
66%
0,00
%-3
4,41
%
Scen
ario
10
53,2
2%52
,63%
48,1
2%47
,70%
41,5
1%46
,43%
39,5
6%35
,03%
28,3
2%25
,60%
0,00
%
Figu
re 9
-3 -
Pe
rce
nta
ge o
f d
iffe
ren
ce b
etw
ee
n s
cen
ario
s
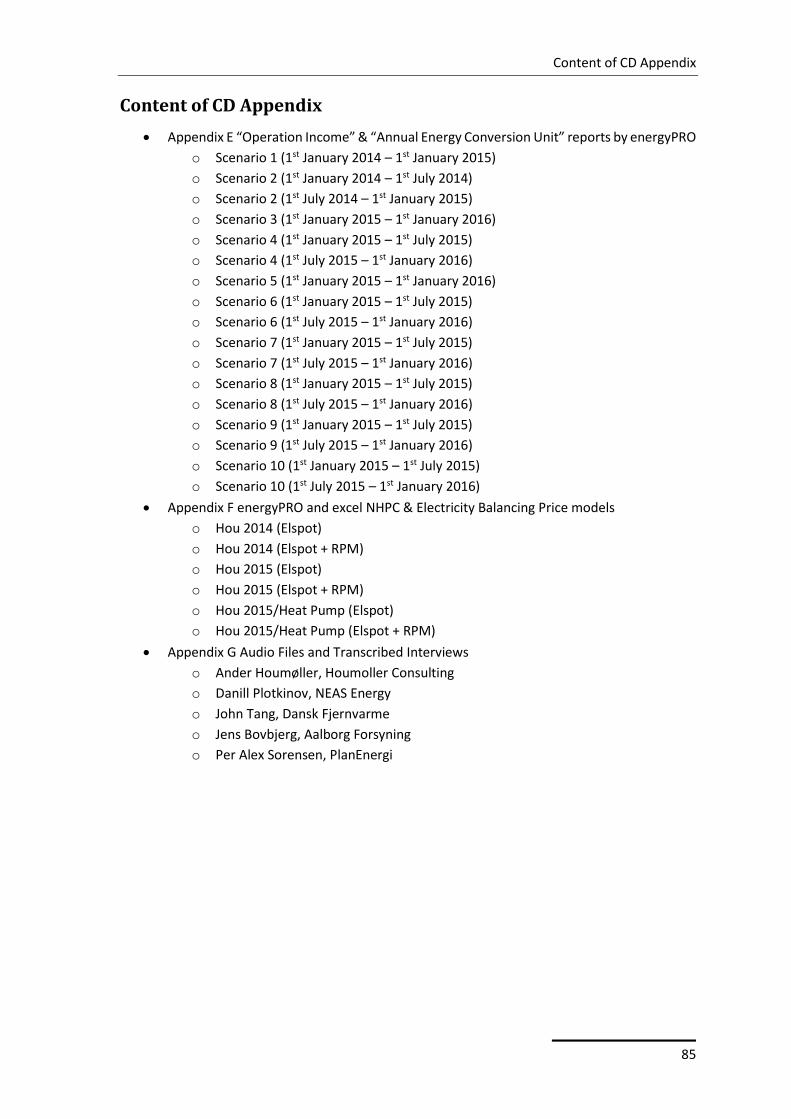
Content of CD Appendix
85
Content of CD Appendix
Appendix E “Operation Income” & “Annual Energy Conversion Unit” reports by energyPRO
o Scenario 1 (1st January 2014 – 1st January 2015)
o Scenario 2 (1st January 2014 – 1st July 2014)
o Scenario 2 (1st July 2014 – 1st January 2015)
o Scenario 3 (1st January 2015 – 1st January 2016)
o Scenario 4 (1st January 2015 – 1st July 2015)
o Scenario 4 (1st July 2015 – 1st January 2016)
o Scenario 5 (1st January 2015 – 1st January 2016)
o Scenario 6 (1st January 2015 – 1st July 2015)
o Scenario 6 (1st July 2015 – 1st January 2016)
o Scenario 7 (1st January 2015 – 1st July 2015)
o Scenario 7 (1st July 2015 – 1st January 2016)
o Scenario 8 (1st January 2015 – 1st July 2015)
o Scenario 8 (1st July 2015 – 1st January 2016)
o Scenario 9 (1st January 2015 – 1st July 2015)
o Scenario 9 (1st July 2015 – 1st January 2016)
o Scenario 10 (1st January 2015 – 1st July 2015)
o Scenario 10 (1st July 2015 – 1st January 2016)
Appendix F energyPRO and excel NHPC & Electricity Balancing Price models
o Hou 2014 (Elspot)
o Hou 2014 (Elspot + RPM)
o Hou 2015 (Elspot)
o Hou 2015 (Elspot + RPM)
o Hou 2015/Heat Pump (Elspot)
o Hou 2015/Heat Pump (Elspot + RPM)
Appendix G Audio Files and Transcribed Interviews
o Ander Houmøller, Houmoller Consulting
o Danill Plotkinov, NEAS Energy
o John Tang, Dansk Fjernvarme
o Jens Bovbjerg, Aalborg Forsyning
o Per Alex Sorensen, PlanEnergi