Embed Size (px)
Citation preview
Techno-economic analysis of waste heat recovery by inverted Brayton cycle applied to an LNG-fuelled transport truck
Kirill Abrosimov1*, Federica Sciacchitano2, Gianluca Pasini2, Andrea Baccioli2, Aldo Bischi1 and Marco Antonelli2 1Skolkovo Institute of Science and Technology, Moscow, Russian Federation 2Department of Energy, Systems, Territory and Constructions Engineering (DESTeC), University of Pisa, Italy
Abstract. Aiming for the better environmental and economic performance of traditional engines, waste
heat recovery (WHR) technologies are actively studied to find their most beneficial applications. In this
work, the inverted Brayton cycle (IBC) is investigated as a potential WHR solution for liquefied natural gas
(LNG) fuelled transport truck. LNG being one of the less polluting fossil fuels is widely spreading nowadays
in different industries due to the rapid development of the LNG supply chain in the world. LNG-fuelled
cargo transportation follows this prevailing trend. Based on the overexpansion of flue gases to
subatmospheric pressure, inverted Brayton cycle, in turn, is considered a prospective technology of WHR
and techno-economic analysis of IBC in several configurations on-board of a heavy transport truck have
been assessed. IBC is integrated into the engine cooling system in the basic layout, and additionally, it
incorporates LNG regasification process in advanced configurations. Power balance based on Aspen Hysys
model enables to perform system optimisation and gives preliminary design parameters of the system
components. Cost function approach provides the basis for a preliminary economic assessment of the
layouts. Although the system shows fuel economy of maximum about 2.1 %, analysis revealed the necessity
to continue the search for better technical solutions in IBC-based systems to make them economically
attractive due to high cost of installed equipment.
1 Introduction
The transport sector is one of the central topics in
European debates for the reduction of greenhouse gases
and polluting emissions of NOx, CO, and soot. In
particular, heavy vehicles, including trucks, buses, and
coaches, are in charge for around 6% of the total carbon
dioxide (CO2) emissions and about 25% of the total CO2
emissions generated by road transport in the European
Union [1]. With the new regulation (EU) 2019/1242, the
target levels of CO2 performance of modern heavy
vehicles have been normalised by the values of vehicle
fleet average emissions monitored in the 2019-2020
period. In particular, a reduction is expected: by 15%
starting from 2025 and by 30% starting from the year
2030 referencing 2019-2020 level. As regards to
polluting emissions, Euro VI standards have been in
force since 2014. This regulatory framework relating to
the transport sector has increased the interest in
improving the energy efficiency of internal combustion
engines with a consequent reduction in fuel
consumption and the search for cleaner fuels with a
lower content of carbon, like liquefied natural gas
(LNG). LNG is made up of 90-99% of methane and the
remaining part consisting of other gases such as
propane, ethane, nitrogen, and carbon dioxide.
* Corresponding author: [email protected]
Liquefaction involves a reduction of the specific volume
of about 600 times, with advantages in terms of vehicle
range in comparison with other solutions such as
compressed natural gas (CNG). Among the advantages
over traditional diesel (EURO VI) LNG has lower CO2,
carbon monoxide, NOx and particulate matter emissions
[2].
In order to improve the energy efficiency of internal
combustion engines, systems for recovering residual
energy from the exhaust gases, which represents around
30% of the energy input to the engine, have been studied
with increasing interest. Among the various existing
systems such as turbo-compound systems (TS), Organic
Rankine Cycle (ORC) and Thermo-Electric Generator
(TEG), the inverted Brayton cycle (IBC) could represent
an interesting alternative (Bianchi & De Pascale, 2011
[3]). In comparison with other mechanical waste heat
recovery (WHR) systems like ORC, IBC contributes to
the simplicity and compactness of the components,
which are especially important where weight and
dimensions constitute a binding problem for the
installation of WHR systems. Comparison with non-
mechanical technologies like TEG shows better
economic performance of the studied approach.
In this discussion, the waste heat recovery system
based on the IBC applied to the exhaust gas of internal
© The Authors, published by EDP Sciences. This is an open access article distributed under the terms of the Creative Commons Attribution License 4.0
(http://creativecommons.org/licenses/by/4.0/).
E3S Web of Conferences 238, 10008 (2021) https://doi.org/10.1051/e3sconf/202123810008100RES 2020
combustion engine was analysed with the aim of
assessing the technical-economic feasibility for a real
case of an LNG-fuelled heavy transport vehicle.
2 Methodology
The model was built in commercial software Aspen
Hysys. Effect of the WHR system operation is evaluated
as the reduced fuel consumption of the main engine due
to additional power generated by IBC. On the other side,
the negative effect of the system associated with
additional mass on-board is evaluated with experimental
interpolations from literature. Available technical
reports ([4], [5], [6]) on the case-study truck gave the
basic fuel consumption and performance data in
different driving modes. Economic analysis is based on
the simple non-discounted cash flow approach with the
cost of the WHR system based on the cost-functions of
the main components. The following section gives
further details on this methodology.
2.1 Case study
As a case-study, the Iveco Stralis NP-400 has been
chosen as an example of a modern heavy transport truck
fuelled with LNG. Based on data from [4], Table 1
shows its main characteristics. In this work, LNG is
considered being pure methane for sake of simplicity
Table 1. Iveco Stralis NP-400 characteristics
General information
Vehicle type N3
LNG tank capacity 2x598 l
LNG storage pressure 8.2 bar
Tractor weight 7760 kg
Trailer weight 7400 kg
Max transportable weight 28840 kg
Engine characteristics
Model Cursor 9
Combustion type Stoichiometric
Displacement 8.71 l
Euro class Euro VI
Supercharging Present
According to FIGE ETC (Forschungsinstitut für
Geräusche und Erschütterungen European Transient
Cycle) [5], there are three main modes, or phases, of the
truck operation: Urban, Rural and Motorway. In the
techno-economic assessment of this paper, the WHR
system is conservatively assumed to operate only in
Motorway and Rural regimes, as it provides a relatively
constant high engine load with a high temperature of the
exhaust. For urban streets, the WHR system is
considered to be by-passed. Besides, 90 % operation
time in the Rural phase to consider possible severe non-
design operation conditions of turbomachines when IBC
has to be by-passed
Table 2. Standard test regime of heavy truck (UE)
N.582/2011 [7]
The time distribution between operation modes and
range of velocity for each mode for N3 type vehicle are
presented in Table 2 [7].
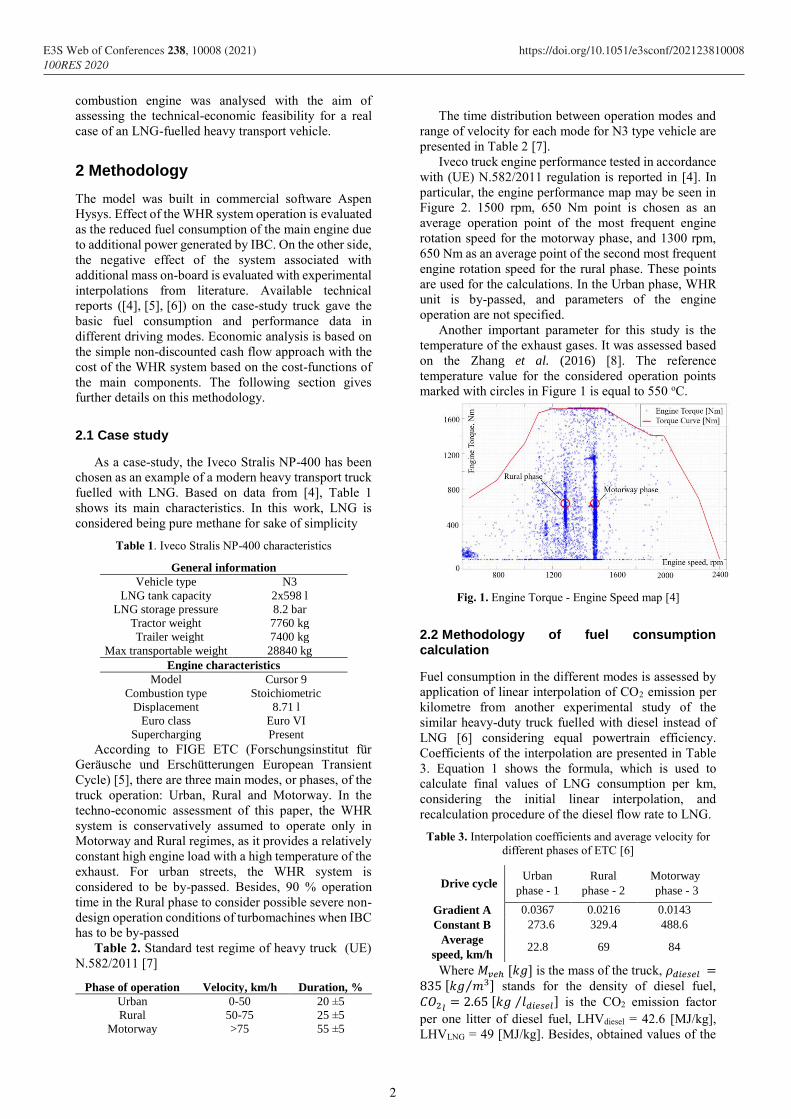
Iveco truck engine performance tested in accordance
with (UE) N.582/2011 regulation is reported in [4]. In
particular, the engine performance map may be seen in
Figure 2. 1500 rpm, 650 Nm point is chosen as an
average operation point of the most frequent engine
rotation speed for the motorway phase, and 1300 rpm,
650 Nm as an average point of the second most frequent
engine rotation speed for the rural phase. These points
are used for the calculations. In the Urban phase, WHR
unit is by-passed, and parameters of the engine
operation are not specified.
Another important parameter for this study is the
temperature of the exhaust gases. It was assessed based
on the Zhang et al. (2016) [8]. The reference
temperature value for the considered operation points
marked with circles in Figure 1 is equal to 550 oC.
Fig. 1. Engine Torque - Engine Speed map [4]
2.2 Methodology of fuel consumption calculation
Fuel consumption in the different modes is assessed by
application of linear interpolation of CO2 emission per
kilometre from another experimental study of the
similar heavy-duty truck fuelled with diesel instead of
LNG [6] considering equal powertrain efficiency.
Coefficients of the interpolation are presented in Table
3. Equation 1 shows the formula, which is used to
calculate final values of LNG consumption per km,
considering the initial linear interpolation, and
recalculation procedure of the diesel flow rate to LNG.
Table 3. Interpolation coefficients and average velocity for
different phases of ETC [6]
Drive cycle Urban
phase - 1
Rural
phase - 2
Motorway
phase - 3
Gradient A 0.0367 0.0216 0.0143
Constant B 273.6 329.4 488.6
Average
speed, km/h 22.8 69 84
Where 𝑀𝑣𝑒ℎ [𝑘𝑔] is the mass of the truck, 𝜌𝑑𝑖𝑒𝑠𝑒𝑙 =835 [𝑘𝑔 𝑚3⁄ ] stands for the density of diesel fuel,
𝐶𝑂2𝑙= 2.65 [𝑘𝑔 𝑙𝑑𝑖𝑒𝑠𝑒𝑙⁄ ] is the CO2 emission factor
per one litter of diesel fuel, LHVdiesel = 42.6 [MJ/kg],
LHVLNG = 49 [MJ/kg]. Besides, obtained values of the
Phase of operation Velocity, km/h Duration, %
Urban 0-50 20 ±5
Rural 50-75 25 ±5
Motorway >75 55 ±5
2
E3S Web of Conferences 238, 10008 (2021) https://doi.org/10.1051/e3sconf/202123810008100RES 2020
fuel rate enable to assess the exhaust gas flow rate and
composition, since the engine runs in stoichiometric
condition [2] giving results corresponding to other
sources, e.g. [8].
𝐶𝐿𝑁𝐺_𝑘𝑚 = ((𝐵 + 𝐴 ∙ 𝑀𝑣𝑒ℎ[𝑘𝑔]) [𝑔
𝑘𝑚] ∙
1
𝐶𝑂2𝑙_𝑑𝑖𝑒𝑠𝑒𝑙[𝑘𝑔
𝑙]) ∙
𝜌𝑑𝑖𝑒𝑠𝑒𝑙 [𝑘𝑔
𝑚3] ∙𝐿𝐻𝑉𝑑𝑖𝑒𝑠𝑒𝑙
𝐿𝐻𝑉𝐿𝑁𝐺, [
𝑘𝑔
𝑘𝑚] Eq. 1
For the calculation of the benefit coming from the
IBC-WHR system, the power recovered is simply added
to the ICE one to satisfy the entire load, assuming all the
mechanical energy converted into electric, giving the
consequent fuel saving. Saved fuel enables to compute
the cash flow in $/km. The price of the kilogram of LNG
for Italy (priceLNG = 0.96 €/kg [9]) was converted to
dollar of 2018 [10].
2.3 Studied system
Inverted Brayton cycle as a technical solution for WHR
was suggested decades ago; Dunteman in 1970 [11] was
one of the first who investigated it in detailes. But only
recently this concept got a new wave of attention in the
scientific literature. In particular, the application of IBC
for the reciprocating engine bottoming is studied by
Kennedy et al. [12] and Di Battista et al. [13] for light
vehicles, or Di Battista et al. [14] for heavy vehicles
whose models show good results from thermodynamic
point of view. Kennedy et al. report about 5% decrease
in brake specific fuel consumption. Di Battista et al.
demonstrated 3.5% of the brake mechanical power
recovery [14], and 3.4% net efficiency increase in a later
work [13] underlining the operability of the system only
under the engine load above 70%.
The principle of operation of the IBC is described in
details in [12]. Briefly, the hot exhaust gas leaving its
source (reciprocating engine in the studied case) comes
to the turbine of IBC with near atmospheric pressure. It
expands in the turbine down to the subatmospheric
pressure, which is generated by the compressor standing
downstream. Then the gas cools down in the cooler and
get back to the atmosperic pressure with the compressor.
Although this cycle enables to direct exhaust straight to
the turbine without intermediate fluid, cooling before
the compressor should be intense to cool the exhaust gas
down to provide an essential difference between the
turbine produced work and compressor consumed work.
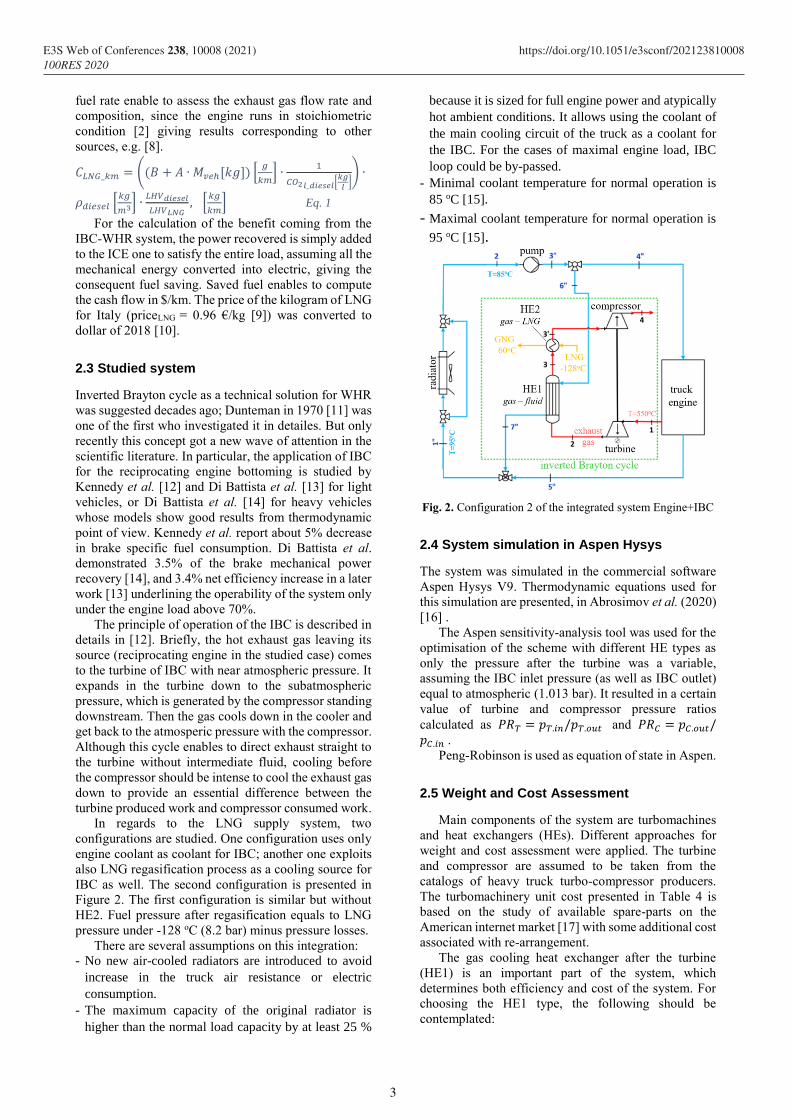
In regards to the LNG supply system, two
configurations are studied. One configuration uses only
engine coolant as coolant for IBC; another one exploits
also LNG regasification process as a cooling source for
IBC as well. The second configuration is presented in
Figure 2. The first configuration is similar but without
HE2. Fuel pressure after regasification equals to LNG
pressure under -128 oC (8.2 bar) minus pressure losses.
There are several assumptions on this integration:
- No new air-cooled radiators are introduced to avoid
increase in the truck air resistance or electric
consumption.
- The maximum capacity of the original radiator is
higher than the normal load capacity by at least 25 %
because it is sized for full engine power and atypically
hot ambient conditions. It allows using the coolant of
the main cooling circuit of the truck as a coolant for
the IBC. For the cases of maximal engine load, IBC
loop could be by-passed.
- Minimal coolant temperature for normal operation is
85 oC [15].
- Maximal coolant temperature for normal operation is
95 oC [15].
Fig. 2. Configuration 2 of the integrated system Engine+IBC
2.4 System simulation in Aspen Hysys
The system was simulated in the commercial software
Aspen Hysys V9. Thermodynamic equations used for
this simulation are presented, in Abrosimov et al. (2020)
[16] .
The Aspen sensitivity-analysis tool was used for the
optimisation of the scheme with different HE types as
only the pressure after the turbine was a variable,
assuming the IBC inlet pressure (as well as IBC outlet)
equal to atmospheric (1.013 bar). It resulted in a certain
value of turbine and compressor pressure ratios
calculated as 𝑃𝑅𝑇 = 𝑝𝑇.𝑖𝑛/𝑝𝑇.𝑜𝑢𝑡 and 𝑃𝑅𝐶 = 𝑝𝐶.𝑜𝑢𝑡/𝑝𝐶.𝑖𝑛 .
Peng-Robinson is used as equation of state in Aspen.
2.5 Weight and Cost Assessment
Main components of the system are turbomachines
and heat exchangers (HEs). Different approaches for
weight and cost assessment were applied. The turbine
and compressor are assumed to be taken from the
catalogs of heavy truck turbo-compressor producers.
The turbomachinery unit cost presented in Table 4 is
based on the study of available spare-parts on the
American internet market [17] with some additional cost
associated with re-arrangement.
The gas cooling heat exchanger after the turbine
(HE1) is an important part of the system, which
determines both efficiency and cost of the system. For
choosing the HE1 type, the following should be
contemplated:
3
E3S Web of Conferences 238, 10008 (2021) https://doi.org/10.1051/e3sconf/202123810008100RES 2020
- One side of HE1 is under vacuum conditions, so
suitable casing should be applied
- The highest temperature is above 400 oC, so some
materials (e.g. aluminium) and HE types (e.g., plate-
and-frame due to sealing issues) cannot be used
- To provide reasonable system efficiency, considering
a relatively high temperature of the coolant,
effectiveness (𝜎 =𝑇ℎ𝑜𝑡.𝑖𝑛 − 𝑇ℎ𝑜𝑡.𝑜𝑢𝑡
𝑇ℎ𝑜𝑡.𝑖𝑛 − 𝑇𝑐𝑜𝑙𝑑.𝑖𝑛⁄ )
of the HE1 should be the highest possible.
- To provide higher efficiency of the WHR unit,
pressure losses in HEs should be the lowest possible.
Relative pressure losses Δp = (𝑝𝑖𝑛 − 𝑝𝑜𝑢𝑡) 𝑝𝑖𝑛⁄ are
used for this assessment
These considerations bring out two types of the main
heat exchangers, which are in the focus of this work:
plate-fin type and shell-and-tube type.
Both heat exchangers are relatively small, so it is
quite challenging to apply the usual cost-function
assessment technique (e.g., based on [18]) for the
considered type and size of HEs. Besides, this method is
subjected to criticism in the literature (e.g. [19]) as the
25 years old data may not consider progress in
manufacturing technologies. That is why a range of
possible cost was assessed based on the several literature
sources.
One of the cost estimations for the shell-and-tube HE
is based on Hewitt & Pugh (2007) [20] who give the
interpolation for the cost of plate-and-frame HEs in the
range of the working area 0.1 – 1000 m2, where HE1 fits
in. Then, the obtained value is multiplied by three,
following the comparison of the manufacturing cost of
plate-and-frame and shell-and-tube HEs in Kananeh et
al. (2012) [21]. Conversion from UA [W/K] available in
Aspen to the effective heat-transfer area of the HE (Aeff
[m2]) is based on the assumption of U = 75 [W/m2K ]
for the effective overall heat conductance in case of heat
exchange between low-pressure gas and brines [22]. For
the assessment of the high cost bound of the plate-fin
HE, ESDU (1995) [23] graphical cost-function was used
relying on the active volume (Vact) of HE. The Vact =
500·Aeff ratio from [20] gives an approximate
assessment of the this parameter for plate-fin HE based
on the Aeff available from Aspen Hysys model. In this
study, Vact is observed varying around 0.01 m3 for plate-
fin, and around 0.05 m3 for shell-and-tube. Hewitt &
Pugh reference a source in British pounds of 1995, [23]
is in British pounds of 1997 which are converted to US
dollars 2018 using the currency exchange rate for 1995
and 1997 [10] and CEPCI cost index [24].
An alternative source of the cost estimation is Xie et
al. (2008) [25] who estimate a larger size plate-fin HE
with about 5 times lower cost than the approach
described above has shown. Besides, studying of the
Chinese internet market [26] has demonstrated that
available costs of some components are much lower
than it could be calculated with classical cost-function
methods. Considering the fact that this paper is trying to
assess the practical value of the technology, sources of
the cost data such as [26] should be considered.
For HE2, which is a gas cooler at one side, and LNG
regasifier at the other, different types of HE are in use,
for example, Dorosz et al. (2018) [27] mention brazed
plate and shell-and-tube HEs as possible types.
However, as in many other literature sources, the phase
change HE is described as quite a complex system,
usually consisting of several sections and combining
HEs of different types to compensate high superheating
of the gas phase. The cost of HE2 is also given as a range
based on the calculation of the shell-and-tube HE and
plate-fin HE. The procedure is similar to HE1 with Vact
in the range 0.0015-0.01 m3.
Here, the plate-fin type as is chosen as conservative
solution being one of the most expensive types of HEs.
The assessment of HEs weight range is based on
several HE configurations obtained in Aspen Hysys HE
design add-in. Thus the mass of HEs was assessed as a
range, which contains the plate-fin HE as a low bound
and shell-and-tube as a high bound.
As the additional system increases the overall mass
of the truck, it is important to consider this effect on fuel
consumption. The chosen method of fuel consumption
calculation allows doing that as the variable in Equation
1 is the mass of the vehicle (𝑀𝑣𝑒ℎ).
Cash flow discounting is not accounted for in the
economic analysis of this work. Operation and
maintenance (O&M) expenditures are neglected as they
do not affect much overall truck O&M costs.
3 Results
Table 4. Parameters of IBC components
Table 4 reports the summary of component parameters
(cost and weight). Besides, it contains the main
assumption on the components parameters based on
their type and scale (efficiency of turbomachinery,
effectiveness and relative pressure losses of HE1). The
effectiveness of HE1 associated with HE type has been
assigned as reasonably achievable for the particular
type. The effectiveness of HE2 is not fixed being
determined in HE2 by the flow rates and temperatures
of the mediums. For any of the cases, it does not exceed
0.82 for the cold side and 0.19 for the hot side.
Temperature before the compressor takes the value
between 60 and 85 oC. It was checked that condensation
does not occur under these pressure and temperature, as
with the lower temperature, it is possible [16].
Component Type Additional
features Cost, $
Weight,
kg
Turbine Radial ηis = 0.8 1000 10
Compressor Radial ηis = 0.8
HE1
Plate-fin /
shell-
and-tube
σ = 0.95 / 0.9
Δp = 0.035 / 0.025
Toil.in = 85 oC
Toil.out = 95 oC
4200 –
23850
100 -
370
HE2 Plate-fin
Δp = 0.015
TLNG.in = -128 oC
TGNG.out = 60 oC
1575-
4650 10-50
4
E3S Web of Conferences 238, 10008 (2021) https://doi.org/10.1051/e3sconf/202123810008100RES 2020
Results of the system performance in different
configurations, HE1 hot side effectiveness, and phase of
the truck operation are shown in Table 5. Calculated
engine power in the Motorway phase (phase-3) equals
to 102 kW, and in Rural phase (phase-2), it is equal to
88.5 kW. As mentioned before, the WHR system is by-
passed in the Urban phase. The maximum useful power
produced by IBC (PIBC) is reached in the Motorway
phase with HE1 of the higher effectiveness (average
IBC power (PIBC) 2.75 kW, 2.70 % of the fuel economy
(FE). Maximal total FE for this configuration for the
whole ETC is 2.14 %. The range of FEtot is associated
with the varying WHR system weight. Generated power
partially covers electric consumption of the vehicle
auxiliaries, which is in the range 4.7-7.3 % according to
[28].
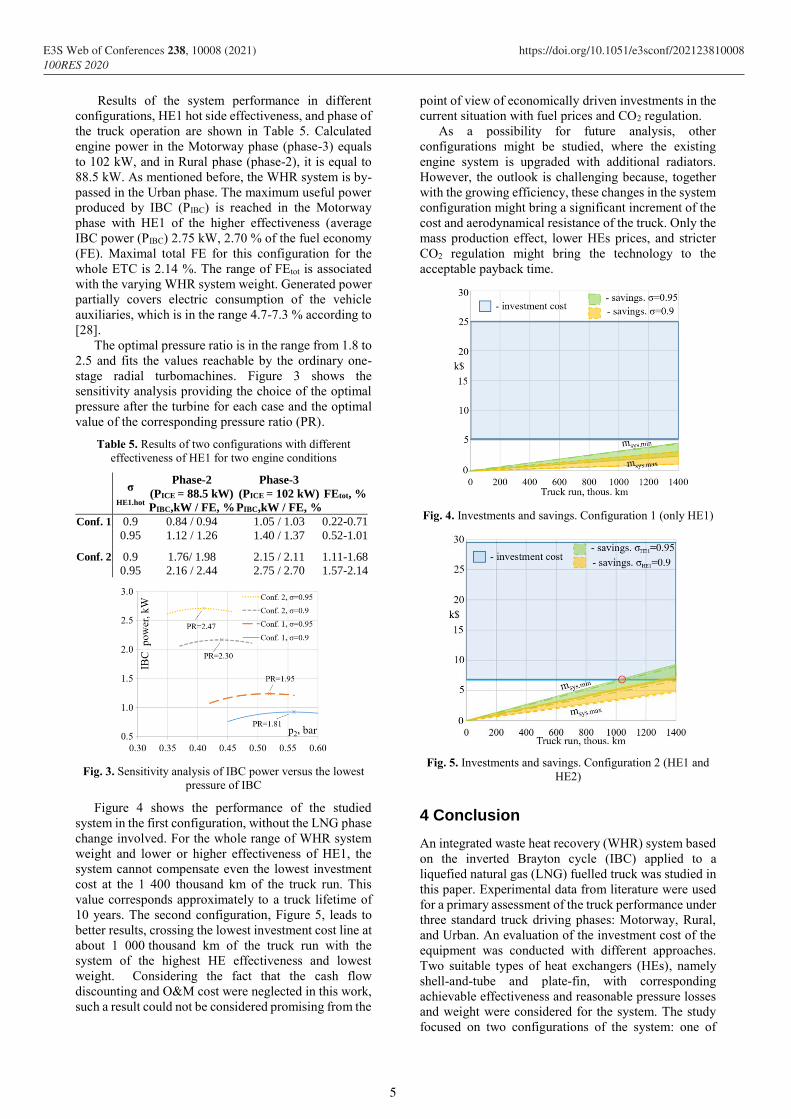
The optimal pressure ratio is in the range from 1.8 to
2.5 and fits the values reachable by the ordinary one-
stage radial turbomachines. Figure 3 shows the
sensitivity analysis providing the choice of the optimal
pressure after the turbine for each case and the optimal
value of the corresponding pressure ratio (PR).
Table 5. Results of two configurations with different
effectiveness of HE1 for two engine conditions
σ
HE1.hot
Phase-2
(PICE = 88.5 kW)
PIBC,kW / FE, %
Phase-3
(PICE = 102 kW)
PIBC,kW / FE, %
FEtot, %
Conf. 1 0.9 0.84 / 0.94 1.05 / 1.03 0.22-0.71
0.95 1.12 / 1.26 1.40 / 1.37 0.52-1.01
Conf. 2 0.9 1.76/ 1.98 2.15 / 2.11 1.11-1.68
0.95 2.16 / 2.44 2.75 / 2.70 1.57-2.14
Fig. 3. Sensitivity analysis of IBC power versus the lowest
pressure of IBC
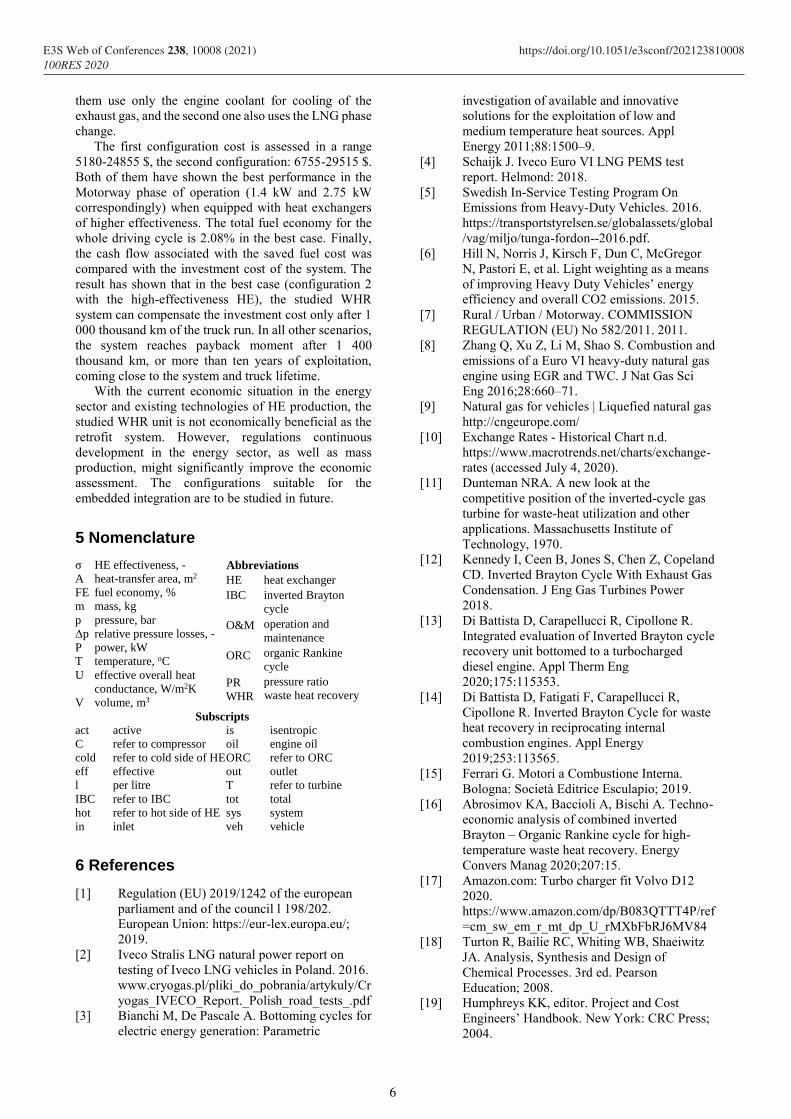
Figure 4 shows the performance of the studied
system in the first configuration, without the LNG phase
change involved. For the whole range of WHR system
weight and lower or higher effectiveness of HE1, the
system cannot compensate even the lowest investment
cost at the 1 400 thousand km of the truck run. This
value corresponds approximately to a truck lifetime of
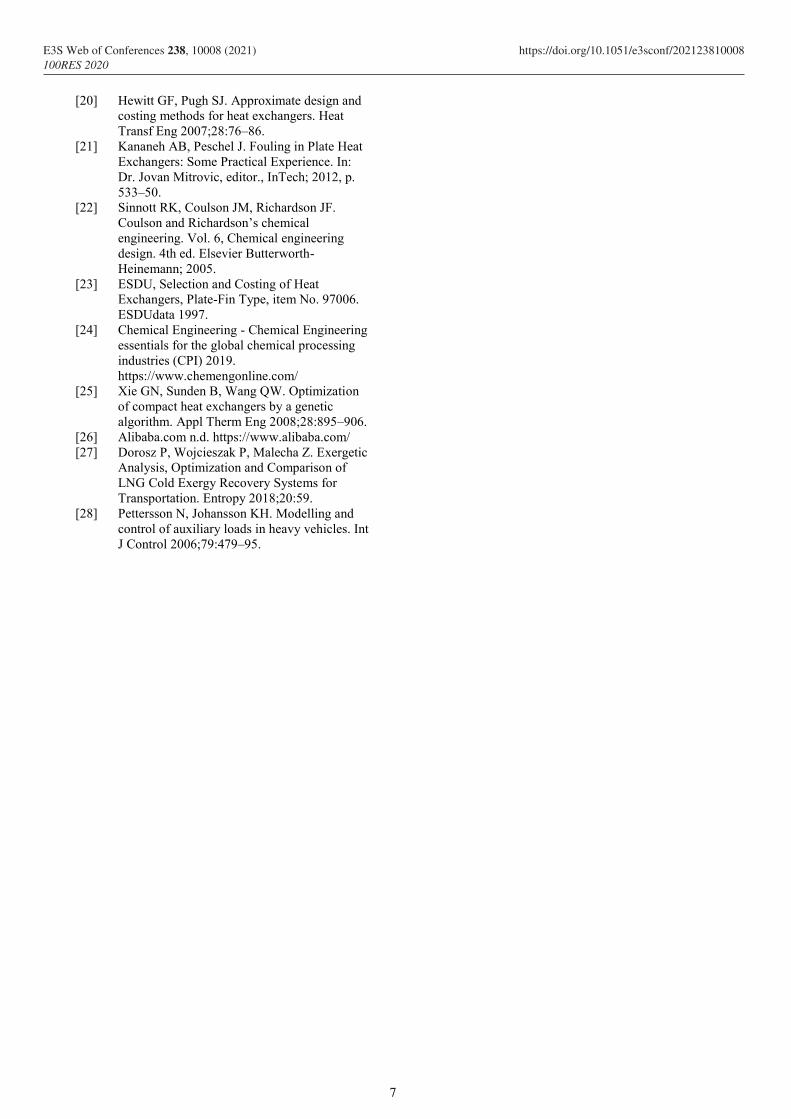
10 years. The second configuration, Figure 5, leads to
better results, crossing the lowest investment cost line at
about 1 000 thousand km of the truck run with the
system of the highest HE effectiveness and lowest
weight. Considering the fact that the cash flow
discounting and O&M cost were neglected in this work,
such a result could not be considered promising from the
point of view of economically driven investments in the
current situation with fuel prices and CO2 regulation.
As a possibility for future analysis, other
configurations might be studied, where the existing
engine system is upgraded with additional radiators.
However, the outlook is challenging because, together
with the growing efficiency, these changes in the system
configuration might bring a significant increment of the
cost and aerodynamical resistance of the truck. Only the
mass production effect, lower HEs prices, and stricter
CO2 regulation might bring the technology to the
acceptable payback time.
Fig. 4. Investments and savings. Configuration 1 (only HE1)
Fig. 5. Investments and savings. Configuration 2 (HE1 and
HE2)
4 Conclusion
An integrated waste heat recovery (WHR) system based
on the inverted Brayton cycle (IBC) applied to a
liquefied natural gas (LNG) fuelled truck was studied in
this paper. Experimental data from literature were used
for a primary assessment of the truck performance under
three standard truck driving phases: Motorway, Rural,
and Urban. An evaluation of the investment cost of the
equipment was conducted with different approaches.
Two suitable types of heat exchangers (HEs), namely
shell-and-tube and plate-fin, with corresponding
achievable effectiveness and reasonable pressure losses
and weight were considered for the system. The study
focused on two configurations of the system: one of
5
E3S Web of Conferences 238, 10008 (2021) https://doi.org/10.1051/e3sconf/202123810008100RES 2020
them use only the engine coolant for cooling of the
exhaust gas, and the second one also uses the LNG phase
change.
The first configuration cost is assessed in a range
5180-24855 $, the second configuration: 6755-29515 $.
Both of them have shown the best performance in the
Motorway phase of operation (1.4 kW and 2.75 kW
correspondingly) when equipped with heat exchangers
of higher effectiveness. The total fuel economy for the
whole driving cycle is 2.08% in the best case. Finally,
the cash flow associated with the saved fuel cost was
compared with the investment cost of the system. The
result has shown that in the best case (configuration 2
with the high-effectiveness HE), the studied WHR
system can compensate the investment cost only after 1
000 thousand km of the truck run. In all other scenarios,
the system reaches payback moment after 1 400
thousand km, or more than ten years of exploitation,
coming close to the system and truck lifetime.
With the current economic situation in the energy
sector and existing technologies of HE production, the
studied WHR unit is not economically beneficial as the
retrofit system. However, regulations continuous
development in the energy sector, as well as mass
production, might significantly improve the economic
assessment. The configurations suitable for the
embedded integration are to be studied in future.
5 Nomenclature
σ
A
FE
m
p
Δp
P
T
U
V
HE effectiveness, -
heat-transfer area, m2
fuel economy, %
mass, kg
pressure, bar
relative pressure losses, -
power, kW
temperature, oC
effective overall heat
conductance, W/m2K
volume, m3
Abbreviations
HE
IBC
O&M
ORC
PR
WHR
heat exchanger
inverted Brayton
cycle
operation and
maintenance
organic Rankine
cycle
pressure ratio
waste heat recovery
Subscripts act
C
cold
eff
l
IBC
hot
in
active
refer to compressor
refer to cold side of HE
effective
per litre
refer to IBC
refer to hot side of HE
inlet
is
oil
ORC
out
T
tot
sys
veh
isentropic
engine oil
refer to ORC
outlet
refer to turbine
total
system
vehicle
6 References
[1] Regulation (EU) 2019/1242 of the european
parliament and of the council l 198/202.
European Union: https://eur-lex.europa.eu/;
2019.
[2] Iveco Stralis LNG natural power report on
testing of Iveco LNG vehicles in Poland. 2016.
www.cryogas.pl/pliki_do_pobrania/artykuly/Cr
yogas_IVECO_Report._Polish_road_tests_.pdf
[3] Bianchi M, De Pascale A. Bottoming cycles for
electric energy generation: Parametric
investigation of available and innovative
solutions for the exploitation of low and
medium temperature heat sources. Appl
Energy 2011;88:1500–9.
[4] Schaijk J. Iveco Euro VI LNG PEMS test
report. Helmond: 2018.
[5] Swedish In-Service Testing Program On
Emissions from Heavy-Duty Vehicles. 2016.
https://transportstyrelsen.se/globalassets/global
/vag/miljo/tunga-fordon--2016.pdf.
[6] Hill N, Norris J, Kirsch F, Dun C, McGregor
N, Pastori E, et al. Light weighting as a means
of improving Heavy Duty Vehicles’ energy
efficiency and overall CO2 emissions. 2015.
[7] Rural / Urban / Motorway. COMMISSION
REGULATION (EU) No 582/2011. 2011.
[8] Zhang Q, Xu Z, Li M, Shao S. Combustion and
emissions of a Euro VI heavy-duty natural gas
engine using EGR and TWC. J Nat Gas Sci
Eng 2016;28:660–71.
[9] Natural gas for vehicles | Liquefied natural gas
http://cngeurope.com/
[10] Exchange Rates - Historical Chart n.d.
https://www.macrotrends.net/charts/exchange-
rates (accessed July 4, 2020).
[11] Dunteman NRA. A new look at the
competitive position of the inverted-cycle gas
turbine for waste-heat utilization and other
applications. Massachusetts Institute of
Technology, 1970.
[12] Kennedy I, Ceen B, Jones S, Chen Z, Copeland
CD. Inverted Brayton Cycle With Exhaust Gas
Condensation. J Eng Gas Turbines Power
2018.
[13] Di Battista D, Carapellucci R, Cipollone R.
Integrated evaluation of Inverted Brayton cycle
recovery unit bottomed to a turbocharged
diesel engine. Appl Therm Eng
2020;175:115353.
[14] Di Battista D, Fatigati F, Carapellucci R,
Cipollone R. Inverted Brayton Cycle for waste
heat recovery in reciprocating internal
combustion engines. Appl Energy
2019;253:113565.
[15] Ferrari G. Motori a Combustione Interna.
Bologna: Società Editrice Esculapio; 2019.
[16] Abrosimov KA, Baccioli A, Bischi A. Techno-
economic analysis of combined inverted
Brayton – Organic Rankine cycle for high-
temperature waste heat recovery. Energy
Convers Manag 2020;207:15.
[17] Amazon.com: Turbo charger fit Volvo D12
2020.
https://www.amazon.com/dp/B083QTTT4P/ref
=cm_sw_em_r_mt_dp_U_rMXbFbRJ6MV84
[18] Turton R, Bailie RC, Whiting WB, Shaeiwitz
JA. Analysis, Synthesis and Design of
Chemical Processes. 3rd ed. Pearson
Education; 2008.
[19] Humphreys KK, editor. Project and Cost
Engineers’ Handbook. New York: CRC Press;
2004.
6
E3S Web of Conferences 238, 10008 (2021) https://doi.org/10.1051/e3sconf/202123810008100RES 2020
[20] Hewitt GF, Pugh SJ. Approximate design and
costing methods for heat exchangers. Heat
Transf Eng 2007;28:76–86.
[21] Kananeh AB, Peschel J. Fouling in Plate Heat
Exchangers: Some Practical Experience. In:
Dr. Jovan Mitrovic, editor., InTech; 2012, p.
533–50.
[22] Sinnott RK, Coulson JM, Richardson JF.
Coulson and Richardson’s chemical
engineering. Vol. 6, Chemical engineering
design. 4th ed. Elsevier Butterworth-
Heinemann; 2005.
[23] ESDU, Selection and Costing of Heat
Exchangers, Plate-Fin Type, item No. 97006.
ESDUdata 1997.
[24] Chemical Engineering - Chemical Engineering
essentials for the global chemical processing
industries (CPI) 2019.
https://www.chemengonline.com/
[25] Xie GN, Sunden B, Wang QW. Optimization
of compact heat exchangers by a genetic
algorithm. Appl Therm Eng 2008;28:895–906.
[26] Alibaba.com n.d. https://www.alibaba.com/
[27] Dorosz P, Wojcieszak P, Malecha Z. Exergetic
Analysis, Optimization and Comparison of
LNG Cold Exergy Recovery Systems for
Transportation. Entropy 2018;20:59.
[28] Pettersson N, Johansson KH. Modelling and
control of auxiliary loads in heavy vehicles. Int
J Control 2006;79:479–95.
7
E3S Web of Conferences 238, 10008 (2021) https://doi.org/10.1051/e3sconf/202123810008100RES 2020


![Waste Heat Recovery[1]](https://img.pdfslide.us/doc/110x75/577d28de1a28ab4e1ea56f01/waste-heat-recovery1.jpg)
