Embed Size (px)
Citation preview

Techniques for semi-automatic generationof data cubes from star-schemas
Mattias Hinnerson
Mattias HinnersonAuthumn 2016Master Thesis in Computing Science and Engineering, 30 ECTSSupervisor: Michael MinockExtern Supervisor: Adam HolmstromExaminer: Henrik BjorklundUmea University, Department of Computing Science


Abstract
The aim of this thesis is to investigate techniques to better automate theprocess of generating data cubes from star- or snowflake schemas. Thecompany Trimma builds cubes manually today, but we will investigatedoing this more efficiently. We will select two basic approaches and im-plement them in Prototype A and Prototype B. Prototype A is a directmethod that communicates directly with a database server. PrototypeB is an indirect method that creates configuration files that can, lateron, get loaded onto a database server. We evaluate the two prototypesover a star schema and a snowflake schema case provided by Trimma.The evaluation criteria include completeness, usability, documentationand support, maintainability, license costs, and development speed. Ourevaluation indicates that Prototype A is generally outperforming Pro-totype B and that prototype A is arguably performing better than themanual method current employed by Trimma.


Acknowledgements
First and foremost I would like to say a big thank you to my two supervisors: Adam Holm-strom and Michael Minock, who have guided me through this master thesis with muchthoughtful advice. I would also like to say a big thank you to the company Trimma thatlet me work at their office, lending me a desk to work at and a laptop to work with duringthis thesis. I would also like to give a thank you to Trimma’s employees, who helped meduring this thesis in many different ways, for example by being survey participants in theevaluation.
Secondly, I would like to thank my parents, grandparents, sisters, and my sister’s son forgiving me support during this thesis’ trials. Lastly, I would also like to thank all my friendsthat gave additional support.

Contents
1 Introduction 1
1.1 Organization of this thesis . . . . . . . . . . . . . . . . . . . . . . . . . . 1
1.2 About Trimma . . . . . . . . . . . . . . . . . . . . . . . . . . . . . . . . . 2
1.3 Thesis Focus . . . . . . . . . . . . . . . . . . . . . . . . . . . . . . . . . 3
1.4 How it could work in a (semi)-automated method . . . . . . . . . . . . . . 3
1.5 Problem statement . . . . . . . . . . . . . . . . . . . . . . . . . . . . . . 3
1.6 Restrictions . . . . . . . . . . . . . . . . . . . . . . . . . . . . . . . . . . 4
2 Background 5
2.1 History of Business Intelligence . . . . . . . . . . . . . . . . . . . . . . . 5
2.2 Business Intelligence structure and parts . . . . . . . . . . . . . . . . . . . 6
2.2.1 OLTP (Online Transaction Processing) . . . . . . . . . . . . . . . 6
2.2.2 Data Warehouse . . . . . . . . . . . . . . . . . . . . . . . . . . . 6
2.2.3 ETL (Extract, Transform, Load) . . . . . . . . . . . . . . . . . . . 7
2.2.4 Structure of a data warehouse . . . . . . . . . . . . . . . . . . . . 7
2.2.5 OLAP Cubes . . . . . . . . . . . . . . . . . . . . . . . . . . . . . 8
2.2.6 OLAP (Online Analytic Processing) . . . . . . . . . . . . . . . . . 10
2.3 Software that Trimma use: . . . . . . . . . . . . . . . . . . . . . . . . . . 10
2.4 Available Tools for Cube Creation and management . . . . . . . . . . . . . 11
2.4.1 Microsoft API AMO . . . . . . . . . . . . . . . . . . . . . . . . . 11
2.4.2 BIML . . . . . . . . . . . . . . . . . . . . . . . . . . . . . . . . . 11
3 Approach 13
3.1 Example Schemas . . . . . . . . . . . . . . . . . . . . . . . . . . . . . . . 13
3.1.1 Case 1: A star schema with five dimension tables . . . . . . . . . . 14
3.1.2 Case 2: A Snowflake Schema . . . . . . . . . . . . . . . . . . . . 14
3.2 Prototype Architechtual Design . . . . . . . . . . . . . . . . . . . . . . . . 14
3.3 Evaluation Criteria . . . . . . . . . . . . . . . . . . . . . . . . . . . . . . 17
4 Implementation 19
4.1 General . . . . . . . . . . . . . . . . . . . . . . . . . . . . . . . . . . . . 19
4.1.1 Programming language . . . . . . . . . . . . . . . . . . . . . . . . 19
4.1.2 Input Handling . . . . . . . . . . . . . . . . . . . . . . . . . . . . 20
4.1.3 Output Handling . . . . . . . . . . . . . . . . . . . . . . . . . . . 20
4.2 Creating a data source view . . . . . . . . . . . . . . . . . . . . . . . . . . 21
4.3 Creating a dimension . . . . . . . . . . . . . . . . . . . . . . . . . . . . . 23
4.3.1 Step 1: New empty dimension . . . . . . . . . . . . . . . . . . . . 23
4.3.2 Step 2: Add dimension key attribute . . . . . . . . . . . . . . . . . 24
4.3.3 Step 3: Add dimension hierarchy level attributes . . . . . . . . . . 25
4.4 Creating a cube . . . . . . . . . . . . . . . . . . . . . . . . . . . . . . . . 27
5 Evaluation 31
5.1 Completeness . . . . . . . . . . . . . . . . . . . . . . . . . . . . . . . . . 31
5.1.1 Completeness compared to cases declared in chapter 4 . . . . . . . 31
5.1.2 Completeness compared to manually built cubes . . . . . . . . . . 33
5.2 Usability . . . . . . . . . . . . . . . . . . . . . . . . . . . . . . . . . . . . 35
5.2.1 Understandability . . . . . . . . . . . . . . . . . . . . . . . . . . . 36
5.2.2 Readability . . . . . . . . . . . . . . . . . . . . . . . . . . . . . . 37
5.2.3 Test Group Preferability . . . . . . . . . . . . . . . . . . . . . . . 37
5.3 Documentation and Support . . . . . . . . . . . . . . . . . . . . . . . . . 37
5.3.1 Documentation . . . . . . . . . . . . . . . . . . . . . . . . . . . . 38
5.3.2 Support . . . . . . . . . . . . . . . . . . . . . . . . . . . . . . . . 38
5.4 Maintainability . . . . . . . . . . . . . . . . . . . . . . . . . . . . . . . . 39
5.5 Lines of code . . . . . . . . . . . . . . . . . . . . . . . . . . . . . . . . . 39
5.6 Cyclomatic Complexity . . . . . . . . . . . . . . . . . . . . . . . . . . . . 40
5.7 Development speed . . . . . . . . . . . . . . . . . . . . . . . . . . . . . . 41
5.8 Saved Developer Time . . . . . . . . . . . . . . . . . . . . . . . . . . . . 42
5.9 License costs . . . . . . . . . . . . . . . . . . . . . . . . . . . . . . . . . 43
5.10 Result Summary . . . . . . . . . . . . . . . . . . . . . . . . . . . . . . . . 44
6 Discussion and Conclusion 47
6.1 Discussion . . . . . . . . . . . . . . . . . . . . . . . . . . . . . . . . . . . 47
6.2 Conclusion . . . . . . . . . . . . . . . . . . . . . . . . . . . . . . . . . . 48

6.3 Future work . . . . . . . . . . . . . . . . . . . . . . . . . . . . . . . . . . 48
References . . . . . . . . . . . . . . . . . . . . . . . . . . . . . . . . . . . . . . 49
A Appendix 53
A.1 Implementation case 1: Star Schema . . . . . . . . . . . . . . . . . . . . . 53
A.2 Implementation case 2: Snowflake Schema . . . . . . . . . . . . . . . . . 54
A.3 User Survey . . . . . . . . . . . . . . . . . . . . . . . . . . . . . . . . . . 55

1(58)
1 Introduction
The world we live in gets more globalised every day, opening up for new business opportuni-ties for companies to expand to other markets, but also creates a higher risk for competition[1, p. 31-32]. This has led to that companies have started to use computerised support forimproved decision making. This phenomenon appeared already in the 70s, where it in 2006became widespread under the name Business Intelligence (BI). BI provides easier accessto data and gives better insight on the development of a business, leading to more well in-formed and better decisions [2, p. 19]. Constructing a BI system can be very challenging,expensive and require years of work. This because of all its complex parts that both shouldbe secure (since the system might contain sensitive strategical data), and integrated intomany other systems such as databases, legacy systems, etc. [1, p. 40,42].
This master thesis will focus on a particular part in the construction of new BI systems:the creation of Online Analytical Processing (OLAP) cubes. We will investigate varioustechniques that could speed up the creation of cubes. Two of these will be selected forprototype implementation and then be compared and analysed according to an evaluationcriteria.
1.1 Organization of this thesis
Introduction gives an explanation of what this thesis is about, a description about the com-pany Trimma, how they create cubes today, and a problem description with a problem state-ment.
Background gives an explanation of what this thesis is about, a description about the com-pany Trimma, how they create cubes today, and a problem description with a problem state-ment.
Approach describes the approach of this thesis, telling how the evaluation will be performedto answer the thesis’ problem statement, and also what criteria that exist.
Implementation contains a description of the two selected techniques, where we describesyntax similarities and differences.
Evaluation describes the performed evaluations conducted on each method according to thelist of criteria stated in chapter four. It also has an overview of the results at the end of thechapter.
Discussion and Conclusion contains a discussion, states the answer to the thesis’ problemstatement, and also propose possible future work.

2(58)
1.2 About Trimma
This master thesis is done in cooperation with Trimma 1. Trimma is a software company thatwas founded in Umea in the year of 2003. Today they have several offices around Sweden,still having their head office in Umea. Their focus is solutions for operation managementand business intelligence that helps other companies to run their businesses more efficiently.One of the programs that they develop and advertise is the application named INSIGHT (IN-SIKT in Swedish), which is based on standard techniques from Microsoft. Many big com-panies use their software, for example, MAX hamburgers, LKAB, The Swedish ConsumerAgency (Swedish: Konsumentverket), etc. Their software supports the whole process fromsetting up goals and planning, to making analysis and performance management. By usingINSIGHT, the customers of Trimma can get statistics about their own business so that theycan monitor their development and better plan for the future.
The tool Trimma uses today for building OLAP cubes is Microsoft Visual Studio. Thecontent inside Trimma’s data warehouse look different and contain different types of datain every customer project, but they always follow a particular pattern. The process thathappens when Trimma get a new customer can briefly be described as:
1. The customer decides to buy Trimma’s product INSIKT.
2. Trimma build a data warehouse, which is a database system with particular contentwith a model that describes the demands and needs of the customer in an efficientmanner. The needs of the client are somewhat known to Trimma since the base of-ten follows a particular pattern. For example, if Trimma get a new customer in anarea they have had customers before, and the customer wants a system for financialtracking of their own business, then Trimma have a clue of how to build up the datawarehouse. This includes star-/snowflake schemas (i.e. internal data warehouse struc-tures), and indirectly the cubes, in such a way that the customer’s needs are mainlycovered. However, if they get a new customer that has entirely different demands orin a field completely new to Trimma, then they would have to do more manual work.
3. Provided that the customer’s operational source systems are standardised and with aknown structure by Trimma since earlier projects, the ETL-process (data extraction)and data warehouse with star schemas gets semi-automatically generated.
4. The result so far is a star schema with facts and dimensions that are built accordingto Trimma’s standard formats and conventions.
5. The next phase is to create one or several cubes from these star schema database. To-day this work (defining cube structure) is done manually by consultants and requireshours of clicking, drag and drop and completing wizards in Microsoft Visual Studio.
6. When Trimma have created definitions of how the cube should look like and wheredata can be extracted from the star schemas, The definitions are loaded onto a Mi-crosoft SQL server where the built-in cube engine gathers information and createsthe cube(s) with desired aggregations.
7. The web application INSIKT gets connected to the created cube(s) and the customer’sdata can now be analysed.
1https://www.trimma.se/

3(58)
1.3 Thesis Focus
A brief overview of the central parts of a BI system is shown in Figure 1. These will bedescribed in more detail further into the report, but briefly, ETL is the process of fetchinganalytic data from customers. The output is stored in the Data Warehouse, as a collectionof tables with relations formed like a star- or snowflake schema. This data can, later on, betransformed into data cubes. It is this, among others, that Trimma build. These parts needto be constructed for every new customer that Trimma get. This requires a lot of consultingservices and time. Trimma has focused on simplifying the construction of star schemas andETL function. However, still many manual instances of cubes from the star schemas needto be managed (see * in Figure 1).
Figure 1: The focus of this thesis will be the link between star/snowflake schemas andcubes.
1.4 How it could work in a (semi)-automated method
The semi-automatic generation would preferably be done in a way that when the prototypestarts, you give it as input, a name to a database source and a fact table. It should then auto-matically be able to understand the schema structure from the fact table, set up definitionsfor where data should be collected, define the cube structure and lastly generate a cube uponthis. Note though that it is up to the database engine to load and create the cube defined bythe prototypes’ specified definitions and structure. It is also preferable if the method couldbe used as a plug-in inside Microsoft Visual Studio. If it can be automized in this way,then it will save Trimma many hours of manual work every time they get a new customeror whenever new cubes need to be built. If it works, then they would also be able to acceptmore customers since the startup process can be optimised and done faster.
1.5 Problem statement
The aim of this thesis is to find out what techniques exist that could more automaticallygenerate the otherwise manual work of creating OLAP cubes. Then it is necessary to deter-mine how well each of those perform regarding completeness, usability, and effectiveness.All this should lead to an answer for which tool is the preferable choice. All these problem-questions can get summarised in the following problem statement:
• Out of all available techniques for OLAP cube generation, can we determine whichtechnique that is the best choice regarding completeness, good usability and highefficiency?

4(58)
1.6 Restrictions
This thesis will not involve inventing an entirely new technique for autogenerating databasecubes, but instead it will contain an evaluation of existing tools. We will not create a wholedatabase engine for creating a cube, but rather we define where the engine should extractdata, how it should be interpreted, and how the internal structure should be inside the cube.It is then up to the cube engine to act on our set up definitions and extract the actual data.
This thesis will focus only on the generation of Online Analytical Processing (OLAP) cubes.Hence, the evaluation is based only on that area and does not include, for example, SQLServer Integration Services (SSIS) [3]. How the evaluated techniques will perform is solelymeasured for the OLAP aspect, and the results will not show how they behave in other as-pects and fields. Also, this thesis will only take into account that the cubes are created fromscratch from a star/snowflake- schema. It does not measure how each technique performswith configuring and changing existing ones.
Lastly, this thesis will only take into account schemas which have one fact table inside it.We will not include additional fact tables within the same schema.
5(58)
2 Background
2.1 History of Business Intelligence
The idea to analyse one’s surroundings for better business decisions appeared already in1865 where Richard Millar Devens described the banker Sir Henry Furnese’s work as busi-ness intelligence (BI) [4]. Although computers did not exist, Furnese managed to, via man-ual methods, get deeper understandings of the issues (such as political ones) in his sur-roundings and used it to make better decisions [5]. People later on accused Furnese to be acorrupt financier [6], but the idea of BI was born.
In 1958, Hans Peter Luhn, who often is considered the father of BI [5], described the ob-jective of business intelligence system as: ”The objective of the system is to supply suitableinformation to support specific activities carried out by individuals, groups, departments,divisions, or even larger units”[7, p. 2]. This area continued to be developed and in the1970s, static two-dimensional reporting systems started to exist with no analytic capabili-ties [1, p. 33]. These were run on mainframe computers and were often referred to as blackholes since they were good at collecting data, but retrieving data for analysis were muchmore challenging [1, p. 39]. This because of their complicated file structure, resulting inthat a complex aggregated information retrieval took a long time to execute. These thingschanged in the late 70s where solutions came up to solve this problem, where the companyTeradata created a database management system specifically for decision support[1, p. 65].
In the 1980s, Personal computers (PC) became widely available. This lead to increaseddigital storage which became more spread out than in mainframe computers. Resulting inthe problem called Islands of data. New software was created to fix this, called distributeddatabase management systems, which upon querying, fetched the data directly from filesat the organisation’s PCs and put it in one place, transformed it and created an answer to auser’s question. However, this was not efficient [1, p. 65]. Instead, a change happened in the90s where it went back to the ideas of the 70’s to copy data into a central location to laterperform analysis on it. This technique resulted in the birth of Data warehouses [1, p. 66],which are a central part of BI today [8].
6(58)
2.2 Business Intelligence structure and parts
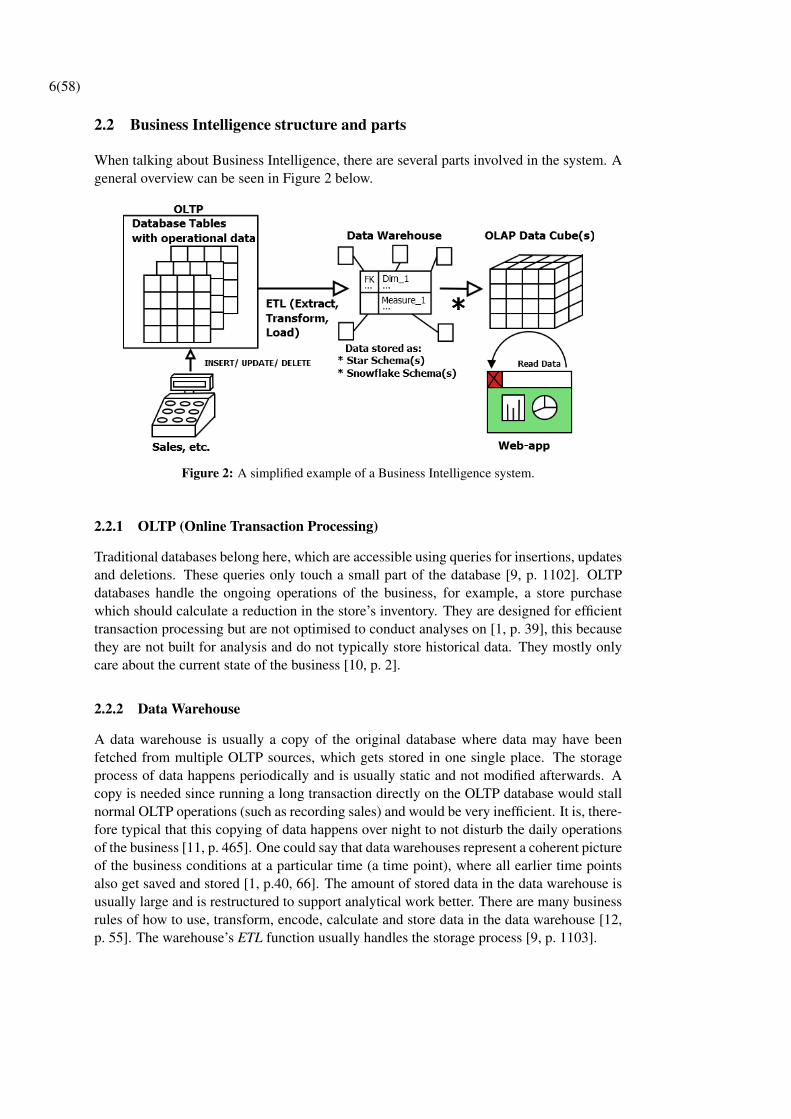
When talking about Business Intelligence, there are several parts involved in the system. Ageneral overview can be seen in Figure 2 below.
Figure 2: A simplified example of a Business Intelligence system.
2.2.1 OLTP (Online Transaction Processing)
Traditional databases belong here, which are accessible using queries for insertions, updatesand deletions. These queries only touch a small part of the database [9, p. 1102]. OLTPdatabases handle the ongoing operations of the business, for example, a store purchasewhich should calculate a reduction in the store’s inventory. They are designed for efficienttransaction processing but are not optimised to conduct analyses on [1, p. 39], this becausethey are not built for analysis and do not typically store historical data. They mostly onlycare about the current state of the business [10, p. 2].
2.2.2 Data Warehouse
A data warehouse is usually a copy of the original database where data may have beenfetched from multiple OLTP sources, which gets stored in one single place. The storageprocess of data happens periodically and is usually static and not modified afterwards. Acopy is needed since running a long transaction directly on the OLTP database would stallnormal OLTP operations (such as recording sales) and would be very inefficient. It is, there-fore typical that this copying of data happens over night to not disturb the daily operationsof the business [11, p. 465]. One could say that data warehouses represent a coherent pictureof the business conditions at a particular time (a time point), where all earlier time pointsalso get saved and stored [1, p.40, 66]. The amount of stored data in the data warehouse isusually large and is restructured to support analytical work better. There are many businessrules of how to use, transform, encode, calculate and store data in the data warehouse [12,p. 55]. The warehouse’s ETL function usually handles the storage process [9, p. 1103].

7(58)
2.2.3 ETL (Extract, Transform, Load)
Plays a significant role in the data warehouse. In short, this is the process that moves datafrom external OLTP sources into the Data Warehouse. It consists of a work area, instantiatedstructures, and processes [10, p. 19]. The processes is often divided into three parts:
• Extract: Reads data from one or many sources, which potentially could be of manydifferent kinds (OLTP databases, spreadsheets, external files, etc.) [12, p.54]. Data isextracted into the ETL system for further transformation [10, p. 19].
• Transform: Since extracted data can have different formats, we need to transform itinto a form that is suitable for storage in the data warehouse. This stage can alsoinclude aggregation and cleansing of data [12, p.54]. Cleansing, according to Kim-ball and Ross [10, p. 19-20], means that it corrects misspellings, resolves domainconflicts, handles missing elements, or parse data into a standard format.
• Load: Load over the transformed data into the data warehouse’s dimensional models[10, p. 20].
2.2.4 Structure of a data warehouse
The logical representation of data in the data warehouse can be seen as a multidimensionalmodel that is either built up like a star schema or snowflake schema, or an OLAP cube.The logical design for these is similar, but they differ in physical representation [10, p. 8].Ralph Kimball and Margy Ross suggest in their book ”the data warehouse toolkit” that,when constructing a data warehouse, one should first build star-/snowflake schemas hostedin a relational database, then build OLAP cubes upon these[10, p. 9]. It is common that aData warehouse has multiple star- or snowflake schemas. A Fact table is in the center of theschema. Tables that are linked with a relation to the fact table is called Dimension tables.
The difference between a Star- and a Snowflake schema is that, in a snowflake schema,the dimension tables could have additional Sub-tables which describes the dimension withadditional attributes. These attributes gives extra possibilities for filtering the result of aquery. An example could be when sending a query, asking for the amount of sold menuitems at a restaurant, by only showing data where the restaurant is located in a specificregion. A graphical representation of a star schema and snowflake schema is shown below.
Figure 3: A star schema (a) and a snowflake schema (b), containing a fact table (purple),dimension tables (dark green), and dimension sub-tables (light green).
8(58)
Fact Tables: Contains foreign key connections to the dimension tables, but also measures,which are dependent attributes that a user may want to ask the system [11, p. 467].An example of a measure is amount, or sales.
Dimension tables: Contain tuples of attributes that explain an event [9, p.1108-1109].These dimension tables can get huge, having up to 100 attributes in its dimension.Additional sub-tables may also exist to dimension tables (coloured light green in Fig-ure 3), giving it additional attributes. Every dimension table has at least one primarykey to which the fact tables’ foreign keys are joined to. These dimension tables cre-ate the constraints to queries via their attributes. If a user, for example, wants to seesales by brand, a brand must exist as an attribute in a dimension table [10, p. 13,15].Hence, attributes in dimensions are used for filtering and grouping the facts. [10,p. 40]. Attributes can be combined into hierarchies.
Hierarchies: Describes the drill-down paths for users to see more detailed data [13]. Sev-eral hierarchies can exist in a dimension table. A hierarchy can be divided into levelswith more or less detail, where the levels contains more or less precomputed, aggre-gated data. An example of two hierarchies for date are Year-Month-Day and Year-Week-Day [10, p. 48]. We then get that numbers are shown distributed as Years,Months/Weeks, or Days.
2.2.5 OLAP Cubes
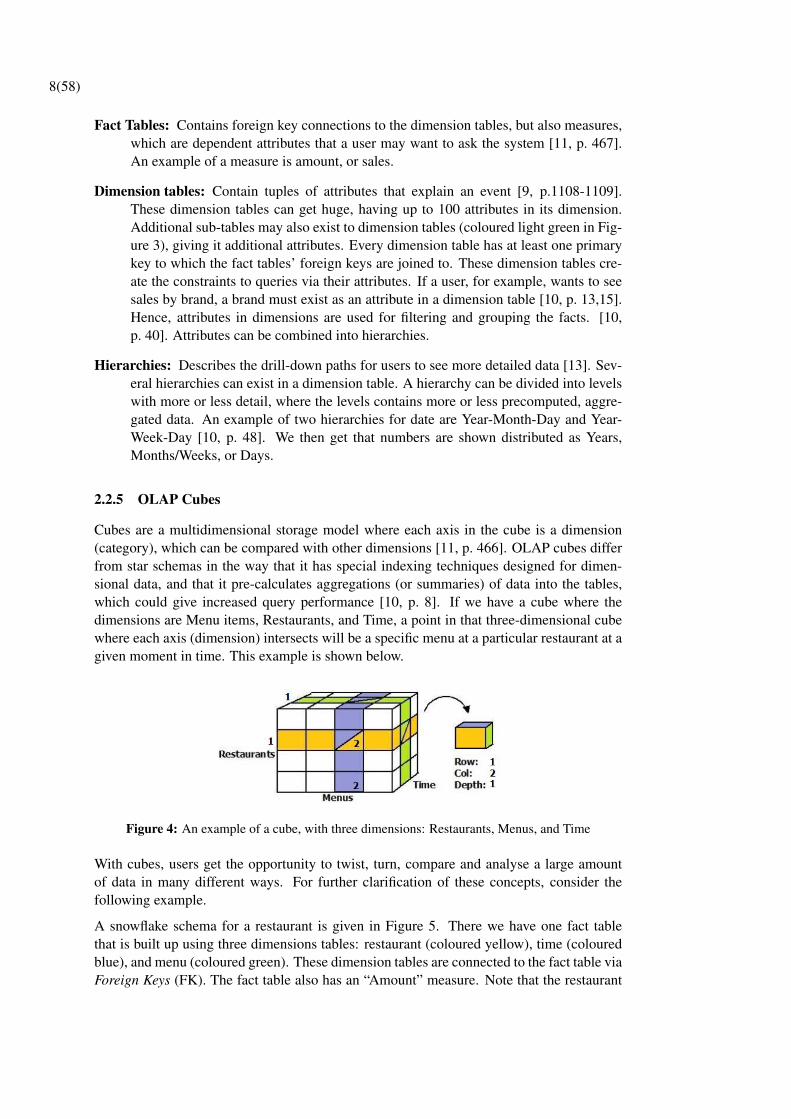
Cubes are a multidimensional storage model where each axis in the cube is a dimension(category), which can be compared with other dimensions [11, p. 466]. OLAP cubes differfrom star schemas in the way that it has special indexing techniques designed for dimen-sional data, and that it pre-calculates aggregations (or summaries) of data into the tables,which could give increased query performance [10, p. 8]. If we have a cube where thedimensions are Menu items, Restaurants, and Time, a point in that three-dimensional cubewhere each axis (dimension) intersects will be a specific menu at a particular restaurant at agiven moment in time. This example is shown below.
Figure 4: An example of a cube, with three dimensions: Restaurants, Menus, and Time
With cubes, users get the opportunity to twist, turn, compare and analyse a large amountof data in many different ways. For further clarification of these concepts, consider thefollowing example.
A snowflake schema for a restaurant is given in Figure 5. There we have one fact tablethat is built up using three dimensions tables: restaurant (coloured yellow), time (colouredblue), and menu (coloured green). These dimension tables are connected to the fact table viaForeign Keys (FK). The fact table also has an “Amount” measure. Note that the restaurant

9(58)
dimension has three hierarchies, while time and menus only have one. Every dimensionhas at least one hierarchy which is a plain list of all tuples. Additional hierarchies as in therestaurant dimension enable that the user could, for example, see how much they have soldof a particular menu item at a specific restaurant on a specific date. One could also limit theshown results by only seeing restaurants of a certain size or from a particular region.
Figure 5: Schema and Cube example.
An example of a cube derived from this snowflake schema is shown in Figure 5. Here itexists entries for three restaurants, three menu items, and three dates. It also has extra rows,columns, and depth. One extra row exists called Total which contains the sum of each soldmenus at all restaurants on each date. Example: on the date 2016-09-21, 2000 pizzas weresold in the Stockholm restaurant, 1000 in Umea, and 3000 in London. Everything sums upto 6000 pizzas in the total row. When the user queries for the total amount of sold pizzas onthat date, the value, which is already precomputed, only has to be fetched from one cell inthe cube.

10(58)
2.2.6 OLAP (Online Analytic Processing)
In short, OLAP is a method for end-users to analyse data [9, p. 1102]. There are severaldifferent variations of OLAP systems where each has pros and cons. The most commonones are MOLAP, ROLAP and HOLAP [1, p. 95-96].
MOLAP: Is a shortage for Multidimensional Online Analytical Processing. This method isbuilt upon the usage of multidimensional data cubes for storage and analysis. Thesecubes contain both raw data and precomputed aggregated data [11, p. 467]. Thisaggregated data could, for example, be the sales for a specific menu item at all restau-rants. The storage medium for cubes is optimised multidimensional arrays [1, p. 96].
ROLAP: Stands for Relational Online Analytical Processing. It has a design for analysisthrough a multidimensional model, but it does not require precomputed data such asaggregations. Instead, When the end-user has a question to the system, an SQL queryis created to directly ask the relational model (i.e. the star-/snowflake schema) foran answer to that question. Using ROLAP gives that less storage of information isneeded. The storage medium for ROLAP is relational databases [1, p. 95-96].
HOLAP: Stands for Hybrid Online Analytical Processing and it is a combination of MO-LAP and ROLAP [1, p. 96].
2.3 Software that Trimma use:
The database structure that Trimma use today is Microsoft’s solution for OLAP cubesnamed SQL Server Analysis Services (SSAS) [14]. Currently, they build the cubes man-ually in Microsoft Visual Studio where the system has a MOLAP structure. When building,they declare the cube definitions, and where and how to extract data, the rest is handledby the Cube engine. Thus, the cube engine deals with how data is stored inside the cube.Possibilities exist, though, for example, to configure the cube engine to select if MOLAP orROLAP should be used, if cubes should be saved on disk or RAM, etc. In this thesis, Wewill only work with cubes that get saved to disk.

11(58)
2.4 Available Tools for Cube Creation and management
After a thorough search for available techniques for a more automatic creation of SSAScubes, these are the tools that were found.
2.4.1 Microsoft API AMO
Microsoft API Analysis Management Object (AMO) is a complete library under the .NETFramework version 2.0 with classes that enables the user to create, modify, and delete Anal-ysis Services objects such as cubes, dimensions, mining structures, and databases. Thewhole library is built on managing an instance of Microsoft Analysis Services [15].
According to Microsoft, their AMO is built for automating repetitive tasks that are usuallyperformed on a weekly, monthly, or quarterly basis, where they even mention as an exampleto automate the creation of cubes [15]. Extra features that AMO have is a cleaning service,where data older than a specified time limit can be set to be removed, some security featuressuch as user permissions, and automatic backup management.
The part of AMO that is used for SSAS cubes is the AMO OLAP Classes, which includesboth the Cube class and the Dimension class. There are also possibilities to use the advancedclasses, for example for creating alert-actions when the user browse parts of the cube, par-ticular views of a single cube, and proactive hashing that helps with the balance betweenMOLAP and ROLAP data storage [16]. The advanced classes might not be interesting forthis thesis, though, only the OLAP classes are of interest.
2.4.2 BIML
BIML stands for Business Intelligence Markup Language and is an XML dialect that han-dles many aspects around Business Intelligence Programming. The primary programminglanguage used in BIML is XML, but code written in C# or VB can also be included intothe BIML code [17]. BIML is created for easier being able to build data warehouses andBusiness Intelligence solutions. The aim, according to Scott Currie [18], is that this soft-ware should eliminate a lot of clicks and drag procedures, to more automate the generationof SQL scripts, SSIS-packages and SSAS cubes.
BIML works in the way that one writes XML based source code, often with the help ofXML code editors. One example of such a code editor is the Varigence’s Mist IDE [19].The BIML compiler should then be able to read the source files and output SQL scripts,SSIS files (DTSX, DTPRO), or SSAS files (cube, dim, dsv). These SSAS files should, lateron, be able to be used with Microsoft SQL server [18].

12(58)

13(58)
3 Approach
Three ways of building database cubes were found. One is doing it manually, as Trimmadoes it today. Two other options are using API AMO or BIML. For this thesis, we will buildtwo Prototypes, where the output of both will be stored on a Microsoft SQL Server 2014.
Prototype A: Will be built using Microsoft API AMO inside Microsoft Visual Studio IDE.This prototype will be more of a direct method where the prototype will communicate withthe SQL server every time an object (i.e. data source, data source view, dimension and cube)is created. This also includes that the objects get processed, which means that the databaseengine fills the objects with data.
Prototype B: Will be constructed using BIML inside the Mist IDE, but Microsoft VisualStudio will still be needed to load the SSAS cube files onto the database server. This willbe more of an indirect method where object configuration is created via BIML code. TheBIML Compiler will output these as SSAS files, which then could be uploaded to the run-time SQL server via Visual Studio.
The prototypes will be constructed to work in the general case taking in only a data ware-house reference, a fact table name, and a reference to where the generated cube should bestored. They will then produce a cube upon this information. The prototypes will have tofollow a few rules which we will describe in this chapter. We will also show what schemasthat will be used as a reference when building the prototypes, together with a checklistspecifying what one should expect from a good cube generation tool.
3.1 Example Schemas
When building the two prototypes, two different schemas will be used as a model. Theseschemas describe the included tables, with a fact table and the relations in between. Wecould see these as two cases, where one is simpler having a star schema structure, and theother is more advanced, having a snowflake schema structure. The advanced schema willenable the opportunity to create a cube with more information and more possibilities togroup data into additional categories.
The prototypes should work for the general cases, not being hard coded for a particularschema relationship. Tables that should be considered included are those who has a foreign-key relationship from a parent table (ex. the fact table has a foreign key to a dimensiontable). Each dimension table (or sub-table) can have from one up to five level columns(L0,L1,L2,L3,L4). These describe data more or less summarised, where in this example,Level four is the most detailed and level zero the most summarised. If a table column hasan additional DisplayName, this should be used for graphically display the content of acolumn. Every dimension will have at least two hierarchies: one where rows are just a plainlist, and one grouped according to the dimension’s level structure.

14(58)
3.1.1 Case 1: A star schema with five dimension tables
The first goal was to make so that the prototypes could be able to read and create cubesbased upon data input of a star schema structure. A figure describing the star schema usedduring the implementation can be seen in the appendix, section A.1, where it had one facttable and five dimension tables.
3.1.2 Case 2: A Snowflake Schema
When the prototype could handle a star schema case, it got extended to also handle asnowflake schema case, where each dimension table could have additional sub-tables. Thesnowflake schema used for the implementation can be seen in the appendix, section A.2. Ithad one fact table and five dimension tables, where two of those dimension tables had twoadditional sub-tables connected to them.
3.2 Prototype Architechtual Design
Both of the prototypes will initially use the same C# code for reading in the internal struc-ture, which is later on needed for building the cube. This internal structure represents theinvolved database diagrams with relations, from the input database. The states that bothprototypes need to go through is:
1. Run the program by giving the input server and database names, the fact table nameto build from, and the name of the server and database to store the final cube in.
2. Call the Schema reader class to create an internal structure of necessary schemas andrelations.
3. Prefetch all necessary schemas that have a connection to the given fact table (includ-ing the fact table itself).
4. Store this together with name references in an internal structure.
5. Return the structure to the main program.
6. Create a cube upon the internal structure, either using the method of prototype A orB.
15(58)
Prototype A:
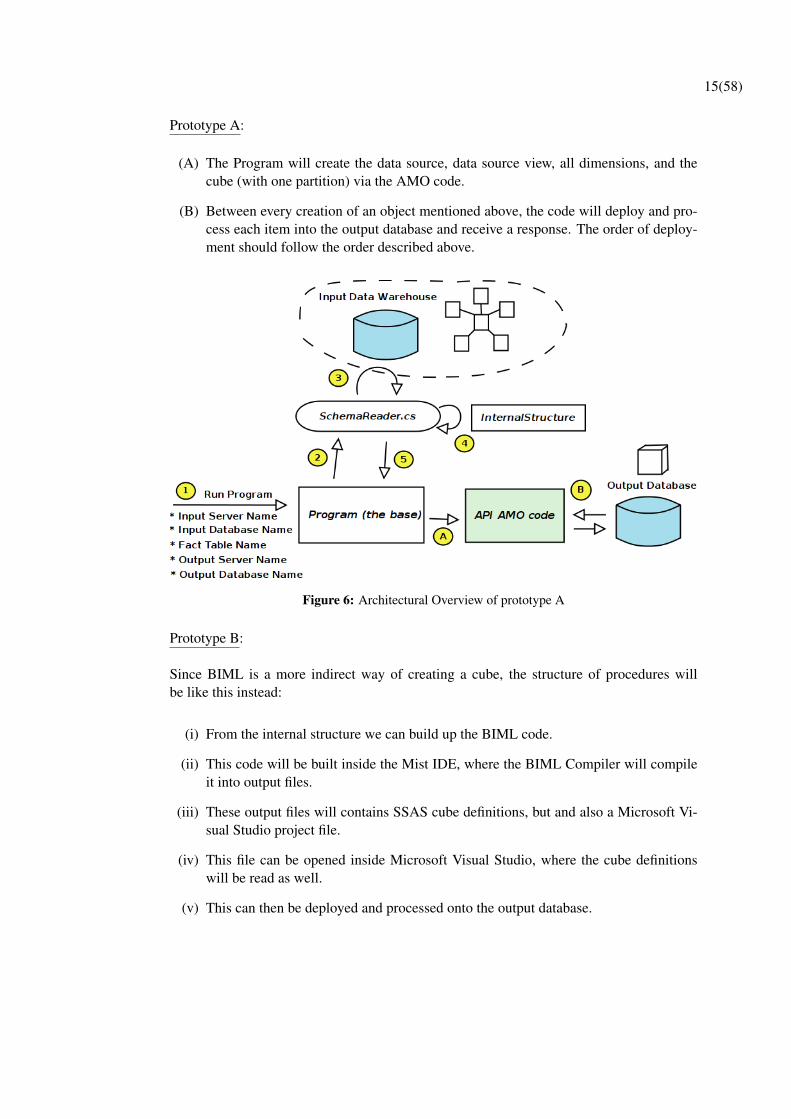
(A) The Program will create the data source, data source view, all dimensions, and thecube (with one partition) via the AMO code.
(B) Between every creation of an object mentioned above, the code will deploy and pro-cess each item into the output database and receive a response. The order of deploy-ment should follow the order described above.
Figure 6: Architectural Overview of prototype A
Prototype B:
Since BIML is a more indirect way of creating a cube, the structure of procedures willbe like this instead:
(i) From the internal structure we can build up the BIML code.
(ii) This code will be built inside the Mist IDE, where the BIML Compiler will compileit into output files.
(iii) These output files will contains SSAS cube definitions, but and also a Microsoft Vi-sual Studio project file.
(iv) This file can be opened inside Microsoft Visual Studio, where the cube definitionswill be read as well.
(v) This can then be deployed and processed onto the output database.

16(58)
Figure 7: Architectural Overview of prototype B

17(58)
3.3 Evaluation Criteria
This subsection describes what expectations one should have on a tool for generating SSAScubes. They are described below together with an explanation on how it will be used lateron in the evaluation chapter to evaluate AMO and BIML.
1. Completeness: It is important that the tool is complete enough so that the generatedcubes look like the ones that would otherwise have been manually built.
This evaluation is measured in two ways. First, a verification will be done so that eachof the two prototypes can handle both schema cases stated in section 3.1. Secondly,We will compare the created cubes by each tool with a manually built cube usingTrimma’s web-client. A couple of test reports will be constructed in their client wherethe internal values of the reports will be compared with the values inside reportsmade from a manually built cube. The values inside the reports should look the samebetween all three cube versions.
2. Usability: It is important that API AMO and BIML code is easy to read and un-derstand, minimising the risk of creating bugs when coding in each code language,but also produce results more quickly. A survey will be made with the employeesof Trimma to evaluate this, where they will read some particular code sections doneboth in AMO and BIML, and answer a few questions about each tool.
3. Documentation and Support: In cases when the understandability is not enoughto perform a particular task in AMO or BIML, it is important that the tool is welldocumented, both in written texts and in web content such as blog forums, etc.
For measuring this, we will count the number of forum threads about cubes for eachtechnique on their main forum websites. Also, to measure the support, we will post aproblem on each of the technique’s forums and send a mail to their support, measuringthe time it takes to get an answer to the problem that helps getting the problem solved.The questioned problem was how one should do to create a relationship betweendimension tables and sub-dimension tables for the data source view (which is thecollection of tables and relationships from the input data warehouse).
4. Maintainability: The tool should be easy to maintain, be modularized and easy toextend.
Heitlager, et-al. describes in their article for measuring Maintainability [20, p. 31-34]it can be measured in several different ways, where they, for example, mention thenumber of code lines (without comments and blank spaces), and Cyclomatic com-plexity per unit. The latter one was in their article done as a percentage risk calcu-lation. We will use these two measure techniques, but the cyclomatic complexity’s“raw” number will be used instead, for comparison between the AMO and BIML pro-totype. A lower Cyclomatic Complexity number is desirable, which leads to easiermaintainability and a lower risk of coding errors [21].

18(58)
5. Development speed: It is important that the tool should be easy to understand and beexpressive so that one can build much code quickly with it.
Specific implementation criteria will be created to measure this, describing when afeature for the prototype is done. When we have completed a feature, we will recordhow much time that was required to reach to that point. This measure will give anindication of how steep the learning curve is for each tool [22]. One should thoughbe aware of that the measurements could be a bit biased since the development of thefirst prototype might help when developing the second prototype.
6. Saved Developer Time: How much time was approximately saved with using a toolfor semi-auto-generating cubes than building them manually?
To get a measure of this, We will measure the time it took to create a program thatgenerates a cube in AMO and BIML, versus the average time it takes for an employeeat Trimma to manually build a cube in Microsoft Visual Studio. The employeesat Trimma that participates in this measurement should have earlier experience ofcreating cubes manually. This will give a result that might say that it took x minutesto make a program for semi-automatic SSAS cube creation, and it takes n minutes tocreate a cube manually every time in average.
7. License costs: A small but still existing factor with the choice of technique is if thereare any license costs to use the tool. If a license cost exists, how much is it?
19(58)
4 Implementation
This chapter is about similarities and differences between AMO and BIML. First, generalobservations are presented, followed by the relevant, significant parts when building a cube.We will present these in the order that they were implemented when the two prototypes werebuilt. Note though that the code samples only show the things that worked for both AMOand BIML. The inspiration for this comes from the implementation of the two prototypes,but also from Microsoft’s AMO articles [23] [24], and Weissman’s BIML SSAS article [25],which has been an inspiration source during the implementation as well.
4.1 General
The general similarities and differences between BIML and API AMO are:
4.1.1 Programming language
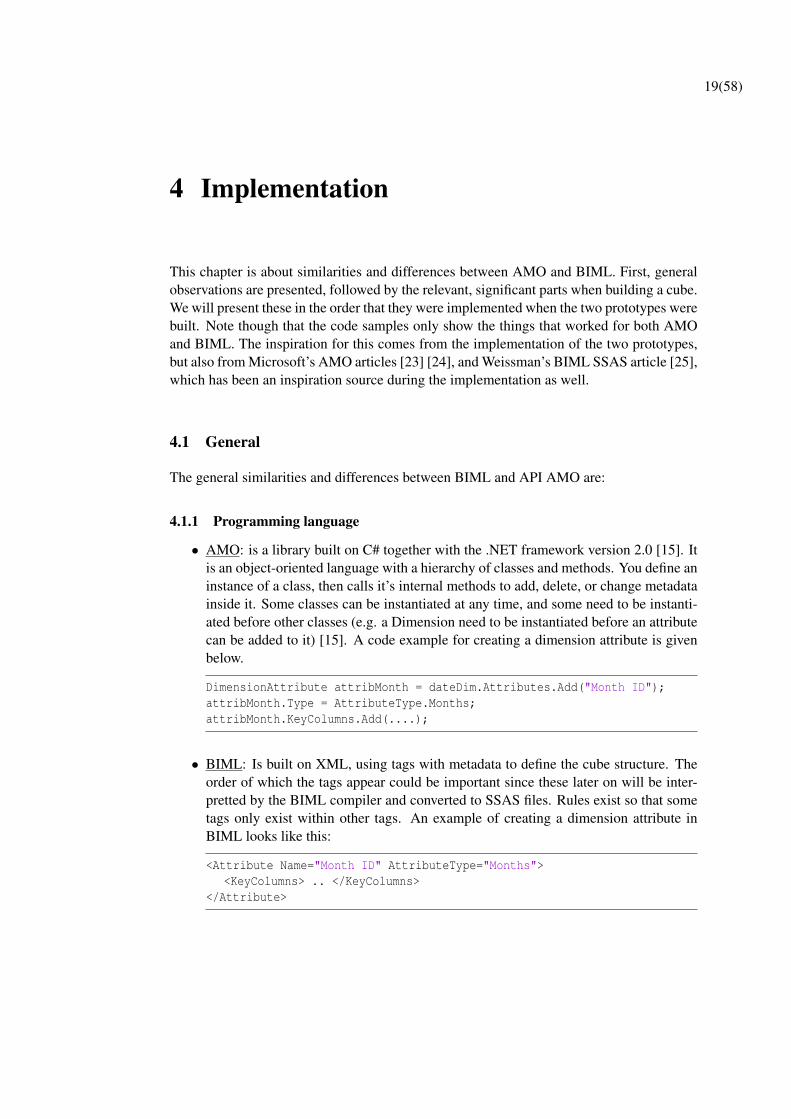
• AMO: is a library built on C# together with the .NET framework version 2.0 [15]. Itis an object-oriented language with a hierarchy of classes and methods. You define aninstance of a class, then calls it’s internal methods to add, delete, or change metadatainside it. Some classes can be instantiated at any time, and some need to be instanti-ated before other classes (e.g. a Dimension need to be instantiated before an attributecan be added to it) [15]. A code example for creating a dimension attribute is givenbelow.
DimensionAttribute attribMonth = dateDim.Attributes.Add("Month ID");attribMonth.Type = AttributeType.Months;attribMonth.KeyColumns.Add(....);
• BIML: Is built on XML, using tags with metadata to define the cube structure. Theorder of which the tags appear could be important since these later on will be inter-pretted by the BIML compiler and converted to SSAS files. Rules exist so that sometags only exist within other tags. An example of creating a dimension attribute inBIML looks like this:
<Attribute Name="Month ID" AttributeType="Months"><KeyColumns> .. </KeyColumns>
</Attribute>

20(58)
BIML have a feature of including C# or VB code inside BIML code [26]. Thisenables one to avoid repeating code sections. This code can be inserted in betweenthe symbols:
<# ... #>
If we had several attributes in a dimension, the code could look like this:
<# foreach (Attribute attrib in attribList){ #><Attribute Name="<#=attrib.name()#>" AttributeType="Months">
<KeyColumns> .. </KeyColumns></Attribute>
<# } #>
4.1.2 Input Handling
• AMO: In C# (that is used in AMO) it is possible to build a program that can take inputparameters when it starts to run. It is also possible to get data from other sources, us-ing existing C# libraries. One example tested in the AMO prototype was Microsoft’sSQL Server Management Objects (SMO) [27], which was used for reading in aninternal representation of the required database tables with relations.
• BIML: Since BIML can include C# and VB code, it makes it possible to include codelibraries written in those languages. This is a good feature since you can reuse alreadywritten code. For example, this made it possible to reuse the SMO code for reading inthe internal representation which we used in the AMO prototype. BIML can also takeinput from other sources, for example relational databases[28]. However, it seemslike BIML is unable to take program start parameters. It is possible to send parametersbetween BIML code files, even read from separate files, but running the main BIMLscript with input parameters seems not to be supported (like the C#’s ”Main(string[]args)”). Hence, in BIML one can include C# or VB code, but it does not seem tosupport making it the other way around, i.e. including BIML code inside existing C#or VB code.
4.1.3 Output Handling
• AMO: Communicates directly with the database, where the cube and its parts willbe stored. It also has the feature to make the OLAP cube engine to process theobject (dimension, cube), i.e. making the OLAP engine to extract data from the datawarehouse to fill the object with data.
• BIML: is a more indirect method. You declare the cube structure (with internalproperties) in BIML code. Then the BIML compiler in the Mist IDE builds SSASoutput files from the code, including a visual studio project file. From this visualstudio project file, you can inspect the result, deploy the cube onto a database andprocess it (i.e. filling the cube with values). This process of deploying the cube wasdone manually through out the thesis.
21(58)
4.2 Creating a data source view
A data source view represents selected objects (such as tables with relations) from an inputdata source (in our case, the data warehouse). These are used when creating dimensions,cubes, and mining structures [29]. When creating a SSAS cube using either AMO or BIML,a data source with a data source view is needed. The ways that AMO and BIML do this isa bit different compared to each other.
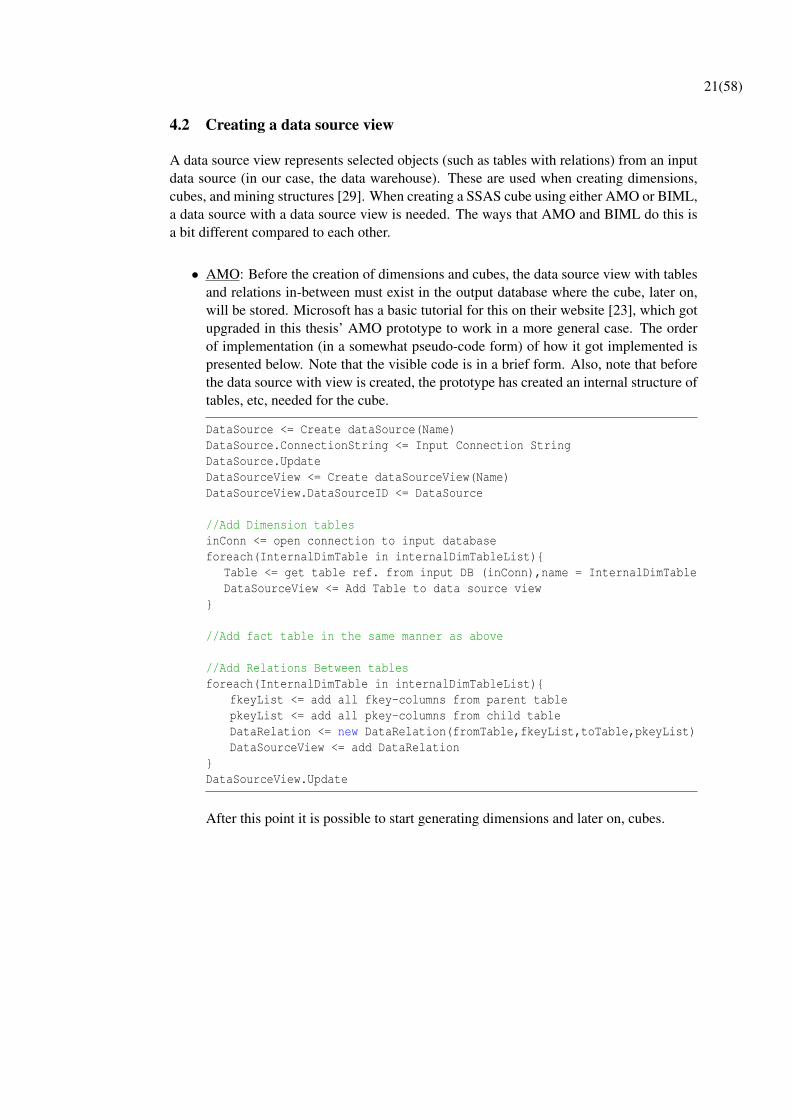
• AMO: Before the creation of dimensions and cubes, the data source view with tablesand relations in-between must exist in the output database where the cube, later on,will be stored. Microsoft has a basic tutorial for this on their website [23], which gotupgraded in this thesis’ AMO prototype to work in a more general case. The orderof implementation (in a somewhat pseudo-code form) of how it got implemented ispresented below. Note that the visible code is in a brief form. Also, note that beforethe data source with view is created, the prototype has created an internal structure oftables, etc, needed for the cube.
DataSource <= Create dataSource(Name)DataSource.ConnectionString <= Input Connection StringDataSource.UpdateDataSourceView <= Create dataSourceView(Name)DataSourceView.DataSourceID <= DataSource
//Add Dimension tablesinConn <= open connection to input databaseforeach(InternalDimTable in internalDimTableList){
Table <= get table ref. from input DB (inConn),name = InternalDimTableDataSourceView <= Add Table to data source view
}
//Add fact table in the same manner as above
//Add Relations Between tablesforeach(InternalDimTable in internalDimTableList){
fkeyList <= add all fkey-columns from parent tablepkeyList <= add all pkey-columns from child tableDataRelation <= new DataRelation(fromTable,fkeyList,toTable,pkeyList)DataSourceView <= add DataRelation
}DataSourceView.Update
After this point it is possible to start generating dimensions and later on, cubes.
22(58)
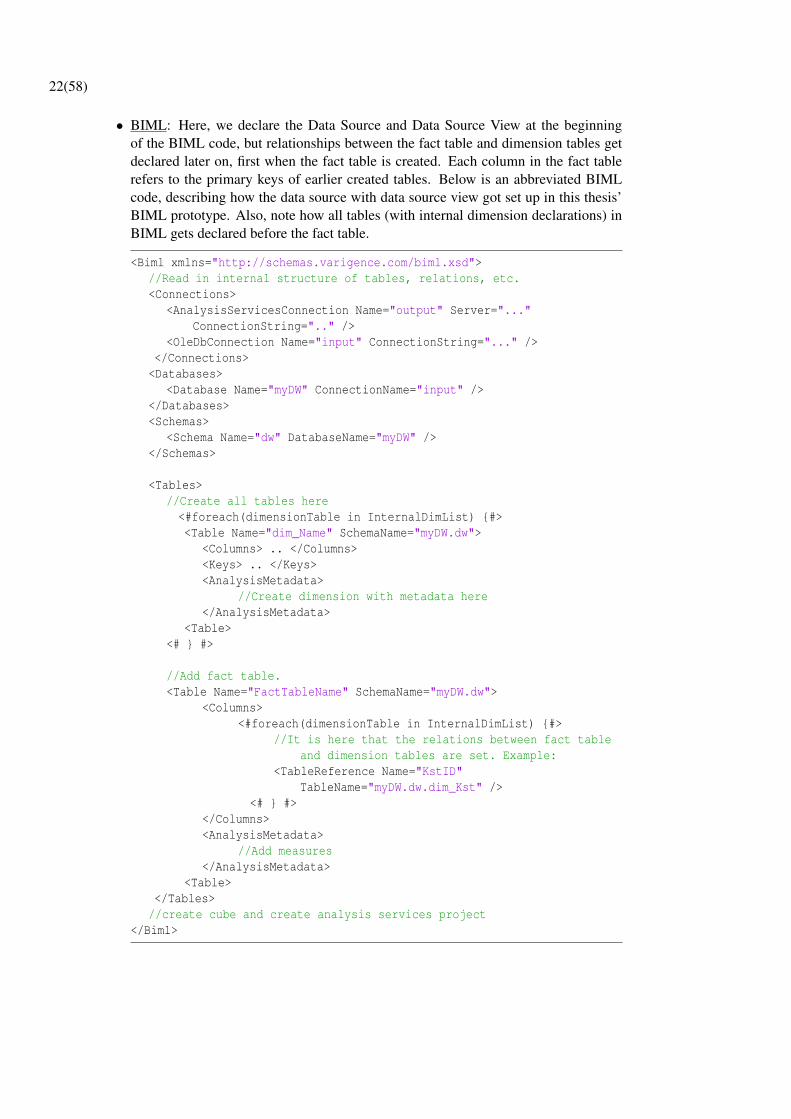
• BIML: Here, we declare the Data Source and Data Source View at the beginningof the BIML code, but relationships between the fact table and dimension tables getdeclared later on, first when the fact table is created. Each column in the fact tablerefers to the primary keys of earlier created tables. Below is an abbreviated BIMLcode, describing how the data source with data source view got set up in this thesis’BIML prototype. Also, note how all tables (with internal dimension declarations) inBIML gets declared before the fact table.
<Biml xmlns="http://schemas.varigence.com/biml.xsd">//Read in internal structure of tables, relations, etc.<Connections>
<AnalysisServicesConnection Name="output" Server="..."ConnectionString=".." />
<OleDbConnection Name="input" ConnectionString="..." /></Connections><Databases>
<Database Name="myDW" ConnectionName="input" /></Databases><Schemas>
<Schema Name="dw" DatabaseName="myDW" /></Schemas>
<Tables>//Create all tables here<#foreach(dimensionTable in InternalDimList) {#><Table Name="dim_Name" SchemaName="myDW.dw">
<Columns> .. </Columns><Keys> .. </Keys><AnalysisMetadata>
//Create dimension with metadata here</AnalysisMetadata>
<Table><# } #>
//Add fact table.<Table Name="FactTableName" SchemaName="myDW.dw">
<Columns><#foreach(dimensionTable in InternalDimList) {#>
//It is here that the relations between fact tableand dimension tables are set. Example:
<TableReference Name="KstID"TableName="myDW.dw.dim_Kst" />
<# } #></Columns><AnalysisMetadata>
//Add measures</AnalysisMetadata>
<Table></Tables>//create cube and create analysis services project
</Biml>
23(58)
4.3 Creating a dimension
The generation of dimensions is needed for later on being able to build a cube upon these.During the development of each prototype, the goal was to make the code general so thatit could handle the creation of multiple dimensions with varying content (attributes, hierar-chies, etc.). Due to the different characteristics of BIML and AMO, the code has similaritiesbut also differences. The code presented here is very brief. This to better point out the keysimilarities and differences. This subsection will be divided into three pieces to better beable to compare AMO with BIML.
4.3.1 Step 1: New empty dimension
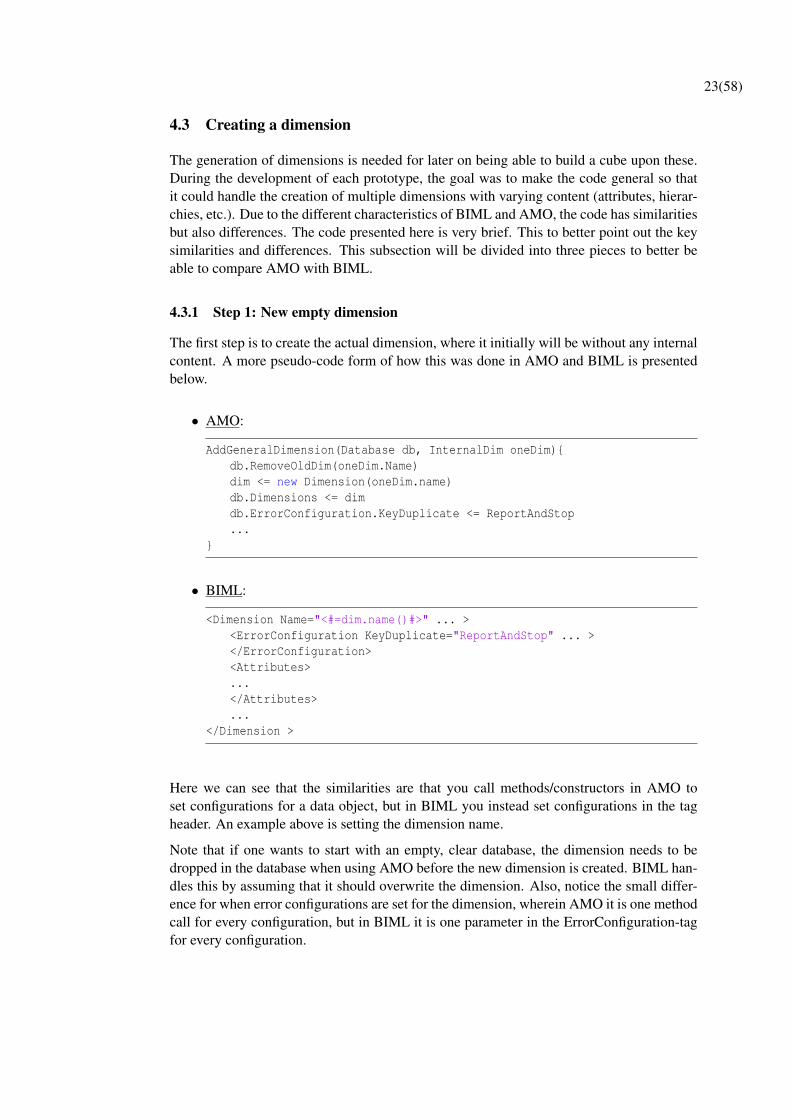
The first step is to create the actual dimension, where it initially will be without any internalcontent. A more pseudo-code form of how this was done in AMO and BIML is presentedbelow.
• AMO:
AddGeneralDimension(Database db, InternalDim oneDim){db.RemoveOldDim(oneDim.Name)dim <= new Dimension(oneDim.name)db.Dimensions <= dimdb.ErrorConfiguration.KeyDuplicate <= ReportAndStop...
}
• BIML:
<Dimension Name="<#=dim.name()#>" ... ><ErrorConfiguration KeyDuplicate="ReportAndStop" ... ></ErrorConfiguration><Attributes>...</Attributes>...
</Dimension >
Here we can see that the similarities are that you call methods/constructors in AMO toset configurations for a data object, but in BIML you instead set configurations in the tagheader. An example above is setting the dimension name.
Note that if one wants to start with an empty, clear database, the dimension needs to bedropped in the database when using AMO before the new dimension is created. BIML han-dles this by assuming that it should overwrite the dimension. Also, notice the small differ-ence for when error configurations are set for the dimension, wherein AMO it is one methodcall for every configuration, but in BIML it is one parameter in the ErrorConfiguration-tagfor every configuration.
24(58)
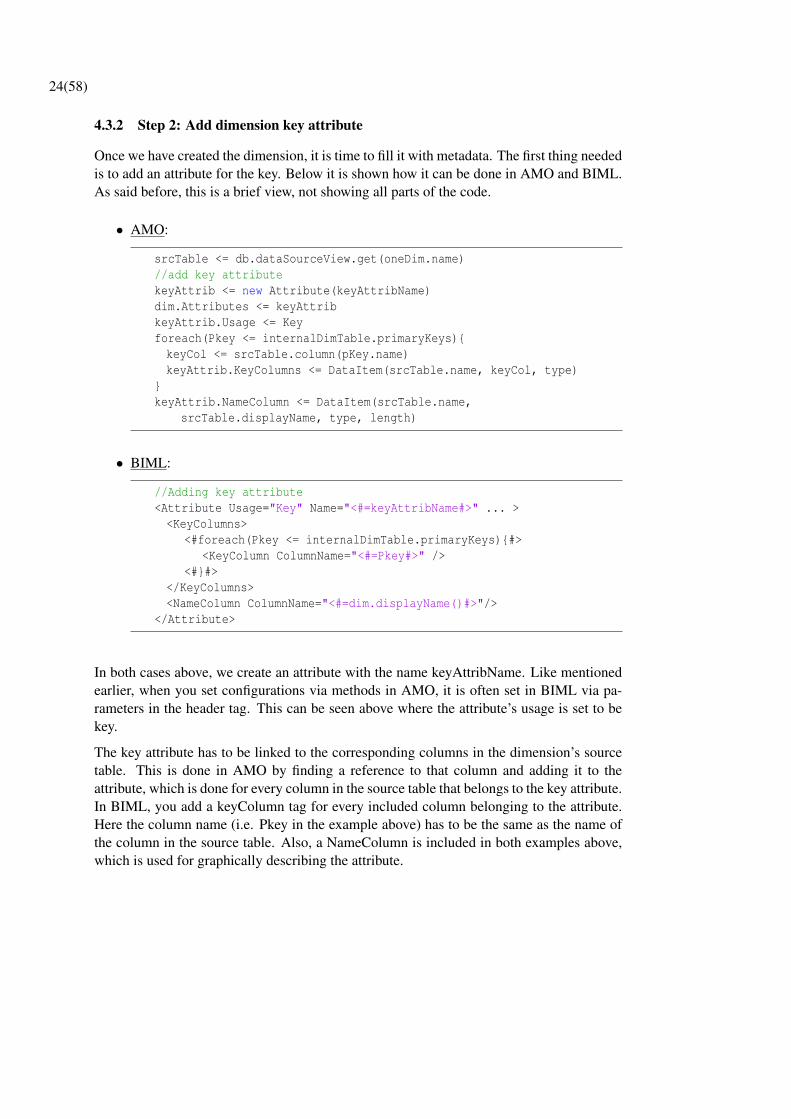
4.3.2 Step 2: Add dimension key attribute
Once we have created the dimension, it is time to fill it with metadata. The first thing neededis to add an attribute for the key. Below it is shown how it can be done in AMO and BIML.As said before, this is a brief view, not showing all parts of the code.
• AMO:
srcTable <= db.dataSourceView.get(oneDim.name)//add key attributekeyAttrib <= new Attribute(keyAttribName)dim.Attributes <= keyAttribkeyAttrib.Usage <= Keyforeach(Pkey <= internalDimTable.primaryKeys){keyCol <= srcTable.column(pKey.name)keyAttrib.KeyColumns <= DataItem(srcTable.name, keyCol, type)
}keyAttrib.NameColumn <= DataItem(srcTable.name,
srcTable.displayName, type, length)
• BIML:
//Adding key attribute<Attribute Usage="Key" Name="<#=keyAttribName#>" ... ><KeyColumns>
<#foreach(Pkey <= internalDimTable.primaryKeys){#><KeyColumn ColumnName="<#=Pkey#>" />
<#}#></KeyColumns><NameColumn ColumnName="<#=dim.displayName()#>"/>
</Attribute>
In both cases above, we create an attribute with the name keyAttribName. Like mentionedearlier, when you set configurations via methods in AMO, it is often set in BIML via pa-rameters in the header tag. This can be seen above where the attribute’s usage is set to bekey.
The key attribute has to be linked to the corresponding columns in the dimension’s sourcetable. This is done in AMO by finding a reference to that column and adding it to theattribute, which is done for every column in the source table that belongs to the key attribute.In BIML, you add a keyColumn tag for every included column belonging to the attribute.Here the column name (i.e. Pkey in the example above) has to be the same as the name ofthe column in the source table. Also, a NameColumn is included in both examples above,which is used for graphically describing the attribute.

25(58)
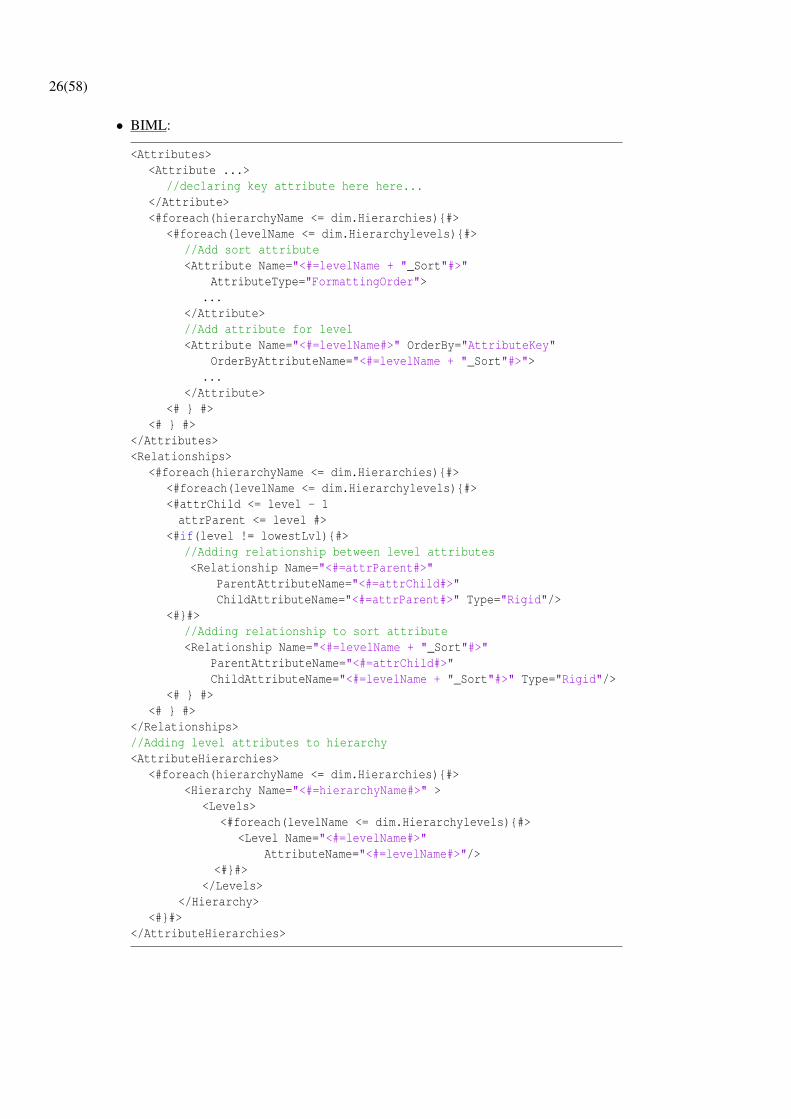
4.3.3 Step 3: Add dimension hierarchy level attributes
When the dimension exists with an internal key attribute, it is time to fill it with additionalcontent. In this thesis’ prototypes, the following part was implemented to go through allpredefined hierarchies and levels, creating two attributes for each level (one for describinghow data should be sorted in that level, and one for containing the actual level data). Theseattributes get added as levels to a hierarchy, where relationships between them are set. Abrief version for AMO and BIML is shown below (leaving out repeated parts with dots).
• AMO:
//Let oneDim be the internal representation of a dimension table//add attributes for all hierarchies and hierarchy levelsforeach(hierarchyName <= oneDim.Hierarchies){
hierarchy <= new hierarchy(hierarchyName)dim.Hierarchies <= hierarchyforeach(levelName <= oneDim.Hierarchylevels){
//add sort attribute the same way as described earlier.sortAttrib <= new Attribute(levelName + "_sort")dim.Attributes <= sortAttribsortAttrib.Type <= FormattingOrder...
//add attribute for level, the same way as described earlier.lvlAttrib <= new Attribute(levelName)lvlAttrib.Usage <= RegularlvlAttrib.OrderBy <= AttributeKeylvlAttrib.OrderByAttributeID <= sortAttrib...
//add relationship between level attributesif(level != lowestLvl){
lvlAttrib.Relationships <= Previous_attrib}//add relationship to sort attributelvlAttrib.Relationships <= sortAttrib
//adding level to hierarchyLevel <= new Level(levelName)level.SourceAttribute <= lvlAttribhierarchy.levels <= level
Previous_attrib <= lvlAttrib}
}dim.Update
26(58)
• BIML:
<Attributes><Attribute ...>
//declaring key attribute here here...</Attribute><#foreach(hierarchyName <= dim.Hierarchies){#>
<#foreach(levelName <= dim.Hierarchylevels){#>//Add sort attribute<Attribute Name="<#=levelName + "_Sort"#>"
AttributeType="FormattingOrder">...
</Attribute>//Add attribute for level<Attribute Name="<#=levelName#>" OrderBy="AttributeKey"
OrderByAttributeName="<#=levelName + "_Sort"#>">...
</Attribute><# } #>
<# } #></Attributes><Relationships>
<#foreach(hierarchyName <= dim.Hierarchies){#><#foreach(levelName <= dim.Hierarchylevels){#><#attrChild <= level - 1attrParent <= level #>
<#if(level != lowestLvl){#>//Adding relationship between level attributes<Relationship Name="<#=attrParent#>"
ParentAttributeName="<#=attrChild#>"ChildAttributeName="<#=attrParent#>" Type="Rigid"/>
<#}#>//Adding relationship to sort attribute<Relationship Name="<#=levelName + "_Sort"#>"
ParentAttributeName="<#=attrChild#>"ChildAttributeName="<#=levelName + "_Sort"#>" Type="Rigid"/>
<# } #><# } #>
</Relationships>//Adding level attributes to hierarchy<AttributeHierarchies>
<#foreach(hierarchyName <= dim.Hierarchies){#><Hierarchy Name="<#=hierarchyName#>" >
<Levels><#foreach(levelName <= dim.Hierarchylevels){#>
<Level Name="<#=levelName#>"AttributeName="<#=levelName#>"/>
<#}#></Levels>
</Hierarchy><#}#>
</AttributeHierarchies>

27(58)
After this point, we have a dimension created in AMO or BIML.
As said before, there are similarities in the sense that when AMO uses methods to setconfigurations, BIML often uses parameters in the header tags. Here it can be seen forexample when we set the attribute usage and sorting order for the level attribute. The sortingorder in both AMO and BIML support an ordering defined by a separate sort attribute, wherethat attribute is created before the level attribute (as implemented above). This enablesone to create a specific column describing the ordering of level values already in the datawarehouse tables. Also, the way of connecting each attribute in relationships are similar,where each level attribute gets connected in descending order, and also gets connected to itssort attribute.
The major difference one can see is that there are more loops required in the BIML imple-mentation compared to AMO. The creation of hierarchies, levels, and attributes could beplaced inside the same loop for AMO, but in BIML this could not be done. This is becauseBIML declares it’s attributes, relationships, and attributeHierarchies individually, separatedby tags (example, attribute gets declared inside the ”Attributes”-tag, then relationships areset in the ”Relationships”-tag).
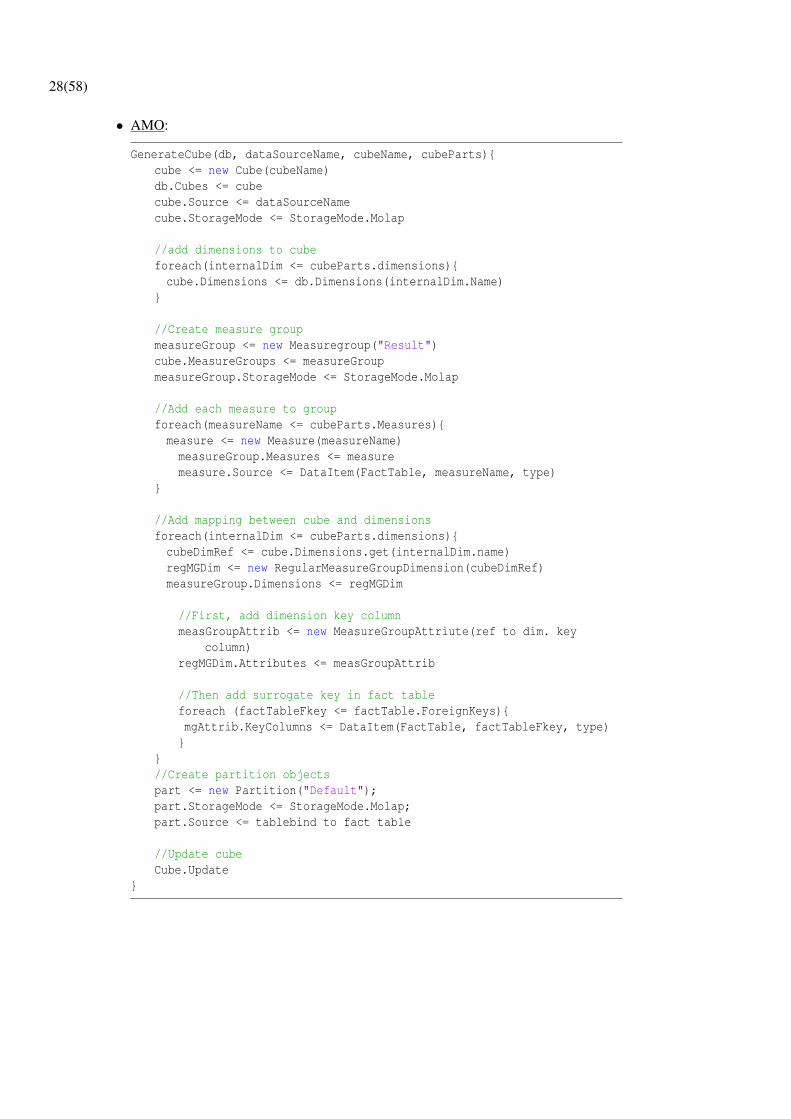
4.4 Creating a cube
When we have declared the dimensions with internal attributes, hierarchies, and levels, wecan build a cube upon these. The way that AMO and BIML do this is quite similar. Howthis got implemented in the two prototypes is shown on the next two pages, in a brief, morepseudo-like form.
28(58)
• AMO:
GenerateCube(db, dataSourceName, cubeName, cubeParts){cube <= new Cube(cubeName)db.Cubes <= cubecube.Source <= dataSourceNamecube.StorageMode <= StorageMode.Molap
//add dimensions to cubeforeach(internalDim <= cubeParts.dimensions){cube.Dimensions <= db.Dimensions(internalDim.Name)
}
//Create measure groupmeasureGroup <= new Measuregroup("Result")cube.MeasureGroups <= measureGroupmeasureGroup.StorageMode <= StorageMode.Molap
//Add each measure to groupforeach(measureName <= cubeParts.Measures){measure <= new Measure(measureName)measureGroup.Measures <= measuremeasure.Source <= DataItem(FactTable, measureName, type)
}
//Add mapping between cube and dimensionsforeach(internalDim <= cubeParts.dimensions){cubeDimRef <= cube.Dimensions.get(internalDim.name)regMGDim <= new RegularMeasureGroupDimension(cubeDimRef)measureGroup.Dimensions <= regMGDim
//First, add dimension key columnmeasGroupAttrib <= new MeasureGroupAttriute(ref to dim. key
column)regMGDim.Attributes <= measGroupAttrib
//Then add surrogate key in fact tableforeach (factTableFkey <= factTable.ForeignKeys){mgAttrib.KeyColumns <= DataItem(FactTable, factTableFkey, type)}
}//Create partition objectspart <= new Partition("Default");part.StorageMode <= StorageMode.Molap;part.Source <= tablebind to fact table
//Update cubeCube.Update
}

29(58)
• BIML:
<Cubes><Cube Name="CubeName" ConnectionName="theCubeConn">
<CubeMeasureGroups><CubeMeasureGroup Name="Result" FactName="FactTableName">
//Add dimensions to cube<CubeDimensionBindings>
<#foreach(internalDim <= cubeParts.dimensions){#><CubeDimensionBinding
CubeDimensionName="<#=dim.Name#>"FactColumnName="<#=dim.Name#>" />
<#}#></CubeDimensionBindings><Partitions>
<Partition Name="Default"><DsvTableSource ConnectionName="Conn"
TableName="<#=FactTableName#>" /></Partition>
</Partitions></CubeMeasureGroup>
</CubeMeasureGroups><CubeDimensions>
<#foreach(internalDim <= cubeParts.dimensions){#><CubeDimension Name="<#=dim.Name#>"
DimensionName="<#=internalDim.Name#>" /><#}#>
</CubeDimensions></Cube>
</Cubes>
Here there are some similar patterns of how the cube gets created, but still, differ-ences exist. In AMO and BIML, We first create a cube and add the earlier createddimensions to it. In the example above for BIML, the measureGroup was createdbefore adding the cubeDimensions, but it could as well have been done the other wayaround.
A measure group is also created in both AMO and BIML. The measure group con-tains the measures that existed in the fact table (in the prototype implementation itwas amount and number). In both versions there are similarities. The measure group(with measures) gets created, and a declaration is done for what dimensions that areincluded in that measure group, and how the relation is between each included di-mension and the fact table. Also, a partition is made for the cube, which is given thename ”Default”.
After this, we have created the Cube. However, in BIML you have left to create ananalysis services project and add all dimensions and cube to it. This code sample isshown on the next page. If we build the code using the Mist IDE, the BIML compilerwill create SSAS cube output files from this, together with a visual studio project file,which could be used to deploy the cube and process it (fill it with data).

30(58)
BIML - Create Cube project:
<CubeProject Name="BimlCubeProj"><Connections>
<Connection ConnectionName="outConnName"></Connection></Connections><Dimensions>
<#foreach(DimensionPart oneDim in theCubeParts.getAllDimensions()){#><#dimName = "BIML_DB.dw." + oneDim.getDimName() + "." +
oneDim.getDimName().Substring(4);#><Dimension DimensionName="<#=dimName#>"></Dimension>
<#}#></Dimensions><Cubes>
<Cube CubeName="<#=cubeName#>"></Cube></Cubes>
</CubeProject>
31(58)
5 Evaluation
The evaluation of the two prototypes is performed according to the criteria of Chapter 3.3.
5.1 Completeness
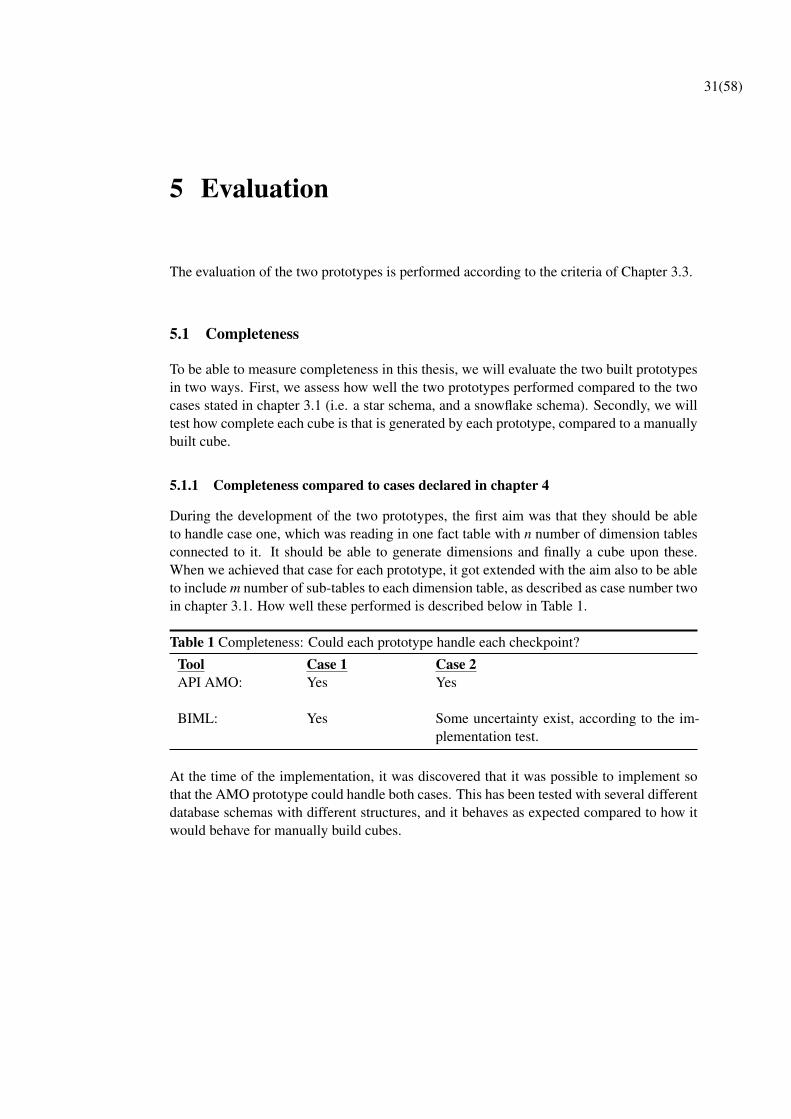
To be able to measure completeness in this thesis, we will evaluate the two built prototypesin two ways. First, we assess how well the two prototypes performed compared to the twocases stated in chapter 3.1 (i.e. a star schema, and a snowflake schema). Secondly, we willtest how complete each cube is that is generated by each prototype, compared to a manuallybuilt cube.
5.1.1 Completeness compared to cases declared in chapter 4
During the development of the two prototypes, the first aim was that they should be ableto handle case one, which was reading in one fact table with n number of dimension tablesconnected to it. It should be able to generate dimensions and finally a cube upon these.When we achieved that case for each prototype, it got extended with the aim also to be ableto include m number of sub-tables to each dimension table, as described as case number twoin chapter 3.1. How well these performed is described below in Table 1.
Table 1 Completeness: Could each prototype handle each checkpoint?
Tool Case 1 Case 2API AMO: Yes Yes
BIML: Yes Some uncertainty exist, according to the im-plementation test.
At the time of the implementation, it was discovered that it was possible to implement sothat the AMO prototype could handle both cases. This has been tested with several differentdatabase schemas with different structures, and it behaves as expected compared to how itwould behave for manually build cubes.

32(58)
According to the implementation of the BIML prototype, it was successfully possible tohandle the case of checkpoint one, with one fact table and n dimension tables. However,some problems appeared when trying to extend it to also include m sub-tables to dimensiontables and make them hierarchies. The problem exists in adding all tables and their relationsto the data source view. It was possible to insert all the tables in the data source view, butadding relations to sub-tables from the dimension tables were problematic. The BIMLcompiler gives no error when it is performed as described in the code snippet below, butwhen opening the generated SSAS files in Microsoft Visual Studio, the Data source viewwas broken.
The same way to how the relations were added to the fact table and the dimension table,was tested between the dimension tables and dimension sub-tables. The code tested lookedbriefly as follows, abstracting away loops, showing only the case where one sub-table existto one dimension table:
//First the sub-table was added<Table Name="SubTableName" SchemaName="myDW.dw">
<Columns>...
</Columns><Keys>
<PrimaryKey Name="PK_keyID">...
</PrimaryKey></Keys>
</Table>//Then the dimension table was added<Table Name="dimName" SchemaName="myDW.dw">
<Columns>//Referense to sub-table created above<TableReference Name="<#=FKeyColumnInDimTable#>"
TableName="<#=myDW.dw.SubTableName#>" />...
</Columns><Keys>
<PrimaryKey Name="<#=PK_DimKeyID#>">...
</PrimaryKey></Keys>...
</Table>
This way of creating a relation worked between a fact table and dimension tables, but notbetween dimension tables and sub-dimension tables. We did not find an answer to how thisshould be done. A thorough search on the internet, together with posting the problem onVarigence’s forum and emailing their support about this, was done to find an answer to howthis could be solved.
33(58)
Another BIML tag that was tested was the MultipleColumnTableReference, for referencingmultiple rows in a key. It looks as follows:
<MultipleColumnTableReference Name="FKDimCol_1"ForeignColumnName="subTableCol_1"MultipleColumnTableReferenceGroupName="keyGroup1" />
<MultipleColumnTableReference Name="FKDimCol_2"ForeignColumnName="subTableCol_2"MultipleColumnTableReferenceGroupName="keyGroup1" />
But this did not give a good result either for our problem case.
5.1.2 Completeness compared to manually built cubes
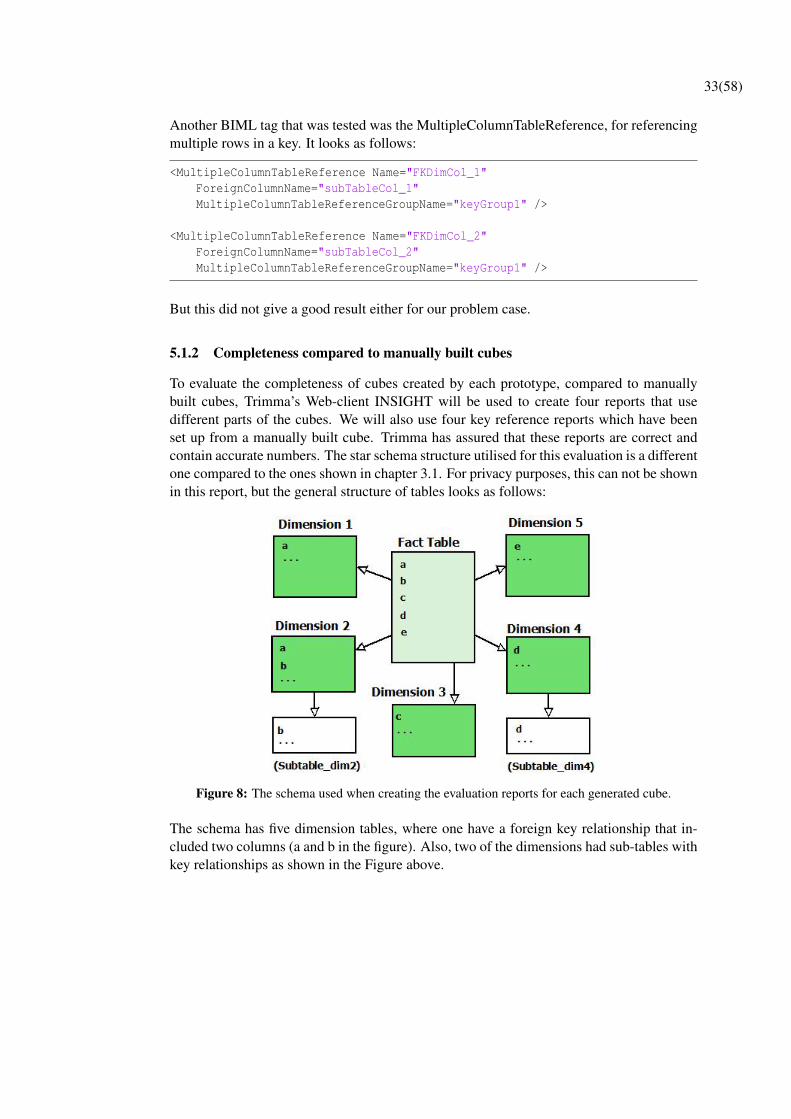
To evaluate the completeness of cubes created by each prototype, compared to manuallybuilt cubes, Trimma’s Web-client INSIGHT will be used to create four reports that usedifferent parts of the cubes. We will also use four key reference reports which have beenset up from a manually built cube. Trimma has assured that these reports are correct andcontain accurate numbers. The star schema structure utilised for this evaluation is a differentone compared to the ones shown in chapter 3.1. For privacy purposes, this can not be shownin this report, but the general structure of tables looks as follows:
Figure 8: The schema used when creating the evaluation reports for each generated cube.
The schema has five dimension tables, where one have a foreign key relationship that in-cluded two columns (a and b in the figure). Also, two of the dimensions had sub-tables withkey relationships as shown in the Figure above.

34(58)
For this evaluation, the same reports will be constructed as the key reference reports butbased on the cubes made in the AMO, and BIML. These reports with its internal numberswill be compared with the numbers of the key reference reports. If the numbers inside allthe reports are the same, then AMO and BIML can be concluded to be complete in this case.For minimising the possible error from evaluating the reports manually, the reports will bebuilt in the INSIGHT client, downloaded as Excel files, and make Microsoft Excel checkfor differences between the Excel sheets.
The result from the completeness evaluation for each report is shown below in Table 2below. Note that the fourth report requires that the cube contains sub-tables as well. Hencethat report could not be tested for BIML.
Table 2 Completeness for each report case, compared with a manually built cube
Tool Report 1 Report 2 Report 3 Report 4AMO: Correct Correct Correct Correct
BIML: Correct Unknown Correct Unknown
Here we can see that AMO could create all of the four reports and the internal numberswere correct compared to the manually built reports. Some uncertainty exists though withBIML. We knew since before that during the implementation part of this thesis, we wereunable to make the BIML prototype to include sub-tables. Hence, that is why report fourwas not possible to create for BIML.
However, Report two was not possible to be built with the BIML prototype either. This isbecause that report used a dimension with a key relationship that included two columns (aand b in Figure 8). With the BIML prototype, We were not able to create the key relationshipbetween the fact table and dimension tables for this case. The things that were tested to solvethis were:
• Used the BIML tag:
<TableReference Name="<#=FKeyColumnInDimTable#>"TableName="<#=myDW.dw.SubTableName#>" />
This gave an error saying that the TableReference tag is for key relationships withonly one column, and that multipleColumnTableReference should be used instead.
• Changed to use the MultipleColumnTableReference-tag everywhere where a foreignkey had several columns to it. Otherwise, the TableReference tag was used. This leadto an error, saying that a column name exists at several places in the BIML code. Itgave this since column a (see Figure 8) is a part of two separate key relationships andtherefore exist as two tags in the BIML code.

35(58)
• Each column that belongs to several key relationships was given a unique name. Thiscompiled in the Mist IDE but gave too many columns in the fact table, and the createdcube gave errors. We want to strive to have one column that can belong to several keyrelationships.
• Tried to make one MultipleColumnTableReference tag for each column in the facttable, with several internal tags stating each relationship. This failed since no possibletags were found that fits inside the MultipleColumnTableReference tag.
• Make all column relationships to be MultipleColumnTableReferences. This alsofailed, giving the same error as before that a column name is repeated in the code.
Although much effort was made to try to solve this for this for the thesis’ BIML prototype,including searching for help from external sources on the internet, no answer was found.
5.2 Usability
To be able to measure the readability and understandability of AMO and BIML code, a sur-vey was performed on the employees of Trimma. The study had four code examples: twofor AMO and two for BIML. The examples were made as general as possible not to be codespecific to what was done in this thesis’ prototypes. Those performed the similar action,but in their code language. The actions were: adding a key attribute and adding a hierarchywith levels. After each code sample, a few questions existed with the aim of measuring thereadability and understandability of each sample.
Among the staff that answered this survey, nine out of fourteen had previous experienceof database cubes, dimensions, etc. This experience is from building cubes manually in Vi-sual Studio and not via AMO or BIML. The numbers presented in the following diagramsincludes all staff members that answered the questions. In the survey, the order of presen-tation in the first part was: first AMO, then BIML. In the second part, We switched so thatthe BIML code sample came first, before AMO.

36(58)
Amount of persons participating in the survey: 14.
5.2.1 Understandability
Two questions existed to measure the understandability of AMO and BIML. The partici-pants were asked to look at each code example, and answer if it was easy to understand, andalso describe what the code sample was all about. The question and results of these are de-scribed below. The numbers inside the parenthesis describe how many survey participantsthat mentioned that they had prior knowledge of dimensions, cubes, etc. (this knowledgethough is from creating them manually). A deeper description showing how the surveylooked like can be seen in the appendix.
Was it easy to understand each code sample?
Test Case Yes No Partly No AnswerAMO 1 6 (5) 7 (4) 1 (0) -BIML 1 13 (8) 1 (1) - -AMO 2 11 (8) 2 (1) - 1 (0)BIML 2 5 (3) 9 (6) - -
Describe the purpose of the code.
Test Case Correct Ans Partly Correct Ans Wrong Ans Don’t knowAMO 1 8 (6) 1 (1) 2 (1) 3 (1)BIML 1 9 (7) 4 (1) 1 (1) -AMO 2 11 (7) 0 2 (1) 1 (1)BIML 2 10 (6) 2 (2) 1 (1) 1 (0)
By inspecting the two tables above, we can see that in the first case (number one above),BIML was easier to understand, and also more participants answered correctly or partlycorrectly when questioned about its purpose. More people did not understand the AMOcode sample in this first case compared to BIML, and also answered wrong, or do notknow, when asked about its purpose. However, in the second case, the survey participantsresponded that AMO was easier to understand and many thought that BIML was morecomplicated to read. In this second case, BIML had included C# code, which it did nothave in the first case. Perhaps this was something that made people confused. Althoughmany people thought BIML was harder to understand in the second case, many managedto answer correctly or partly correctly when asked what the AMO or BIML code’s purposewas.
The results here could have been affected a little bit by the order that the user reads eachcode sample (first AMO 1, then BIML 1, BIML 2, and finally AMO 2). The code exampledoes the same thing in each of the two cases, thus, reading it a second time but in anotherlanguage might make it easier. How much this has affected the result is assumed to be low,though. Overall it is hard to say which of AMO or BIML that is easier to understand fromthe survey result above. As it seems, it depends from case to case.
37(58)
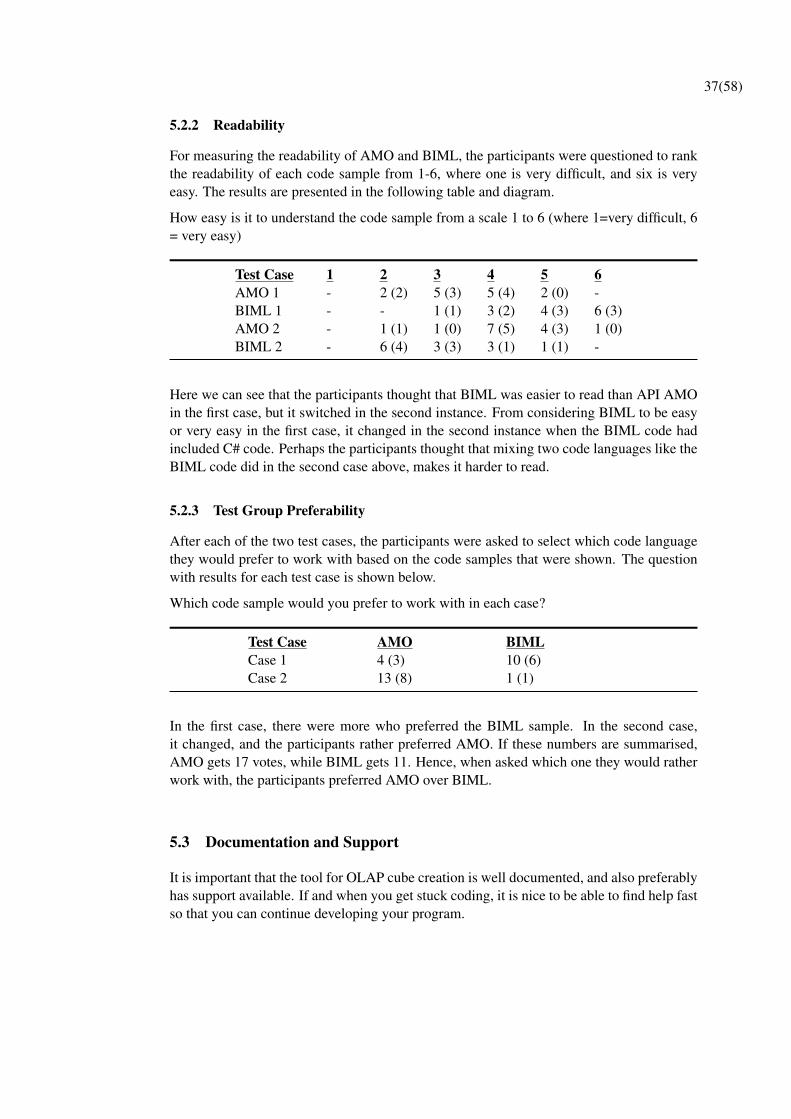
5.2.2 Readability
For measuring the readability of AMO and BIML, the participants were questioned to rankthe readability of each code sample from 1-6, where one is very difficult, and six is veryeasy. The results are presented in the following table and diagram.
How easy is it to understand the code sample from a scale 1 to 6 (where 1=very difficult, 6= very easy)
Test Case 1 2 3 4 5 6AMO 1 - 2 (2) 5 (3) 5 (4) 2 (0) -BIML 1 - - 1 (1) 3 (2) 4 (3) 6 (3)AMO 2 - 1 (1) 1 (0) 7 (5) 4 (3) 1 (0)BIML 2 - 6 (4) 3 (3) 3 (1) 1 (1) -
Here we can see that the participants thought that BIML was easier to read than API AMOin the first case, but it switched in the second instance. From considering BIML to be easyor very easy in the first case, it changed in the second instance when the BIML code hadincluded C# code. Perhaps the participants thought that mixing two code languages like theBIML code did in the second case above, makes it harder to read.
5.2.3 Test Group Preferability
After each of the two test cases, the participants were asked to select which code languagethey would prefer to work with based on the code samples that were shown. The questionwith results for each test case is shown below.
Which code sample would you prefer to work with in each case?
Test Case AMO BIMLCase 1 4 (3) 10 (6)Case 2 13 (8) 1 (1)
In the first case, there were more who preferred the BIML sample. In the second case,it changed, and the participants rather preferred AMO. If these numbers are summarised,AMO gets 17 votes, while BIML gets 11. Hence, when asked which one they would ratherwork with, the participants preferred AMO over BIML.
5.3 Documentation and Support
It is important that the tool for OLAP cube creation is well documented, and also preferablyhas support available. If and when you get stuck coding, it is nice to be able to find help fastso that you can continue developing your program.

38(58)
5.3.1 Documentation
The amount of available documentation on each of the two prototypes are described below.
AMO: Microsoft have created several documents that help you with building your AMOcode. Their forum [30] is also a good source for finding help when you get stuck. At the date2016-11-23, Microsoft’s Forum had just under 2 million answered posts overall, but around26 000 answered posts in the field of SQL Server Analysis Services [31] (which AMO is apart of). When developing cubes using AMO, the Microsoft’s forums and articles might bethe best source for getting help with your coding.
BIML: The amount of documentation for BIML is much more sparse, where Varigence’sforum [32] at the same date, had 1364 posts around BIML code. This amount of postsincludes both SSAS cube creation, but also SSIS (e.g. ETL construction). Also a few postson the website of Solisyon [33] was sometimes useful. Overall it feels like for BIML thereis more documentation about SSIS than SSAS.
5.3.2 Support
When you have a specific question and can not get help via web forums, etc. It is good thatsupport exists for the technique you have chosen. The idea of how to measure this arosewhen we got stuck during the development of the BIML prototype, more specifically ofhow to include sub-tables of dimension tables into a data source view. This question wastested for both AMO and BIML, where the time was measured until an answer was given.The result of this test is shown below in Table 3.
Table 3 Support answering time for API AMO and BIML, measured on the 30th of Novem-ber, 2016
Tool Web forum Personal Support via EmailAMO Microsoft forum: 1 Hour, 23 Minutes
[34]Not tested, since it costs and answerwas given by a user in their forum.
BIML Varigence BIML forum: 3 weeks, andstill no answer on the 30:th of Novem-ber. [35]
Varigence Support: 3 weeks, and stillno answer on the 30:th of November.(Also, A reminder email was sent after1 Week).
Note however that we used the free trial version of BIML when the support request wassent, and we were not a paying customer. Hence, the result does not say if an answer couldhave been given if we were a paying customer. However, have in mind that posting a helppost in Microsoft forums [31] is free as well, and an answer was given in a short amount oftime. Also, In the mail to Varigence support, the problem was mentioned together with anexplanation that it was going to be used in this master thesis.
Summarised, AMO gets the upper hand in this measurement, At least at the time when thistest was performed (November 2016). One could also guess that perhaps it is also so thatthe user base is bigger for AMO than BIML.

39(58)
5.4 Maintainability
For measuring maintainability on this thesis’ two prototypes, we will compare the lines ofcode for a couple of relevant sections, as well as how complex the code language is, usingthe Cyclomatic Complexity measure. Since it was not possible to fully implement all thedesired features in the BIML prototype (which was described in the completeness section),the maintainability measurement will only be measuring the code that has the collectiveactions between BIML and AMO, which resulted in a cube. Hence, we will not count codethat exists for a particular feature in the AMO prototype that was unable to be implementedin the BIML prototype.
5.5 Lines of code
The lines of code are measured for both of the two prototypes in four distinct parts in thecube generation process. The estimated numbers do not include white spaces, comments,or extra code lines for includes, or for easier readability. We also only count the things thatboth AMO and BIML could handle. Also, for BIML, the numbers are the actual BIMLcode with included C# code (i.e. not the expanded BimlScript), and for both prototypes, thecode column width is set to maximum 80 signs and indentation set to width 4. The result isshown below.
In this measurement, the code for the BIML data source and view creation also involvedcounting the declarations of tables (but not dimensions). This code could perhaps havebeen 10-15 rows smaller if additional optimisation had been done to it, but due to lack oftime, it was decided to stop and not optimise it further. We can see in this measurementthat the BIML code requires fewer lines of code compared to API AMO. If the BIML codefor creation of the data source and view could be optimised, losing 10-15 rows, it wouldbe similar to the rows of code required in the AMO prototype. Have in mind that thisevaluation was performed on the code that worked for both prototypes.

40(58)
5.6 Cyclomatic Complexity
The Cyclomatic Complexity, v(G), is a technique for measuring complexity by countingthe number of linearly independent paths through a program. It is defined by the followingformula, stated by Thomas J. McCabe [36, 308-309].
v(G) = e−n+ p (5.1)
where n = number of nodes, e = number of edges, and p = the amount of exit points. Nodesmeans when a decision has to be made (e.g. if-cases, allocations, etc.) and edges is the linkin-between those nodes. The higher number of cyclomatic complexity, the more complexthe code is and the higher risk there is that errors may exist inside the code [21]. Thisformula can, according to McCabe [36, 314-315], be simplified into:
v(G) = π+1 (5.2)
where π is the amount of predicates. Hence, To test our two prototypes’ Cyclomatic com-plexity, we could count the amount of predicates inside the code, i.e. If-cases, Loops, etc.and add one. If we do this, grouped into the same modules as when we measured the linesof code as in the previous section, we get the following data as shown in the diagram below.Also remember that to be able to test the two prototypes equally, we only count code thatworked for both prototypes.
Here for BIML, when creating the data source view, all table declarations were countedas well. One reason why the Cyclomatic Complexity is higher here is that, when columnsare declared for each table, there are several if-cases that sort out so that the column getsthe correct datatype. This datatype may differ from the read in datatype that follows theSQL server standard and therefore needs to be re-declared according to BIML datatypes[37]. Summarising the complexity values for AMO and BIML gives an equal CyclomaticComplexity number of 31, so it is hard to say which one that is more complex. However,

41(58)
if we just measure the tasks independently, we see that BIML is less complex in two out ofthe four tasks. We can also see that one task has the same complexity, and AMO is only lesscomplex at one out of four tasks. Summarised, the methods are equally complex.
5.7 Development speed
It is good that the technique for SSAS cube creation can be used to build much code inshorter amount of time. During the development of this thesis’ two prototypes, time wasmeasured in hours spent with developing each prototype. Before the implementation started,some key checkpoints were selected that each of the prototypes should be able to handle.When the prototypes could handle that checkpoint, the time required to get to there wasnoted. The result is shown below. Note that since both prototypes needed an internal struc-ture of the input database tables and relations, the first checkpoint is the same for bothprototypes, where it took 53 hours to create that internal structure. Also, this diagram isbased on the time for when things were succeeded. Hence, it does not include the problemsthat were experienced with BIML (as described earlier in this chapter, in the completenesssection). Also, the hours shown does not include the time needed to understand the basicsconcept about cubes, dimensions, data source view, etc.
From this diagram, we can see that the time required to build the prototypes by each methodis quite similar. Some data for the BIML prototype does not exist, though, but to generatea cube on a simple star schema with only single-column key relationships and withoutsub-tables, require almost the same amount of time. Summarised, they perform equallyregarding prototype development time.

42(58)
5.8 Saved Developer Time
One aim of using a more semi-automatic way of generating cubes instead of building themmanually is to save time and make the process more efficient. It also enables one to producecubes more often, even for test purposes and small changes.
To measure the saved developer time by implementing a program in AMO or BIML insteadof manually creating cubes was measured by letting an IT-consultant at Trimma build aDimension. Unfortunately, it was not possible at the time when this thesis was performed,letting the IT-consultant create a whole cube manually since it would take up too much timefor that employee at that moment. However, building only one dimension takes less timeand was possible to perform. During the implementation of that dimension, the time wasmeasured until it was finished. This time value gives an approximate value of how muchtime it would take to build n more dimensions, and then, later on, a cube. The dimensionthat was created was the dim KST dimension, with one underlying sub-table.
Table 4 Manual development speed of dimension dim KST and one sub-table
Test person TimeTest person 1 7 Min. 45 s.
Test person 2 8 Min 20 s.
Average 8 Min 12,5 s.
In average it took 8 minutes and 12,5 seconds to create this dimension. If the test person hadcreated five dimensions in total, it would have taken 492,5∗5 = 2462,5 seconds, i.e. circa41 Minutes. After this, you have to create a cube based on those established dimensions,and also add cube partitions to it. Since there was no possibility when this thesis took placeto measure the time to create a whole cube manually, an approximate value has been givenby an employee at Trimma who has worked the most with creating cubes. The approximatevalue of creating a cube from five dimensions, with only one partition for the cube, notcounting in creating predefined MDX or SSAS actions, takes about 10 minutes. All thesetimes gives a result that:
• An approximate value of the time required to build a cube manually with five dimen-sions, and one cube partition is 51 minutes.
It is interesting to know how many times you should have to build a cube until it is worthspending time implementing a program that does this more automatically instead of doingit manually every time. By comparing the approximate value of the time spent to build acube manually, with the time it took to create one of the prototypes for this thesis, we canget a rough estimate for this. Since it was possible with the AMO prototype to extend it onestep further than BIML, to also include sub-tables, this is the time we will use.
• It took approximately 51 minutes, or 0.85 hours to create a cube manually, and 111hours to build a program to do this more automatically. Hence, it will be worthspending the time developing a more automatic program if you plan to generate morethan 131 cubes. However, if you also want to further automate the SSAS actions andMDX, more time could be saved.
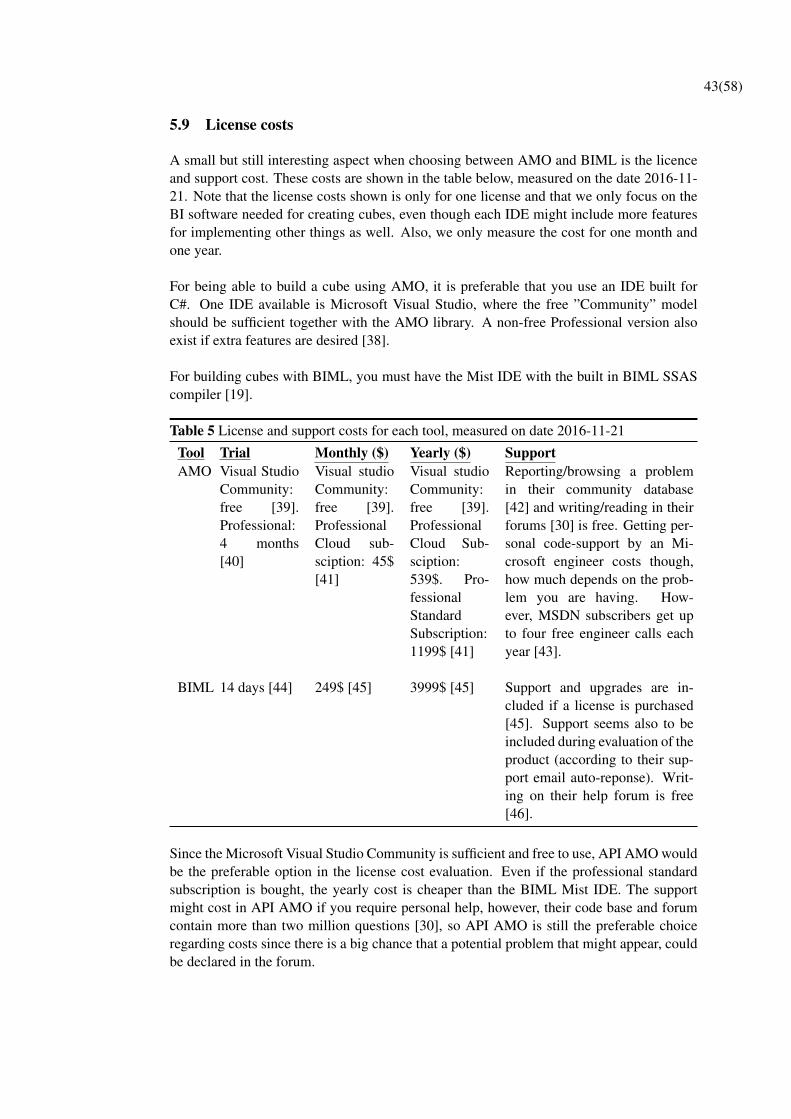
43(58)
5.9 License costs
A small but still interesting aspect when choosing between AMO and BIML is the licenceand support cost. These costs are shown in the table below, measured on the date 2016-11-21. Note that the license costs shown is only for one license and that we only focus on theBI software needed for creating cubes, even though each IDE might include more featuresfor implementing other things as well. Also, we only measure the cost for one month andone year.
For being able to build a cube using AMO, it is preferable that you use an IDE built forC#. One IDE available is Microsoft Visual Studio, where the free ”Community” modelshould be sufficient together with the AMO library. A non-free Professional version alsoexist if extra features are desired [38].
For building cubes with BIML, you must have the Mist IDE with the built in BIML SSAScompiler [19].
Table 5 License and support costs for each tool, measured on date 2016-11-21
Tool Trial Monthly ($) Yearly ($) SupportAMO Visual Studio
Community:free [39].Professional:4 months[40]
Visual studioCommunity:free [39].ProfessionalCloud sub-sciption: 45$[41]
Visual studioCommunity:free [39].ProfessionalCloud Sub-sciption:539$. Pro-fessionalStandardSubscription:1199$ [41]
Reporting/browsing a problemin their community database[42] and writing/reading in theirforums [30] is free. Getting per-sonal code-support by an Mi-crosoft engineer costs though,how much depends on the prob-lem you are having. How-ever, MSDN subscribers get upto four free engineer calls eachyear [43].
BIML 14 days [44] 249$ [45] 3999$ [45] Support and upgrades are in-cluded if a license is purchased[45]. Support seems also to beincluded during evaluation of theproduct (according to their sup-port email auto-reponse). Writ-ing on their help forum is free[46].
Since the Microsoft Visual Studio Community is sufficient and free to use, API AMO wouldbe the preferable option in the license cost evaluation. Even if the professional standardsubscription is bought, the yearly cost is cheaper than the BIML Mist IDE. The supportmight cost in API AMO if you require personal help, however, their code base and forumcontain more than two million questions [30], so API AMO is still the preferable choiceregarding costs since there is a big chance that a potential problem that might appear, couldbe declared in the forum.

44(58)
5.10 Result Summary
Table 6 Results to the evaluation checklistChecklist item Highest Score CommentCompleteness AMO In our evaluation it was possible to show complete-
ness for AMO, where it could handle both cases ofschema structures and had correct internal numbers.This could not be totally shown for BIML.
Usability Equal Based on a survey made on Trimma’s employees, itis difficult to say which is more readable and under-standable. It depends from case to case.
Preferability ofTrimma’s eployees
AMO When asked during the survey which code languageTrimma’s employees prefered.
Documentationand Support
AMO A problem question was posted on each of the tech-niques’ forums (and a mail to the support of theBIML creator: Varigence). An answer was givenwithin 2 hours for AMO. No answer was given forBIML when this measurement stopped after threeweeks. Also, the available documentation is biggerfor AMO compared to BIML.
Maintainability BIML This was tested on the actions that both prototypescould handle. BIML required less rows of code toperform a specific action. However, the CyclomaticComplexity was somewhat equal between them.
Saved DeveloperTime
- It takes approximately 51 minutes to manually cre-ate a standard cube with five dimensions and onepartition, without predefined MDX or Cube Actions.An automatic program does this in a few seconds.The implementation of a semi-automatic programtakes about 111 hours to implement (AMO case).It will be worth the time if you build more than 131cubes. However, this value is a rough approximate,see discussion for more information.

45(58)
Checklist item Highest Score CommentDevelopmentSpeed
Equal Only counting to the point that a cube exist (withoutdimension sub-tables), the prototype developmenttime was somewhat equal. After that point, it wasdifficult to continue developing the BIML prototypeto the next, extended, case. The documentation wasvery sparse and it was not understandable how oneshould do to reach case 2.
License costs AMO The costs for using AMO is cheaper than BIML.AMO could sometimes even be totally free depend-ing on desired Visual studio features.

46(58)

47(58)
6 Discussion and Conclusion
6.1 Discussion
When the calculation was made for the saved developer time, the resulting values is a roughapproximate. This since when both participants built the dimension, they both used a pieceof help structure that helped with creating a base that they continued to build upon. Hence,it is a big risk that it takes a longer time to build a cube than just 51 minutes. During adiscussion with one of the participants about how much time that would be required if thathelping structure was not used, the answer was that around 4 hours would be needed to builda basic cube, for a person that has built cubes manually before. If that number is correct,then it will be worth creating a program that does this more automatically if you are goingto create more than 28 cubes.
When measuring the license costs for BIML it was noticed that the cost for one monthlysubscription license payed during a time period of 12 months is cheaper than paying for oneyearly license. The reason why it is cheaper could not be found.
For the readability of each of the prototype code languages it is hard to decide which ofAMO or BIML that is more readable. It might be simpler to say which one is better bypicking the one that gets the highest summarised points. However, this gives AMO 108points and BIML 110 points, so it is still difficult to select which one is preferable con-cerning readability. However, perhaps AMO has a little advantage since the people thatanswered the survey seem to think that BIML code gets harder to read when C# code isincluded inside the BIML code (which is preferable if one wants more slim and efficientBIML code).
Regarding the documentation for AMO and BIML, it was difficult to find answers to prob-lems that arose during the implementation of the BIML prototype. For the AMO prototype,it was easier to get answers when help was needed. If BIML had more documentationaround cube creation, then the results of this thesis could perhaps have been different sinceit might have been possible to make the BIML prototype to include a snowflake schemacase.
It was possible to implement both cases into the AMO prototype, but it was not possibleto implement the second in BIML. The problem lies in how one should build the relationsbetween tables inside the data source view when there are table columns that belong toseveral key relationships. Many different ways of trying to solve this was performed, butthese either lead to an error saying that a column name exists at several places in the BIMLcode, or that the output was defective. It feels like the problems that occurred with BIMLshould be possible to solve, but the lack of documentation gave that a solution was notfound. If the documentation and support for BIML get better in the future, then BIMLcould be a possible option, but not as it is right now.
48(58)
6.2 Conclusion
Our problem statement was declared as follows:
“Out of all available techniques for OLAP cube generation, can we determine which tech-nique that is the best choice regarding completeness, good usability and high efficiency?”
According to the evaluations performed on the two prototypes built by each technique,AMO is the superior choice. This because BIML had an insufficient amount of documenta-tion around cube creation, which might have had an influence on why it was not possible toconclude total completeness for BIML in this thesis’ evaluation. Completeness was, how-ever, satisfied for AMO, at least according to the set completeness test framework. Thus,AMO performs best, better than the manual method currently employed by Trimma since itcould do the same work in a more efficient manner. Also, a recommendation for Trimma’sfuture work is to use AMO before BIML at the current stage since it could not be securedwhether BIML is complete enough.
6.3 Future work
This thesis focused only on creating the internal structure of a cube from scratch basedon tables inside a database that has relations like a star/snowflake schema. More thingscould be done with this where the cubes, later on, could have predefined MultidimensionalExpression (MDX) [47] and Cube Actions to it, which would enable additional features forthe end user [48].
Implement a more automatic SQL Server Integration Services (SSIS) [3] ETL tool andevaluate different ways or techniques for doing this. During the implementation of theBIML prototype, it felt like it was more usable and better developed for that cause. Hence,BIML might be a good participant for this since it might perform better there compared toSSAS creation. Microsoft also has tools for this [3]. Other techniques might also exist.

49(58)
References
[1] Ramesh Sharda, Dursun Delen, and Efraim Turban. Business Intelligence - A Man-agerial Perspective on Analytics; Third Edition. Pearson, Edinburgh Gate, Harlow,Essex CM20 2JE, England, 2014.
[2] Murugan Anandarajan, Asokan Anandarajan, and Cadambi A. Srinivasan. BusinessIntelligence Techniques - A perspective from Accounting and Finance. Springer, 2004.
[3] Microsoft. SQL Server Integration Services, 2016. https://msdn.microsoft.com/en-us/library/ms141026.aspx [Accessed: 2016-12-01].
[4] Natalie Davies. A History of Business Intelligence, 2015. http://www.sales-i.com/a-history-of-business-intelligence [Accessed: 2016-12-07].
[5] Investopedia. What are the historical origins of business intelligence?, 2015. http://www.investopedia.com/ask/answers/033015/what- are- historical-origins-business-intelligence.asp [Accessed: 2016-09-15].
[6] Justin Heinze. History of Business Intelligence, 2014. https://www.betterbuys.com/bi/history-of-business-intelligence/ [Accessed: 2016-09-15].
[7] Hans Peter Luhn. A business intelligence system. IBM Journal, 1:2, 1958.
[8] Wikipedia. Business Intelligence, 2016. https://en.wikipedia.org/wiki/Business_intelligence [Accessed: 2016-09-15].
[9] Ramez Elmasri and Shamkant B. Navathe. Fundamentals of Database Systems; 7thEdition. Pearson, 221 River Street, Hoboken, NJ 07030, USA, 2015.
[10] Ralph Kimball and Margy Ross. The Data Warehouse Toolkit, Third Edition. WILEY,John Wiley & Sons, inc., 10475 Crosspoint Boulevard, Indianapolis, IN 46256, USA,2013.
[11] Hector Garcia-Molina, Jeffrey D. Ullman, and Jennifer Widom. Database Systems -The Complete Book; 2nd Edition. Pearson, Dept. of Comp. Sc., Stanford University,2008.
[12] Efraim Turban, Ramesh Sharda, Jay E. Aronson, and David King. Business Intelli-gence - A Managerial Approach. Pearson, Edinburgh Gate, Harlow, Essex CM20 2JE,England, 2008.
[13] Microsoft. Attributes and Attribute Hierarchies, 2016. https://msdn.microsoft.com/en-us/library/ms174760.aspx [Accessed: 2016-09-29].
[14] Microsoft. SQL Server Analysis Services, 2005. https://technet.microsoft.com/en-us/library/ms175609(v=sql.90).aspx [Accessed: 2016-09-21].

50(58)
[15] Microsoft. AMO Concepts and Object Model, 2016. https://msdn.microsoft.com/en-us/library/bb522603.aspx [Accessed: 2016-09-27].
[16] Microsoft. AMO OLAP Classes, 2016. https://msdn.microsoft.com/en-us/library/ms345083.aspx [Accessed: 2016-09-27].
[17] BIMLScript. About, 2015. http://bimlscript.com/About [Accessed: 2016-09-28].
[18] Scott Currie. What is Biml?, 2015. http://bimlscript.com/walkthrough/Details/3105 [Accessed: 2016-09-28].
[19] Scott Currie. Mist, 2015. http://bimlscript.com/walkthrough/Details/3107[Accessed: 2016-09-28].
[20] Ilja Heitlager, Tobias Kuipers, and Joost Visser. A practical model for measuringmaintainability - a preliminary report. Sixth International Conference on the Qualityof Information and COmmunications Technology, 1:31–32, 2007.
[21] Zain Naboulsi. Code Metrics - Cyclomatic Complexity, 2011. https://blogs.msdn.microsoft.com/zainnab/2011/05/17/code- metrics- cyclomatic-complexity/ [Accessed: 2016-12-01].
[22] Macmillan Dictionary. Learning curve - definition and synonyms, 2016. http://www.macmillandictionary.com/dictionary/british/learning-curve [Accessed:2016-09-26].
[23] Microsoft. Programming AMO Fundamental Objects, 2012. https://technet.microsoft.com/en-us/library/ms345093(v=sql.110).aspx [Accessed: 2016-11-10].
[24] Microsoft. Programming AMO OLAP Basic Objects, 2012. https://technet.microsoft.com/en-us/library/ms345091(v=sql.110).aspx [Accessed: 2016-11-10].
[25] Ben Weissman. Building a multidimensional SSAS database with BIML, 2016. https://www.solisyon.de/building-a-multidimensional-ssas-database-with-biml/ [Accessed: 2016-11-10].
[26] Scott Currie. Techniques for Automating Biml Code, 2015. http://bimlscript.com/walkthrough/Details/3114 [Accessed: 2016-11-10].
[27] Microsoft. SQL Server Management Objects (SMO) Programming Guide, 2016.https://msdn.microsoft.com/en-us/library/ms162169.aspx [Accessed:2016-11-10].
[28] Scott Currie. Biml Basics for Relational DBs, 2016. http://bimlscript.com/walkthrough/Details/3111 [Accessed: 2016-11-10].
[29] Microsoft. Defining a Data Source View (Analysis Services), 2016. https://msdn.microsoft.com/en-us/library/ms174600.aspx [Accessed: 2016-11-10].
[30] Microsoft. Developer Forums, 2016. https://social.msdn.microsoft.com/Forums/en-US/home [Accessed: 2016-11-21].
51(58)
[31] Microsoft. Microsoft Forums SSAS, 2016. https://social.msdn.microsoft.com/Forums/en-US/home?forum=sqlanalysisservices&filter=answered&sort=lastpostdesc [Accessed: 2016-11-23].
[32] Varigence. Varigence Forums, 2016. https://varigence.com/Forums [Accessed:2016-11-23].
[33] Solisyon. Solisyon BIML, 2016. https://www.solisyon.de/biml/ [Accessed:2016-11-23].
[34] Mattias Hinnerson & Jorg. API AMO: Datasource view. How to create relationshipbetween tables, including keys with multiple rows, 2016. https://social.msdn.microsoft.com/Forums/en-US/1e6e949a-8756-4175-b396-59f8c1c79635/api-amo-datasource-view-how-to-create-relationship-between-tables-including- keys- with- multiple?forum=sqlanalysisservices [Accessed:2016-11-30].
[35] Mattias Hinnerson. BIML SSAS cubes, Table Relations: How to include sub-tables ofdimension tables, 2016. https://varigence.com/Forums?threadID=9709 [Ac-cessed: 2016-11-30].
[36] Thomas J. McCABE. A complexity measure. IEE Transactions on software engineer-ing, Vol. SE-2, SE-2:1, December 1976.
[37] Cathrine Wilhelmsen. SQL Server, SSIS and Biml Data Types, 2015. https://www.cathrinewilhelmsen.net/2014/05/27/sql-server-ssis-and-biml-data-types/ [Accessed: 2016-12-06].
[38] Microsoft. Compare Visual Studio 2015 Offerings, 2016. https://www.visualstudio.com/vs/compare/ [Accessed: 2016-11-21].
[39] Microsoft. Visual Studio Community, 2016. https://www.visualstudio.com/vs/community/ [Accessed: 2016-11-21].
[40] Microsoft. Visual Studio Professional, 2016. https://www.visualstudio.com/vs/professional/ [Accessed: 2016-11-21].
[41] Microsoft. Visual Studio Purchasing Options, 2016. https://www.visualstudio.com/vs/pricing/ [Accessed: 2016-11-21].
[42] Microsoft. Developer Community, 2016. https://developercommunity.visualstudio.com/index.html [Accessed: 2016-11-21].
[43] Microsoft. MSDN troubleshooting and support, 2016. https://msdn.microsoft.com/sv-se/hh361695?WT.mc_id=SMCfoot_SV_TEXT [Accessed: 2016-11-21].
[44] Varigence. FAQs, 2016. https://varigence.com/FAQ [Accessed: 2016-11-21].
[45] Varigence. Mist Perpetual License, 2016. https://varigence.com/Store [Ac-cessed: 2016-11-21].
[46] Varigence. BIML Forums, 2016. https://varigence.com/Forums?forumName=Biml [Accessed: 2016-11-21].

52(58)
[47] Microsoft. MDX Query Fundamentals (Analysis Services), 2016. https://msdn.microsoft.com/en-us/library/ms145514.aspx [Accessed: 2016-12-01].
[48] Robert Sheldon. Adding Actions to a Cube in SQL Server Analysis Services 2008,2010. https://www.simple-talk.com/sql/reporting-services/adding-actions-to-a-cube-in-sql-server-analysis-services-2008/ [Accessed:2016-12-05].

53(58)
A Appendix
A.1 Implementation case 1: Star Schema
Figure 9: A star schema showing a fact table (highlighted in blue) that includes five di-mension tables. This was the first implementation goal. The dimensions here arehaving Swedish names, but the dimensions are Kst = Cost Center, Proj = Project,Resultatkonto = Results account, Mortp = Counterpart, and Time.
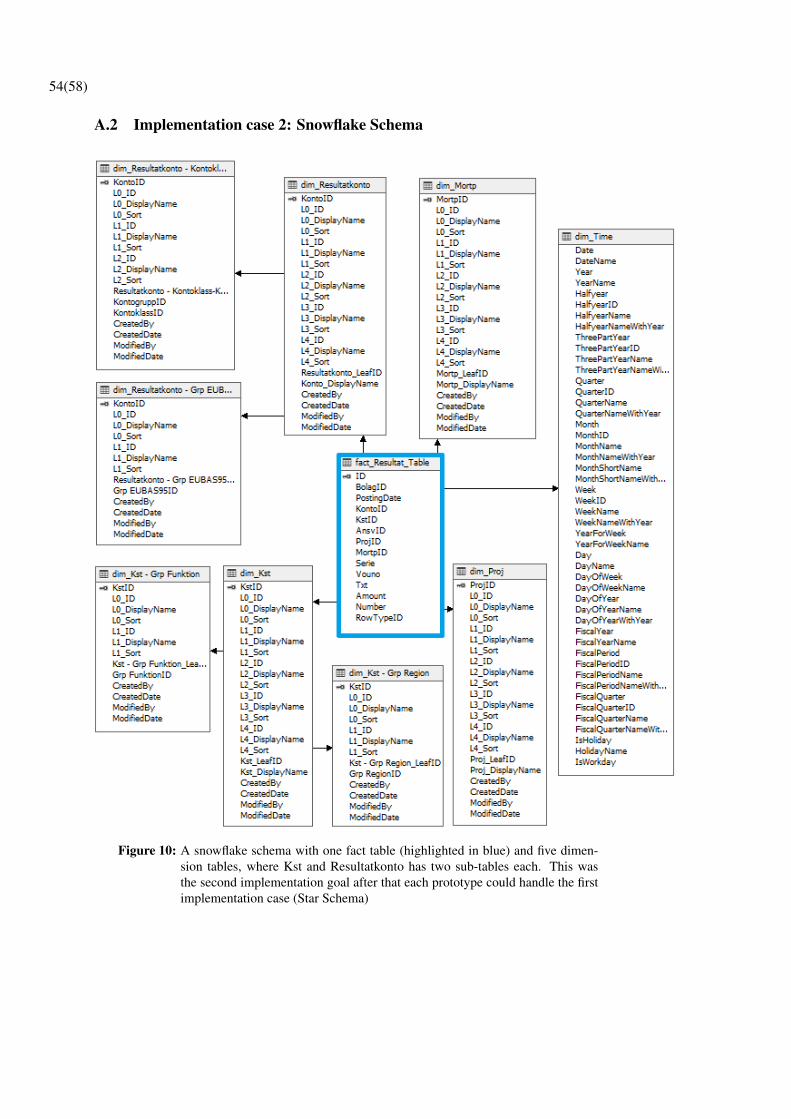
54(58)
A.2 Implementation case 2: Snowflake Schema
Figure 10: A snowflake schema with one fact table (highlighted in blue) and five dimen-sion tables, where Kst and Resultatkonto has two sub-tables each. This wasthe second implementation goal after that each prototype could handle the firstimplementation case (Star Schema)

55(58)
A.3 User Survey
User Survey
Do you have any prior knowledge of fundamental concepts concerning OLAP cubes (e.g.Dimensions, etc.)?
Yes No
Code example 1: Please read the code sample below, then answer the following questions.
DataTable srcTab = db.DataSourceViews[0].Schema.Tables["dim_Time"];DataColumn srcCol = srcTab.Columns["Date"];DimensionAttribute attribDate = newDim.Attributes.Add("Date");attribDate.Type = AttributeType.Date;attribDate.Usage = AttributeUsage.Key;attribDate.AttributeHierarchyVisible = false;attribDate.KeyColumns.Add(srcTab.TableName, srcCol.ColumnName,
OleDbTypeConverter.GetRestrictedOleDbType(srcCol.DataType));srcCol = srcTab.Columns["DateName"];attribDate.NameColumn = new DataItem(srcTab.TableName, srcCol.ColumnName,
OleDbTypeConverter.GetRestrictedOleDbType(srcCol.DataType),srcCol.MaxLength);
Was this code sample easy to understand?
Yes No
What is the purpose of the code? (i.e. what does it do?). Please answer with a few sen-tences. If the sample was incomprehensible, answer “don’t know”.
From a scale, 1 to 6, how easy was is to read the code sample? (1=very hard, 6=very easy)
1 2 3 4 5 6

56(58)
Code example 2: Please read the code sample below, then answer the following questions.
<Dimension Name="..." DimensionType="..."><Attributes>
<Attribute Usage="Key" Name="Date" AttributeType="Date"AttributeHierarchyVisible="false"><KeyColumns>
<KeyColumn ColumnName="Date" /></KeyColumns><NameColumn ColumnName="DateName"/>
</Attribute></Attributes>...
</Dimension>
Was this code sample easy to understand?
Yes No
What is the purpose of the code? (i.e. what does it do?). Please answer with a few sen-tences. If the sample was incomprehensible, answer “don’t know”.
From a scale, 1 to 6, how easy was is to read the code sample? (1=very hard, 6=veryeasy)
1 2 3 4 5 6
Comparing the code language in code sample 1 and 2, which one would you prefer towork with?
Code sample 1 Code sample 2

57(58)
Code example 3: Please read the code sample below, then answer the following questions.
<#foreach(hier in hierarchyList){#><#i=1;#><#List<String> lvlList = hierListLevels.getList(hier.Name()); #><Hierarchy Name="<#=hier.name()#>" AllMemberName="All">
<Levels><#foreach(string level in lvlList){#>
<# String lvlName = "Level " + i;#><Level Name="<#=lvlName#>" AttributeName="<#=lvlName#>"
HideMemberIf="NoName"/><#}#>#i++;#>
</Levels></Hierarchy>
<#}#>
Was this code sample easy to understand?
Yes No
What is the purpose of the code? (i.e. what does it do?). Please answer with a few sen-tences. If the sample was incomprehensible, answer “don’t know”.
From a scale, 1 to 6, how easy was is to read the code sample? (1=very hard, 6=veryeasy)
1 2 3 4 5 6

58(58)
Code example 4: Please read the code sample below, then answer the following questions.
foreach (HierarchyPart oneHier in oneDim.getHierarchyList(){int i=1;Hierarchy oneHieararchy = newDim.Hierarchies.Add(oneHier.getName());oneHieararchy.AllMemberName = "All";foreach (String oneLevel in oneHier.getLevelList()){
...Level oneL = new Level("Level " + i);oneL.HideMemberIf = HideIfValue.NoName;oneL.SourceAttribute = oneLevelAttrib;oneHieararchy.Levels.Add(oneL);i++;
}}
Was this code sample easy to understand?
Yes No
What is the purpose of the code? (i.e. what does it do?). Please answer with a few sen-tences. If the sample was incomprehensible, answer “don’t know”.
From a scale, 1 to 6, how easy was is to read the code sample? (1=very hard, 6=veryeasy)
1 2 3 4 5 6
Comparing the code language in code sample 3 and 4, which one would you prefer towork with?
Code sample 3 Code sample 4
Thank you for your participation!