Embed Size (px)
Citation preview
Technique for Estimating Depth of Floods in Tennessee
IY
Charles R. Gamble
U.S . GEOLOGICAL SURVEYWater Resources Investigations 83-4050
Prepared in cooperation with the
TENNESSEE DEPARTMENT OF TRANSPORTATION
Nashville, Tennessee1983
UNITED STATES DEPARTMENT OF THE INTERIOR
JAMES A . WATT, Secretary
For additional information write to :
District ChiefU. S . Geological SurveyA-413 Federal BuildingU.S . CourthouseNashville, Tennessee 37203
GEOLOGICAL SURVEY
Dallas L. Peck, Director
Copies of this report canbe purchased from :
Open-File Services SectionWestern Services SectionU .S . Geological SurveyBox 25425, Federal CenterLakewood, Colorado 80225(Telephone : (303) 234-5888)
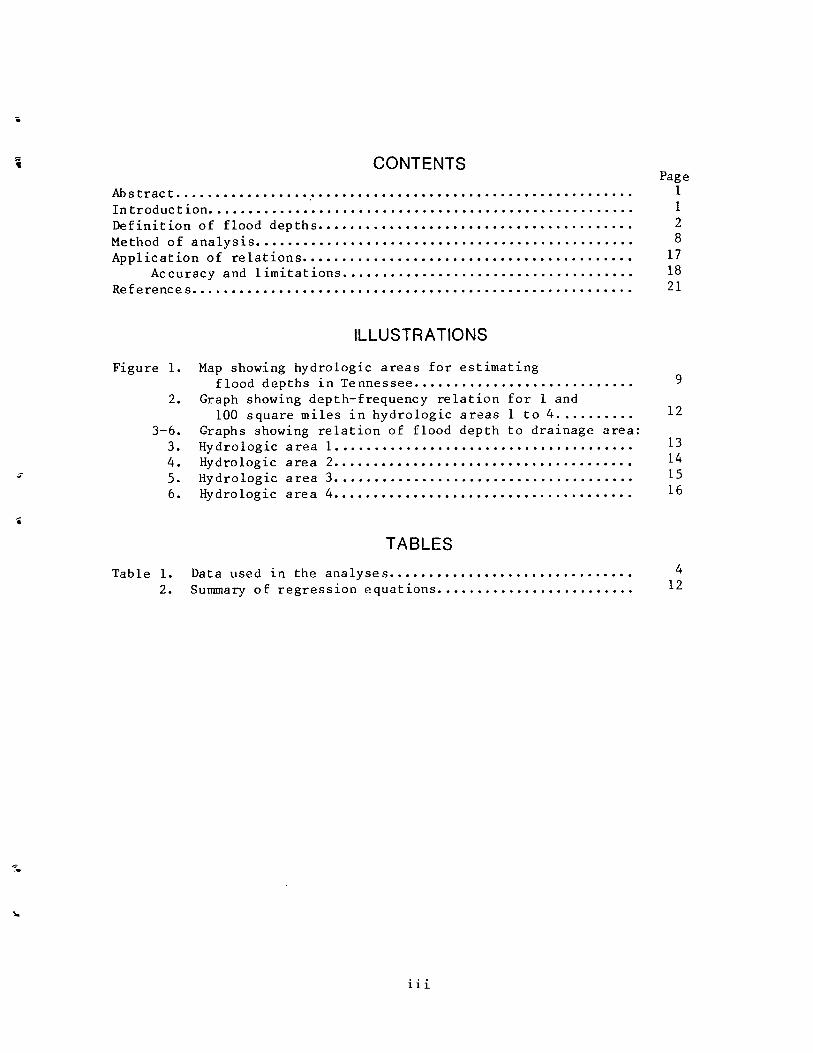
CONTENTS
Abstract . . . . . . . . . . . . . . . . . . . . . . . . . . . . . . . . . . . . . . . . . . . . . . . . . . . . . . . .Introduction . . . . . . . . . . . . . . . . . . . . . . . . . . . . . . . . . . . . . . . . . . . . . . . . . . . . . .Definition of flood depths . . . . . . . . . . . . . . . . . . . . . . . . . . . . . . . . . . . . . . . .Method of analysis . . . . . . . . . . . . . . . . . . . . . . . . . . . . . . . . . . . . . . . . . . . . . . . .
Page1i28
Application of relations . . . . . . . . . . . . . . . . . . . . . . . . . . . . . . . . . . . . . . . . . . 17Accuracy and limitations . . . . . . . . . . . . . . . . . . . . . . . . . . . . . . . . . . . . . 18
References. . . . . . . . . . . . . . . . . . . . . . . . . . . . . . . . . . . . . . . . . . . . . . . . . . . . . . . . 21
ILLUSTRATIONS
Figure 1 . Map showing hydrologic areas for estimatingflood depths in Tennessee . . . . . . . . . . . . . . . . . . . . . . . . . . . . 9
2 . Graph showing depth-frequency relation for 1 and100 square miles in hydrologic areas 1 to 4 . . . . . . . . . . 12
3-6 . Graphs showing relation of flood depth to drainage area :3 . Hydrologic area 1 . . . . . . . . . . . . . . . . . . . . . . . . . . . . . . . . . . . . . . 13
4 . Hydrologic area 2 . . . . . . . . . . . . . . . . . . . . . . . . . . . . . . . . . . . . . . 14
5 . Hydrologic area 3 . . . . . . . . . . . . . . . . . . . . . . . . . . . . . . . . . . . . . . 15
6 . Hydrologic area 4. . . . . . . . . . . . . . . . . . . . . . . . . . . . . . . . . . . . . . 16
TABLES
Table 1 . Data used in the analyses . . . . . . . . . . . . . . . . . . . . . . . . . . . . . . . 4
2 . Summary of regression equations . . . . . . . . . . . . . . . . . . . . . . . . . 12
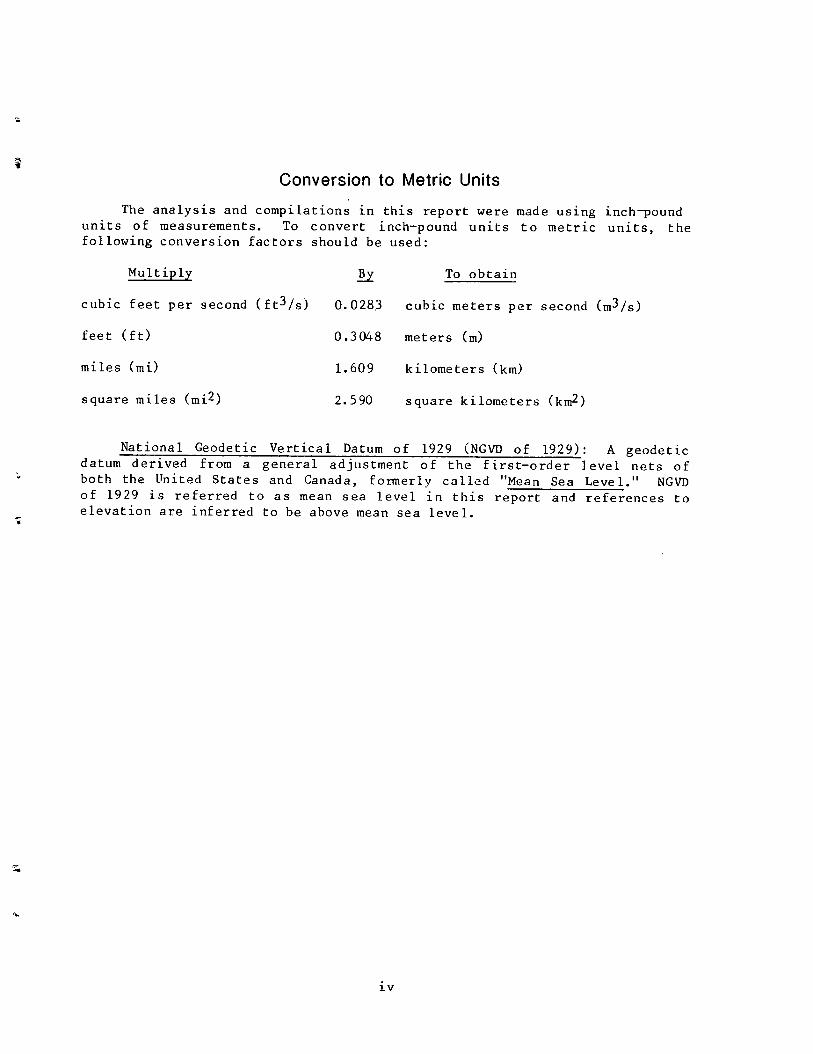
Conversion to Metric UnitsThe analysis and compilations in this report were made using inch-pound
units of measurements. To convert inch-pound units to metric units, thefollowing conversion factors should be used :
Nat ional Geodetic Vertical Datum of 1929 (NGVD of 1929) : A geodeticdatum derived from a general adjustment of the first-order level nets ofboth the United States and Canada, formerly called "Mean Sea Level." NGVDof 1929 is referred to as mean sea level in this report and references toelevation are inferred to be above mean sea level .
Multiply y To obtain
cubic feet per second (ft3/s) 0.0283 cubic meters per second (m3/s)
feet (ft) 0 .3048 meters (m)
miles (mi) 1 .609 kilometers (km)
square miles (mil) 2.590 square kilometers (km2 )
Technique for Estimating Depth of Floods in Tennessee
Charles R . Gamble
ABSTRACT
Estimates of flood depths are needed for the design of roadways across
flood plains and for other types of construction along streams . Equations
for estimating flood depths in Tennessee were derived using data for 150
gaging stations . The equations are based on drainage basin size and can be
used to estimate depths of the 10-year and 100-year floods for four hydro-
logic areas . Estimates of depths of floods having recurrence intervals
falling between 10 and 100 years can be made graphically . Standard errors
range from 22 to 30 percent for the 10-year depth equations and from 23 to
30 percent for the 100-year depth equations .
INTRODUCTION
Population growth and economic expansion have resulted in increased use
and development of land in and adjacent to flood plains . Knowledge of the
flood characteristics of the streams involved is essential for wise use of
these areas . If the approximate frequency and depth of flooding are known,
adequate design and proper use of flood-prone areas can minimize flood
damage .
At some sites it is not economically feasible to design structures for
extreme floods such as the 50-year or the 100-year flood . This is especi-
ally true for some bridges and culverts at small streams on secondary roads
where average daily traffic is low and where the duration of flood
inundation of road embankments is short . Therefore, the Tennessee Department
of Transportation sometimes designs bridges, culverts, and roadway embank-
ments for floods as small as the 10-year flood . The 10-year flood is
defined as the peak discharge which will be exceeded once, on the average,
in 10 years, or stated another way, the peak discharge which has a 10 percent
chance of being exceeded in any year . Techniques to estimate flood depths
to aid in the design of roadway embankments and drainage structures have
been developed by this study which was done in cooperation with the Tennessee
Department of Transportation .
This study was concerned with developing techniques for estimating
depths of floods for selected recurrence intervals of 10 to 100 years .
Gamble and Lewis (1977) previously presented a technique for estimating the
depth of the 100-year flood for unregulated streams in Tennessee . Depths of
100-year floods have been re-analyzed in this study so that consistent esti-
mates of the 10-year and 100-year flood depths can be presented in the same
report . Equations for estimating 100-year flood depths presented herein
supersede those given by Gamble and Lewis (1977) .
The purpose of this report is to present methods for estimating depths
of various recurrence interval floods for unregulated streams in Tennessee .
Relations between the size of the drainage basin and flood depths for four
hydrologic areas of the state are defined .
DEFINITION OF FLOOD DEPTHS
Estimation of flood depth at a specific site on a stream and flood
mapping probably are the major uses of the relations developed in this study .
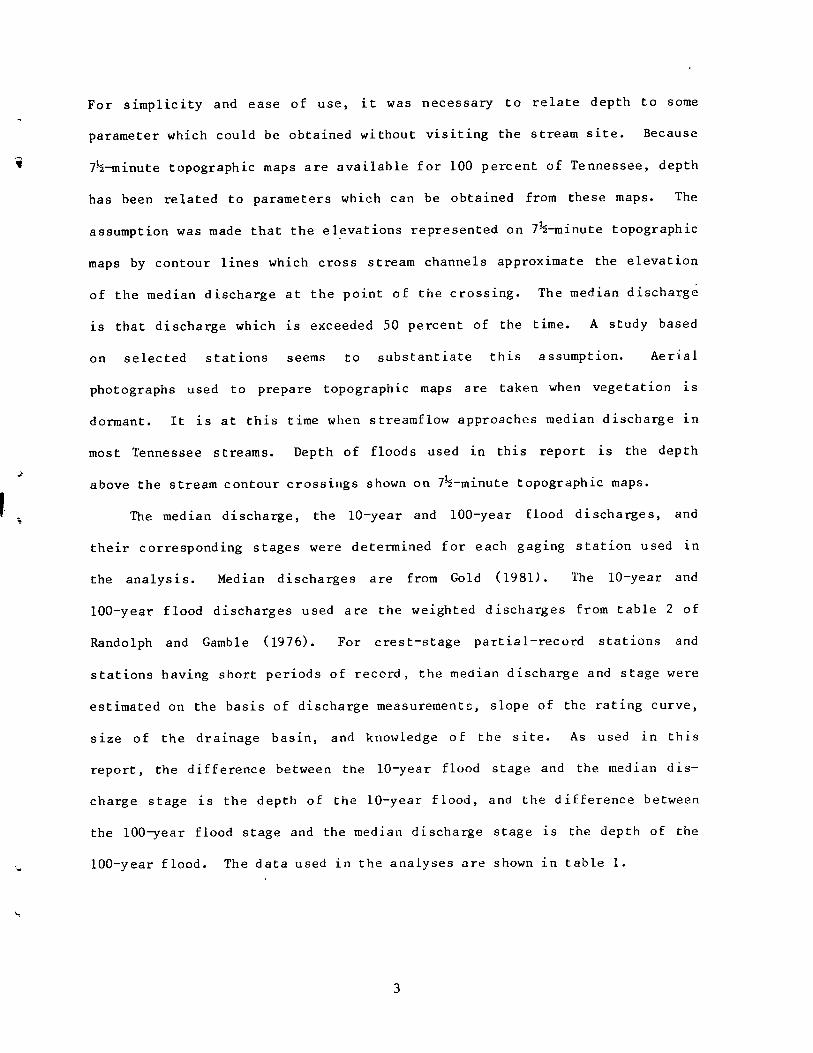
For simplicity and ease of use, it was necessary to relate depth to some
parameter which could be obtained without visiting the stream site . Because
7i-minute topographic maps are available for 100 percent of Tennessee, depth
has been related to parameters which can be obtained from these maps . The
assumption was made that the elevations represented on 7i-minute topographic
maps by contour lines which cross stream channels approximate the elevation
of the median discharge at the point of the crossing . The median discharge
is that discharge which is exceeded 50 percent of the time . A study based
on selected stations seems to substantiate this assumption . Aerial
photographs used to prepare topographic maps are taken when vegetation is
dormant . It is at this time when streamflow approaches median discharge in
most Tennessee streams . Depth of floods used in this report is the depth
above the stream contour crossings shown on 7i-minute topographic maps .
The median discharge, the 10-year and 100-year flood discharges, and
their corresponding stages were determined for each gaging station used in
the analysis . Median discharges are from Gold (1981) . The 10-year and
100-year flood discharges used are the weighted discharges from table 2 of
Randolph and Gamble (1976) . For crest-stage partial-record stations and
stations having short periods of record, the median discharge and stage were
estimated on the basis of discharge measurements, slope of the rating curve,
size of the drainage basin, and knowledge of the site . As used in this
report, the difference between the 10-year flood stage and the median dis-
charge stage is the depth of the 10-year flood, and the difference between
the 100-year flood stage and the median discharge stage is the depth of the
100-year flood . The data used in the analyses are shown in table 1 .

Table l .--Data used in the analyses
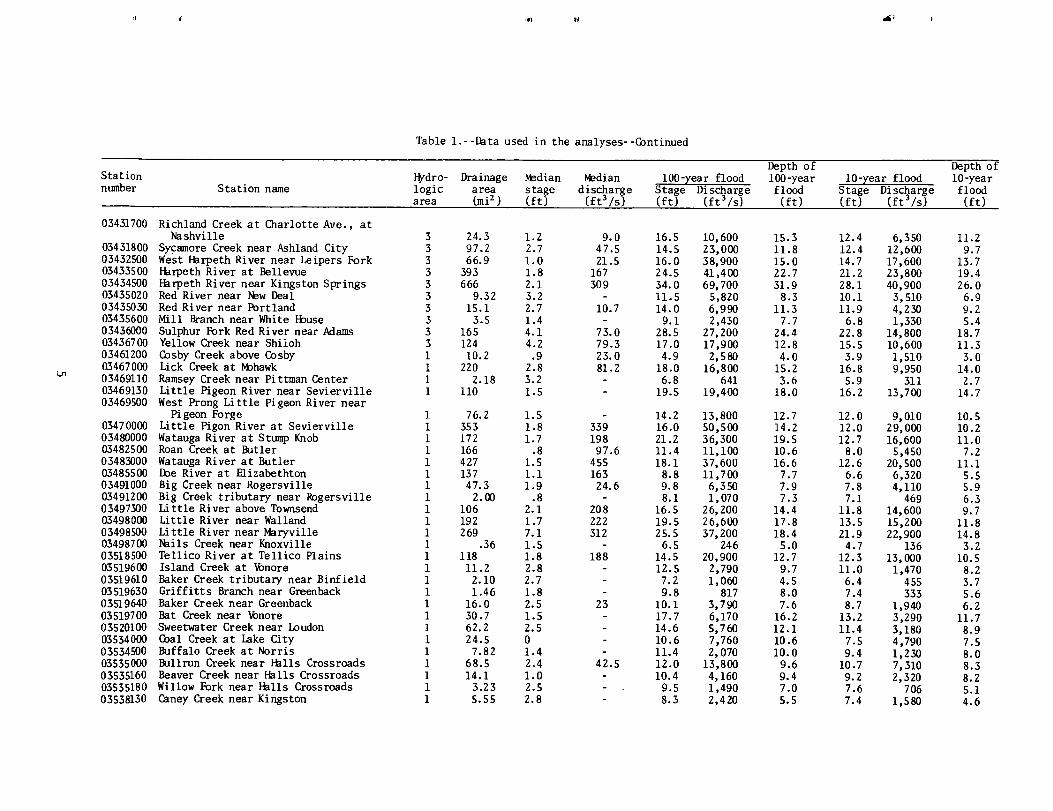
Table l .--Data used in the analyses--Gontinued
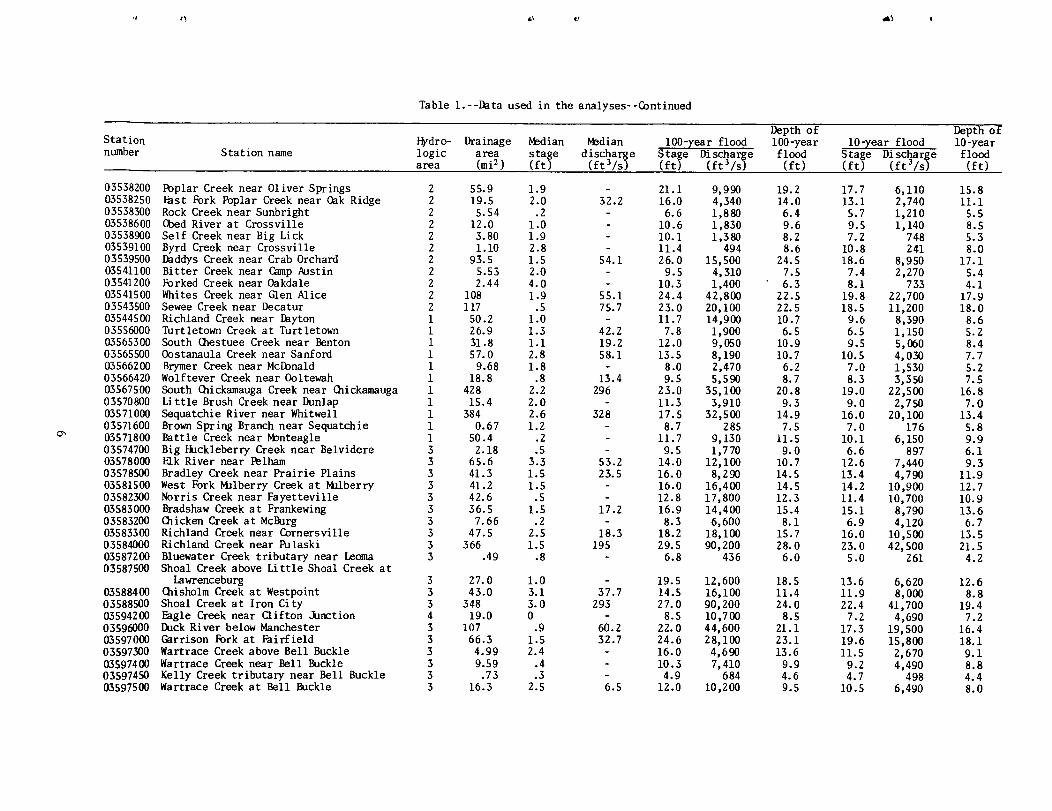
Table l .--Data used in the analyses--Continued

Table l .--Data used in the analyses--Continued

METHOD OF ANALYSIS
Randolph and Gamble (1976) defined equations relating flood discharge
characteristics to the size of drainage basin . Other basin characteristics
such as stream length, stream slope., and mean basin elevation were also
investigated to see if they improved the equations . The definition and
method of computation of these characteristics are described by May and
others (1970) . The same characteristics were tested by multiple regression
techniques in this analysis to determine whether their use would provide
improved estimates of flood depth over the use of drainage basin size alone .
Gamble and Lewis (1977) defined a relation between depth of the 100-year
flood and drainage area in four hydrologic areas of Tennessee . Those hydro-
logic areas, modified slightly, are used in this study .
The stations within each of the four hydrologic areas (fig . 1) were
grouped together . For each area the 10 year flood depth was regressed on the
four basin characteristics discussed previously . No significant decrease in
reliability of the estimating equation was noted, as measured by the standard
error of estimate, when all basin variables except size of the drainage basin
were deleted . This one-variable equation is the most practical for esti-
mating purposes because of its simplicity of use, and because additional
variables showed little statistical improvement .
The first several regression analyses for the 10-year flood depths
included 161 continuous-record gaging stations divided into four hydrologic
areas . Those analyses resulted in equations that underestimate depths at
sites with actual flood depths of 15 feet or more, and overestimate depths at
sites with actual flood depths of 5 feet or less . Additional regression
analyses were performed in an attempt to derive equations that would provide
estimates of flood depths without bias .
In those analyses hydrologic area
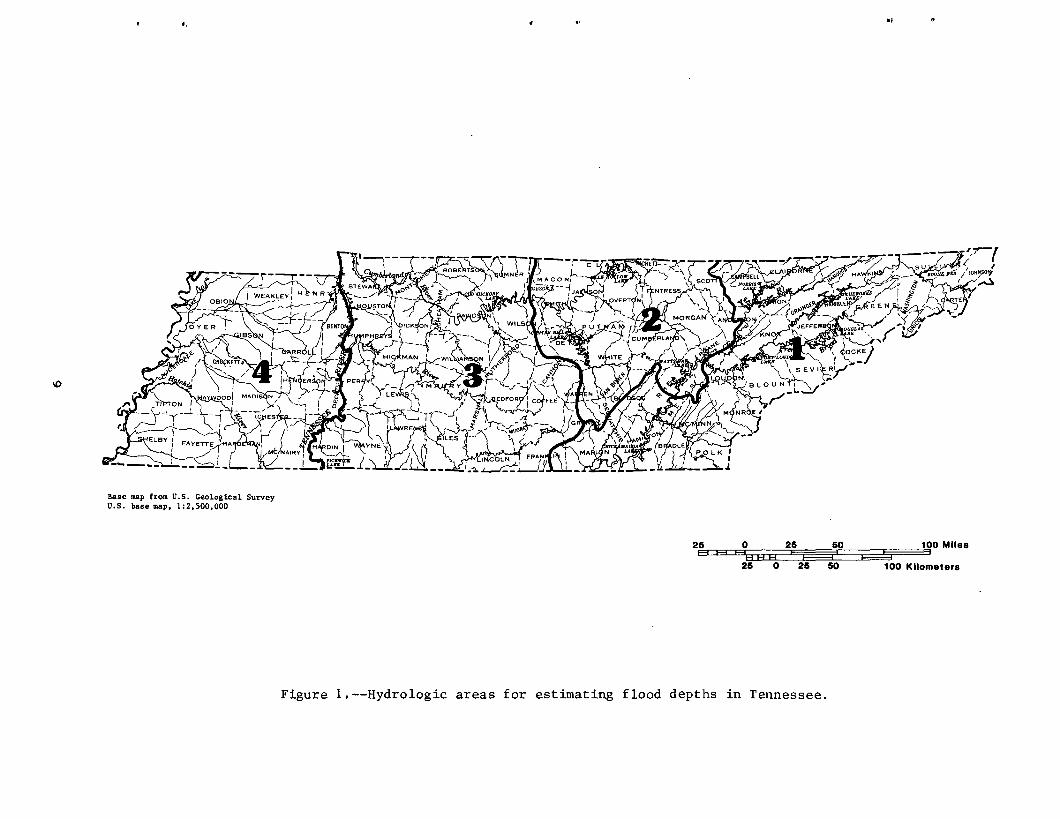
Figure l .--Hydrologic areas for estimating flood depths in Tennessee .
boundaries were shifted, areas were combined, and the analyses were performed
on data for the entire State without subdivision into hydrologic areas in an
attempt to eliminate the bias . Although the standard errors of the regres-
sions changed considerably with subsequent analyses, the amount of bias
remained about the same for depths of about 15 feet or more .
Based on graphical plots of observed flood depths versus estimated
depths, and station residuals versus observed depths, it appeared that most
of the bias was caused by 11 stations randomly dispersed across the State .
Examination of the data indicated that two stations in west Tennessee had
flood depths of about one-half the depths that would be expected for that
area . The two stations are 50 to 100 feet downstream from highway fills
which cause considerable constriction of the flood flow and probably several
feet of back water upstream from the highway . Consequently, a large part of
the flood water is stored behind the fill which reduces considerably the
amount and depth of flood flow at the station . Those two stations were
deleted from subsequent regression analyses . However, problems of over-
estimating flood depths probably exist at similar sites in west Tennessee,
and caution should be used in estimating flood depths for those sites .
Nine stations in central and east Tennessee were also deleted from
subsequent regression analyses . Those stations are on streams with very
narrow V-shaped valleys without a flood plain, or with a near vertical
bedrock outcrop at one edge of the stream and a fairly steep slope at the
other edge . In either case, the equations underestimate flood depths at
those stations . Problems of underestimating flood depths probably exist at
similar sites in central and east Tennessee, and caution should be used in
estimating flood depths for those sites .
Deletion of the 11 stations across the State reduced the standard error
of regression and reduced the bias . For the 10-year flood depths, the
average of standard errors of all four hydrologic areas was about 33 percent
using 161 stations, and about 26 .5 percent using 150 stations . For the
100-year flood depths, the average error of all four hydrologic areas was
about 32 .5 percent using 161 stations, and about 27 .8 percent using 150
stations . Although the bias in each equation was reduced considerably, the
equations still have a tendency to underestimate the larger depths .
As a test, the depths of the 25-year and 50-year floods were computed
for a few stations in each hydrologic area . The stations used were those
with the lowest residuals for the 10-year flood . These depths and those for
10 and 100-year floods were plotted on normal probability paper . For most
of these stations, the 25-year and the 50-year flood depths plotted very
close to the straight line connecting the 10 and 100-year depths, indicating
that depths for frequencies between the 10-year and the 100-year floods can
be interpolated with reasonable accuracy .
Depths of the 10-year and the 100-year floods were then computed from
the regression equations for drainage areas of 1 and 100 square miles for
each hydrologic area (fig . 2) . Depths of the 25-year and the 50-year floods
were taken from the straight lines connecting the 10 and 100year depths and
are shown in figures 3 to 6 .
The equations that were developed to compute depth of the 10-year and
100-year floods in each of the four hydrologic areas are given in table 2
and shown in graphical form on figures 3 to 6 .
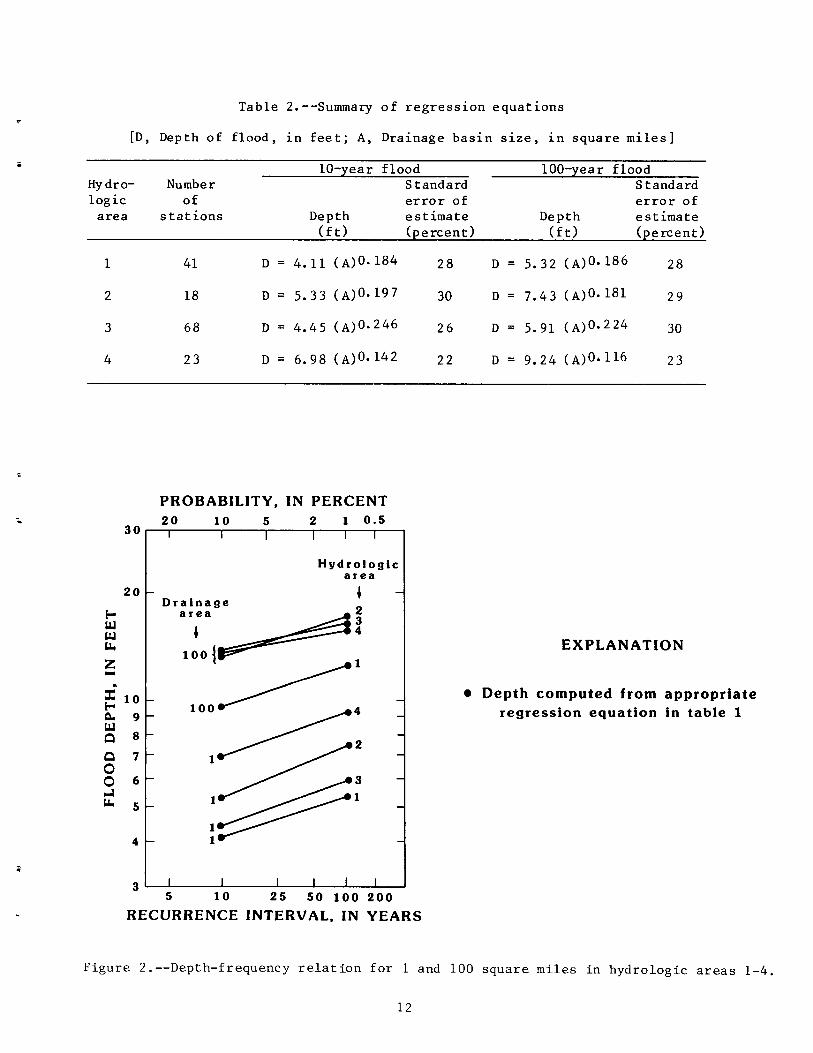
rTable 2 .--Summary of regression equations
1 2
Figure 2 .--Depth-frequency relation for 1 and 100 square miles in hydrologic areas 1-4 .
Figure 3.--Relation of flood depth to drainage area for hydrologic area 1.
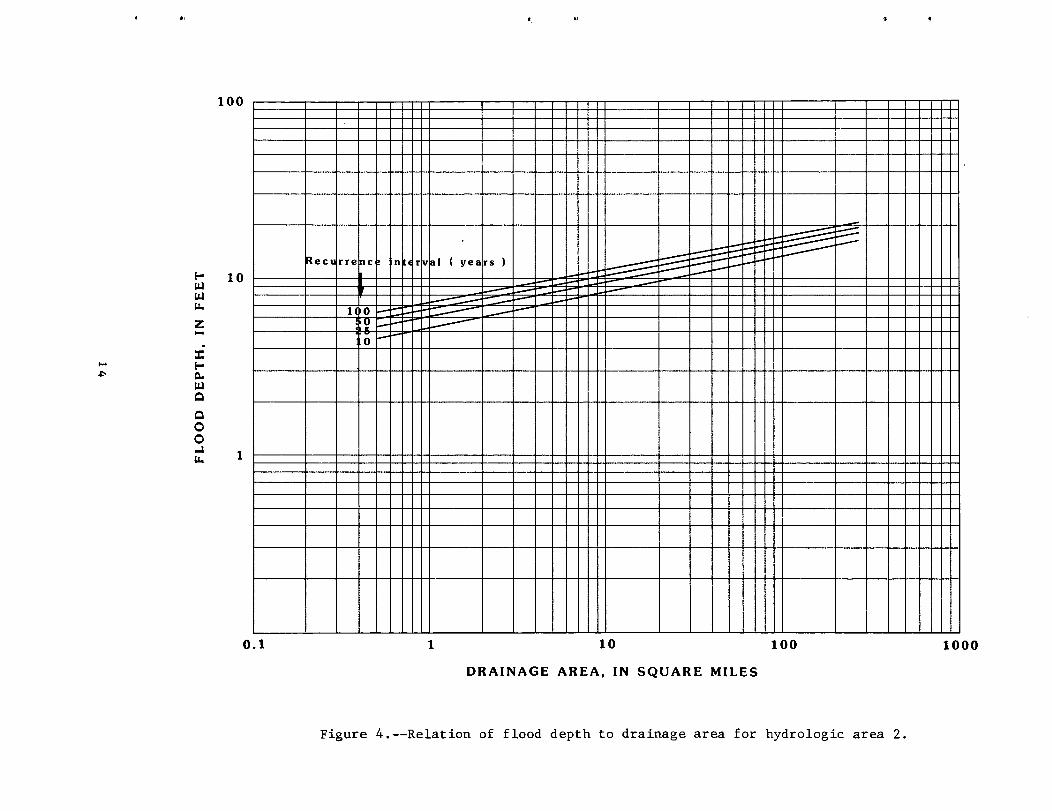
Figure 4 .--Relation of flood depth to drainage area for hydrologic area 2 .
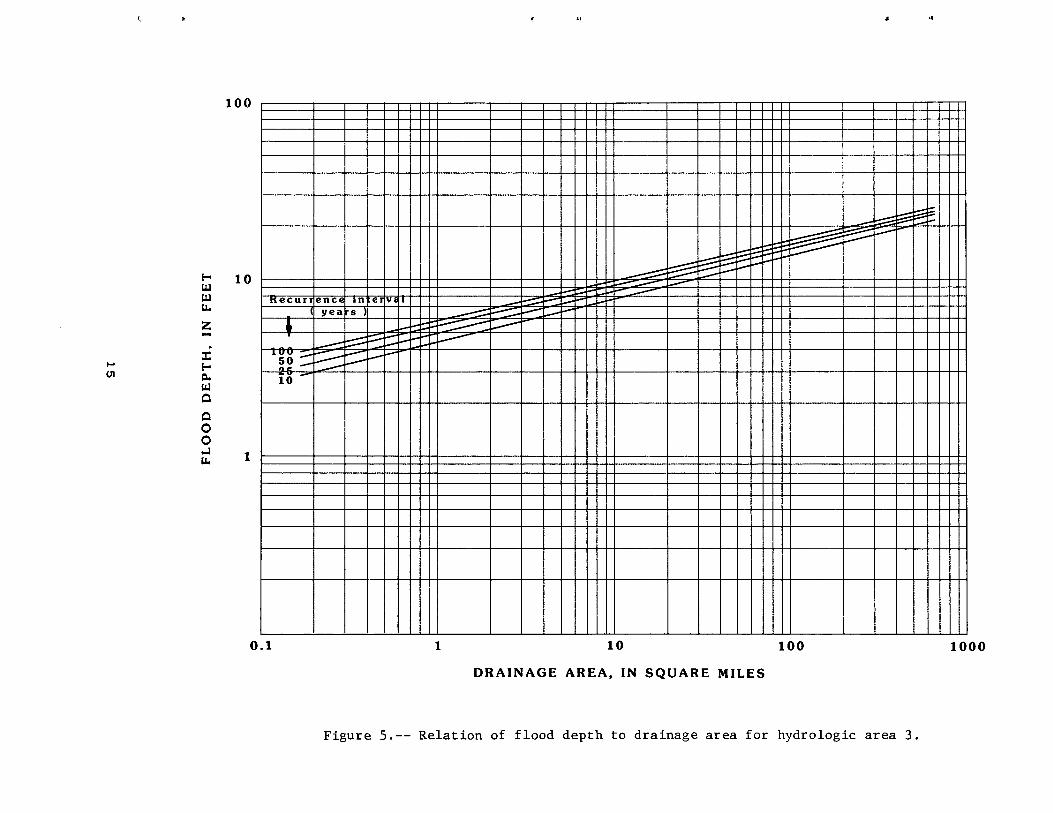
Figure 5 .-- Relation of flood depth to drainage area for hydrologic area 3 .
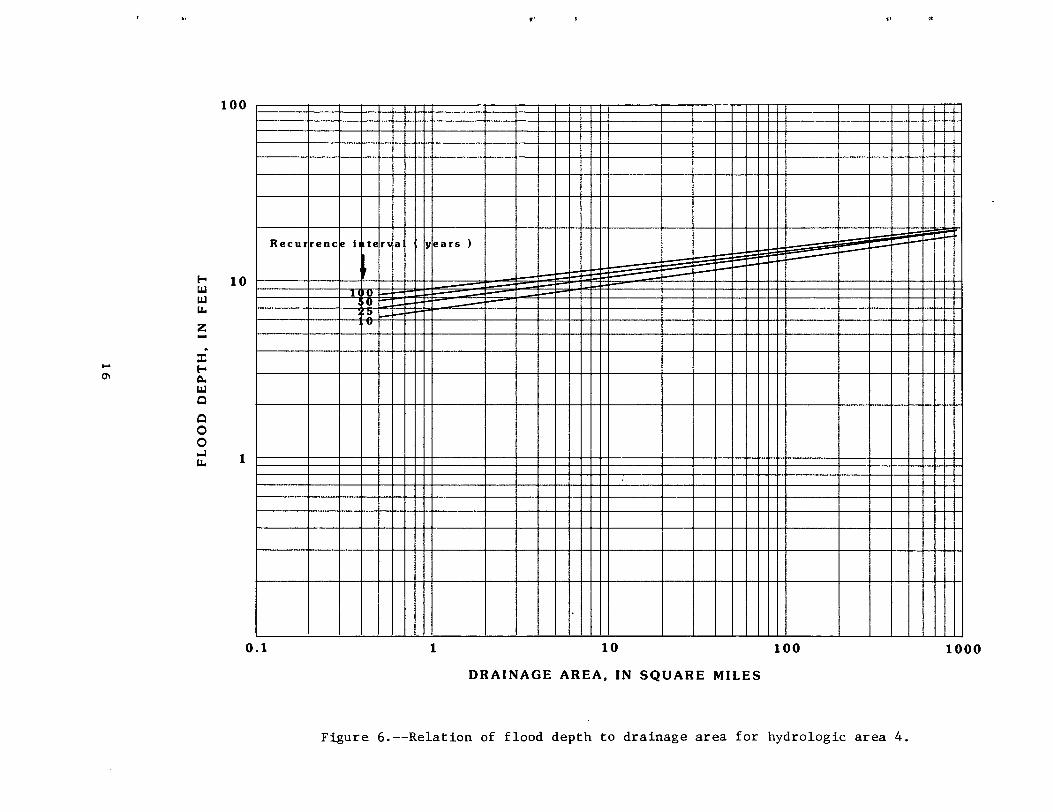
Figure 6.--Relation of flood depth to drainage area for hydrologic area 4 .
APPLICATION OF RELATIONS
To determine the elevation of the 10-year or the 100-year flood at a
given point on a stream, proceed as follows :
1 . Determine the correct hydrologic area from figure 1 .
2. Determine the drainage area of the stream, in square miles, from
7.5-minute topographic maps.
3 . Compute the depth of the 10-year or the 100-year flood using the
appropriate equation from table 2 (or read from graphs on figure 3,
4, 5 or 6) .
4 . Add this depth to the median discharge elevation represented by con-
tour crossings on 7.5-minute topographic maps to obtain the elevation
of the 10-year or the 100-year flood .
To determine the elevation for floods with recurrence intervals falling
between the 10 and 100-years
1 . Determine the correct hydrologic area from figure 1 .
2 . Determine the drainage area at the site, in square miles, from 7%-
minute topographic maps .
3 . Enter figure 2 with the desired recurrence interval and pick off
depth for 1 and 100 square miles from the appropriate hydrologic
area curve .
4 . Plot the values determined in step 3 on the appropriate figure 3, 4,
5, or 6 and draw a straight line through them.
5 . Enter this graph with the drainage area determined in step 2 and
read depth .
6 . Add this depth to the median discharge elevation represented by
contour crossings on 7.5-minute topographic maps to obtain the
elevation of the flood .
17
Slightly less accurate results can be obtained by eliminating steps 3
and 4 and interpolating between the lines of figures 3 to 6. If the drainage
area of the site of interest is less than 1 square mile or greater than 100
square miles, use this method also .
On streams where reliable flood data are available, this data should be
used to help define the desired flood depth or elevation or to appraise the
validity of that computed by the above procedures . A profile of an actual
flood is useful for this purpose . Most Federal agencies operating in
Tennessee have various kinds of flood data in their files .
Boundaries of the four hydrologic areas (fig . 1) generally coincide with
topographic divides . Consequently, for most streams, the entire basin is in
one hydrologic area . For streams where parts of the basin are in two hydro
logic areas, flood depths should be computed using the equation for each
hydrologic area and the results weighted based on the percent of the basin in
each hydrologic area .
Accuracy and Limitations
The accuracy of the regression equations can be expressed in terms of
the standard error of estimate which is a measure of how well the actual
depths used in the analysis agree with those computed by the regression
equations . By definition, approximately two of three gaged sites have
observed flood depths within one standard deviation on each side of the
regression value . The standard error of estimate of the regressions for each
hydrologic area is given in table 2 . The standard error of prediction (total
prediction error using the regression equations) may be somewhat larger
(Hardison, 1971) .
The regression equations are known to be applicable only within the
range of drainage area sizes used in their definition . Reliability of the.
equations for estimating depths at sites outside the sample range is
unknown . Therefore, the regression equations should be applied only to
streams in Tennessee with basin sizes within the following ranges :
Hydrologic area 1
0.36 to 428 mil
Hydrologic area 2
.49 to 272 mil
Hydrologic area 3
.17 to 666 mil
Hydrologic area 4
.51 to 939 mil
Stations with larger drainage areas were not used because profiles and other
data to estimate flood depths are available for most large streams in the
offices of various Federal agencies operating in Tennessee .
This report is not intended to be used in making final decisions on land
use . The results should be used only as a guide to decide if a more detailed
investigation is needed . Their use in delineating flood boundaries on 7i
minute topographic maps should yield accuracies consistent with map production
standards, which is one-half contour interval .
In West Tennessee (hydrologic area 4), dredging of the channels and
construction of levees during the past several years have undoubtedly
affected the flood characteristics, and consequently flood depths, of some
streams . Randolph and Gamble (1976) state that " . . . the discharges of 50-
year floods on small streams with a large improved channel may be as much as
100 percent larger than other streams in the vicinity without an improved
channel." It seems obvious then, that discharges for the 10-year and the
100-year floods may also be larger for improved channels. Many of these
improved channels in West Tennessee are of sufficient size to carry major
floods within the channel . This means that a larger discharge is confined in
1 9
a relatively narrow channel, hence a greater depth must occur than would have
occurred in the natural channel . Limited data on streams with improved
channels indicate that depth of floods is larger than that on unimproved
channels in the same vicinity . However, the equations given in this report
were not adjusted for improved channels because of insufficient data. Knowl-
edge of whether the particular stream is improved is essential in applying
the equation for West Tennessee . Most of the topographic maps in West
Tennessee were prepared before about 1960 and, therefore, do not reflect
recent channel changes .
Caution should be used in estimating flood depths at sites where the
flow is significantly affected by constrictions, such as highway and railroad
fills, across the flood plain. Two stations in west Tennessee were excluded
from the analyses for this reason . Caution also should be used for stream
sites in very narrow V-shaped valleys without a flood plain. Nine stations
in central and east Tennessee were excluded from the analyses for these
reasons . The relations given in this report tend to underestimate flood
depths at such sites .
The relations given in this report may not be applicable to regulated
streams, since the stream contour crossings shown on the topographic maps may
not reflect the median discharge elevation and most regulated streams in
Tennessee are larger than those used to define the relationships in this
report . Also the discharge-frequency relation may be different for regulated
streams.

REFERENCES
Gamble, C . R., and Lewis, J. G., 1977, Technique for estimating depth of100-year floods in Tennessee : Nashville, Tennessee, U .S . GeologicalSurvey Open-File Report 77-668', 18 p .
Gold, R . L., 1981, Low-flow frequency and flow duration of Tennessee streams :Nashville, Tennessee, U.S . Geological Survey Open-File Report 78-807,361 p .
Hardison, C. H., 1971, Prediction error of regression estimates of streamflowcharacteristics at ungaged sites, in Geological Survey Research 1971 :U .S . Geological Survey Professional Paper 750-C, p . C228-C236.
May, V. J ., Wood, G . H., and Rima, D . R., 1970, A proposed streamflow-dataprogram for Tennessee : Nashville, Tennessee, U .S . Geological Surveyopen-file report, 55 p .
Randolph, W . J., and Gamble, C. R., 1976, Technique for estimating magnitudeand frequency of floods in Tennessee : Tennessee Department ofTransportation, 52 p .