Embed Size (px)
Citation preview

Technical Subcommittee on Nuclear Power, Nuclear Fuel Cycle, etc. Data Sheet 1
Estimation of Nuclear Fuel Cycle Cost
November 10, 2011
Edited by Atomic Energy Commission Bureau
Provisional Translation

Table of Contents Cost Estimation Conditions & Model
Environmental Changes after Previous Estimation (2004)
Front-end, back-end, direct disposal
Costs of Individual Operations by Processes
Reprocessing, disposal of high-level radioactive waste, direct disposal
Nuclear Fuel Cycle Cost
Sensitivity analysis, plutonium credit, recovered uranium credit
11/10/2011 Technical Subcommittee on Nuclear Power, Nuclear Fuel Cycle, etc., Data Sheet 1 1

Requests from the Cost Review Committee※
Nuclear fuel cycling costs in nuclear power generation A variety of methods are available for processing spent fuel by nuclear
power generation. The costs of these methods need to be estimated according to the latest knowledge and circumstances.
Main specifications of 2010 model plant and estimation conditions
11/10/2011 Technical Subcommittee on Nuclear Power, Nuclear Fuel Cycle, etc., Data Sheet 1 2
Plant capacity 1.2 million kW
Specification base Plant data for the latest 7 years
Capacity factor 80%, 70%, 60%
Durability 40 yr, 30 yr, 16 yr (legal useful life)
Exchange rate 85.74 yen/dollar
Discount rate 0%, 1%, 3%, 5%※ the Energy and Environment Council’s Cost Review Committee, http://www.npu.go.jp/

This estimation will be used for comparisons with generation costs by electric systems, the fuel cost in nuclear power generation cost are estimated using the “model plant system.”
Two models are used for estimation: With nuclear fuel cycle Reprocessing model Without nuclear fuel cycle Direct disposal model
Additionally, the present status of energy supply in Japan is still unfolding; estimations are being used Latest model
Cost Estimation Conditions
Estimation Models (1)
11/10/2011 Technical Subcommittee on Nuclear Power, Nuclear Fuel Cycle, etc., Data Sheet 1 3
11/10/2011 Technical Subcommittee on Nuclear Power, Nuclear Fuel Cycle, etc., Data Sheet 1 4
Cost Estimation Conditions
Estimation Models (2) The future costs derived from fuel acquisition and
loading into reactors and generated energy are converted to the present values for finding the levelized cost of generation (yen/kWh).
Present nuclear fuel cycle costs are estimated in accordance with situational changes from 2004 to the present Steep rise of uranium resources price Strong yen Enforcement of the Spent Nuclear Fuel Reprocessing
Fund Act , etc.
Techniques Used by the Cost Subcommittee[1] is used.
[1] Subcommittee to Study Costs and Other Issues, Electricity Industry Committee, Advisory Committee on Energy and Natural Resources (2004)
http://www.meti.go.jp/policy/electricpower_partialliberalization/contentscost.html
Cost Estimation Conditions
Estimation Models (3) Methodology of the Cost Subcommittee
A nuclear fuel cycle of “reprocessing at Rokkasho + subsequent reprocessing” was assumed, because the Rokkasho Reprocessing Plant has caused in test operations.
Assuming the NPP capacity and processing capacity of the reprocessing plant, 64% of the generated spent fuel is predicted for the reprocessing, and the remaining 36% is assumed to be stored in the interim storage facilities.
The costs were estimated using reprocessing or direct disposal models.
The estimation using the latest model is presented for reference.
511/10/2011 Technical Subcommittee on Nuclear Power, Nuclear Fuel Cycle, etc., Data Sheet 1

6
Cost Estimation ConditionsCycle Cost Estimation Conditions (Common to All Models)
Item Cost Subcom. (2004) This time
Uranium fuel enrichmentBWR 3.8%PWR 4.1%
RP modelLatest model
BWR 3.7%PWR 4.6%
DD model PWR 4.5%
Average burnup at discharged
UO2 fuel: 45,000 MWd/tMOX fuel: 40,000 MWd/t
←
Incore fuel dwelling time 5 years ←Heat efficiency 34.5% ←Exchange rate 121.98 yen/dollar 85.74 yen/dollarDiscount rate 0, 1, 2, 3, 4 % 0, 1, 3, 5 %
RP model, latest model
Reprocessing and interim storage ratio 64:36 50:50
Next generation production ratio 15% ←
11/10/2011 Technical Subcommittee on Nuclear Power, Nuclear Fuel Cycle, etc., Data Sheet 1
RP: Reprocessing Plant, DD: Direct Disposal Site
Estimation Model
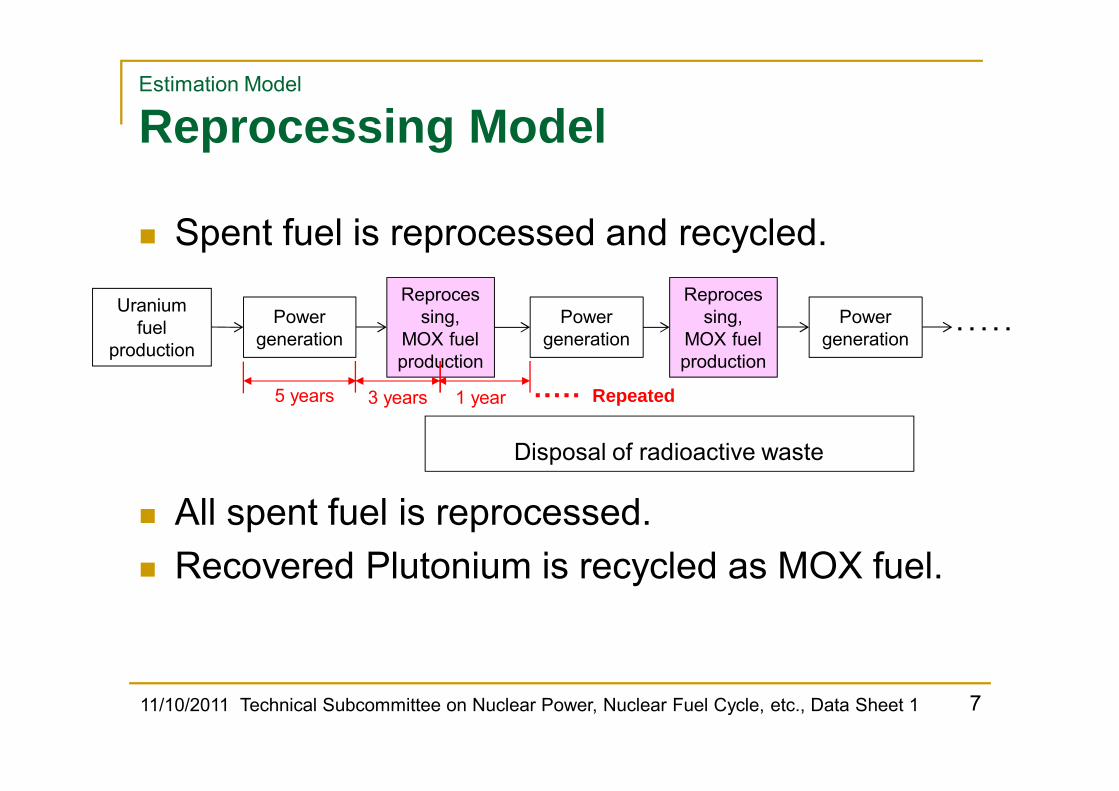
Reprocessing Model
Spent fuel is reprocessed and recycled.
All spent fuel is reprocessed. Recovered Plutonium is recycled as MOX fuel.
7
Uraniumfuel
production
Reprocessing,
MOX fuel production
・・・・・Power
generationPower
generationPower
generation
Reprocessing,
MOX fuel production
Disposal of radioactive waste
5 years 3 years 1 year ・・・・・ Repeated
11/10/2011 Technical Subcommittee on Nuclear Power, Nuclear Fuel Cycle, etc., Data Sheet 1

5 years
Estimation Model
Direct Disposal Model
All spent fuel is directly disposed after interim storage.
8
Uranium fuel
production
Power generation
Interim storage
Direct Disposal
59 years
11/10/2011 Technical Subcommittee on Nuclear Power, Nuclear Fuel Cycle, etc., Data Sheet 1
1 year
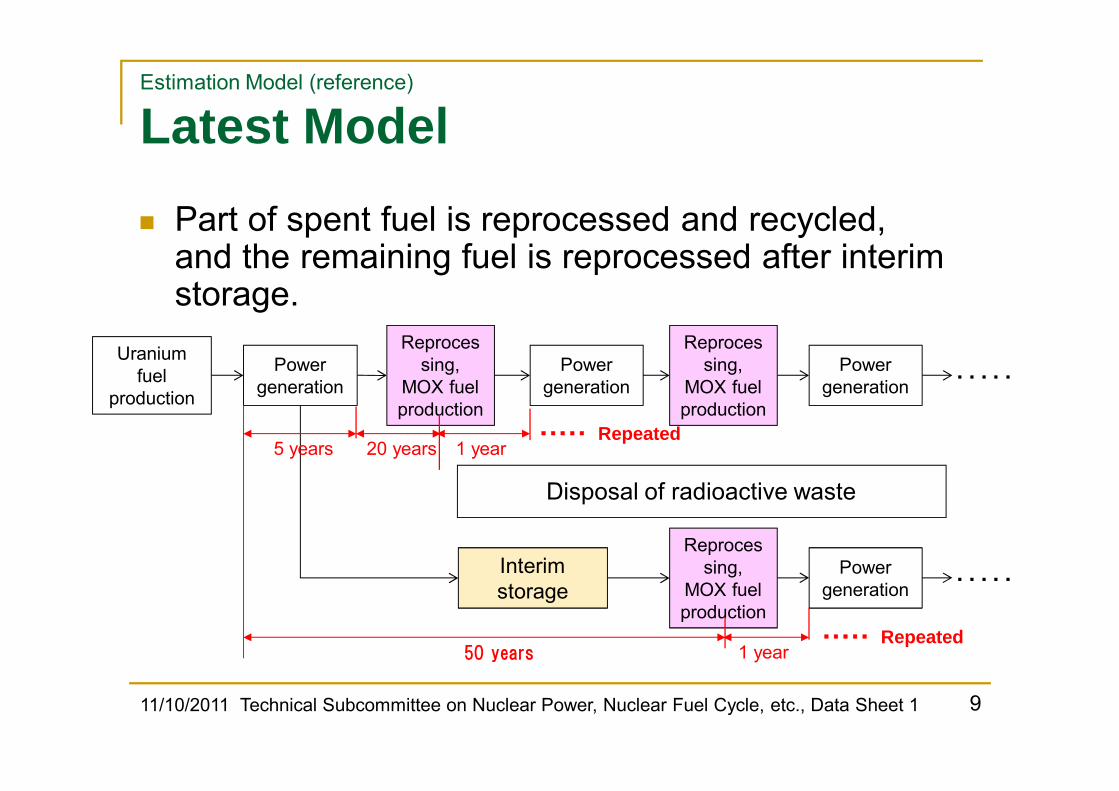
Estimation Model (reference)
Latest Model Part of spent fuel is reprocessed and recycled,
and the remaining fuel is reprocessed after interim storage.
9
Uraniumfuel
production
Reprocessing,
MOX fuel production
Disposal of radioactive waste
・・・・・Power
generationPower
generationPower
generation
Reprocessing,
MOX fuel production
・・・・・Power
generation
Reprocessing,
MOX fuel production
Interim storage
5 years 20 years 1 year・・・・・ Repeated
50 years・・・・・ Repeated
11/10/2011 Technical Subcommittee on Nuclear Power, Nuclear Fuel Cycle, etc., Data Sheet 1

10
Environmental Changes from Last Estimation
Front-end Recent spot prices of uranium concentrate
(yellow cake: U3O8) have fluctuated significantly. Although the past market price were stable around $10/lb., recent price has increased to as high as $130 temporarily and it is fluctuating between $40 and $60/lbU3O8during 2008 to 2010.
As for exchange rates, the yen has strengthened significantly: although the rate in August 2004 was around 110 yen/dollar, an average rate is around 86 yen/dollar in 2010.
11/10/2011 Technical Subcommittee on Nuclear Power, Nuclear Fuel Cycle, etc., Data Sheet 1

11
Environmental Changes from Last Investigation
Back-end A fund system for reprocessing, etc. was established. (refer to p.12)
The costs concerning reprocessing, including decommissioning costs and TRU waste disposal costs, have been reserved from 2005. The fund is collected from electricity charges.
Test operation using spent fuel (active tests) started at the Rokkasho Reprocessing Plant in March 2006. The tests became stagnant in the vitrification process of high level
radioactive waste, and the completion was postponed to October 2012. Four NPP started to use MOX fuel. Construction of the Rokkasho MOX Fuel Fabrication Plant started in
October 2010. The construction is expected to be completed in March 2016.
Construction of the first spent fuel interim storage facilities in Japan started at Mutsu City of Aomori Prefecture in August 2010. The construction is expected to be completed in July 2012.
11/10/2011 Technical Subcommittee on Nuclear Power, Nuclear Fuel Cycle, etc., Data Sheet 1

Environmental Changes from Last InvestigationDevelopment of System and Provision for Spent Fuel Reprocessing Fund The Spent Nuclear Fuel Reprocessing Fund Act was
enforced in 2005 (for the Rokkasho Reprocessing Plant) Costs of reprocessing at the Rokkasho Reprocessing Plant are
reserved for future use. The yearly assignments of reprocessing costs and relevant spent fuel
generated are simultaneously converted when the spent fuel is generated, using the discount rate to find the levelized cost for unit weight.
The report of the Investment Environment Improvement Subcommittee (2007) of the Electricity Industry Committeeindicated a decision to include the costs of reprocessing the spent fuel other than that reprocessed at the Rokkasho Reprocessing Plant in the reserve.
1211/10/2011 Technical Subcommittee on Nuclear Power, Nuclear Fuel Cycle, etc., Data Sheet 1

Environmental Changes from Last Investigation
Direct Disposal
Data used the 4th New Nuclear Policy-Planning Council
13
[Issues potentially containing uncertainty of feasibilities and costs]1. Behavior and effects of radiaolysis and development of redox
front⇒Effects are not significant when processing environment
and the existence of canisters (iron) are taken into account.2. Evaluation of effects of waste heat on processing system design
⇒There is not a significant difference in the areas of disposal system (m2/tU) discussed in the Technology Subcommittee at the previous meeting for determining the framework, and those in Sweden and Finland.
3. Waste emplacement method and geological repository design technique
⇒While there is potentially a large reduction in the cross section area of tunnels , it is almost within the reference width for horizontal positioning discussed in the Technical Subcommittee at the previous New Nuclear Policy-Planning Council.
4. Prevention and evaluation of criticality⇒The consideration of burnup credit and FP concentration are
important.5. Evaluation and setting of heat ing and nuclide concentration
of fuel assembly⇒LWR and LWR-MOX analysis instances were examined.
[Basic concept]• Basic Technologies for the geologic disposal of vitrified radwastes can be used as the direct disposal.• Existing data and precedent technological developments in overseas operations (in Sweden, Finland,
and elsewhere) are investigated.
11/10/2011 Technical Subcommittee on Nuclear Power, Nuclear Fuel Cycle, etc., Data Sheet 1
Basic method (under demonstration)
Alternative method (investigated as an option to reduce the amount of
drilling)

About Costs of Individual Operations by Processes
Front-endUranium fuel Latest procurement by utilities
MOX fuel The latest moves of construction costs are considered for the estimate used at the Cost Subcommittee 2004.
Back-end
ReprocessingEstimated based on the reprocessing costs estimated by the Government (METI) according to the law and the latest notices from utilities and Japan Nuclear Fuel Ltd.
Disposal of high-level radioactive
wasteEstimated based on the latest disposal costs estimated by the Government (METI) according to the law.
Interim storage The latest construction costs of the estimates used at the Cost Subcommittee 2004 are considered.
Direct disposal The latest technological insights are considered , based on the estimates at the previous Technology Subcommittee.
14
Evaluating the costs of individual operations (the cost per ton of uranium fuel) is required for estimating the future costs in front-end and back-end.
1411/10/2011 Technical Subcommittee on Nuclear Power, Nuclear Fuel Cycle, etc., Data Sheet 1

Costs of individual operations by processes (reprocessing)
Costs of Individual Operations by Processes
The estimated total cost of reprocessing is around 12.6 trillion yen at the Cost Subcommittee 2004 based on the reasonable estimates of the operation and maintenance of the Rokkasho Reprocessing Plant.
After that, the reprocessing fund system (p.16) was started. The total operation cost is estimated every fiscal year by the Government (METI) according to the law and based on the notices from utilities and Japan Nuclear Fuel Ltd. The effects of postponed completion of construction of the Rokkasho Reprocessing Plant, etc. are considered.
The reprocessing costs used for the current estimation are, therefore, estimated based on the total operation costs (p.17) estimated based on the latest notices from utilities. Sensitivity analysis will be conducted as needed in case of difficulties in rational
estimation.
1511/10/2011 Technical Subcommittee on Nuclear Power, Nuclear Fuel Cycle, etc., Data Sheet 1
Utility(licensee of specified
commercial reactor operation)
Costs of individual operations by processes (reprocessing)
Reprocessing Fund Scheme
16
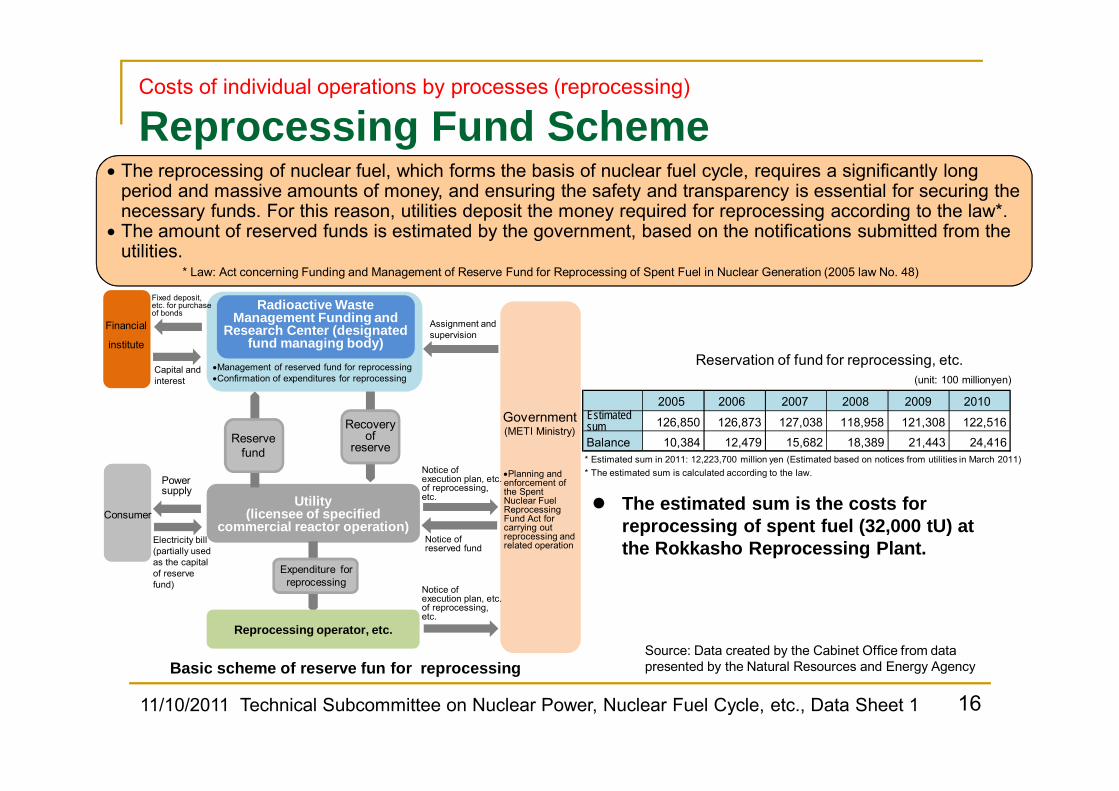
The estimated sum is the costs for reprocessing of spent fuel (32,000 tU) at the Rokkasho Reprocessing Plant.
Reserve fund
Reprocessing operator, etc.
Financial
institute
Basic scheme of reserve fun for reprocessing
Radioactive Waste Management Funding and
Research Center (designated fund managing body)
Source: Data created by the Cabinet Office from data presented by the Natural Resources and Energy Agency
2005 2006 2007 2008 2009 2010Estimated sum 126,850 126,873 127,038 118,958 121,308 122,516Balance 10,384 12,479 15,682 18,389 21,443 24,416* Estimated sum in 2011: 12,223,700 million yen (Estimated based on notices from utilities in March 2011)
(unit: 100 millionyen)
* The estimated sum is calculated according to the law.
Reservation of fund for reprocessing, etc.
11/10/2011 Technical Subcommittee on Nuclear Power, Nuclear Fuel Cycle, etc., Data Sheet 1
The reprocessing of nuclear fuel, which forms the basis of nuclear fuel cycle, requires a significantly long period and massive amounts of money, and ensuring the safety and transparency is essential for securing the necessary funds. For this reason, utilities deposit the money required for reprocessing according to the law*.
The amount of reserved funds is estimated by the government, based on the notifications submitted from the utilities.
* Law: Act concerning Funding and Management of Reserve Fund for Reprocessing of Spent Fuel in Nuclear Generation (2005 law No. 48)
Fixed deposit, etc. for purchase of bonds
Capital and interest
Management of reserved fund for reprocessingConfirmation of expenditures for reprocessing
Assignment and supervision
Recovery of
reserve
Consumer
Power supply
Electricity bill(partially used as the capital of reserve fund)
Expenditure for reprocessing
Notice of execution plan, etc. of reprocessing, etc.
Notice of execution plan, etc. of reprocessing, etc.
Notice of reserved fund
Government (METI Ministry)
Planning and enforcement of the Spent Nuclear Fuel Reprocessing Fund Act for carrying out reprocessing and related operation
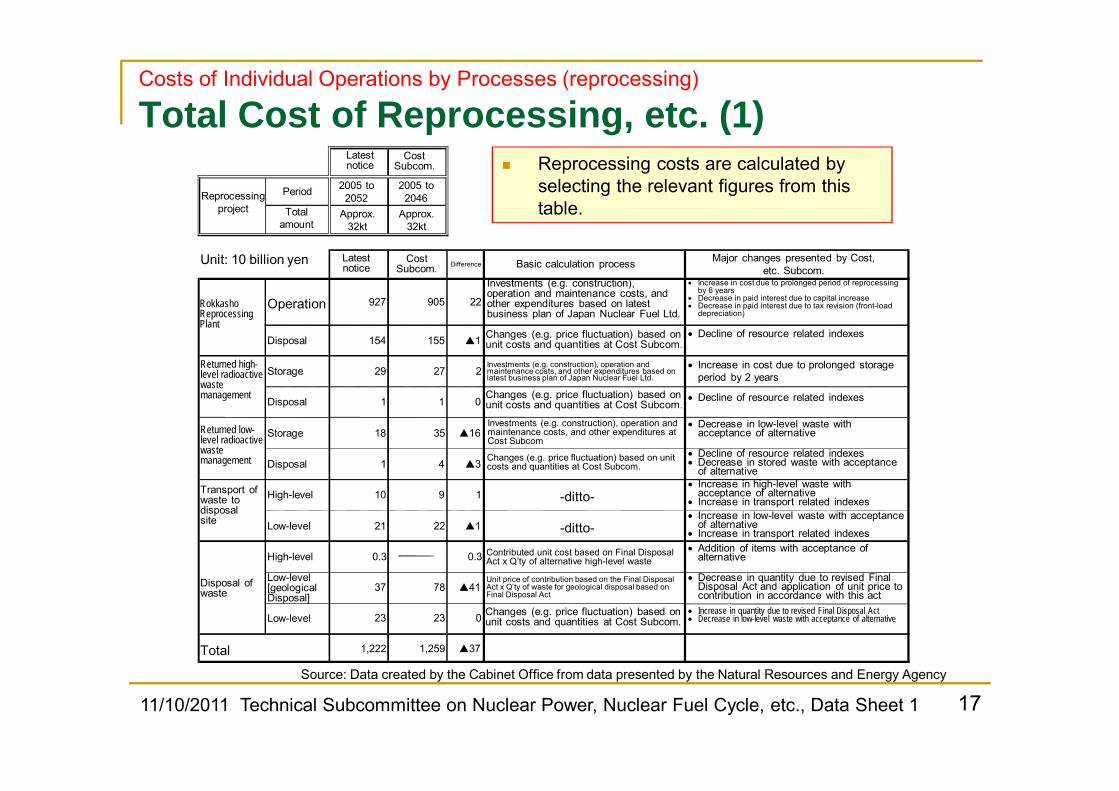
Reprocessing costs are calculated by selecting the relevant figures from this table.
Costs of Individual Operations by Processes (reprocessing)
Total Cost of Reprocessing, etc. (1)
17Source: Data created by the Cabinet Office from data presented by the Natural Resources and Energy Agency
Returned low-level radioactive waste management
11/10/2011 Technical Subcommittee on Nuclear Power, Nuclear Fuel Cycle, etc., Data Sheet 1
Decrease in quantity due to revised Final Disposal Act and application of unit price to contribution in accordance with this act
Latest notice
Cost Subcom.
Total amount
Approx.32kt
Approx.32kt
Unit: 10 billion yen Latest notice
Cost Subcom.
Increase in cost due to prolonged period of reprocessing by 6 years
Decrease in paid interest due to capital increase Decrease in paid interest due to tax revision (front-load
depreciation)
Decline of resource related indexes
Increase in cost due to prolonged storage period by 2 years
Decline of resource related indexes
Decrease in low-level waste with acceptance of alternative
Decline of resource related indexes Decrease in stored waste with acceptance
of alternative Increase in high-level waste with
acceptance of alternative Increase in transport related indexes Increase in low-level waste with acceptance
of alternative Increase in transport related indexes Addition of items with acceptance of
alternative
Low-level[geologicalDisposal]
Low-level Increase in quantity due to revised Final Disposal Act Decrease in low-level waste with acceptance of alternative
Total 1,222 1,259 37
Storage
Disposal
Investments (e.g. construction), operation and maintenance costs, and other expenditures based on latest business plan of Japan Nuclear Fuel Ltd.
Investments (e.g. construction), operation and maintenance costs, and other expenditures based on latest business plan of Japan Nuclear Fuel Ltd.
Difference Basic calculation process Major changes presented by Cost, etc. Subcom.
Changes (e.g. price fluctuation) based on unit costs and quantities at Cost Subcom.
41
Changes (e.g. price fluctuation) based on unit costs and quantities at Cost Subcom.
Changes (e.g. price fluctuation) based on unit costs and quantities at Cost Subcom.
1
3
Changes (e.g. price fluctuation) based on unit costs and quantities at Cost Subcom.
Storage
Disposal
Unit price of contribution based on the Final Disposal Act x Q’ty of waste for geological disposal based on Final Disposal Act
Contributed unit cost based on Final Disposal Act x Q’ty of alternative high-level waste
-ditto-
-ditto-
0.3 0.3
37
1High-level
23 23 0
78
Low-level
18 35
1 4
21 22
10 9Transport of waste to disposal site
Disposal of waste
2005 to 2052
154
Returned high-level radioactive waste management
29
1
High-level
PeriodReprocessing project
Rokkasho Reprocessing Plant
155Disposal
Operation 927 905
Investments (e.g. construction), operation and maintenance costs, and other expenditures at Cost Subcom
2005 to 2046
1
27 2
1 0
16
22

Costs of Individual Operations by Processes (reprocessing)
Total Cost of Reprocessing, etc. (2)
18
Unit: 10 billion yen Latest notice
Cost of domestic reprocessing
Other(Returned waste costs)
Low-level waste[classified to Geological disposal]
Low-level waste[Other]
Total 1,222 1,168 54
18
1
9.7 0.6
Returned low-level radioactive waste management
Transport of waste to disposal site
Disposal of waste High-level
waste
High-level waste
Storage
Returned high-level radioactive waste management
29
1
Operation
Storage
23
Low-level waste
0.3
37
21
10
18
1
23
0.5
0.3
34 2
20.0
Changes (e.g. price fluctuation) based on unit costs and quantities at Cost Subcom.
-ditto-
-ditto
Costs for domestic disposal of alternative waste returned from overseas reprocessing contractorsAll returned waste related costs
All costs for disposal of waste resulting fromReprocessing at the Rokkasho plant.
Costs at Rokkasho Reprocessing PlantAll costs for domestic reprocessing
Costs for domestic management of waste returned from overseas reprocessing contractors
All returned waste related costs
Sum of transport costs for waste resulting from reprocessing at the Rokkasho plant and that for waste returned from oversea reprocessing contractors
”Unit cost x Quantity of waste from domestic reprocessing” is the domestic reprocessing related costs.
Of the latest reported amount of 12.22 trillion yen, 11.68 trillion yen is used as the cost for domestic reprocessing.
Investments (e.g. construction), operation and maintenance costs, and other expenditures based on latest business plan of Japan Nuclear Fuel Ltd.Changes (e.g. price fluctuation) based on unit costs and quantities at Cost Subcom.Investments (e.g. construction), operation and maintenance costs, and other expenditures based on latest business plan of Japan Nuclear Fuel Ltd.
927 927
154154
Rokkasho Reprocessing Plant
Decommissioning
Remark
Changes (e.g. price fluctuation) based on unit costs and quantities at Cost Subcom.
29
1
Excerpt from data at the 1st Technical Subcommittee on Nuclear Power, Nuclear Fuel Cycle, etc.
Changes (e.g. price fluctuation) based on unit costs and quantities at Cost Subcom.
Unit price of contribution based on Final Disposal Act x Q’ty of alternative high-level waste
Unit price of contribution based on Final Disposal Act x Q’ty of waste for geological disposal based on Final Disposal Act
Changes (e.g. price fluctuation) based on unit costs and quantities at Cost Subcom.
Source: Data created by the Cabinet Office from data presented by the Natural Resources and Energy Agency
Sum of transport cost for waste resulting from reprocessing at Rokkasho plant and that for waste returned from oversea reprocessing contractors”Unit cost x Quantity of waste from domestic reprocessing” is the domestic reprocessing related costs.
”Unit cost x Quantity of waste from domestic reprocessing” is the domestic reprocessing related costs.
11/10/2011 Technical Subcommittee on Nuclear Power, Nuclear Fuel Cycle, etc., Data Sheet 1
Decommissioning
Decommissioning
Costs of Individual Operations by Processes (disposal of high-level radioactive waste)
Costs of Individual Operations by Processes In the waste disposal operation (vitrification of waste), the costs for
geological disposal of 40,000 bodies of vitrified radwaste were confirmed to be around 2.9 trillion yen at the Nuclear Energy Group of the Advisory Committee on Energy and Natural Resources in September 2000, based on the standard processes and technical conditions clarified by the R&D results of the Japan Atomic Energy Agency (former Japan Nuclear Cycle Development Institute) and the investigation of operational concepts by the Atomic Energy Commission.
After that, the Contribution Scheme for Final Disposal Fund (P.20) was started, and the government (METI) estimates the total operation costs based on the latest standard of personnel expenditure, etc. every year according to the law.
For this reason, the calculation of the waste disposal costs, used for the present estimation, should be based on the most recent total operation costs (p.21). Sensitivity analysis will be conducted as needed in case of difficulties in rational
estimation.
1911/10/2011 Technical Subcommittee on Nuclear Power, Nuclear Fuel Cycle, etc., Data Sheet 1

* Estimated sum in 2011: 2,718,300 million yen* The estimated sum is calculated according to the accumulation method ensured at the Nuclear Energy Group of the Advisory Committee for Energy.
The estimated sum is the costs required for the geological disposal of 40,000 bodies of vitrified radwaste by NUMO.
Costs of Individual Operations by Processes (disposal of high-level radioactive waste)
Contribution Scheme for Final Disposal Fund
20
Reservation of final disposal fund
(Unit: 100 million yen)
2000 2001 2002 2003 2004 2005Estimated sum 29,305 28,911 28,819 28,297 27,843 27,652
Balance 0 1,020 1,705 2,372 2,940 3,566
(Unit: 100 million yen)2006 2007 2008 2009 2010
Estimated sum 27,728 27,879 27,582 27,922 27,769
Balance 4,241 4,999 5,763 6,498 7,394
Considering the importance of a systematic accumulation of funds for the final disposal of vitrified radwastes, the Radioactive Waste Management Funding and Research Center was designated as the fund managing body in 2000 according to the related law, and manages a fund with contributions from the Nuclear Waste Management Organization of Japan (NUMO).
The government reviews the unit price of contribution required for the reserve every year.* Law: Designated Radioactive Waste Final Disposal Act, Act No. 117 of 2000
Basic scheme of final disposal fund Source: Data created by the Cabinet Office from data presented by the Natural Resources and Energy Agency
Radioactive Waste Management Funding and Research Center
(designated fund managing body)
Management of reserved fund for final disposalConfirmation of expenditures for final disposal
Utilities(licensee of specified
commercial reactor operation)
The Government(METI Ministry)
Basic policiesBasic direction of final disposalAssent of local residents to the disposal of radioactive waste
Final disposal planTime and quantity of disposal
Nuclear Waste Management Organization of Japan
(authorized association)Final disposal, Construction, remodeling and maintenance of facilities, Selection of survey areas, Collection of contributions, etc.
11/10/2011 Technical Subcommittee on Nuclear Power, Nuclear Fuel Cycle, etc., Data Sheet 1
Financial
institute
Fixed deposit, etc. for purchase of bonds
Capital and interest
Assignment and supervision
Recovery of
Fund
Consumer
Power supply
Electricity bill(partially used as the capital of reserve fund)
External management of
contributed money
Execution planApproval by the Government
Permission and supervisionContingency planRestraint of dismantlement
Contribution
Unit price of contribution

Costs of Individual Operations by Processes (disposal of high-level radioactive waste)
Waste Disposal Costs (Vitrification)2011 2000 Mean
diffe’ce Major change from 2000 Principle of estimationCost Soft rock Hard rock Mean Soft rock Hard rock MeanTechnology
R&D 1,031 1,031 1,031 1,118 1,118 1,118 ▲ 87 Decrease in unit personnel costs
<Accumulation method> Accumulation of direct costs of personnel,
materials, machinery, etc. and indirect costs of on-site management and general management, etc.
Costs and methods used for general civil work, geological survey and general public work are used for the accumulation method, and the estimation of personnel and material costs.
<Estimation case setting> Because of the dependency of final
disposal costs on the rock types and depth settings, a case of 500m for soft rock system, and a case of 1,000m for hard rock system (crystalline rock) are estimated and their average is used.
<Scale of facilities> Facilities that can accommodate 40,000
bodies of vitrified radwaste.
<No. of sites in cost estimation stages > Together with TRU waste, costs are
estimated given 10 areas for literature search, 5 areas for general survey, 2 areas for detailed survey and 2 areas as the site of final disposal facilities.
<Disposal schedule> 2000 The executing body was selected. 2036 Operation is commenced. 2086 Teardown and closure of the
facilities begin. 2096 The disposal tunnels are closed. Afterwards, the site will be monitored for
300 years.
Survey and landPurchase 1,591 1,782 1,687 2,252 2,501 2,376 ▲ 689
Decrease in unit personnel costs; decrease due to proportional changes with introduction of TRU; decrease in land price
Design and construction 9,750 8,110 8,930 10,476 8,725 9,600 ▲ 670
Decrease in personnel costs; fall of installation related indexes
Operation 7,041 7,674 7,358 6,805 7,736 7,271 87 Increase in material related indexes
Teardown and closure 861 909 885 801 884 842 43 Increase in material related
indexes
Monitoring 1,187 1,187 1,187 1,236 1,236 1,236 ▲ 49 Fall of installation related indexes
Project management 5,407 4,722 5,065 6,132 5,396 5,764 ▲ 699
Decrease in unit personnel costs; decrease due to proportional changes with introduction of TRU; decrease in property tax
Consumption tax 1,055 1,020 1,037 1,107 1,087 1,097 ▲ 60
Total 27,927 26,438 27,183 29,927 28,683 29,305 ▲ 2,122
21
Source: Data created by the Cabinet Office from data presented by the Natural Resources and Energy Agency
Unit: 100 million yen
11/10/2011 Technical Subcommittee on Nuclear Power, Nuclear Fuel Cycle, etc., Data Sheet 1

* The emplacement four-piece canisters in vertical position in the hard rock geology is excluded from the review because it does not meet the heat limit.
Cost of Individual Operations by Processes (direct disposal)
Cost Estimation Case The model plant used in this estimation is a case of constructing a
repository site with the emplacement in vertical position, which is a prevailing method of overseas final disposal operations.
22
Rock type
Estimation case in2004 [1]
Emplacement
method
No. of stored bodies
No. of sites
Total cost in previous
estimation(trillion yen)
Current estimation
Soft rock
1
Vertical
2 1 7.80
2 4 1 6.03
3 2 2 9.46
Additional review 1
Horizontal2 1 4.09
Additional review 2 4 1 3.84
Hard rock
1Vertical
2 1 5.33
2 2 2 7.34
Additional review 2 Horizontal 2 1 4.54
[1] AEC Technical Subcommittee of the New Nuclear Policy-Planning Council (2004)http://www.aec.go.jp/jicst/NC/tyoki/tyoki_gijyutu.htm
11/10/2011 Technical Subcommittee on Nuclear Power, Nuclear Fuel Cycle, etc., Data Sheet 1

1. Review of disposal tunnel specificationThe disposal tunnel specification is reviewed based on the latest investigation of the spent fuel emplacement method (spent fuel is conveyed in horizontal position) in Finland and Sweden, the countries which have a lead in the direct disposal [vertical arrangement only, and no change in horizontal arrangement] (a reduction in the sectional area of disposal tunnels with the reduction in diameters, etc.).
2. The settings in the above 2004 report are used for cost estimation except the use of the latest open construction costs.
3. No change is made for other preconditions set in 2004.
Costs of Individual Operations by Processes (direct disposal)
Cost Review Points Costs are directly reviewed by applying the latest insight to the
following points based on the investigation at the Technical Subcommittee [1] in 2004.
23
[1] AEC Technical Subcommittee of the New Nuclear Policy-Planning Council (2004)http://www.aec.go.jp/jicst/NC/tyoki/tyoki_gijyutu.htm
11/10/2011 Technical Subcommittee on Nuclear Power, Nuclear Fuel Cycle, etc., Data Sheet 1

Examined instance of direct disposal in Japan (hard rock)
Canister (for 4 bodies) Tunnel/hole specification Emplacement methodConveyance and emplacement in vertical position (same as the vitrified bodies)
Thickness: 190 mm(Lid: 230 mm)Material: Carbon steel
Tunnel: 7.8mH, 6.5mWHole: 2.70m dia, 7.40mH
(Japan Nuclear Cycle Development Institute, 1999)
(Atomic Energy Commission, 2004)
H 4
.76m1.24m
(Atomic Energy Commission, 2004)
Costs of Individual Operations by Processes (direct disposal)
Review of Disposal Tunnel Specification (1)
24
(Japan Nuclear Cycle Development Institute, 1999)
11/10/2011 Technical Subcommittee on Nuclear Power, Nuclear Fuel Cycle, etc., Data Sheet 1
Section A-ATunnel
backfill
Buffer (100mm??
thick)
(Sprayed concrete)
Canister
Shielding container
Waste
Motive power unit
Stationary placement
facility
Unit: mm
Unit: mm
Waste

Costs of Individual Operations by Processes (direct disposal)
Review of Disposal Tunnel Specification (2) Overseas Instances
Type Canister Tunnel/hole specification Conveyance/emplacement method
Finland (hard rock)
50 mm Thick (Side: 48 mm). Outer: Copper, Inner: Cast iron
Tunnel: 4.4 mH, 3.5 mWHole: 1.75 m dia., 8.25 mHSlope: X1.0 m, Y1.0 m
Conveyance in horizontal position and emplacement in vertical position
Sw
eden (hard rock)
Tunnel: 4.0 mH, 3.6 mWHole: 1.75 m dia., 7.83 mHSlope: X1.6 m, Y1.2 m
Conveyance in horizontal position and emplacement in vertical position
(Andersson , 2002)
(Revised Raiko, 2005) (Saanio et. al., 2007)
(SKB, 2007)
5.25
mH
1.05 m dia.4.
83 m
H
【November 2008 Atomic Energy Commission, Policy Evaluation Group】
25
50 mm thickOuter: CopperInner: Cast iron
11/10/2011 Technical Subcommittee on Nuclear Power, Nuclear Fuel Cycle, etc., Data Sheet 1
Finland
Sweden

After investigating emplacement methods (spend fuel is conveyed in horizontal position) used in Finland (POSIVA) and Sweden (SKB), the specification with a reduced section area of tunnels in hard lock systems by about 65% of the previous estimation was employed.
Costs of Individual Operations by Processes (direct disposal)
Review of Disposal Tunnel Specification (3)
Specification by Atomic Energy Commission (2004) Present specification
H=7.8m, W=6.5m, S=46.2m2 H=4.0m, W=4.6m, S=16.0m2
Approx. 65% reduction in cross section of tunnel
(The width was reduced according to Sweden spec. for improving workability.)
【AEC Policy Evaluation Group, November 2008 】
2611/10/2011 Technical Subcommittee on Nuclear Power, Nuclear Fuel Cycle, etc., Data Sheet 1
Initial tunnel specification
Investigatedtunnel specification

Costs of Individual Operations by Processes (direct disposal)
Presumed Schedule of Operation Same as the previous Technology Subcommittee is assumed.
2711/10/2011 Technical Subcommittee on Nuclear Power, Nuclear Fuel Cycle, etc., Data Sheet 1
Period Schedule
First year Selection of the executing body
- 9th year (10 years) Selection of potential sites
10th - 24th year (15 years) Survey of potential sites and demonstration of disposal technologies
25th - 84th year (60 years)
Construction and Operation- Start of construction: 25th year- Start of operation: 35th year (spent fuel
acceptance period: 40 years)- End of operation: 84th year
85th - 94th year (10 years) Dismantling of facilities and closure of site
95th - 394th year(300 years) Post-closure site management

Costs of Individual Operations by Processes
Unit Cost of Individual Operations
28
Discount rate 0% 1% 3% 5%
Uranium fuel (10,000 yen/tU) 25,900 26,200 27,100 28,200
MOX fuel (10,000 yen/tHM) 40,600 40,700 41,500 42,700
Reprocessing, etc. (10,000 yen/tU) 37,200 37,800 41,100 46,400
Spent fuel transportation(NPP→ Reprocessing) (10,000 yen/tU) 1,700 1,700 1,700 1,700
Spent fuel transportation(NPP → Interim storage) (10,000 yen/tU) 1,600 1,600 1,600 1,600
Interim storage (10,000 yen/tU) 3,600 4,000 5,200 6,900
Disposal of high-level radioactive waste (10,000 yen/tU) 8,500 8,700 11,000 15,700
Spent fuel transportation(Interim storage Direct disposal site)
(10,000 yen/tU) 1,600 1,600 1,600 1,600
Direct disposal (min value) (10,000 yen/tU) 13,200 13,700 17,400 24,900
Direct disposal (max value) (10,000 yen/tU) 15,700 16,300 20,100 27,600
Source: Data created by the Cabinet Office from data presented by utilities, Japan Atomic Energy Agency and Natural Resources and Energy Agency
11/10/2011 Technical Subcommittee on Nuclear Power, Nuclear Fuel Cycle, etc., Data Sheet 1

Costs of Individual Operations by Processes
Comparison of Previous and Present Cost SortingCategory of cost in the present
estimationCategory of cost in the
previous estimation Reference data in the present estimation
Uranium fuel - Latest procurement results of utilities (2008 to 2010)
MOX fuel MOX fuel fabricationIncrease in the total operation costs from the estimation used at Cost Subcommittee in 2004 (increase from 120 billion to 190 billion yen) in line with the latest trends of construction costs.
Reprocessing, etc.
ReprocessingHLW storageHLW transportationTRU waste disposal /storageTRU disposalReprocessing plant
decommissioningmeasures
Estimated was based on the costs of reprocessing, etc. estimated by the Government (METI) according to the law and in line with the latest notices from utilities and Japan Nuclear Fuel Ltd. The costs of emergency safety measures reported by Japan Nuclear Fuel Ltd. were also included.Compared with assumptions by the Cost Subcommittee, cost sorting presented by utilities and Japan Nuclear Fuel Ltd. differs from the previous one due to difference in the classification of actual facilities, and to the emphasis of Japan Nuclear Fuel Ltd. on the total cost management in order to promote efficiency, dissolve accumulated losses, and gain profits as a private company.
Spent fuel transportation (NPPReprocessing)
SF transportation to reprocessing plant
The latest quantity of transportation and contract rates was reflected on the estimation used at the Cost Subcommittee in 2004.
Spent fuel transportation(NPP→ Interim storage)
SF transportation to int. storage site
The latest quantity of transportation and contract rates were reflected on the estimation used at the Cost Subcommittee in 2004.
Interim storage Interim storageThe latest trends of construction costs (Mutsu, decrease from 130 billion to 100 billion yen) was reflected on the estimation used at the Cost Subcommittee in 2004.
Disposal of HL radwaste HLW disposal Estimation was made in line with the latest disposal costs estimated by the government (METI) according to the law.
Spent fuel transportation (Interim storage Direct disposal site) - Transportation costs to the interim storage site were applied.
Direct disposal - The latest perspectives and integrated value were reflected on the estimation in the Technical Subcommittee[1] in 2004.
[1] AEC Technical Subcommittee of the New Nuclear Policy-Planning Council (2004)http://www.aec.go.jp/jicst/NC/tyoki/tyoki_gijyutu.htm
2911/10/2011 Technical Subcommittee on Nuclear Power, Nuclear Fuel Cycle, etc., Data Sheet 1

Costs of Individual Operations by Processes
Cost Estimates (Reprocessing, etc.)
Cost per ton = Reprocessing cost [converted to base year’s value] / Reprocessing Amount [converted to base year’s value]
30
Base Year
11/10/2011 Technical Subcommittee on Nuclear Power, Nuclear Fuel Cycle, etc., Data Sheet 1
25.827.9
22.6
19.1 18.7 18.1 18.6 18.517.2
15.4
10.4 10.1
5.2 4.2
0.8 1.10.0
5.0
10.0
15.0
20.0
25.0
30.020
05 -
2009
2010
-20
14
2015
-20
19
2020
-20
24
2025
-20
29
2030
-20
34
2035
-20
39
2040
-20
44
2045
-20
49
2050
-20
54
2055
-20
59
2060
-20
64
2065
-20
69
2070
-20
74
2075
-20
79
2080
-20
84
(10 billion yen/year)
140181104 80
320
480
640
800800800800800800800800800800800800800800800800800800800800800800800800800800800800800800800800800800800800800
0
200
400
600
800
1,000
800
(ton/year)
Converted to present values
Converted to present values
Reprocessing costs
Reprocessing operation plan

Nuclear Fuel Cycle Cost
Costs for Various Models (1) - Discount rate: 0% and 1% -
Note) The total may not correspond to the sum of all the items due to rounding. (Electricity generation at sending end)
31
(yen/kWh)
ItemDiscount rate: 0% Discount rate: 1%
Reprocessing model
Direct disposal model
Latestmodel
Reprocessing model
Direct disposal model
Latestmodel
Uranium fuel 0.62 0.72 0.62 0.65 0.75 0.68
MOX fuel 0.17 - 0.17 0.16 - 0.12
(Front-end total) 0.79 0.72 0.79 0.82 0.75 0.80
Reprocessing, etc. 1.10 - 1.10 1.06 - 0.79
Interim storage - 0.14 0.07 - 0.12 0.06
HLW disposal 0.24 - 0.24 0.16 - 0.12
Direct disposal - 0.41 - 0.48 - - 0.24 -0.28 -
(Back-end total) 1.34 0.56 -0.63 1.41 1.21 0.37 - 0.41 0.98
Total 2.14 1.28 - 1.35 2.21 2.03 1.11 - 1.15 1.78
11/10/2011 Technical Subcommittee on Nuclear Power, Nuclear Fuel Cycle, etc., Data Sheet 1

Nuclear Fuel Cycle Cost
Costs for Various Models (2) - Discount rate: 3% and 5% -
Note) The total may not correspond to the sum of all the items due to rounding.
32
(yen/kWh)
ItemDiscount rate: 3% Discount rate: 5%
Reprocessing model
Direct disposal model
Latestmodel
Reprocessing model
Direct disposal model
Latestmodel
Uranium fuel 0.73 0.81 0.77 0.81 0.88 0.86
MOX fuel 0.15 - 0.07 0.14 - 0.04
(Front-end total) 0.88 0.81 0.84 0.94 0.88 0.90
Reprocessing, etc. 1.03 - 0.46 1.04 - 0.30
Interim storage - 0.09 0.05 - 0.07 0.04
HLW disposal 0.08 - 0.04 0.05 - 0.01
Direct disposal - 0.10 - 0.11 - - 0.05 - 0.05 -
(Back-end total) 1.11 0.19 - 0.21 0.55 1.08 0.12 - 0.12 0.36
Total 1.98 1.00 - 1.02 1.39 2.03 1.00 - 1.01 1.26
11/10/2011 Technical Subcommittee on Nuclear Power, Nuclear Fuel Cycle, etc., Data Sheet 1
(Electricity generation at sending end)

Nuclear Fuel Cycle Cost
Comparison with Previous Estimation (1) - Discount rate: 3% -
33
Discount rate: 3% (yen/kWh)
Item Reprocessing model
Latest model Direct disposal model
Present Cost Subcom. in 2004 Present Tech, Subcom.
in 2004
Uranium fuel 0.73 0.77 0.59 0.81 0.64 MOX fuel 0.15 0.07 0.07 - -(Front-end total) 0.88 0.84 0.66 0.81 0.64 Reprocessing, etc. 1.03 0.46 0.65 - -
Interim storage - 0.05 0.04 0.09 0.12 HLW disposal 0.08 0.04 0.12 - -Direct disposal - - - 0.10 - 0.11 0.12 - 0.21(Back-end total) 1.11 0.55 0.81 0.19 - 0.21 0.24 - 0.33
Total 1.98 1.39 1.47 1.00 - 1.02 0.9 - 1.0Note 1) The total may not correspond to the sum of all the items due to rounding.Note 2) The unit of contribution (2% discount rate) was uniformly applied to the HLW disposal in the estimation in 2004,
while costs were estimated at different discount rates in this estimation.
11/10/2011 Technical Subcommittee on Nuclear Power, Nuclear Fuel Cycle, etc., Data Sheet 1

Nuclear Fuel Cycle Cost
Comparison with Previous Estimation (2)- Discount rate: 0% -
34
Discount rate: 3% (yen/kWh)
Item Reprocessing model
Latest model Direct disposal model
Present Cost Subcom. in 2004 Present Tech, Subcom.
in 2004
Uranium fuel 0.62 0.62 0.49 0.72 0.57 MOX fuel 0.17 0.17 0.11 - -(Front-end total) 0.79 0.79 0.60 0.72 0.57 Reprocessing, etc. 1.10 1.10 1.05 - -
Interim storage - 0.07 0.06 0.14 0.18 HLW disposal 0.24 0.24 0.12 - -Direct disposal - - - 0.41 - 0.48 0.51 - 0.87(Back-end total) 1.34 1.41 1.23 0.56 - 0.63 0.69 - 1.05
Total 2.14 2.21 1.83 1.28 - 1.35 1.26 - 1.62Note 1) The total may be inconsistent owing to round-off of individual values.Note 2) The unit of contribution (2% discount rate) was uniformly applied to the HLW disposal in the estimation in 2004,
but costs were estimated at different discount rates in this estimation.Note 3) The direct model at 0% discount rate was omitted from estimation in 2004, but estimated this time for
comparison using the method used in 2004.
11/10/2011 Technical Subcommittee on Nuclear Power, Nuclear Fuel Cycle, etc., Data Sheet 1

Nuclear Fuel Cycle Cost
Results of Estimation Front-end
In addition to yen appreciation in the exchange rate, substantial increases in the uranium concentrate price affect the costs of the direct disposal model.
The proportion of MOX fuel loaded in reactors is small and the effects of MOX fuel cost in the front-end costs are insignificant.
Reprocessing, etc. The difference between the costs of the reprocessing and direct disposal models is
about 1 yen/kWh (at 3% discount rate), and this is caused by the presence of reprocessing etc.
When the nuclear fuel recycle is included, the difference between the costs of the reprocessing and latest models is about 0.6 yen/kWh (at 3% discount rate), and this is caused by the length of storage period.
35
A comprehensive evaluation of various nuclear fuel recycle options will becontinued, including the perspectives other than economical efficiency.
11/10/2011 Technical Subcommittee on Nuclear Power, Nuclear Fuel Cycle, etc., Data Sheet 1

Sensitivity Analysis of Nuclear Fuel Cycle Cost
Sensitivity Analysis (1) Reprocessing & MOX Cost The reprocessing, etc. and MOX fuel cost are subject to sensitivity analysis
using a sensitivity of 1.5 times of unit cost (sensitivity analysis case) for the latest model (basic case).
【Reprocessing, etc.】 Complete denial is hard for a potential decrease in the reprocessing
amount (reduced operating rate) due to the delayed achievement of the rated reprocessing quantity (800tU/year), and a potential increase in the cost of construction for the planned expansion of facilities in the future, and a possibility of additional investments for maintaining the operating rate.
【MOX fuel】 Construction cost have increased from 120 billion to 190 billion yen owing
mainly to 1) increases in the price of construction materials and 2) requirement of antiseismic installation. Complete denial is hard for a potential increase in the construction cost due to the same reasons until the time the construction is completed in March 2016.
3611/10/2011 Technical Subcommittee on Nuclear Power, Nuclear Fuel Cycle, etc., Data Sheet 1

Sensitivity Analysis of Nuclear Fuel Cycle Cost
Reasons of Setting 1.5 times in Sensitivity Analysis
Analysis includes the excess of case C in the range of a sensitivity of 1.5 times.
37
(ratio to 32k tons)
11/10/2011 Technical Subcommittee on Nuclear Power, Nuclear Fuel Cycle, etc., Data Sheet 1
(91%)K tos(88%)
K tons(84%)
K tons K tons(97%)
K tons(94%)
K tons(81%)
K tons
600 million yen/ton
500 million yen/ton
400 million yen/ton
300 million yen/ton
200 million yen/ton
100 million yen/ton
A
BC
2.5262728293031323.3
1.5 times of costs in present estimation560 million yen/ton
In case of increase of 3 trillion yen from present estimation
【Present estimation】Cost: 11.7 trillion yenReprocessing amount: 3.2 ktons (800 tons/year at the 5th year of operation)Unit price: 370 million yen/ton
Incase of present estimation
Uni
t Cos
t
Total Cost
Reprocessingplan
800 tons/yr
Unit Cost
3 trillion yen increase: Corresponds to cost increase equal to the construction cost of 3.3 trillion yen including the futureinvestment amount.
Reprocessing q'ty
C11.7 trillion yen
Present A B
Same as presentPresent estimate Present estimate+ 3 trillion yen + 3 trillion yen
(5 yr delay)5th yr of operation (same as present) (5 yr delay)
10th yr 5th yr 10th yr
32k tons 30k tons 32k tons 30k tons370 million
yen/ton390 million yen/ton 460 million yen/ton 490 million yen/ton
(30% increase)(25% increase)(5% increase)

Sensitivity Analysis of Nuclear Fuel Cycle Cost
Results of Sensitivity Analysis (1) Reprocessing and MOX costs
38
(Discount rate: 3%) (yen/kWh)
ItemLatest model
Basic case Sensitivity analysis case Cost ratio
Uranium fuel 0.77 ---
MOX fuel 0.07 0.10 1.5
Reprocessing, etc. 0.46 0.68 1.5
Interim storage 0.05 ---
HLW disposal 0.04 ---
Total 1.39 1.64 1.2
11/10/2011 Technical Subcommittee on Nuclear Power, Nuclear Fuel Cycle, etc., Data Sheet 1
Sensitivity Analysis of Nuclear Fuel Cycle Cost
Sensitivity Analysis (2) Front-end Costs The element of uranium concentrate in the uranium fuel price is
subject to sensitivity analysis using a sensitivity of 2.0 times (sensitivity analysis case) for the reprocessing, direct disposal and latest models (basic cases). The present spot uranium price is approx. $140/kgU, but the fluctuation in
the latest three years ranged $100 to $180/kgU. There is no publication for future price estimates by public organizations,
but the report by OECD/NEA and IAEA is attached for reference. "Uranium 2009” (July 2010) published by OECD/NEA and IAEA analyzed the
amount of resources based on the new product costs up to $260/kgU (formerly up to $130/kgU) which reflect the rising uranium production costs and the basic moves of the uranium markets.
Considering the sharply rising spot uranium, which once exceeded $260/kgU, the future hike of the uranium price around twice the present level is taken into account.
3911/10/2011 Technical Subcommittee on Nuclear Power, Nuclear Fuel Cycle, etc., Data Sheet 1

Sensitivity Analysis of Nuclear Fuel Cycle Cost
Future Prospects of Uranium Demand (1) Uranium demand in 2030 will be about twice the present level.
“Recent Trends of Uranium Resources” (Nov.2010), Sudo, JAEA
4011/10/2011 Technical Subcommittee on Nuclear Power, Nuclear Fuel Cycle, etc., Data Sheet 1
Evaluation body
Evaluation case
Demand in 2008
Demand in 2015
Demand in 2020
Demand in 2025
Demand in 2030
Demand in 2035
Low case
High case
Low case
High case
Reference case
Sensitivity Analysis of Neclear Fuel Cycle Cost
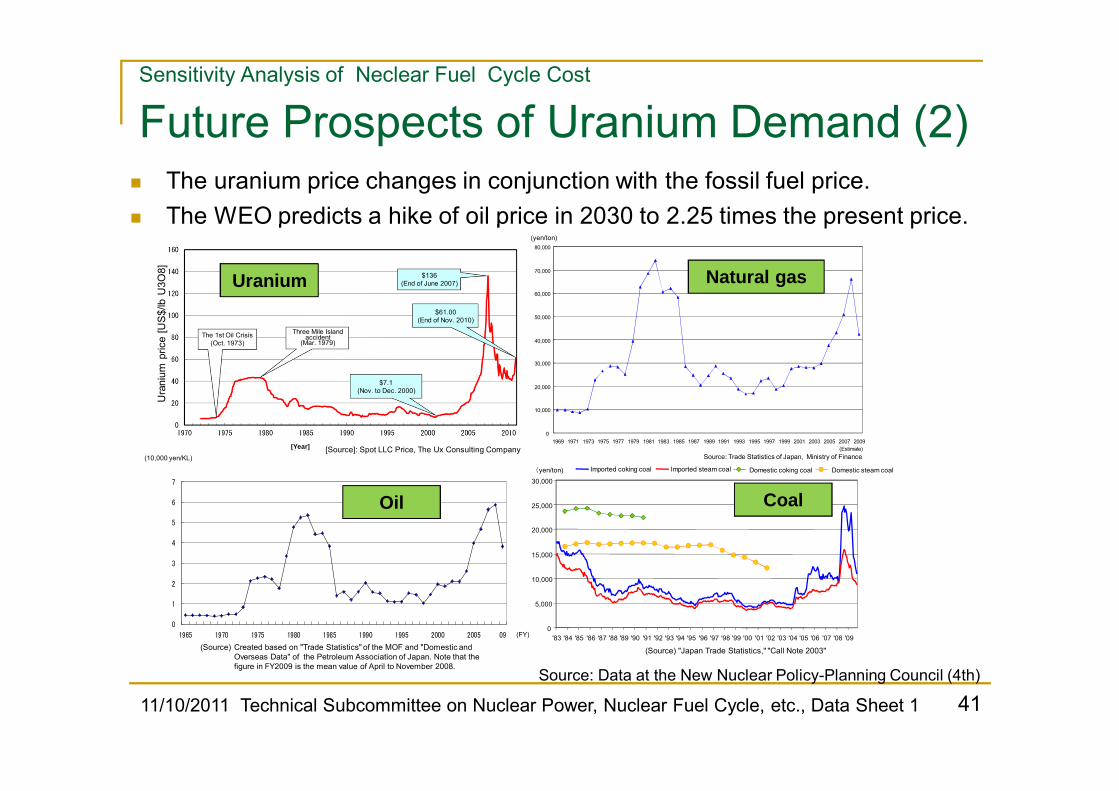
Future Prospects of Uranium Demand (2) The uranium price changes in conjunction with the fossil fuel price. The WEO predicts a hike of oil price in 2030 to 2.25 times the present price.
0
1
2
3
4
5
6
7
1965 1970 1975 1980 1985 1990 1995 2000 2005 09
(万円/kL)
(年度)
ウラン
Oil Coal
(yen/ton)
図の追加
0
10,000
20,000
30,000
40,000
50,000
60,000
70,000
80,000
1969 1971 1973 1975 1977 1979 1981 1983 1985 1987 1989 1991 1993 1995 1997 1999 2001 2003 2005 2007 2009(Estimate)
Source: Trade Statistics of Japan, Ministry of Finance
(Source) "Japan Trade Statistics," "Call Note 2003"(Source) Created based on "Trade Statistics" of the MOF and "Domestic and Overseas Data" of the Petroleum Association of Japan. Note that the figure in FY2009 is the mean value of April to November 2008.
Natural gas
Source: Data at the New Nuclear Policy-Planning Council (4th)
4111/10/2011 Technical Subcommittee on Nuclear Power, Nuclear Fuel Cycle, etc., Data Sheet 1
0
5,000
10,000
15,000
20,000
25,000
30,000
'83 '84 '85 '86 '87 '88 '89 '90 '91 '92 '93 '94 '95 '96 '97 '98 '99 '00 '01 '02 '03 '04 '05 '06 '07 '08 '09
(yen/ton) Imported coking coal Imported steam coal Domestic coking coal Domestic steam coal
Uranium
Ura
nium
pric
e [U
S$/
lb U
3O8]
The 1st Oil Crisis (Oct. 1973)
Three Mile Island accident
(Mar. 1979)
$136(End of June 2007)
$61.00(End of Nov. 2010)
$7.1(Nov. to Dec. 2000)
[Source]: Spot LLC Price, The Ux Consulting Company(10,000 yen/KL)
(FY)
[Year]
Coal

Sensitivity Analysis of Nuclear Fuel Cycle Cost
Results of Sensitivity Analysis (2) Front-end Costs
42
(yen/kWh)
Item
Reprocessing model Direct disposal model Latest model
Basic case
Sensitivity analysis
caseCost ratio Basic
case
Sensitivity analysis
caseCost ratio Basic
case
Sensitivity analysis
caseCost ratio
Uranium fuel 0.73 1.04 1.4 0.81 1.16 1.4 0.77 1.10 1.4
MOX fuel 0.15 --- --- --- --- 0.07 ---
Reprocessing, etc. 1.03 --- --- --- --- 0.46 ---
Interim storage --- --- --- 0.09 --- 0.05 ---
HLW disposal 0.08 - --- --- --- 0.04 ---
Direct disposal --- --- --- 0.10 -0.11 --- --- --- ---
Total 1.98 2.29 1.2 1.00 -1.02
1.35 -1.36 1.3 - 1.4 1.39 1.72 1.2
11/10/2011 Technical Subcommittee on Nuclear Power, Nuclear Fuel Cycle, etc., Data Sheet 1

Sensitivity Analysis of Nuclear Fuel Cycle Cost
Results of Sensitivity Analysis (3) Burial Disposal Costs
The HLW disposal and direct disposal are subject to sensitivity analysis with 1.5 times costs. Discount rate: 3% (yen/kWh)
ItemDirect disposal model Latest model
Basic case Sensitivity analysis case Cost ratio Basic case Sensitivity
analysis case Cost ratio
U fuel 0.81 - 0.77 -
MOX fuel - - - 0.07 -
Reprocessing, etc. - - - 0.46 -
Interim storage 0.09 - 0.05 -
HLW disposal - - - 0.04 0.05 -
Direct disposal 0.10 - 0.11 0.15 - 0.17 - - - -
Total 1.00 - 1.02 1.05 - 1.07 1.05 - 1.05 1.39 1.41 1.01
The impact on the whole cycle is on order of 1% in the latest model which contains HLW disposal, or 5% in the direct disposal model though the latter depends on the disposal method.
4311/10/2011 Technical Subcommittee on Nuclear Power, Nuclear Fuel Cycle, etc., Data Sheet 1

44
Plutonium and Recovered Uranium Credits
Handling of the Pu Credit If the Pu credit is decided, the uranium fuel cycle cost is given by subtracting the Pu credit from
the sum of the front-end costs (uranium refining, conversion, enrichment and fabrication) and back-end costs (reprocessing, waste disposal) in one cycle from the initial loading of uranium fuel on the reactor to the discharge of it from the reactor, and then dividing it with the amount of generation.
The MOX fuel cycle cost is given by adding the Pu credit as expenses for purchasing plutonium to the MOX fuel fabrication costs.
However, there is no plutonium market in the world, and in Japan, the utilities are supposed to sustain the peaceful use of plutonium, recovered from the reprocessing of spent fuel, in their reactors in principle (each utility should make its plutonium utilization plan public).
As the uranium price significantly varies, and the instability of MOX fuel fabrication costs is undeniable, the Pu credit is difficult to decide, and depending on the assumption, it can be either negative or positive.
Hence, a technique to repeat the cycle of utilizing plutonium produced in nuclear power generation in an infinite period of time is used in the conventional calculation of fuel cycle cost to avoid the need to handle the Pu credit explicitly.
Although the recycle is infinite, the infinite series in the integration of the cost and generated energy will, with certainly, converge because 1) the delay of time results in a discount, and 2) the proportion of reproducing MOX fuel from the reprocessing of LWR spent fuel is smaller than 1.
Source: Japan Nuclear Fuel Ltd(The 4th Data, No. 2)11/10/2011 Technical Subcommittee on Nuclear Power, Nuclear Fuel Cycle, etc., Data Sheet 1

45
Plutonium and Recovered Uranium Credits
Calculation of the Pu Credit The figure shows an example of calculating
the Pu credit that makes the fuel cycle costs of uranium fuel and MOX fuel equal (indifference value).
The Pu credit is negative at the uranium price of $50/lb U3O8 and the present MOX fuel fabrication cost, but turns to positive if the uranium price, having the records in the past, rises sharply.
Changes in the conditions, such as increase in the uranium or MOX fuel reprocessing costs, can make the Pu credit either positive or negative.
$160/kgU (equivalent to $24/gPuf) in the report of the Boston Consulting Group (BCG), and ‐$15,743/kgPu (equivalent to -$24/gPuf) in the report of Massachusetts Institute of Technology (MIT) are within the results of this calculation.
Source: Japan Nuclear Fuel Ltd. (Data No. 2 at the 4th meeting)
11/10/2011 Technical Subcommittee on Nuclear Power, Nuclear Fuel Cycle, etc., Data Sheet 1
0
0.5
1
1.5
2
2.5
3
-60 -40 -20 0 20 40 60Pu credit ($/gPuf)
U fuel ($150/lb U3O8)U fuel ($100/lb U38)U fuel ($150/ob U3O8)MOX fuel
A
B
C
Sing
le c
ycle
fuel
cos
t (ye
n/kW
h)
46
Plutonium and Recovered Uranium Credits
Handling of the Recovered Uranium Credit
Source: Japan Nuclear Fuel Ltd. (Data No. 2 at the 4th meeting)
11/10/2011 Technical Subcommittee on Nuclear Power, Nuclear Fuel Cycle, etc., Data Sheet 1
The conversion, re-enrichment and fabrication of recovered uranium may save expenses for purchasing uranium concentrate (recovered uranium price).
The recent improvements in burnup has contributed to reducing the residual concentration of recovered uranium, and soon it cannot be said "significantly expensive" in comparison with natural uranium.
There is a tendency to increase the separative work unit (SWU) for 236U produced by uranium burnup and causing burnup reactivity losses due to neutron absorption.
The daughter nuclides of 232U and 234U contained in the spent fuel also emit strong gamma rays, and shielding is necessary in the conversion, enrichment and fabrication processes, which increases the processing costs.
Meanwhile, no design is made for the recovered uranium utilization process, a post-process at the Rokkasho Reprocessing Plant, and cost estimation is not available.
If increase in the uranium concentrate price makes the use of recovered uranium beneficial, and recovered uranium is significantly accumulated in the operation at the reprocessing plant for re-enrichment and utilization, the fuel cycle costs will definitely decrease.
Only the increase in the cost required for storing recovered uranium is included in the present fuel cycle cost estimation, and the reduction in the recovered uranium credit is not taken into account.

47
Plutonium and Recovered Uranium CreditsCosts of Fuel Acquired from Re-enrichment of Recovered Uranium
The figure shows a comparison of the costs of fuel acquired from the enrichment of natural uranium and the re-enrichment of recovered uranium (converted to the initial loading values).
Even if the costs of the conversion, enrichment, and fabrication of recovered uranium is 1.5 times those of the natural uranium, the benefit is already obvious with the current uranium price of $ 50/lb U3O8.
Even if the front-end cost of the recovered uranium are twice that of the natural uranium, the refining cost of $70/lb U3O8 makes the both equal.
In short, benefits of the re-enrichment of recovered uranium are likely to be realized.
Source: Japan Nuclear Fuel Ltd. (Data No. 2 at the 4th meeting)
11/10/2011 Technical Subcommittee on Nuclear Power, Nuclear Fuel Cycle, etc., Data Sheet 1
0
5,000
10,000
15,000
20,000
25,000
30,000
35,000
40,000
45,000
50,000
0 50 100Natural uranium price ($/lb U3O8)
U fuel
Recovered U fuel
Recovered U fuel*1.5
Recovered U fuel*2.0
A
B
Fuel
acq
uisi
tion
cost
(10,
000y
en/to
n)

48
Plutonium and Recovered Uranium Credits
Calculation of Recovered Uranium Credit The figure shows an example of calculating the
recovered uranium credit that makes the fuel cycle costs of enriched natural uranium fuel and re-enriched recovered uranium fuel equal (indifference value).
Assuming the conversion, enrichment and fabrication costs of recovered uranium are 1.5 times those of natural uranium, the recovered uranium credit which is equal to the natural uranium price of $50/lb U3O8 is $50/kg RU.
If the natural uranium price is $100/lb U3O8, the recovered uranium credit can be slightly less than $100/kg RU even though the front-end cost of recovered uranium fuel are double.
$30/kg SF (equivalent to $32/kg RU) in the BCG report, and $108.3/kg RU in the MIT report fall into this calculation.
11/10/2011 Technical Subcommittee on Nuclear Power, Nuclear Fuel Cycle, etc., Data Sheet 1
1
1.2
1.4
1.6
1.8
2
0 50 100 150
Recovered uranium credit ($/kgRU)
U fuel $0/lb U3O8U fuel $50/lb U3O8U fuel $100/lb U3O8Recovered U fuel*1.0Recovered U fuel*1.5Recovered U fuel *2.0
A
B
Sing
le c
ycle
fuel
cos
t (ye
n/kW
h)
Source: Japan Nuclear Fuel Ltd. (Data No. 2 at the 4th meeting)

The fuel cycle cost was estimated for a single cycle with the Pu credit (-$40/g Puf) and recovered U credit ($50/kg RU) taken into account for evaluating the effects of these credits.
In the infinite cycle calculation, the Pu credit is offset, while the processing costs for MOX fuel are explicitly taken into account. This makes the calculation results using these credits almost equal.
49
Plutonium and Recovered Uranium Credits
Consideration with Pu and Recovered U Credits
11/10/2011 Technical Subcommittee on Nuclear Power, Nuclear Fuel Cycle, etc., Data Sheet 1
1.39 1.39 1.36 1.38
0
0.5
1
1.5
Infinite recyclereference
Single cycle with Pu credit
Single cyclewith recoveredU credit
Single cyclewith Pu andrecovered Ucredits
Sing
le c
ycle
fuel
cos
t (ye
n/kW
h)
Source: Japan Nuclear Fuel Ltd. (Data No. 2 at the 4th meeting)
Hence, the LWR fuel cost may be estimated using a simplified calculation with the Pu credit and without MOX fuel (=0), and the difference from the result of a full calculation is not significant.
The difference caused by the presence or absence of the recovered uranium credit is significant because the use of recovered uranium is not considered in the calculation of the present fuel cycle cost (infinite recycle).
The calculation is made according to the fact that the half of spent fuel is sent to the interim storage facilities.

Reference
5011/10/2011 Technical Subcommittee on Nuclear Power, Nuclear Fuel Cycle, etc., Data Sheet 1
Calculation of Nuclear Fuel Cycle Costs
51
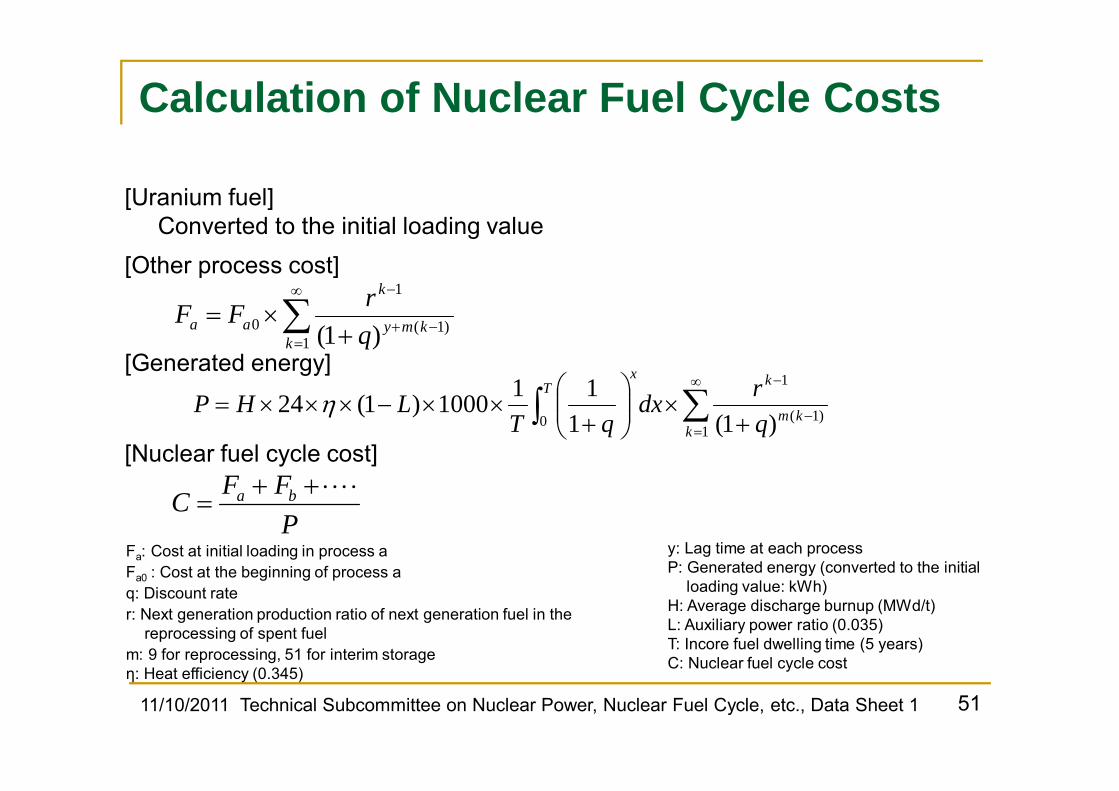
[Uranium fuel]Converted to the initial loading value
[Other process cost]
[Generated energy]
Fa: Cost at initial loading in process aFa0 : Cost at the beginning of process aq: Discount rater: Next generation production ratio of next generation fuel in the
reprocessing of spent fuelm: 9 for reprocessing, 51 for interim storageη: Heat efficiency (0.345)
1
)1(
1
0 )1(1111000)1(24
kkm
kxT
qrdx
qTLHP
1)1(
1
0 )1(kkmy
k
aa qrFF
[Nuclear fuel cycle cost]
y: Lag time at each processP: Generated energy (converted to the initial
loading value: kWh)H: Average discharge burnup (MWd/t)L: Auxiliary power ratio (0.035)T: Incore fuel dwelling time (5 years)C: Nuclear fuel cycle cost
PFFC ba
11/10/2011 Technical Subcommittee on Nuclear Power, Nuclear Fuel Cycle, etc., Data Sheet 1

Nuclear Fuel Cycle Cost Calculation Sheet (Reprocessing Model) -Example-
5211/10/2011 Technical Subcommittee on Nuclear Power, Nuclear Fuel Cycle, etc., Data Sheet 1
Cost 0% 1% 3% 5%U fuel (10,000 yen/tU) 25,900 26,200 27,100 28,200MOX fuel (10,000 yen/tHM) 40,600 40,700 41,500 42,700Reprocessing, etc. (10,000 yen/tU) 37,000 37,600 40,800 46,200Transport to reprocessing (10,000 yen/tU) 1,700 1,700 1,700 1,700HLW disposal (10,000 yen/tU) 8,500 8,700 11,000 15,700
Discount rate 3% Lag time Cost (yen/kWh)
Generated energy (kWh/t) 3.9E+08 U fuel 7.3E-01MOX fuel 8 1.5E-01Reprocessing, etc. 8 9.8E-01Transport to reprocessing 6 4.3E-02HLW disposal 48 8.1E-02
Total 1.98

Time Axis of Scenario
53
*1 According to the previous technical subcommittee.*2 The actual current domestic cycle is reflected.*3 An intermediate phase between the 10th year when transporting to the interim storage facility
starts and the 58th year when transport to the disposal site starts.*4 The 40th year from reprocessing.
PP: Power Plant, RP: Reprocessing Plant, IS: Interim Storage Facility, DD: Direct Disposal Site
*1 *2
*1
*1
*1
*2
*1,3
*1
*1
*1
*1
*1
*1
*1
*1
*1 *1,4 *1,4
11/10/2011 Technical Subcommittee on Nuclear Power, Nuclear Fuel Cycle, etc., Data Sheet 1
(year)
Reprocessing Interim storage
MOX fuel 8 25 50Reprocessing, etc. 8 25 50SF transport (PPRP) 6 6 50SF transport (PPIS) 10 10SF transport (ISDD) 58
Interim storage 34 30HLW disposal 48 65 90Direct disposal 59
Direct disposalmodel
Latest modelProcess
Reprocessingmodel

Total Operation Cost for Direct Disposal Model
Rock type Estimation case
Emplacement
method
No. of Stored bodies
No. of sites
Previous total cost (trillion yen)
Current total cost (100 million yen)
0% 1% 3% 5%
Soft rock
1Vertical
2 1 7.80 50,114 43,139 38,258 39,789
2 4 1 6.03 42,222 36,355 33,191 35,847
Hard rock 1 Vertical 2 1 5.33 46,518 40,021 35,755 37,877
(Note) The year to start operation (the 35th year) is set as the base year.
5411/10/2011 Technical Subcommittee on Nuclear Power, Nuclear Fuel Cycle, etc., Data Sheet 1

55
Overseas Cycle Cost Estimates (1)
BCG Report (2006)
Recycling is dominant.
Direct disposal is dominant.Basic case
Sameeconomicalefficiency
Repository cost
Uranium price
($/kg, discount rate: 3%)
Source: “Economic Assessment of Used Nuclear Fuel Management in the United States” 2006, Boston Consulting Group (BCG)
Direct disposal Reprocessing
Item Before discount
After discount Item Before
discountAfter
discount
Interim storage 150 125 Integrated recycling facilities 630 525
Final disposal 700 320 Final disposal 175 80
Transport (SF) 70 55 Transport (SF, HLW) 95 75
Pu/U credit -190 -160
Total 920 500 710 520
Reprocessing with the integrated recycling facilities (reprocessing & MOX fabrication facilities)
11/10/2011 Technical Subcommittee on Nuclear Power, Nuclear Fuel Cycle, etc., Data Sheet 1

Overseas Cycle Cost Estimates (2)
MIT Report (2011)
Source: “The Future of Nuclear Fuel Cycle” 2010, Massachusetts Institute of Technology (MIT)
Direct disposal Reprocessing1st cycle: U fuel
Reprocessing2nd cycle: MOX fuel
U 2.76 U 2.76 DU 0.03
Pu -4.39
Fuel production 4.35 Fuel
production 4.35 Fuel production 7.38
Back-end 1.30 Reprocessing 2.36 Back-end 6.96
HLW disposal 0.4
Recovered U price -0.14
Recovered Puprice 0.25
Total fuel cost 8.41 Total fuel cost 9.98 Total fuel cost 9.98
Direct disposalOne-time
reprocessing
1stcycle
2ndcycle
* In this reprocessing scenario, uranium fuel is loaded in the 1st cycle, and the MOX fuel is loaded in the 2nd cycle.
(mill/kWh)
5611/10/2011 Technical Subcommittee on Nuclear Power, Nuclear Fuel Cycle, etc., Data Sheet 1

Overseas Cycle Cost Estimates (3)
OECD/NEA Report (2010)
Source: “Projected Costs of Generating Electricity” 2010 edition, OECD/NEA
Costs of nuclear, coal, gas and wind generation(Discount rate: 5%)
There is no detailed analysis on the nuclear fuel cycle, and the following assumption is used for all estimates:
Front-end: $7/MWhBack-end: $2.33/MWh
5711/10/2011 Technical Subcommittee on Nuclear Power, Nuclear Fuel Cycle, etc., Data Sheet 1


![[IAEA_2009] Nuclear Fuel Cycle](https://img.pdfslide.us/doc/110x75/54f458884a7959a1318b45c3/iaea2009-nuclear-fuel-cycle.jpg)