Embed Size (px)
Citation preview
TECHNICAL SERVICE RESPONSE NO.: UT025
Subject: Analysis of the Dress Worn by Betty Hill During the September 19, 1961 Abduction in New Hampshire
Betty Hill and author with dress worn during the abduction (7-7-2002).
Date: October 19, 2003 Reported By: P. A. Budinger Analytical Scientist Background/Objective:
Synopsis of the Abduction Event
This famous case is well documented in many publications and on many internet web sites. The reader is directed to these easily locatable literature references for the details. The reader is especially directed to the classic book on the event, “The Interrupted Journey”1, and “The UFO Encyclopedia”2. A brief scenario follows. On September 19, 1961, Betty and Barney Hill, along with dachshund “Delsey”, were returning home (Portsmouth, New Hampshire) from an extended weekend pleasure trip to Canada. Their itinerary took them to Niagara Falls, then to Montreal, and home. They were traveling south on US Route 3 in central New Hampshire. At
1 John J, Fuller, The Interrupted Journey: Two Lost Hours “Aboard a Flying Saucer,” The Dial Press, New York, 1966. 2 Jerome Clark, “The UFO Encyclopedia The Phenomenon from the Beginning”, Omnigraphics, Inc., Detroit, MI, 2nd Edition, Volume 1: Page 489 – 504.
T. S. R. No.: UT025 P. A. Budinger Page 2 approximately 10:15 they noted a “bright star” which appeared to move erratically. They continued to observe it as it apparently paced them and got closer and closer. Barney stopped to retrieve a 0.22 pistol from the trunk. After resuming the drive, both Betty and Barney looked at the object through binoculars. They observed a spinning, flattened circular disk with multicolored lights on the rim. About two miles north of North Woodstock, the object descended and hovered about 100 feet in the air. No spinning was noted. A blue-white fluorescent glow shone through its windows. The object appeared to be the size of a 4-engine aircraft. Barney stopped the car and got out. He could see several uniformed, human-like figures. He suspected they were about to be abducted, jumped in the car, and raced down the road. Suddenly an irregular beeping sound was heard. The Hills felt a tingling sensation and became drowsy. The next thing they remembered was a second series of beeps as they were passing through Plymouth. The craft was gone. Two hours of missing time were noted. They both felt clammy and dirty, and Barney suffered other physical problems. Hypnosis of both Barney and Betty suggested they had been abducted. Both Betty and Barney were subjected to physical examinations. Further details of what may have occurred can be found in previous cited references. The object of this report is to document the analysis of the dress worn by Betty Hill during the abduction.
Dress History To my knowledge many details on the history of the dress worn during the abduction event are not documented, though some are. The dress Betty wore on that fateful night was new. She had worn it only one other day during that weekend, but not the day before the abduction. Therefore, it had never been laundered. The weather on the night of the event was unusually warm for that time of year, and it was not exceptionally humid.3 When the abduction began, Betty recalls that two beings were on each side and escorted her with their “hands” under her armpits to the craft. Betty related she put up a “helluva fight” before she crossed the threshold of the craft4. I asked whether she hit with her hands. She said, “No, I kicked like hell”, because her arms were restricted. The dress probably suffered stresses. While on the craft she remembers that half way through the physical examination they decided to remove the dress. They had difficulties with the zipper. Once removed, the dress ended up on the floor of the craft in a heap. After the event, when Betty and Barney arrived home, she undressed to go to bed. Betty related the following in a letter to me dated October 31, 2001. “When I returned home that morning, I put my dress, folded, in the bottom of my closet, where it remained for several days. When I removed it, it was covered with a pink powder. So I threw it in the trash, but quickly changed my mind. I decided to put it outdoors in the sun. The powder blew away, but leaving the stains.” Barney
3 Betty Hill, Personal communication, 10-29-2002. There was a hurricane coming from the south but it didn’t hit NH. The next day it did bring rain. 4 Betty Hill, Personal communication 7/7/2002.
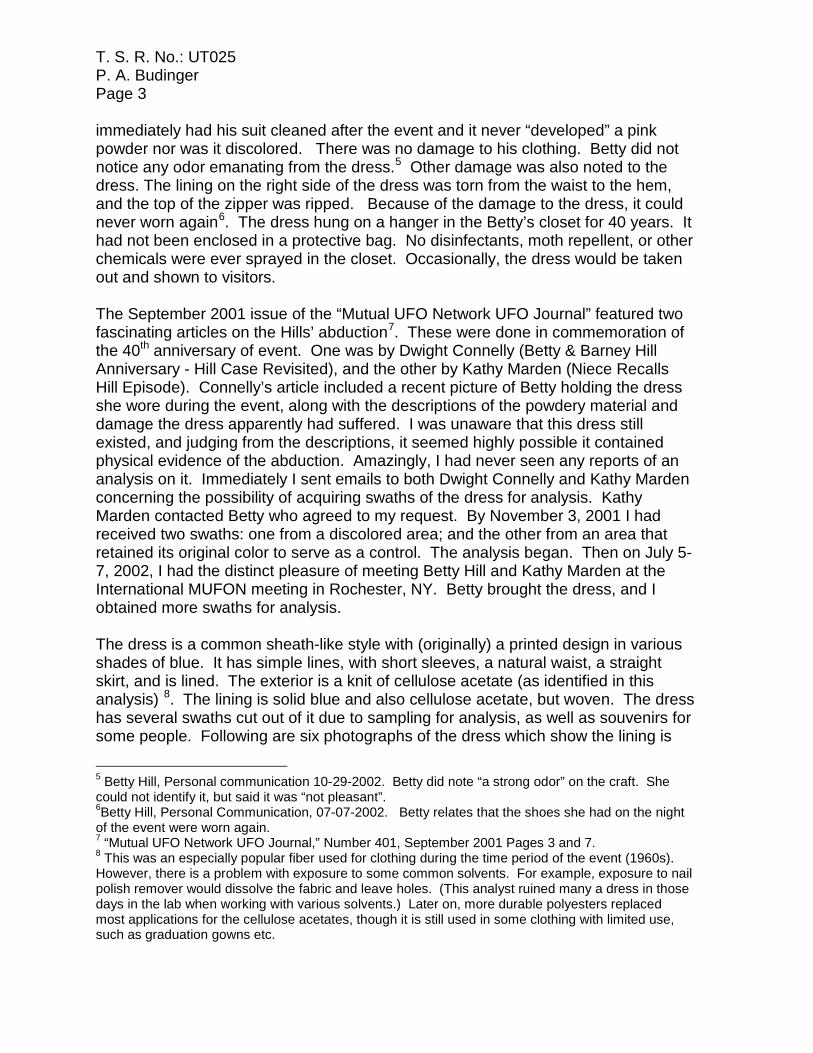
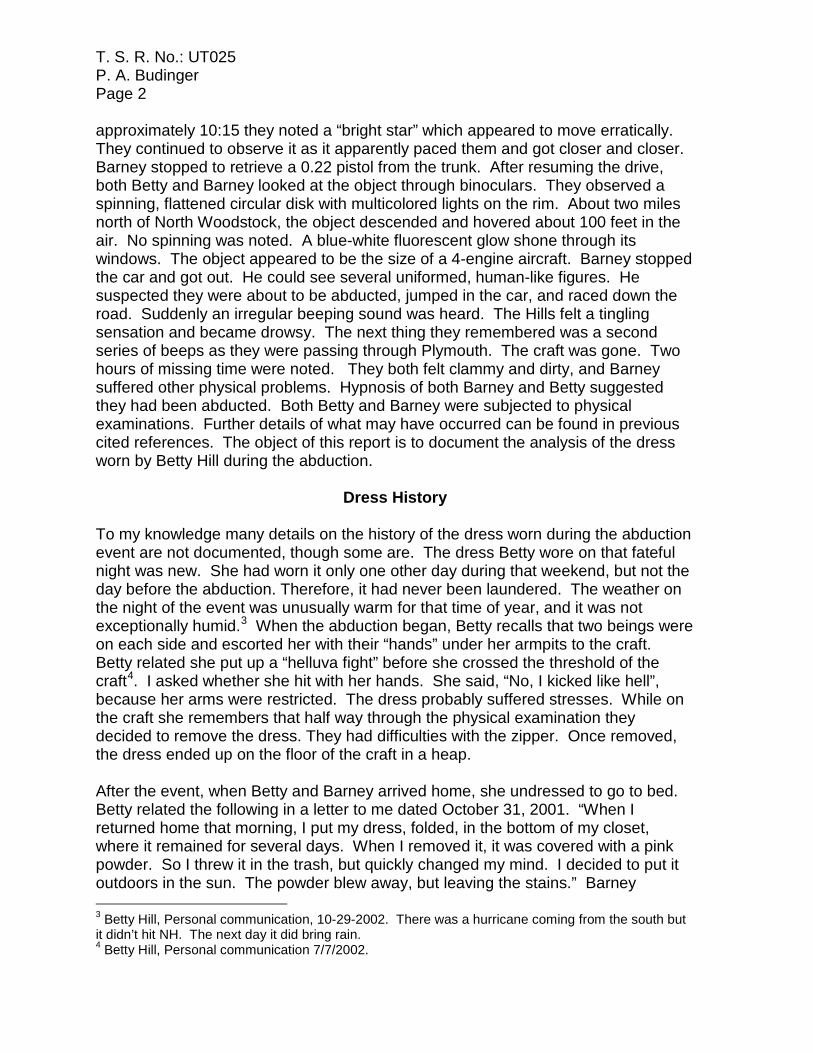
T. S. R. No.: UT025 P. A. Budinger Page 3 immediately had his suit cleaned after the event and it never “developed” a pink powder nor was it discolored. There was no damage to his clothing. Betty did not notice any odor emanating from the dress.5 Other damage was also noted to the dress. The lining on the right side of the dress was torn from the waist to the hem, and the top of the zipper was ripped. Because of the damage to the dress, it could never worn again6. The dress hung on a hanger in the Betty’s closet for 40 years. It had not been enclosed in a protective bag. No disinfectants, moth repellent, or other chemicals were ever sprayed in the closet. Occasionally, the dress would be taken out and shown to visitors. The September 2001 issue of the “Mutual UFO Network UFO Journal” featured two fascinating articles on the Hills’ abduction7. These were done in commemoration of the 40th anniversary of event. One was by Dwight Connelly (Betty & Barney Hill Anniversary - Hill Case Revisited), and the other by Kathy Marden (Niece Recalls Hill Episode). Connelly’s article included a recent picture of Betty holding the dress she wore during the event, along with the descriptions of the powdery material and damage the dress apparently had suffered. I was unaware that this dress still existed, and judging from the descriptions, it seemed highly possible it contained physical evidence of the abduction. Amazingly, I had never seen any reports of an analysis on it. Immediately I sent emails to both Dwight Connelly and Kathy Marden concerning the possibility of acquiring swaths of the dress for analysis. Kathy Marden contacted Betty who agreed to my request. By November 3, 2001 I had received two swaths: one from a discolored area; and the other from an area that retained its original color to serve as a control. The analysis began. Then on July 5-7, 2002, I had the distinct pleasure of meeting Betty Hill and Kathy Marden at the International MUFON meeting in Rochester, NY. Betty brought the dress, and I obtained more swaths for analysis. The dress is a common sheath-like style with (originally) a printed design in various shades of blue. It has simple lines, with short sleeves, a natural waist, a straight skirt, and is lined. The exterior is a knit of cellulose acetate (as identified in this analysis) 8. The lining is solid blue and also cellulose acetate, but woven. The dress has several swaths cut out of it due to sampling for analysis, as well as souvenirs for some people. Following are six photographs of the dress which show the lining is
5 Betty Hill, Personal communication 10-29-2002. Betty did note “a strong odor” on the craft. She could not identify it, but said it was “not pleasant”. 6Betty Hill, Personal Communication, 07-07-2002. Betty relates that the shoes she had on the night of the event were worn again. 7 “Mutual UFO Network UFO Journal,” Number 401, September 2001 Pages 3 and 7. 8 This was an especially popular fiber used for clothing during the time period of the event (1960s). However, there is a problem with exposure to some common solvents. For example, exposure to nail polish remover would dissolve the fabric and leave holes. (This analyst ruined many a dress in those days in the lab when working with various solvents.) Later on, more durable polyesters replaced most applications for the cellulose acetates, though it is still used in some clothing with limited use, such as graduation gowns etc.
T. S. R. No.: UT025 P. A. Budinger Page 4 torn from the waist down. The zipper is also torn. Extensive discoloration is obvious in two areas: along the top half of the dress, especially in the underarms; and on the bottom of the dress. These are the areas where Betty says the pink powder resided. The waist area retains its original blue color. There is no significant discoloring on the lining except for two or three stains. Photographs follow. (Note: All photographs in this report were taken by Frontier Analysis, Ltd.) Dress Exterior Front Dress Exterior Back
T. S. R. No.: UT025 P. A. Budinger Page 5 Inside Lining - Dress Front Inside Lining Dress Back
Torn Lining Torn Zipper
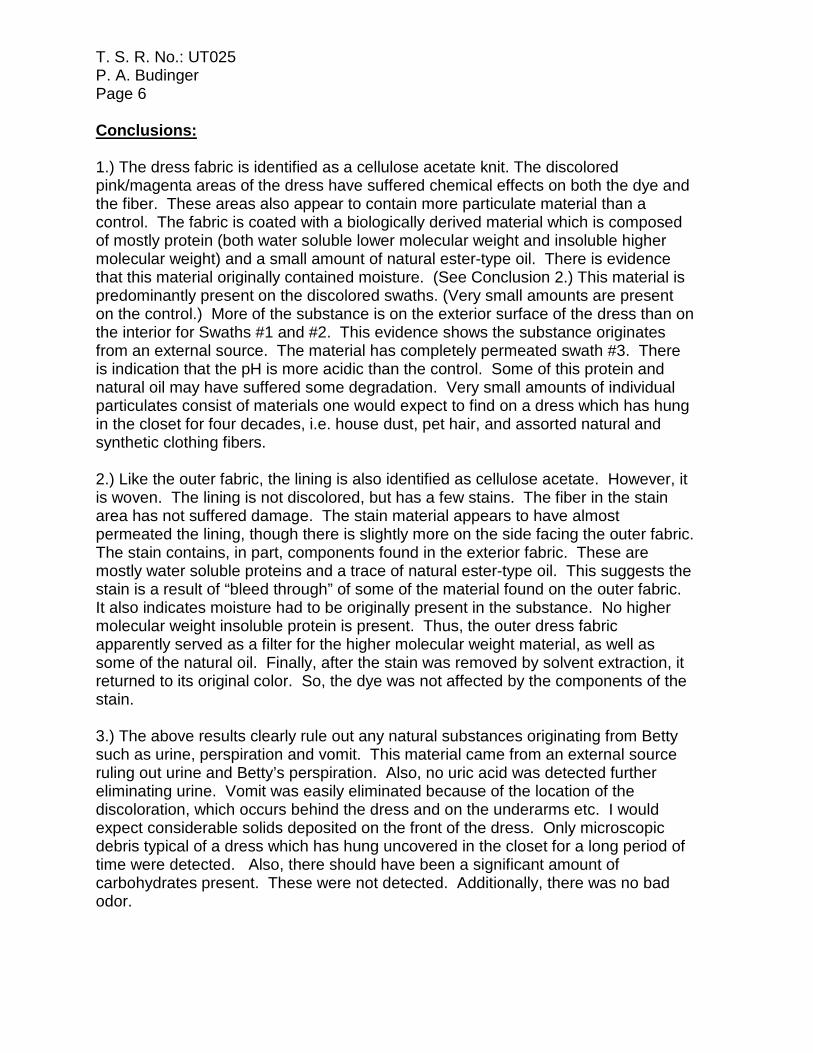
T. S. R. No.: UT025 P. A. Budinger Page 6 Conclusions: 1.) The dress fabric is identified as a cellulose acetate knit. The discolored pink/magenta areas of the dress have suffered chemical effects on both the dye and the fiber. These areas also appear to contain more particulate material than a control. The fabric is coated with a biologically derived material which is composed of mostly protein (both water soluble lower molecular weight and insoluble higher molecular weight) and a small amount of natural ester-type oil. There is evidence that this material originally contained moisture. (See Conclusion 2.) This material is predominantly present on the discolored swaths. (Very small amounts are present on the control.) More of the substance is on the exterior surface of the dress than on the interior for Swaths #1 and #2. This evidence shows the substance originates from an external source. The material has completely permeated swath #3. There is indication that the pH is more acidic than the control. Some of this protein and natural oil may have suffered some degradation. Very small amounts of individual particulates consist of materials one would expect to find on a dress which has hung in the closet for four decades, i.e. house dust, pet hair, and assorted natural and synthetic clothing fibers. 2.) Like the outer fabric, the lining is also identified as cellulose acetate. However, it is woven. The lining is not discolored, but has a few stains. The fiber in the stain area has not suffered damage. The stain material appears to have almost permeated the lining, though there is slightly more on the side facing the outer fabric. The stain contains, in part, components found in the exterior fabric. These are mostly water soluble proteins and a trace of natural ester-type oil. This suggests the stain is a result of “bleed through” of some of the material found on the outer fabric. It also indicates moisture had to be originally present in the substance. No higher molecular weight insoluble protein is present. Thus, the outer dress fabric apparently served as a filter for the higher molecular weight material, as well as some of the natural oil. Finally, after the stain was removed by solvent extraction, it returned to its original color. So, the dye was not affected by the components of the stain. 3.) The above results clearly rule out any natural substances originating from Betty such as urine, perspiration and vomit. This material came from an external source ruling out urine and Betty’s perspiration. Also, no uric acid was detected further eliminating urine. Vomit was easily eliminated because of the location of the discoloration, which occurs behind the dress and on the underarms etc. I would expect considerable solids deposited on the front of the dress. Only microscopic debris typical of a dress which has hung uncovered in the closet for a long period of time were detected. Also, there should have been a significant amount of carbohydrates present. These were not detected. Additionally, there was no bad odor.
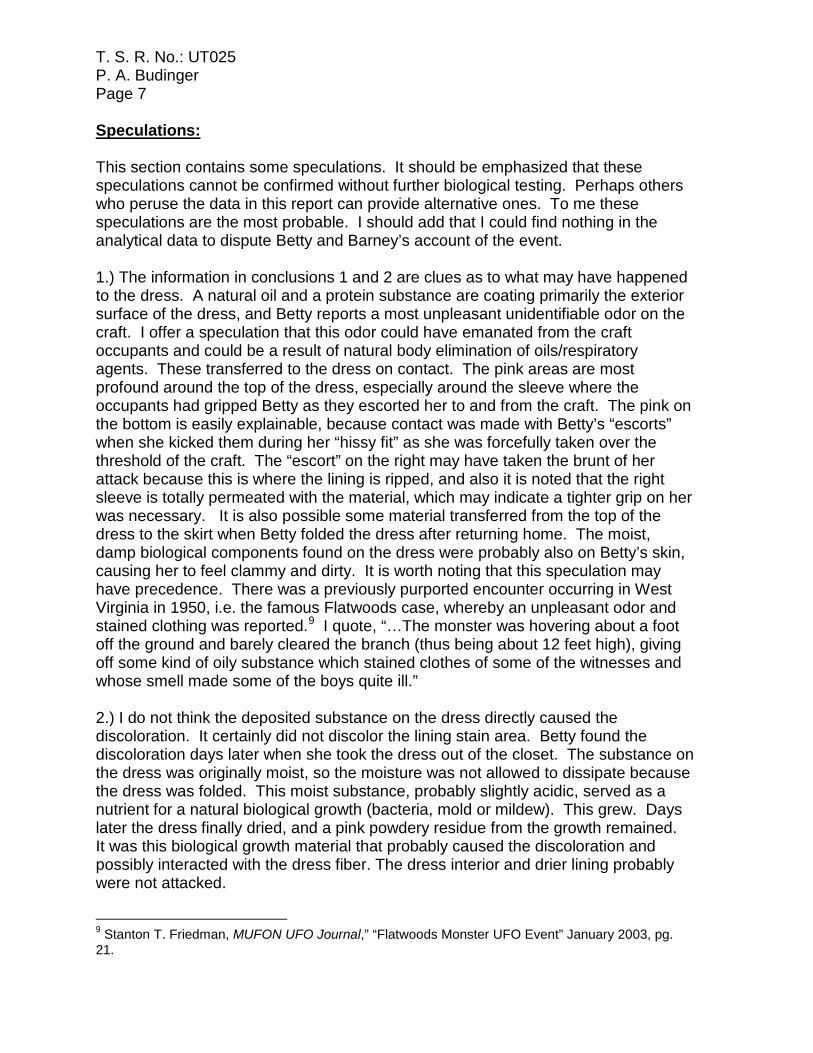
T. S. R. No.: UT025 P. A. Budinger Page 7 Speculations: This section contains some speculations. It should be emphasized that these speculations cannot be confirmed without further biological testing. Perhaps others who peruse the data in this report can provide alternative ones. To me these speculations are the most probable. I should add that I could find nothing in the analytical data to dispute Betty and Barney’s account of the event. 1.) The information in conclusions 1 and 2 are clues as to what may have happened to the dress. A natural oil and a protein substance are coating primarily the exterior surface of the dress, and Betty reports a most unpleasant unidentifiable odor on the craft. I offer a speculation that this odor could have emanated from the craft occupants and could be a result of natural body elimination of oils/respiratory agents. These transferred to the dress on contact. The pink areas are most profound around the top of the dress, especially around the sleeve where the occupants had gripped Betty as they escorted her to and from the craft. The pink on the bottom is easily explainable, because contact was made with Betty’s “escorts” when she kicked them during her “hissy fit” as she was forcefully taken over the threshold of the craft. The “escort” on the right may have taken the brunt of her attack because this is where the lining is ripped, and also it is noted that the right sleeve is totally permeated with the material, which may indicate a tighter grip on her was necessary. It is also possible some material transferred from the top of the dress to the skirt when Betty folded the dress after returning home. The moist, damp biological components found on the dress were probably also on Betty’s skin, causing her to feel clammy and dirty. It is worth noting that this speculation may have precedence. There was a previously purported encounter occurring in West Virginia in 1950, i.e. the famous Flatwoods case, whereby an unpleasant odor and stained clothing was reported.9 I quote, “…The monster was hovering about a foot off the ground and barely cleared the branch (thus being about 12 feet high), giving off some kind of oily substance which stained clothes of some of the witnesses and whose smell made some of the boys quite ill.” 2.) I do not think the deposited substance on the dress directly caused the discoloration. It certainly did not discolor the lining stain area. Betty found the discoloration days later when she took the dress out of the closet. The substance on the dress was originally moist, so the moisture was not allowed to dissipate because the dress was folded. This moist substance, probably slightly acidic, served as a nutrient for a natural biological growth (bacteria, mold or mildew). This grew. Days later the dress finally dried, and a pink powdery residue from the growth remained. It was this biological growth material that probably caused the discoloration and possibly interacted with the dress fiber. The dress interior and drier lining probably were not attacked.
9 Stanton T. Friedman, MUFON UFO Journal,” “Flatwoods Monster UFO Event” January 2003, pg. 21.
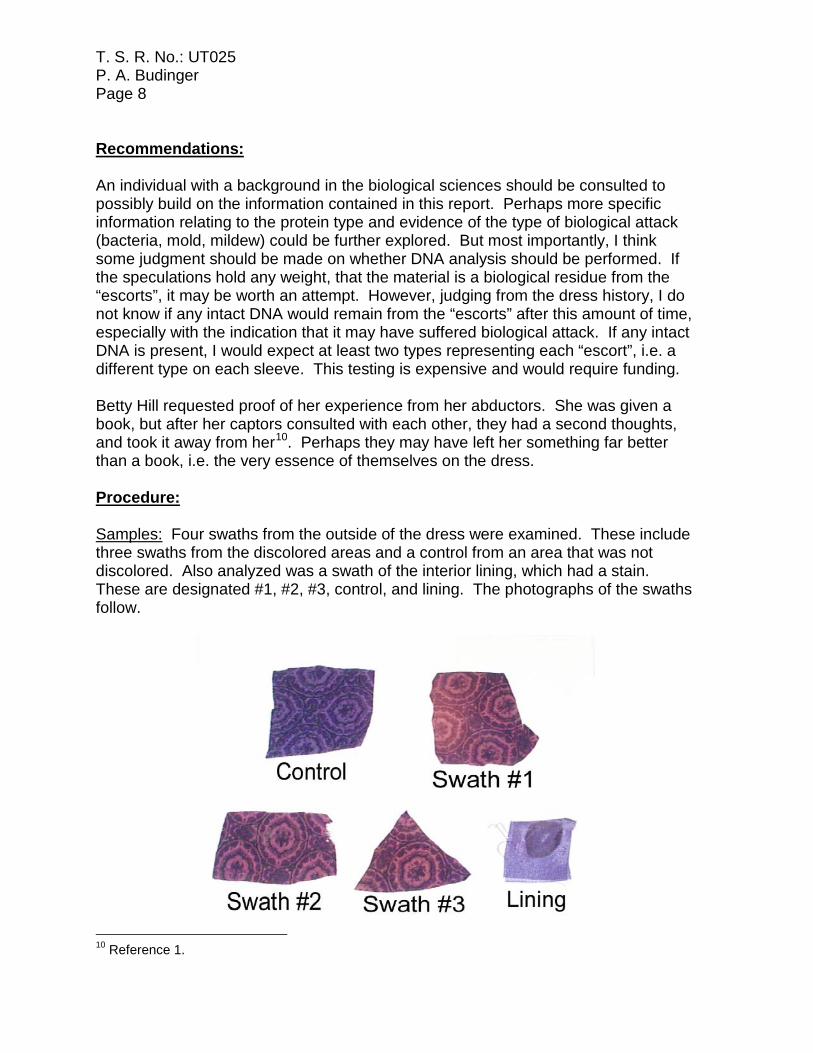
T. S. R. No.: UT025 P. A. Budinger Page 8 Recommendations: An individual with a background in the biological sciences should be consulted to possibly build on the information contained in this report. Perhaps more specific information relating to the protein type and evidence of the type of biological attack (bacteria, mold, mildew) could be further explored. But most importantly, I think some judgment should be made on whether DNA analysis should be performed. If the speculations hold any weight, that the material is a biological residue from the “escorts”, it may be worth an attempt. However, judging from the dress history, I do not know if any intact DNA would remain from the “escorts” after this amount of time, especially with the indication that it may have suffered biological attack. If any intact DNA is present, I would expect at least two types representing each “escort”, i.e. a different type on each sleeve. This testing is expensive and would require funding. Betty Hill requested proof of her experience from her abductors. She was given a book, but after her captors consulted with each other, they had a second thoughts, and took it away from her10. Perhaps they may have left her something far better than a book, i.e. the very essence of themselves on the dress. Procedure: Samples: Four swaths from the outside of the dress were examined. These include three swaths from the discolored areas and a control from an area that was not discolored. Also analyzed was a swath of the interior lining, which had a stain. These are designated #1, #2, #3, control, and lining. The photographs of the swaths follow.
10 Reference 1.
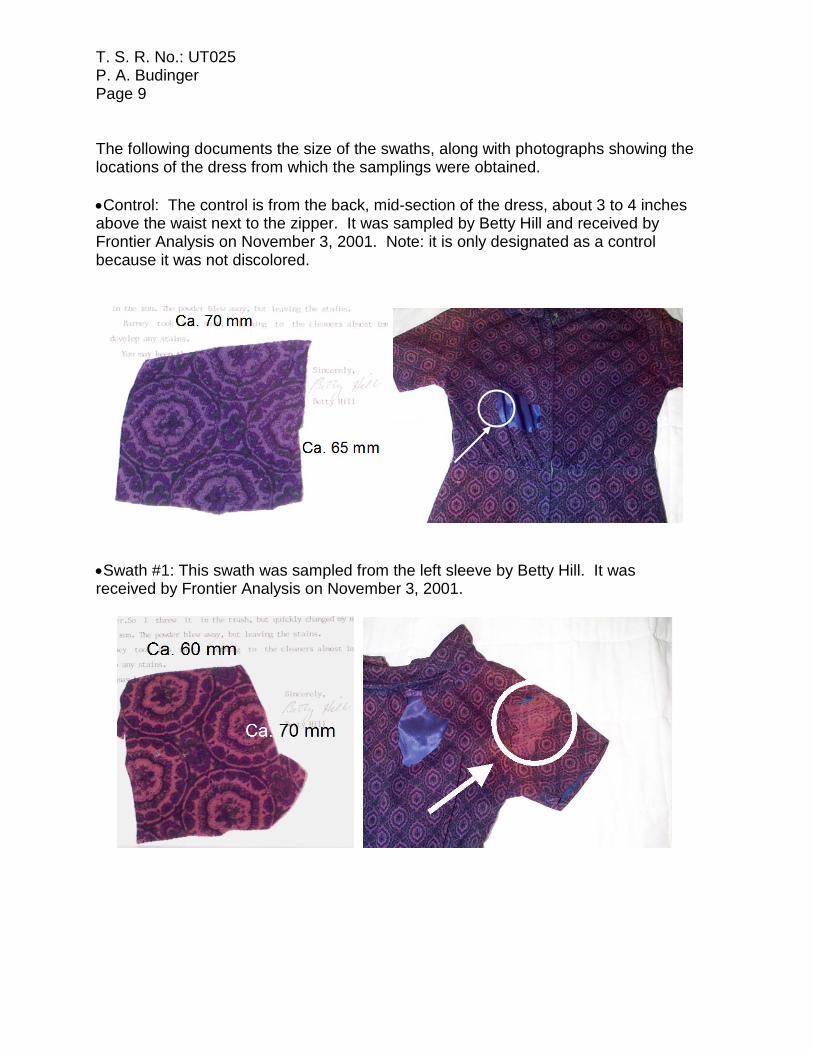
T. S. R. No.: UT025 P. A. Budinger Page 9 The following documents the size of the swaths, along with photographs showing the locations of the dress from which the samplings were obtained. •Control: The control is from the back, mid-section of the dress, about 3 to 4 inches above the waist next to the zipper. It was sampled by Betty Hill and received by Frontier Analysis on November 3, 2001. Note: it is only designated as a control because it was not discolored.
•Swath #1: This swath was sampled from the left sleeve by Betty Hill. It was received by Frontier Analysis on November 3, 2001.
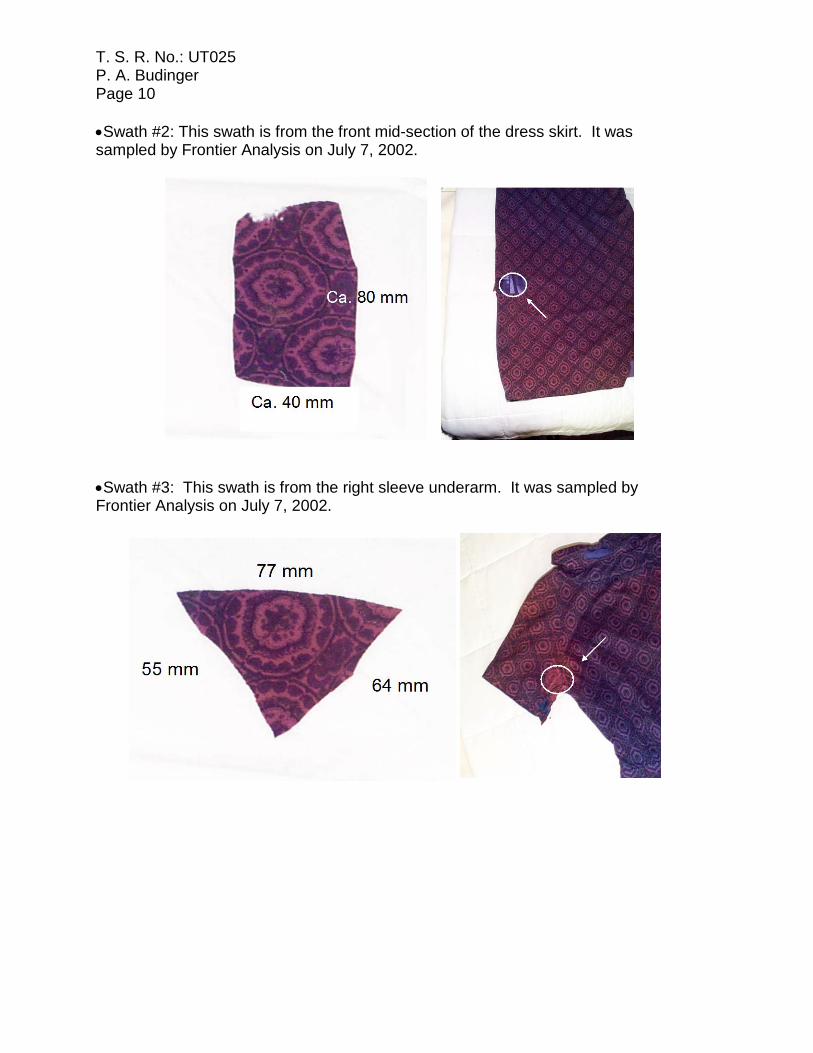
T. S. R. No.: UT025 P. A. Budinger Page 10 •Swath #2: This swath is from the front mid-section of the dress skirt. It was sampled by Frontier Analysis on July 7, 2002.
•Swath #3: This swath is from the right sleeve underarm. It was sampled by Frontier Analysis on July 7, 2002.
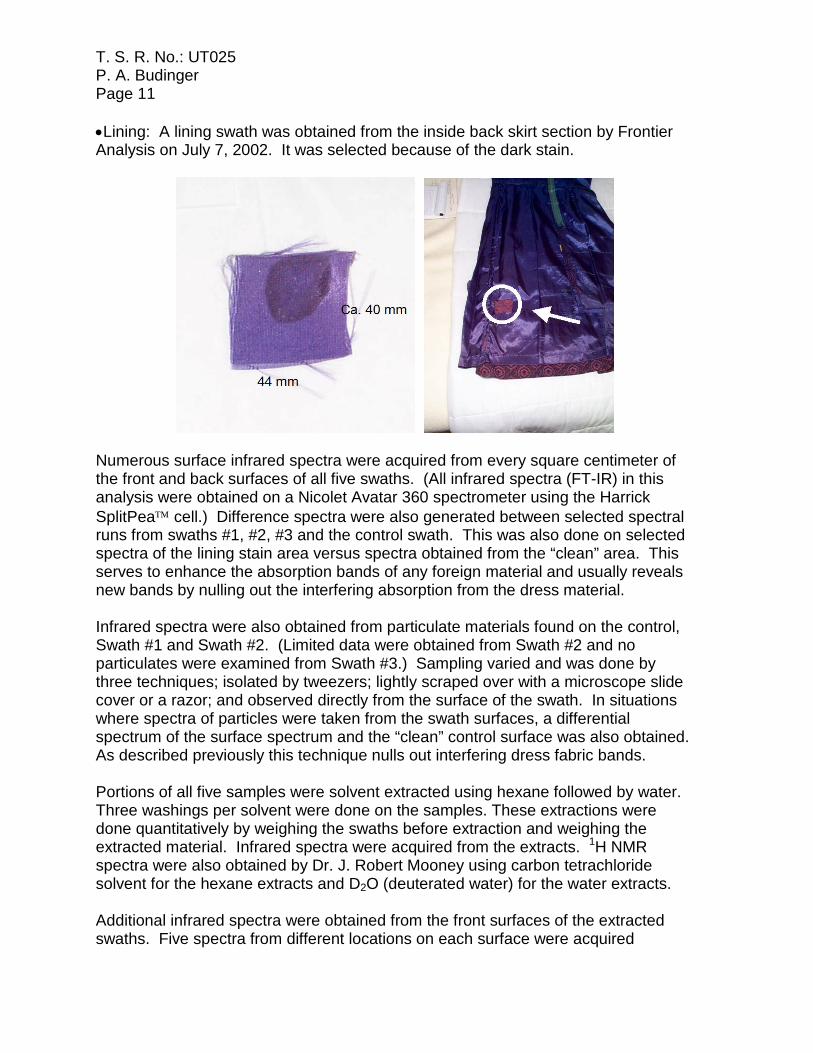
T. S. R. No.: UT025 P. A. Budinger Page 11 •Lining: A lining swath was obtained from the inside back skirt section by Frontier Analysis on July 7, 2002. It was selected because of the dark stain.
Numerous surface infrared spectra were acquired from every square centimeter of the front and back surfaces of all five swaths. (All infrared spectra (FT-IR) in this analysis were obtained on a Nicolet Avatar 360 spectrometer using the Harrick SplitPea cell.) Difference spectra were also generated between selected spectral runs from swaths #1, #2, #3 and the control swath. This was also done on selected spectra of the lining stain area versus spectra obtained from the “clean” area. This serves to enhance the absorption bands of any foreign material and usually reveals new bands by nulling out the interfering absorption from the dress material. Infrared spectra were also obtained from particulate materials found on the control, Swath #1 and Swath #2. (Limited data were obtained from Swath #2 and no particulates were examined from Swath #3.) Sampling varied and was done by three techniques; isolated by tweezers; lightly scraped over with a microscope slide cover or a razor; and observed directly from the surface of the swath. In situations where spectra of particles were taken from the swath surfaces, a differential spectrum of the surface spectrum and the “clean” control surface was also obtained. As described previously this technique nulls out interfering dress fabric bands. Portions of all five samples were solvent extracted using hexane followed by water. Three washings per solvent were done on the samples. These extractions were done quantitatively by weighing the swaths before extraction and weighing the extracted material. Infrared spectra were acquired from the extracts. 1H NMR spectra were also obtained by Dr. J. Robert Mooney using carbon tetrachloride solvent for the hexane extracts and D2O (deuterated water) for the water extracts. Additional infrared spectra were obtained from the front surfaces of the extracted swaths. Five spectra from different locations on each surface were acquired
T. S. R. No.: UT025 P. A. Budinger Page 12 Microscope photographs were obtained from the front and back of the swaths and some isolated particulates using the Leika GZ6 stereomicroscope interfaced to a Kodak Digital Science MDS 120 camera. Regular pictures of were also obtained using the Kodak MDS 120. Results: The results of the individual tests done on the swath samples follow. These results are summarized in the conclusions section on page six. The first section discusses the results for the dress swaths #1, #2, and #3. The second section is devoted to the analysis of the stain on the dress lining. This is because some of the properties found about the lining stain are different. So, it simplifies the discussion.
I. Analytical Results for Swaths #1, #2 and #3
Synopsis of this Section This analysis begins with the microscopic examination of the swaths, and there is a comparison to a control swath. The pink/magenta discolored swaths show the disturbed knit of the fibers, and more particulates are indicated. Spectroscopic examination identifies the dress material as cellulose acetate. Additionally, it shows a biologicaly derived material is predominantly present on the discolored swaths. More specifically, mostly water soluble lower molecular weight, insoluble higher molecular protein, and a small amount of natural ester-type oil are identified. This material is predominantly present on the discolored swaths. Very small amounts are present on the control. More of this substance is shown to be on the front surface of the swaths than on the back side for Swaths #1 and #2. This evidence shows that the substance originates from an external source. The substance has completely permeated swath #3. There is evidence that the pH is on the acidic side on the discolored areas, and more basic on the control. The protein and natural oil may have suffered some degradation. Very small amounts of individual particulates consist of materials one would expect to find on a dress which has hung in the closet for four decades, i.e. house dust, pet hair, cotton and polyacrylonitrile (common clothing fiber). There is some isolated, protein type amide of which the origin is unknown. It could be related to the other biologically derived material coating the discolored swaths.
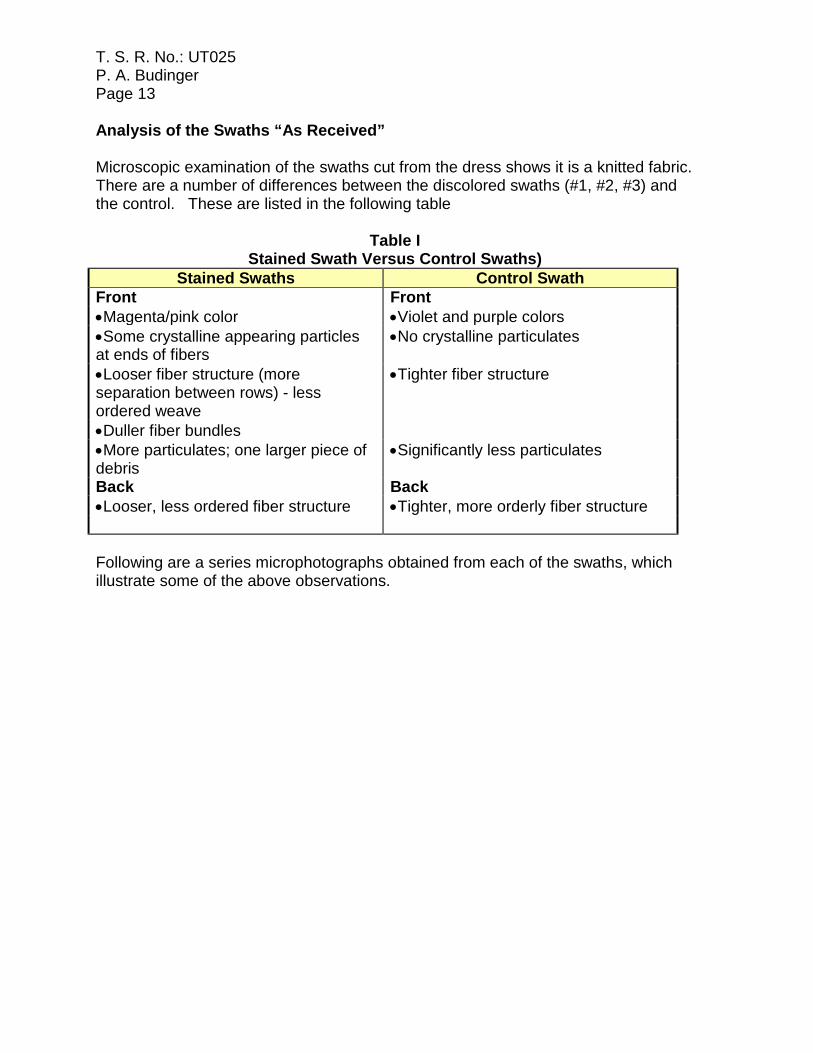
T. S. R. No.: UT025 P. A. Budinger Page 13 Analysis of the Swaths “As Received” Microscopic examination of the swaths cut from the dress shows it is a knitted fabric. There are a number of differences between the discolored swaths (#1, #2, #3) and the control. These are listed in the following table
Table I Stained Swath Versus Control Swaths)
Stained Swaths Control Swath Front Front •Magenta/pink color •Violet and purple colors •Some crystalline appearing particles at ends of fibers
•No crystalline particulates
•Looser fiber structure (more separation between rows) - less ordered weave
•Tighter fiber structure
•Duller fiber bundles •More particulates; one larger piece of debris
•Significantly less particulates
Back Back •Looser, less ordered fiber structure •Tighter, more orderly fiber structure Following are a series microphotographs obtained from each of the swaths, which illustrate some of the above observations.
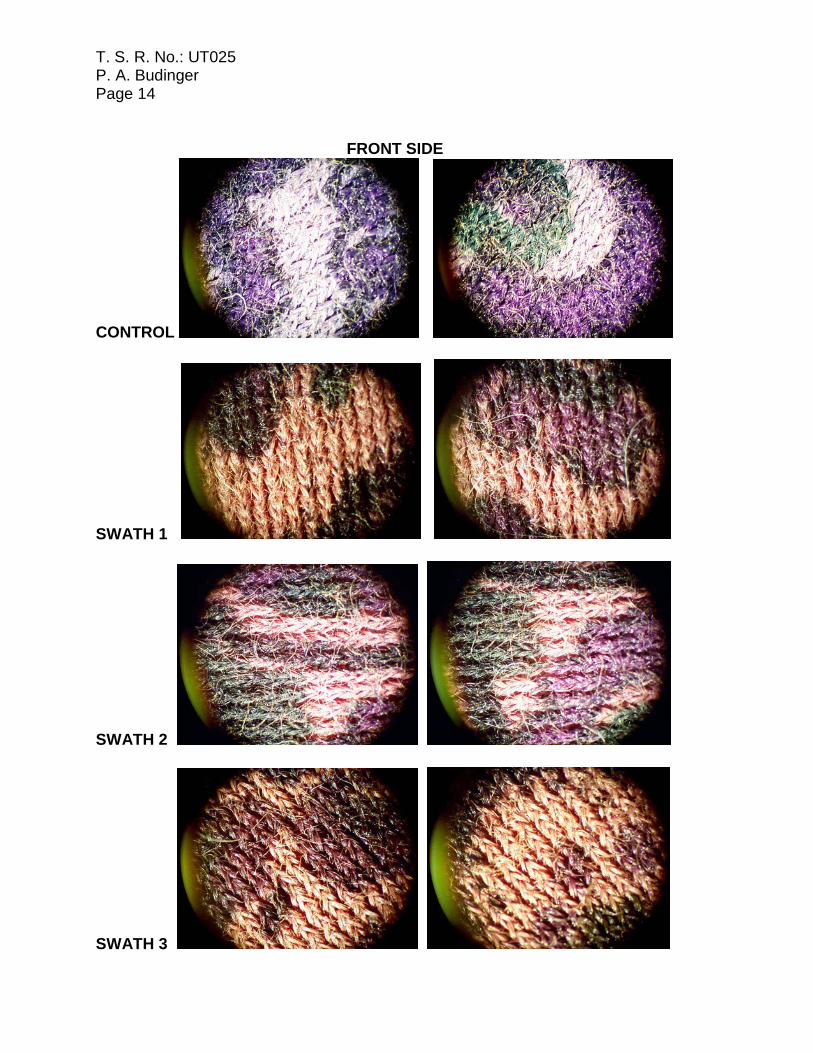
T. S. R. No.: UT025 P. A. Budinger Page 14
FRONT SIDE
CONTROL
SWATH 1
SWATH 2
SWATH 3
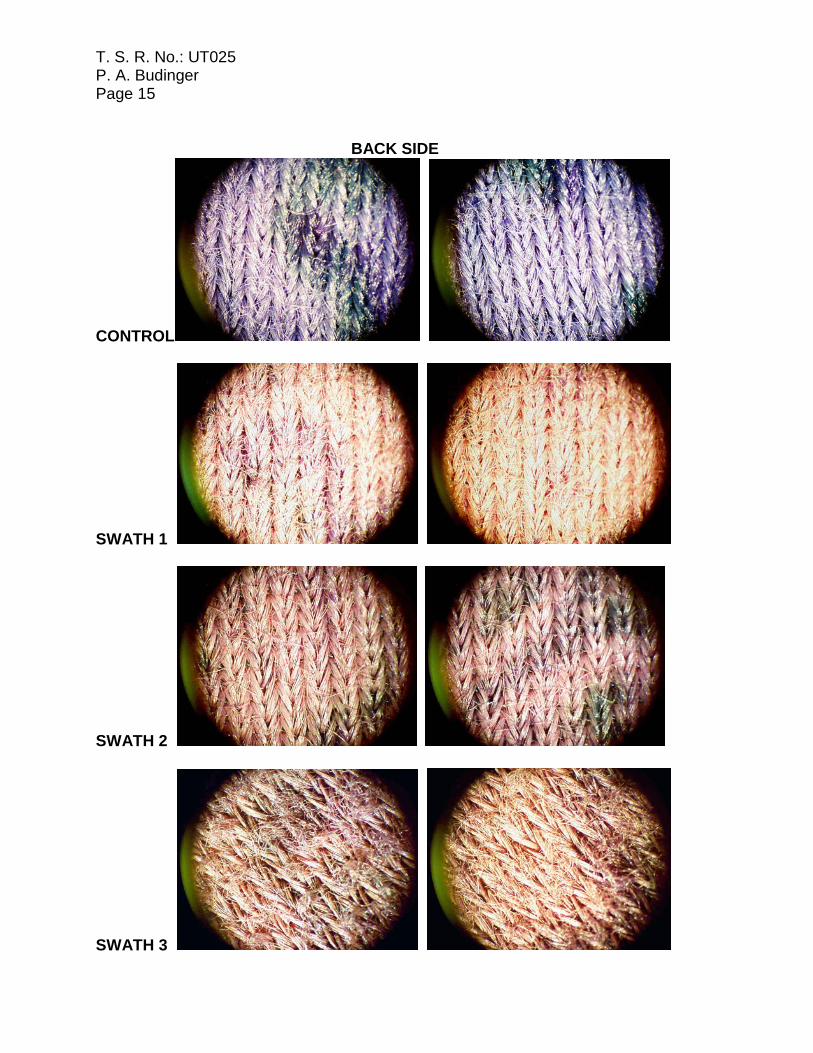
T. S. R. No.: UT025 P. A. Budinger Page 15
BACK SIDE
CONTROL
SWATH 1
SWATH 2
SWATH 3
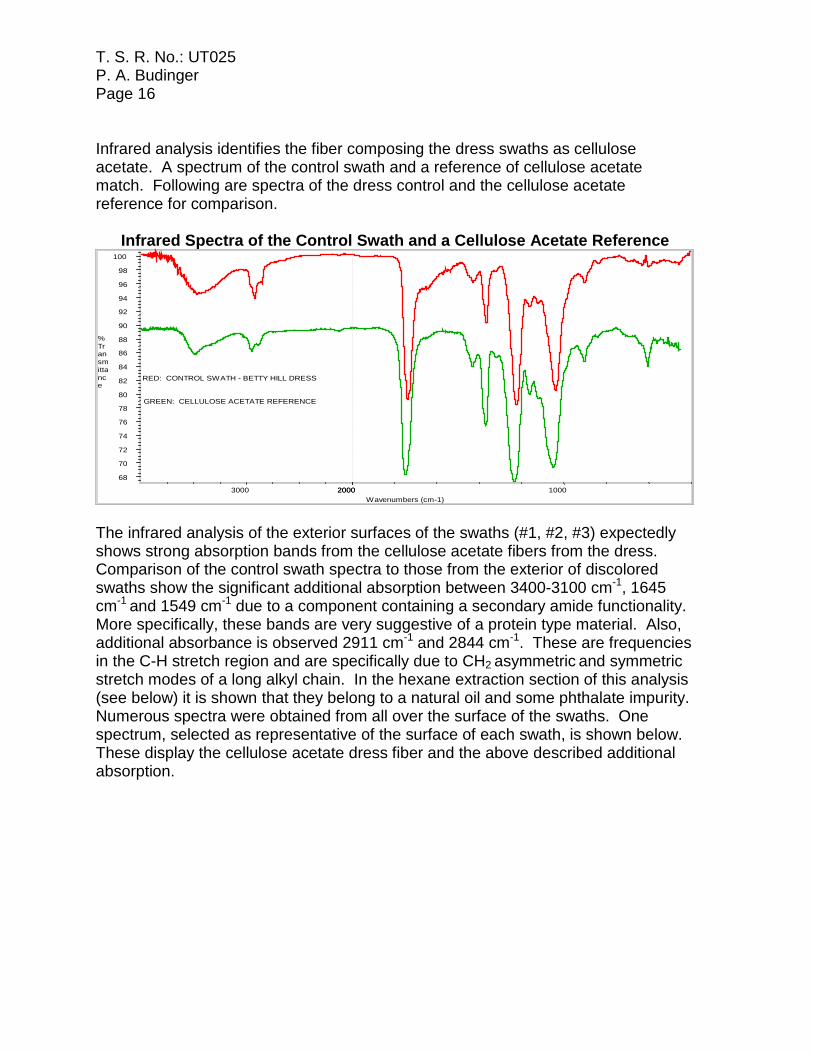
T. S. R. No.: UT025 P. A. Budinger Page 16 Infrared analysis identifies the fiber composing the dress swaths as cellulose acetate. A spectrum of the control swath and a reference of cellulose acetate match. Following are spectra of the dress control and the cellulose acetate reference for comparison.
Infrared Spectra of the Control Swath and a Cellulose Acetate Reference
GREEN: CELLULOSE ACETATE REFERENCE
RED: CONTROL SWATH - BETTY HILL DRESS
68 70 72 74 76 78 80 82 84 86 88 90 92 94 96 98
100
%Transmittance
1000 2000 2000 3000 Wavenumbers (cm-1)
The infrared analysis of the exterior surfaces of the swaths (#1, #2, #3) expectedly shows strong absorption bands from the cellulose acetate fibers from the dress. Comparison of the control swath spectra to those from the exterior of discolored swaths show the significant additional absorption between 3400-3100 cm-1, 1645 cm-1 and 1549 cm-1 due to a component containing a secondary amide functionality. More specifically, these bands are very suggestive of a protein type material. Also, additional absorbance is observed 2911 cm-1 and 2844 cm-1. These are frequencies in the C-H stretch region and are specifically due to CH2 asymmetric and symmetric stretch modes of a long alkyl chain. In the hexane extraction section of this analysis (see below) it is shown that they belong to a natural oil and some phthalate impurity. Numerous spectra were obtained from all over the surface of the swaths. One spectrum, selected as representative of the surface of each swath, is shown below. These display the cellulose acetate dress fiber and the above described additional absorption.
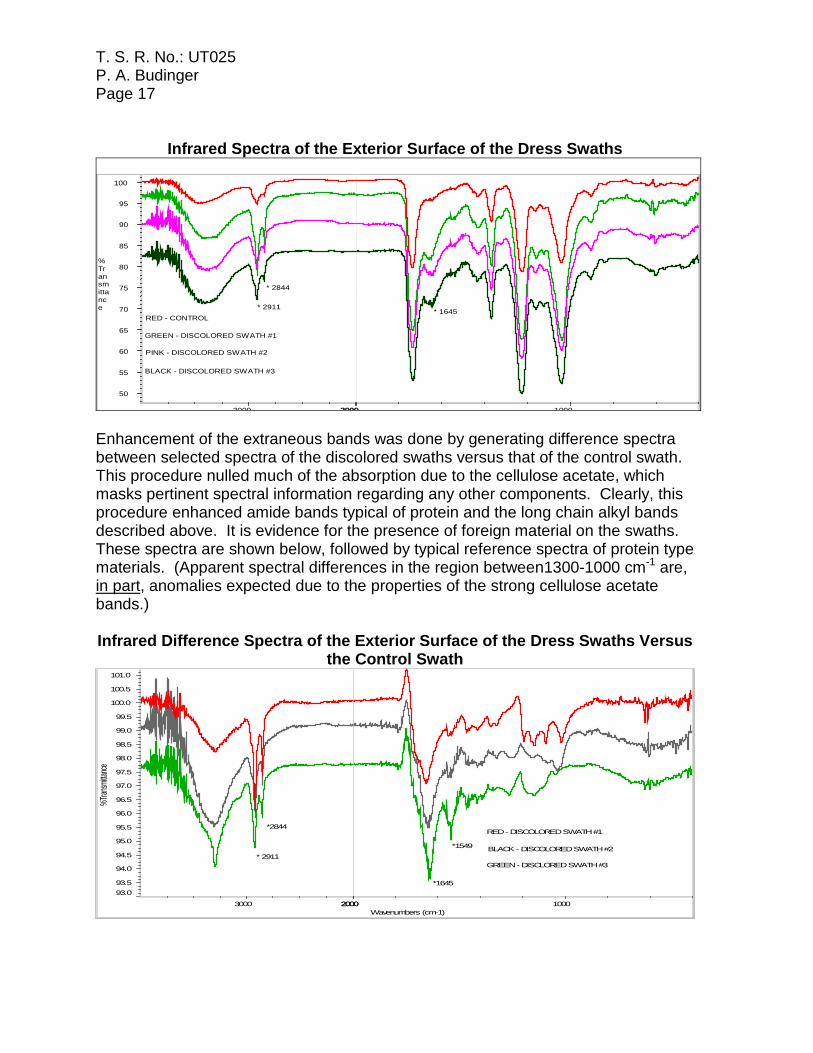
T. S. R. No.: UT025 P. A. Budinger Page 17
Infrared Spectra of the Exterior Surface of the Dress Swaths
* 1645
* 2844 * 2911
RED - CONTROL GREEN - DISCOLORED SWATH #1
BLACK - DISCOLORED SWATH #3 PINK - DISCOLORED SWATH #2
50 55 60 65 70 75 80 85 90 95
100
%Transmittance
1000 2000 2000 3000 Enhancement of the extraneous bands was done by generating difference spectra between selected spectra of the discolored swaths versus that of the control swath. This procedure nulled much of the absorption due to the cellulose acetate, which masks pertinent spectral information regarding any other components. Clearly, this procedure enhanced amide bands typical of protein and the long chain alkyl bands described above. It is evidence for the presence of foreign material on the swaths. These spectra are shown below, followed by typical reference spectra of protein type materials. (Apparent spectral differences in the region between1300-1000 cm-1 are, in part, anomalies expected due to the properties of the strong cellulose acetate bands.)
Infrared Difference Spectra of the Exterior Surface of the Dress Swaths Versus
the Control Swath
*1549
*1645
RED - DISCOLORED SWATH #1
BLACK - DISCOLORED SWATH #2
*2844
* 2911GREEN - DISCLORED SWATH #3
93.0 93.5
94.0
94.5
95.0
95.5
96.0
96.5
97.0
97.5
98.0
98.5
99.0
99.5
100.0
100.5
101.0
%Tran
smitta
nce
1000 2000 2000 3000 Wavenumbers (cm-1)
T. S. R. No.: UT025 P. A. Budinger Page 18
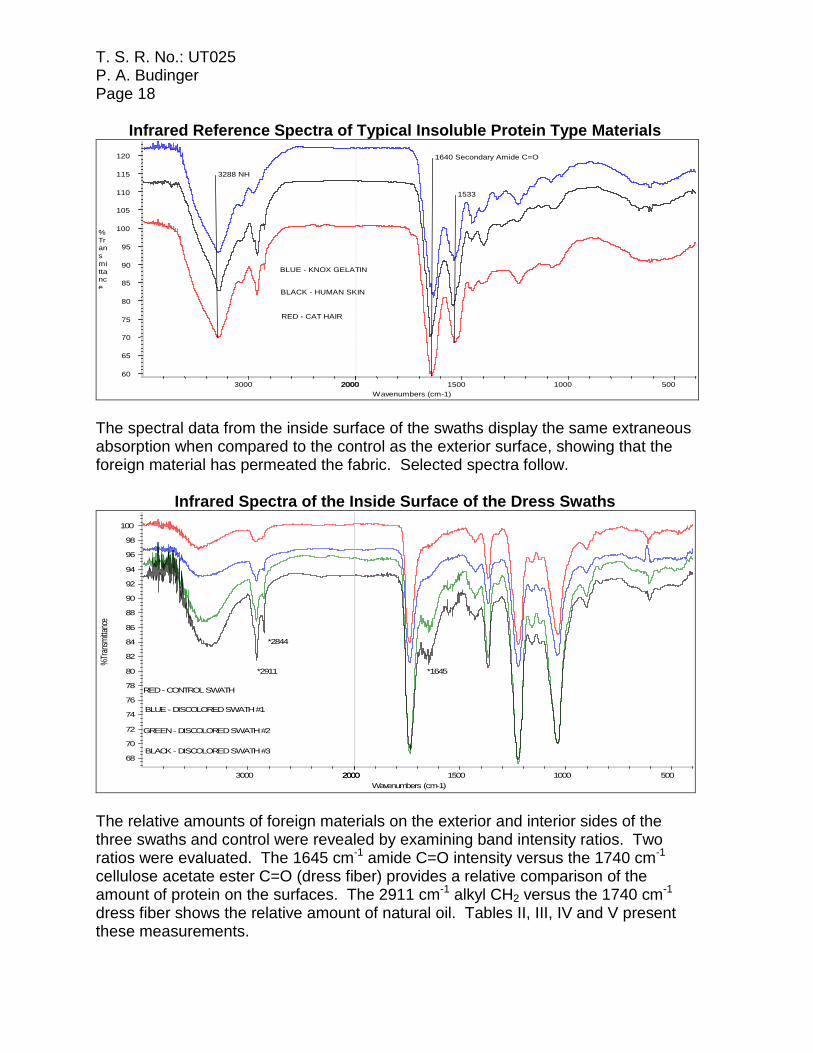
Infrared Reference Spectra of Typical Insoluble Protein Type Materials
1533
1640 Secondary Amide C=O
BLUE - KNOX GELATIN
RED - CAT HAIR
BLACK - HUMAN SKIN
3288 NH
60 65 70 75 80 85 90 95
100 105 110 115 120
%Transmittance
500 1000 1500 2000 2000 3000 Wavenumbers (cm-1)
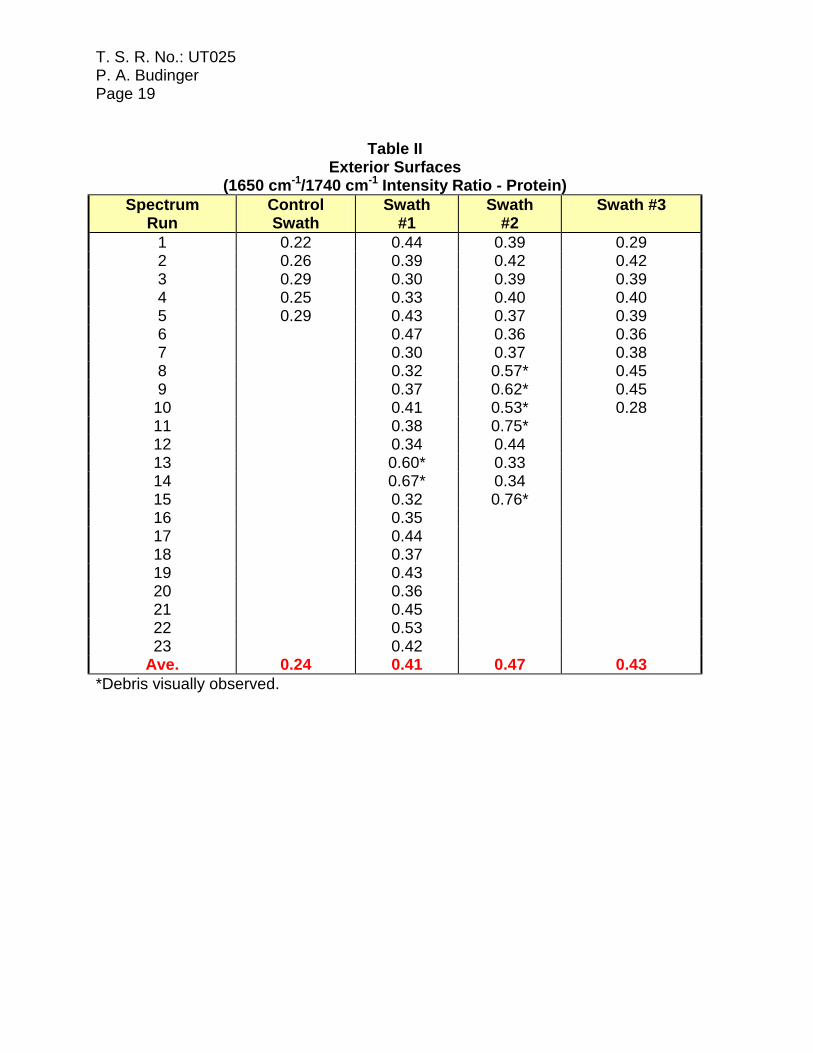
The spectral data from the inside surface of the swaths display the same extraneous absorption when compared to the control as the exterior surface, showing that the foreign material has permeated the fabric. Selected spectra follow.
Infrared Spectra of the Inside Surface of the Dress Swaths
RED - CONTROL SWATH
BLACK - DISCOLORED SWATH #3
GREEN - DISCOLORED SWATH #2
BLUE - DISCOLORED SWATH #1
*1645
*2844
*2911
68
70
72
74
76
78
80
82
84
86
88
90
92
94
96
98
100
%Tran
smitta
nce
500 1000 1500 2000 2000 3000 Wavenumbers (cm-1)
The relative amounts of foreign materials on the exterior and interior sides of the three swaths and control were revealed by examining band intensity ratios. Two ratios were evaluated. The 1645 cm-1 amide C=O intensity versus the 1740 cm-1
cellulose acetate ester C=O (dress fiber) provides a relative comparison of the amount of protein on the surfaces. The 2911 cm-1 alkyl CH2 versus the 1740 cm-1
dress fiber shows the relative amount of natural oil. Tables II, III, IV and V present these measurements.
T. S. R. No.: UT025 P. A. Budinger Page 19
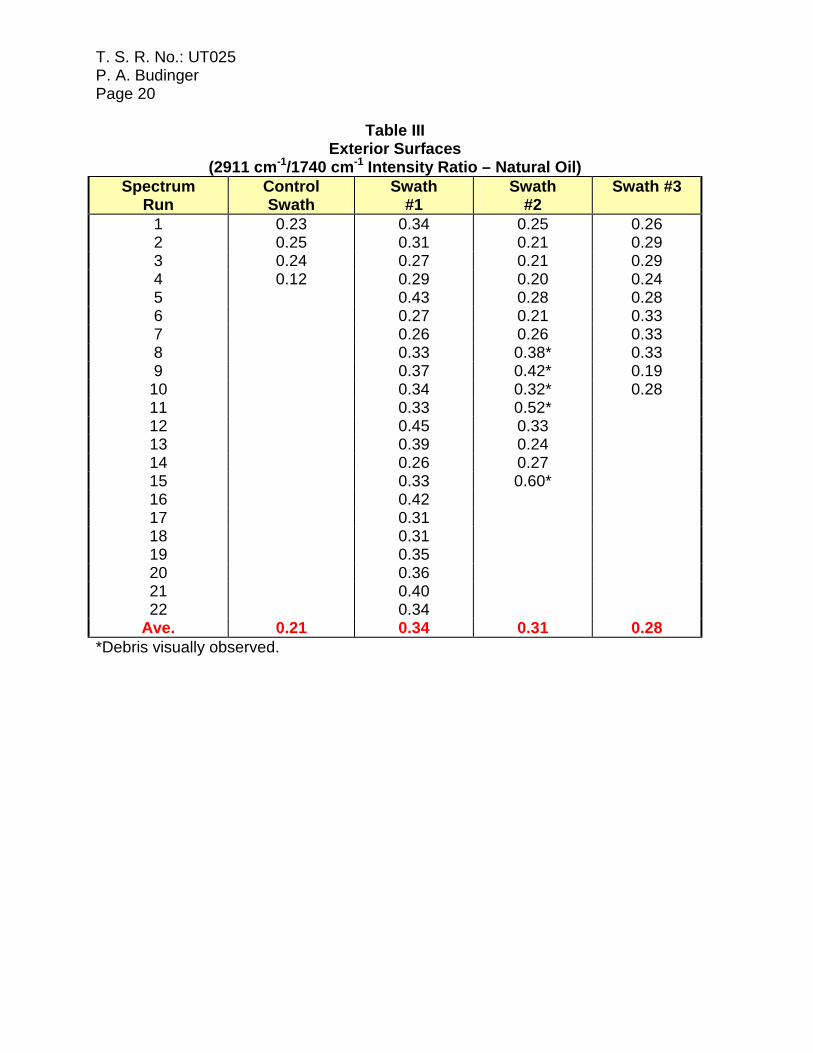
Table II
Exterior Surfaces (1650 cm-1/1740 cm-1 Intensity Ratio - Protein)
Spectrum Run
Control Swath
Swath #1
Swath #2
Swath #3
1 0.22 0.44 0.39 0.29 2 0.26 0.39 0.42 0.42 3 0.29 0.30 0.39 0.39 4 0.25 0.33 0.40 0.40 5 0.29 0.43 0.37 0.39 6 0.47 0.36 0.36 7 0.30 0.37 0.38 8 0.32 0.57* 0.45 9 0.37 0.62* 0.45 10 0.41 0.53* 0.28 11 0.38 0.75* 12 0.34 0.44 13 0.60* 0.33 14 0.67* 0.34 15 0.32 0.76* 16 0.35 17 0.44 18 0.37 19 0.43 20 0.36 21 0.45 22 0.53 23 0.42
Ave. 0.24 0.41 0.47 0.43 *Debris visually observed.
T. S. R. No.: UT025 P. A. Budinger Page 20
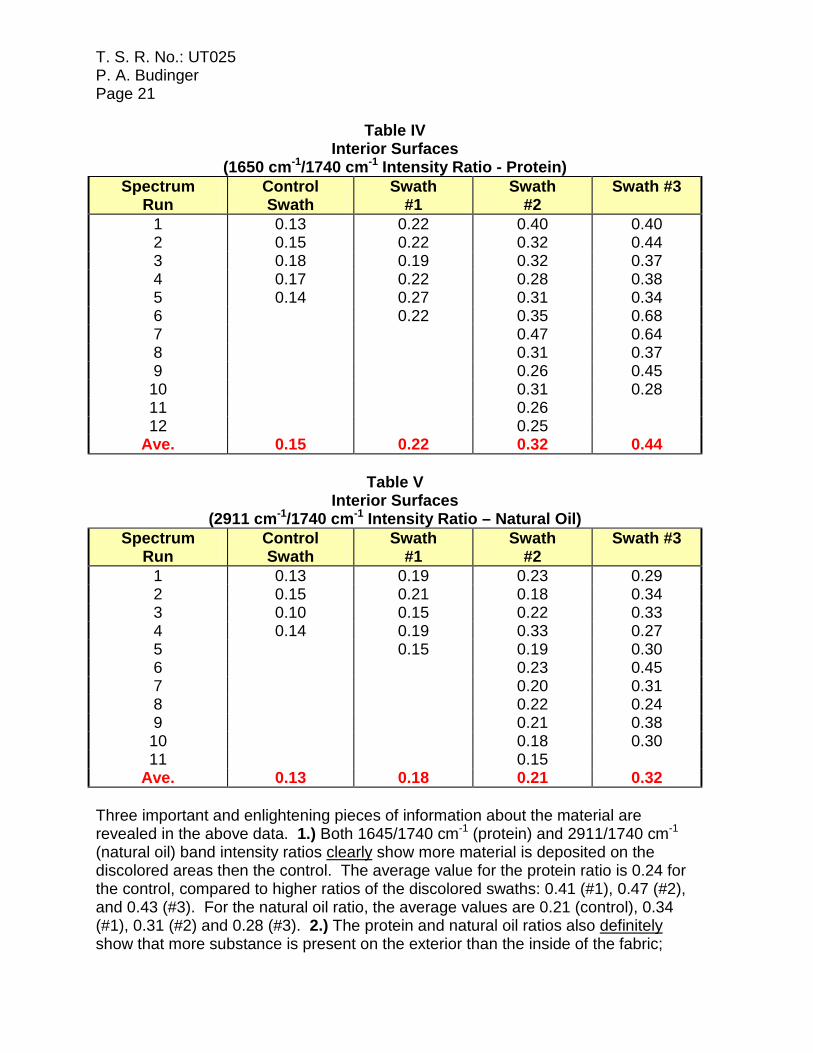
Table III Exterior Surfaces
(2911 cm-1/1740 cm-1 Intensity Ratio – Natural Oil) Spectrum
Run Control Swath
Swath #1
Swath #2
Swath #3
1 0.23 0.34 0.25 0.26 2 0.25 0.31 0.21 0.29 3 0.24 0.27 0.21 0.29 4 0.12 0.29 0.20 0.24 5 0.43 0.28 0.28 6 0.27 0.21 0.33 7 0.26 0.26 0.33 8 0.33 0.38* 0.33 9 0.37 0.42* 0.19 10 0.34 0.32* 0.28 11 0.33 0.52* 12 0.45 0.33 13 0.39 0.24 14 0.26 0.27 15 0.33 0.60* 16 0.42 17 0.31 18 0.31 19 0.35 20 0.36 21 0.40 22 0.34
Ave. 0.21 0.34 0.31 0.28 *Debris visually observed.
T. S. R. No.: UT025 P. A. Budinger Page 21
Table IV Interior Surfaces
(1650 cm-1/1740 cm-1 Intensity Ratio - Protein) Spectrum
Run Control Swath
Swath #1
Swath #2
Swath #3
1 0.13 0.22 0.40 0.40 2 0.15 0.22 0.32 0.44 3 0.18 0.19 0.32 0.37 4 0.17 0.22 0.28 0.38 5 0.14 0.27 0.31 0.34 6 0.22 0.35 0.68 7 0.47 0.64 8 0.31 0.37 9 0.26 0.45 10 0.31 0.28 11 0.26 12 0.25
Ave. 0.15 0.22 0.32 0.44
Table V Interior Surfaces
(2911 cm-1/1740 cm-1 Intensity Ratio – Natural Oil) Spectrum
Run Control Swath
Swath #1
Swath #2
Swath #3
1 0.13 0.19 0.23 0.29 2 0.15 0.21 0.18 0.34 3 0.10 0.15 0.22 0.33 4 0.14 0.19 0.33 0.27 5 0.15 0.19 0.30 6 0.23 0.45 7 0.20 0.31 8 0.22 0.24 9 0.21 0.38 10 0.18 0.30 11 0.15
Ave. 0.13 0.18 0.21 0.32 Three important and enlightening pieces of information about the material are revealed in the above data. 1.) Both 1645/1740 cm-1 (protein) and 2911/1740 cm-1 (natural oil) band intensity ratios clearly show more material is deposited on the discolored areas then the control. The average value for the protein ratio is 0.24 for the control, compared to higher ratios of the discolored swaths: 0.41 (#1), 0.47 (#2), and 0.43 (#3). For the natural oil ratio, the average values are 0.21 (control), 0.34 (#1), 0.31 (#2) and 0.28 (#3). 2.) The protein and natural oil ratios also definitely show that more substance is present on the exterior than the inside of the fabric;
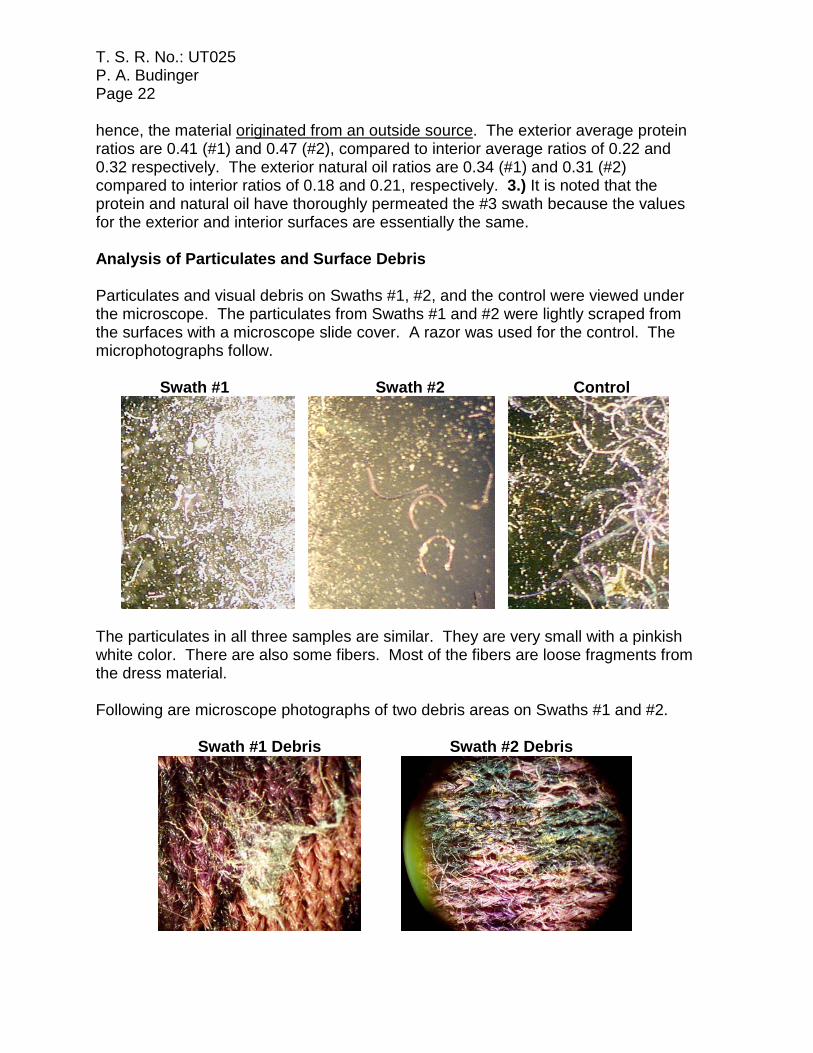
T. S. R. No.: UT025 P. A. Budinger Page 22 hence, the material originated from an outside source. The exterior average protein ratios are 0.41 (#1) and 0.47 (#2), compared to interior average ratios of 0.22 and 0.32 respectively. The exterior natural oil ratios are 0.34 (#1) and 0.31 (#2) compared to interior ratios of 0.18 and 0.21, respectively. 3.) It is noted that the protein and natural oil have thoroughly permeated the #3 swath because the values for the exterior and interior surfaces are essentially the same. Analysis of Particulates and Surface Debris Particulates and visual debris on Swaths #1, #2, and the control were viewed under the microscope. The particulates from Swaths #1 and #2 were lightly scraped from the surfaces with a microscope slide cover. A razor was used for the control. The microphotographs follow.
Swath #1 Swath #2 Control
The particulates in all three samples are similar. They are very small with a pinkish white color. There are also some fibers. Most of the fibers are loose fragments from the dress material. Following are microscope photographs of two debris areas on Swaths #1 and #2. Swath #1 Debris Swath #2 Debris
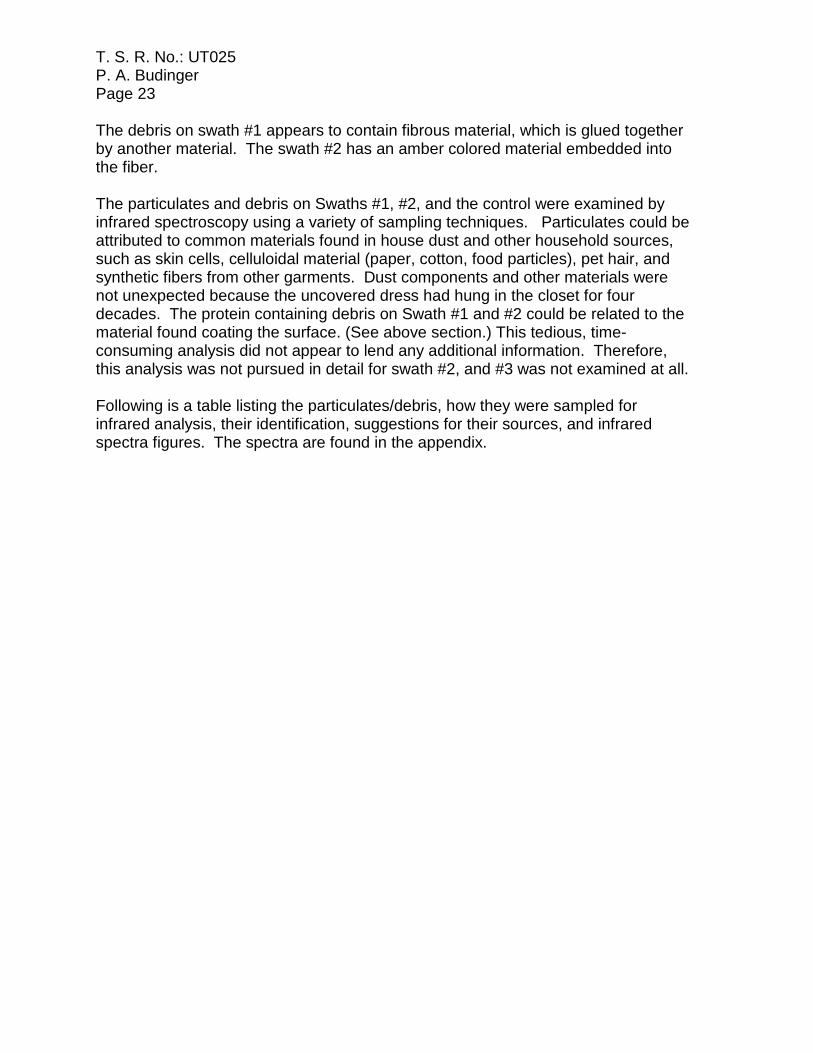
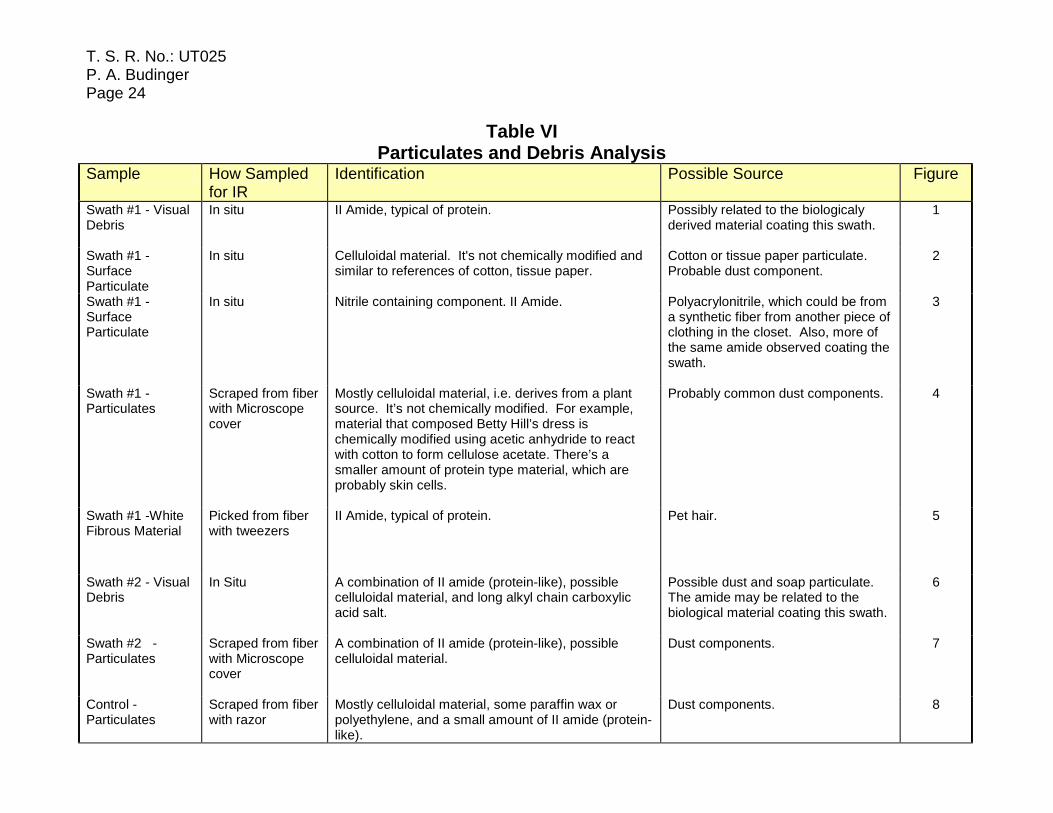
T. S. R. No.: UT025 P. A. Budinger Page 23 The debris on swath #1 appears to contain fibrous material, which is glued together by another material. The swath #2 has an amber colored material embedded into the fiber. The particulates and debris on Swaths #1, #2, and the control were examined by infrared spectroscopy using a variety of sampling techniques. Particulates could be attributed to common materials found in house dust and other household sources, such as skin cells, celluloidal material (paper, cotton, food particles), pet hair, and synthetic fibers from other garments. Dust components and other materials were not unexpected because the uncovered dress had hung in the closet for four decades. The protein containing debris on Swath #1 and #2 could be related to the material found coating the surface. (See above section.) This tedious, time-consuming analysis did not appear to lend any additional information. Therefore, this analysis was not pursued in detail for swath #2, and #3 was not examined at all. Following is a table listing the particulates/debris, how they were sampled for infrared analysis, their identification, suggestions for their sources, and infrared spectra figures. The spectra are found in the appendix.
T. S. R. No.: UT025 P. A. Budinger Page 24
Table VI Particulates and Debris Analysis
Sample How Sampled for IR
Identification Possible Source Figure
Swath #1 - Visual Debris
In situ II Amide, typical of protein.
Possibly related to the biologicaly derived material coating this swath.
1
Swath #1 - Surface Particulate
In situ Celluloidal material. It's not chemically modified and similar to references of cotton, tissue paper.
Cotton or tissue paper particulate. Probable dust component.
2
Swath #1 -Surface Particulate
In situ Nitrile containing component. II Amide. Polyacrylonitrile, which could be from a synthetic fiber from another piece of clothing in the closet. Also, more of the same amide observed coating the swath.
3
Swath #1 -Particulates
Scraped from fiber with Microscope cover
Mostly celluloidal material, i.e. derives from a plant source. It’s not chemically modified. For example, material that composed Betty Hill’s dress is chemically modified using acetic anhydride to react with cotton to form cellulose acetate. There’s a smaller amount of protein type material, which are probably skin cells.
Probably common dust components. 4
Swath #1 -White Fibrous Material
Picked from fiber with tweezers
II Amide, typical of protein. Pet hair. 5
Swath #2 - Visual Debris
In Situ A combination of II amide (protein-like), possible celluloidal material, and long alkyl chain carboxylic acid salt.
Possible dust and soap particulate. The amide may be related to the biological material coating this swath.
6
Swath #2 - Particulates
Scraped from fiber with Microscope cover
A combination of II amide (protein-like), possible celluloidal material.
Dust components. 7
Control - Particulates
Scraped from fiber with razor
Mostly celluloidal material, some paraffin wax or polyethylene, and a small amount of II amide (protein-like).
Dust components. 8
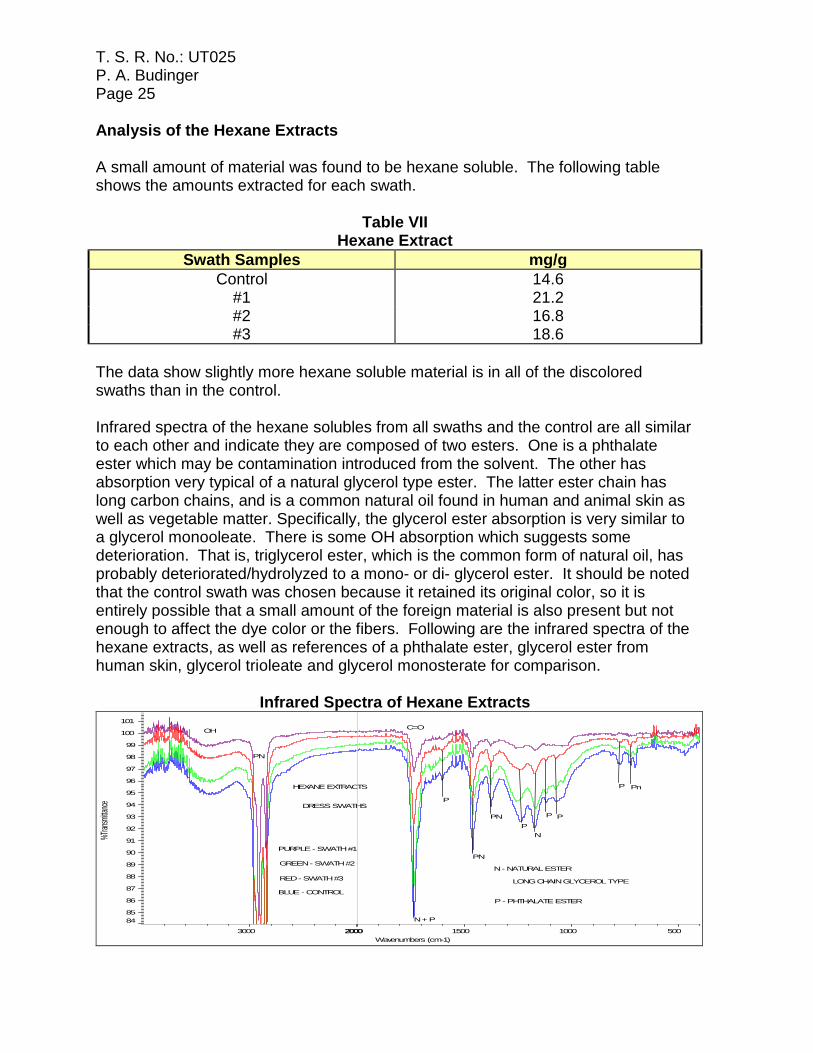
T. S. R. No.: UT025 P. A. Budinger Page 25 Analysis of the Hexane Extracts A small amount of material was found to be hexane soluble. The following table shows the amounts extracted for each swath.
Table VII Hexane Extract
Swath Samples mg/g Control 14.6
#1 21.2 #2 16.8 #3 18.6
The data show slightly more hexane soluble material is in all of the discolored swaths than in the control. Infrared spectra of the hexane solubles from all swaths and the control are all similar to each other and indicate they are composed of two esters. One is a phthalate ester which may be contamination introduced from the solvent. The other has absorption very typical of a natural glycerol type ester. The latter ester chain has long carbon chains, and is a common natural oil found in human and animal skin as well as vegetable matter. Specifically, the glycerol ester absorption is very similar to a glycerol monooleate. There is some OH absorption which suggests some deterioration. That is, triglycerol ester, which is the common form of natural oil, has probably deteriorated/hydrolyzed to a mono- or di- glycerol ester. It should be noted that the control swath was chosen because it retained its original color, so it is entirely possible that a small amount of the foreign material is also present but not enough to affect the dye color or the fibers. Following are the infrared spectra of the hexane extracts, as well as references of a phthalate ester, glycerol ester from human skin, glycerol trioleate and glycerol monosterate for comparison.
Infrared Spectra of Hexane Extracts
PnP
PP
NP
LONG CHAIN GLYCEROL TYPE
PN
P - PHTHALATE ESTER
N - NATURAL ESTER
PN
P
N + P
C=O
HEXANE EXTRACTS
DRESS SWATHS
BLUE - CONTROL
RED - SWATH #3
GREEN - SWATH #2
PURPLE - SWATH #1
PN
OH
84 85
86
87
88
89
90
91
92
93
94
95
96
97
98
99
100
101
%Tran
smitta
nce
500 1000 1500 2000 2000 3000 Wavenumbers (cm-1)
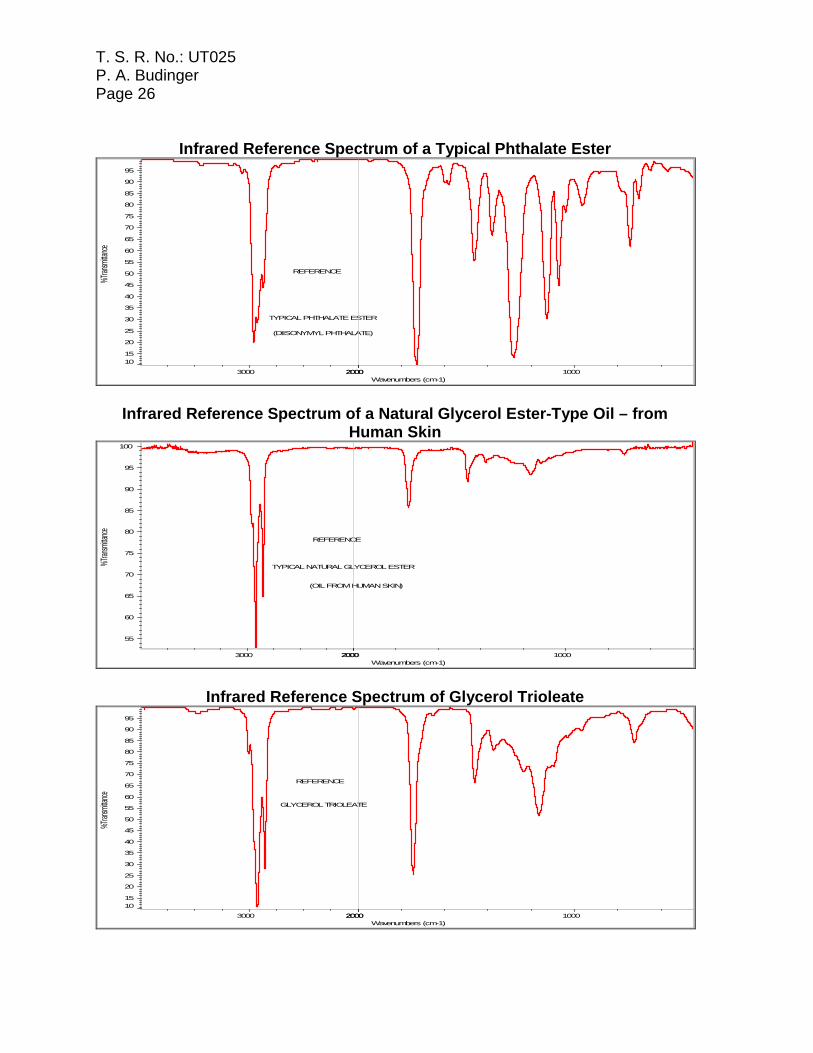
T. S. R. No.: UT025 P. A. Budinger Page 26
Infrared Reference Spectrum of a Typical Phthalate Ester
TYPICAL PHTHALATE ESTER
REFERENCE
(DIISONYMYL PHTHALATE)
10 15
20
25
30
35
40
45
50
55
60
65
70
75
80
85
90
95
%Tran
smitta
nce
1000 2000 2000 3000 Wavenumbers (cm-1)
Infrared Reference Spectrum of a Natural Glycerol Ester-Type Oil – from
Human Skin
(OIL FROM HUMAN SKIN)
REFERENCE
TYPICAL NATURAL GLYCEROL ESTER
55
60
65
70
75
80
85
90
95
100
%Tran
smitta
nce
1000 2000 2000 3000 Wavenumbers (cm-1)
Infrared Reference Spectrum of Glycerol Trioleate
REFERENCE
GLYCEROL TRIOLEATE
10 15
20
25
30
35
40
45
50
55
60
65
70
75
80
85
90
95
%Tran
smitta
nce
1000 2000 2000 3000 Wavenumbers (cm-1)
T. S. R. No.: UT025 P. A. Budinger Page 27
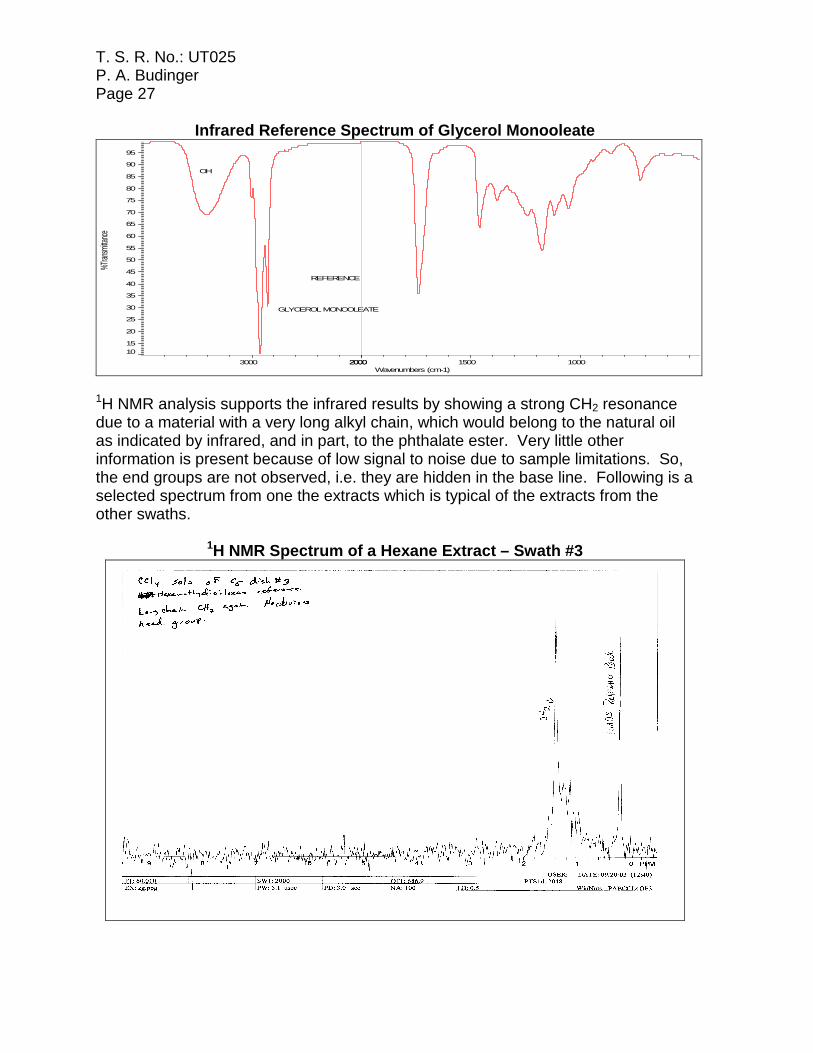
Infrared Reference Spectrum of Glycerol Monooleate
GLYCEROL MONOOLEATE
REFERENCE
OH
10 15
20
25
30
35
40
45
50
55
60
65
70
75
80
85
90
95
%Tran
smitta
nce
1000 1500 2000 2000 3000 Wavenumbers (cm-1)
1H NMR analysis supports the infrared results by showing a strong CH2 resonance due to a material with a very long alkyl chain, which would belong to the natural oil as indicated by infrared, and in part, to the phthalate ester. Very little other information is present because of low signal to noise due to sample limitations. So, the end groups are not observed, i.e. they are hidden in the base line. Following is a selected spectrum from one the extracts which is typical of the extracts from the other swaths.
1H NMR Spectrum of a Hexane Extract – Swath #3
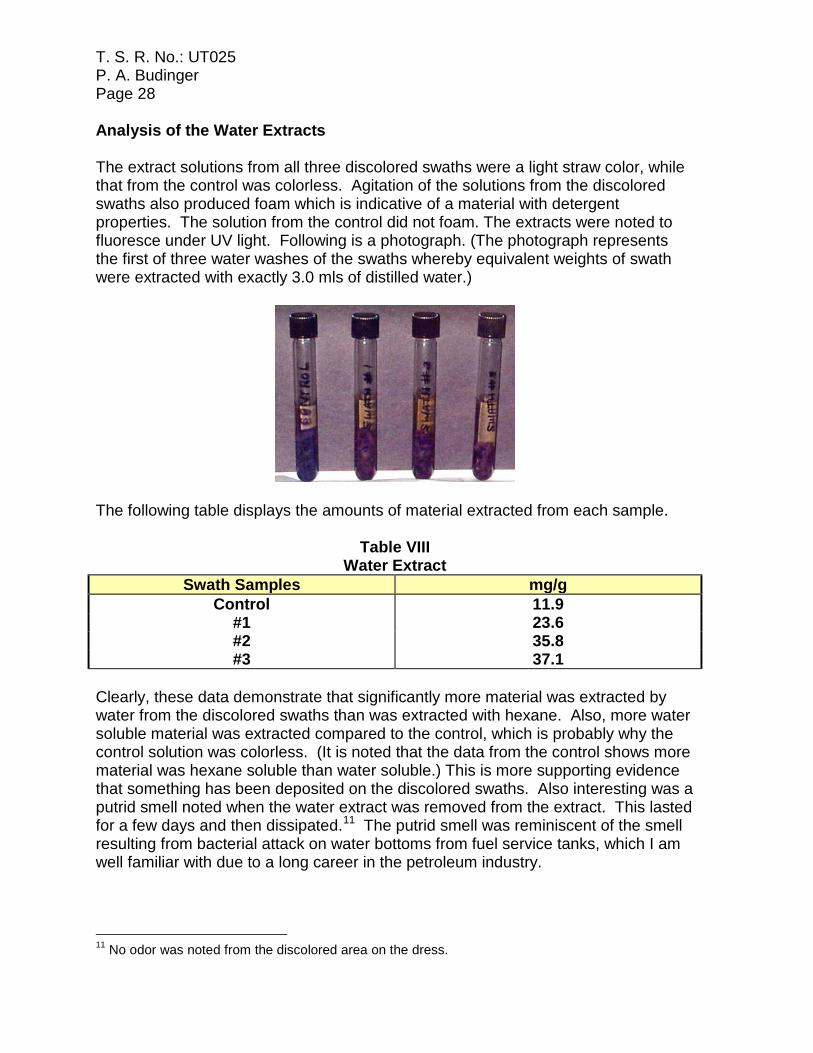
T. S. R. No.: UT025 P. A. Budinger Page 28 Analysis of the Water Extracts
The extract solutions from all three discolored swaths were a light straw color, while that from the control was colorless. Agitation of the solutions from the discolored swaths also produced foam which is indicative of a material with detergent properties. The solution from the control did not foam. The extracts were noted to fluoresce under UV light. Following is a photograph. (The photograph represents the first of three water washes of the swaths whereby equivalent weights of swath were extracted with exactly 3.0 mls of distilled water.)
The following table displays the amounts of material extracted from each sample.
Table VIII Water Extract
Swath Samples mg/g Control 11.9
#1 23.6 #2 35.8 #3 37.1
Clearly, these data demonstrate that significantly more material was extracted by water from the discolored swaths than was extracted with hexane. Also, more water soluble material was extracted compared to the control, which is probably why the control solution was colorless. (It is noted that the data from the control shows more material was hexane soluble than water soluble.) This is more supporting evidence that something has been deposited on the discolored swaths. Also interesting was a putrid smell noted when the water extract was removed from the extract. This lasted for a few days and then dissipated.11 The putrid smell was reminiscent of the smell resulting from bacterial attack on water bottoms from fuel service tanks, which I am well familiar with due to a long career in the petroleum industry.
11 No odor was noted from the discolored area on the dress.
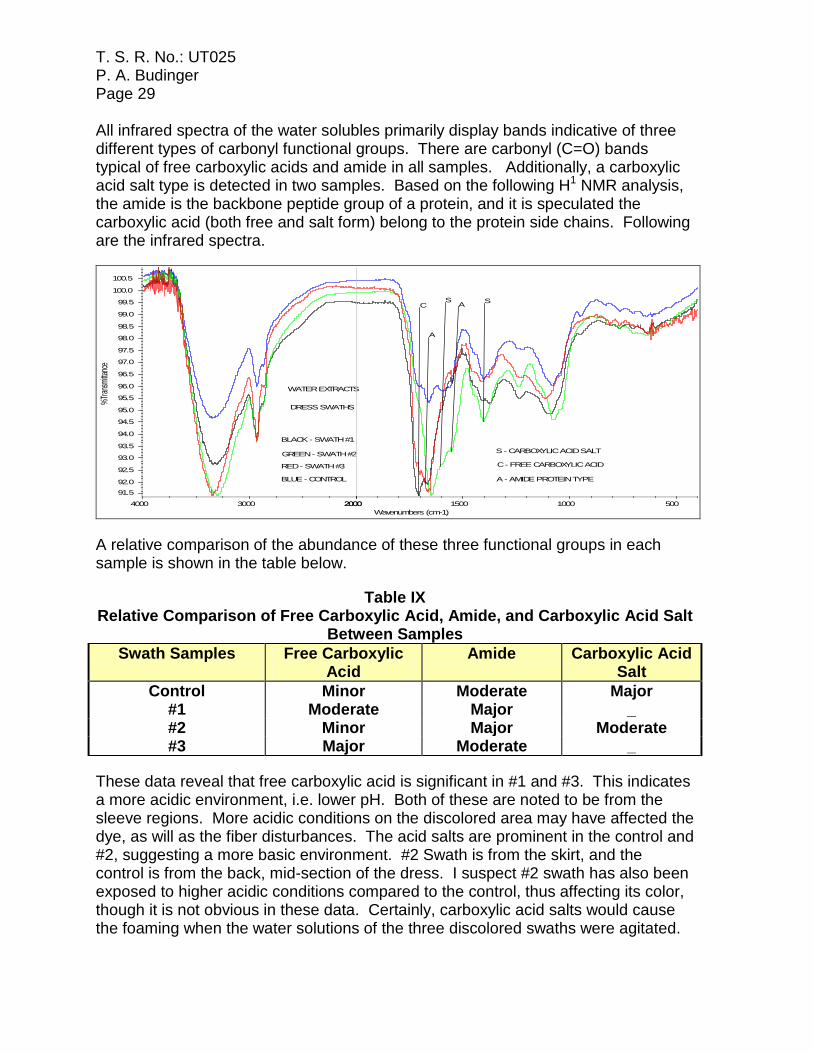
T. S. R. No.: UT025 P. A. Budinger Page 29 All infrared spectra of the water solubles primarily display bands indicative of three different types of carbonyl functional groups. There are carbonyl (C=O) bands typical of free carboxylic acids and amide in all samples. Additionally, a carboxylic acid salt type is detected in two samples. Based on the following H1 NMR analysis, the amide is the backbone peptide group of a protein, and it is speculated the carboxylic acid (both free and salt form) belong to the protein side chains. Following are the infrared spectra.
S - CARBOXYLIC ACID SALT
C - FREE CARBOXYLIC ACID
A - AMIDE PROTEIN TYPE
GREEN - SWATH #2
WATER EXTRACTS
DRESS SWATHS
BLUE - CONTROL
RED - SWATH #3
BLACK - SWATH #1
A
CSA
S
91.5 92.0
92.5
93.0
93.5
94.0
94.5
95.0
95.5
96.0
96.5
97.0
97.5
98.0
98.5
99.0
99.5
100.0
100.5
%Tran
smitta
nce
500 1000 1500 2000 2000 3000 4000 Wavenumbers (cm-1)
A relative comparison of the abundance of these three functional groups in each sample is shown in the table below.
Table IX Relative Comparison of Free Carboxylic Acid, Amide, and Carboxylic Acid Salt
Between Samples Swath Samples Free Carboxylic
Acid Amide Carboxylic Acid
Salt Control Minor Moderate Major
#1 Moderate Major _ #2 Minor Major Moderate #3 Major Moderate _
These data reveal that free carboxylic acid is significant in #1 and #3. This indicates a more acidic environment, i.e. lower pH. Both of these are noted to be from the sleeve regions. More acidic conditions on the discolored area may have affected the dye, as will as the fiber disturbances. The acid salts are prominent in the control and #2, suggesting a more basic environment. #2 Swath is from the skirt, and the control is from the back, mid-section of the dress. I suspect #2 swath has also been exposed to higher acidic conditions compared to the control, thus affecting its color, though it is not obvious in these data. Certainly, carboxylic acid salts would cause the foaming when the water solutions of the three discolored swaths were agitated.
T. S. R. No.: UT025 P. A. Budinger Page 30 (Certain types of carboxylic acid salts are used as soap because of their detergent property.)
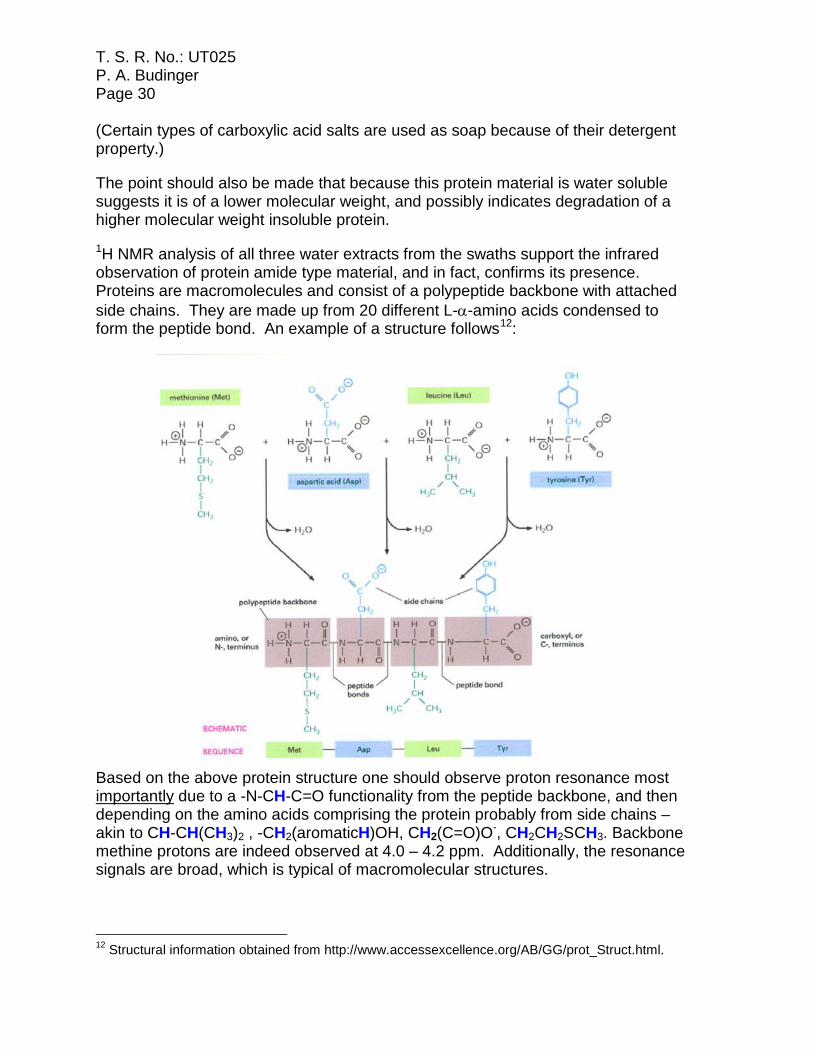
The point should also be made that because this protein material is water soluble suggests it is of a lower molecular weight, and possibly indicates degradation of a higher molecular weight insoluble protein. 1H NMR analysis of all three water extracts from the swaths support the infrared observation of protein amide type material, and in fact, confirms its presence. Proteins are macromolecules and consist of a polypeptide backbone with attached side chains. They are made up from 20 different L-α-amino acids condensed to form the peptide bond. An example of a structure follows12:
Based on the above protein structure one should observe proton resonance most importantly due to a -N-CH-C=O functionality from the peptide backbone, and then depending on the amino acids comprising the protein probably from side chains – akin to CH-CH(CH3)2 , -CH2(aromaticH)OH, CH2(C=O)O-, CH2CH2SCH3. Backbone methine protons are indeed observed at 4.0 – 4.2 ppm. Additionally, the resonance signals are broad, which is typical of macromolecular structures.
12 Structural information obtained from http://www.accessexcellence.org/AB/GG/prot_Struct.html.
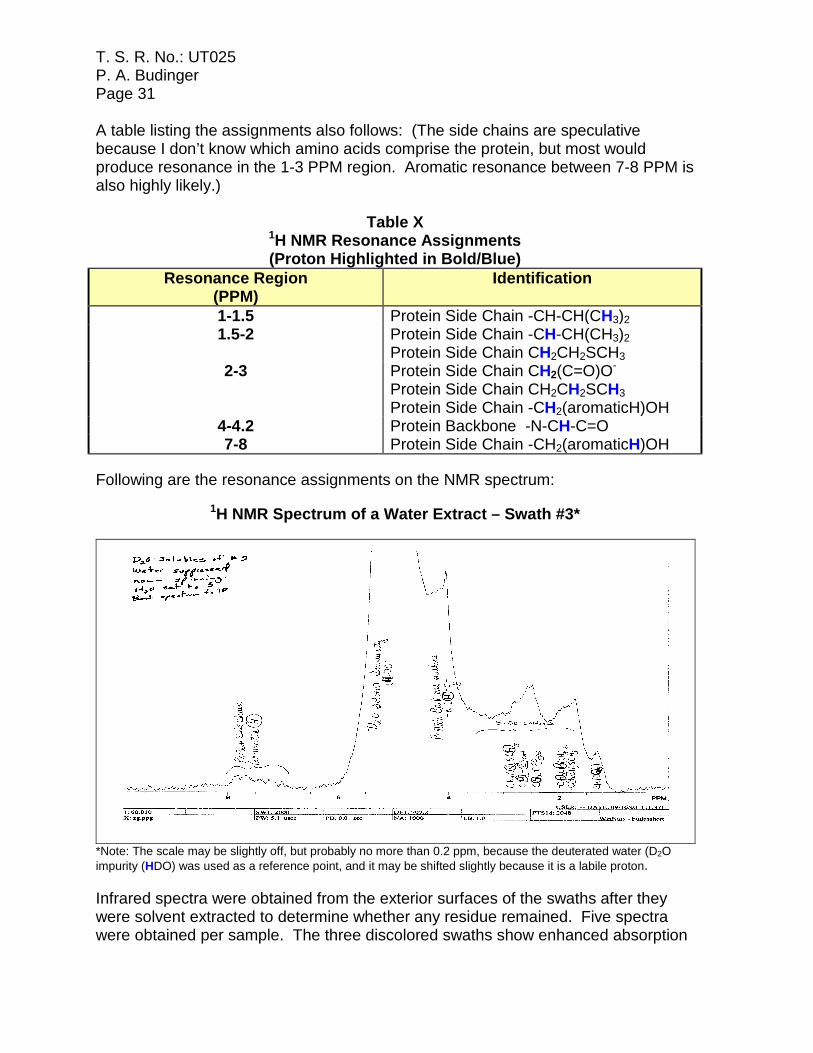
T. S. R. No.: UT025 P. A. Budinger Page 31 A table listing the assignments also follows: (The side chains are speculative because I don’t know which amino acids comprise the protein, but most would produce resonance in the 1-3 PPM region. Aromatic resonance between 7-8 PPM is also highly likely.)
Table X 1H NMR Resonance Assignments (Proton Highlighted in Bold/Blue)
Resonance Region (PPM)
Identification
1-1.5 Protein Side Chain -CH-CH(CH3)2 1.5-2 Protein Side Chain -CH-CH(CH3)2
Protein Side Chain CH2CH2SCH3 2-3 Protein Side Chain CH2(C=O)O-
Protein Side Chain CH2CH2SCH3 Protein Side Chain -CH2(aromaticH)OH
4-4.2 Protein Backbone -N-CH-C=O 7-8 Protein Side Chain -CH2(aromaticH)OH
Following are the resonance assignments on the NMR spectrum: 1H NMR Spectrum of a Water Extract – Swath #3*
*Note: The scale may be slightly off, but probably no more than 0.2 ppm, because the deuterated water (D2O impurity (HDO) was used as a reference point, and it may be shifted slightly because it is a labile proton.
Infrared spectra were obtained from the exterior surfaces of the swaths after they were solvent extracted to determine whether any residue remained. Five spectra were obtained per sample. The three discolored swaths show enhanced absorption
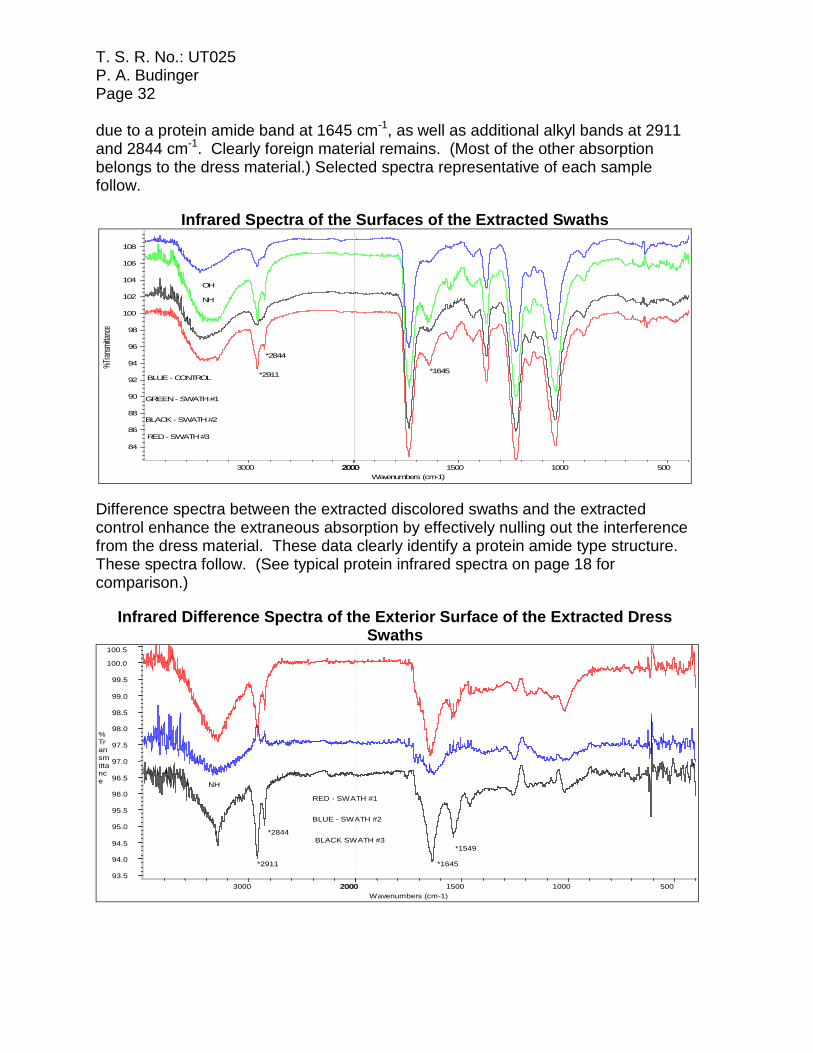
T. S. R. No.: UT025 P. A. Budinger Page 32 due to a protein amide band at 1645 cm-1, as well as additional alkyl bands at 2911 and 2844 cm-1. Clearly foreign material remains. (Most of the other absorption belongs to the dress material.) Selected spectra representative of each sample follow.
Infrared Spectra of the Surfaces of the Extracted Swaths
*1645
RED - SWATH #3
*2844
*2911
NH
OH
BLACK - SWATH #2
BLUE - CONTROL
GREEN - SWATH #1
84
86
88
90
92
94
96
98
100
102
104
106
108
%Tran
smitta
nce
500 1000 1500 2000 2000 3000 Wavenumbers (cm-1)
Difference spectra between the extracted discolored swaths and the extracted control enhance the extraneous absorption by effectively nulling out the interference from the dress material. These data clearly identify a protein amide type structure. These spectra follow. (See typical protein infrared spectra on page 18 for comparison.)
Infrared Difference Spectra of the Exterior Surface of the Extracted Dress Swaths
*1549 *1645
BLACK SWATH #3
RED - SWATH #1 BLUE - SWATH #2
*2844
*2911
NH
93.5 94.0 94.5 95.0 95.5 96.0 96.5 97.0 97.5 98.0 98.5 99.0 99.5
100.0 100.5
%Transmittance
500 1000 1500 2000 2000 3000 Wavenumbers (cm-1)

T. S. R. No.: UT025 P. A. Budinger Page 33 The 1650 cm-1/1740 cm-1 infrared band intensity ratios were obtained from the solvent extracted swaths in the same manner as those from “as received” swaths. This was done to get a relative idea as to the amount of protein remaining on extracted swaths. The following table presents the data.
Table XI
Exterior Surfaces of Extracted Swaths (1650 cm-1/1740 cm-1 Intensity Ratio - Protein)
Spectrum Run
Control Swath
Swath #1
Swath #2
Swath #3
1 0.17 0.25 0.27 0.40 2 0.19 0.26 0.24 0.22 3 0.21 0.49 0.17 0.32 4 0.19 0.30 0.24 0.24 5 0.20 0.21 0.19 0.39
Ave. 0.19 0.30 0.22 0.31 Comparison of the average value of the control (0.19) to those of the swaths 0.30 (Swath #1), 0.22 (Swath #2), and 0.31 (Swath #3) provide additional evidence that insoluble protein remains on the dress. Also, comparing these swaths values to those of the unextracted material, 0.41, 0.47, and 0.43 respectively (see page19), is proof soluble protein material has been removed.
II. Analytical Results for the Lining Stain
Synopsis of this Section The lining is not discolored, but has a few stains. The fiber in the stain area has not suffered damage. It is a knit of cellulose acetate. The stain material appears to have almost permeated the lining, though there is slightly more on the side facing the outer fabric. The stain contains, in part, components found in the exterior fabric. These are mostly water soluble proteins, and a trace of natural ester-type oil. This suggests the stain is a result of “bleed through” of some of the material found on the outer fabric. It also indicates moisture had to be originally present in the substance. No higher molecular weight insoluble protein is present. Thus, the outer dress fabric apparently served as a filter for the higher molecular weight material, as well as some of the natural oil. Finally, after the stain was extracted the fabric returned to its original color. So, the dye was not affected by the components from its stain. Microscope Analysis: Examination of the lining on both sides indicates the stain has permeated the cloth. The lining (cellulose acetate as identified by infrared below) is woven, as opposed to the knit of the dress exterior fabric. The fiber in the stain area does not appear to have suffered damage. Microscope photographs follow.
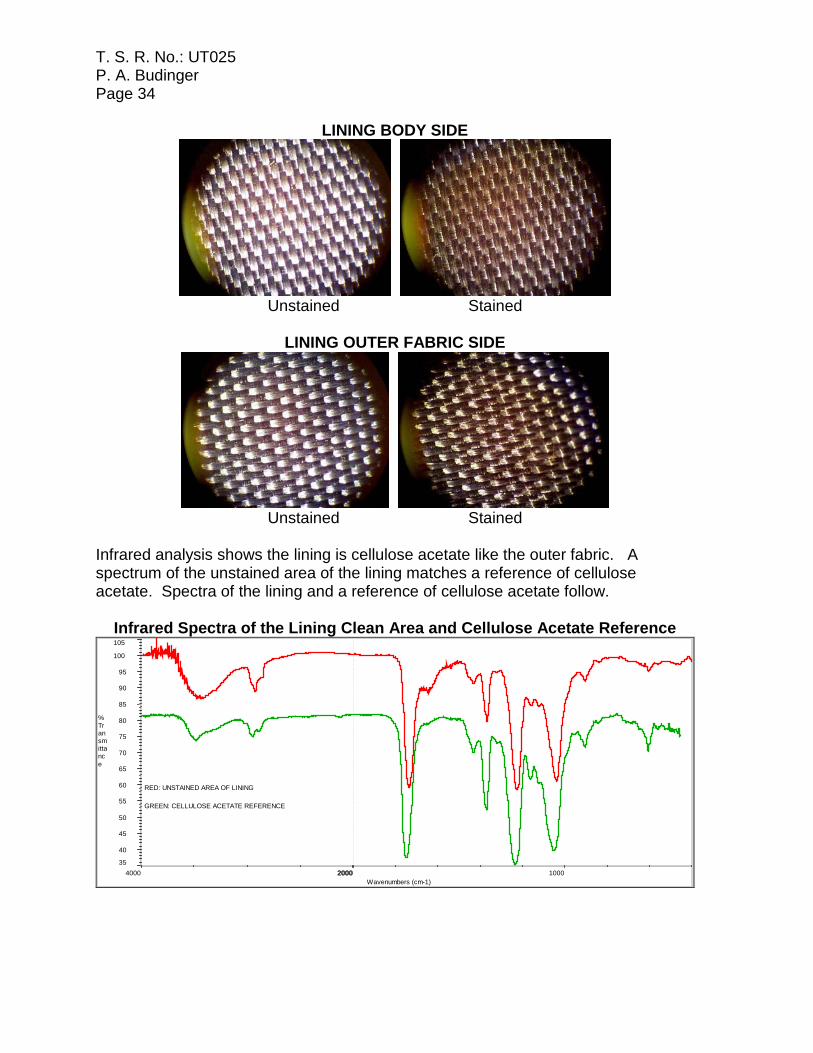
T. S. R. No.: UT025 P. A. Budinger Page 34
LINING BODY SIDE
Unstained Stained
LINING OUTER FABRIC SIDE
Unstained Stained
Infrared analysis shows the lining is cellulose acetate like the outer fabric. A spectrum of the unstained area of the lining matches a reference of cellulose acetate. Spectra of the lining and a reference of cellulose acetate follow.
Infrared Spectra of the Lining Clean Area and Cellulose Acetate Reference
RED: UNSTAINED AREA OF LINING GREEN: CELLULOSE ACETATE REFERENCE
35 40 45 50 55 60 65 70 75 80 85 90 95
100 105
%Transmittance
1000 2000 2000 4000 Wavenumbers (cm-1)
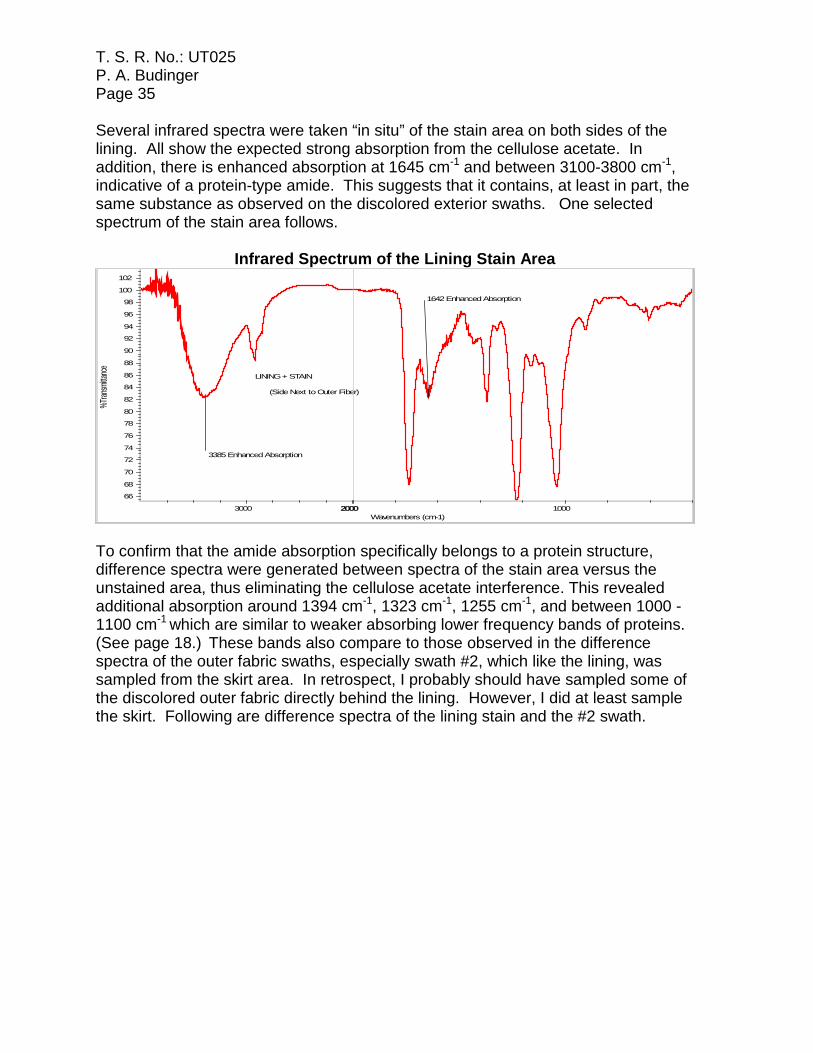
T. S. R. No.: UT025 P. A. Budinger Page 35 Several infrared spectra were taken “in situ” of the stain area on both sides of the lining. All show the expected strong absorption from the cellulose acetate. In addition, there is enhanced absorption at 1645 cm-1 and between 3100-3800 cm-1, indicative of a protein-type amide. This suggests that it contains, at least in part, the same substance as observed on the discolored exterior swaths. One selected spectrum of the stain area follows.
Infrared Spectrum of the Lining Stain Area
1642 Enhanced Absorption
(Side Next to Outer Fiber)
LINING + STAIN
3385 Enhanced Absorption
66
68
70
72
74
76
78
80
82
84
86
88
90
92
94
96
98
100
102
%Tran
smitta
nce
1000 2000 2000 3000 Wavenumbers (cm-1)
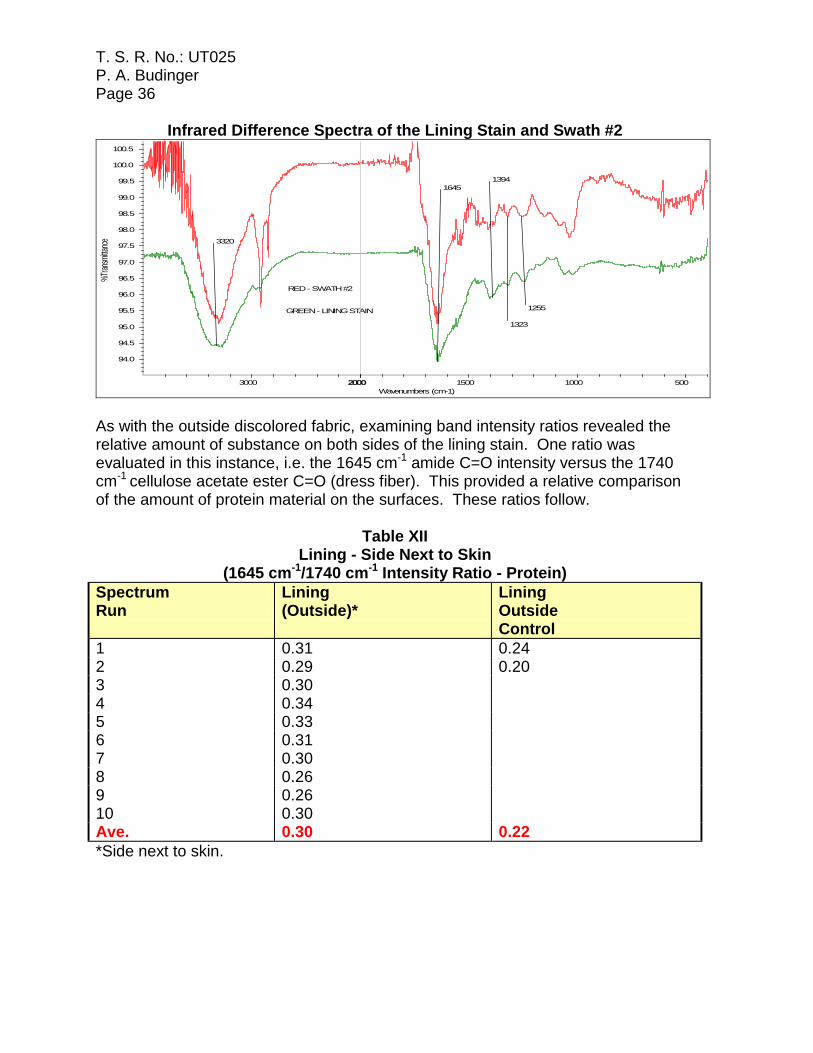
To confirm that the amide absorption specifically belongs to a protein structure, difference spectra were generated between spectra of the stain area versus the unstained area, thus eliminating the cellulose acetate interference. This revealed additional absorption around 1394 cm-1, 1323 cm-1, 1255 cm-1, and between 1000 -1100 cm-1
which are similar to weaker absorbing lower frequency bands of proteins. (See page 18.) These bands also compare to those observed in the difference spectra of the outer fabric swaths, especially swath #2, which like the lining, was sampled from the skirt area. In retrospect, I probably should have sampled some of the discolored outer fabric directly behind the lining. However, I did at least sample the skirt. Following are difference spectra of the lining stain and the #2 swath.
T. S. R. No.: UT025 P. A. Budinger Page 36
Infrared Difference Spectra of the Lining Stain and Swath #2
1394 1645
3320
1255
1323
RED - SWATH #2
GREEN - LINING STAIN
94.0
94.5
95.0
95.5
96.0
96.5
97.0
97.5
98.0
98.5
99.0
99.5
100.0
100.5
%Tran
smitta
nce
500 1000 1500 2000 2000 3000 Wavenumbers (cm-1)
As with the outside discolored fabric, examining band intensity ratios revealed the relative amount of substance on both sides of the lining stain. One ratio was evaluated in this instance, i.e. the 1645 cm-1 amide C=O intensity versus the 1740 cm-1 cellulose acetate ester C=O (dress fiber). This provided a relative comparison of the amount of protein material on the surfaces. These ratios follow.
Table XII Lining - Side Next to Skin
(1645 cm-1/1740 cm-1 Intensity Ratio - Protein) Spectrum Run
Lining (Outside)*
Lining Outside Control
1 0.31 0.24 2 0.29 0.20 3 0.30 4 0.34 5 0.33 6 0.31 7 0.30 8 0.26 9 0.26 10 0.30 Ave. 0.30 0.22 *Side next to skin.
T. S. R. No.: UT025 P. A. Budinger Page 37
Table XIII Lining - Side Next to Outer Fabric
(1645 cm-1/1740 cm-1 Intensity Ratio - Protein) Spectrum Run
Lining (Inside)*
Lining Inside Control
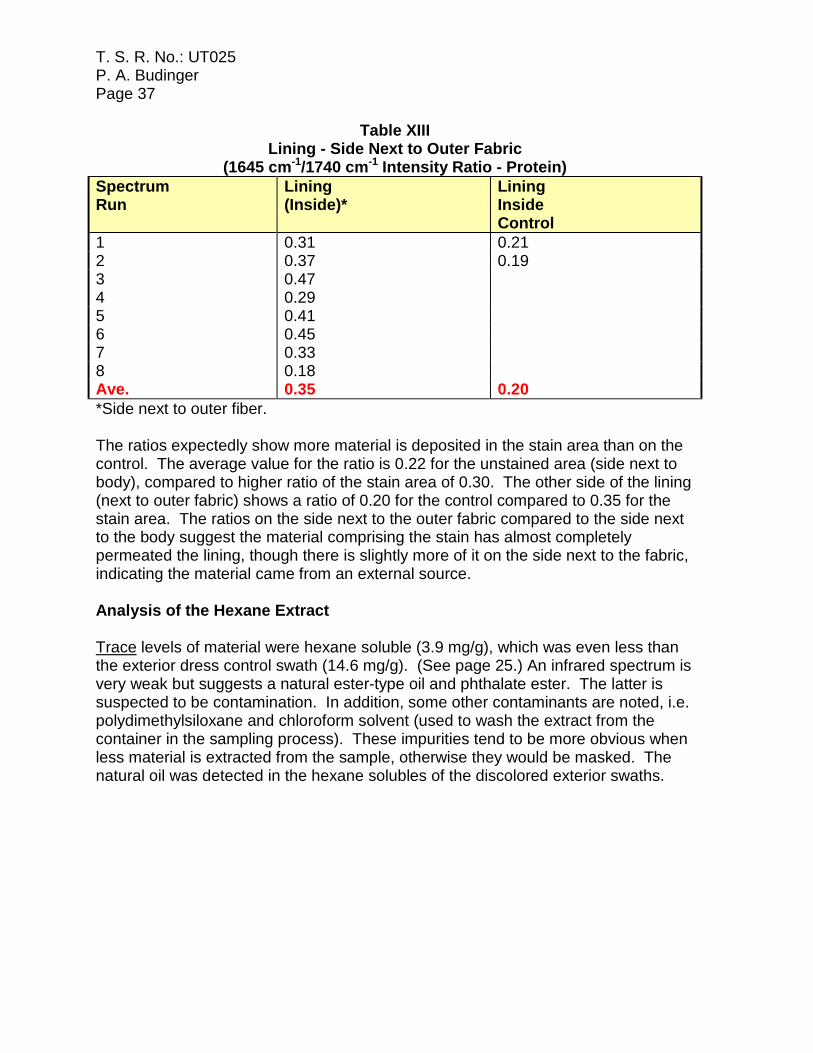
1 0.31 0.21 2 0.37 0.19 3 0.47 4 0.29 5 0.41 6 0.45 7 0.33 8 0.18 Ave. 0.35 0.20 *Side next to outer fiber. The ratios expectedly show more material is deposited in the stain area than on the control. The average value for the ratio is 0.22 for the unstained area (side next to body), compared to higher ratio of the stain area of 0.30. The other side of the lining (next to outer fabric) shows a ratio of 0.20 for the control compared to 0.35 for the stain area. The ratios on the side next to the outer fabric compared to the side next to the body suggest the material comprising the stain has almost completely permeated the lining, though there is slightly more of it on the side next to the fabric, indicating the material came from an external source. Analysis of the Hexane Extract Trace levels of material were hexane soluble (3.9 mg/g), which was even less than the exterior dress control swath (14.6 mg/g). (See page 25.) An infrared spectrum is very weak but suggests a natural ester-type oil and phthalate ester. The latter is suspected to be contamination. In addition, some other contaminants are noted, i.e. polydimethylsiloxane and chloroform solvent (used to wash the extract from the container in the sampling process). These impurities tend to be more obvious when less material is extracted from the sample, otherwise they would be masked. The natural oil was detected in the hexane solubles of the discolored exterior swaths.
T. S. R. No.: UT025 P. A. Budinger Page 38
Infrared Spectrum of the Lining Hexane Extract
N
C
S
S
S
P P
N
C
P
S
PN
PN
PP
PN
P - Phthalate Ester Contamination
LINING HEXANE SOLUBLES
C - Chloroform Contamination
N - NATURAL ESTER
S - Poly(dimethylsiloxane) Contamination
PN
97.0 97.2
97.4
97.6
97.8
98.0
98.2
98.4
98.6
98.8
99.0
99.2
99.4
99.6
99.8
100.0
100.2
100.4
100.6
100.8 101.0
%Tran
smitta
nce
1000 2000 2000 3000 Wavenumbers (cm-1)
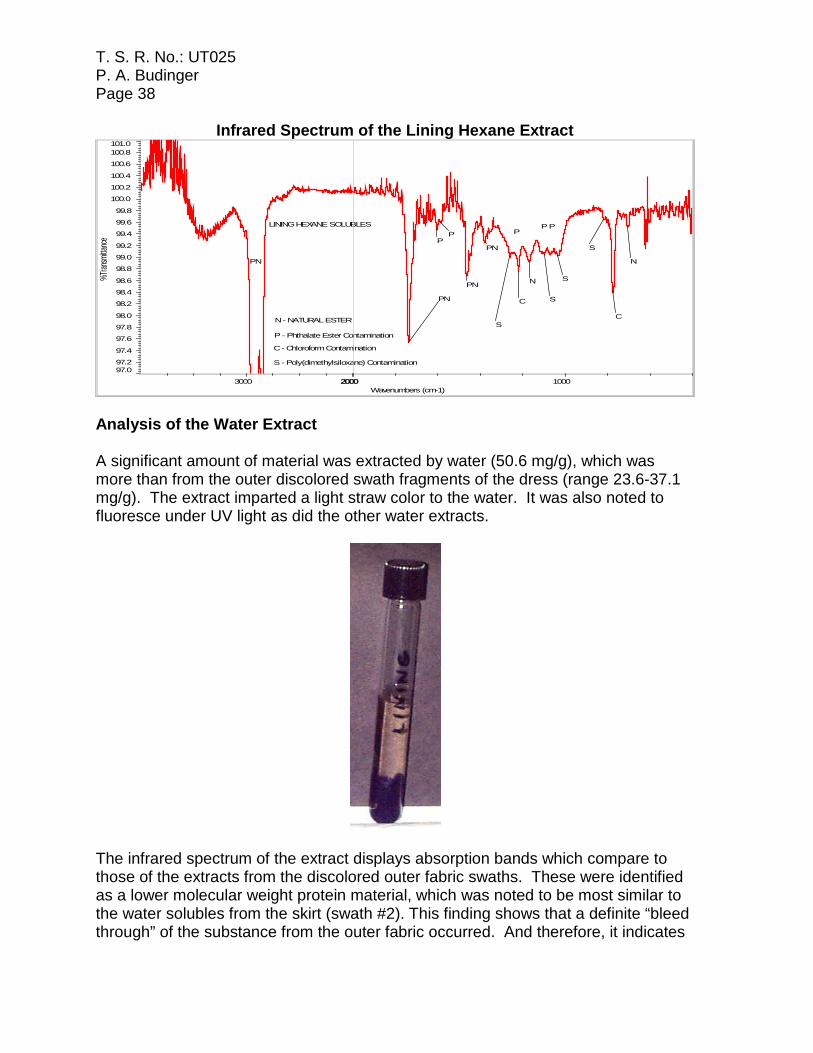
Analysis of the Water Extract A significant amount of material was extracted by water (50.6 mg/g), which was more than from the outer discolored swath fragments of the dress (range 23.6-37.1 mg/g). The extract imparted a light straw color to the water. It was also noted to fluoresce under UV light as did the other water extracts.
The infrared spectrum of the extract displays absorption bands which compare to those of the extracts from the discolored outer fabric swaths. These were identified as a lower molecular weight protein material, which was noted to be most similar to the water solubles from the skirt (swath #2). This finding shows that a definite “bleed through” of the substance from the outer fabric occurred. And therefore, it indicates
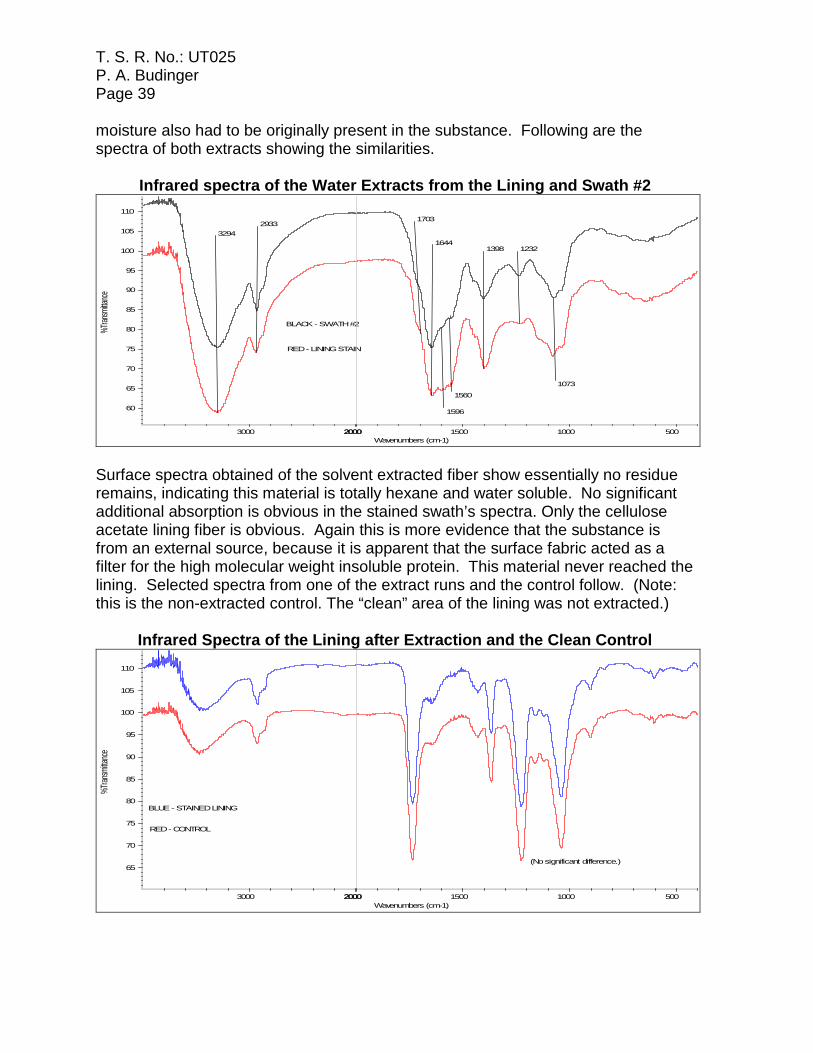
T. S. R. No.: UT025 P. A. Budinger Page 39 moisture also had to be originally present in the substance. Following are the spectra of both extracts showing the similarities.
Infrared spectra of the Water Extracts from the Lining and Swath #2
1073
1560
1596
1232 1398 1644
1703
BLACK - SWATH #2
RED - LINING STAIN
2933 3294
60
65
70
75
80
85
90
95
100
105
110
%Tran
smitta
nce
500 1000 1500 2000 2000 3000 Wavenumbers (cm-1)
Surface spectra obtained of the solvent extracted fiber show essentially no residue remains, indicating this material is totally hexane and water soluble. No significant additional absorption is obvious in the stained swath’s spectra. Only the cellulose acetate lining fiber is obvious. Again this is more evidence that the substance is from an external source, because it is apparent that the surface fabric acted as a filter for the high molecular weight insoluble protein. This material never reached the lining. Selected spectra from one of the extract runs and the control follow. (Note: this is the non-extracted control. The “clean” area of the lining was not extracted.)
Infrared Spectra of the Lining after Extraction and the Clean Control
(No significant difference.)
RED - CONTROL
BLUE - STAINED LINING
65
70
75
80
85
90
95
100
105
110
%Tran
smitta
nce
500 1000 1500 2000 2000 3000 Wavenumbers (cm-1)
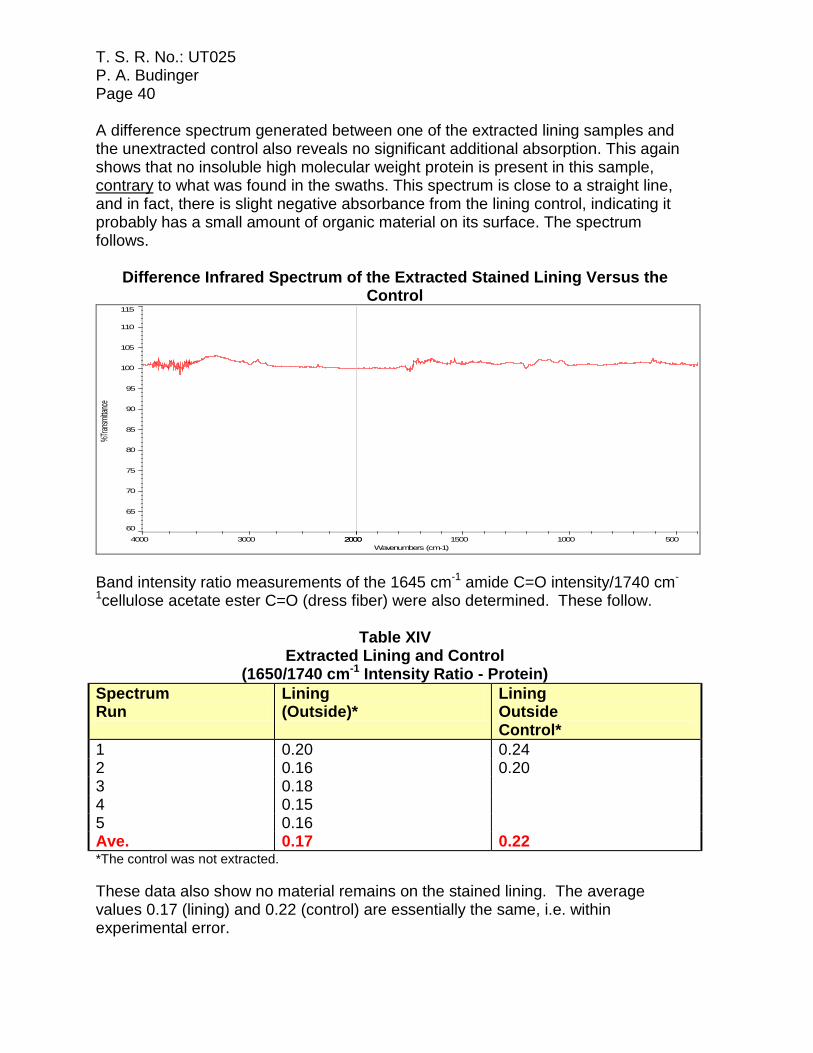
T. S. R. No.: UT025 P. A. Budinger Page 40 A difference spectrum generated between one of the extracted lining samples and the unextracted control also reveals no significant additional absorption. This again shows that no insoluble high molecular weight protein is present in this sample, contrary to what was found in the swaths. This spectrum is close to a straight line, and in fact, there is slight negative absorbance from the lining control, indicating it probably has a small amount of organic material on its surface. The spectrum follows.
Difference Infrared Spectrum of the Extracted Stained Lining Versus the Control
60
65
70
75
80
85
90
95
100
105
110
115
%Tran
smitta
nce
500 1000 1500 2000 2000 3000 4000 Wavenumbers (cm-1)
Band intensity ratio measurements of the 1645 cm-1 amide C=O intensity/1740 cm-
1cellulose acetate ester C=O (dress fiber) were also determined. These follow.
Table XIV Extracted Lining and Control
(1650/1740 cm-1 Intensity Ratio - Protein) Spectrum Run
Lining (Outside)*
Lining Outside Control*
1 0.20 0.24 2 0.16 0.20 3 0.18 4 0.15 5 0.16 Ave. 0.17 0.22 *The control was not extracted. These data also show no material remains on the stained lining. The average values 0.17 (lining) and 0.22 (control) are essentially the same, i.e. within experimental error.
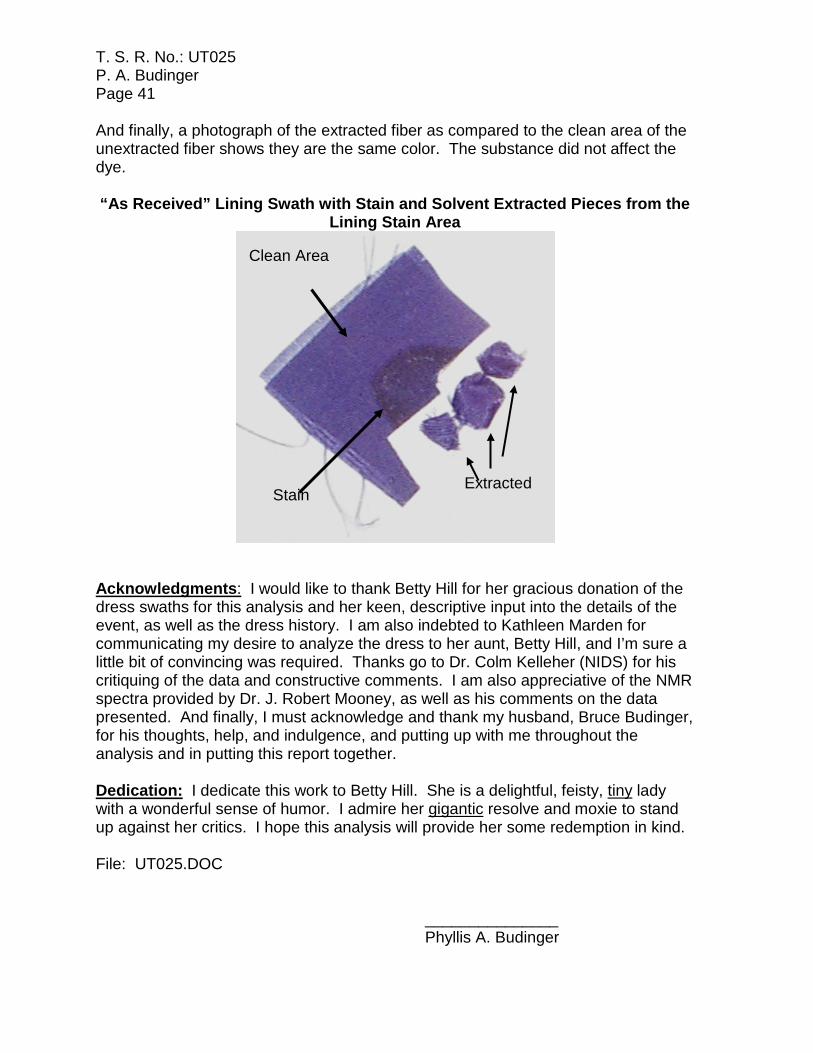
T. S. R. No.: UT025 P. A. Budinger Page 41 And finally, a photograph of the extracted fiber as compared to the clean area of the unextracted fiber shows they are the same color. The substance did not affect the dye. “As Received” Lining Swath with Stain and Solvent Extracted Pieces from the
Lining Stain Area
Acknowledgments: I would like to thank Betty Hill for her gracious donation of the dress swaths for this analysis and her keen, descriptive input into the details of the event, as well as the dress history. I am also indebted to Kathleen Marden for communicating my desire to analyze the dress to her aunt, Betty Hill, and I’m sure a little bit of convincing was required. Thanks go to Dr. Colm Kelleher (NIDS) for his critiquing of the data and constructive comments. I am also appreciative of the NMR spectra provided by Dr. J. Robert Mooney, as well as his comments on the data presented. And finally, I must acknowledge and thank my husband, Bruce Budinger, for his thoughts, help, and indulgence, and putting up with me throughout the analysis and in putting this report together. Dedication: I dedicate this work to Betty Hill. She is a delightful, feisty, tiny lady with a wonderful sense of humor. I admire her gigantic resolve and moxie to stand up against her critics. I hope this analysis will provide her some redemption in kind. File: UT025.DOC _______________ Phyllis A. Budinger
Extracted Stain
Clean Area
T. S. R. No.: UT025 P. A. Budinger Page 42 Distribution:
Betty Hill Kathleen Marden Nancy Talbott (BLT Research) Mark Rodeghier (CUFOS Files) Dwight Connelly (MUFON Files) John Scheussler (MUFON) William Jones (Ohio State University UFO Archives) Colm Kelleher (NIDS) Stanton T. Friedman J. Robert Mooney Bill Chalker (APEG)

T. S. R. No.: UT025 P. A. Budinger Page 43
ADDENDUM
(C=O)NH
Amide
C=O
II AMIDE BANDS PREDOMINATE
TYPICAL PROTEIN STRUCTURE
N-H
94.5
95.0
95.5
96.0
96.5
97.0
97.5
98.0
98.5
99.0
99.5
100.0
%Transm
ittance
1000 2000 2000 3000 Wavenumbers (cm-1)
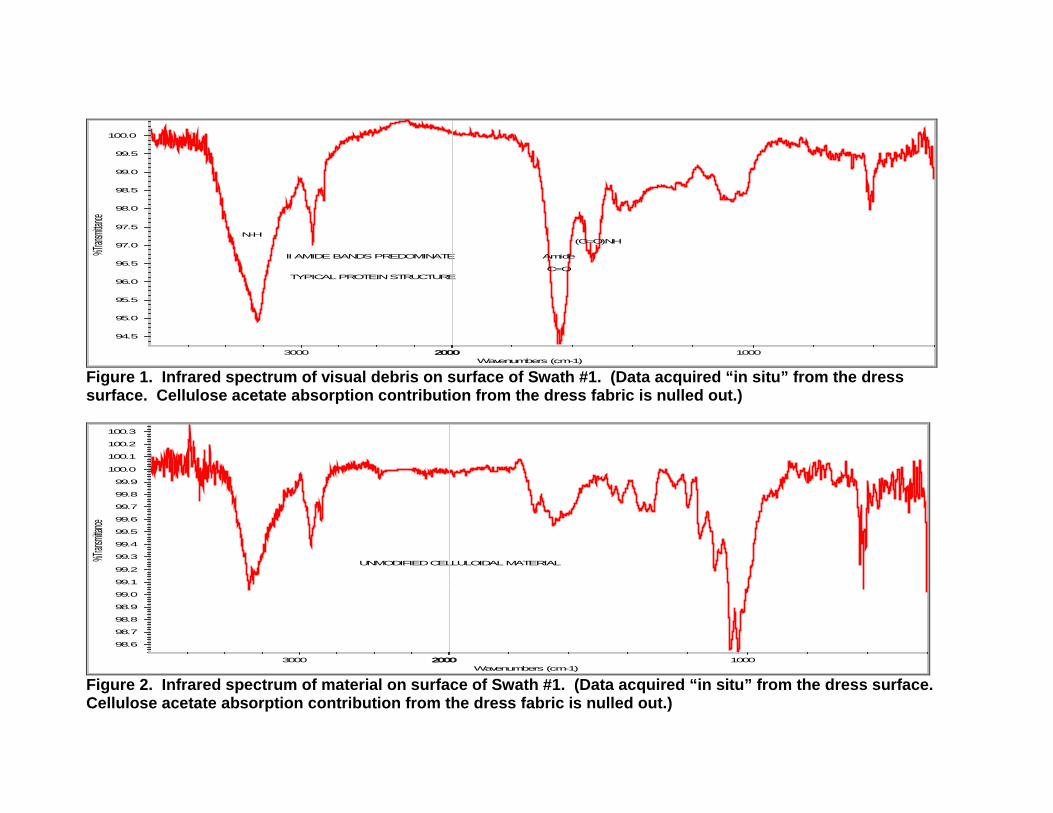
Figure 1. Infrared spectrum of visual debris on surface of Swath #1. (Data acquired “in situ” from the dress surface. Cellulose acetate absorption contribution from the dress fabric is nulled out.)
UNMODIFIED CELLULOIDAL MATERIAL
98.6
98.7
98.8
98.9
99.0
99.1
99.2
99.3
99.4
99.5
99.6
99.7
99.8
99.9
100.0
100.1
100.2
100.3
%Trans
mittanc
e
1000 2000 2000 3000 Wavenumbers (cm-1)
Figure 2. Infrared spectrum of material on surface of Swath #1. (Data acquired “in situ” from the dress surface. Cellulose acetate absorption contribution from the dress fabric is nulled out.)
T. S. R. No.: UT025 P. A. Budinger Page 45
AMIDE C=O
2237 Organic Nitrile
SUSPECT POLACRYLONITRILE ORGANO NITRILE
II AMIDE
95.5 96.0 96.5 97.0 97.5 98.0 98.5 99.0 99.5
100.0 100.5
%Transmittance
1000 2000 2000 3000 Wavenumbers (cm-1)
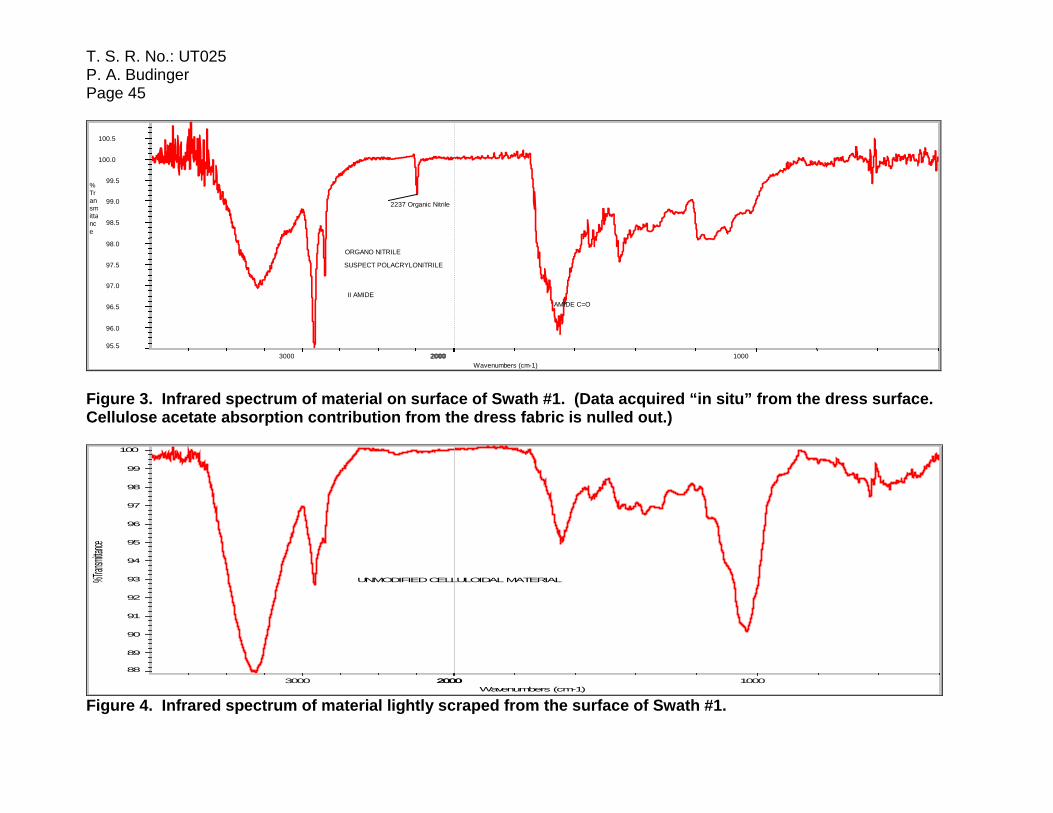
Figure 3. Infrared spectrum of material on surface of Swath #1. (Data acquired “in situ” from the dress surface. Cellulose acetate absorption contribution from the dress fabric is nulled out.)
UNMODIFIED CELLULOIDAL MATERIAL
88
89
90
91
92
93
94
95
96
97
98
99
100
%Transm
ittance
1000 2000 2000 3000 Wavenumbers (cm-1)
Figure 4. Infrared spectrum of material lightly scraped from the surface of Swath #1.
T. S. R. No.: UT025 P. A. Budinger Page 46
TYPICAL PROTEIN STRUCTURE
II AMIDE
92.5
93.0
93.5
94.0
94.5
95.0
95.5
96.0
96.5
97.0
97.5
98.0
98.5
99.0
99.5
100.0
100.5
%Transm
ittance
1000 2000 2000 3000 Wavenumbers (cm-1)
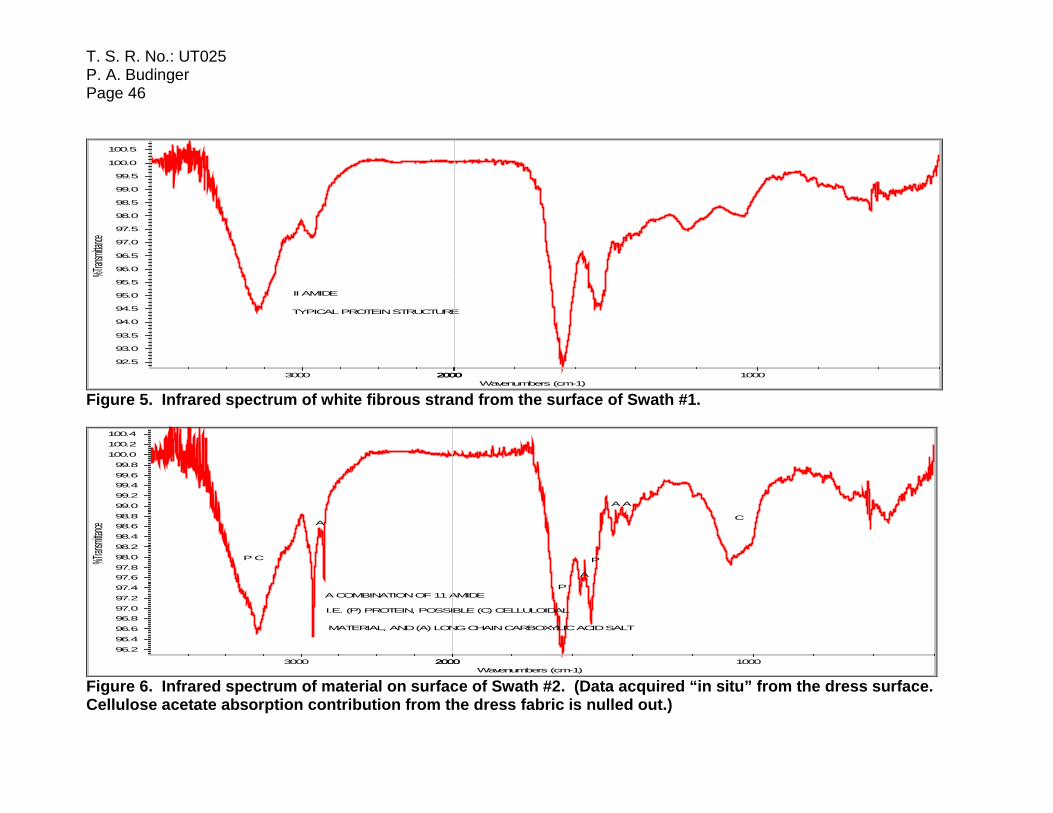
Figure 5. Infrared spectrum of white fibrous strand from the surface of Swath #1.
C
A A
P
A
PA COMBINATION OF 11 AMIDE
MATERIAL, AND (A) LONG CHAIN CARBOXYLIC ACID SALT
I.E. (P) PROTEIN, POSSIBLE (C) CELLULOIDAL
A
P C
96.2 96.4 96.6 96.8 97.0 97.2 97.4 97.6 97.8 98.0 98.2 98.4 98.6 98.8 99.0 99.2 99.4 99.6 99.8
100.0 100.2 100.4
%Transm
ittance
1000 2000 2000 3000 Wavenumbers (cm-1)
Figure 6. Infrared spectrum of material on surface of Swath #2. (Data acquired “in situ” from the dress surface. Cellulose acetate absorption contribution from the dress fabric is nulled out.)
T. S. R. No.: UT025 P. A. Budinger Page 47
C P
P
P
I.E. (P) PROTEIN AND (C) POSSIBLE CELLULOIDAL MATERIAL
A COMBINATION OF II AMIDE
PC
82 84 86 88 90 92 94 96 98
100
%Transmittance
1000 2000 2000 3000 Wavenumbers (cm-1)
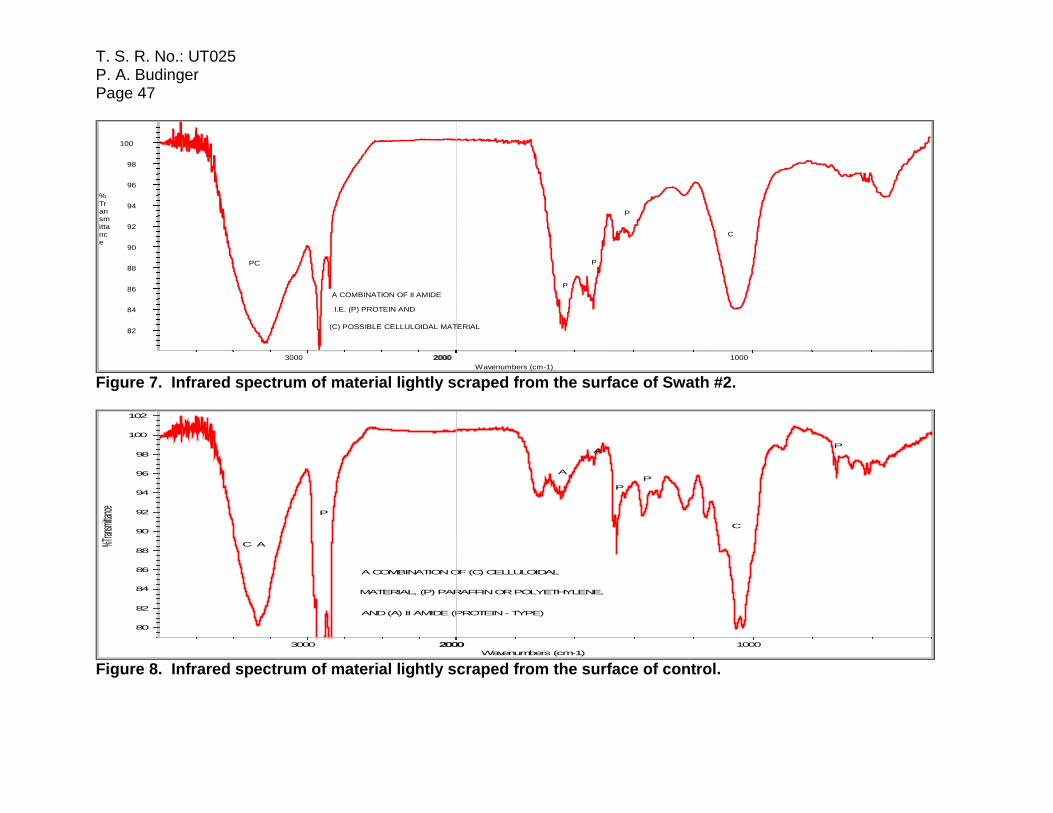
Figure 7. Infrared spectrum of material lightly scraped from the surface of Swath #2.
P
C
PP
A
A
MATERIAL, (P) PARAFFIN OR POLYETHYLENE,
AND (A) II AMIDE (PROTEIN - TYPE)
A COMBINATION OF (C) CELLULOIDAL
P
C A
80
82
84
86
88
90
92
94
96
98
100
102
%Trans
mittanc
e
1000 2000 2000 3000 Wavenumbers (cm-1)
Figure 8. Infrared spectrum of material lightly scraped from the surface of control.