Embed Size (px)
Citation preview
Technical Seminar:Progress with societal risk aroundonshore, non-nuclear major hazardsPresenting societal risk information
Ian Lines 30 April 2009
Overview
• Definition of societal risk
• Objectives of societal risk framework
• Options considered for presenting societal risk
• Approaches currently being taken forward
• Examples
• Possible criteria/guidelines
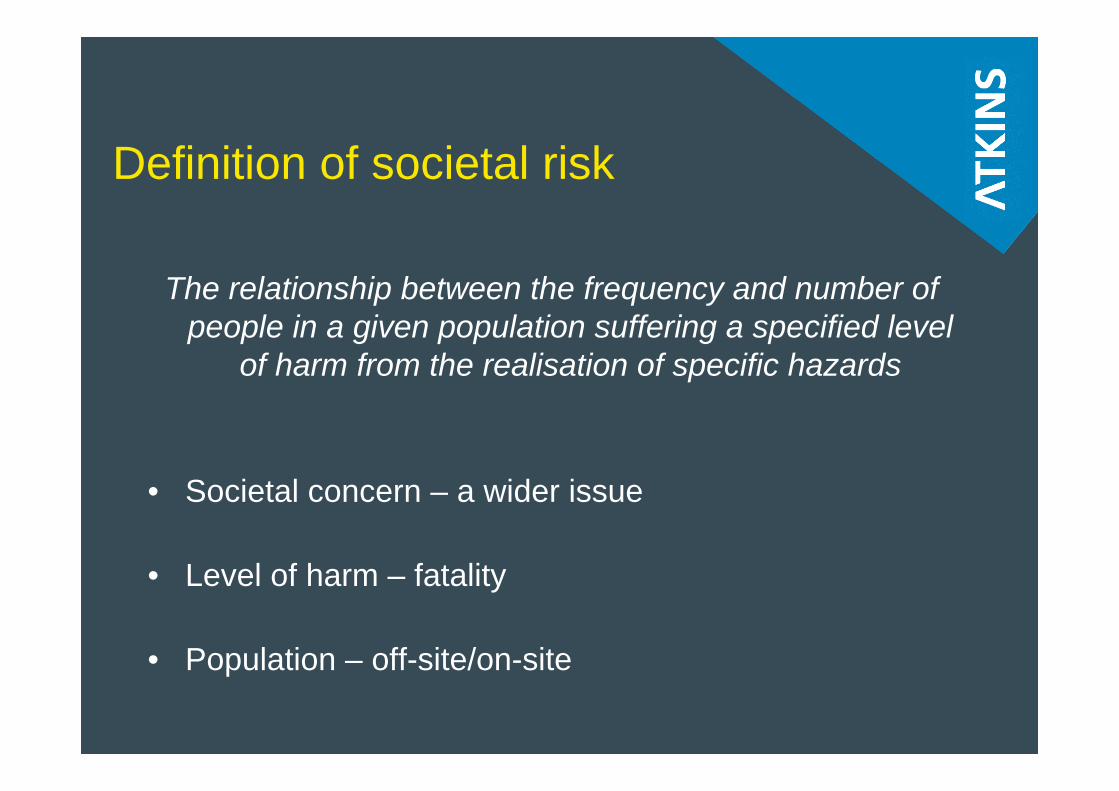
Definition of societal risk
The relationship between the frequency and number of people in a given population suffering a specified level
of harm from the realisation of specific hazards
• Societal concern – a wider issue
• Level of harm – fatality
• Population – off-site/on-site
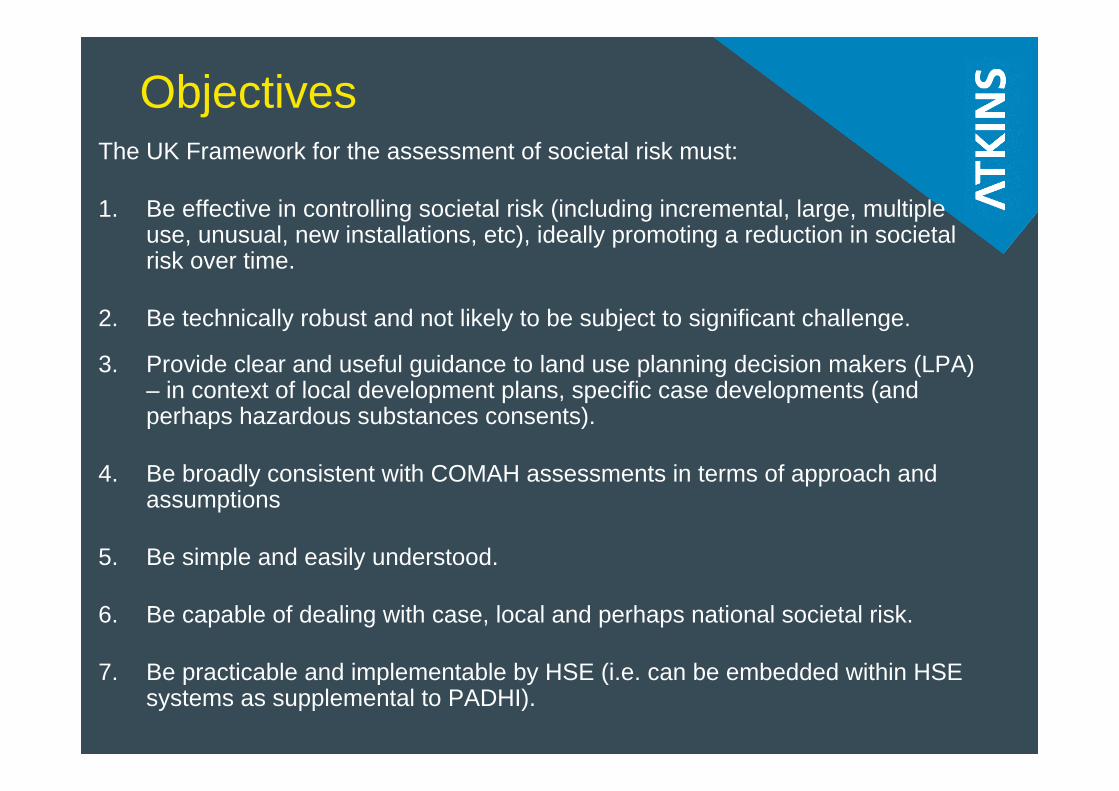
ObjectivesThe UK Framework for the assessment of societal risk must:
1. Be effective in controlling societal risk (including incremental, large, multiple use, unusual, new installations, etc), ideally promoting a reduction in societal risk over time.
2. Be technically robust and not likely to be subject to significant challenge.
3. Provide clear and useful guidance to land use planning decision makers (LPA) – in context of local development plans, specific case developments (and perhaps hazardous substances consents).
4. Be broadly consistent with COMAH assessments in terms of approach and assumptions
5. Be simple and easily understood.
6. Be capable of dealing with case, local and perhaps national societal risk.
7. Be practicable and implementable by HSE (i.e. can be embedded within HSE systems as supplemental to PADHI).
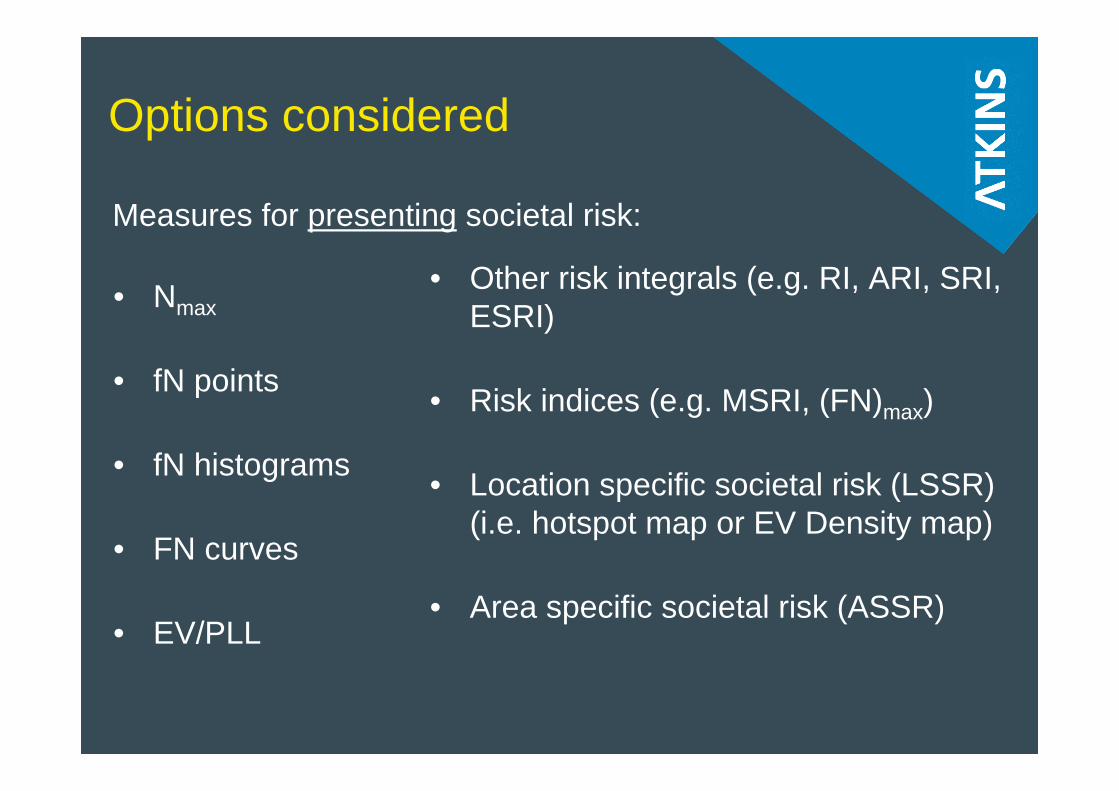
Options considered
• Nmax
• fN points
• fN histograms
• FN curves
• EV/PLL
Measures for presenting societal risk:
• Other risk integrals (e.g. RI, ARI, SRI, ESRI)
• Risk indices (e.g. MSRI, (FN)max)
• Location specific societal risk (LSSR) (i.e. hotspot map or EV Density map)
• Area specific societal risk (ASSR)
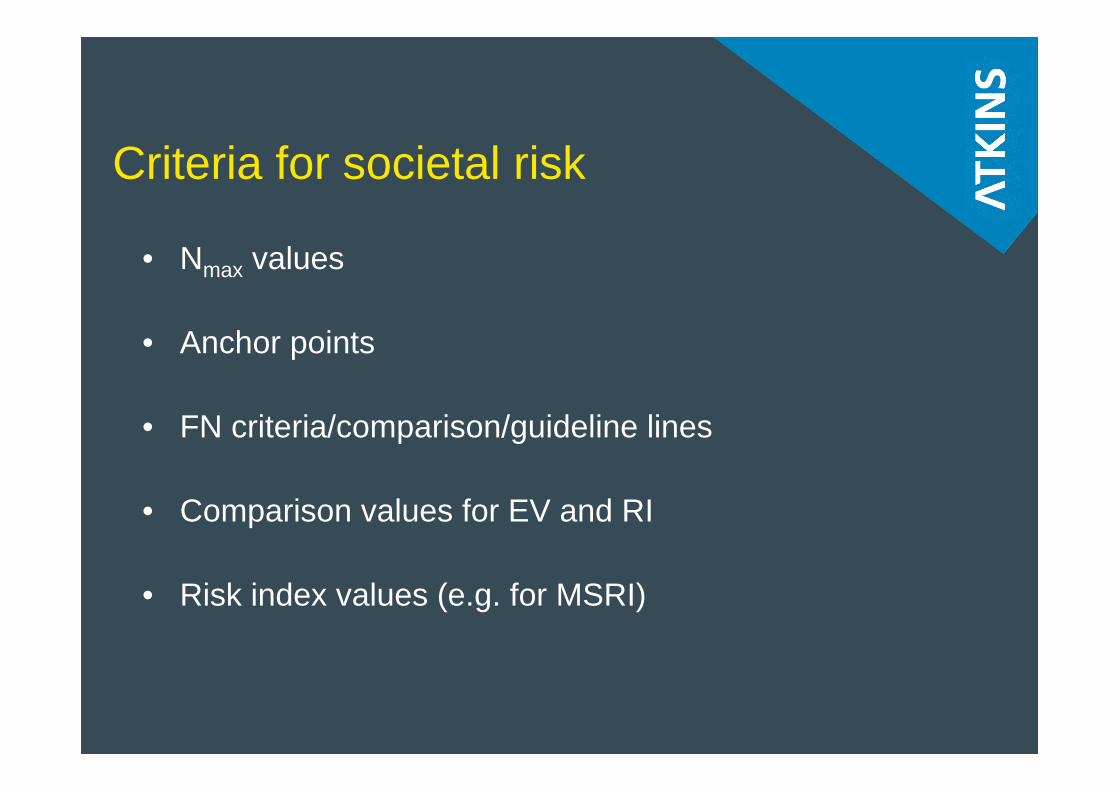
Criteria for societal risk
• Nmax values
• Anchor points
• FN criteria/comparison/guideline lines
• Comparison values for EV and RI
• Risk index values (e.g. for MSRI)
Approaches being taken forward
1. Classical approach• FN curve, EV, Nmax• No scale aversion in calculations
2. Scale averse approach• FN curve, RIs• Explicit scale aversion
3. Map based approach• EV density, area specific societal risk• Various map based approaches
Examples
Classical approach• FN curve (illustrates EV and Nmax)
Scale averse approach• FN curve
Map based approaches• Expectation Value Density (EVD) plot• Area specific societal risk: e.g. Total EV plot
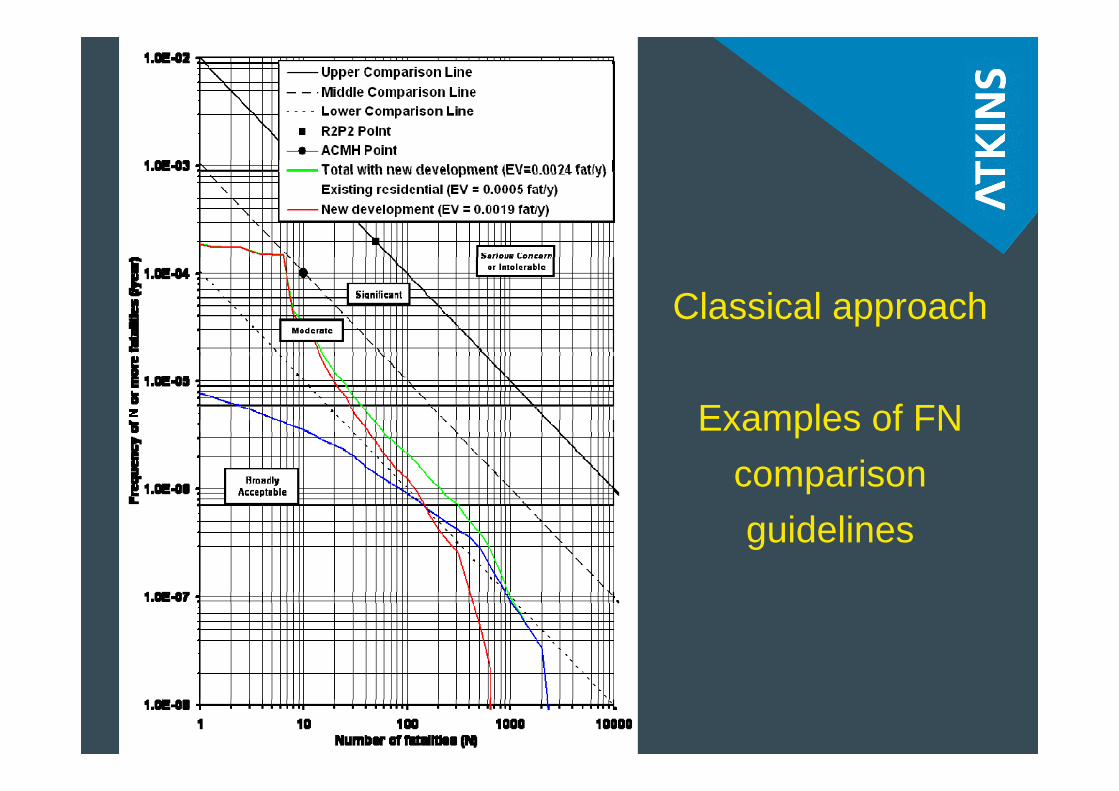
Classical approach
Examples of FN comparison guidelines
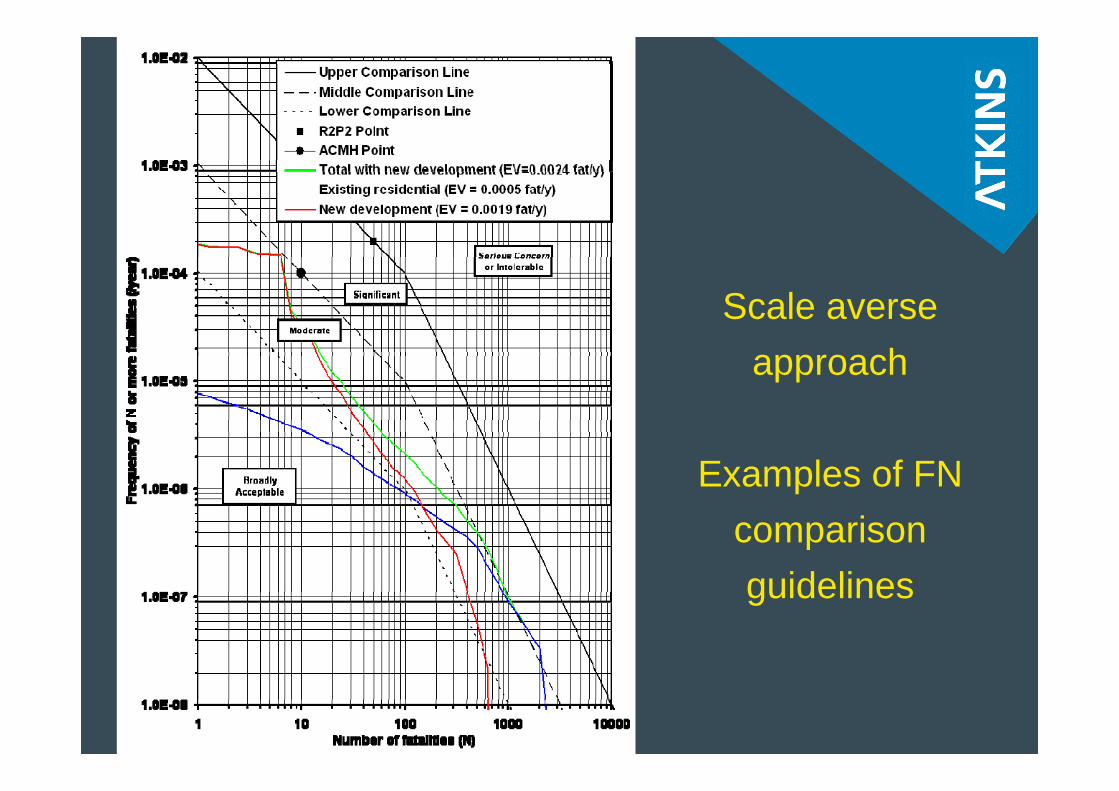
Scale averse approach
Examples of FN comparison guidelines
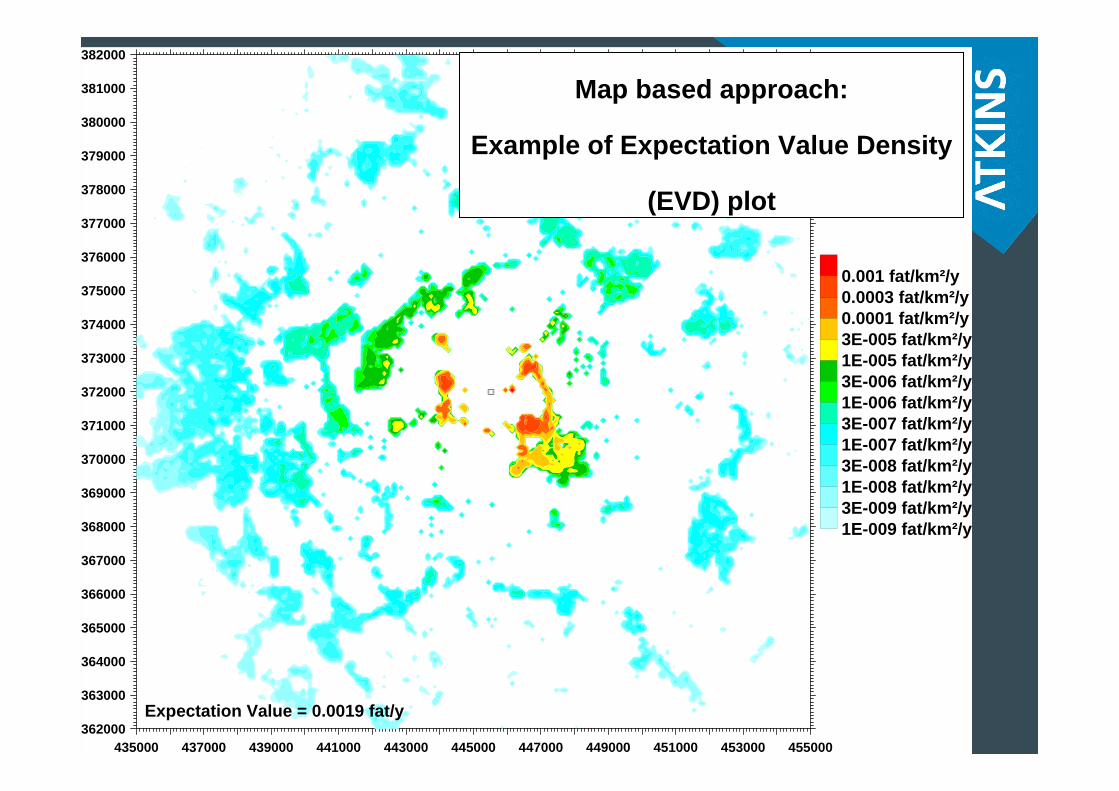
435000 437000 439000 441000 443000 445000 447000 449000 451000 453000 455000362000
363000
364000
365000
366000
367000
368000
369000
370000
371000
372000
373000
374000
375000
376000
377000
378000
379000
380000
381000
382000
1E-009 fat/km²/y3E-009 fat/km²/y1E-008 fat/km²/y3E-008 fat/km²/y1E-007 fat/km²/y3E-007 fat/km²/y1E-006 fat/km²/y3E-006 fat/km²/y1E-005 fat/km²/y3E-005 fat/km²/y0.0001 fat/km²/y0.0003 fat/km²/y0.001 fat/km²/y
Expectation Value = 0.0019 fat/y
Map based approach:
Example of Expectation Value Density
(EVD) plot
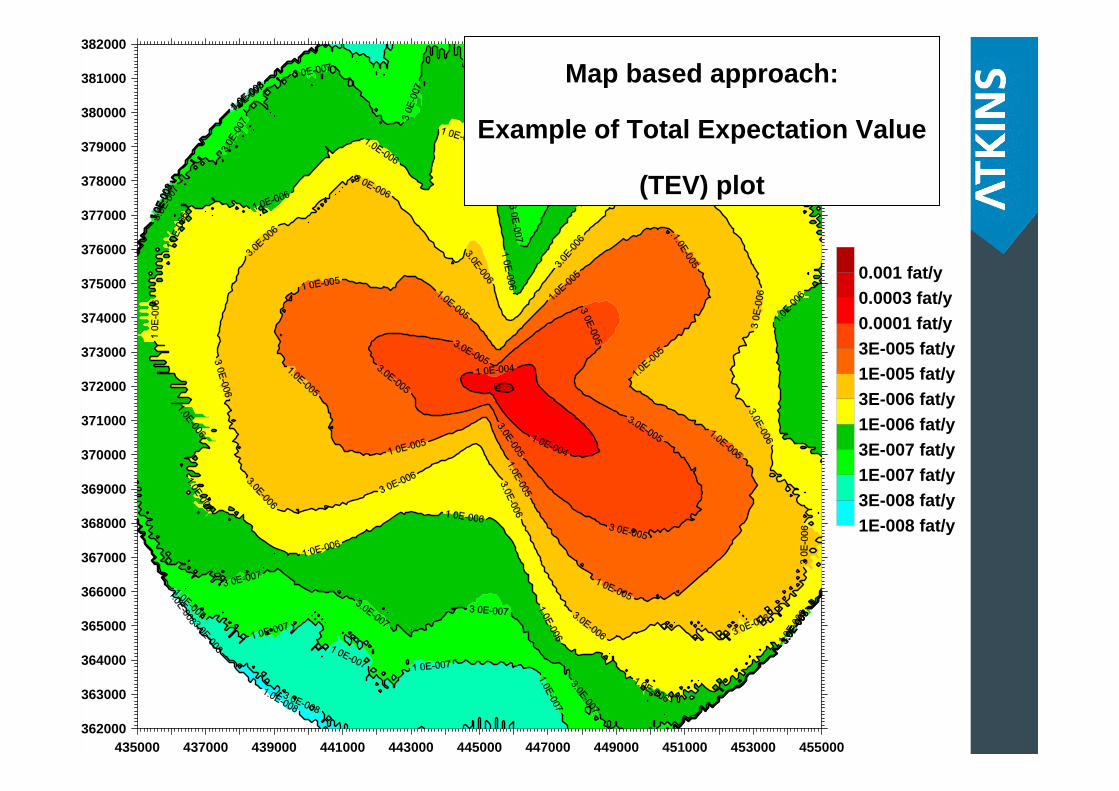
435000 437000 439000 441000 443000 445000 447000 449000 451000 453000 455000362000
363000
364000
365000
366000
367000
368000
369000
370000
371000
372000
373000
374000
375000
376000
377000
378000
379000
380000
381000
382000
1E-008 fat/y3E-008 fat/y1E-007 fat/y3E-007 fat/y1E-006 fat/y3E-006 fat/y1E-005 fat/y3E-005 fat/y0.0001 fat/y0.0003 fat/y0.001 fat/y
Map based approach:
Example of Total Expectation Value
(TEV) plot
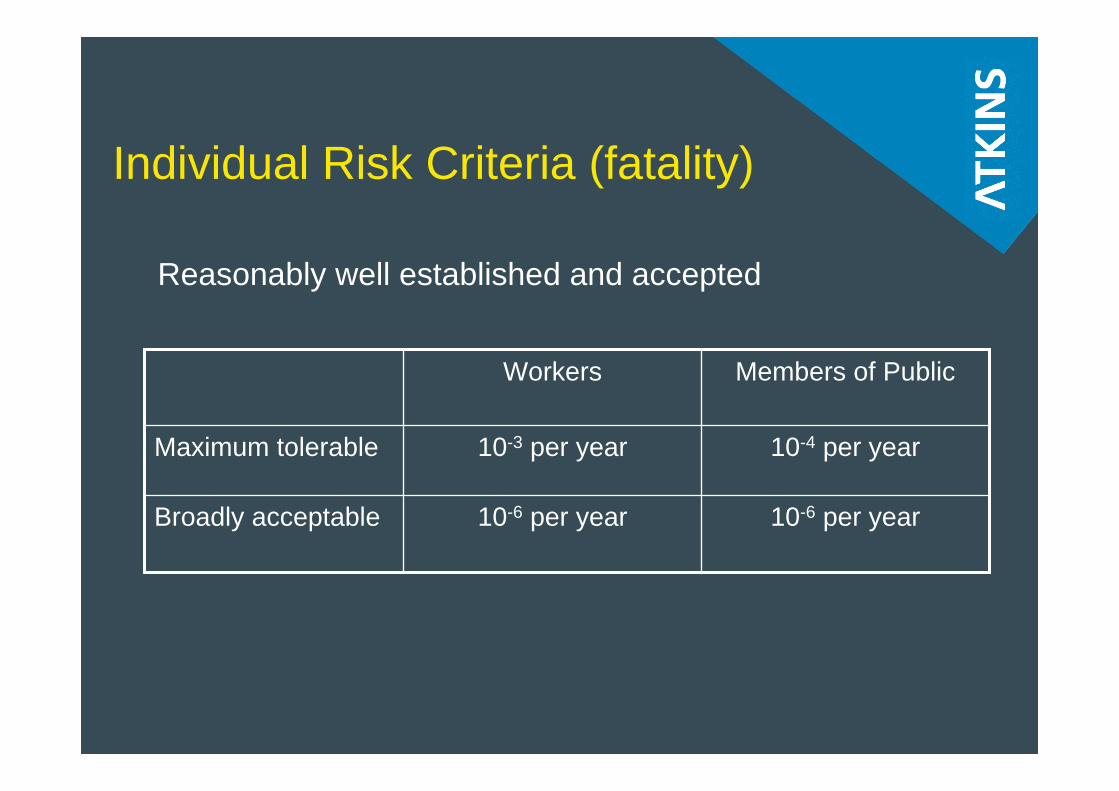
Individual Risk Criteria (fatality)
10-6 per year10-6 per yearBroadly acceptable
10-4 per year10-3 per yearMaximum tolerable
Members of PublicWorkers
Reasonably well established and accepted
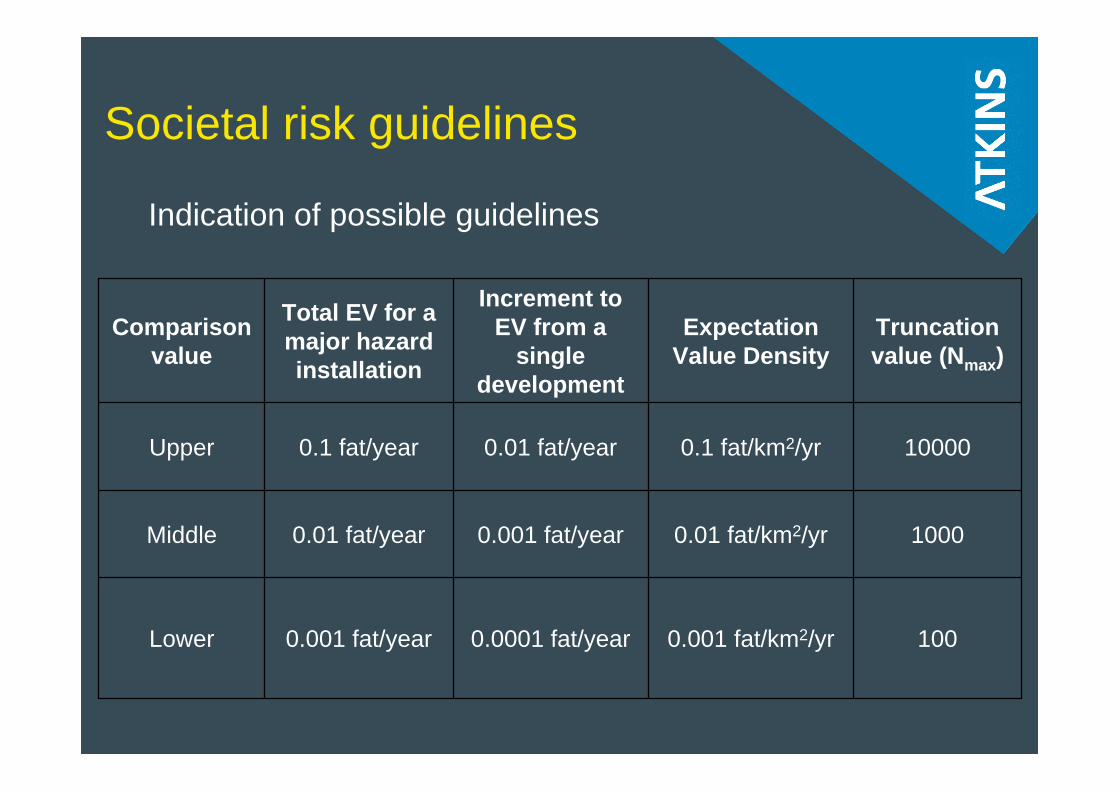
Societal risk guidelines
1000.001 fat/km2/yr0.0001 fat/year0.001 fat/yearLower
10000.01 fat/km2/yr0.001 fat/year0.01 fat/yearMiddle
100000.1 fat/km2/yr0.01 fat/year0.1 fat/yearUpper
Truncation value (Nmax)
Expectation Value Density
Increment to EV from a
single development
Total EV for a major hazard installation
Comparison value
Indication of possible guidelines
SummaryPresenting societal risk information• Definition of societal risk
• Objectives of societal risk framework
• Options considered for presenting societal risk
• Approaches being taken forward
• Examples
• Possible criteria/guidelines