Embed Size (px)
Citation preview

Technical Report:
Business Mobile Communications Usage and Impact Survey
Prepared for The CIE, on behalf of the Australian Communications and Media Authority (ACMA)
October 2013

The ACMA Annual Consumer Survey March 2013
Table of Contents
1. Background and Research Purpose..............................................................................................3
2. Research Design............................................................................................................................4
3. Project Timing...............................................................................................................................8
4. Appendices................................................................................................................................... 9
1.
2

The ACMA Annual Consumer Survey March 2013
1. Background and Research Purpose
This report describes the technical aspects of a quantitative research study that was conducted for the CIE to provide an understanding of current take-up, use and attitudes regarding mobile broadband usage in the business sector in Australia. The data output was used as part of input-output table construction for the CGE modelling conducted by the CIE on behalf of the Australian Communications and Media Authority (the ACMA).
The study also assisted to assess the productivity improvements achieved by business through the use of mobile broadband.
The main areas of investigation included the following: Business characteristics, including employee numbers, sector and revenue information:
Business sector (ANZIC classification); No. of employees; Annual revenue; Estimated revenue growth over the last three years, and for the next three years.
The use of mobile broadband in the organisation: Total expenditure on telecommunications; Average spend on mobile enabled devices as a percentage of annual communications
spend; Past three years percentage change on mobile enabled device expenditure; Proportion of the employees with company provided mobile enabled device; Main uses for mobile devices within the business;
Identification of productivity improvements from using mobile broadband; Views regarding the impact of mobile broadband in reducing costs for the business; Views regarding the impact of mobile broadband in saving time for employees; Whether the use of mobile broadband is seen to have increased sales, improved the
quality of the service delivery of the business, and whether it has allowed access to new markets and/or suppliers;
Other impacts on productivity and the way the business operates; Estimates regarding the impacts of mobile broadband over the next five years, and
reasons for that opinion; Positioning of mobile broadband within the top 3 factors that impact improvements in
productivity.
The full questionnaire is appended to this document, and data sets were provided under separate cover.
3
The ACMA Annual Consumer Survey March 2013
2. Research Design
2.1 Respondent DefinitionThe respondent was defined as the senior person within the business who could provide an idea of expenditure on telecommunications and on mobile communications, as well as estimates of how the use of mobile communications and mobile internet by staff has impacted on the business. For small and medium businesses, the respondent was generally the owner or the general manager, whereas for the larger businesses, the respondent was the Chief Operating Officer, Chief Financial Officer, Telecommunications or IT Director, or other decision maker who could provide the level of information required.
2.2 Capturing a Representative Sample of Landline-only, Landline and Mobile, and Mobile-only Businesses
Interviewing using CATI vs. Online MethodsCATI (computer assisted telephone interviewing) offered the most representative and accurate means of reaching business enterprises, and this was used for the majority of the study. It was the most inclusive method of accessing decision makers from a wide spread of industry types and sizes. Other methods (such as online panels which are ‘opt-in’ and self-completion) did not offer the absolute coverage required for the business segment.
Sampling via Random Digit Dialing vs. Electronic ListingsIn mainstream consumer interviewing using CATI, landline numbers are generally accessed via random digit dialing (RDD) to ensure representativeness of both listed and unlisted numbers. This is important in the consumer market, because those with unlisted numbers may have different attitudes to technology, and different needs to those who have listed numbers.
However, this method was not practicable within the business market, as any phone numbers randomly generated would contain both residential and business numbers, with the business component a much smaller proportion. An extremely large number of calls would have needed to be made to get to a business within the definition.
Instead to better reach a representative sample of business respondents numbers were sourced randomly (within industry) from the Electronic Yellow and White Pages business listings. Unlike the consumer market where there is quite a large segment of households with unlisted numbers, the vast majority of businesses have listed numbers, and therefore random selection in this manner provided the most representative coverage.
Quotas were applied on size of business, by area, and using the ANZIC codes as outlined further below, and there was accurate random sampling within those with a landline number only listed, those with a mobile and a landline number listed, and those with a mobile number only listed.
4
The ACMA Annual Consumer Survey March 2013
Once contact was made with a business, the decision maker was identified, and an interview sought. If it was an inconvenient time for that person, appointments were made for a callback.
For the larger businesses only, where it was necessary to reach very senior level respondents, we offered the opportunity for the respondent to complete the study online, or through a mailed out hard copy. These high level respondents were also sent a letter (or email) from ACMA outlining the purpose of the study and encouraging participation. They were also offered a $100 incentive as a donation to a charity of their choice. Letters and emails are attached to this report.
2.3 Sample Size and Industry Distribution Total Sample Size The total sample size was n= 1007, which provided a robust representation of the business market. Following the submission of the main data set (n=1002) on the 22nd of September, a small number of extra interviews (n= 5) completed in hard copy were received from the large business respondents. These findings were added into the data, with the final data sets containing these results.
Upweighting the Large business segment to allow for detailed analysisThe large businesses (i.e. those with 200 plus employees) in Australia account for less than 1% of all businesses, which on a sample of n= 1,000 would result in only a subsample size of n= 10, and it was agreed to upweight the large business sample size to 4% of the sample, or n=40, with this proportion weighted back to the accurate proportion for the total sample. A total of 47 interviews with larger businesses were achieved.
Industry RepresentationThe total sample was quota’d and structured by ANZSIC divisions and post weighted to ensure the sample accurately reflected the actual business population distribution using the latest ABS statistics.
Area RepresentationThe sample included metro, regional and rural/remote businesses as representative across industry types and states.
2.4 Statistical Clearing HouseThe research design and questionnaire were cleared following amendments suggested by the Statistical Clearing House, the approval number was 02339 -- 01.
2.5 Questionnaire Design and Pilot TestingFollowing commissioning, Woolcott Research provided the CIE with a draft questionnaire for comment and adjustment prior to submitting to the Statistical Clearing House and piloting. Following input and
5

The ACMA Annual Consumer Survey March 2013
agreement a number of pilot interviews (n=30) were conducted spread across small, medium and large businesses, and some minor amendments made.
Results were reported back to the CIE and ACMA and the questionnaires finalised.
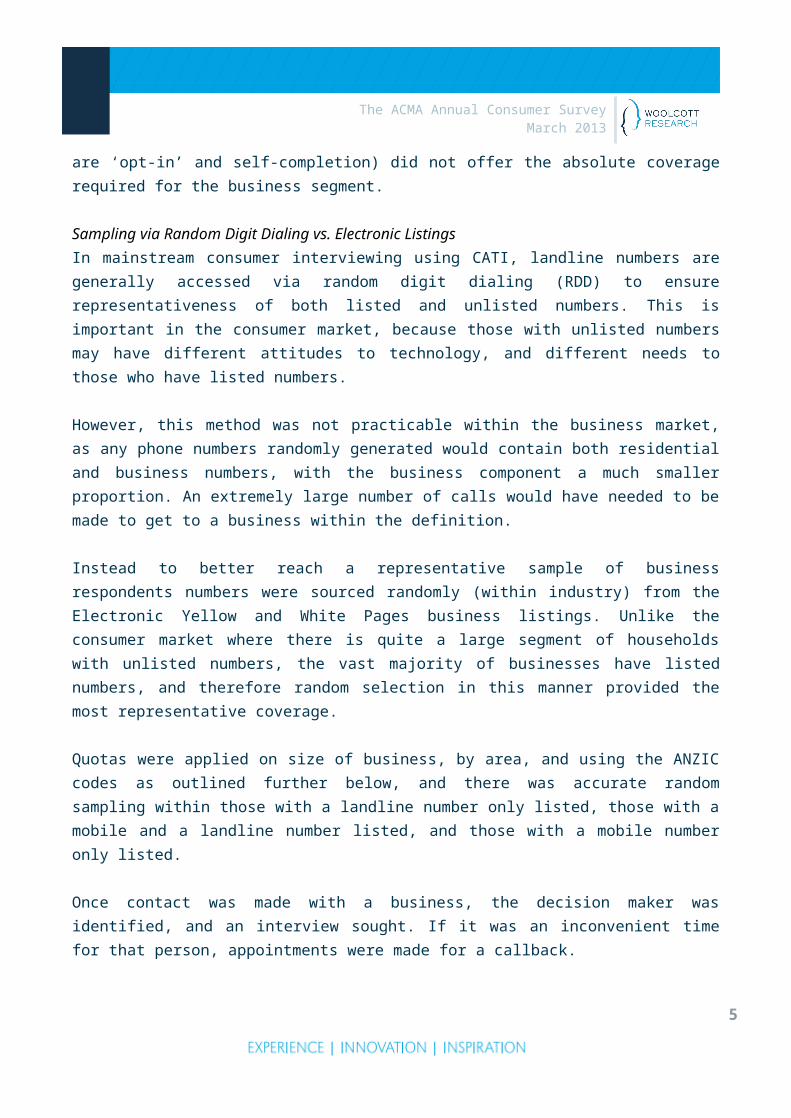
2.6 Quantitative FieldworkThe study consisted of a survey of n= 1007 businesses split by industry with proportions based on ABS Industry data. In total there were n= 860 respondents in the total ‘small’ sector (n= 534 businesses with 0-4 employees, and n= 326 businesses with 5-19 employees), n=100 in the ‘medium’ sector (20-199 employees), and n= 47 in the ‘large’ Sector (200 plus employees). The achieved industry numbers were post weighted slightly to adjust to exact ABS proportions, as indicated below.
Industry Achieved Sample Weighted Sample
Agriculture 69 69
Mining 8 5
Manufacturing 62 60
Electricity Gas, Water and Waste 5 3
Construction 147 163
Wholesale trade 52 50
Retail Trade 100 97
Accommodation/Cafés/Restaurants 72 72
Transport Postal and Warehousing 51 49
Information Media and Telecommunications 10 8
Finance and Insurance 44 40
Rental, Hiring and Real Estate 41 39
Professional Scientific and Technical 131 135
Admin and Support Services 44 45
Public Admin and Safety 5 4
Education and Training 16 14
Health Care and Social Assistance 60 61
Arts and Recreation 11 11
Other* 79 76
Total 1007 1007
6
The ACMA Annual Consumer Survey March 2013
2.7 Response RateIn total, 13,988 connected calls were made, and of these 3,282 were estimated as in scope, as well as fitting with our industry and size quota needs. Whilst we sample by industry, we cannot sample specifically by industry size as this information is not contained in the business listings. As a result a relatively large number of connected screening calls have to be made to ascertain the size of business and to achieve the sample size required for medium and large businesses once the small business quota is filled. The screening response is generally provided at first contact level, such as the receptionist or similar, without having to bother more senior employees.
The resultant response rate and ability to achieve an interview with a respondent of the seniority and knowledge level required was 31%, which is within the level expected for a study such as this.
The use of quotas on industry type and size help to ensure that the response rate does not result in a significant bias which will impact on the representativeness of the results.
2.8 Analysis All data processing, including editing and analysis, was undertaken by the Woolcott Research internal data processing unit. Data was analysed using our NIPO and SPSS+ software, which allowed for the Landline and Mobile-only components to be fully integrated.
Analysis involved the production of cross-tabulations which allowed for the determination of differences by key agreed variables (industry, locations, size of business, incidence of mobile device usage, etc.). As mentioned, data was weighted to reflect the business population.
The data was provided to the CIE as required with data and variables clearly labeled.
2.9 Quality Standards and ProcessesAll CATI interviewing was conducted in house and on site which allowed for hands on and involved management and intervention as required by researchers. CATI interviewers were personally briefed, and monitored throughout the interviewing process, with validation on a minimum of 10% of work.
2.10 Data Processing Quality MeasuresWoolcott Research conducted all analysis and data processing in house and the quality procedures utilised for CATI or Online studies were applied as appropriate.
When the data was collected it underwent a number of steps to ensure data integrity and the quality of the results. An analyst was assigned to be in control of each project with a 2nd analyst used for data checks and to provide backup support if required. A separate coding expert was used to code all open-
7

The ACMA Annual Consumer Survey March 2013
enders, initially devising a frame based on the first fifty responses, adding to this as the coding proceeds.
Each step in data collation was documented. A checklist was used to ensure that each task is completed and that checks are made to ensure data validity.
3. Project Timing
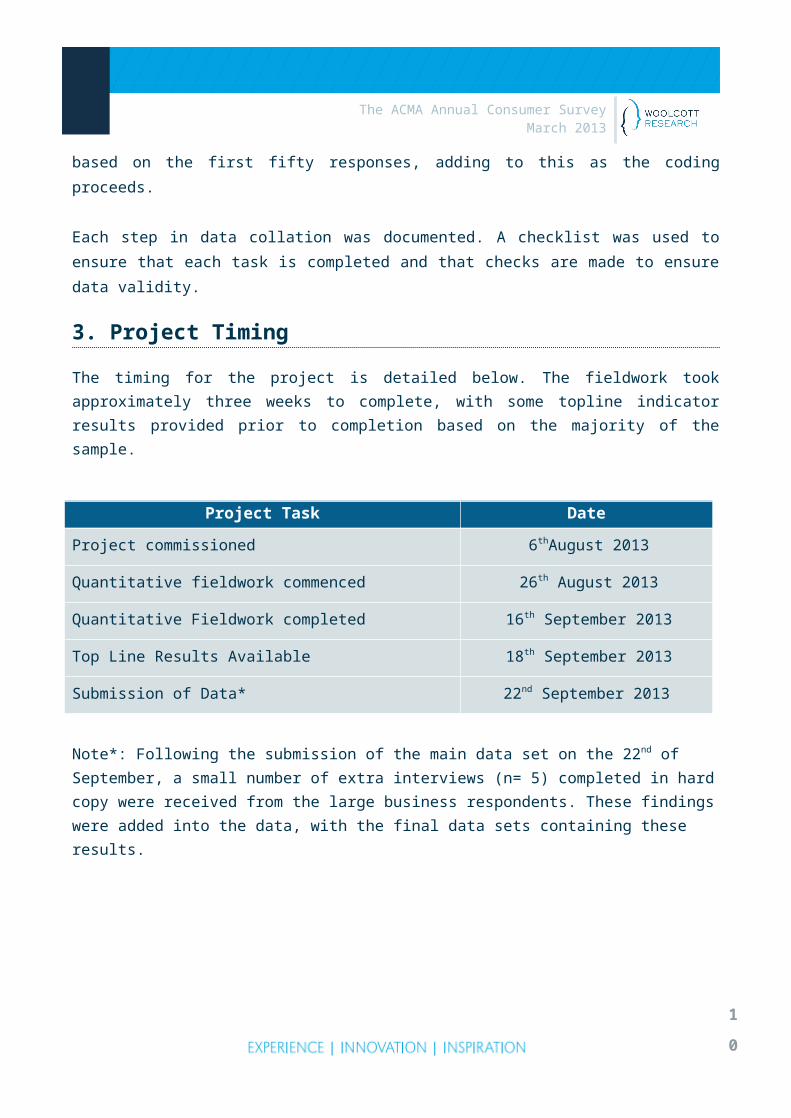
The timing for the project is detailed below. The fieldwork took approximately three weeks to complete, with some topline indicator results provided prior to completion based on the majority of the sample.
Project Task Date
Project commissioned 6thAugust 2013
Quantitative fieldwork commenced 26th August 2013
Quantitative Fieldwork completed 16th September 2013
Top Line Results Available 18th September 2013
Submission of Data* 22nd September 2013
Note*: Following the submission of the main data set on the 22nd of September, a small number of extra interviews (n= 5) completed in hard copy were received from the large business respondents. These findings were added into the data, with the final data sets containing these results.
8
The ACMA Annual Consumer Survey March 2013
4. Appendices
4.1 Questionnaire
Survey Introduction
"Good... my name is.... and I'm phoning from Woolcott Research, an independent market research company.
We have been commissioned by the Australian Government to conduct an important study about mobile communications usage within business, for the Australian Communications and Media Authority (ACMA). This relates only to your business operations in Australia.
Would you be willing to answer some questions for us? The survey will take about 7-8 minutes. Be assured that your answers will remain totally confidential and will simply be reported back to the ACMA in a general sense.
If you have any questions regarding the survey, please contact Dale Osborne or Liz Sparham at Woolcott Research on 02 9261 5221.
This survey has been approved by the Australian Government Statistical Clearing House. The approval number is 02339 -- 01. You may phone the Statistical Clearing House on (02) 6252 5285 to verify the approval number.
Firstly, I just need to ask some questions to check that your business fits into the criteria we are looking for. Would that be ok? Thank you
Business Particulars
Q1a. Firstly, including yourself how many Full Time Equivalent staff does your business employ on a permanent basis? DO NOT READ OUT
1. 1-42. 5-193. 20-1994. Over 200
PROGRAMMER: QUOTAS ON SIZE OF BUSINESS.
IF CODES 1-3 AT Q1a, ASK:Q1b. Could I speak to the owner or general manager of the business? INTERVIEWER NOTE: ASK TO SPEAK WITH OWNER/MANAGER AND MAKE APPOINTMENT FOR CALL BACK IF NECESSARY
1. Yes - CONTINUE2. No - TERMINATE
IF CODE 4 AT Q1a, ASK: 9
The ACMA Annual Consumer Survey March 2013
Q1c. Could I please speak with ………………….(the Chief Operating Officer) for this business? INTERVIEWER NOTE: COLLECT NAME AND DETAILS: MAKE APPOINTMENT IF NECESSARY
1. Yes - CONTINUE2. No – TERMINATE
Write in Title of Respondent………………………………………………………………………………………..
Q2a) What is the main industry in which your business/organisation operates? CHECK QUOTAS Agriculture, forestry and fishing 1 Mining 2
Manufacturing 3Electricity, gas, water and waste services 4Construction 5Wholesale trade 6Retail trade 7Accommodation and food services 8Transport, postal and warehousing 9Information media and telecommunications 10Financial and insurance services 11Rental, hiring and real estate services 12Professional, scientific and technical services 13Administrative and support services 14Public administration and safety 15Education and training 16Health care and social assistance 17Arts and recreational services 18Other services 19Unknown……………………………………………………………………………………………………….20
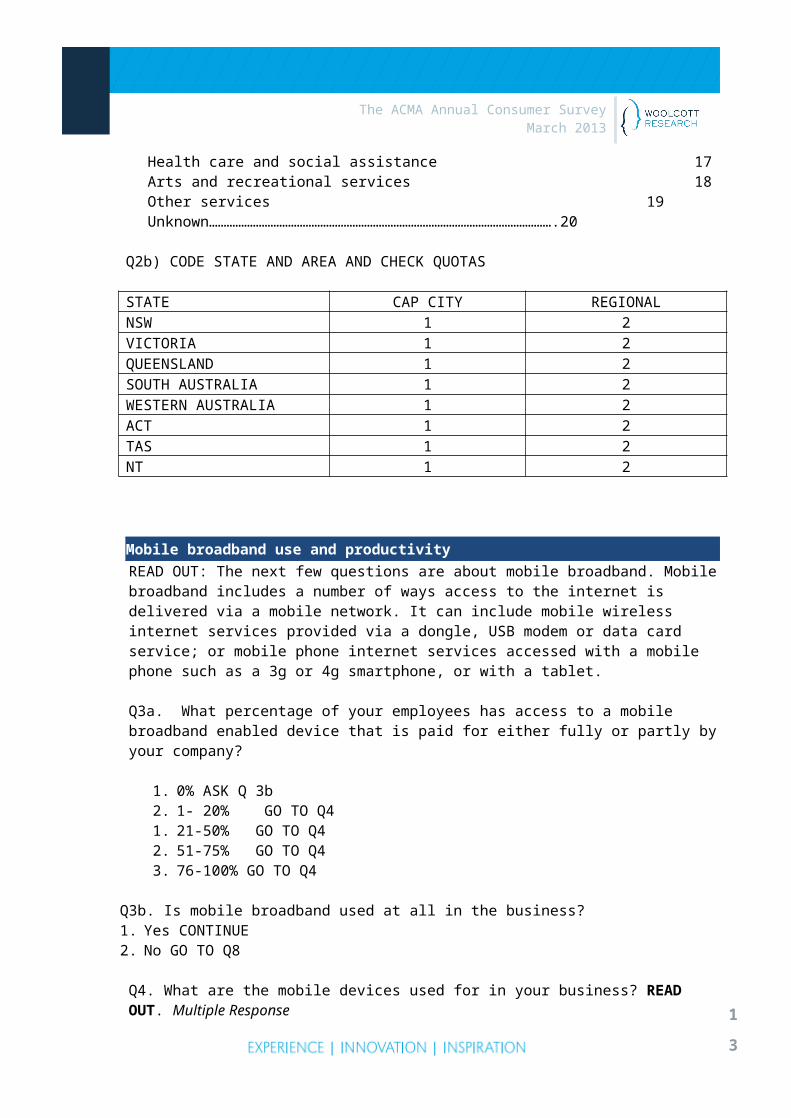
Q2b) CODE STATE AND AREA AND CHECK QUOTAS
STATE CAP CITY REGIONALNSW 1 2VICTORIA 1 2QUEENSLAND 1 2SOUTH AUSTRALIA 1 2WESTERN AUSTRALIA 1 2ACT 1 2TAS 1 2NT 1 2
Mobile broadband use and productivityREAD OUT: The next few questions are about mobile broadband. Mobile broadband includes a number of ways access to the internet is delivered via a mobile network. It can include mobile wireless internet services provided via a dongle, USB modem or data card service; or mobile

The ACMA Annual Consumer Survey March 2013
phone internet services accessed with a mobile phone such as a 3g or 4g smartphone, or with a tablet.
Q3a. What percentage of your employees has access to a mobile broadband enabled device that is paid for either fully or partly by your company?
1. 0% ASK Q 3b2. 1- 20% GO TO Q41. 21-50% GO TO Q42. 51-75% GO TO Q43. 76-100% GO TO Q4
Q3b. Is mobile broadband used at all in the business?1. Yes CONTINUE2. No GO TO Q8
Q4. What are the mobile devices used for in your business? READ OUT. Multiple Response
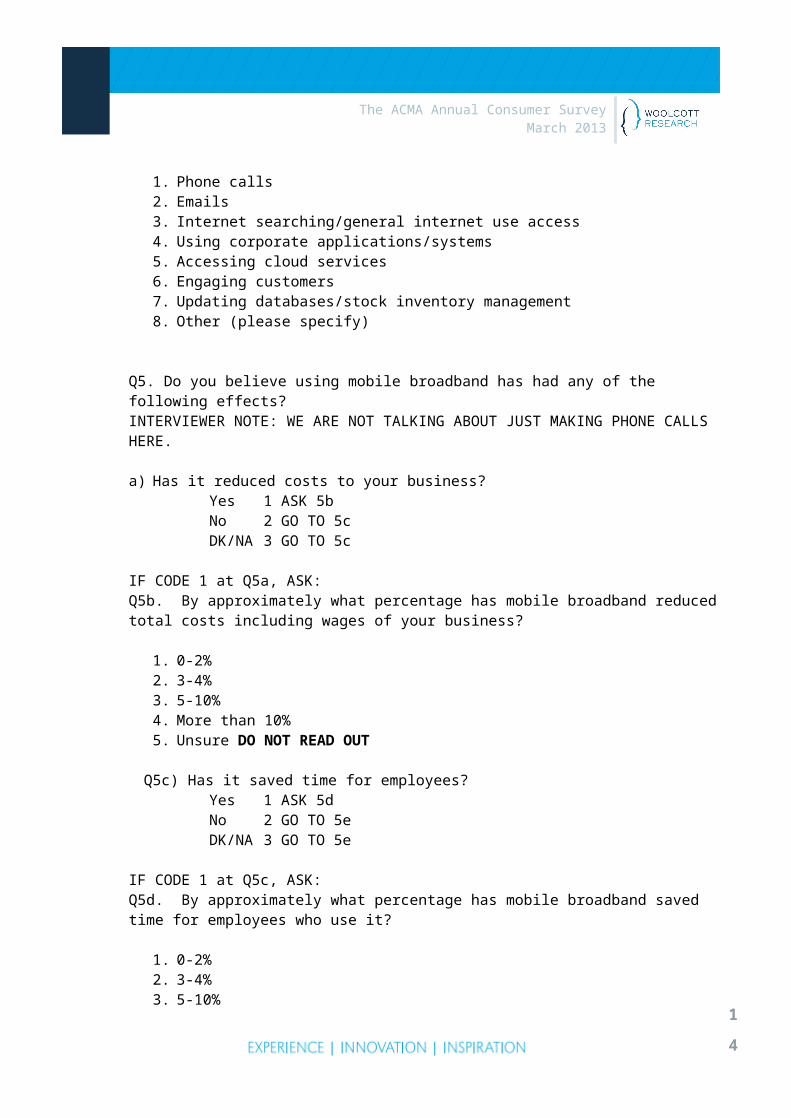
1. Phone calls2. Emails3. Internet searching/general internet use access4. Using corporate applications/systems5. Accessing cloud services6. Engaging customers7. Updating databases/stock inventory management8. Other (please specify)
Q5. Do you believe using mobile broadband has had any of the following effects?INTERVIEWER NOTE: WE ARE NOT TALKING ABOUT JUST MAKING PHONE CALLS HERE.
a) Has it reduced costs to your business?Yes 1 ASK 5bNo 2 GO TO 5cDK/NA 3 GO TO 5c
IF CODE 1 at Q5a, ASK:Q5b. By approximately what percentage has mobile broadband reduced total costs including wages of your business?
1. 0-2%2. 3-4%3. 5-10%4. More than 10%5. Unsure DO NOT READ OUT
Q5c) Has it saved time for employees?Yes 1 ASK 5d

The ACMA Annual Consumer Survey March 2013
No 2 GO TO 5eDK/NA 3 GO TO 5e
IF CODE 1 at Q5c, ASK:Q5d. By approximately what percentage has mobile broadband saved time for employees who use it?
1. 0-2%2. 3-4%3. 5-10%4. More than 10%5. Unsure DO NOT READ OUT
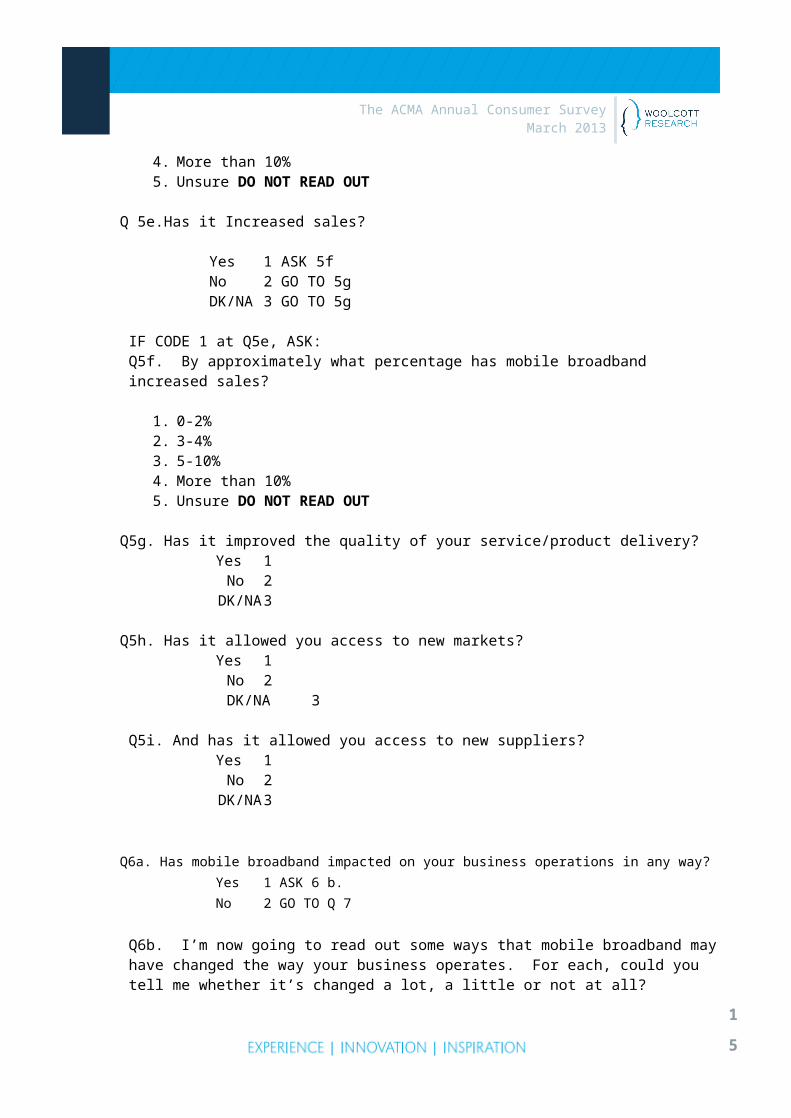
Q 5e.Has it Increased sales?
Yes 1 ASK 5fNo 2 GO TO 5gDK/NA 3 GO TO 5g
IF CODE 1 at Q5e, ASK:Q5f. By approximately what percentage has mobile broadband increased sales?
1. 0-2%2. 3-4%3. 5-10%4. More than 10%5. Unsure DO NOT READ OUT
Q5g. Has it improved the quality of your service/product delivery? Yes 1
No 2 DK/NA 3
Q5h. Has it allowed you access to new markets?Yes 1
No 2 DK/NA 3
Q5i. And has it allowed you access to new suppliers?Yes 1
No 2 DK/NA 3
Q6a. Has mobile broadband impacted on your business operations in any way?Yes 1 ASK 6 b.No 2 GO TO Q 7
The ACMA Annual Consumer Survey March 2013
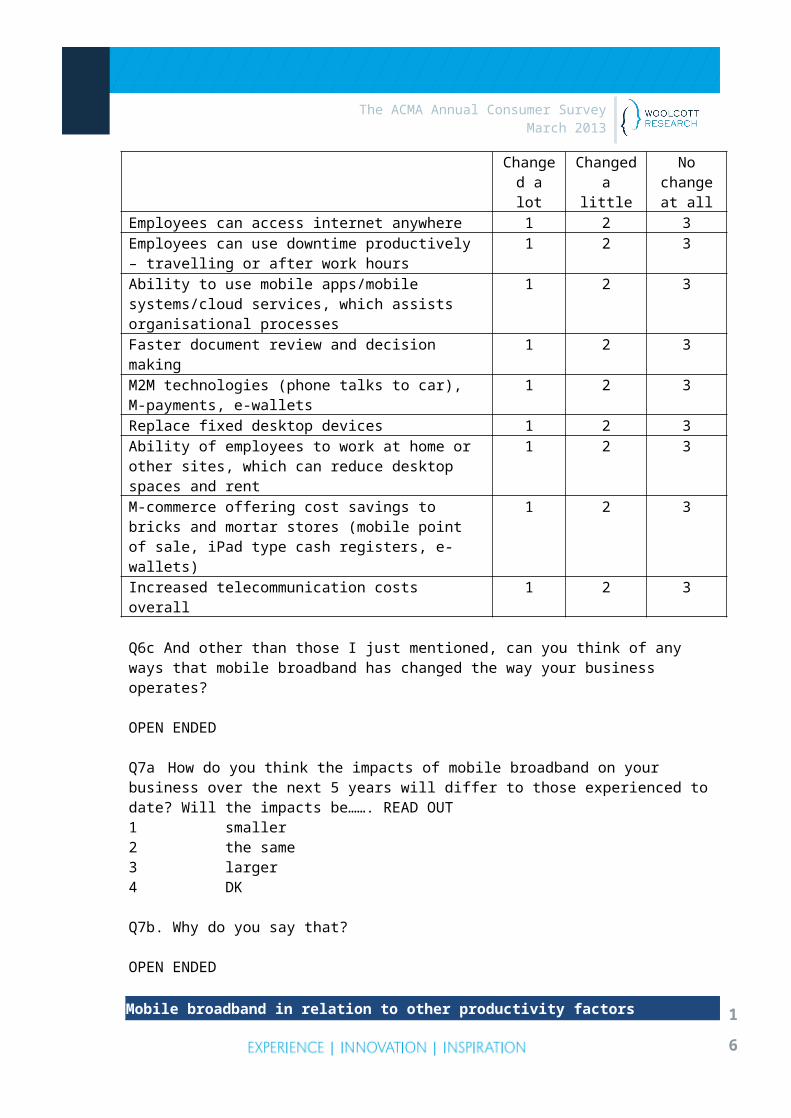
Q6b. I’m now going to read out some ways that mobile broadband may have changed the way your business operates. For each, could you tell me whether it’s changed a lot, a little or not at all?
Changed a lot
Changed a little
No change at all
Employees can access internet anywhere 1 2 3Employees can use downtime productively – travelling or after work hours
1 2 3
Ability to use mobile apps/mobile systems/cloud services, which assists organisational processes
1 2 3
Faster document review and decision making 1 2 3M2M technologies (phone talks to car), M-payments, e-wallets
1 2 3
Replace fixed desktop devices 1 2 3Ability of employees to work at home or other sites, which can reduce desktop spaces and rent
1 2 3
M-commerce offering cost savings to bricks and mortar stores (mobile point of sale, iPad type cash registers, e-wallets)
1 2 3
Increased telecommunication costs overall 1 2 3
Q6c And other than those I just mentioned, can you think of any ways that mobile broadband has changed the way your business operates?
OPEN ENDED
Q7a How do you think the impacts of mobile broadband on your business over the next 5 years will differ to those experienced to date? Will the impacts be……. READ OUT1 smaller2 the same3 larger4 DK
Q7b. Why do you say that?
OPEN ENDED
Mobile broadband in relation to other productivity factorsALL RESPONDENTSQ8. What are the top 3 factors that are the most important for your company to improve productivity? READ OUT ROTATE PROGRAMMER NOTE – ALLOW NO MORE THAN 3 CHOICES, INCLUDING OTHERS MENTIONED OUTSIDE OF THE LIST.
1. Skill development of employees2. More efficient tax system3. Less government regulation4. Investing in IT systems5. Improving internal systems and processes
The ACMA Annual Consumer Survey March 2013
6. Investing in mobile broadband7. Investing in machinery, other capital equipment8. Other (please specify)
Mobile broadband spend
Q9. What is your total annual expenditure on telecommunications, such as phones, internet and mobile internet? WRITE IN AMOUNT OR PROMPT WITH BAND AND CODE
a) 0-4 employees b) 5-19 employees c) 20-199 employees d) 200+ employees
Less than $1,000 1$1,100 - $2,000 2 $2,100 - $5,000 3 $5,100 - $10,000 4 Over $10,000 5
Amount.…………………
Less than $5,000 1 $5,100 - $10,000 2$10,100 - $25,000 3$25,100 -$50,000 4Over $50,000 5
Amount……………………………….
Less than $50,000 1$50,100 - $100,000 2 $100,100 - $200,000 3$200,100 - $500,000 4Over $500,000 5
Amount …………………………..
Less than $200,000 1$201,000 - $1million 2 $1.1million - $5million 3 $5million - $20million 4 Over $20million 5
Amount …………………………..
Q10. What is your total expenditure on mobile broadband devices as a share of your telecommunications spend?
1. 0% GO TO Q122. 1%-20%3. 21-40%4. 41-60%5. 61-80%6. 81-100%
Q11a. Has your expenditure on mobile broadband enabled devices changed over the past 3 years?
1. Yes changed – CONTINUE TO Q11b2. No has remained the same –GOTO Q12
Q11b. By approximately what percentage has it changed?
1. Decrease of more than 20%2. Decrease of 1 to 20%3. Increase of 0-10% 4. Increase of 11-20%5. Increase of 21%-30%6. Increase of 31%-50%7. Increase of 51%-100%8. Increase of over 100% (Write in)…………………………………
Revenue
The ACMA Annual Consumer Survey March 2013
I just have some final questions now, to ensure we have a good cross section of business. As a reminder, all details you provide are completely confidential and anonymous.
Q12. What is the annual revenue of your business (Say before tax if necessary)? WRITE IN AMOUNT OR CODE BAND
0-4 employees 5-19 employees 20-199 employees 200+ employees
0 – $100,000 1$101,000 - $200,000 2$201,000 - $500,000 3$501,000 - $1million 4Over $1million 5Amount.…………………
0 – $500,000 1$501,000 - $1million 2 $1.1million - $2.5million 3 $2.6million - $5million 4 Over $5million 5Amount.…………………
0 – $5million 1 $5.1million - $10million 2 $10.1million - $20million 3 $20.1million - $50million 4 over $50million 5Amount.…………………
0 – $20million 1 $20.1million- $100million 2 $100.1million- $500million 3 $500.1m - $2billion 4Over $2billion 5 Amount.…………………
Q13. What has been your level of revenue growth in percentage terms over the past three years? DO NOT READ
1. Decline in revenue2. No growth3. 1-5%4. 6-10%5. 11-20%6. More than 20%7. Refused/DK DO NOT READ OUT
Q14. What is your expected level of revenue growth in percentage terms over the next three years? DO NOT READ
1. Decline in revenue2. No growth3. 1-5%4. 6-10%5. 11-20%6. More than 20%7. Refused/DK DO NOT READ OUT
That’s the end of the survey. Thanks for your participation, it is really appreciated.
The ACMA Annual Consumer Survey March 2013
4.2 Letter to large organisations


![NIPO ODIN 5[1].11 CommandReference Rev20070123](https://img.pdfslide.us/doc/110x75/5461c760b1af9f86228b4baf/nipo-odin-5111-commandreference-rev20070123.jpg)