Embed Size (px)
Citation preview
Technical Report WRD92038
Viewed at 15:07:08 on 29/07/2010 Page 1 of 17.
\ ;;-
j
NUTRIENT, SUSPENDED SOLID AND METAL INPUTS, FROM POINT AND NON·POINT SOURCES, INTO DARWIN HARBOUR,
NOV. 1990· OCT. 1991
REPORT 38/92
1 f December 1992
S. A. Townsend Water Quality Research and Evaluation Section Water Resources DivIsion, Power and Water Authority. Darwin.
1
Technical Report WRD92038
Viewed at 15:07:08 on 29/07/2010 Page 2 of 17.
•
I J
This report shall not be copied except in full. Anyone quoting information or data from this report and using that information or data in any other document shall make proper written acknowledgment.
rA//o;;;~ '~T""" ••• x.~ .~~ ......... HOB.'_.O.o .~ •• •• ~~ ••••••••••
2
Technical Report WRD92038
Viewed at 15:07:08 on 29/07/2010 Page 3 of 17.
CONTENTS
1 l List of figures and tables ;
! Summary
1. Introduction
2. Darwin Harbour catchment and point source descriptions
3. Methods and calculations
4. Results
••• 5. Discussion
6. Conclusion
·
• i
· ;
t
I \
I I •
7. References
Figures
Tables
3
page 4
5
6
6
6
8
9
10
10
11
12
Technical Report WRD92038
Viewed at 15:07:08 on 29/07/2010 Page 4 of 17.
! i
Figure 1
Table 1
Table 2
• Table 3
Table 4
Table 5
LIST OF FIGURES
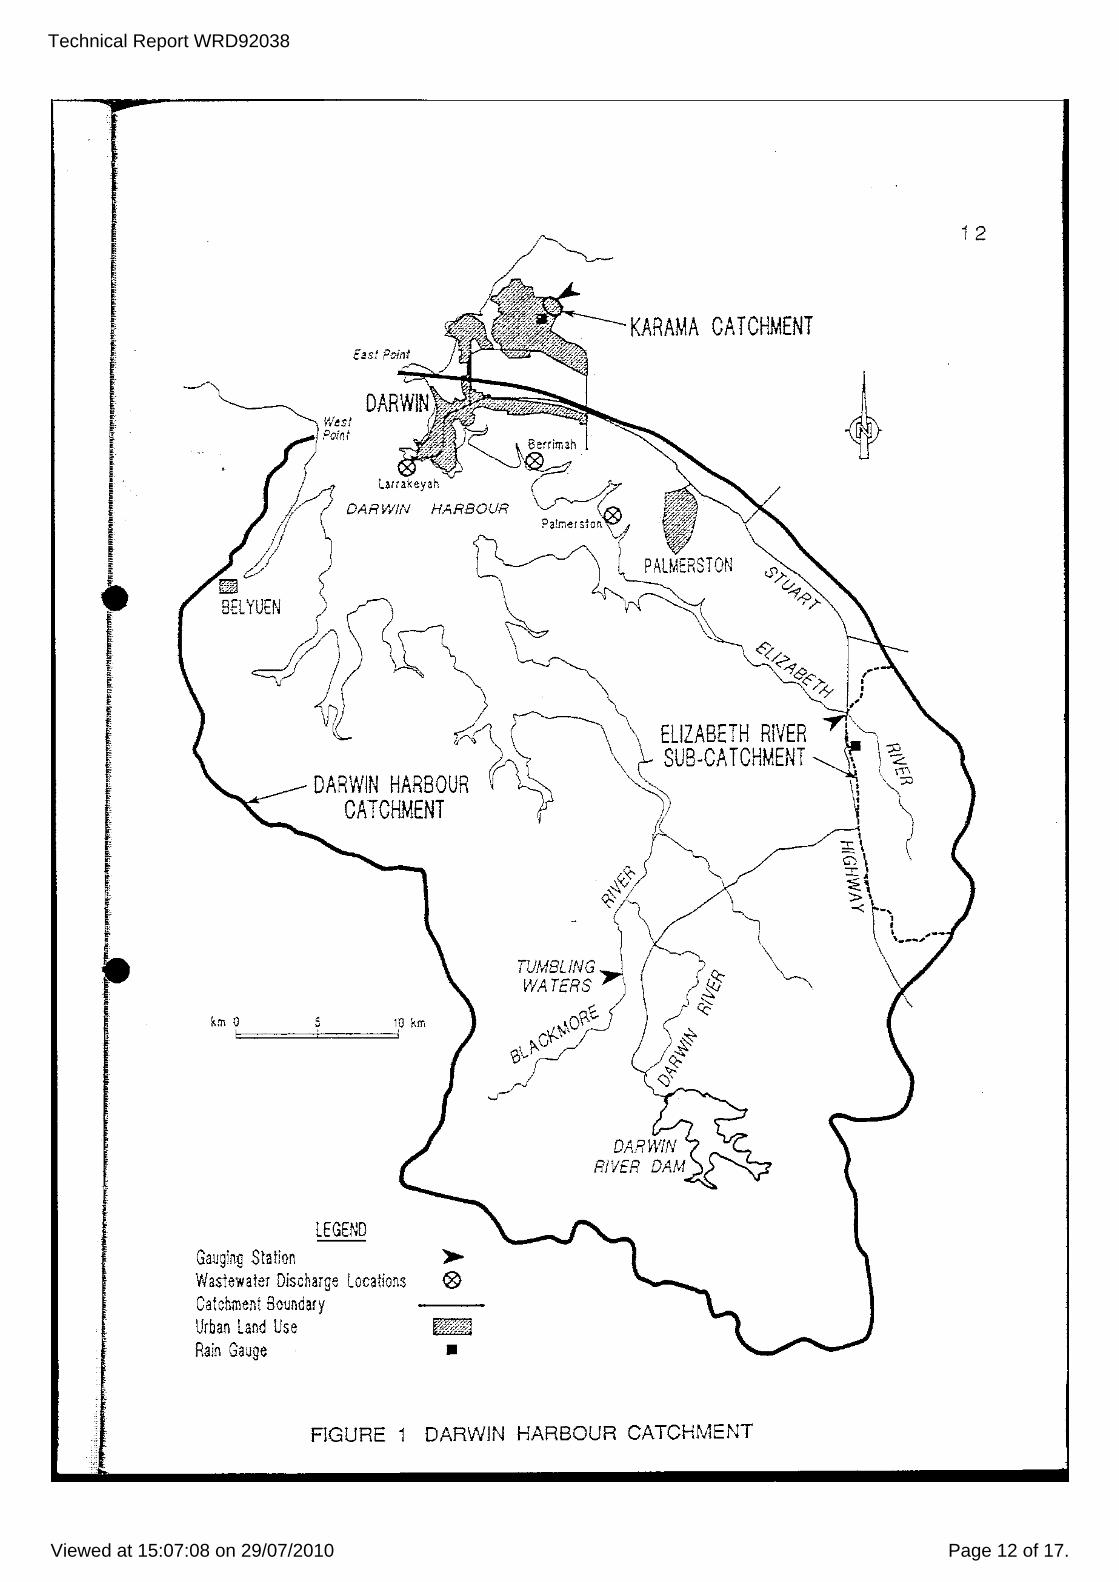
Darwin Harbour catchment
LIST OF TABLES
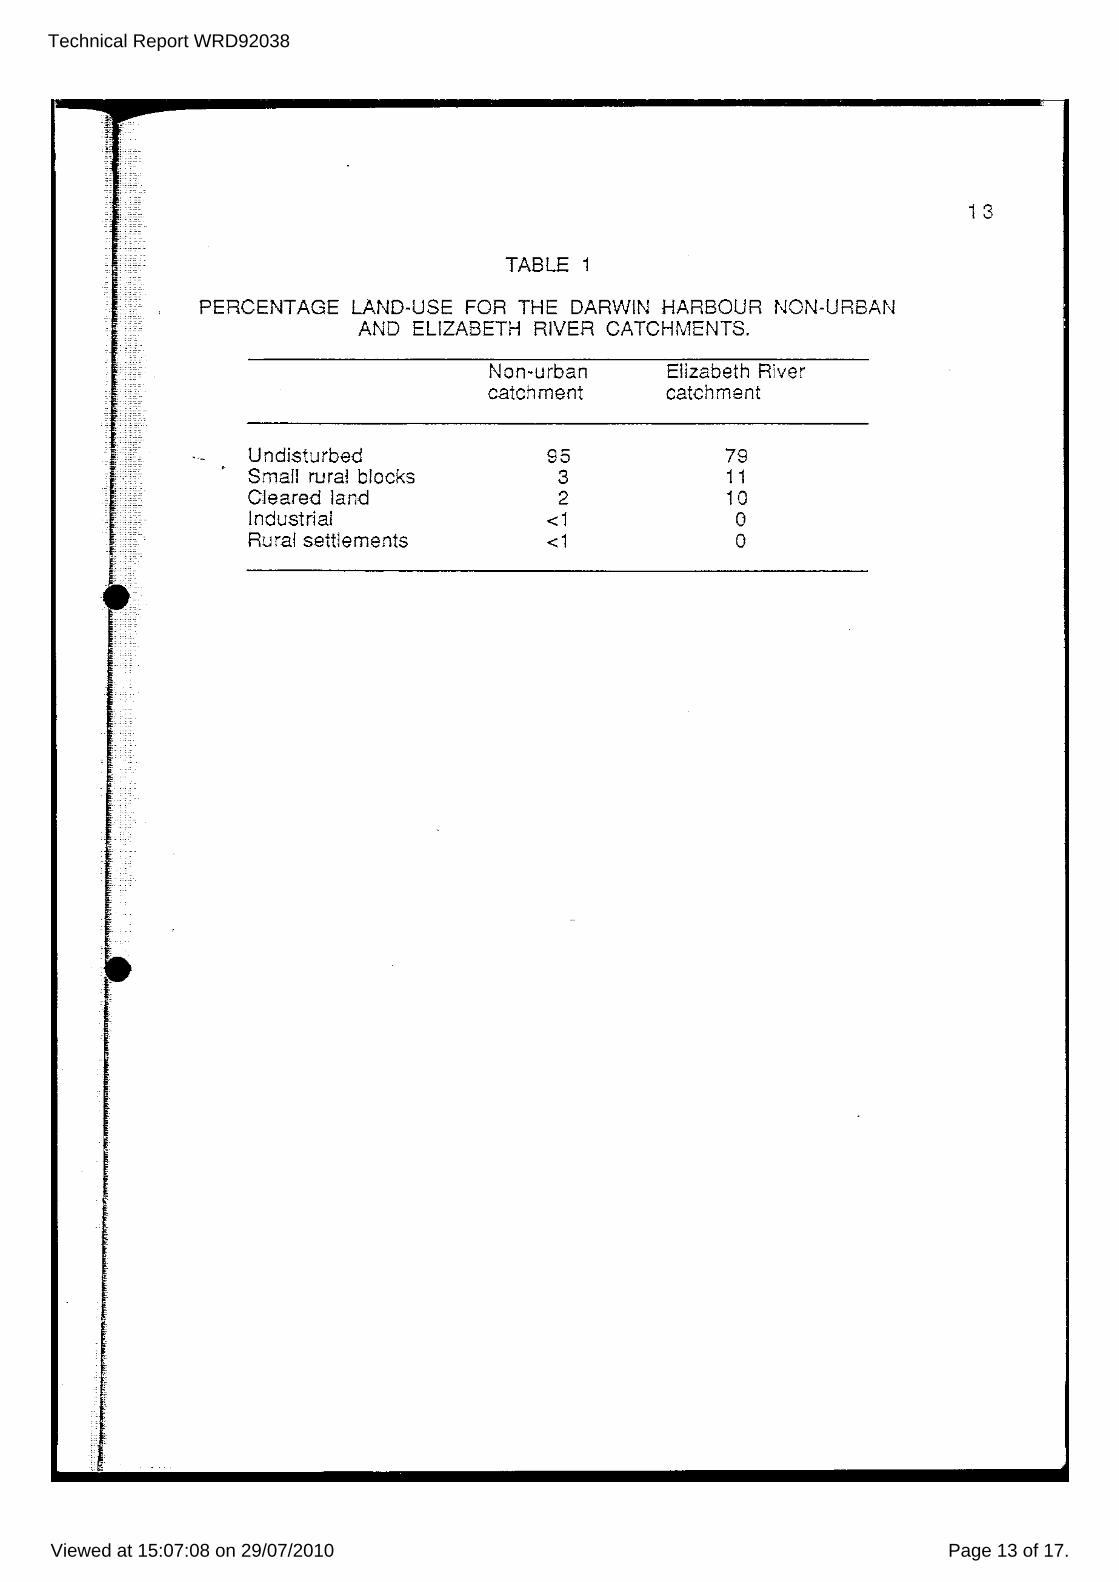
Percentage land-use for the Darwin Harbour non-urban and Elizabeth River catchments.
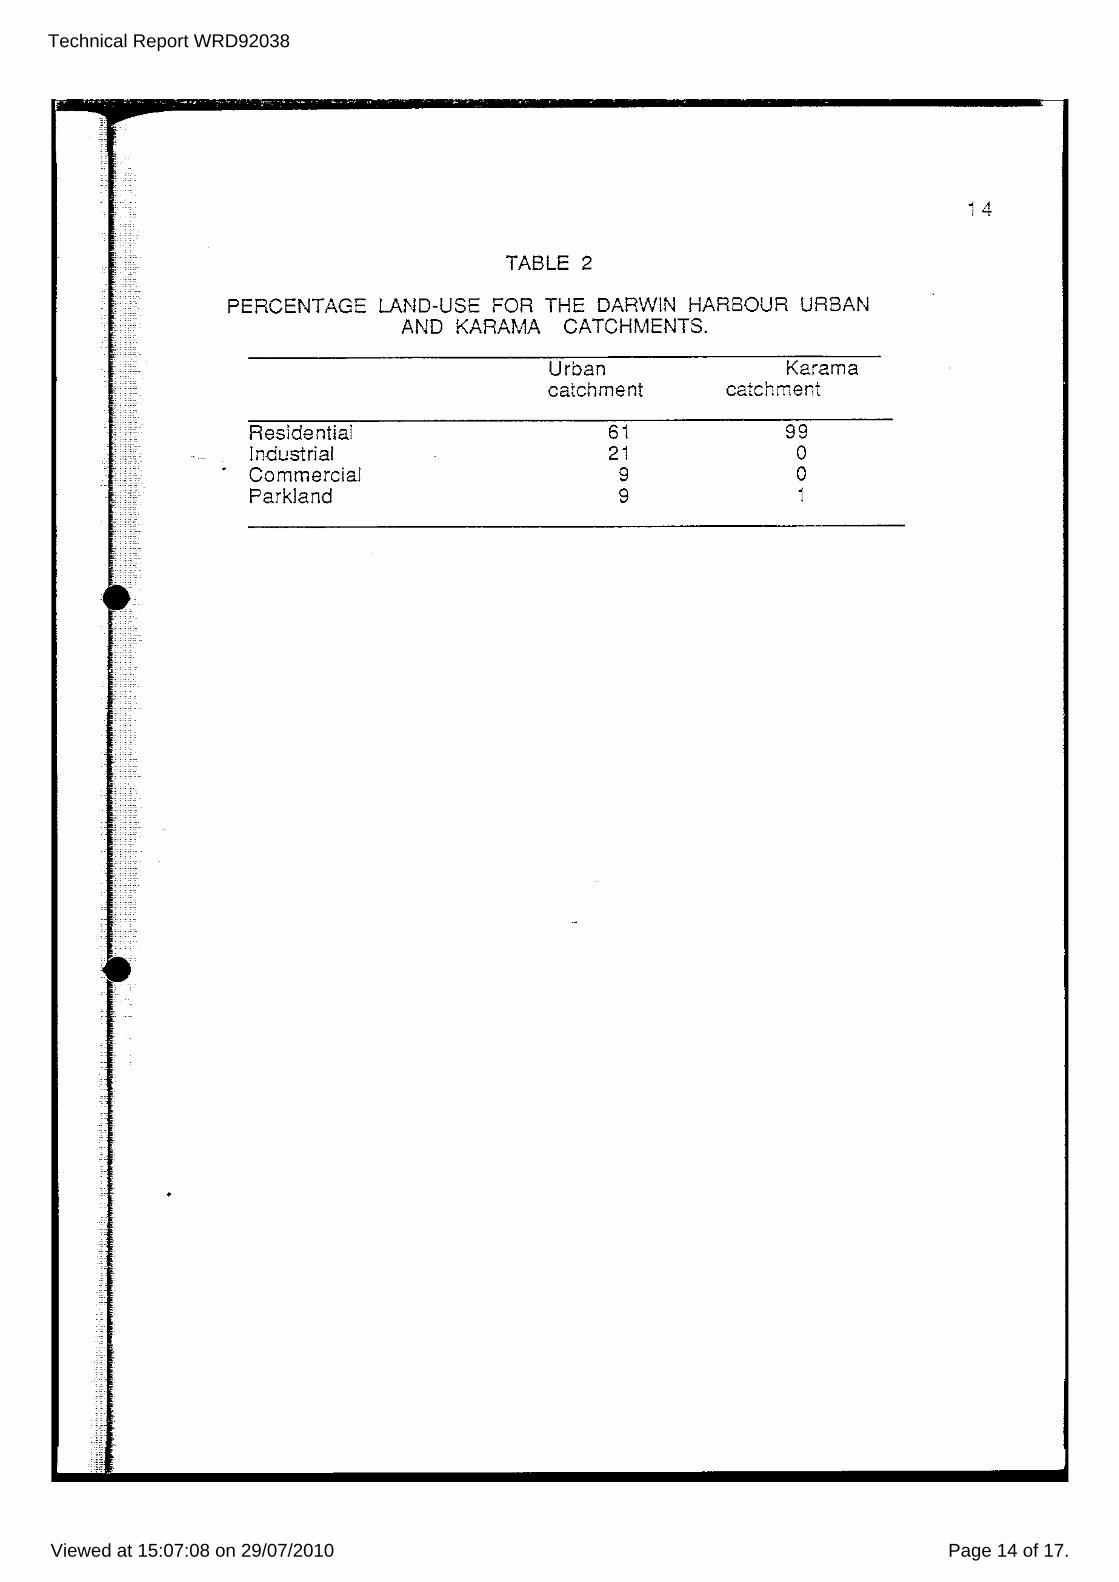
Percentage land-use for the Darwin Harbour urban and Karama catchments .
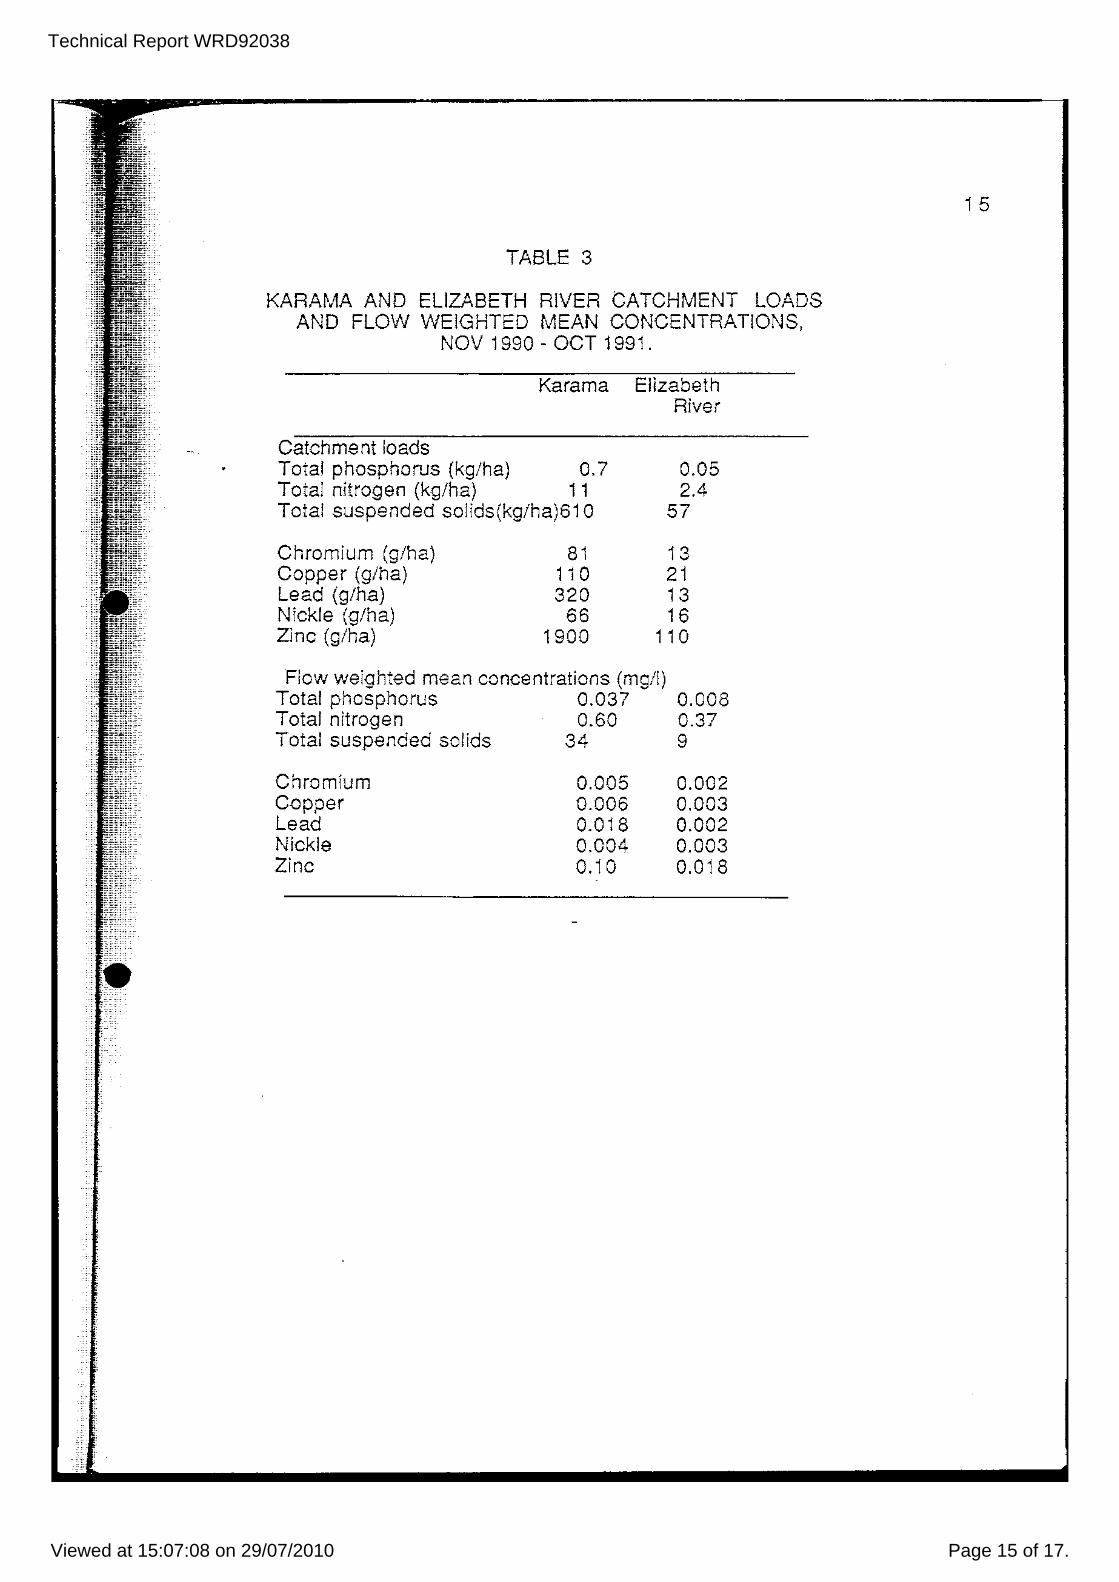
Karama and Elizabeth River catchment loads and flow weighted mean concentrations, Nov 1990 - Oct 1991.
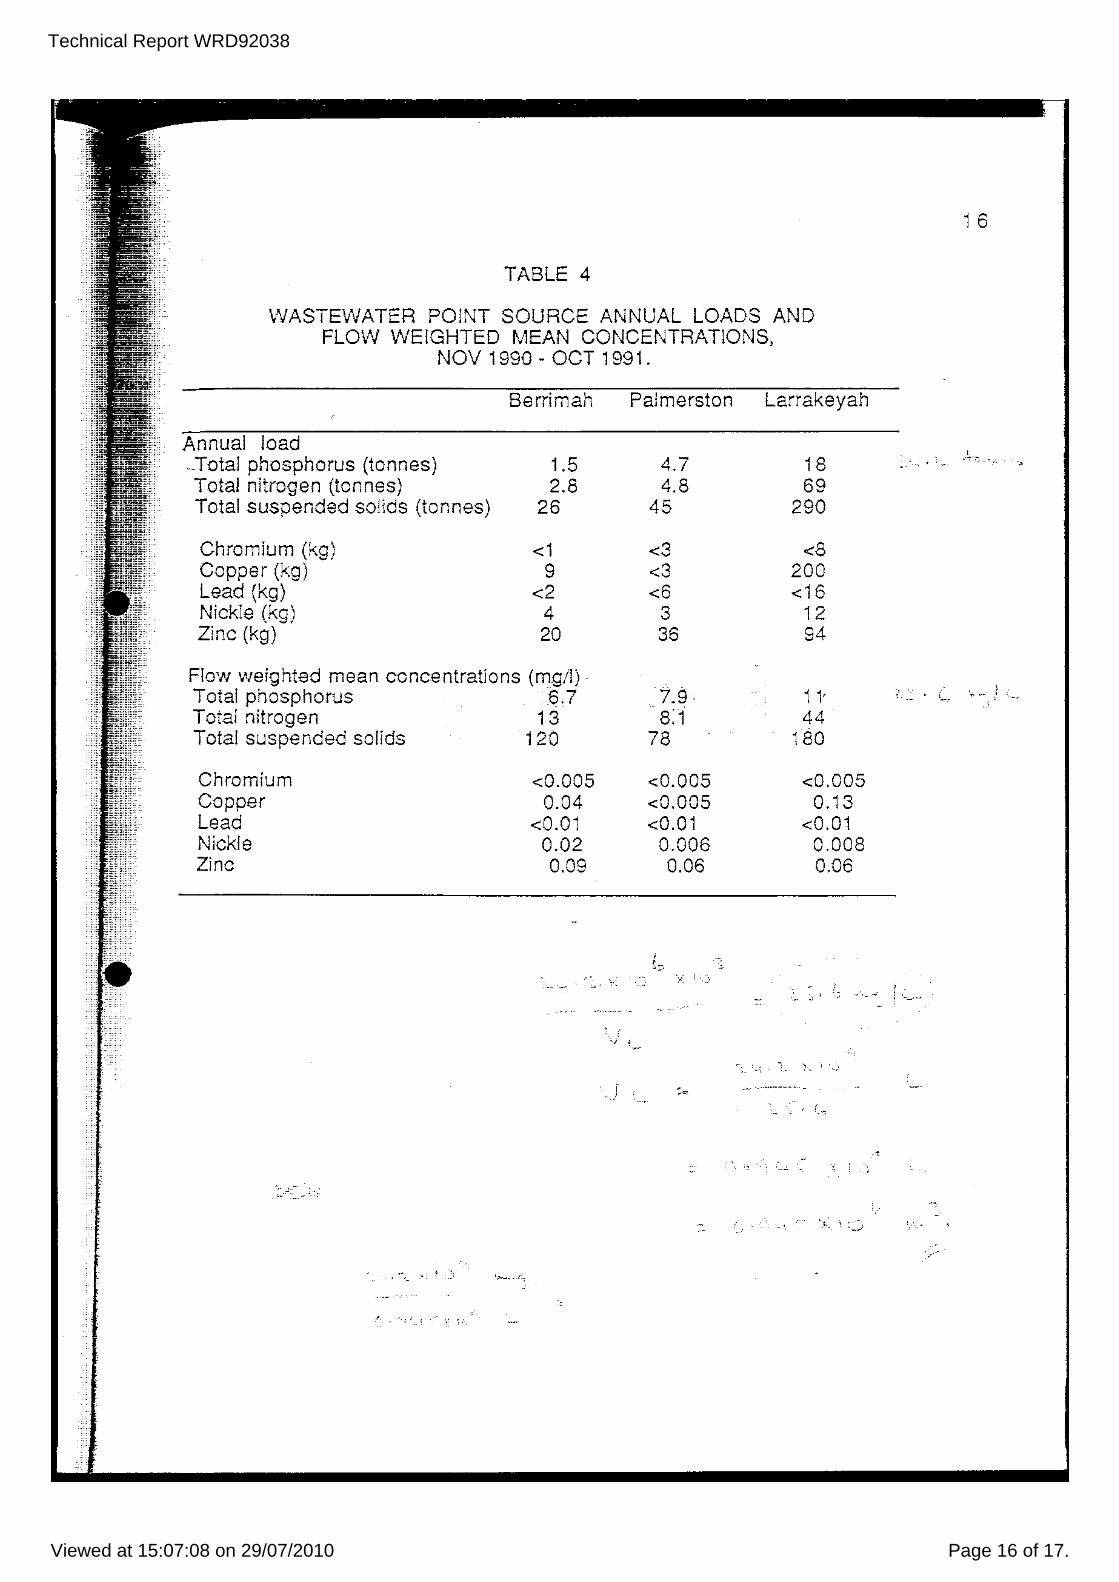
Wastewater point source loads and flow weighted mean concentrations, Nov 1990 - Oct 1991.
Urban and non-urban catchment and point source wastewater loads into Darwin Harbour, Nov 1990 - Ocl 1991.
4
Technical Report WRD92038
Viewed at 15:07:08 on 29/07/2010 Page 5 of 17.
t
'. ,
I , • ! I ~
~
i I I
I '.
SUMMARY
Inputs of total phosphorus, nitrogen, suspended solids, chromium, copper, lead, nickle and zinc into Darwin Harbour, from urban and non-urban catchments and wastewater point sources, were calculated for the period November 1990 to October 1991. Exports from two catchments, representing urban and non-urban land-use, were extrapolated to the whole of the Darwin Harbour catchment to determine non-point source contributions whilst point sources werB determined directly. There were several sources of error associated with the calculation of the loads, nevertheless the results provide an estimate of the relative and absolute contributions of each water quality parameter into Darwin Harbour. Wastewater point sources contributed approximately 75% of the total phosphorus load, 20% of the total nitrogen load and a small proportion of the suspended solid and metal loads, except for copper. Allhough urban land-use represented only 2% of the total harbour catchment, it contributed a large proportion of phosphorus, suspended solids, lead and zinc loads compared to non-urban areas. Run-off into the harbour was above median volumes during the study period, and consequently the proportions of urban and non-urban loads would be lower in most years (assuming constant wastewater exports).
5
Technical Report WRD92038
Viewed at 15:07:08 on 29/07/2010 Page 6 of 17.
! ,.
1. INTRODUCTION
Darwin Harbour receives run-off from wastewater point sources, and urban, rural and largely undisturbed non-point sources. Knowledge of the relative contributions of these sources is important to the development of strategies in the assessment and management of receiving waters. This report details the nutrient, suspended solid and metal loads into Darwin Harbour for the period Novemb€r 1990 to October 1991 .
2. DARWIN HARBOUR CATCHMENT AND POINT SOURCE DESCRIPTIONS
For the purposes of this study, the mouth of Darwin Harbour is defined by East and West Points (Fig. 1). The catchment area, above the high tide water level, is 1430 km2, of which 29 km2 is urban (Darwin and Palmerston) with the remainder being largely undisturbed (Table 1). Catchment relief consists mainly of undulating plains and hills which have been extensively weathered and laterized (Wood 1986). Vegetation is predominantly Eucalvotus woodland with sorghum grassland understorey. Approximately 2% of the catchment has been cleared for hay production and low intensity horticulture (eg. mango and melon CUltivation). Small rural residential blocks of 1-10 ha constitute 3% of the catchment and occur within a 50 km radius of Darwin. The small settlement of Belyuen (population 250) is on the western side of the harbour. Industrial land-use within the non-urban area of the harbour occupies approximately 2 km2 and comprises the Trade Development Zone, which contains light industry, and the Channel Island Power station. Darwin and the satellite township of Palmerston are fully sewered and comprise 61 % residential land-use while the remainder is industrial, commercial and parkland (Table 2).
Representative catchments, with hydrographic stations, for urban and nonurban land-use were selected according. to station access and catchment land-use_ The non-urban portion of Darwin Harbour catchment was represented by the Elizabeth River sub-catchment (Fig. 1), comprising 79% undisturbed land and the remainder either cleared land or rural residential blocks {Table 1). Run-off from urban land-use was represented by the Karama catchment (Fig. 1) which is a small, catchment (0.51 km2) outside the harbour catchment boundary consisting predominantly of residential land-use (Table 2). Catchment run-off is collected by a storm water drainage system and directed through a Parshall flume.
Oar..vin Harbour receives wastewater effluent from three main point sources: Palmerston, Berrimah and larrakeyah treatment plants (Fig. 1). The Paimerston plant comprises a five pond lagoon system and treats domestic sewage from Palmerston township (population 8000). Domestic and light industrial wastewater is treated at the Berrimah plant by a three pond lagoon system_ Both lagoon systems discharge into the inter-tidal zone. The larrakeyah plan! serves both the Darwin central business district and the inner residential area. Grit is removed and the sewage macerated, before effluent is discharged into the harbour 100 m offshore at a depth of 10m.
6
Technical Report WRD92038
Viewed at 15:07:08 on 29/07/2010 Page 7 of 17.
I , I !
II i~
3. METHODS AND CALCULATIONS
At Karama and Elizabeth River gauging stations, a data logger recorded stage height, computed stream flow and actuated an automatic sampler to collect subsamples of 500 mL which were stored as a composite sample in an 80 litre container. The subsamples were collected according to a volume interval regime set at 0.2 - 0.5 ML at the Karama station and 0.2 - 20 ML at the Elizabeth River station. The number of subsamples comprising a composite sample varied between 5 and 152. Grab samples were collected at the Karama station during the dry season flows «0.01 cumecs) because attached algal growth on the flume and sedimentation prevented automated sample collection. Between December 28 1990 and January 9 1991 three grab samples were collected from the Elizabeth River station as stage height data and automated samples could not be obtained due to a power failure. Hydrographic data was estimated from a linear regression (r= 0.76 ; P < 0.05) between Elizabeth River and Tumbling Waters (Fig. 1) flow based on 20 years of flow records for the period of missing data.
Eighteen composite and 3 grab samples were collected from the Elizabeth River gauging station and 38 composite and 6 grab sanples were collected from the Karama site. The samples were analysed by standard methods (Anon. 1989) for total phosphorus, nitrite, nitrate, kjeldahl nitrogen, total suspended solids, and residual and filterable chromium, copper, lead, nickle and zinc. Total nitrogen concentrations were determined from the sum of the kjeldahl nitrogen, nitrite and nitrate concentrations and total metal concentrations from the sum of the residual and filterable concentrations.
The Karama and Elizabeth River catchment loads were computed by summing matching volume and concentration products and are expressed in areal units (mass per unit area). There are several sources of error associated with these calculations which are primarily related to the volume and concentration data and the propagation of this error when the two variables afe multiplled to determine load and summed to obtain total load.
The discharge data, excluding the period of estimated flow for Elizabeth River, is estimated to have an accuracy of 10%, of which the largest source of error is the stage-discharge relationship. The errors associated with the concentration data were largely related to how representative the composite samples were of temporal and spatial variation in stream concentrations. Other errors arose from subsampling and analytical techniques.
Harbour catchment loadings were determined by multiplying the Kar2ma and Elizabeth River areal loadings to the total catchment based on the proportions of urban and non-urbar' land-use over the whole catchment. Large increases in error equal to the square of the multiplier result from such extrapolations.
Samples were collected, on average, every fortnight from the effluent of each wastewater point source and analysed for total phosphorus, kjeldahl nitrogen and total suspended solids (Anon. 1.989). Nitrate was not analysed as it has been found to be undetectable «0.1 mg/L) in the effluents (unpublished data, P.A.W.A.). Larrakeyah wastewater samples were collected at 10:30 am. Concentrations of water quality variables in samples collected at this time did not vary significantly from 24 hour composite samples taken at the same site
7
Technical Report WRD92038
Viewed at 15:07:08 on 29/07/2010 Page 8 of 17.
;;
I
(unpublished data, PAWA), consequently there is no correction for variations in diurnal load. Wastewater loads at Palmerston and Berrimah were assumed not to have significant diurnal variation. Samples collected from each wastewater point source in February, May and August 1991 were analysed for the same metals determined for the Karama and Elizabeth River samples.
Flow volumes for Larrakeyah were calculated from hydrographic data whilst at Berrimah and Palmerston point source outflows were estimated from inflow hydrographic data corrected for evaporation and rainfall. The error associated with the metal loads from the wastewater point sources are likely to be large compared to the nutrient and suspended solids determinations due·to the smail number of samples collected.
Water yields (run-off, mm 1 rainfall, mm) from the Karama and Elizabeth River catchments were determined using rainfall data collected near the boundary of each catchment (fig. 1).
4. RESULTS
Flow at the Karama and Elizabeth River gauging stations commenced in December 1990 and continued through the dry season at Karama whilst Elizabeth River flow ceased in early May 1991. The discharge volume measured at Elizabeth River for the 1990/91 wet season was higher than the median, and equal to the upper quartile based on a twenty year record at the site. Total discharge into the harbour was therefore likely to be higher than median volumes during the 1990/91 wet season. Rainfall measured near the Elizabeth River station was 1730 mm, 500 mm lower than that measured at Karama. Water yield from the Elizabeth River catchment (0.37) was about half that of the Karama catchment (0.78).
Total phosphorus, nitrogen, metal and suspended solid loadings from the Karama catchment exceeded Elizabeth River catchment values by 4 - 25 fold (Table 3). Phosphorus, lead, zinc and suspended solids were at least an order of magnitude higher. The ratio of total nitrogen to total phosphorus in the Elizabeth River catchment run-off (48:1) was considerably higher than the Karama catchment run·off (16:1).
Wastewater discharge into the harbour from the Berrimah, Palmerston and Larrakeyah plants averaged 0.6, 1.6 and 4.3 MUd respectively. Loads for all parameters were up 10 40 times higher in the substantially untreated Larrakeyah wastewater effluent compared to the Berrimah and Palmerston effluents (Table 4), apart from chromium and lead which were not detected in wastewater samples. The ratios of nitrogen to phosphorus from the lagoon effluents approximated 1:1, whilst from Larrakeyah this ratio was 4:1.
Nutrient, suspended solid and metal loads into Darwin Harbour from urban and non-urban catchments sources, and wastewater point sources, are presented in Table 5.
8
Technical Report WRD92038
Viewed at 15:07:08 on 29/07/2010 Page 9 of 17.
i: ,
I }
I I
5. DISCUSSION
Nitrogen and phosphorus loads from the Karama catchment were similar to the predicted annual loads for a Melbourne catchment (GHD/EPA, 1981), and within the range of values reported by Weeks and Crockett (1983) and Miller (1983) for other Australian studies. The low nitrogen to phosphorus ratio of Karama run-oil, compared to the Elizabeth River, may have resulted from the application of garden fertllizers which are typically rich in phosphorus, with nitrogen to phosphorus ratios of 1 :1-1 :2. The Karama suspended solid load was about twice the values reported by Weeks (1982) and GHD/EPA (1981), whilst metal loads differed by a factor of 0.3 - 4 compared to the GHD/EPA (1981) estimates. Different urban land-uses, run-off volumes, rainfall regime and data collection methods would have contributed to the these differences.
Elizabeth River copper, phosphorus and suspended solids areal loads were similar to those determined by Hart et a!. (1987) for Magela Creek (Kakadu National Park) upstream of the coastal floodplain. Lead and zinc values from Elizabeth River were, however, were two orders of magnitude higher than Magela Creek loads. This difference may be attributable to the greater anthropogenic activity in the Elizabeth River catchment and/or the difierent catchment geology. Magela Creek drains Middle Proterozoic sandstones, whilst the Elizabeth River catchment drains mainly Lower Proterozoic sediments (Williams, 1991).
Lagoon treatment of domestic sewage reduces suspended solids, phosphorus and metals by sedimentation, and nitrogen mainly by volatization of ammonia (Gloyna 1971). The loss of nitrogen from the Berrimah and Palmerston lagoon systems accounts for the lower nitrogen to phosphorus ratios compared to wastewater from the Larrakeyah plant. The high loads from the Larrakeyah point source result from it's negligible treatment and high flows compared to the trealed Berrimah and Palmerston point sources which have lower flows. The relatively high copper load from the Larrakeyah plant can probably be attributed to household and hotel brass fittings.
The calculation of the total harbour catchment loadings is based on the assumption tha! the Karama and Elizabeth River catchments are representative of urban and non-urban land-use. The Karama catchment has a lower proportion of commercial, industrial and park land-use compared to urban land-use in the Darwin Harbour catchment. Commercial and residential land-uses have similar loads, whilst industrial catchments characteristically have higher metal and suspended solid and lower nutrient loads (Novotny 1992). Parkland typically has a smaller load of all parameters examined compared to residential land-use (Novotny 1992). The Elizabeth River values may over-estimate non-urban loads due to the greater level of human activity within it's catchment compared to the total non-urban land-use of Darwin Harbour. The catchment and wastewater loadings into Darwin Harbour must be regarded as an estimate because of the errors associated with the data collection methods, computations and the use of sub-catchments. Nevertheless, the results do serve as an estimate of the relative and absolute contributions from different sources for the various parameters examined.
Wastewater effluent and urban run-off constituted approximately 75% of the total phosphorus load in 1990/91, about half this was from the Larrakeyah
9
Technical Report WRD92038
Viewed at 15:07:08 on 29/07/2010 Page 10 of 17.
• ,
•
wastewater plant. The proportion of nitrogen from anthropogenic sources was much lower, representing about 25% of the total nitrogen load. The proportion of lead and zinc entering the harbour from urban land-use was high (approx. 30 %) compared to other inputs into the harbour. With the exception of copper loads from the Larrakeyah point source, wastewater metal inputs into the harbour were low compared to the total catchment load. The higher loads from the urban catchments for phosphorus, lead, zinc and suspended solids, compared to non-urban areas, resulted from higher concentrations and increased water yield.
The relative contributions from wastewater point sources, which are relatively constant, and non-point sources will vary between years because of varying annual discharge volumes into the harbour. Cosser (1989) and other authors have reported proportional relationships between load and run-off volume, consequently the proportion of non-point source contributions determined for the study period will be less for most years because total discharge into the harbour during the 1990/91 wet season exceeded median volumes .
6. CONCLUSION
Estimated contributions of total phosphorus, nitrogen, suspended solids, chromium, copper, nickle and zinc into Darwin Harbour varied markedly between sources. The study found there were relatively large contributions of phosphorus, lead, zinc and suspended solids from urban areas compared to non-urban land-use, and there was a large phosphorus load from wastewater paint sources, in particular the Larrakeyah plant. Run-off during the study year was higher than the median, consequently the proportion of the total load from non-point sources will be less during most years. The results contribute to the understanding of the sources of nutrient, suspended solids and metals into Darwin Harbour and will assist in the development of strategies for effective management of the harbour.
7. REFERENCES
ANON. (1989). Standard methods for the examination of water and wastewater 17th ed. U.S.A., A. P.HAfA.W.wANl.P.C.F.
COSSER, P. R. (1989). Nutrient concentration-flow relationships and loads in the South Pine River, south·eastern Queensland I. phosphorus loads. Aust. J, Mar. and Freshw. Res. 40, 613-630.
GLOYNA, F.G. (1971). Waste stabilization ponds. W. H. 0., Geneva.
GUTTERlDGE, HASKINS and DAVEY P/L and ENVIRONMENTAL PROTECTION AUTHORITY of VICTORIA (1981). Characterisation of pollution in urban slormwater run-off. AWRC technical paper 60. A.G.P.S. Canberra.
HART, B.T., OTTAWAY, E.M. and NOLLER, B. N. (1987). Magela Creek system, northern Australia. II material budget for the floodplain. Aust. J. Mar, ErAshw, Res. 38, 861 -876.
1 0
Technical Report WRD92038
Viewed at 15:07:08 on 29/07/2010 Page 11 of 17.
•
f;
•
MILLER, M.C. (1983). Some discussion points relating to urban stormwater pollution and abatement. Proceedings of the workshoo on non-ooin! sources of pollution in Australia (eds. Australian Water Resources Council). A.G.P.S. Canberra. pp 232-235.
NOVOTNY, V. (1992). Unit pollutant loads. Water Environment and Technologv. 1, 40-43.
WILLIAMS, MAJ. (1992). Evolution of a landscape. Monsoonal Australia. landscape, ecology and man in the northern lowlands (eds. Haynes, C.D., Ridpath, M.G. and Williams, MAJ.) Balkema Publishers, Netherlands. pp 3-17. '
WEEKS, C.R. and CROCKETT, J.A. (1983). Urban stormwater pollution and abatement. Proceedings of the workshop on non-point sources of poilution in Australia (eds. Australian Water Resources Council). A.G.P.S, Canberra. pp 190-202 .
WOOD, B. (1986). The land resources of the Darwin region. Proceedings of the Darwin Region Future Land-use and Water Supply Seminar (eds. Dept. of Transport and Works and Dept. of Lands. Darwin, pp1-10.
1 1
Technical Report WRD92038
Viewed at 15:07:08 on 29/07/2010 Page 12 of 17.
East Point
DARWIN HARBOUR
DARWIN HARBOUR CATCHMENT
k:n 0k=! ===~±oo' ==~1D km
LEGEND Gauging Station » Wastewater Discharge Locations 0 Catchment Boundary Urban Land Use W*-iA Rain Gauge -
Pa!r.1er
TUMBLING WATERS
,'Ol'~ ,;(",
0\-i'G '
KARAMA CATCHMENT
ELIZABETH RiVER SUB-CA TCHMENT
FIGURE 1 DARWIN HARBOUR CATCHMENT
i 2
Technical Report WRD92038
Viewed at 15:07:08 on 29/07/2010 Page 13 of 17.
••••
I
TABLE 1
PERCENTAGE LAND-USE FOR THE DARWIN HARBOUR NON-URBAN AND ELIZABETH RIVER CATCHMENTS.
Undisturbed Small rural blocks Cleared land Industrial Rural settlements
Non-urban catchment
95 3 2
<1 <1
Elizabeth River catchment
79 1 1 10 o o
1 3
Technical Report WRD92038
Viewed at 15:07:08 on 29/07/2010 Page 14 of 17.
•
•
••
•
,
•
TABLE 2
PERCENTAGE LAND-USE FOR THE DARWIN HARBOUR URBAN AND KARMJ1A CATCHMENTS.
Residential Industrial Commercial Parkland
Urban catchment
61 21 9 9
Karama catchment
99 o o 1
14
Technical Report WRD92038
Viewed at 15:07:08 on 29/07/2010 Page 15 of 17.
TABLE 3
KARMAA AND ELIZABETH RIVER CATCHMENT LOADS AND FLOW WEIGHTED MEAN CONCENTRATIONS,
NOV 1990 - OCT 1991.
Karama
Catchment loads Total phosphorus (kg/ha) 0.7 Total nitrogen (kg/ha) 11 Tolal suspended solids(kg/ha)61 0
Chromium (g/ha) Copper (g/ha) Lead (g/ha) Nickle (g/ha) Zinc (g/ha)
81 110 320
66 1900
Elizabeth River
0.05 2.4
57
13 21 13 16
110
Flow weighted mean concentrations (mg/l) Total phosphorus 0.037 0.008 Total nitrogen 0.60 0.37 Total suspended solids 34 9
Chromium Copper Lead Nickle Zinc
0.005 0.006 0.018 0.004 0.10
0.002 0.003 0.002 0.003 0.018
1 5
Technical Report WRD92038
Viewed at 15:07:08 on 29/07/2010 Page 16 of 17.
1 6
TABLE 4
WASTEWATER POINT SOURCE ANNUAL LOADS AND FLOW WEIGHTED MEAN CONCENTRATIONS,
NOV 1990 - OCT 1991 .
Berrimah Paimerston Larrakeyah
Annual load , .. Total phosphorus (tonnes) 1.5 4.7 18 ' ... "
Total nitrogen (tonnes) 2.8 4.8 69 Total suspended solids (tonnes) 26 45 290
Chromium (kg) <1 <3 <8 Copper (kg) 9 <3 200 Lead (kg) <2 <6 <16 Nickle (kg) 4 3 12 Zinc (kg) 20 36 94
Flow weighted mean concentrations (mg/l) , , .
Total phosphorus 6.7 7.9 11- i. __ ... -. !
Total nitrogen 13 8:1 44 Total suspended solids 120 78 180
Chromium <0.005 <0.005 <0.005 Copper 0.04 <0.005 0.13 Lead <0.01 <0.01 <0.01 Nickle 0.02 0.006 0.008 Zinc 0.09 0.06 0.06
V I.:. , ~ ,.'._..; : "'-"
i '
. ,

Technical Report WRD92038
Viewed at 15:07:08 on 29/07/2010 Page 17 of 17.
17
TABLE 5
URBAN AND NON-URBAN CATCHMENT AND WASTEWATER LOADS INTO DARWIN HARBOUR, NOV 1990 - OCT 1991.
Urban Non-urban Wastewater
Total phosphorus (tonnes) 2 (6) 7 (21 ) 24 (73) Total nitrogen (tonnes) 32 (7) 340 (75) 79 (18) Tot~1 suspended solids (tonnes) 1800 (17) 8200 (79) 370 ( 4)
Chromium (kg) 230 (11) 1900 (89) <1 «1 ) Copper (kg) 320 (9) 3000 (85) 210 (6) Lead (kg) 930 (33) 1900 (67) <20 «1 ) Nickle (kg) 190 (8) 2200 (91 ) 17 (1 ) Zinc (kg) 5500 (26) 16000 (74) 150 «1 )
% total parameter load in brackets