Embed Size (px)
Citation preview
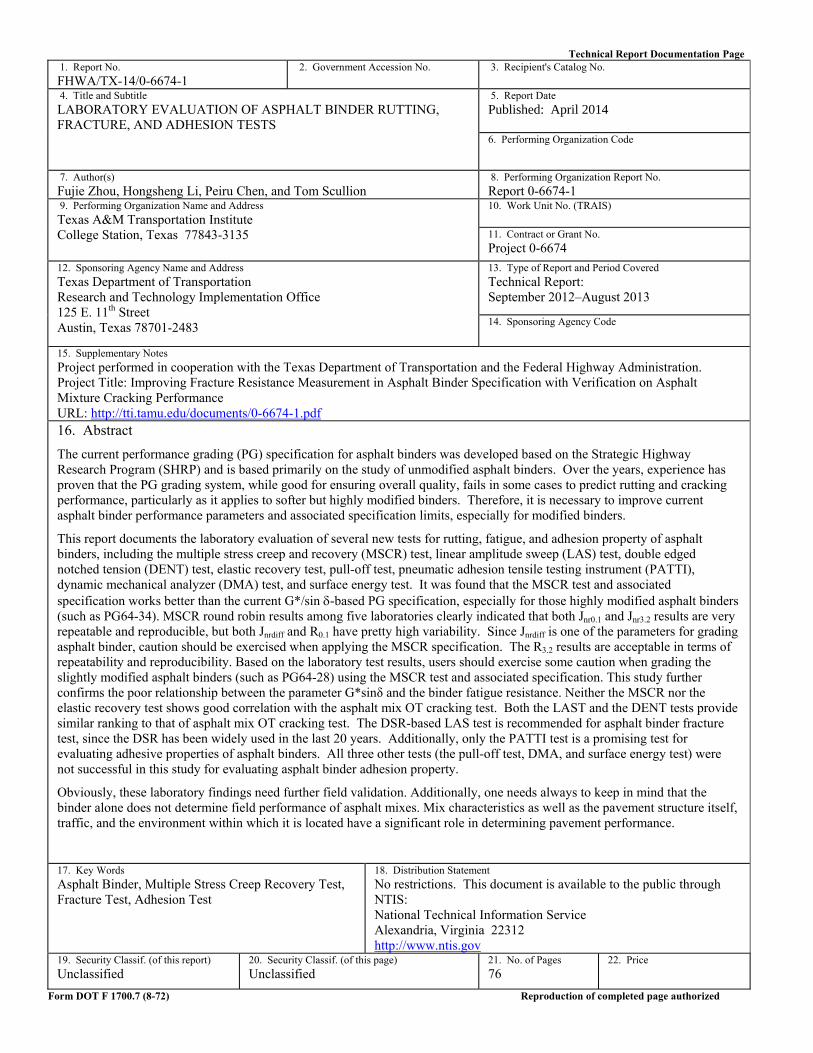
Technical Report Documentation Page 1. Report No.
FHWA/TX-14/0-6674-1 2. Government Accession No.
3. Recipient's Catalog No.
4. Title and Subtitle
LABORATORY EVALUATION OF ASPHALT BINDER RUTTING, FRACTURE, AND ADHESION TESTS
5. Report Date
Published: April 2014
6. Performing Organization Code
7. Author(s)
Fujie Zhou, Hongsheng Li, Peiru Chen, and Tom Scullion 8. Performing Organization Report No.
Report 0-6674-1 9. Performing Organization Name and Address
Texas A&M Transportation Institute College Station, Texas 77843-3135
10. Work Unit No. (TRAIS)
11. Contract or Grant No.
Project 0-6674 12. Sponsoring Agency Name and Address
Texas Department of Transportation Research and Technology Implementation Office 125 E. 11th Street Austin, Texas 78701-2483
13. Type of Report and Period Covered
Technical Report: September 2012–August 2013
14. Sponsoring Agency Code
15. Supplementary Notes
Project performed in cooperation with the Texas Department of Transportation and the Federal Highway Administration. Project Title: Improving Fracture Resistance Measurement in Asphalt Binder Specification with Verification on Asphalt Mixture Cracking Performance URL: http://tti.tamu.edu/documents/0-6674-1.pdf 16. Abstract
The current performance grading (PG) specification for asphalt binders was developed based on the Strategic Highway Research Program (SHRP) and is based primarily on the study of unmodified asphalt binders. Over the years, experience has proven that the PG grading system, while good for ensuring overall quality, fails in some cases to predict rutting and cracking performance, particularly as it applies to softer but highly modified binders. Therefore, it is necessary to improve current asphalt binder performance parameters and associated specification limits, especially for modified binders.
This report documents the laboratory evaluation of several new tests for rutting, fatigue, and adhesion property of asphalt binders, including the multiple stress creep and recovery (MSCR) test, linear amplitude sweep (LAS) test, double edged notched tension (DENT) test, elastic recovery test, pull-off test, pneumatic adhesion tensile testing instrument (PATTI), dynamic mechanical analyzer (DMA) test, and surface energy test. It was found that the MSCR test and associated specification works better than the current G*/sin -based PG specification, especially for those highly modified asphalt binders (such as PG64-34). MSCR round robin results among five laboratories clearly indicated that both Jnr0.1 and Jnr3.2 results are very repeatable and reproducible, but both Jnrdiff and R0.1 have pretty high variability. Since Jnrdiff is one of the parameters for grading asphalt binder, caution should be exercised when applying the MSCR specification. The R3.2 results are acceptable in terms of repeatability and reproducibility. Based on the laboratory test results, users should exercise some caution when grading the slightly modified asphalt binders (such as PG64-28) using the MSCR test and associated specification. This study further confirms the poor relationship between the parameter G*sinδ and the binder fatigue resistance. Neither the MSCR nor the elastic recovery test shows good correlation with the asphalt mix OT cracking test. Both the LAST and the DENT tests provide similar ranking to that of asphalt mix OT cracking test. The DSR-based LAS test is recommended for asphalt binder fracture test, since the DSR has been widely used in the last 20 years. Additionally, only the PATTI test is a promising test for evaluating adhesive properties of asphalt binders. All three other tests (the pull-off test, DMA, and surface energy test) were not successful in this study for evaluating asphalt binder adhesion property.
Obviously, these laboratory findings need further field validation. Additionally, one needs always to keep in mind that the binder alone does not determine field performance of asphalt mixes. Mix characteristics as well as the pavement structure itself, traffic, and the environment within which it is located have a significant role in determining pavement performance.
17. Key Words
Asphalt Binder, Multiple Stress Creep Recovery Test, Fracture Test, Adhesion Test
18. Distribution Statement
No restrictions. This document is available to the public through NTIS: National Technical Information Service Alexandria, Virginia 22312 http://www.ntis.gov
19. Security Classif. (of this report)
Unclassified 20. Security Classif. (of this page)
Unclassified 21. No. of Pages
76 22. Price
Form DOT F 1700.7 (8-72) Reproduction of completed page authorized

LABORATORY EVALUATION OF ASPHALT BINDER RUTTING, FRACTURE, AND ADHESION TESTS
by
Fujie Zhou, Ph.D., P.E. Research Engineer
Texas A&M Transportation Institute
Hongsheng Li Research Associate
Texas A&M Transportation Institute
Peiru Chen Research Associate
Texas A&M Transportation Institute
and
Tom Scullion Senior Research Engineer
Texas A&M Transportation Institute
Report 0-6674-1 Project 0-6674
Project Title: Improving Fracture Resistance Measurement in Asphalt Binder Specification with Verification on Asphalt Mixture Cracking Performance
Performed in cooperation with the Texas Department of Transportation
and the Federal Highway Administration
Published: April 2014
TEXAS A&M TRANSPORTATION INSTITUTE College Station, Texas 77843-3135

v
DISCLAIMER
The contents of this report reflect the views of the authors, who are responsible for the facts and the accuracy of the data presented here. The contents do not necessarily reflect the official view or policies of the Texas Department of Transportation (TxDOT) or the Federal Highway Administration (FHWA). This report does not constitute a standard, specification, or regulation. The engineer in charge was Dr. Fujie Zhou, P.E. (Texas, # 95969).
There is no invention or discovery conceived or first actually reduced to practice in the course of or under this contract, including any art, method, process, machine, manufacture, design or composition of matter, or any new useful improvement thereof, or any variety of plant, which is or may be patentable under the patent laws of the United States of America or any foreign country.
The United States Government and the State of Texas do not endorse products or manufacturers. Trade or manufacturers’ names appear herein solely because they are considered essential to the object of this report.
vi
ACKNOWLEDGMENTS
This project was made possible by the Texas Department of Transportation in cooperation with the Federal Highway Administration. The authors thank the many personnel who contributed to the coordination and accomplishment of the work presented here. Special thanks are extended to Darrin Jensen for serving as the project manager. Many people volunteered their time to serve as project advisors, including:
Jerry Peterson. Gisel Carrasco. Dar-Hao Chen. Stacey Young. Rhonda Roundy.
vii
TABLE OF CONTENTS List of Figures ............................................................................................................................. viii List of Tables ................................................................................................................................ ix Chapter 1 Introduction................................................................................................................. 1
Organization of the Report ......................................................................................................... 1 Chapter 2 Laboratory Evaluation of MSCR Test: Repeatability and Correlation with
Asphalt Mix Rutting Test ...................................................................................................... 3 Introduction ................................................................................................................................. 3 Background MSCR Test ............................................................................................................. 3 Repeatability and Precision of the MSCR Test .......................................................................... 6 Asphalt Binder Ranking Based on Jnr and G*/sin Criteria ................................................... 12 Correlation between MSCR Binder Test and Asphalt Mix Rutting Test ................................. 13 Conclusions and Recommendation ........................................................................................... 16
Chapter 3 Identification of Simple Fracture Tests for Asphalt Binders ............................... 19 Introduction ............................................................................................................................... 19 Objectives ................................................................................................................................. 20 Experimental Test Plan ............................................................................................................. 20 Asphalt Binders, Tests, Results, and Analysis .......................................................................... 22 Asphalt Mixes, Cracking Test, Results, and Analysis .............................................................. 26 Discussion on the Best Binder Fatigue Test ............................................................................. 27 Summary and Findings ............................................................................................................. 28
Chapter 4 Asphalt Binder Adhesion Test ................................................................................. 29 Introduction ............................................................................................................................... 29 Direction Tensile Bond Test, Results, and Discussion ............................................................. 30 Pneumatic Adhesion Tensile Test, Results, and Discussion .................................................... 32 DMA Test, Results, and Discussion ......................................................................................... 34 Surface Energy Test .................................................................................................................. 38 Summary and Conclusions ....................................................................................................... 39
Chapter 5 Summary and Conclusions ...................................................................................... 41 References .................................................................................................................................... 43 Appendix A ASTM STANDARD E 691-11 .............................................................................. 47 Appendix B Detailed Laboratory Test Results and Analysis .................................................. 51
viii
LIST OF FIGURES
Figure 1. Jnr Definition. .................................................................................................................. 4 Figure 2. h Value for Jnr0.1 – Materials within Laboratories. ........................................................ 10 Figure 3. h Value for Jnr0.1 – Laboratories within Materials. ........................................................ 10 Figure 4. MSCR Test Results of Nine Asphalt Binders. .............................................................. 13 Figure 5. Aggregate Gradations of Mixes Used in This Study. .................................................... 14 Figure 6. HWTT Results of Gravel Mixes with Five Binders. ..................................................... 15 Figure 7. HWTT Results of Limestone Mixes with Five Binders. ............................................... 16 Figure 8. HWTT Results of Granite Mixes with Five Binders. .................................................... 16 Figure 9. Experimental Plan. ........................................................................................................ 20 Figure 10. FHWA DENT Test (28). ............................................................................................. 24 Figure 11. OT Test Results of 15 Asphalt Mixes. ........................................................................ 27 Figure 12. Schematic of Direct Tensile Bond Test and Possible Failure Mode. .......................... 30 Figure 13. Photo of Direct Tensile Bond Test Apparatus. ............................................................ 30 Figure 14. Whole Process of the Direct Tensile Bond Test for Asphalt Binders. ........................ 31 Figure 15. PATTI Test. ................................................................................................................. 32 Figure 16. PATTI Test Results of Five Original Asphalt Binders. .............................................. 33 Figure 17. PATTI Test Results of Five RTFO-Aged Asphalt Binders. ........................................ 34 Figure 18. Schematic View of Asphalt Concrete and Asphalt Mastic. ........................................ 34 Figure 19. DMA Specimen Preparation and Test Setup. .............................................................. 36
ix
LIST OF TABLES
Table 1. Major Differences between G*/sinδ and MSCR-Jnr Grading Systems. ........................... 5 Table 2. Summary of New High Temperature PG Binder Specification for PG64-XX Grade. ..... 5 Table 3. Participating Labs for MSCR Inter-Laboratory Study. .................................................... 6 Table 4. Asphalt Binders................................................................................................................. 6 Table 5. Inter-Laboratory MSCR Test Results. .............................................................................. 7 Table 6. Initial Preparation of Jnr0.1 Test Results for Binder A. ................................................... 9 Table 7. Consistency Statistic “h” for Jnr0.1
A. ................................................................................ 10 Table 8. Repeatability and Reproducibility Calculations for Jnr0.1. .............................................. 11 Table 9. Repeatability and Reproducibility Calculations for Jnr3.2. .............................................. 11 Table 10. Repeatability and Reproducibility Calculations for Jnrdiff. ............................................ 11 Table 11. Repeatability and Reproducibility Calculations for R0.1. .............................................. 11 Table 12. Repeatability and Reproducibility Calculations for R3200. ............................................ 11 Table 13. Optimum Asphalt Content of Each Mix. ...................................................................... 13 Table 14. Existing Laboratory Tests for Characterizing Asphalt Binder Fatigue Resistance. ..... 21 Table 15. Phase I Test Results of the Five Asphalt Binders. ........................................................ 25 Table 16. Asphalt Binder Adhesion Tests. ................................................................................... 29 Table 17. DMA Test Results at the Temperature of 86°F and a Strain of 0.25. ........................... 38 Table 18. Surface Energy of Asphalt Binders. ............................................................................. 39

1
CHAPTER 1 INTRODUCTION
The current performance grading (PG) specification for asphalt binders was developed based on the Strategic Highway Research Program (SHRP) and is based primarily on the study of unmodified asphalt binders. Over the years, experience has proven that the PG grading system, while good for ensuring overall quality, fails in some cases to predict rutting and cracking performance, particularly as it applies to modified binders (such as those with polymers or other types of modifiers). Specifically, recent studies on mixes from out of state (Minnesota) found that the mixes from Minnesota’s Cold Weather Road Research Facility (MnRoad) have substantially improved cold weather cracking properties than mixes currently used in Texas. while these mixes still pass Hamburg rutting requirements, in spite of the binders being much softer, according to typical PG measurement, than would be used on Texas roads, according to typical PG measurement. To eliminate this type of apparent discrepancy on softer but highly modified binders, a new Multiple Stress Creep and Recovery (MSCR) test-based specification was proposed and has been adopted by the American Association of State Highway and Transportation Officials (AASHTO). It is believed that using the MSCR test which directly measures the permanent deformation properties of asphalt binder and the new specification, softer but highly modified binders will be allowed. However, these claims have not been verified with tests on Texas mixtures. Additionally, another weakness of the PG grading system is that it has no test method or criteria to screen out the premature adhesive or moisture damage failures of asphalt binder-aggregates. Therefore, it is necessary to improve current asphalt binder performance parameters and associated specification limits, especially for modified binders. Specifically, the major objectives of research project 0-6674 are:
Determine if the new AASHTO MSCR-based binder grading system is superior to the current TxDOT system.
Identify/develop a simple test method or methods to characterize fracture and adhesive properties of modified and unmodified asphalt binders and associated tentative specification limits.
Determine if asphalt binders not currently used in Texas would potentially improve overlay performance and conduct an associated cost-benefit analysis.
Identify optimal asphalt binder/aggregate combinations for different environmental zones in Texas.
Develop and initially populate a catalogue of all these measured (binder, binder/fine aggregate mastic, and asphalt mix) properties with relevant information that can be used to track the field performance of pavements constructed using these asphalt binders.
This report documents the laboratory work focused on part of the first two objectives.
ORGANIZATION OF THE REPORT
This report is composed of five chapters. Following this introduction (Chapter 1), Chapter 2 describes the laboratory evaluation of MSCR test repeatability and its correlation with asphalt mix rutting properties. Chapter 3 focuses on identifying a simple fracture test for asphalt binder

2
fatigue properties. The asphalt binder adhesion tests are discussed in Chapter 4. Finally, Chapter 5 provides a summary of findings and conclusions of this project.
3
CHAPTER 2 LABORATORY EVALUATION OF MSCR TEST: REPEATABILITY AND
CORRELATION WITH ASPHALT MIX RUTTING TEST
INTRODUCTION
The Superpave PG binder specification, AASHTO M320 (1) is now used binders in Texas and other States to buy and sell paving asphalt binders. The current high temperature PG specification for asphalt binders uses the stiffness-based G*/sinδ as the rutting parameter, and the basic assumption is that a stiffer binder is rut resistant. However, the inadequacy of the current specification parameter, G*/sin δ, to correctly grade the superior field performance of modified asphalt binders has been demonstrated by several researchers (2, 3, 4). To address this issue, researchers have explored several different rheological properties to replace the existing PG high temperature specification parameter G*/sinδ. These properties include repeated load creep and recovery testing, Zero Shear Viscosity (ZSV), and low frequency dynamic viscosity, η'. The relationship to asphalt mix rutting, ease of testing, and repeatability of each procedure have also been evaluated (5-10). After years of development, debate, and discussion, AASHTO finally adopted the MSCR test to characterize asphalt binder rutting resistance. However, TxDOT still has two major concerns with the MSCR test: its repeatability and correlation with asphalt mix rutting performance. Additionally, one may wonder about the ranking difference between the MSCR specification and the G*/sinδ specification. This chapter will address these two concerns and related issues.
BACKGROUND MSCR TEST
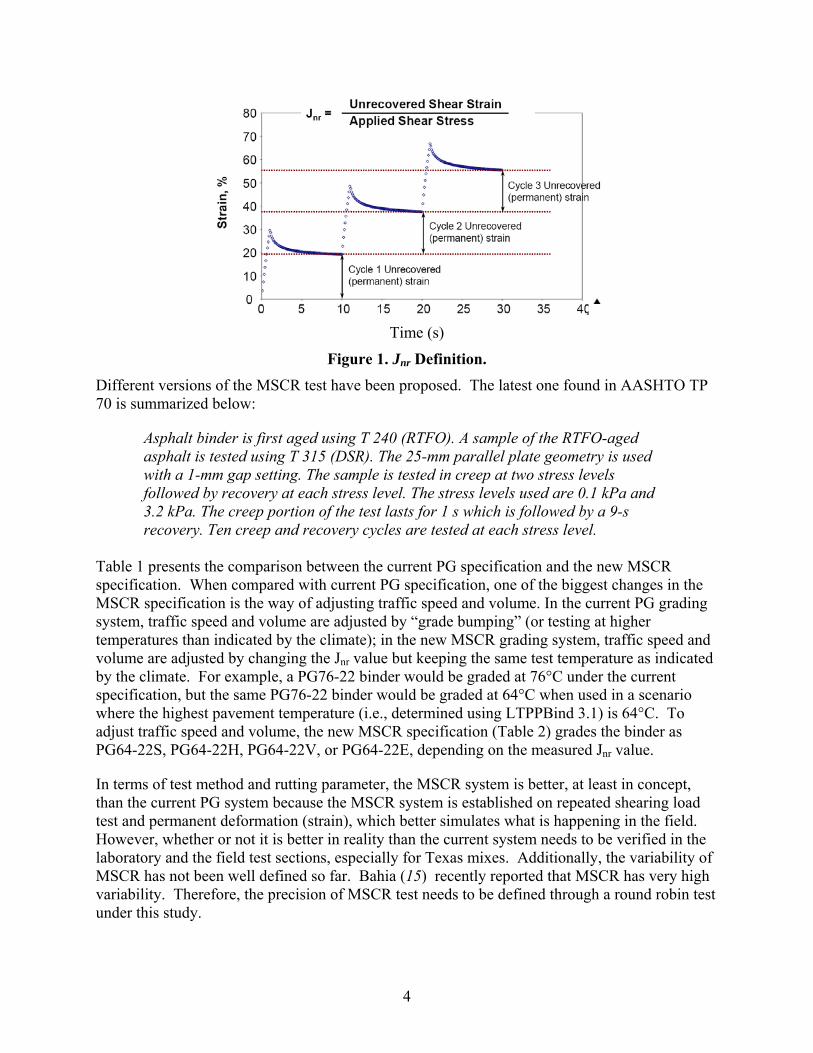
The MSCR test is based on the repeated creep and recovery test which was recommended as a high temperature parameter under the National Cooperative Highway Research Program (NCHRP) project 9-10, “Characterization of Polymer Modified Binder in Superpave Mix Design” (11). In this test a Dynamic Shear Rheometer (DSR) is used to apply a constant stress to a sample of asphalt binder for 1 second. After the load is removed the sample is then allowed to relax for 9 seconds. The test, as run in the NCHRP 9-10 work, is repeated for 50 to 100 cycles. The creep test has been used for many years to evaluate the creep-recovery of a material. This test closely models the loading associated with traffic passing over a spot in the roadway. For this reason the 9-10 researchers felt it should be the experimental procedure for evaluating asphalt binders. In the NCHRP 9-10 project, the repeated creep and recovery test was performed at only one creep stress level of 300 Pa repeated for 100 creep and recovery cycles. To determine the stress dependence of an asphalt binder, D' Angelo and Dongre (12, 13, 14) extended the NCHRP 9-10 repeated creep and recovery test and modified it by using increasing stress levels and renamed it the MSCR test. The idea behind the approach is to get the non-recovered compliance (Jnr-) as a measure of the high temperature specification as it relates to the binder contributions in the roadway permanent deformation (Figure 1). The test introduces stress sensitivity as well as a recoverable strain response and nonrecoverable response; that is, an alternative to elastic recovery specifications (ASTM D5976, AASHTO T-51).
4
Time (s)
Figure 1. Jnr Definition.
Different versions of the MSCR test have been proposed. The latest one found in AASHTO TP 70 is summarized below:
Asphalt binder is first aged using T 240 (RTFO). A sample of the RTFO-aged asphalt is tested using T 315 (DSR). The 25-mm parallel plate geometry is used with a 1-mm gap setting. The sample is tested in creep at two stress levels followed by recovery at each stress level. The stress levels used are 0.1 kPa and 3.2 kPa. The creep portion of the test lasts for 1 s which is followed by a 9-s recovery. Ten creep and recovery cycles are tested at each stress level.
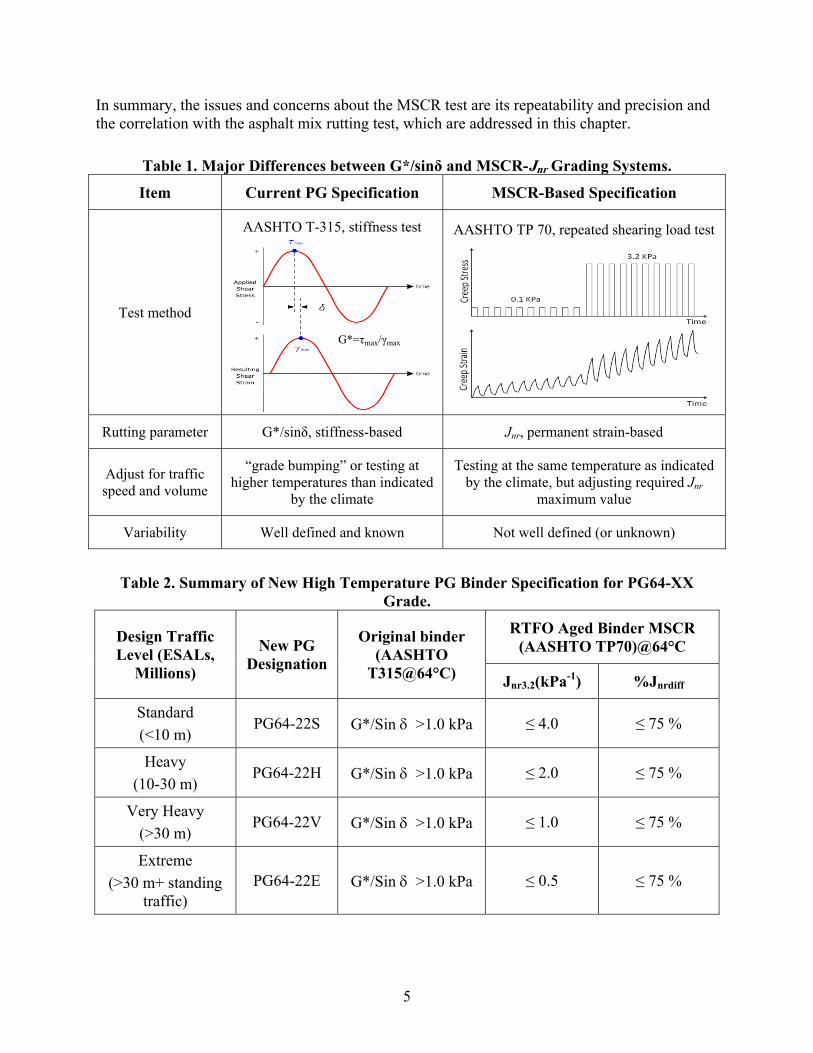
Table 1 presents the comparison between the current PG specification and the new MSCR specification. When compared with current PG specification, one of the biggest changes in the MSCR specification is the way of adjusting traffic speed and volume. In the current PG grading system, traffic speed and volume are adjusted by “grade bumping” (or testing at higher temperatures than indicated by the climate); in the new MSCR grading system, traffic speed and volume are adjusted by changing the Jnr value but keeping the same test temperature as indicated by the climate. For example, a PG76-22 binder would be graded at 76°C under the current specification, but the same PG76-22 binder would be graded at 64°C when used in a scenario where the highest pavement temperature (i.e., determined using LTPPBind 3.1) is 64°C. To adjust traffic speed and volume, the new MSCR specification (Table 2) grades the binder as PG64-22S, PG64-22H, PG64-22V, or PG64-22E, depending on the measured Jnr value.
In terms of test method and rutting parameter, the MSCR system is better, at least in concept, than the current PG system because the MSCR system is established on repeated shearing load test and permanent deformation (strain), which better simulates what is happening in the field. However, whether or not it is better in reality than the current system needs to be verified in the laboratory and the field test sections, especially for Texas mixes. Additionally, the variability of MSCR has not been well defined so far. Bahia (15) recently reported that MSCR has very high variability. Therefore, the precision of MSCR test needs to be defined through a round robin test under this study.
5
In summary, the issues and concerns about the MSCR test are its repeatability and precision and the correlation with the asphalt mix rutting test, which are addressed in this chapter.
Table 1. Major Differences between G*/sinδ and MSCR-Jnr Grading Systems.
Item Current PG Specification MSCR-Based Specification
Test method
AASHTO T-315, stiffness test AASHTO TP 70, repeated shearing load test
Rutting parameter G*/sinδ, stiffness-based Jnr, permanent strain-based
Adjust for traffic speed and volume
“grade bumping” or testing at higher temperatures than indicated
by the climate
Testing at the same temperature as indicated by the climate, but adjusting required Jnr
maximum value
Variability Well defined and known Not well defined (or unknown)
Table 2. Summary of New High Temperature PG Binder Specification for PG64-XX Grade.
Design Traffic Level (ESALs,
Millions)
New PG Designation
Original binder (AASHTO
T315@64°C)
RTFO Aged Binder MSCR (AASHTO TP70)@64°C
Jnr3.2(kPa-1) %Jnrdiff
Standard
(<10 m) PG64-22S G*/Sin >1.0 kPa ≤ 4.0 ≤ 75 %
Heavy
(10-30 m) PG64-22H G*/Sin >1.0 kPa ≤ 2.0 ≤ 75 %
Very Heavy
(>30 m) PG64-22V G*/Sin >1.0 kPa ≤ 1.0 ≤ 75 %
Extreme
(>30 m+ standing traffic)
PG64-22E G*/Sin >1.0 kPa ≤ 0.5 ≤ 75 %
G*=τmax/γmax
6
REPEATABILITY AND PRECISION OF THE MSCR TEST
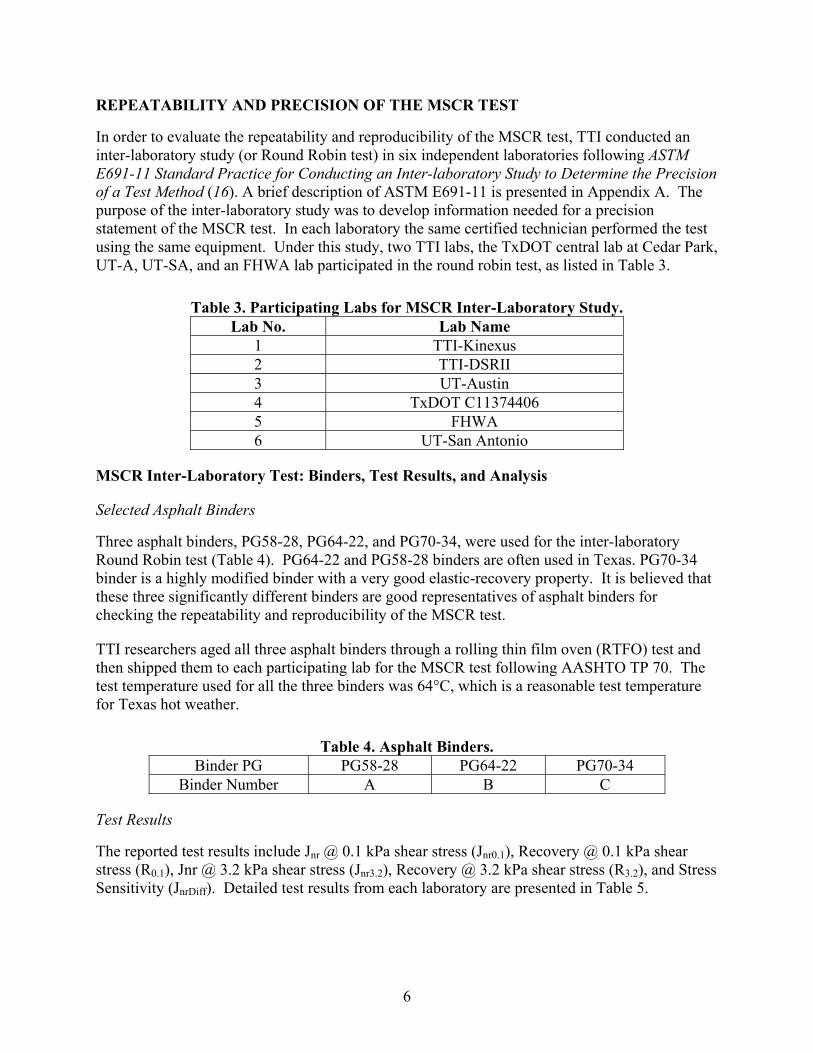
In order to evaluate the repeatability and reproducibility of the MSCR test, TTI conducted an inter-laboratory study (or Round Robin test) in six independent laboratories following ASTM E691-11 Standard Practice for Conducting an Inter-laboratory Study to Determine the Precision of a Test Method (16). A brief description of ASTM E691-11 is presented in Appendix A. The purpose of the inter-laboratory study was to develop information needed for a precision statement of the MSCR test. In each laboratory the same certified technician performed the test using the same equipment. Under this study, two TTI labs, the TxDOT central lab at Cedar Park, UT-A, UT-SA, and an FHWA lab participated in the round robin test, as listed in Table 3.
Table 3. Participating Labs for MSCR Inter-Laboratory Study. Lab No. Lab Name
1 TTI-Kinexus 2 TTI-DSRII 3 UT-Austin 4 TxDOT C11374406 5 FHWA 6 UT-San Antonio
MSCR Inter-Laboratory Test: Binders, Test Results, and Analysis
Selected Asphalt Binders
Three asphalt binders, PG58-28, PG64-22, and PG70-34, were used for the inter-laboratory Round Robin test (Table 4). PG64-22 and PG58-28 binders are often used in Texas. PG70-34 binder is a highly modified binder with a very good elastic-recovery property. It is believed that these three significantly different binders are good representatives of asphalt binders for checking the repeatability and reproducibility of the MSCR test.
TTI researchers aged all three asphalt binders through a rolling thin film oven (RTFO) test and then shipped them to each participating lab for the MSCR test following AASHTO TP 70. The test temperature used for all the three binders was 64°C, which is a reasonable test temperature for Texas hot weather.
Table 4. Asphalt Binders. Binder PG PG58-28 PG64-22 PG70-34
Binder Number A B C
Test Results
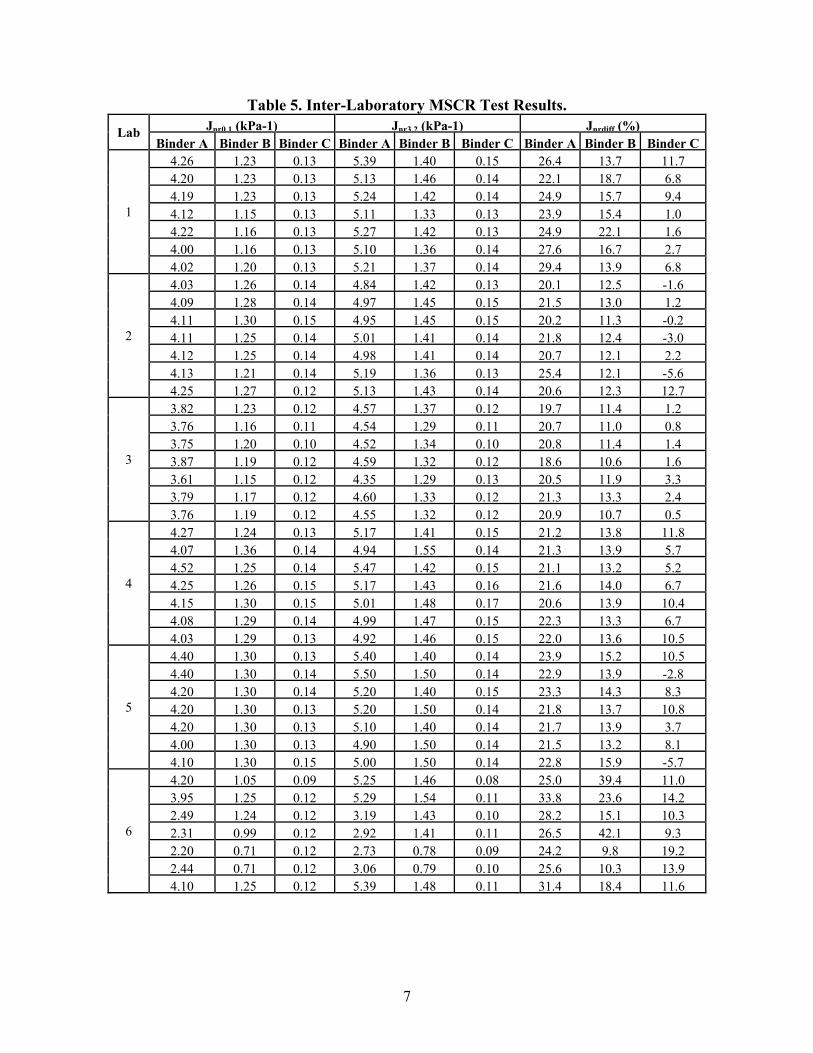
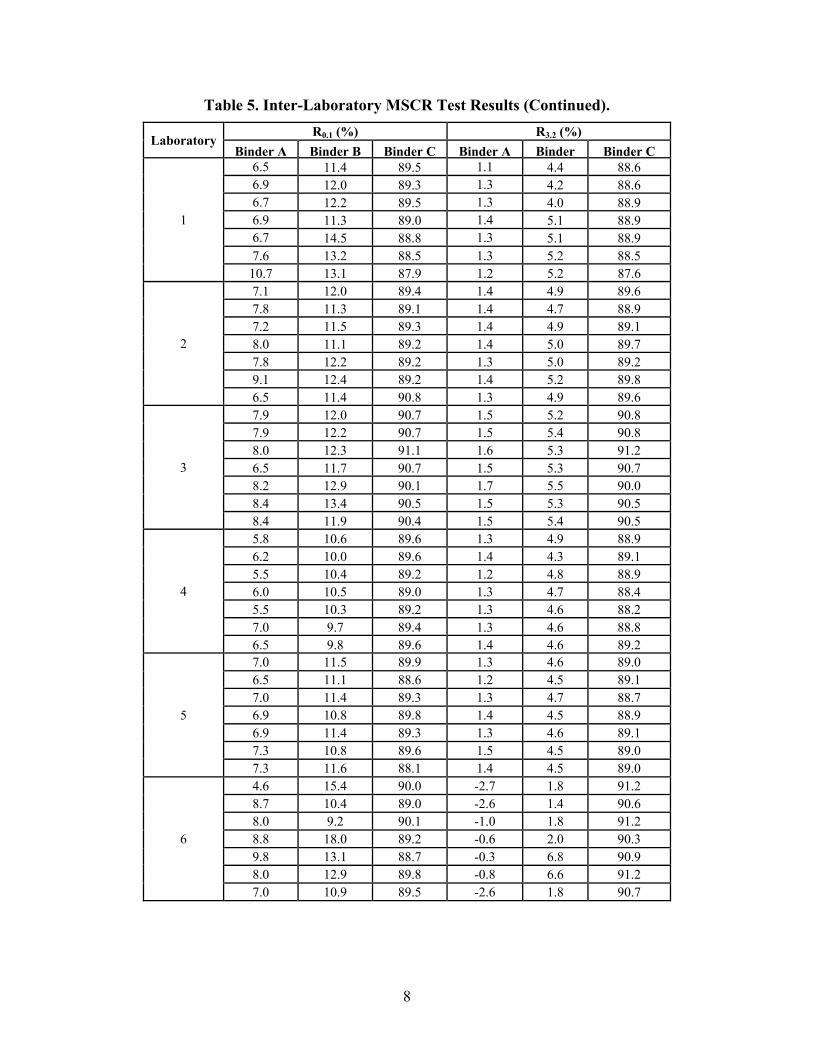
The reported test results include Jnr @ 0.1 kPa shear stress (Jnr0.1), Recovery @ 0.1 kPa shear stress (R0.1), Jnr @ 3.2 kPa shear stress (Jnr3.2), Recovery @ 3.2 kPa shear stress (R3.2), and Stress Sensitivity (JnrDiff). Detailed test results from each laboratory are presented in Table 5.
7
Table 5. Inter-Laboratory MSCR Test Results.
Lab Jnr0.1 (kPa-1) Jnr3.2 (kPa-1) Jnrdiff (%) Binder A Binder B Binder C Binder A Binder B Binder C Binder A Binder B Binder C
1
4.26 1.23 0.13 5.39 1.40 0.15 26.4 13.7 11.74.20 1.23 0.13 5.13 1.46 0.14 22.1 18.7 6.84.19 1.23 0.13 5.24 1.42 0.14 24.9 15.7 9.44.12 1.15 0.13 5.11 1.33 0.13 23.9 15.4 1.04.22 1.16 0.13 5.27 1.42 0.13 24.9 22.1 1.64.00 1.16 0.13 5.10 1.36 0.14 27.6 16.7 2.74.02 1.20 0.13 5.21 1.37 0.14 29.4 13.9 6.8
2
4.03 1.26 0.14 4.84 1.42 0.13 20.1 12.5 -1.64.09 1.28 0.14 4.97 1.45 0.15 21.5 13.0 1.24.11 1.30 0.15 4.95 1.45 0.15 20.2 11.3 -0.24.11 1.25 0.14 5.01 1.41 0.14 21.8 12.4 -3.04.12 1.25 0.14 4.98 1.41 0.14 20.7 12.1 2.24.13 1.21 0.14 5.19 1.36 0.13 25.4 12.1 -5.64.25 1.27 0.12 5.13 1.43 0.14 20.6 12.3 12.7
3
3.82 1.23 0.12 4.57 1.37 0.12 19.7 11.4 1.23.76 1.16 0.11 4.54 1.29 0.11 20.7 11.0 0.83.75 1.20 0.10 4.52 1.34 0.10 20.8 11.4 1.43.87 1.19 0.12 4.59 1.32 0.12 18.6 10.6 1.63.61 1.15 0.12 4.35 1.29 0.13 20.5 11.9 3.33.79 1.17 0.12 4.60 1.33 0.12 21.3 13.3 2.43.76 1.19 0.12 4.55 1.32 0.12 20.9 10.7 0.5
4
4.27 1.24 0.13 5.17 1.41 0.15 21.2 13.8 11.84.07 1.36 0.14 4.94 1.55 0.14 21.3 13.9 5.74.52 1.25 0.14 5.47 1.42 0.15 21.1 13.2 5.24.25 1.26 0.15 5.17 1.43 0.16 21.6 14.0 6.74.15 1.30 0.15 5.01 1.48 0.17 20.6 13.9 10.44.08 1.29 0.14 4.99 1.47 0.15 22.3 13.3 6.74.03 1.29 0.13 4.92 1.46 0.15 22.0 13.6 10.5
5
4.40 1.30 0.13 5.40 1.40 0.14 23.9 15.2 10.54.40 1.30 0.14 5.50 1.50 0.14 22.9 13.9 -2.84.20 1.30 0.14 5.20 1.40 0.15 23.3 14.3 8.34.20 1.30 0.13 5.20 1.50 0.14 21.8 13.7 10.84.20 1.30 0.13 5.10 1.40 0.14 21.7 13.9 3.74.00 1.30 0.13 4.90 1.50 0.14 21.5 13.2 8.14.10 1.30 0.15 5.00 1.50 0.14 22.8 15.9 -5.7
6
4.20 1.05 0.09 5.25 1.46 0.08 25.0 39.4 11.03.95 1.25 0.12 5.29 1.54 0.11 33.8 23.6 14.22.49 1.24 0.12 3.19 1.43 0.10 28.2 15.1 10.32.31 0.99 0.12 2.92 1.41 0.11 26.5 42.1 9.32.20 0.71 0.12 2.73 0.78 0.09 24.2 9.8 19.22.44 0.71 0.12 3.06 0.79 0.10 25.6 10.3 13.94.10 1.25 0.12 5.39 1.48 0.11 31.4 18.4 11.6
8
Table 5. Inter-Laboratory MSCR Test Results (Continued).
Laboratory R0.1 (%) R3.2 (%)
Binder A Binder B Binder C Binder A Binder Binder C
1
6.5 11.4 89.5 1.1 4.4 88.6 6.9 12.0 89.3 1.3 4.2 88.6 6.7 12.2 89.5 1.3 4.0 88.9 6.9 11.3 89.0 1.4 5.1 88.9 6.7 14.5 88.8 1.3 5.1 88.9 7.6 13.2 88.5 1.3 5.2 88.5
10.7 13.1 87.9 1.2 5.2 87.6
2
7.1 12.0 89.4 1.4 4.9 89.6 7.8 11.3 89.1 1.4 4.7 88.9 7.2 11.5 89.3 1.4 4.9 89.1 8.0 11.1 89.2 1.4 5.0 89.7 7.8 12.2 89.2 1.3 5.0 89.2 9.1 12.4 89.2 1.4 5.2 89.8 6.5 11.4 90.8 1.3 4.9 89.6
3
7.9 12.0 90.7 1.5 5.2 90.8 7.9 12.2 90.7 1.5 5.4 90.8 8.0 12.3 91.1 1.6 5.3 91.2 6.5 11.7 90.7 1.5 5.3 90.7 8.2 12.9 90.1 1.7 5.5 90.0 8.4 13.4 90.5 1.5 5.3 90.5 8.4 11.9 90.4 1.5 5.4 90.5
4
5.8 10.6 89.6 1.3 4.9 88.9 6.2 10.0 89.6 1.4 4.3 89.1 5.5 10.4 89.2 1.2 4.8 88.9 6.0 10.5 89.0 1.3 4.7 88.4 5.5 10.3 89.2 1.3 4.6 88.2 7.0 9.7 89.4 1.3 4.6 88.8 6.5 9.8 89.6 1.4 4.6 89.2
5
7.0 11.5 89.9 1.3 4.6 89.0 6.5 11.1 88.6 1.2 4.5 89.1 7.0 11.4 89.3 1.3 4.7 88.7 6.9 10.8 89.8 1.4 4.5 88.9 6.9 11.4 89.3 1.3 4.6 89.1 7.3 10.8 89.6 1.5 4.5 89.0 7.3 11.6 88.1 1.4 4.5 89.0
6
4.6 15.4 90.0 -2.7 1.8 91.2 8.7 10.4 89.0 -2.6 1.4 90.6 8.0 9.2 90.1 -1.0 1.8 91.2 8.8 18.0 89.2 -0.6 2.0 90.3 9.8 13.1 88.7 -0.3 6.8 90.9 8.0 12.9 89.8 -0.8 6.6 91.2 7.0 10.9 89.5 -2.6 1.8 90.7
9
Data Analysis
Following ASTM E691-11, the round robin test results were analyzed for each asphalt binder to develop information needed for a precision statement on MSCR test. The main tasks of this phase were to: 1) determine whether the collected data were consistent enough to form the basis for a test method precision statement, 2) investigate and act on any data considered inconsistent, and 3) obtain the precision statistics on which the precision statement can be based.
Consistency verification of the test results is important because the presence of outliers may lead to invalidation of the analysis. A simple one-way analysis of variance can check data consistency. For ease of analyzing the data, the results are represented in the form of a table where each row contains data from one laboratory for three binders and the columns contains the data obtained from all laboratories for a certain parameter. The data are then divided into cell statistics, intermediate statistics, precision statistics, and consistency statistics, as described in the following paragraphs. Note that Lab6 data were seriously deviated from others. Thus, Lab 6 was removed from the analysis. The test results for Labs 1-5 were used to conduct the inter-laboratory study analysis.
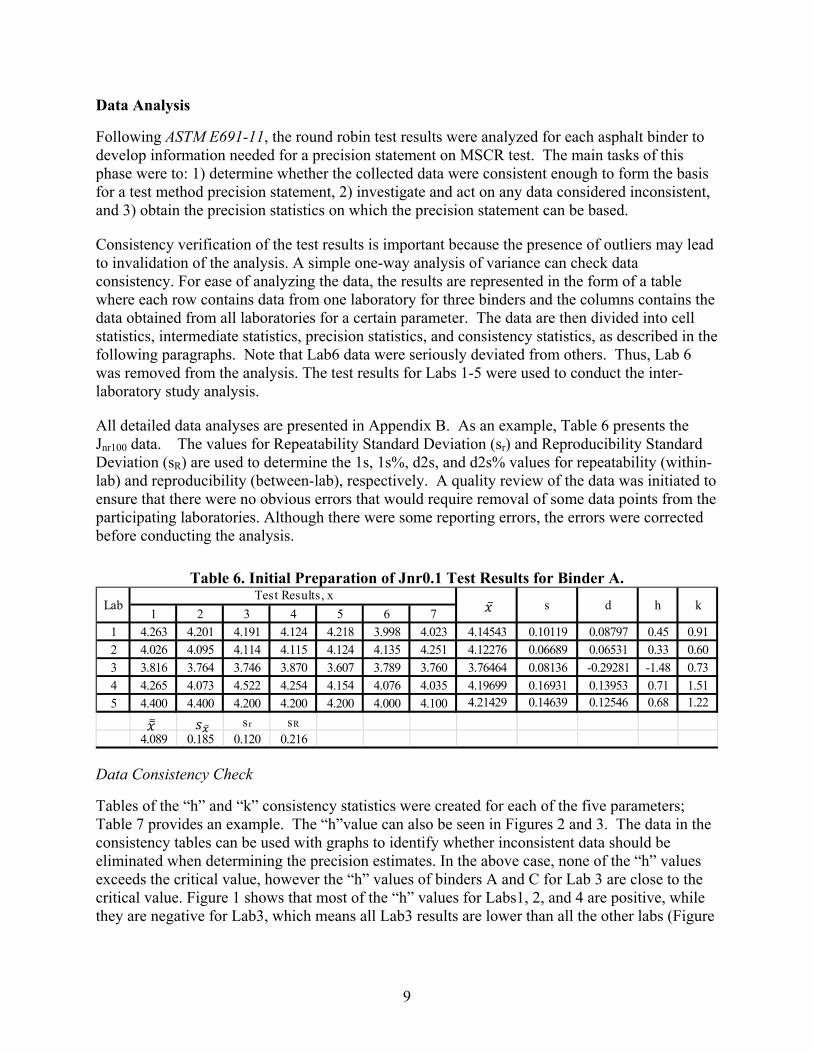
All detailed data analyses are presented in Appendix B. As an example, Table 6 presents the Jnr100 data. The values for Repeatability Standard Deviation (sr) and Reproducibility Standard Deviation (sR) are used to determine the 1s, 1s%, d2s, and d2s% values for repeatability (within-lab) and reproducibility (between-lab), respectively. A quality review of the data was initiated to ensure that there were no obvious errors that would require removal of some data points from the participating laboratories. Although there were some reporting errors, the errors were corrected before conducting the analysis.
Table 6. Initial Preparation of Jnr0.1 Test Results for Binder A.
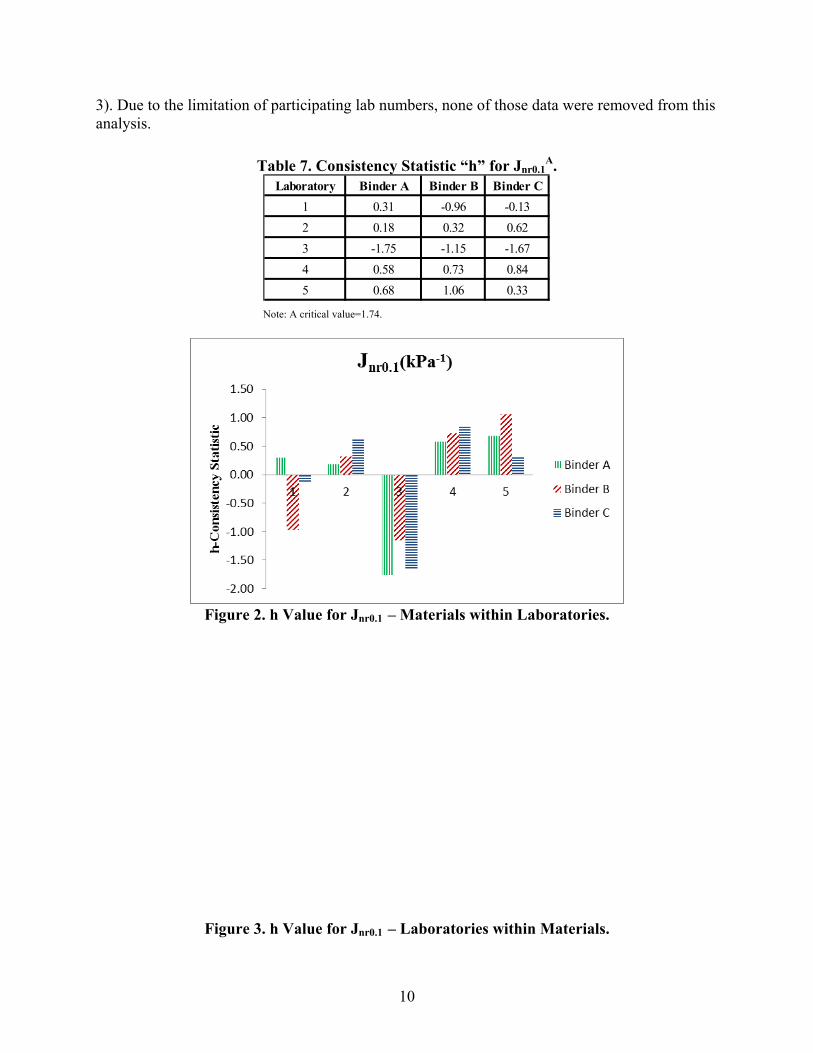
Data Consistency Check
Tables of the “h” and “k” consistency statistics were created for each of the five parameters; Table 7 provides an example. The “h”value can also be seen in Figures 2 and 3. The data in the consistency tables can be used with graphs to identify whether inconsistent data should be eliminated when determining the precision estimates. In the above case, none of the “h” values exceeds the critical value, however the “h” values of binders A and C for Lab 3 are close to the critical value. Figure 1 shows that most of the “h” values for Labs1, 2, and 4 are positive, while they are negative for Lab3, which means all Lab3 results are lower than all the other labs (Figure
1 2 3 4 5 6 7
1 4.263 4.201 4.191 4.124 4.218 3.998 4.023 4.14543 0.10119 0.08797 0.45 0.912 4.026 4.095 4.114 4.115 4.124 4.135 4.251 4.12276 0.06689 0.06531 0.33 0.60
3 3.816 3.764 3.746 3.870 3.607 3.789 3.760 3.76464 0.08136 -0.29281 -1.48 0.73
4 4.265 4.073 4.522 4.254 4.154 4.076 4.035 4.19699 0.16931 0.13953 0.71 1.51
5 4.400 4.400 4.200 4.200 4.200 4.000 4.100 4.21429 0.14639 0.12546 0.68 1.22
sr sR
4.089 0.185 0.120 0.216
LabTest Results, x
s d h k
10
3). Due to the limitation of participating lab numbers, none of those data were removed from this analysis.
Table 7. Consistency Statistic “h” for Jnr0.1A.
Note: A critical value=1.74.
Figure 2. h Value for Jnr0.1 – Materials within Laboratories.
Figure 3. h Value for Jnr0.1 – Laboratories within Materials.
Laboratory Binder A Binder B Binder C
1 0.31 -0.96 -0.13
2 0.18 0.32 0.62
3 -1.75 -1.15 -1.67
4 0.58 0.73 0.84
5 0.68 1.06 0.33
11
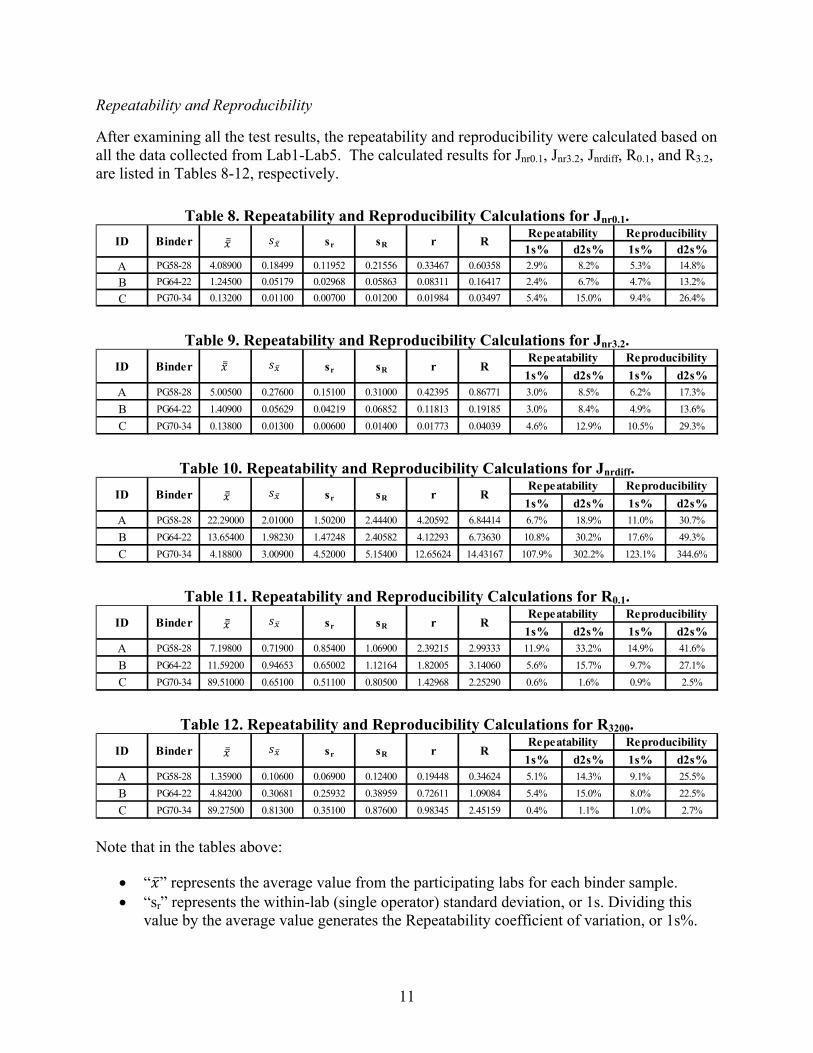
Repeatability and Reproducibility
After examining all the test results, the repeatability and reproducibility were calculated based on all the data collected from Lab1-Lab5. The calculated results for Jnr0.1, Jnr3.2, Jnrdiff, R0.1, and R3.2, are listed in Tables 8-12, respectively.
Table 8. Repeatability and Reproducibility Calculations for Jnr0.1.
Table 9. Repeatability and Reproducibility Calculations for Jnr3.2.
Table 10. Repeatability and Reproducibility Calculations for Jnrdiff.
Table 11. Repeatability and Reproducibility Calculations for R0.1.
Table 12. Repeatability and Reproducibility Calculations for R3200.
Note that in the tables above:
“ ” represents the average value from the participating labs for each binder sample. “sr” represents the within-lab (single operator) standard deviation, or 1s. Dividing this
value by the average value generates the Repeatability coefficient of variation, or 1s%.
1s% d2s% 1s% d2s%A PG58-28 4.08900 0.18499 0.11952 0.21556 0.33467 0.60358 2.9% 8.2% 5.3% 14.8%
B PG64-22 1.24500 0.05179 0.02968 0.05863 0.08311 0.16417 2.4% 6.7% 4.7% 13.2%
C PG70-34 0.13200 0.01100 0.00700 0.01200 0.01984 0.03497 5.4% 15.0% 9.4% 26.4%
ID Binder sr sR r RRepeatability Reproducibility
1s% d2s% 1s% d2s%A PG58-28 5.00500 0.27600 0.15100 0.31000 0.42395 0.86771 3.0% 8.5% 6.2% 17.3%
B PG64-22 1.40900 0.05629 0.04219 0.06852 0.11813 0.19185 3.0% 8.4% 4.9% 13.6%
C PG70-34 0.13800 0.01300 0.00600 0.01400 0.01773 0.04039 4.6% 12.9% 10.5% 29.3%
ID Binder sr sR r RRepeatability Reproducibility
1s% d2s% 1s% d2s%A PG58-28 22.29000 2.01000 1.50200 2.44400 4.20592 6.84414 6.7% 18.9% 11.0% 30.7%
B PG64-22 13.65400 1.98230 1.47248 2.40582 4.12293 6.73630 10.8% 30.2% 17.6% 49.3%
C PG70-34 4.18800 3.00900 4.52000 5.15400 12.65624 14.43167 107.9% 302.2% 123.1% 344.6%
ID Binder sr sR r RRepeatability Reproducibility
1s% d2s% 1s% d2s%A PG58-28 7.19800 0.71900 0.85400 1.06900 2.39215 2.99333 11.9% 33.2% 14.9% 41.6%
B PG64-22 11.59200 0.94653 0.65002 1.12164 1.82005 3.14060 5.6% 15.7% 9.7% 27.1%
C PG70-34 89.51000 0.65100 0.51100 0.80500 1.42968 2.25290 0.6% 1.6% 0.9% 2.5%
ID Binder sr sR r RRepeatability Reproducibility
1s% d2s% 1s% d2s%A PG58-28 1.35900 0.10600 0.06900 0.12400 0.19448 0.34624 5.1% 14.3% 9.1% 25.5%
B PG64-22 4.84200 0.30681 0.25932 0.38959 0.72611 1.09084 5.4% 15.0% 8.0% 22.5%
C PG70-34 89.27500 0.81300 0.35100 0.87600 0.98345 2.45159 0.4% 1.1% 1.0% 2.7%
sR r RRepeatability Reproducibility
ID Binder sr
12
Multiplying sr by 2.8 generates the acceptable range of two test results under repeatability conditions, or d2s. Dividing this product by the average value results in the d2s%.
“sR” represents the between-lab standard deviation, or 1s. Dividing this value by the average value generates the Reproducibility coefficient of variation, or 1s%. Multiplying sR by 2.8 generates the acceptable range of two test results under reproducibility conditions, or d2s. Dividing this product by the average value results in the d2s%.
Summary of the MSCR Inter-Laboratory Test
Based on the test results presented above, the following conclusions are offered:
Both Jnr0.1 and Jnr3.2 results are very repeatable and reproducible. Both Jnrdiff and R0.1 have pretty high variability. As shown in Table 2, Jnrdiff is one of the
parameters for grading asphalt binder. Therefore, cautions should be exercised when applying the MSCR specification.
The R3.2 results are acceptable in terms of repeatability and reproducibility.
ASPHALT BINDER RANKING BASED ON JNR AND G*/SIN CRITERIA
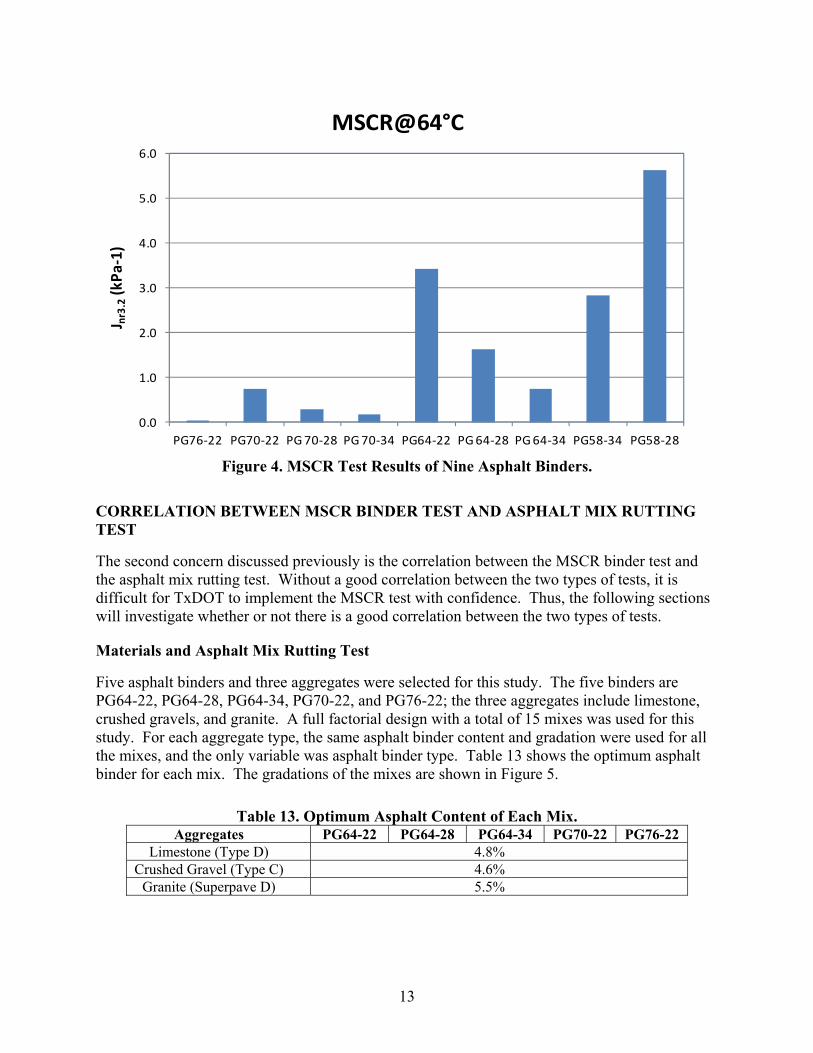
Nine asphalt binders ranging from the softest (PG58-34) to the hardest (PG76-22) were selected for this comparison. Both the MSCR and PG grading tests were performed at 64°C, which is the temperature pavements experience in Texas, based on AASHTO TP70. Figure 4 shows the test results. It is clear that both Jnr and G*/sin criteria provide the same overall ranking from the most rutting resistant to the least: PG76-XX, PG70-XX, PG64-XX, and PG58-XX. The advantage of the MSCR test is to consider the influence of recoverable deformation on rutting resistance. For example, PG64-34 has better rutting performance than PG64-28, followed by PG64-22. The difference among the binders with the same high temperature PG cannot be identified by current G*/sin based specification. Therefore, Jnr is overall better than G*/sin . The MSCR test results also clearly showed the significant benefit of using softer, highly modified binder to improve asphalt binder rutting resistance. However, it is necessary to evaluate how much the improvement in asphalt binder can be transferred into the rutting resistance of asphalt mixes, because it is the asphalt mix (asphalt binder and aggregates) rather than asphalt binder alone that is paved on the road. The following section investigates the rutting resistance of these softer, modified binders in the asphalt mixes and the correlation between Jnr and asphalt mix rutting test results.
13
Figure 4. MSCR Test Results of Nine Asphalt Binders.
CORRELATION BETWEEN MSCR BINDER TEST AND ASPHALT MIX RUTTING TEST
The second concern discussed previously is the correlation between the MSCR binder test and the asphalt mix rutting test. Without a good correlation between the two types of tests, it is difficult for TxDOT to implement the MSCR test with confidence. Thus, the following sections will investigate whether or not there is a good correlation between the two types of tests.
Materials and Asphalt Mix Rutting Test
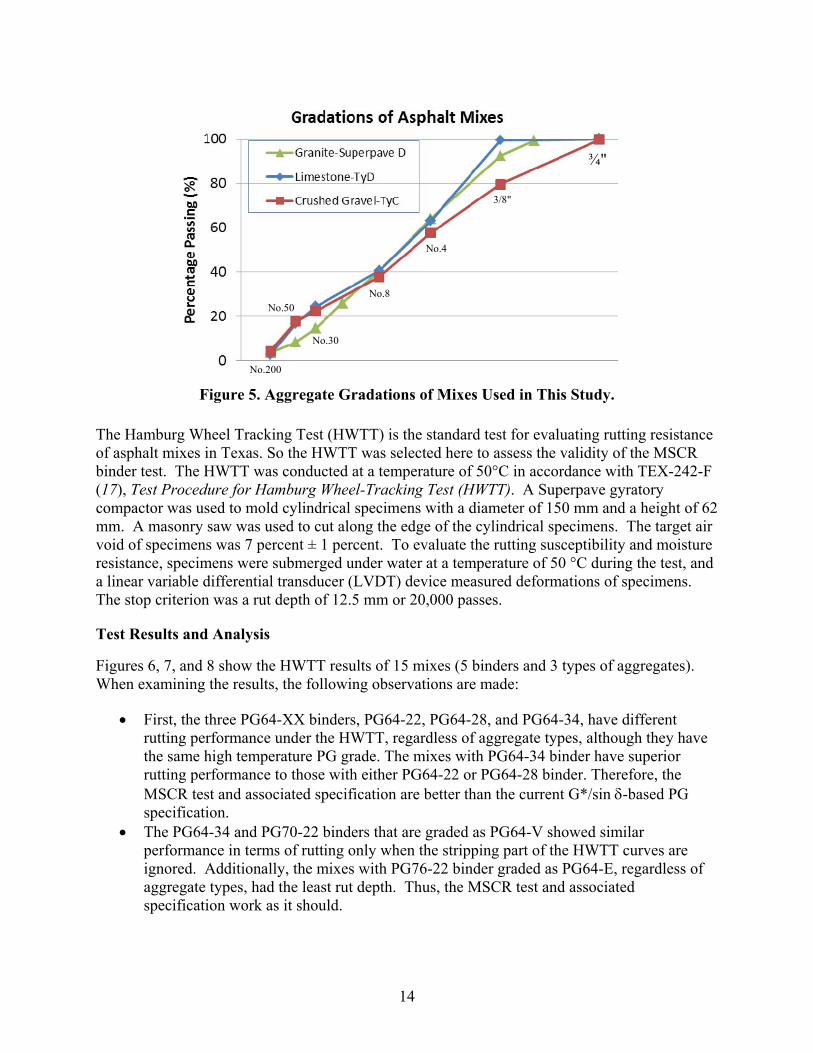
Five asphalt binders and three aggregates were selected for this study. The five binders are PG64-22, PG64-28, PG64-34, PG70-22, and PG76-22; the three aggregates include limestone, crushed gravels, and granite. A full factorial design with a total of 15 mixes was used for this study. For each aggregate type, the same asphalt binder content and gradation were used for all the mixes, and the only variable was asphalt binder type. Table 13 shows the optimum asphalt binder for each mix. The gradations of the mixes are shown in Figure 5.
Table 13. Optimum Asphalt Content of Each Mix. Aggregates PG64-22 PG64-28 PG64-34 PG70-22 PG76-22
Limestone (Type D) 4.8% Crushed Gravel (Type C) 4.6%
Granite (Superpave D) 5.5%
0.0
1.0
2.0
3.0
4.0
5.0
6.0
PG76‐22 PG70‐22 PG 70‐28 PG 70‐34 PG64‐22 PG 64‐28 PG 64‐34 PG58‐34 PG58‐28
J nr3.2(kPa‐1)
MSCR@64°C
14
Figure 5. Aggregate Gradations of Mixes Used in This Study.
The Hamburg Wheel Tracking Test (HWTT) is the standard test for evaluating rutting resistance of asphalt mixes in Texas. So the HWTT was selected here to assess the validity of the MSCR binder test. The HWTT was conducted at a temperature of 50°C in accordance with TEX-242-F (17), Test Procedure for Hamburg Wheel-Tracking Test (HWTT). A Superpave gyratory compactor was used to mold cylindrical specimens with a diameter of 150 mm and a height of 62 mm. A masonry saw was used to cut along the edge of the cylindrical specimens. The target air void of specimens was 7 percent ± 1 percent. To evaluate the rutting susceptibility and moisture resistance, specimens were submerged under water at a temperature of 50 °C during the test, and a linear variable differential transducer (LVDT) device measured deformations of specimens. The stop criterion was a rut depth of 12.5 mm or 20,000 passes.
Test Results and Analysis
Figures 6, 7, and 8 show the HWTT results of 15 mixes (5 binders and 3 types of aggregates). When examining the results, the following observations are made:
First, the three PG64-XX binders, PG64-22, PG64-28, and PG64-34, have different rutting performance under the HWTT, regardless of aggregate types, although they have the same high temperature PG grade. The mixes with PG64-34 binder have superior rutting performance to those with either PG64-22 or PG64-28 binder. Therefore, the MSCR test and associated specification are better than the current G*/sin -based PG specification.
The PG64-34 and PG70-22 binders that are graded as PG64-V showed similar performance in terms of rutting only when the stripping part of the HWTT curves are ignored. Additionally, the mixes with PG76-22 binder graded as PG64-E, regardless of aggregate types, had the least rut depth. Thus, the MSCR test and associated specification work as it should.
¾"
3/8"
No.4
No.8
No.30
No.50
No.200
15
There is not much difference in rutting performance between the mixes with PG64-22 and PG64-28 binders, which seems to prove that the current G*/sin -based PG specification works just fine.
In summary, it seems that the MSCR test and associated specification works better than the current G*/sin -based PG specification. However, some caution should be exercised when grading the slightly modified asphalt binders (such as PG64-28).
Figure 6. HWTT Results of Gravel Mixes with Five Binders.
16
Figure 7. HWTT Results of Limestone Mixes with Five Binders.
Figure 8. HWTT Results of Granite Mixes with Five Binders.
CONCLUSIONS AND RECOMMENDATION
This chapter evaluated the MSCR test with a focus on its repeatability and the validity of differentiating rutting performance of five types of asphalt binders. Based on the research results obtained previously, the following conclusions and recommendation are offered:
17
MSCR Round Robin results among five laboratories clearly indicated that both Jnr0.1 and Jnr3.2 results are very repeatable and reproducible. But both Jnrdiff and R0.1 have pretty high variability. Since Jnrdiff is one of the parameters for grading asphalt binder, caution should be exercised when applying the MSCR specification. The R3.2 results are acceptable in terms of repeatability and reproducibility.
Asphalt mix rutting test results showed that that the MSCR test and associated specification works better than the current G*/sin -based PG specification, especially for those highly modified asphalt binders (such as PG64-34). However, some caution should be exercised when grading the slightly modified asphalt binders (such as PG64-28).
Based on the laboratory test results, the research team recommends that TxDOT implement the MSCR test and associated specification.
Certainly, the above conclusions and recommendation still need to be validated through field test sections constructed at different environments and traffic conditions.

19
CHAPTER 3 IDENTIFICATION OF SIMPLE FRACTURE TESTS FOR ASPHALT
BINDERS
INTRODUCTION
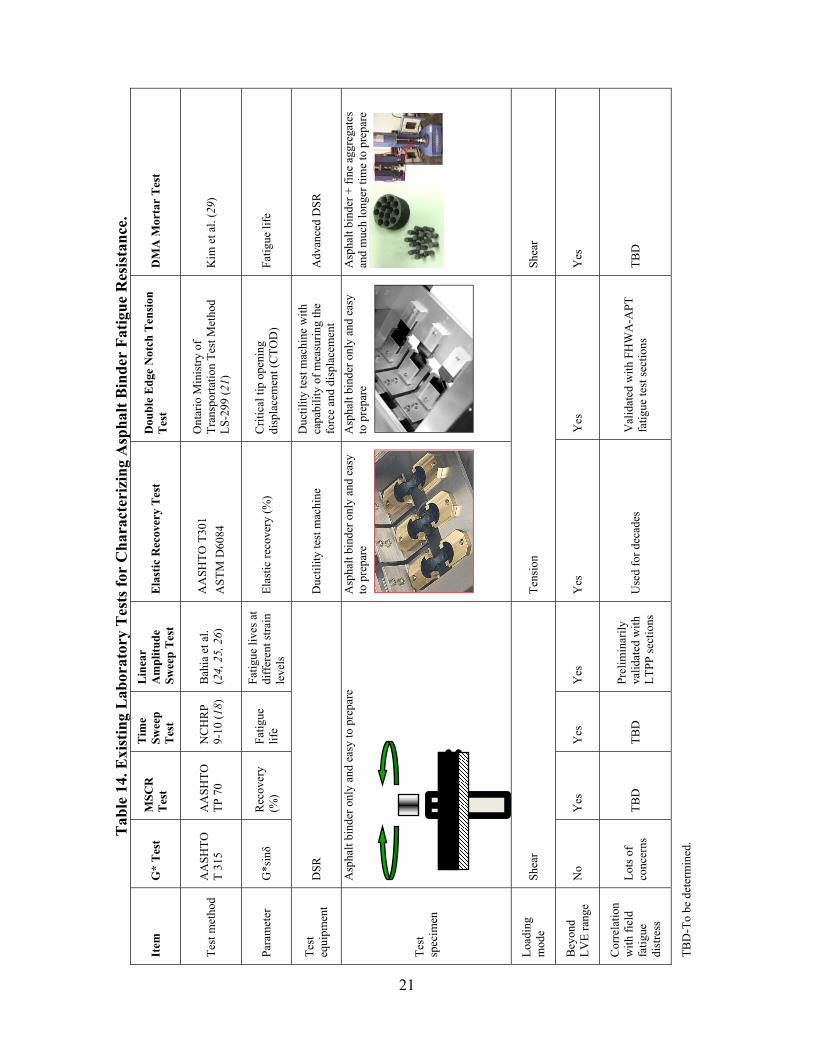
The current asphalt binder PG specification was developed based on the SHRP asphalt program, and it was based primarily on the study of unmodified asphalt binders. It has long been known that the weakest part of the PG specification is the fatigue cracking parameter and associated criteria. The current PG binder specification employs parameter G*sinδ to quantify asphalt binder fatigue resistance. Many studies have questioned the parameter G*sinδ (18-22). Parameter G* sinδ is a binder stiffness parameter and is measured under relatively small strain conditions at a fixed frequency (10 rad/s) and only a few cycles of loading without damage, which is significantly different from the very complicated fatigue phenomenon that features much more cycles of loading and fatigue damage. To address this issue, many highway agencies adopted the elastic-recovery test to identify the existence of polymers in the modified binder and to enhance the current PG fatigue parameter, which is often called the PG Plus specification. Meanwhile, substantial research has been made to develop/identify a new asphalt binder fatigue test. Table 14 summarizes existing binder fatigue test methods and associated features for each method. Overall, there are four major developments in terms of asphalt binder fatigue test:
1. Linear amplitude sweep test: Bahia et al. initially proposed using DSR in a repeated constant strain/stress mode (or time sweep) to characterize the fatigue behavior of asphalt binders in 2001 (18). The proposed procedure is conceptually sound but not without its flaws. Anderson et al. found that the DSR-based time sweep test was not suitable for characterizing the fatigue behavior because of unstable flow and edge fracture effects in some cases (23). Most recently, Bahia and his associates developed a new, promising test named the linear amplitude sweep (LAS) test (24, 25,26). The LAS test results correlated fairly well with LTPP field fatigue cracking data (25, 26).
2. Multiple stress creep recovery test: The MSCR test was developed mainly for characterizing rutting resistance of asphalt binders (13, 14), but the MSCR recovery can be potentially used as one parameter to evaluate the delayed elastic response of asphalt binder. PG plus tests with a similar purpose such as elastic recovery could be replaced if MSCR recovery correlates well with fatigue resistance.
3. Double edged notched tension (DENT) test: Researchers at Queen’s University initially proposed evaluation of the energy needed for fracturing ductile materials to get a measure of the fatigue cracking resistance of asphalt binders (27). It is a ductility tension test, but the sample is notched on two edges. Most recently, researchers at the Federal Highway Administration (FHWA) employed the DENT test to characterize the binders used in the FHWA accelerated loading facility (ALF) fatigue test lanes, and found very good rank-correlation between the DENT test results and the observed fatigue cracking under ALF loading (28).
4. Dynamic mechanical analysis (DMA) mortar test: Kim et al. used the DMA mortar test to characterize binder fatigue and healing potential of asphalt binders (29). Different from other tests in which the sample is asphalt binder only, the DMA mortar test uses asphalt mastic made of asphalt binder and sands or fine aggregates (30).
20
One of the good features of using the DMA mortar test for characterizing binder fatigue is to clearly define fatigue failure and avoid the unstable flow and edge fracture effect. The downside of the DMA mortar test is the influence of sand or fine aggregates on asphalt binder fatigue resistance. This is especially true when the test is to serve the purpose of a binder purchase specification. More discussion on the DMA fatigue cracking test is provided in Chapter 4. Therefore, this chapter evaluates all existing and the latest asphalt binder fatigue tests and compares them with asphalt mix fatigue cracking test data. Based on the comparisons, a simple and promising fatigue test for asphalt binders is recommended at the end of this chapter.
OBJECTIVES
The objectives of this study were to 1) evaluate the fatigue resistance of various binders (unmodified and modified), 2) verify the binder test results through two fatigue tests (Overlay Test and push-pull fatigue test) of asphalt mixes containing the same binders, and 3) identify a simple and promising asphalt binder fatigue test.
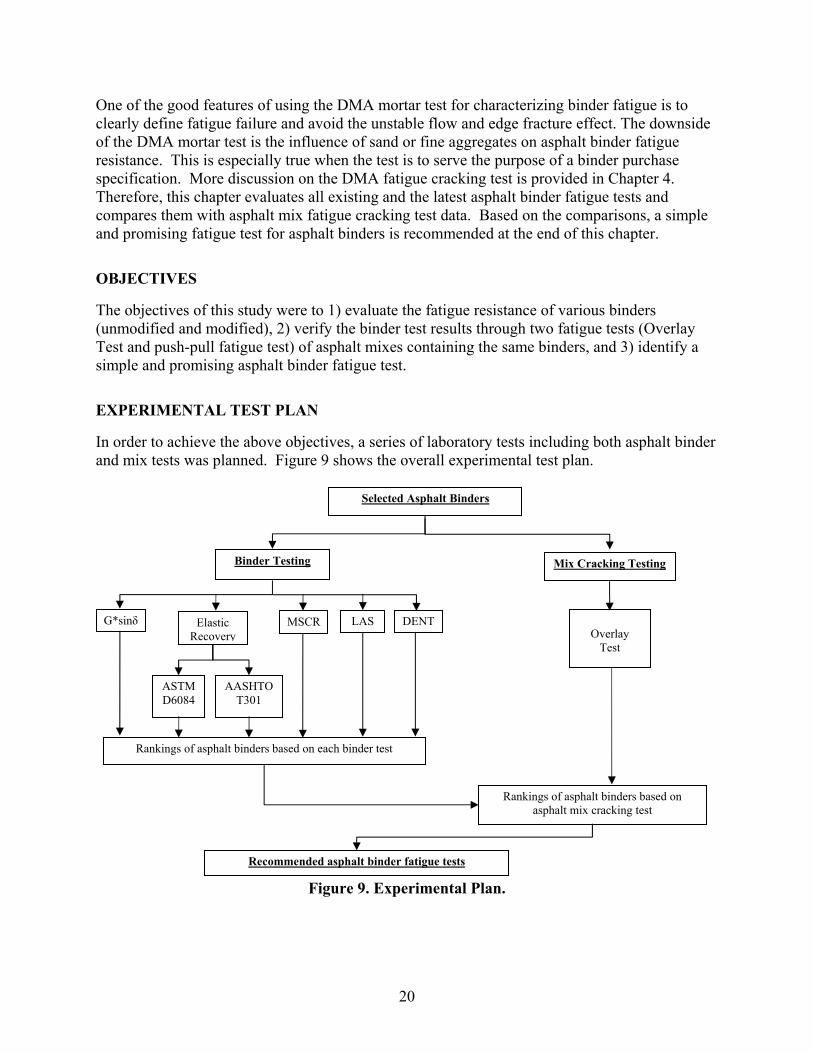
EXPERIMENTAL TEST PLAN
In order to achieve the above objectives, a series of laboratory tests including both asphalt binder and mix tests was planned. Figure 9 shows the overall experimental test plan.
Figure 9. Experimental Plan.
Selected Asphalt Binders
Binder Testing Mix Cracking Testing
Elastic Recovery
MSCR Overlay
Test
Rankings of asphalt binders based on each binder test
Recommended asphalt binder fatigue tests
AASHTO T301
ASTM D6084
LAS DENT G*sinδ
Rankings of asphalt binders based on asphalt mix cracking test
21
Tab
le 1
4. E
xist
ing
Lab
orat
ory
Tes
ts f
or C
har
acte
rizi
ng
Asp
hal
t B
ind
er F
atig
ue
Res
ista
nce
.
Item
G
* T
est
MS
CR
T
est
Tim
e Sw
eep
Tes
t
Lin
ear
Am
pli
tud
e Sw
eep
Tes
t E
last
ic R
ecov
ery
Tes
t D
oub
le E
dge
Not
ch T
ensi
on
Tes
t D
MA
Mor
tar
Tes
t
Tes
t met
hod
AA
SH
TO
T
315
A
AS
HT
O
TP
70
NC
HR
P
9-10
(18
) B
ahia
et a
l. (2
4, 2
5, 2
6)
AA
SH
TO
T30
1
AS
TM
D60
84
Ont
ario
Min
istr
y of
T
rans
port
atio
n T
est M
etho
d L
S-2
99 (
21)
Kim
et a
l. (2
9)
Para
met
er
G*s
inδ
Rec
over
y (%
)
Fat
igue
li
fe
Fati
gue
live
s at
di
ffer
ent s
trai
n le
vels
E
last
ic r
ecov
ery
(%)
Cri
tica
l tip
ope
ning
di
spla
cem
ent (
CT
OD
)
Fati
gue
life
Tes
t eq
uipm
ent
DSR
D
ucti
lity
test
mac
hine
D
ucti
lity
test
mac
hine
wit
h ca
pabi
lity
of m
easu
ring
the
forc
e an
d di
spla
cem
ent
Adv
ance
d D
SR
Tes
t sp
ecim
en
Asp
halt
bin
der
only
and
eas
y to
pre
pare
Asp
halt
bin
der
only
and
eas
y to
pre
pare
Asp
halt
bin
der
only
and
eas
y to
pre
pare
Asp
halt
bin
der
+ f
ine
aggr
egat
es
and
muc
h lo
nger
tim
e to
pre
pare
Loa
ding
m
ode
Shea
r T
ensi
on
Shea
r
Bey
ond
LV
E r
ange
N
o Y
es
Yes
Y
es
Yes
Y
es
Yes
Cor
rela
tion
w
ith
fiel
d fa
tigu
e di
stre
ss
Lot
s of
co
ncer
ns
TB
D
TB
D
Prel
imin
arily
va
lida
ted
wit
h L
TP
P s
ectio
ns
Use
d fo
r de
cade
s V
alid
ated
with
FH
WA
-APT
fa
tigue
test
sec
tion
s T
BD
TB
D-T
o be
det
erm
ined
.
22
ASPHALT BINDERS, TESTS, RESULTS, AND ANALYSIS
Asphalt Binders
The same five asphalt binders used for the MSCR test evaluation in Chapter 2 were employed here. They are PG64-22, PG64-28, PG64-34, PG70-22, and PG76-22. Except for the PG64-22 binder, the other four binders are polymer modified binders.
Asphalt Binder Testing
A total of five tests were performed in this study. Detailed information is described below.
PG Grading Test
The six asphalt binders were tested following the American Association of State Highway and Transportation Officials T315 “Determining the Rheological Properties of Asphalt Binder Using a Dynamic Shear Rheometer (DSR)” and T313 “Determining the Flexural Creep Stiffness of Asphalt Binder Using the Bending Beam Rheometer (BBR).”
Elastic Recovery Test
The elastic recovery test is conducted using the ductility device following TxDOT’s elastic recovery test, which is a modified version of American Society for Testing and Materials (ASTM) D6084 Method A “Standard Test Method for Elastic Recovery of Bituminous Materials by Ductilometer.” The major difference between TxDOT’s method and the ASTM D6084 is the test temperature. TxDOT’s test method requires performing the elastic recovery test at 50°F (10°C) rather than 77°F (25°C) at the ASTM specification. Another difference is that TxDOT uses original asphalt binder for the elastic recovery test.
In the elastic recovery test, the binder specimens were pulled apart in a ductilometer and held after reaching a specified elongation. The specimens were then cut in the middle of the elongation and the percent recovery of each specimen was determined.
MSCR Test
The MSCR test is conducted using the DSR following AASHTO TP70 “Multiple Stress Creep Recovery (MSCR) Test of Asphalt Binder Using a Dynamic Shear Rheometer (DSR).” Each RTFO-aged specimen was tested at the same temperature of 64°C. It is hypothesized that the higher the degree of elastic recovery under the MSCR test, the binder is more fatigue resistance. This hypothesis will be tested here by comparing the ranking of binder recovery to the ranking of the asphalt mix fatigue characteristics measured under the push-pull fatigue test.
LAS Test
The LAS test, compared to the time sweep test, is an accelerated method test and it uses the DSR with the standard 8 mm parallel plate geometry. Either RTFO- or pressure aging vessel (PAV)-aged asphalt binder can be used. Basically the LAS test determines two parameters (a and b) of asphalt binder fatigue law (Nf =a×γmax
b). As noted by Bahia and his associates (24-26), the LAS
23
test consists of two steps: a frequency sweep test and an amplitude sweep test. The frequency sweep test at very low strain amplitude of 0.1% is used to obtain undamaged material properties and accordingly the parameter b of the fatigue law. The amplitude sweep test with a series of cyclic loads at systematically linearly increasing strain amplitudes at a constant frequency of 10 Hz is used to determine the parameter a of the fatigue law through the viscoelastic continuum damage (VECD) mechanics analysis. For the linear amplitude sweep test, loading begins with 100 cycles of sinusoidal loading at 0.1%. Each successive loading step consists of 100 cycles at a rate of increase of 1% applied strain until reaching 30% applied strain (25). Note that the combination of the frequency and amplitude sweeps tests takes approximately 10 min plus conditioning time. Bahia and his associates reported that the LAS test results have a good correlation with the fatigue data of LTPP test sections (25).
Specifically for this study the PAV-aged specimens with two replicates were used for each binder, and the LAS test was conducted at 77°F (25°C). The test data were analyzed using an Excel© macro provided by Bahia’s group, and the two parameters a and b were automatically calculated. The results presented later are the average value of the two replicates.
DENT Test
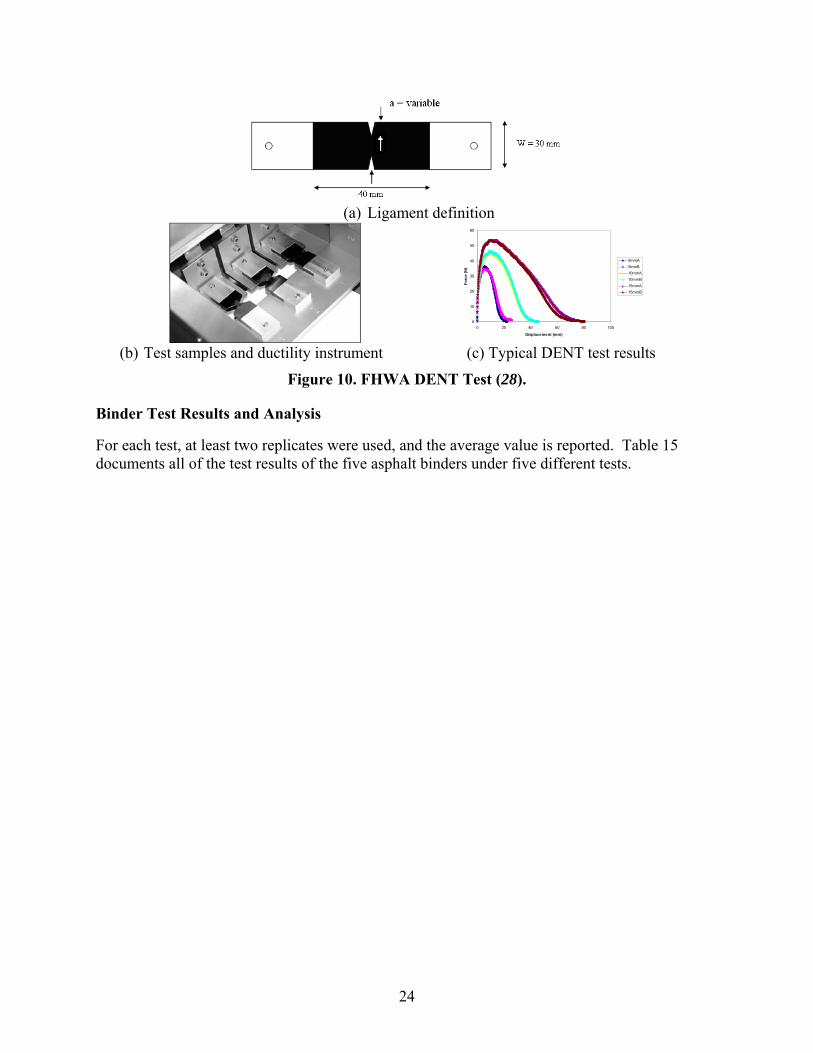
The DENT test and the calculated critical tip opening displacement (CTOD) were originally developed at Queen’s University of Canada (27). Recently, FHWA made some minor changes relative to the Ontario Ministry of Transportation test method for more southern conditions and developed a draft method in AASHTO format (28). Basically, it is believed that the energy needed for fracturing ductile materials consists of two parts: an essential portion of work performed in the local region of the advancing crack creating two surfaces and non-essential work away from the local region of cracking/tearing associated with ductility, plasticity and yielding. To determine the essential work of fracture and the CTOD, the DENT test is performed using similar specimens with different ligament lengths (such as 5, 10, 15 mm). Figure 10 shows a schematic of the sample in the DENT test defining ligament length, the test samples in a force-ductility instrument, and typical test results. Gibson et al. reported that the parameter CTOD relates extremely well with the FHWA-ALF fatigue test results (28). Large CTOD test results indicate better fatigue resistance.
For this study, the DENT test was conducted at 77°F (25°C) for all six asphalt binders with the PAV-aged specimens and two replicates used for each asphalt binder. The results reported later are the average values of the two replicates.
24
(a) Ligament definition
(b) Test samples and ductility instrument (c) Typical DENT test results
Figure 10. FHWA DENT Test (28).
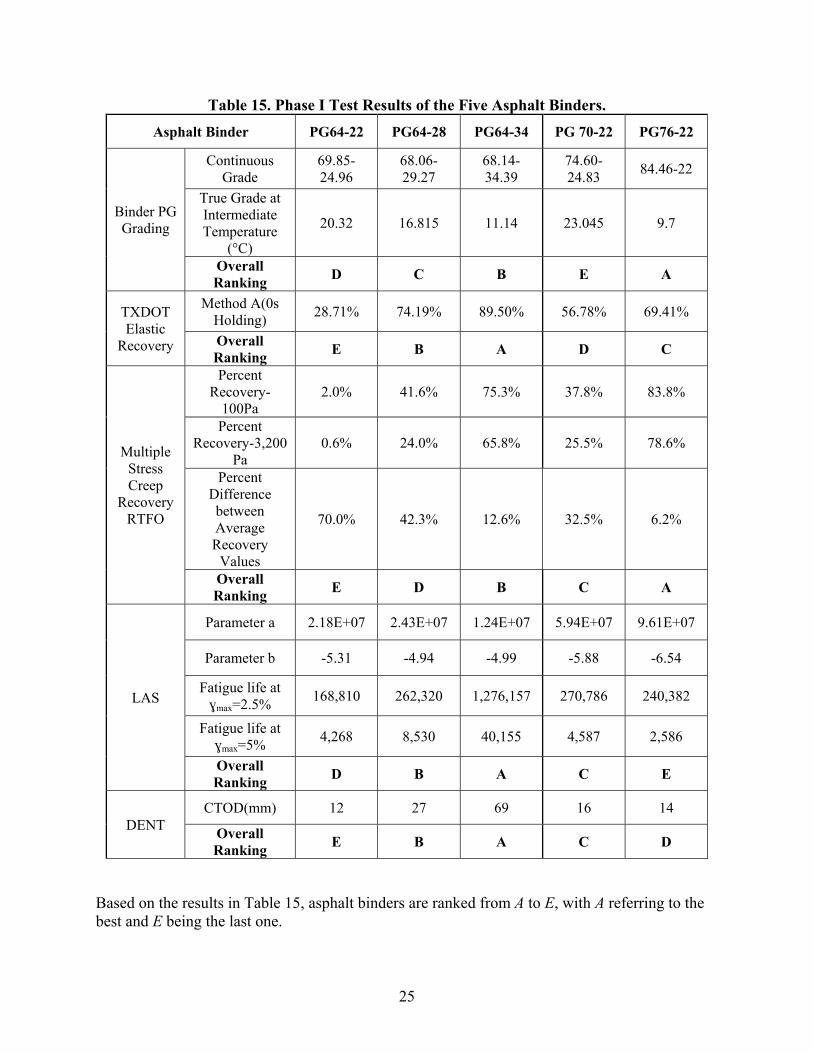
Binder Test Results and Analysis
For each test, at least two replicates were used, and the average value is reported. Table 15 documents all of the test results of the five asphalt binders under five different tests.
0
10
20
30
40
50
60
0 20 40 60 80 100
Displacement (mm)
Fo
rce
(N)
5mmA
5mmB
10mmA
10mmB
15mmA
15mmB
25
Table 15. Phase I Test Results of the Five Asphalt Binders.
Asphalt Binder PG64-22 PG64-28 PG64-34 PG 70-22 PG76-22
Binder PG Grading
Continuous Grade
69.85-24.96
68.06-29.27
68.14-34.39
74.60-24.83
84.46-22
True Grade at Intermediate Temperature
(°C)
20.32 16.815 11.14 23.045 9.7
Overall Ranking
D C B E A
TXDOT Elastic
Recovery
Method A(0s Holding)
28.71% 74.19% 89.50% 56.78% 69.41%
Overall Ranking
E B A D C
Multiple Stress Creep
Recovery RTFO
Percent Recovery-
100Pa 2.0% 41.6% 75.3% 37.8% 83.8%
Percent Recovery-3,200
Pa 0.6% 24.0% 65.8% 25.5% 78.6%
Percent Difference between Average Recovery
Values
70.0% 42.3% 12.6% 32.5% 6.2%
Overall Ranking
E D B C A
LAS
Parameter a 2.18E+07 2.43E+07 1.24E+07 5.94E+07 9.61E+07
Parameter b -5.31 -4.94 -4.99 -5.88 -6.54
Fatigue life at ɣmax=2.5%
168,810 262,320 1,276,157 270,786 240,382
Fatigue life at ɣmax=5%
4,268 8,530 40,155 4,587 2,586
Overall Ranking
D B A C E
DENT CTOD(mm) 12 27 69 16 14
Overall Ranking
E B A C D
Based on the results in Table 15, asphalt binders are ranked from A to E, with A referring to the best and E being the last one.
26
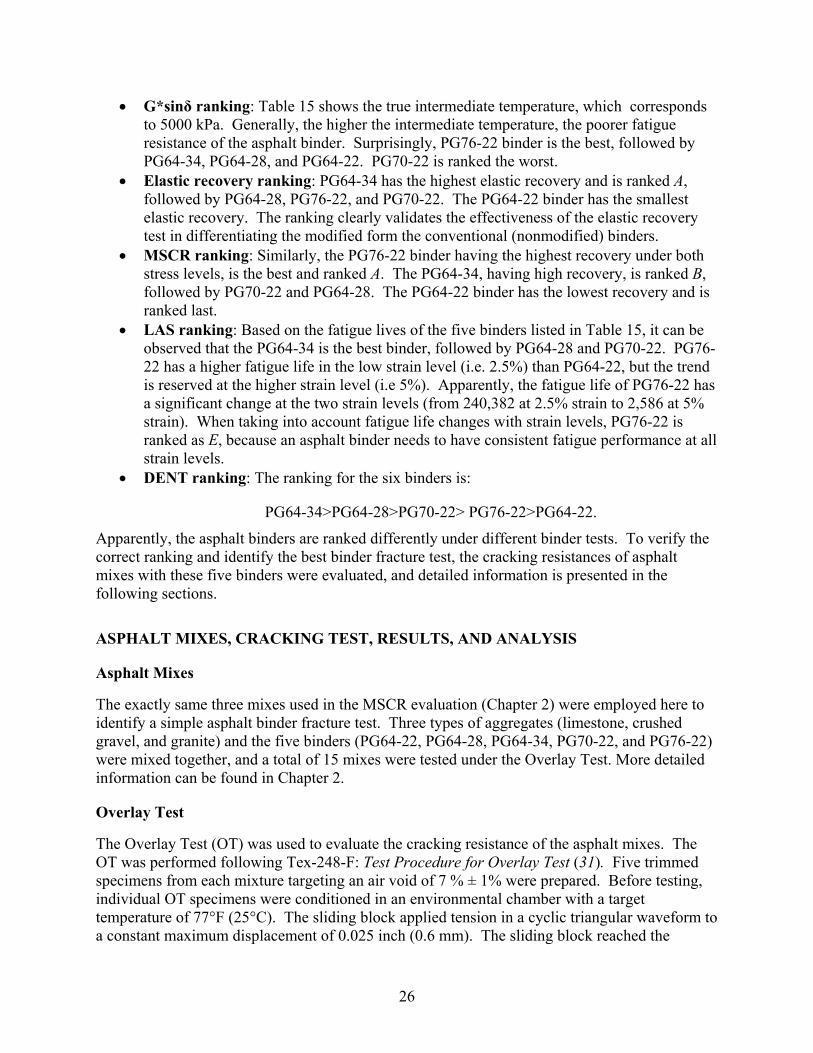
G*sinδ ranking: Table 15 shows the true intermediate temperature, which corresponds to 5000 kPa. Generally, the higher the intermediate temperature, the poorer fatigue resistance of the asphalt binder. Surprisingly, PG76-22 binder is the best, followed by PG64-34, PG64-28, and PG64-22. PG70-22 is ranked the worst.
Elastic recovery ranking: PG64-34 has the highest elastic recovery and is ranked A, followed by PG64-28, PG76-22, and PG70-22. The PG64-22 binder has the smallest elastic recovery. The ranking clearly validates the effectiveness of the elastic recovery test in differentiating the modified form the conventional (nonmodified) binders.
MSCR ranking: Similarly, the PG76-22 binder having the highest recovery under both stress levels, is the best and ranked A. The PG64-34, having high recovery, is ranked B, followed by PG70-22 and PG64-28. The PG64-22 binder has the lowest recovery and is ranked last.
LAS ranking: Based on the fatigue lives of the five binders listed in Table 15, it can be observed that the PG64-34 is the best binder, followed by PG64-28 and PG70-22. PG76-22 has a higher fatigue life in the low strain level (i.e. 2.5%) than PG64-22, but the trend is reserved at the higher strain level (i.e 5%). Apparently, the fatigue life of PG76-22 has a significant change at the two strain levels (from 240,382 at 2.5% strain to 2,586 at 5% strain). When taking into account fatigue life changes with strain levels, PG76-22 is ranked as E, because an asphalt binder needs to have consistent fatigue performance at all strain levels.
DENT ranking: The ranking for the six binders is:
PG64-34>PG64-28>PG70-22> PG76-22>PG64-22.
Apparently, the asphalt binders are ranked differently under different binder tests. To verify the correct ranking and identify the best binder fracture test, the cracking resistances of asphalt mixes with these five binders were evaluated, and detailed information is presented in the following sections.
ASPHALT MIXES, CRACKING TEST, RESULTS, AND ANALYSIS
Asphalt Mixes
The exactly same three mixes used in the MSCR evaluation (Chapter 2) were employed here to identify a simple asphalt binder fracture test. Three types of aggregates (limestone, crushed gravel, and granite) and the five binders (PG64-22, PG64-28, PG64-34, PG70-22, and PG76-22) were mixed together, and a total of 15 mixes were tested under the Overlay Test. More detailed information can be found in Chapter 2.
Overlay Test
The Overlay Test (OT) was used to evaluate the cracking resistance of the asphalt mixes. The OT was performed following Tex-248-F: Test Procedure for Overlay Test (31). Five trimmed specimens from each mixture targeting an air void of 7 % ± 1% were prepared. Before testing, individual OT specimens were conditioned in an environmental chamber with a target temperature of 77°F (25°C). The sliding block applied tension in a cyclic triangular waveform to a constant maximum displacement of 0.025 inch (0.6 mm). The sliding block reached the
27
maximum displacement and then returned to its initial position in 10 sec. The time, displacement, and load corresponding to a certain number of loading cycles were recorded during the tests. The number of cycles to failure is determined for each specimen when the maximum load reaches 7 percent of the initial maximum load recorded in the first cycle. The average of the OT cycles of five specimens is reported. The larger the OT cycles, the better cracking resistance is.
Results and Analysis
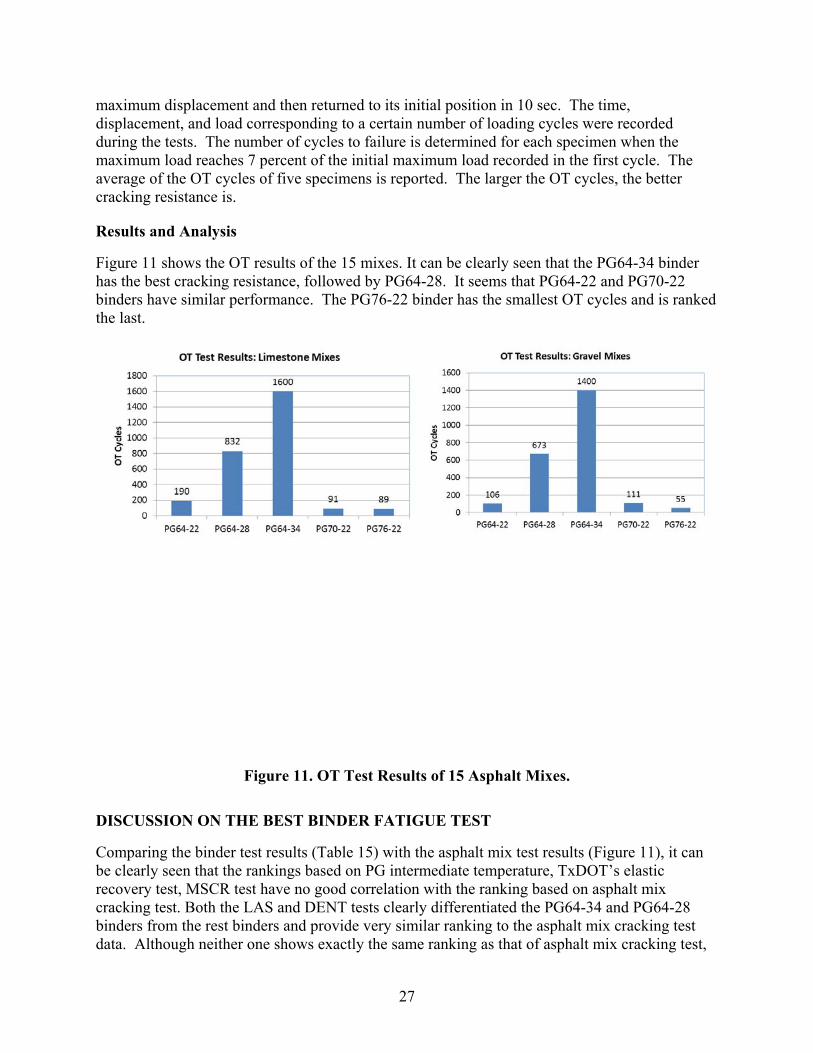
Figure 11 shows the OT results of the 15 mixes. It can be clearly seen that the PG64-34 binder has the best cracking resistance, followed by PG64-28. It seems that PG64-22 and PG70-22 binders have similar performance. The PG76-22 binder has the smallest OT cycles and is ranked the last.
Figure 11. OT Test Results of 15 Asphalt Mixes.
DISCUSSION ON THE BEST BINDER FATIGUE TEST
Comparing the binder test results (Table 15) with the asphalt mix test results (Figure 11), it can be clearly seen that the rankings based on PG intermediate temperature, TxDOT’s elastic recovery test, MSCR test have no good correlation with the ranking based on asphalt mix cracking test. Both the LAS and DENT tests clearly differentiated the PG64-34 and PG64-28 binders from the rest binders and provide very similar ranking to the asphalt mix cracking test data. Although neither one shows exactly the same ranking as that of asphalt mix cracking test,
28
both the LAS and DENT tests can be used for characterizing cracking resistance of asphalt binders. Considering the test equipment requirement of both the LAS and DENT tests, the DSR-based LAS test is recommended for asphalt binder fracture test, because the ductility test equipment required by the DENT test is not often used in TxDOT and contractors’ laboratories.
SUMMARY AND FINDINGS
The current PG binder specification uses parameter G*sinδ to quantify asphalt binder fatigue resistance, which has long been known to be the weakest part of the specification. The purpose of this study was to identify a better asphalt binder fracture test. Five asphalt binder tests were evaluated and compared with the OT cracking test. Basically, three findings are identified in this study:
This study further confirms the poor relationship between the parameter G*sinδ and the binder fatigue resistance.
Neither the MSCR nor the elastic recovery test shows good correlation with the asphalt mix OT cracking test.
Both the LAST and the DENT tests provide similar ranking as that of asphalt mix OT cracking test. Considering the test equipment requirements of both the LAS and DENT tests, the DSR-based LAS test is recommended for asphalt binder fracture test, since the DSR has been widely used in last 20 years and laboratory technicians and researchers are very familiar with it.
Obviously, these findings are based on laboratory test results only. Further field validation is definitely needed. Additionally, one needs always to keep in mind that “the binder alone does not determine fatigue response in the pavement structure. Mix characteristics as well as the pavement structure itself and the environment within which it is located have a significant role in determining pavement performance” (18).
29
CHAPTER 4 ASPHALT BINDER ADHESION TEST
INTRODUCTION
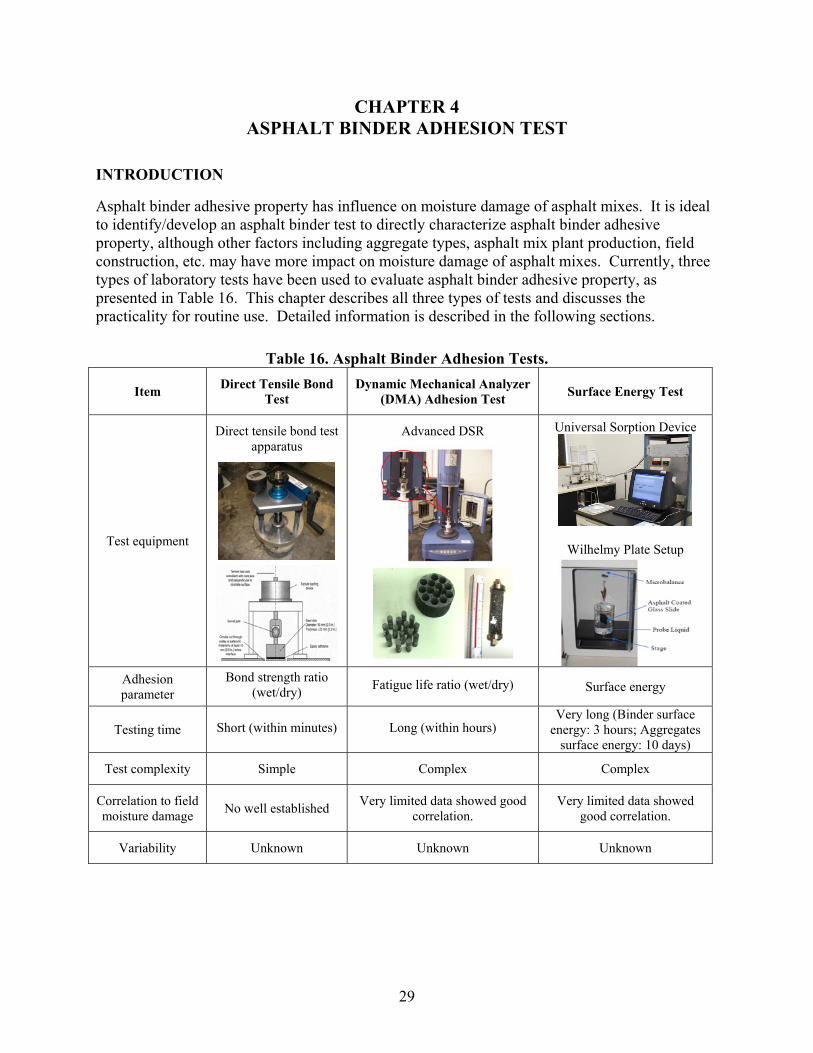
Asphalt binder adhesive property has influence on moisture damage of asphalt mixes. It is ideal to identify/develop an asphalt binder test to directly characterize asphalt binder adhesive property, although other factors including aggregate types, asphalt mix plant production, field construction, etc. may have more impact on moisture damage of asphalt mixes. Currently, three types of laboratory tests have been used to evaluate asphalt binder adhesive property, as presented in Table 16. This chapter describes all three types of tests and discusses the practicality for routine use. Detailed information is described in the following sections.
Table 16. Asphalt Binder Adhesion Tests.
Item Direct Tensile Bond
Test Dynamic Mechanical Analyzer
(DMA) Adhesion Test Surface Energy Test
Test equipment
Direct tensile bond test apparatus
Advanced DSR
Universal Sorption Device
Wilhelmy Plate Setup
Adhesion parameter
Bond strength ratio (wet/dry)
Fatigue life ratio (wet/dry) Surface energy
Testing time Short (within minutes) Long (within hours) Very long (Binder surface
energy: 3 hours; Aggregates surface energy: 10 days)
Test complexity Simple Complex Complex
Correlation to field moisture damage
No well established Very limited data showed good
correlation. Very limited data showed
good correlation.
Variability Unknown Unknown Unknown
30
DIRECTION TENSILE BOND TEST, RESULTS, AND DISCUSSION
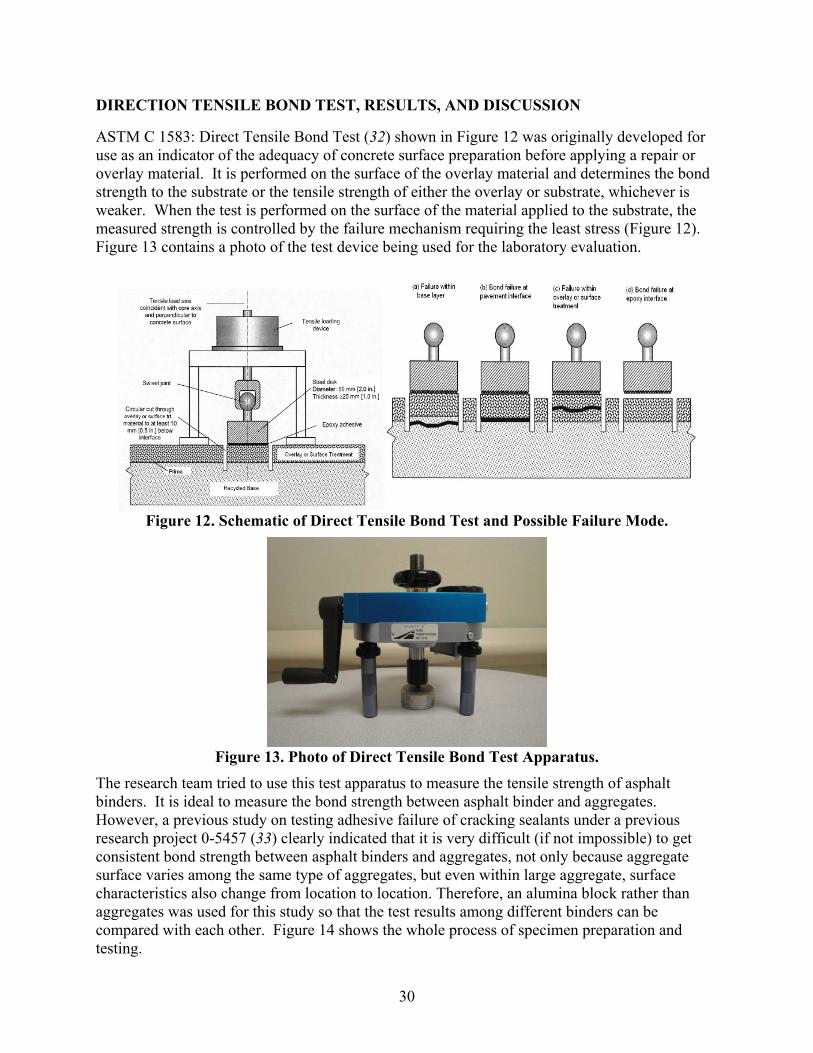
ASTM C 1583: Direct Tensile Bond Test (32) shown in Figure 12 was originally developed for use as an indicator of the adequacy of concrete surface preparation before applying a repair or overlay material. It is performed on the surface of the overlay material and determines the bond strength to the substrate or the tensile strength of either the overlay or substrate, whichever is weaker. When the test is performed on the surface of the material applied to the substrate, the measured strength is controlled by the failure mechanism requiring the least stress (Figure 12). Figure 13 contains a photo of the test device being used for the laboratory evaluation.
Figure 12. Schematic of Direct Tensile Bond Test and Possible Failure Mode.
Figure 13. Photo of Direct Tensile Bond Test Apparatus.
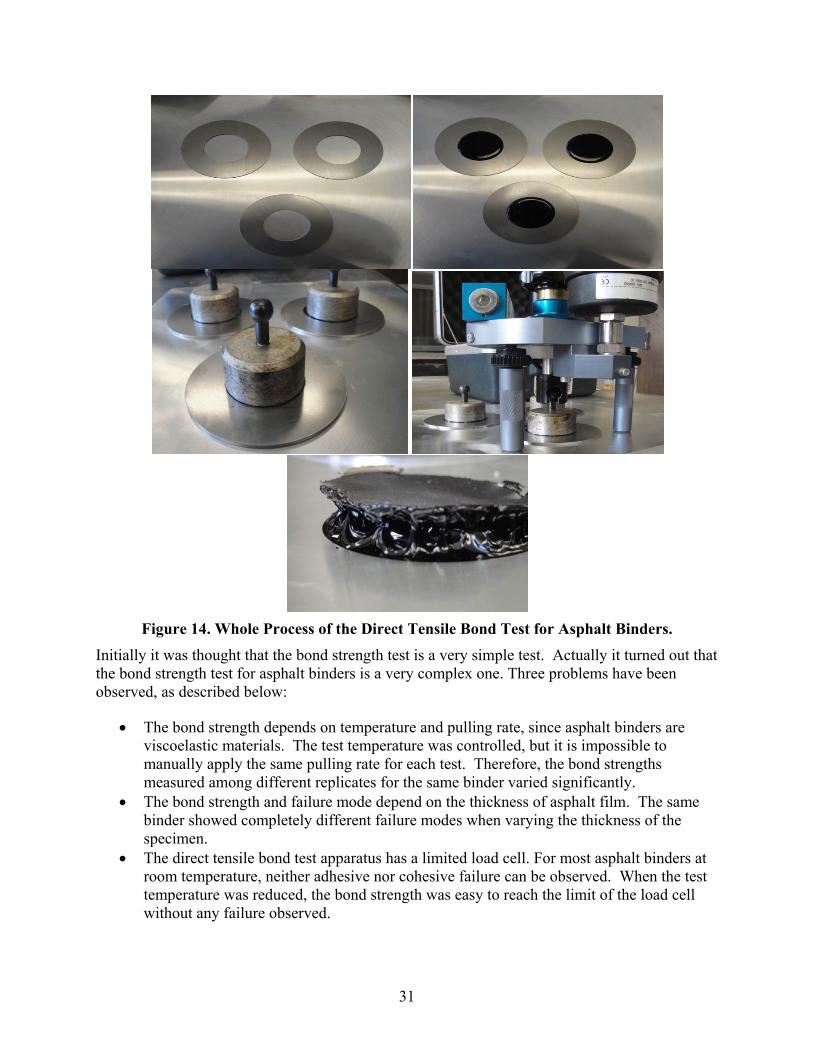
The research team tried to use this test apparatus to measure the tensile strength of asphalt binders. It is ideal to measure the bond strength between asphalt binder and aggregates. However, a previous study on testing adhesive failure of cracking sealants under a previous research project 0-5457 (33) clearly indicated that it is very difficult (if not impossible) to get consistent bond strength between asphalt binders and aggregates, not only because aggregate surface varies among the same type of aggregates, but even within large aggregate, surface characteristics also change from location to location. Therefore, an alumina block rather than aggregates was used for this study so that the test results among different binders can be compared with each other. Figure 14 shows the whole process of specimen preparation and testing.
31
Figure 14. Whole Process of the Direct Tensile Bond Test for Asphalt Binders.
Initially it was thought that the bond strength test is a very simple test. Actually it turned out that the bond strength test for asphalt binders is a very complex one. Three problems have been observed, as described below:
The bond strength depends on temperature and pulling rate, since asphalt binders are viscoelastic materials. The test temperature was controlled, but it is impossible to manually apply the same pulling rate for each test. Therefore, the bond strengths measured among different replicates for the same binder varied significantly.
The bond strength and failure mode depend on the thickness of asphalt film. The same binder showed completely different failure modes when varying the thickness of the specimen.
The direct tensile bond test apparatus has a limited load cell. For most asphalt binders at room temperature, neither adhesive nor cohesive failure can be observed. When the test temperature was reduced, the bond strength was easy to reach the limit of the load cell without any failure observed.
32
After many trials, the researchers concluded that the direct tensile bond test apparatus used in this subtask is not suitable to measure the bond strength of asphalt binders.
PNEUMATIC ADHESION TENSILE TEST, RESULTS, AND DISCUSSION
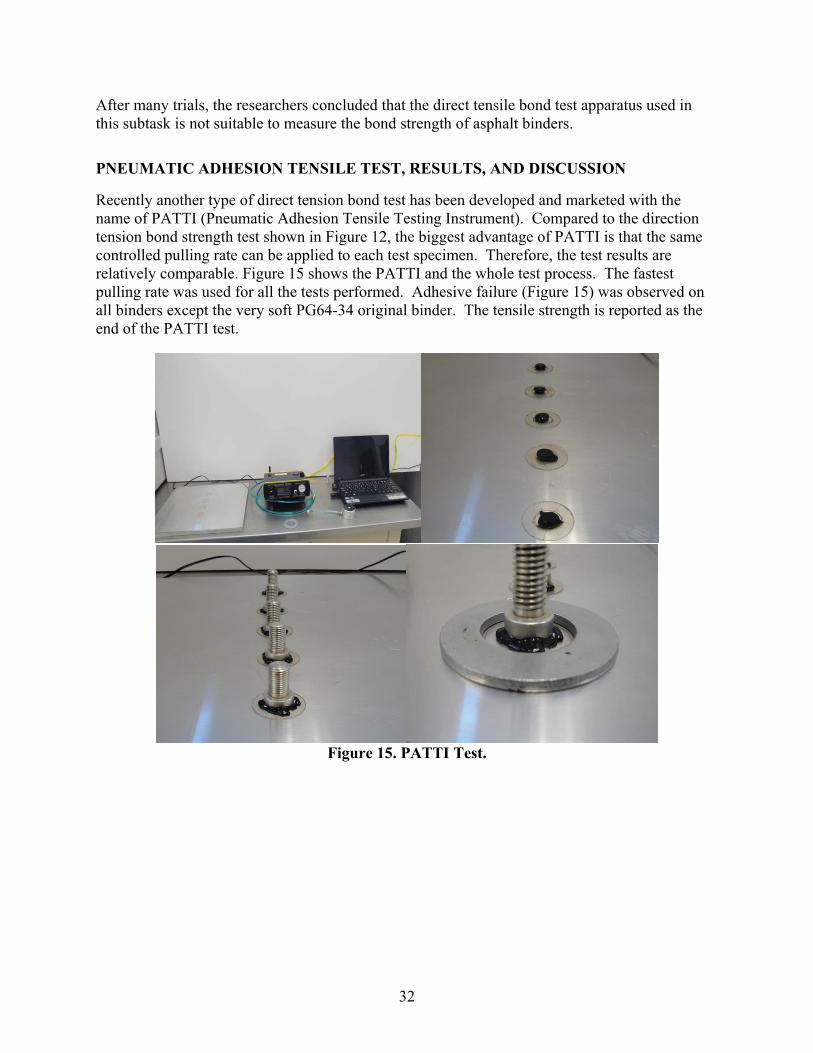
Recently another type of direct tension bond test has been developed and marketed with the name of PATTI (Pneumatic Adhesion Tensile Testing Instrument). Compared to the direction tension bond strength test shown in Figure 12, the biggest advantage of PATTI is that the same controlled pulling rate can be applied to each test specimen. Therefore, the test results are relatively comparable. Figure 15 shows the PATTI and the whole test process. The fastest pulling rate was used for all the tests performed. Adhesive failure (Figure 15) was observed on all binders except the very soft PG64-34 original binder. The tensile strength is reported as the end of the PATTI test.
Figure 15. PATTI Test.
33
Figure 15. PATTI Test (continued).
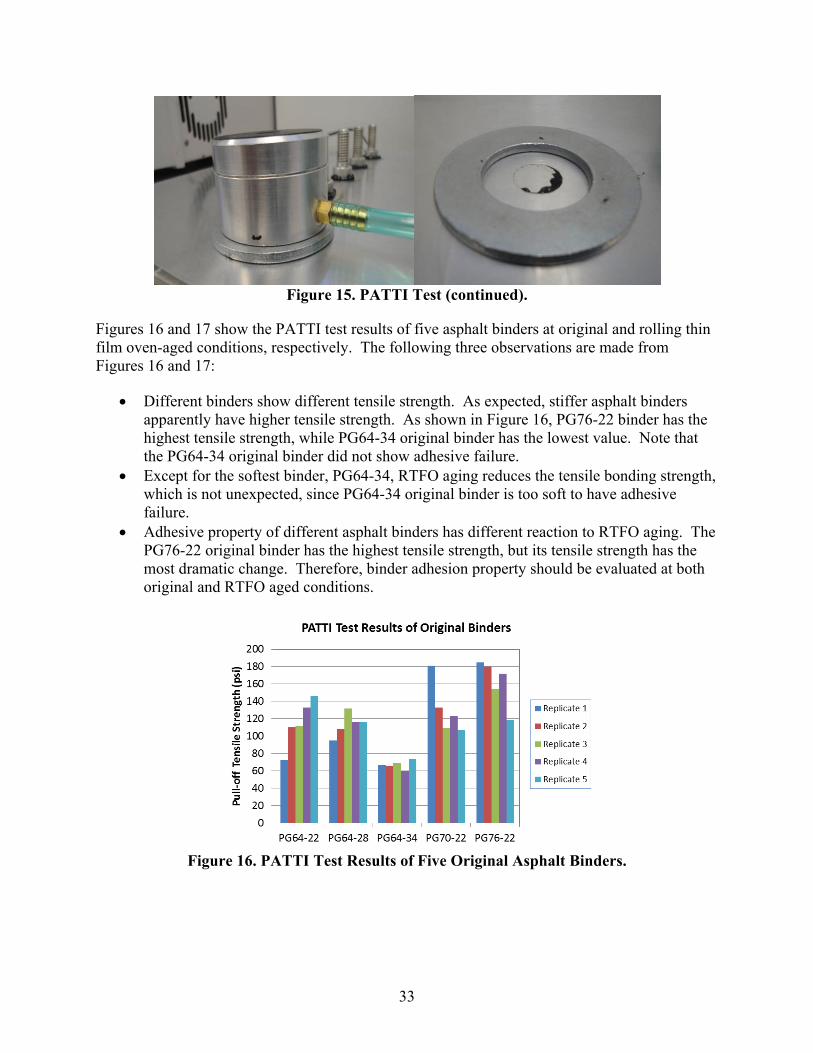
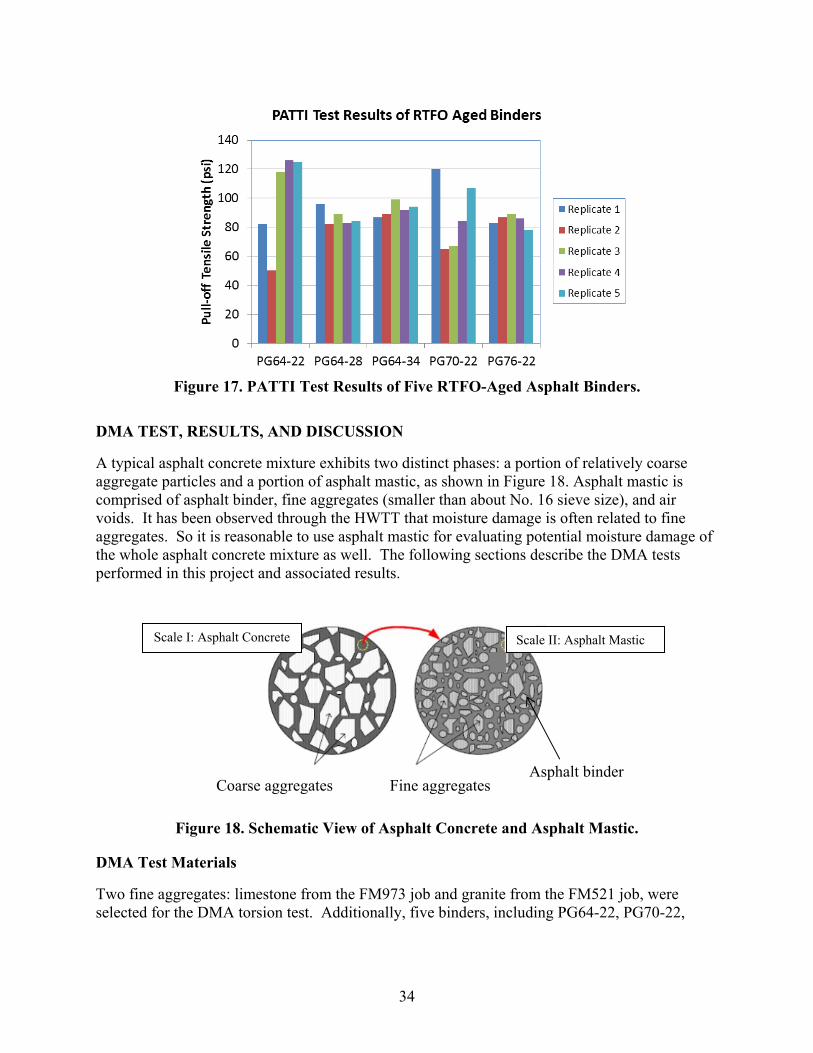
Figures 16 and 17 show the PATTI test results of five asphalt binders at original and rolling thin film oven-aged conditions, respectively. The following three observations are made from Figures 16 and 17:
Different binders show different tensile strength. As expected, stiffer asphalt binders apparently have higher tensile strength. As shown in Figure 16, PG76-22 binder has the highest tensile strength, while PG64-34 original binder has the lowest value. Note that the PG64-34 original binder did not show adhesive failure.
Except for the softest binder, PG64-34, RTFO aging reduces the tensile bonding strength, which is not unexpected, since PG64-34 original binder is too soft to have adhesive failure.
Adhesive property of different asphalt binders has different reaction to RTFO aging. The PG76-22 original binder has the highest tensile strength, but its tensile strength has the most dramatic change. Therefore, binder adhesion property should be evaluated at both original and RTFO aged conditions.
Figure 16. PATTI Test Results of Five Original Asphalt Binders.
34
Figure 17. PATTI Test Results of Five RTFO-Aged Asphalt Binders.
DMA TEST, RESULTS, AND DISCUSSION
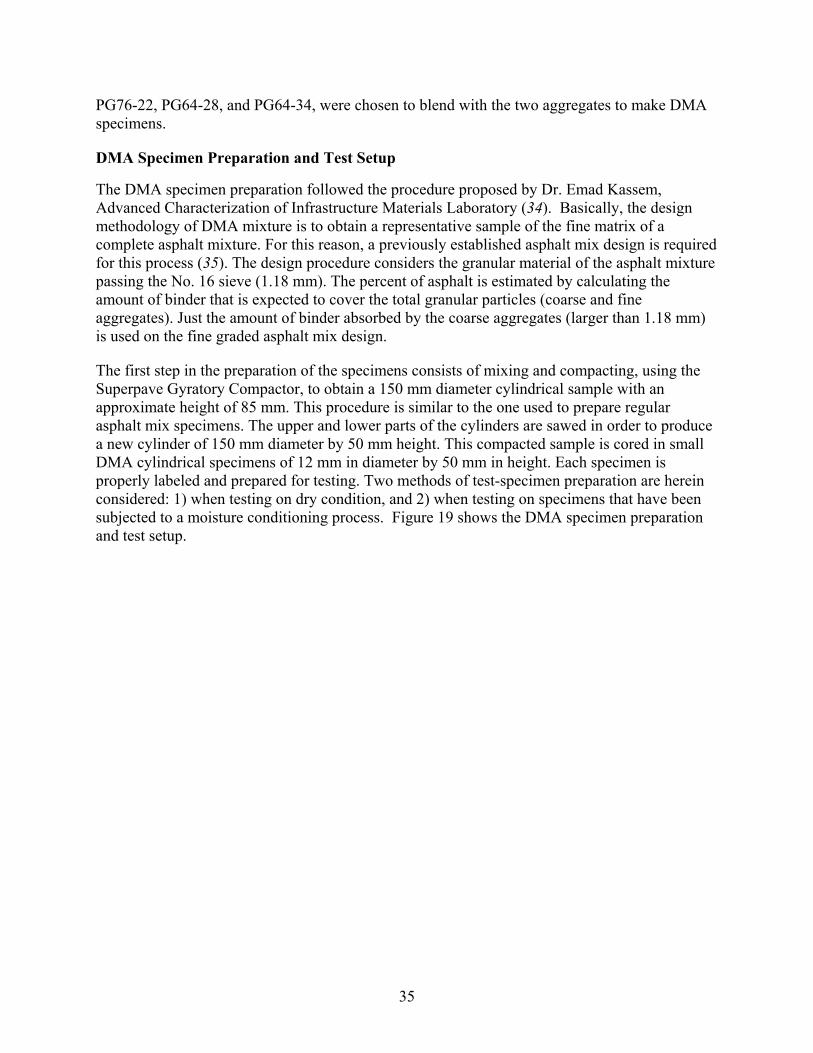
A typical asphalt concrete mixture exhibits two distinct phases: a portion of relatively coarse aggregate particles and a portion of asphalt mastic, as shown in Figure 18. Asphalt mastic is comprised of asphalt binder, fine aggregates (smaller than about No. 16 sieve size), and air voids. It has been observed through the HWTT that moisture damage is often related to fine aggregates. So it is reasonable to use asphalt mastic for evaluating potential moisture damage of the whole asphalt concrete mixture as well. The following sections describe the DMA tests performed in this project and associated results.
Figure 18. Schematic View of Asphalt Concrete and Asphalt Mastic.
DMA Test Materials
Two fine aggregates: limestone from the FM973 job and granite from the FM521 job, were selected for the DMA torsion test. Additionally, five binders, including PG64-22, PG70-22,
Scale I: Asphalt Concrete Scale II: Asphalt Mastic
Coarse aggregates Fine aggregates Asphalt binder
35
PG76-22, PG64-28, and PG64-34, were chosen to blend with the two aggregates to make DMA specimens.
DMA Specimen Preparation and Test Setup
The DMA specimen preparation followed the procedure proposed by Dr. Emad Kassem, Advanced Characterization of Infrastructure Materials Laboratory (34). Basically, the design methodology of DMA mixture is to obtain a representative sample of the fine matrix of a complete asphalt mixture. For this reason, a previously established asphalt mix design is required for this process (35). The design procedure considers the granular material of the asphalt mixture passing the No. 16 sieve (1.18 mm). The percent of asphalt is estimated by calculating the amount of binder that is expected to cover the total granular particles (coarse and fine aggregates). Just the amount of binder absorbed by the coarse aggregates (larger than 1.18 mm) is used on the fine graded asphalt mix design.
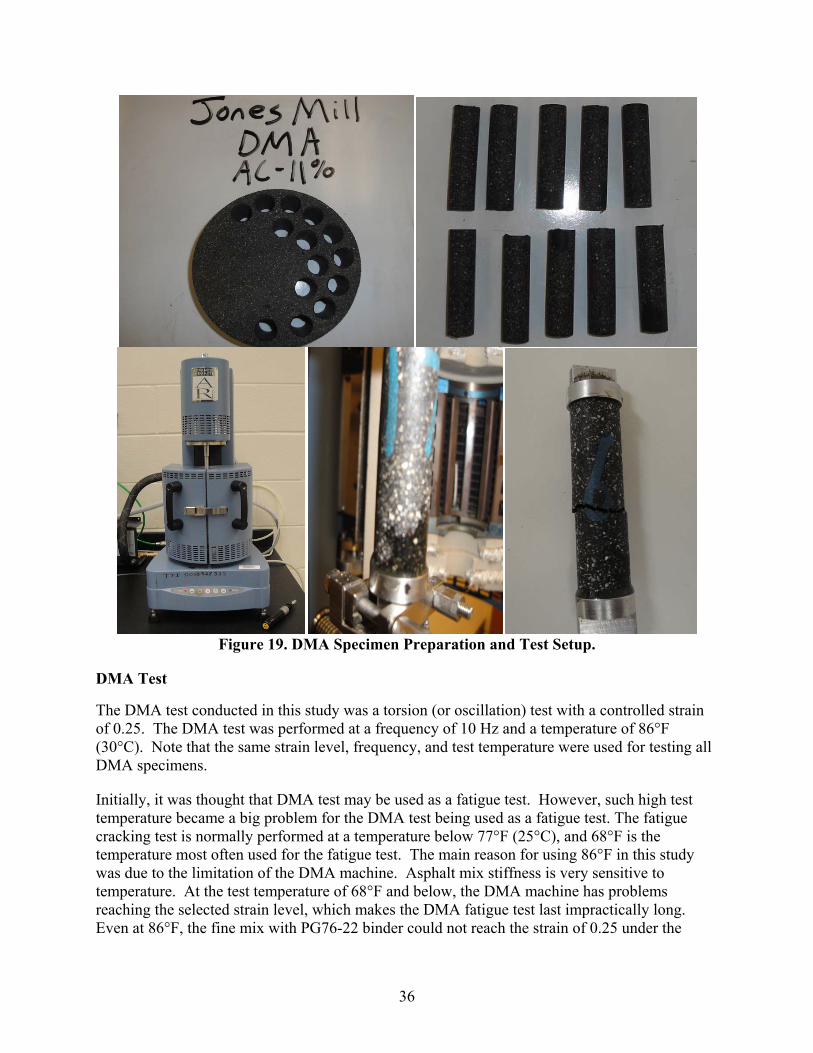
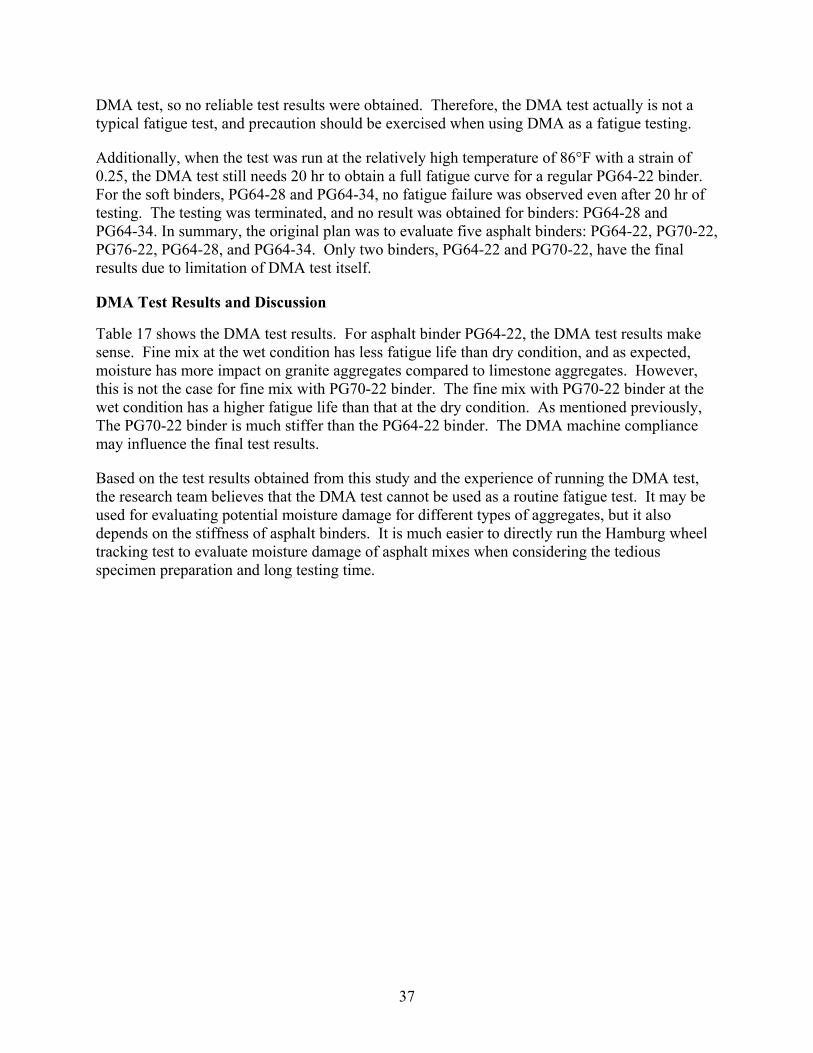
The first step in the preparation of the specimens consists of mixing and compacting, using the Superpave Gyratory Compactor, to obtain a 150 mm diameter cylindrical sample with an approximate height of 85 mm. This procedure is similar to the one used to prepare regular asphalt mix specimens. The upper and lower parts of the cylinders are sawed in order to produce a new cylinder of 150 mm diameter by 50 mm height. This compacted sample is cored in small DMA cylindrical specimens of 12 mm in diameter by 50 mm in height. Each specimen is properly labeled and prepared for testing. Two methods of test-specimen preparation are herein considered: 1) when testing on dry condition, and 2) when testing on specimens that have been subjected to a moisture conditioning process. Figure 19 shows the DMA specimen preparation and test setup.
36
Figure 19. DMA Specimen Preparation and Test Setup.
DMA Test
The DMA test conducted in this study was a torsion (or oscillation) test with a controlled strain of 0.25. The DMA test was performed at a frequency of 10 Hz and a temperature of 86°F (30°C). Note that the same strain level, frequency, and test temperature were used for testing all DMA specimens.
Initially, it was thought that DMA test may be used as a fatigue test. However, such high test temperature became a big problem for the DMA test being used as a fatigue test. The fatigue cracking test is normally performed at a temperature below 77°F (25°C), and 68°F is the temperature most often used for the fatigue test. The main reason for using 86°F in this study was due to the limitation of the DMA machine. Asphalt mix stiffness is very sensitive to temperature. At the test temperature of 68°F and below, the DMA machine has problems reaching the selected strain level, which makes the DMA fatigue test last impractically long. Even at 86°F, the fine mix with PG76-22 binder could not reach the strain of 0.25 under the
37
DMA test, so no reliable test results were obtained. Therefore, the DMA test actually is not a typical fatigue test, and precaution should be exercised when using DMA as a fatigue testing.
Additionally, when the test was run at the relatively high temperature of 86°F with a strain of 0.25, the DMA test still needs 20 hr to obtain a full fatigue curve for a regular PG64-22 binder. For the soft binders, PG64-28 and PG64-34, no fatigue failure was observed even after 20 hr of testing. The testing was terminated, and no result was obtained for binders: PG64-28 and PG64-34. In summary, the original plan was to evaluate five asphalt binders: PG64-22, PG70-22, PG76-22, PG64-28, and PG64-34. Only two binders, PG64-22 and PG70-22, have the final results due to limitation of DMA test itself.
DMA Test Results and Discussion
Table 17 shows the DMA test results. For asphalt binder PG64-22, the DMA test results make sense. Fine mix at the wet condition has less fatigue life than dry condition, and as expected, moisture has more impact on granite aggregates compared to limestone aggregates. However, this is not the case for fine mix with PG70-22 binder. The fine mix with PG70-22 binder at the wet condition has a higher fatigue life than that at the dry condition. As mentioned previously, The PG70-22 binder is much stiffer than the PG64-22 binder. The DMA machine compliance may influence the final test results.
Based on the test results obtained from this study and the experience of running the DMA test, the research team believes that the DMA test cannot be used as a routine fatigue test. It may be used for evaluating potential moisture damage for different types of aggregates, but it also depends on the stiffness of asphalt binders. It is much easier to directly run the Hamburg wheel tracking test to evaluate moisture damage of asphalt mixes when considering the tedious specimen preparation and long testing time.
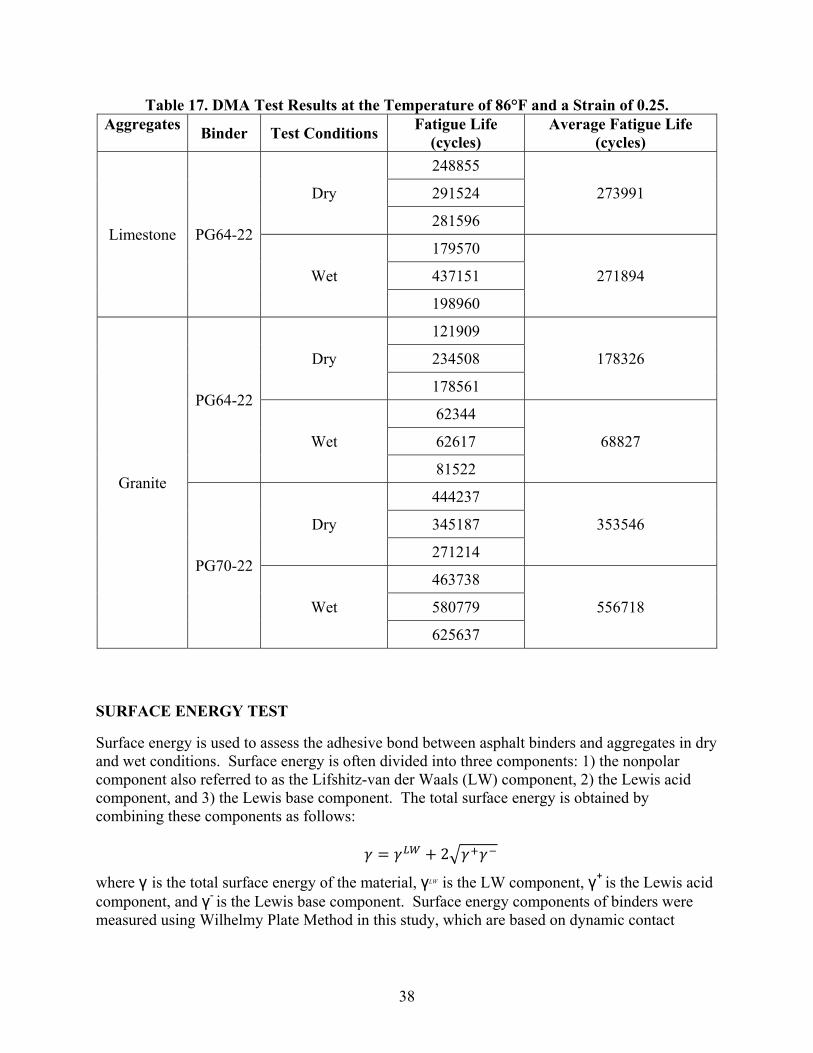
38
Table 17. DMA Test Results at the Temperature of 86°F and a Strain of 0.25. Aggregates
Binder Test Conditions Fatigue Life
(cycles) Average Fatigue Life
(cycles)
Limestone PG64-22
Dry
248855
273991 291524
281596
Wet
179570
271894 437151
198960
Granite
PG64-22
Dry
121909
178326 234508
178561
Wet
62344
68827 62617
81522
PG70-22
Dry
444237
353546 345187
271214
Wet
463738
556718 580779
625637
SURFACE ENERGY TEST
Surface energy is used to assess the adhesive bond between asphalt binders and aggregates in dry and wet conditions. Surface energy is often divided into three components: 1) the nonpolar component also referred to as the Lifshitz-van der Waals (LW) component, 2) the Lewis acid component, and 3) the Lewis base component. The total surface energy is obtained by combining these components as follows:
2
where γ is the total surface energy of the material, γLW is the LW component, γ+
is the Lewis acid component, and γ-
is the Lewis base component. Surface energy components of binders were measured using Wilhelmy Plate Method in this study, which are based on dynamic contact
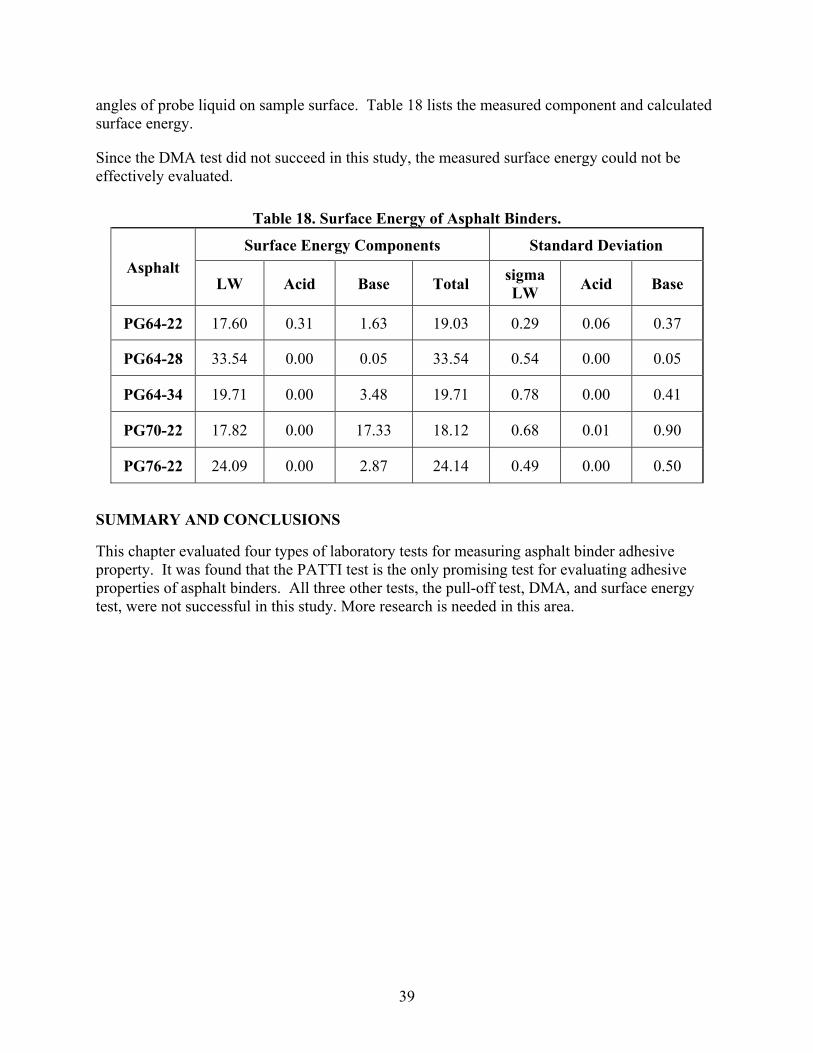
39
angles of probe liquid on sample surface. Table 18 lists the measured component and calculated surface energy.
Since the DMA test did not succeed in this study, the measured surface energy could not be effectively evaluated.
Table 18. Surface Energy of Asphalt Binders.
Asphalt
Surface Energy Components Standard Deviation
LW Acid Base Total sigma LW
Acid Base
PG64-22 17.60 0.31 1.63 19.03 0.29 0.06 0.37
PG64-28 33.54 0.00 0.05 33.54 0.54 0.00 0.05
PG64-34 19.71 0.00 3.48 19.71 0.78 0.00 0.41
PG70-22 17.82 0.00 17.33 18.12 0.68 0.01 0.90
PG76-22 24.09 0.00 2.87 24.14 0.49 0.00 0.50
SUMMARY AND CONCLUSIONS
This chapter evaluated four types of laboratory tests for measuring asphalt binder adhesive property. It was found that the PATTI test is the only promising test for evaluating adhesive properties of asphalt binders. All three other tests, the pull-off test, DMA, and surface energy test, were not successful in this study. More research is needed in this area.

41
CHAPTER 5 SUMMARY AND CONCLUSIONS
This report documents the research work on asphalt binder rutting test, fatigue test, and adhesion test. A variety of new development in each area has been made in the past. This project evaluated all new tests available for both modified and non-modified asphalt binders. Based on the results presented in this report, the following conclusions are offered.
Asphalt mix rutting test results showed that that the MSCR test and associated specification works better than the current G*/sin based PG specification, especially for those highly modified asphalt binders (such as PG64-34). MSCR Round Robin results among five laboratories clearly indicated that both Jnr0.1 and Jnr3.2 results are very repeatable and reproducible. The R3.2 results are acceptable in terms of repeatability and reproducibility, but both Jnrdiff and R0.1 have pretty high variability. Since Jnrdiff is one of the parameters for grading asphalt binder, TxDOT should exercise caution when grading the slightly modified asphalt binders (such as PG64-28) using the MSCR specification.
This study further confirms the poor relationship between the parameter G*sinδ and the binder fatigue resistance. Neither the MSCR nor the elastic recovery test shows good correlation with the asphalt mix OT cracking test. Both the LAST and the DENT tests provide similar ranking as that of asphalt mix OT cracking test. Considering the test equipment requirements of both the LAS and DENT tests, the DSR-based LAS test is recommended for asphalt binder fracture test, since the DSR has been widely used in last 20 years and laboratory technicians and researchers are very familiar with it.
Four types of laboratory tests for measuring asphalt binder adhesive property were evaluated. It was found that the PATTI test is the only promising test for evaluating adhesive properties of asphalt binders. All other three tests, the pull-off test, DMA, and surface energy test, were not successful in this study for evaluating asphalt binder adhesion property.
Obviously, these findings are based on laboratory test results only, and further field validation is definitely needed. Additionally, one needs always to keep in mind that the binder alone does not determine rutting, fatigue cracking, and moisture damage of asphalt pavements. Mix characteristics as well as the pavement structure itself, traffic, and the environment within which it is located have a significant role in determining pavement performance.

43
REFERENCES
1. American Association of State Highway and Transportation Officials. Standard Specification for Performance Graded Asphalt Binders M320, 2006.
2. Dongre, R., J. and D’Angelo., “Evaluation of Different Parameters for Superpave High Temperature Binder Specification Based on Rutting Performance in the Accelerated Loading Facility at FHWA,” Transportation Research Record, TRB, 2003.
3. Stuart, K., W. Mogawer, and P. Romero. (1999). Validation of Asphalt Binder and Mixture Test That Measured Rutting Susceptibility Using the Accelerated Loading Facility. Interim Report October 1993-October 1999. Turner Fairbank Highway Research Center, Federal Highway Administration, McLean, VA.
4. D’Angelo, J., R. Dongre. “Superpave Binder Specifications and their Performance Relationship to Modified Binders,” Proceeding, Canadian Technical Asphalt Association, November 2002.
5. Sybilski, D. Zero-Shear Viscosity of Bituminous Binder and Its Relation to Bituminous Mixtures Rutting Resistance, Journal of Transportation Research Record 1535, 1996, pp. 15-21.
6. Bouldin, M. G., R. Dongre, and J. D’Angelo, J. “Proposed Refinement to The Superpave High Temperature Specification parameter for Performance Graded Binders,” Journal of Transportation Research Record 1766, 2001, pp. 40-47.
7. Shenoy, A. “Refinement of the Superpave Specification Parameter for Performance Grading of Asphalt,” Journal of Transportation Engineering, Vol. 127, No. 5, 2001, pp. 357- 362.
8. Phillips, M. C. and C. Robertus. “Binder Rheology and Asphaltic Pavement Permanent Deformation; The Zero-shear Viscosity,” 1st Eurasphalt and Eurobitume Congress, Strasbourg, 1996, Paper No. 5.134.
9. Desmazes, C., M. Lecomte, D. Lesueur, and M. Phillips. “A Protocol for Reliable Measurement of Zero-shear-viscosity in Order to Evaluate Antirutting Performance of Binders,” Proceedings of 2nd Eurasphalt & Eurobitume Congress, Barcelona, Spain, Book 1, 2000, pp. 202-211.
10. Ferry, J. D., Viscoelastic Properties of Polymers, Third Edition, John Wiley and Sons Inc., New York, 1980.
11. Bahia, H. U., D. L. Hanson, M. Zeng, H. Zhai, M. A. Khatri, and R. M. Anderson. Characterization of Modified Asphalt Binders in Superpave Mix Design, Report No. 459, National Cooperative Highway Research Program, Washington, D.C., 2001.
12. Dongré, R. N., and J. A. D’Angelo. “Development of a high temperature performance-based specification in the United States.” 10th International Conference on Asphalt Pavements, Quebec, Canada, 2006.
13. D' Angleo, J., R. Q. Kluttz, N. Raj, K. Stephens, and L. Zanzotto, Revision of the Superpave High Temperature Binder Specification: the Multiple Stress Creep and Recovery Test, Journal of the Association of Asphalt Paving Technologists, Vol. 76, 2007.
44
14. D' Angleo, J. and N. Raj, Practical Use of the MSCR Test: Characterization of SBS Dispersion and Other Additives in PMA Binders, Journal of Transportation Research Record 2126, 2009, pp. 73-82.
15. H. Bahia, MARC Program Research Update, Presentation at the 12th annual meeting of the association of modified asphalt producers in Kansas City, Missouri on February 15-17, 2011.
16. ASTM E691-11 Standard Practice for Conducting an Inter laboratory Study to Determine the Precision of a Test Method.
17. TxDOT Designation: TEX-242-F. Hamburg Wheel-Tracking Test. Construction Division, Texas Department of Transportation, 2009.
18. Deacon, J. A., J. T. Harvey, A. Tayebali, and C. L. Monismith. “Influence of Binder Loss Modulus on the Fatigue Performance of Asphalt Concrete Pavements.” Journal of Association of Asphalt Paving Technologists, Vol. 66, 1997, pp. 633-668.
19. Bahia, H. U., D. L. Hanson, M. Zeng, H. Zhai, M. A. Khatri, and R. M. Anderson, Characterization of Modified Asphalt Binders in Superpave Mix Design, Report No. 459, National Cooperative Highway Research Program, Washington, D.C., 2001.
20. Bahia, H. U., H. Zhai, M. Zeng, Y. Hu, and P. Turner. Development of Binder Specification Parameters Based on Characterization of Damage Behavior. Journal of the Association of Asphalt Paving Technologists, Vol. 70, 2002, pp. 442-470.
21. Andriescu, A., S. A. Am. Hesp, and J. S. Youtcheff, “Essential and Plastic Works of Ductile Fracture in Asphalt Binders,” Journal of Transportation Research Record 1875, 2004.
22. Tsai, B. and C. L. Monismith, Influence of Asphalt Binder Properties on the Fatigue Performance of Asphalt Concrete Pavements, Journal of Association of Asphalt Paving Technologists, Vol. 74, 2005, pp. 733-790.
23. Andersen, D. A., M. Y. Le Hir, M. Marasteanu, J. P. Planche, D. Martin, and G. Gaauthier, “Evaluation of fatigue criteria for asphalt binder.” Journal of Transportation Research Record 1766, Transportation Research Board, Washington, D.C., 2001, pp. 48-56.
24. Johnson, C.M. and H.U. Bahia. Evaluation of an Accelerated Procedure for Fatigue Characterization of Asphalt Binders. Submitted for publication in Road Materials and Pavement Design. 2010.
25. Hintz, C., R. Velasquez, C. Johnson, and H. Bahia, Modification and Validation of the Linear Amplitude Sweep Test for Binder Fatigue Specification, Transportation Research Board, Washington, D.C., 2011.
26. Hintz, C. R. Velasquez, Z. Li, and H. Bahia, Effect of Oxidative Aging on Binder Fatigue Performance, Journal of the Association of Asphalt Paving Technologists, Tampa, FL, Vol. 80, 2011.
27. Andriescu, A., S. A. M. Hesp, and J. S. Youtcheff, “Essential and Plastic Works of Ductile Fracture in Asphalt Binders,” Journal of Transportation Research Record 1875, 2004.
45
28. Gibson, N., X. Qi, A. Shenoy, G. Al-Khateeb, M. E. Kutay, A. Andriescu, K. Stuart, J. Youtcheff, and T. Harman, Full-Scale Accelerated Performance Testing for Superpave and Structural Validation-Transportation Pooled Fund Study TPF-5(019) and SPR-2(174) Accelerated Pavement Testing of Crumb Rubber Modified Asphalt Pavements, Federal Highway Administration, McLean, VA, August 2010.
29. Kim, Y., D. N. Little, and R. L. Lytton, “Use of dynamic mechanical analysis DMA to evaluate the fatigue and healing potential of asphalt binders in sand asphalt mixtures.” Journal of the Association of Asphalt Paving Technologists, Vol. 71, 2002, pp.176-206.
30. Castelo Branco, V., E. Masad, A. Bhasin, and D. Little. Fatigue Analysis of Asphalt Mixtures Independent of Mode of Loading,” Transportation Research Record 2057, Journal of the Transportation Research Board, 2008, pp. 149-156.
31. TxDOT Designation: Tex-248-F. Overlay Test. Construction Division, Texas Department of Transportation, 2009.
32. ASTM C1583 “Standard Test Method for Tensile Strength of Concrete Surfaces and the Bond Strength or Tensile Strength of Concrete Repair and Overlay Materials by Direct Tension (Pull-off Method),” 2013.
33. Zhou, F., S. Hu, and T. Scullion, Preliminary Results of Repeatability and Sensitivity Study on Overlay Tester for Crack Sealants, FHWA/TX-07/0-5457-1, Texas Transportation Institute, College Station, TX, 2007.
34. Kassem, E., Preparation and Testing of Fine Graded Asphalt Mixes by Means of the Dynamic Mechanical Analyzer (DMA), ACIM Lab DMA Procedure, 2011.
35. Sousa, P., E. Kassem, E. Masad, and D. Little, “New Design Method of Fine Aggregates Mixtures and Automated Method for Analysis of Dynamic Mechanical Characterization Data.” The 90th Annual Meeting, Transportation Research Board, Washington, D.C., January 2011.

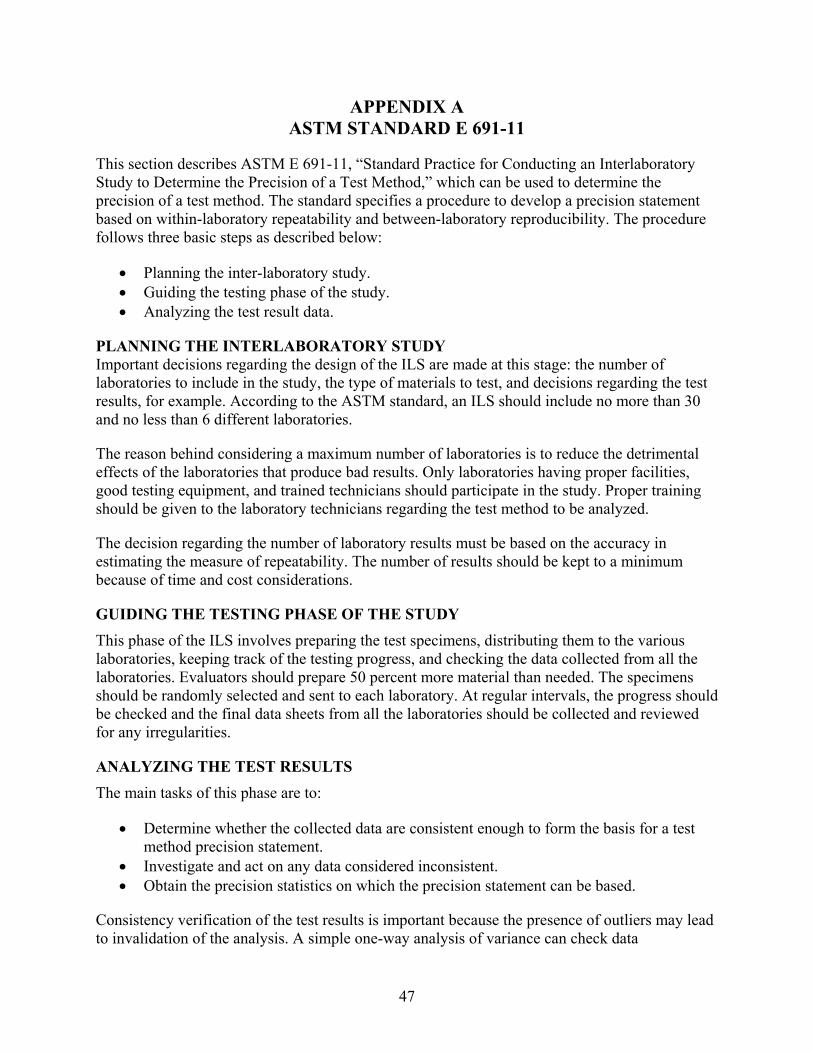
47
APPENDIX A ASTM STANDARD E 691-11
This section describes ASTM E 691-11, “Standard Practice for Conducting an Interlaboratory Study to Determine the Precision of a Test Method,” which can be used to determine the precision of a test method. The standard specifies a procedure to develop a precision statement based on within-laboratory repeatability and between-laboratory reproducibility. The procedure follows three basic steps as described below:
Planning the inter-laboratory study. Guiding the testing phase of the study. Analyzing the test result data.
PLANNING THE INTERLABORATORY STUDY Important decisions regarding the design of the ILS are made at this stage: the number of laboratories to include in the study, the type of materials to test, and decisions regarding the test results, for example. According to the ASTM standard, an ILS should include no more than 30 and no less than 6 different laboratories.
The reason behind considering a maximum number of laboratories is to reduce the detrimental effects of the laboratories that produce bad results. Only laboratories having proper facilities, good testing equipment, and trained technicians should participate in the study. Proper training should be given to the laboratory technicians regarding the test method to be analyzed.
The decision regarding the number of laboratory results must be based on the accuracy in estimating the measure of repeatability. The number of results should be kept to a minimum because of time and cost considerations.
GUIDING THE TESTING PHASE OF THE STUDY
This phase of the ILS involves preparing the test specimens, distributing them to the various laboratories, keeping track of the testing progress, and checking the data collected from all the laboratories. Evaluators should prepare 50 percent more material than needed. The specimens should be randomly selected and sent to each laboratory. At regular intervals, the progress should be checked and the final data sheets from all the laboratories should be collected and reviewed for any irregularities.
ANALYZING THE TEST RESULTS
The main tasks of this phase are to:
Determine whether the collected data are consistent enough to form the basis for a test method precision statement.
Investigate and act on any data considered inconsistent. Obtain the precision statistics on which the precision statement can be based.
Consistency verification of the test results is important because the presence of outliers may lead to invalidation of the analysis. A simple one-way analysis of variance can check data
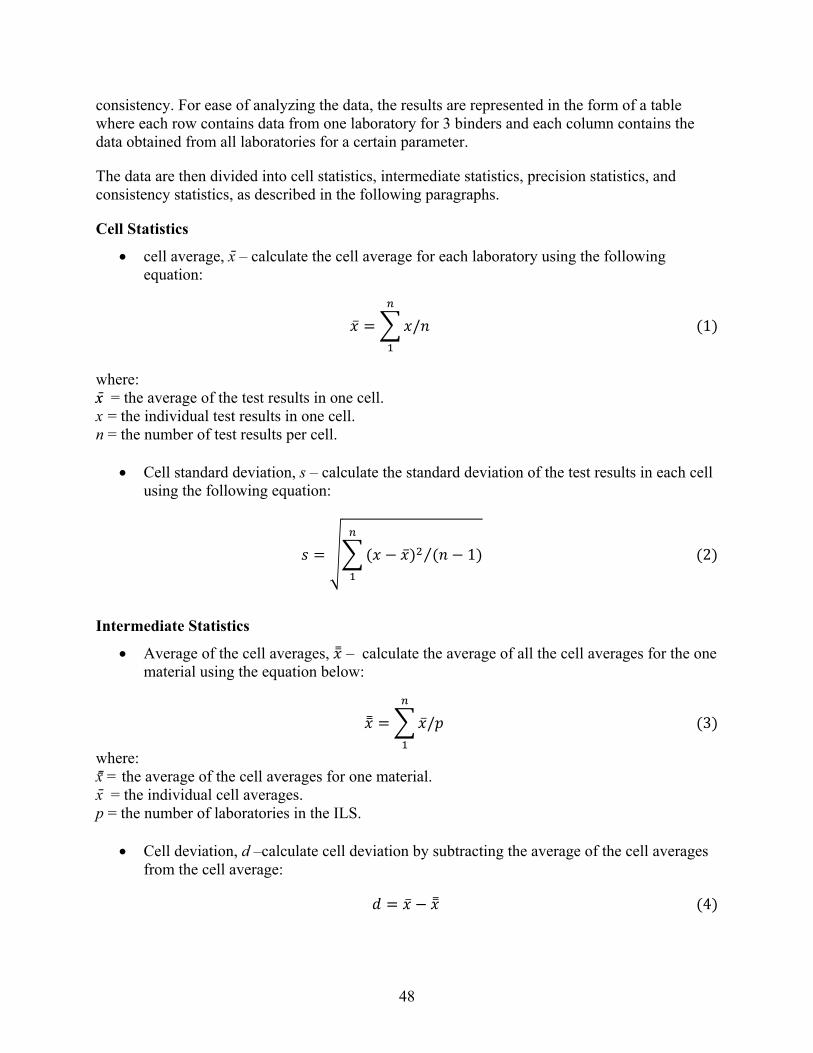
48
consistency. For ease of analyzing the data, the results are represented in the form of a table where each row contains data from one laboratory for 3 binders and each column contains the data obtained from all laboratories for a certain parameter.
The data are then divided into cell statistics, intermediate statistics, precision statistics, and consistency statistics, as described in the following paragraphs.
Cell Statistics
cell average, x – calculate the cell average for each laboratory using the following equation:
/ 1
where: xx = the average of the test results in one cell. x = the individual test results in one cell. n = the number of test results per cell.
Cell standard deviation, s – calculate the standard deviation of the test results in each cell using the following equation:
1⁄ 2
Intermediate Statistics
Average of the cell averages, – calculate the average of all the cell averages for the one material using the equation below:
/ 3
where: x˭ = the average of the cell averages for one material. x = the individual cell averages. p = the number of laboratories in the ILS.
Cell deviation, d –calculate cell deviation by subtracting the average of the cell averages from the cell average:
4
49
Standard deviation of the cell averages, sx – standard deviation is calculated as follows:
/ 1 5
Precision Statistics
The fundamental precision statistics are the repeatability standard deviation and the reproducibility standard deviation.
Repeatability standard deviation, sr – calculate this statistic using the following equation:
⁄ 6
where: sr = the repeatability standard deviation. s = the cell standard deviation. p = the number of laboratories.
Reproducibility standard deviation, – In this case, the larger of the values obtained from the equation below or the value of sr is considered as reproducibility standard deviation:
1 / 7
Consistency Statistics
For each cell, the value of h is calculated using the equation given below:
⁄ 8 where: h = the between-laboratory consistency statistic. d = the cell deviation. sx = the standard deviation of the cell averages.
For each cell, the value of k is calculated using the equation given below:
/ 9 where: k = within-laboratory consistency statistic. s = the cell standard deviation for one laboratory. sr = the repeatability standard deviation of the material.
50
To facilitate easy representation, bar charts are prepared from the calculated values of h and k. The bar charts are prepared in two ways:
Materials grouped by laboratory. Laboratories grouped by materials.
The critical values for 0.5 percent significance level for both h and k are recommended based on experience. When 1 percent significance level was used, most of the cells were flagged, and when 0.1 percent was used very few cells were flagged. The values that exceed the critical values are marked in the Appendix B tables.
In the plots by laboratory, there are usually three general patterns for the h plot:
All laboratories have both positive and negative h values. The h values for individual laboratories are either positive or negative, and the number of
negative laboratories equals the number of positive laboratories. One laboratory shows all positive h values while the other laboratories show all negative
h values.
The first two patterns indicate that there is no variation in the test procedure and there is no need of any investigation, while the last type suggests the need for an investigation.
In the case of the k plots by laboratory, a k value from one of the laboratories either too small or too large when compared to those from the other laboratories suggests the need for an investigation. Small k values indicate some error in measurement, and high k values indicate a large variation in data.
The plots by material are necessary to compare the plots by laboratory type when the values of h and k for the plot by laboratory are close to the critical values. If the values of h and k for one laboratory are considerably different from the values for other laboratories then an investigation of the offset laboratory is suggested.
Once the data are analyzed and the flawed cells are identified, a detailed investigation must be conducted to determine the reason for the variation in the results. Retesting of the materials is an option, and h and k values will be determined again. With the corrected data, the 95 percent repeatability (r) and reproducibility (R) limits can be determined using the following equations:
2.8 10 2.8 11
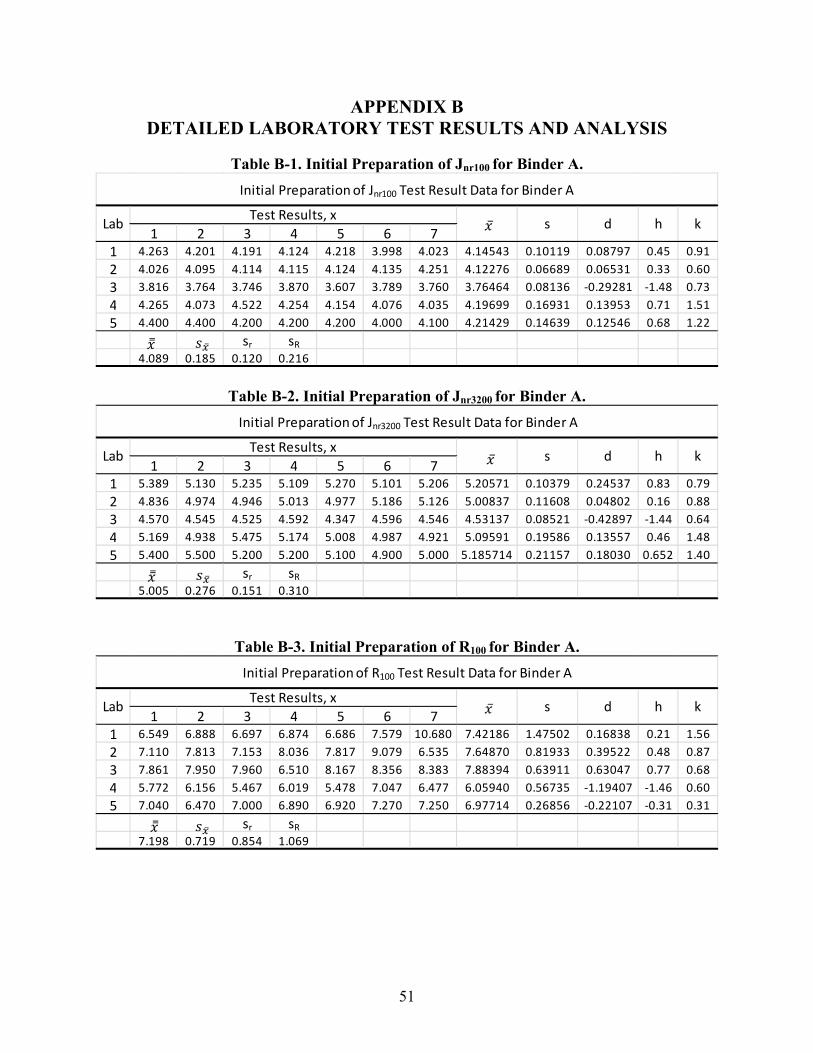
51
APPENDIX B DETAILED LABORATORY TEST RESULTS AND ANALYSIS
Table B-1. Initial Preparation of Jnr100 for Binder A.
Table B-2. Initial Preparation of Jnr3200 for Binder A.
Table B-3. Initial Preparation of R100 for Binder A.
1 2 3 4 5 6 71 4.263 4.201 4.191 4.124 4.218 3.998 4.023 4.14543 0.10119 0.08797 0.45 0.91
2 4.026 4.095 4.114 4.115 4.124 4.135 4.251 4.12276 0.06689 0.06531 0.33 0.60
3 3.816 3.764 3.746 3.870 3.607 3.789 3.760 3.76464 0.08136 ‐0.29281 ‐1.48 0.73
4 4.265 4.073 4.522 4.254 4.154 4.076 4.035 4.19699 0.16931 0.13953 0.71 1.51
5 4.400 4.400 4.200 4.200 4.200 4.000 4.100 4.21429 0.14639 0.12546 0.68 1.22
sr sR4.089 0.185 0.120 0.216
Lab
Initial Preparation of Jnr100 Test Result Data for Binder A
Test Results, xs d h k
1 2 3 4 5 6 71 5.389 5.130 5.235 5.109 5.270 5.101 5.206 5.20571 0.10379 0.24537 0.83 0.79
2 4.836 4.974 4.946 5.013 4.977 5.186 5.126 5.00837 0.11608 0.04802 0.16 0.88
3 4.570 4.545 4.525 4.592 4.347 4.596 4.546 4.53137 0.08521 ‐0.42897 ‐1.44 0.64
4 5.169 4.938 5.475 5.174 5.008 4.987 4.921 5.09591 0.19586 0.13557 0.46 1.48
5 5.400 5.500 5.200 5.200 5.100 4.900 5.000 5.185714 0.21157 0.18030 0.652 1.40
sr sR5.005 0.276 0.151 0.310
Initial Preparation of Jnr3200 Test Result Data for Binder A
LabTest Results, x
s d h k
1 2 3 4 5 6 71 6.549 6.888 6.697 6.874 6.686 7.579 10.680 7.42186 1.47502 0.16838 0.21 1.56
2 7.110 7.813 7.153 8.036 7.817 9.079 6.535 7.64870 0.81933 0.39522 0.48 0.87
3 7.861 7.950 7.960 6.510 8.167 8.356 8.383 7.88394 0.63911 0.63047 0.77 0.68
4 5.772 6.156 5.467 6.019 5.478 7.047 6.477 6.05940 0.56735 ‐1.19407 ‐1.46 0.60
5 7.040 6.470 7.000 6.890 6.920 7.270 7.250 6.97714 0.26856 ‐0.22107 ‐0.31 0.31
sr sR7.198 0.719 0.854 1.069
Initial Preparation of R100 Test Result Data for Binder A
LabTest Results, x
s d h k
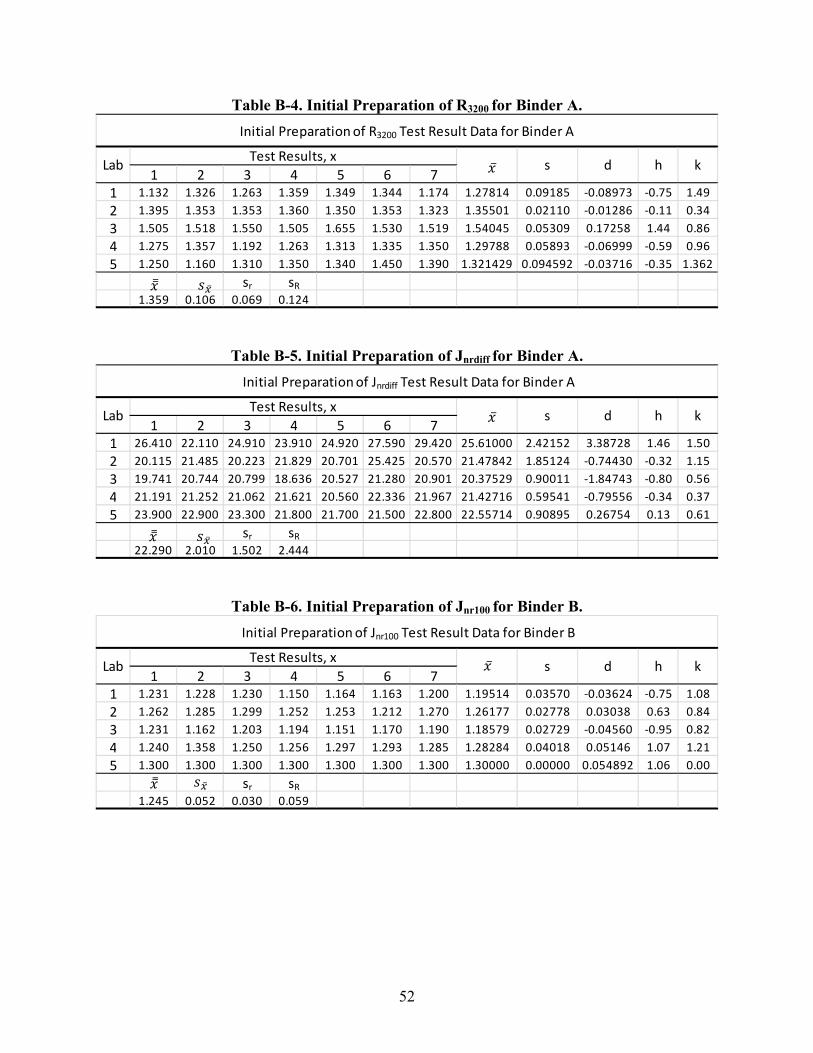
52
Table B-4. Initial Preparation of R3200 for Binder A.
Table B-5. Initial Preparation of Jnrdiff for Binder A.
Table B-6. Initial Preparation of Jnr100 for Binder B.
1 2 3 4 5 6 71 1.132 1.326 1.263 1.359 1.349 1.344 1.174 1.27814 0.09185 ‐0.08973 ‐0.75 1.49
2 1.395 1.353 1.353 1.360 1.350 1.353 1.323 1.35501 0.02110 ‐0.01286 ‐0.11 0.34
3 1.505 1.518 1.550 1.505 1.655 1.530 1.519 1.54045 0.05309 0.17258 1.44 0.86
4 1.275 1.357 1.192 1.263 1.313 1.335 1.350 1.29788 0.05893 ‐0.06999 ‐0.59 0.96
5 1.250 1.160 1.310 1.350 1.340 1.450 1.390 1.321429 0.094592 ‐0.03716 ‐0.35 1.362
sr sR1.359 0.106 0.069 0.124
Initial Preparation of R3200 Test Result Data for Binder A
LabTest Results, x
s d h k
1 2 3 4 5 6 71 26.410 22.110 24.910 23.910 24.920 27.590 29.420 25.61000 2.42152 3.38728 1.46 1.50
2 20.115 21.485 20.223 21.829 20.701 25.425 20.570 21.47842 1.85124 ‐0.74430 ‐0.32 1.15
3 19.741 20.744 20.799 18.636 20.527 21.280 20.901 20.37529 0.90011 ‐1.84743 ‐0.80 0.56
4 21.191 21.252 21.062 21.621 20.560 22.336 21.967 21.42716 0.59541 ‐0.79556 ‐0.34 0.37
5 23.900 22.900 23.300 21.800 21.700 21.500 22.800 22.55714 0.90895 0.26754 0.13 0.61
sr sR22.290 2.010 1.502 2.444
Initial Preparation of Jnrdiff Test Result Data for Binder A
LabTest Results, x
s d h k
1 2 3 4 5 6 71 1.231 1.228 1.230 1.150 1.164 1.163 1.200 1.19514 0.03570 ‐0.03624 ‐0.75 1.08
2 1.262 1.285 1.299 1.252 1.253 1.212 1.270 1.26177 0.02778 0.03038 0.63 0.84
3 1.231 1.162 1.203 1.194 1.151 1.170 1.190 1.18579 0.02729 ‐0.04560 ‐0.95 0.82
4 1.240 1.358 1.250 1.256 1.297 1.293 1.285 1.28284 0.04018 0.05146 1.07 1.21
5 1.300 1.300 1.300 1.300 1.300 1.300 1.300 1.30000 0.00000 0.054892 1.06 0.00
sr sR1.245 0.052 0.030 0.059
Initial Preparation of Jnr100 Test Result Data for Binder B
LabTest Results, x
s d h k
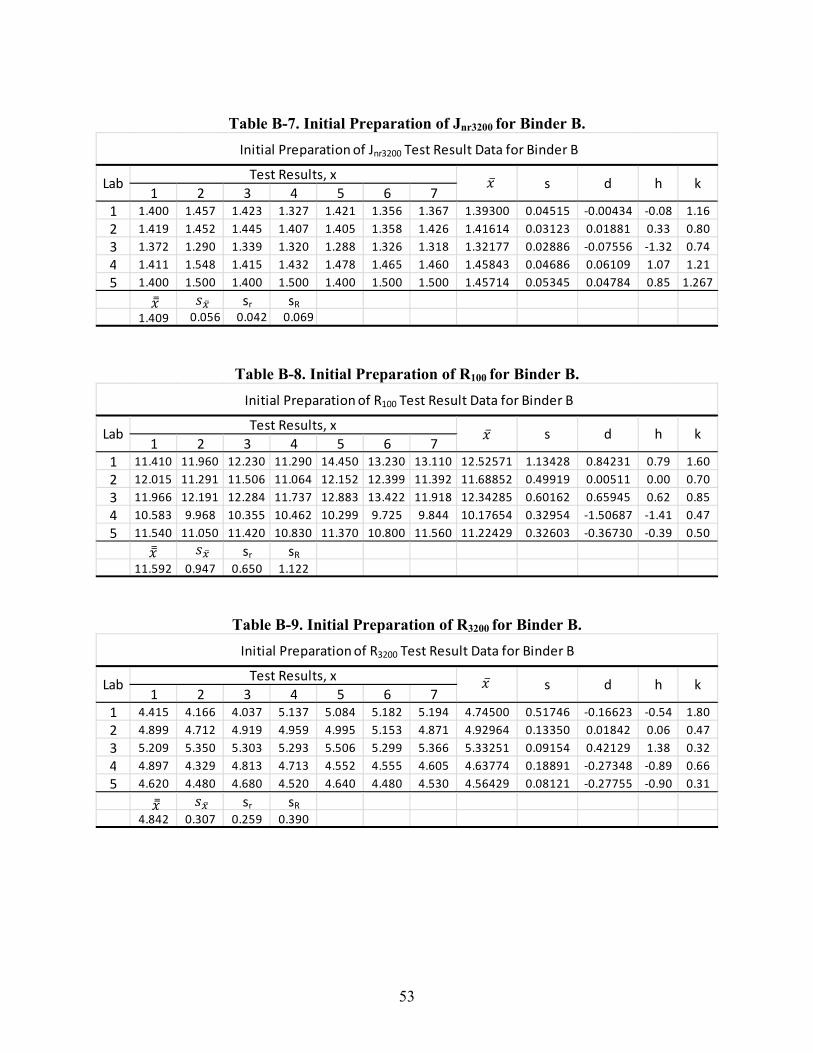
53
Table B-7. Initial Preparation of Jnr3200 for Binder B.
Table B-8. Initial Preparation of R100 for Binder B.
Table B-9. Initial Preparation of R3200 for Binder B.
1 2 3 4 5 6 71 1.400 1.457 1.423 1.327 1.421 1.356 1.367 1.39300 0.04515 ‐0.00434 ‐0.08 1.16
2 1.419 1.452 1.445 1.407 1.405 1.358 1.426 1.41614 0.03123 0.01881 0.33 0.80
3 1.372 1.290 1.339 1.320 1.288 1.326 1.318 1.32177 0.02886 ‐0.07556 ‐1.32 0.74
4 1.411 1.548 1.415 1.432 1.478 1.465 1.460 1.45843 0.04686 0.06109 1.07 1.21
5 1.400 1.500 1.400 1.500 1.400 1.500 1.500 1.45714 0.05345 0.04784 0.85 1.267
sr sR1.409 0.056 0.042 0.069
Initial Preparation of Jnr3200 Test Result Data for Binder B
LabTest Results, x
s d h k
1 2 3 4 5 6 71 11.410 11.960 12.230 11.290 14.450 13.230 13.110 12.52571 1.13428 0.84231 0.79 1.60
2 12.015 11.291 11.506 11.064 12.152 12.399 11.392 11.68852 0.49919 0.00511 0.00 0.70
3 11.966 12.191 12.284 11.737 12.883 13.422 11.918 12.34285 0.60162 0.65945 0.62 0.85
4 10.583 9.968 10.355 10.462 10.299 9.725 9.844 10.17654 0.32954 ‐1.50687 ‐1.41 0.47
5 11.540 11.050 11.420 10.830 11.370 10.800 11.560 11.22429 0.32603 ‐0.36730 ‐0.39 0.50
sr sR11.592 0.947 0.650 1.122
Initial Preparation of R100 Test Result Data for Binder B
LabTest Results, x
s d h k
1 2 3 4 5 6 71 4.415 4.166 4.037 5.137 5.084 5.182 5.194 4.74500 0.51746 ‐0.16623 ‐0.54 1.80
2 4.899 4.712 4.919 4.959 4.995 5.153 4.871 4.92964 0.13350 0.01842 0.06 0.47
3 5.209 5.350 5.303 5.293 5.506 5.299 5.366 5.33251 0.09154 0.42129 1.38 0.32
4 4.897 4.329 4.813 4.713 4.552 4.555 4.605 4.63774 0.18891 ‐0.27348 ‐0.89 0.66
5 4.620 4.480 4.680 4.520 4.640 4.480 4.530 4.56429 0.08121 ‐0.27755 ‐0.90 0.31
sr sR4.842 0.307 0.259 0.390
Initial Preparation of R3200 Test Result Data for Binder B
LabTest Results, x
s d h k
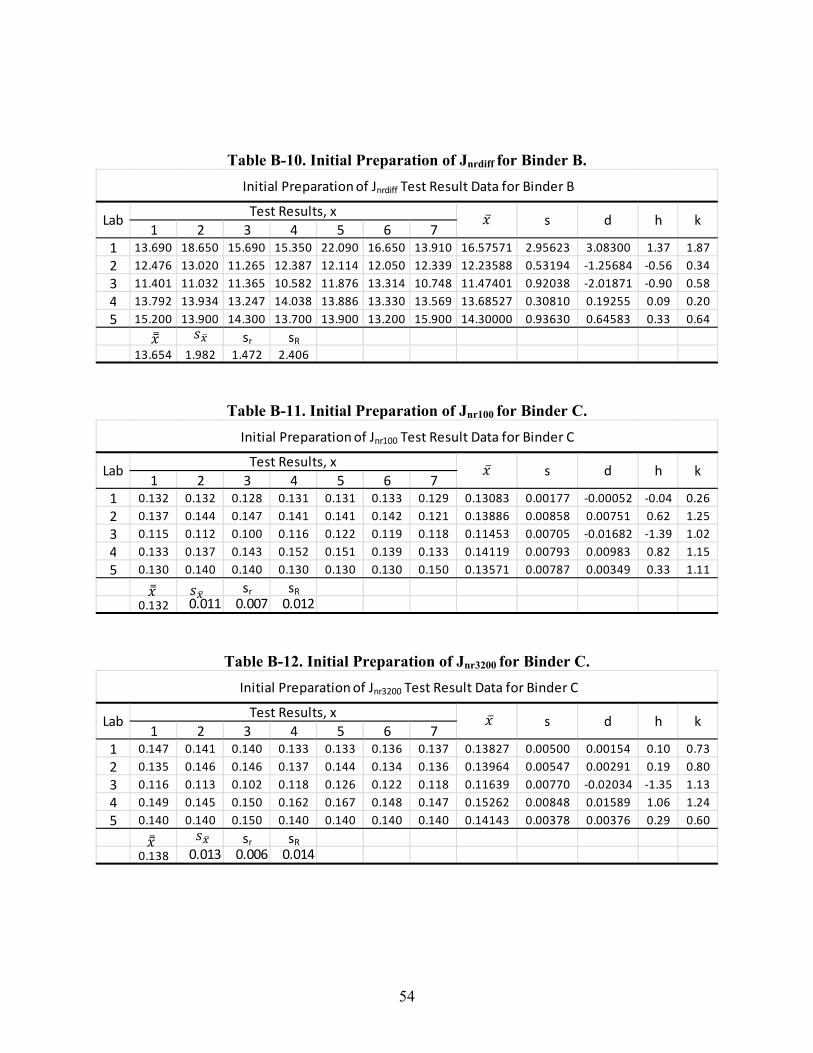
54
Table B-10. Initial Preparation of Jnrdiff for Binder B.
Table B-11. Initial Preparation of Jnr100 for Binder C.
Table B-12. Initial Preparation of Jnr3200 for Binder C.
1 2 3 4 5 6 71 13.690 18.650 15.690 15.350 22.090 16.650 13.910 16.57571 2.95623 3.08300 1.37 1.87
2 12.476 13.020 11.265 12.387 12.114 12.050 12.339 12.23588 0.53194 ‐1.25684 ‐0.56 0.34
3 11.401 11.032 11.365 10.582 11.876 13.314 10.748 11.47401 0.92038 ‐2.01871 ‐0.90 0.58
4 13.792 13.934 13.247 14.038 13.886 13.330 13.569 13.68527 0.30810 0.19255 0.09 0.20
5 15.200 13.900 14.300 13.700 13.900 13.200 15.900 14.30000 0.93630 0.64583 0.33 0.64
sr sR13.654 1.982 1.472 2.406
Initial Preparation of Jnrdiff Test Result Data for Binder B
LabTest Results, x
s d h k
1 2 3 4 5 6 71 0.132 0.132 0.128 0.131 0.131 0.133 0.129 0.13083 0.00177 ‐0.00052 ‐0.04 0.26
2 0.137 0.144 0.147 0.141 0.141 0.142 0.121 0.13886 0.00858 0.00751 0.62 1.25
3 0.115 0.112 0.100 0.116 0.122 0.119 0.118 0.11453 0.00705 ‐0.01682 ‐1.39 1.02
4 0.133 0.137 0.143 0.152 0.151 0.139 0.133 0.14119 0.00793 0.00983 0.82 1.15
5 0.130 0.140 0.140 0.130 0.130 0.130 0.150 0.13571 0.00787 0.00349 0.33 1.11
sr sR0.132 0.011 0.007 0.012
Initial Preparation of Jnr100 Test Result Data for Binder C
LabTest Results, x
s d h k
1 2 3 4 5 6 71 0.147 0.141 0.140 0.133 0.133 0.136 0.137 0.13827 0.00500 0.00154 0.10 0.73
2 0.135 0.146 0.146 0.137 0.144 0.134 0.136 0.13964 0.00547 0.00291 0.19 0.80
3 0.116 0.113 0.102 0.118 0.126 0.122 0.118 0.11639 0.00770 ‐0.02034 ‐1.35 1.13
4 0.149 0.145 0.150 0.162 0.167 0.148 0.147 0.15262 0.00848 0.01589 1.06 1.24
5 0.140 0.140 0.150 0.140 0.140 0.140 0.140 0.14143 0.00378 0.00376 0.29 0.60
sr sR0.138 0.013 0.006 0.014
Initial Preparation of Jnr3200 Test Result Data for Binder C
LabTest Results, x
s d h k
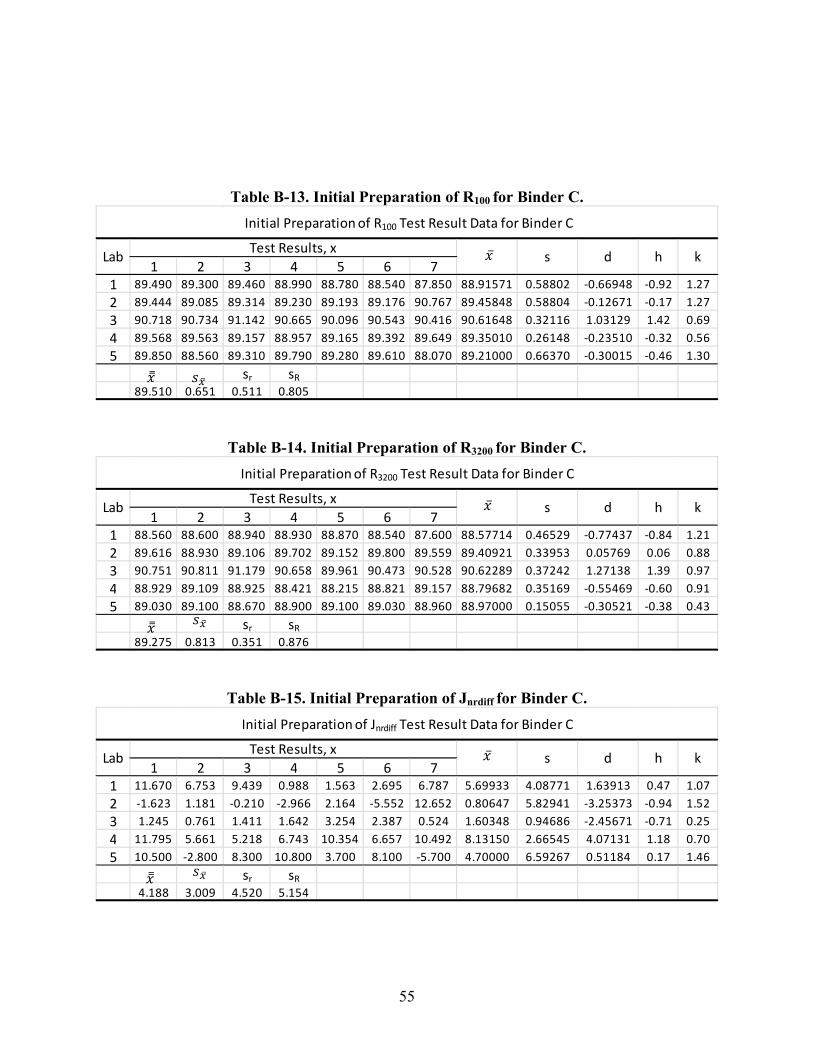
55
Table B-13. Initial Preparation of R100 for Binder C.
Table B-14. Initial Preparation of R3200 for Binder C.
Table B-15. Initial Preparation of Jnrdiff for Binder C.
1 2 3 4 5 6 71 89.490 89.300 89.460 88.990 88.780 88.540 87.850 88.91571 0.58802 ‐0.66948 ‐0.92 1.27
2 89.444 89.085 89.314 89.230 89.193 89.176 90.767 89.45848 0.58804 ‐0.12671 ‐0.17 1.27
3 90.718 90.734 91.142 90.665 90.096 90.543 90.416 90.61648 0.32116 1.03129 1.42 0.69
4 89.568 89.563 89.157 88.957 89.165 89.392 89.649 89.35010 0.26148 ‐0.23510 ‐0.32 0.56
5 89.850 88.560 89.310 89.790 89.280 89.610 88.070 89.21000 0.66370 ‐0.30015 ‐0.46 1.30
sr sR89.510 0.651 0.511 0.805
Initial Preparation of R100 Test Result Data for Binder C
LabTest Results, x
s d h k
1 2 3 4 5 6 71 88.560 88.600 88.940 88.930 88.870 88.540 87.600 88.57714 0.46529 ‐0.77437 ‐0.84 1.21
2 89.616 88.930 89.106 89.702 89.152 89.800 89.559 89.40921 0.33953 0.05769 0.06 0.88
3 90.751 90.811 91.179 90.658 89.961 90.473 90.528 90.62289 0.37242 1.27138 1.39 0.97
4 88.929 89.109 88.925 88.421 88.215 88.821 89.157 88.79682 0.35169 ‐0.55469 ‐0.60 0.91
5 89.030 89.100 88.670 88.900 89.100 89.030 88.960 88.97000 0.15055 ‐0.30521 ‐0.38 0.43
sr sR89.275 0.813 0.351 0.876
Initial Preparation of R3200 Test Result Data for Binder C
LabTest Results, x
s d h k
1 2 3 4 5 6 71 11.670 6.753 9.439 0.988 1.563 2.695 6.787 5.69933 4.08771 1.63913 0.47 1.07
2 ‐1.623 1.181 ‐0.210 ‐2.966 2.164 ‐5.552 12.652 0.80647 5.82941 ‐3.25373 ‐0.94 1.52
3 1.245 0.761 1.411 1.642 3.254 2.387 0.524 1.60348 0.94686 ‐2.45671 ‐0.71 0.25
4 11.795 5.661 5.218 6.743 10.354 6.657 10.492 8.13150 2.66545 4.07131 1.18 0.70
5 10.500 ‐2.800 8.300 10.800 3.700 8.100 ‐5.700 4.70000 6.59267 0.51184 0.17 1.46
sr sR4.188 3.009 4.520 5.154
Initial Preparation of Jnrdiff Test Result Data for Binder C
LabTest Results, x
s d h k
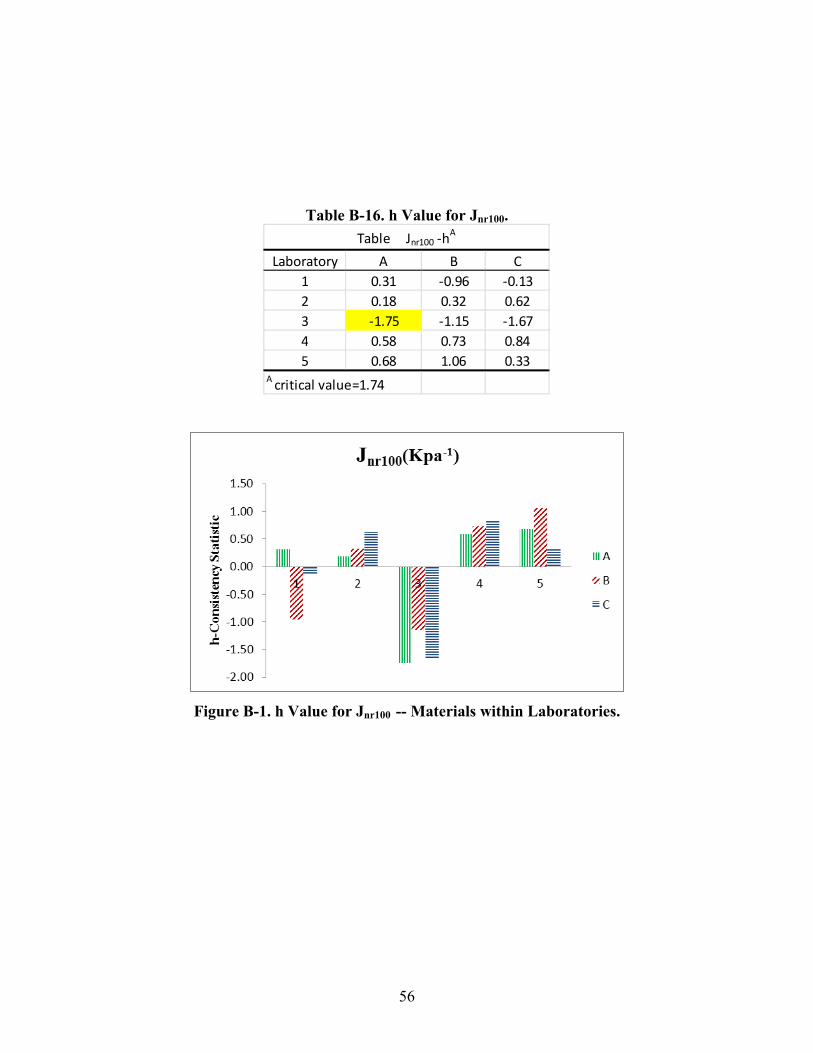
56
Table B-16. h Value for Jnr100.
Figure B-1. h Value for Jnr100 -- Materials within Laboratories.
Laboratory A B C
1 0.31 ‐0.96 ‐0.13
2 0.18 0.32 0.62
3 ‐1.75 ‐1.15 ‐1.67
4 0.58 0.73 0.84
5 0.68 1.06 0.33A critical value=1.74
Table Jnr100 ‐hA
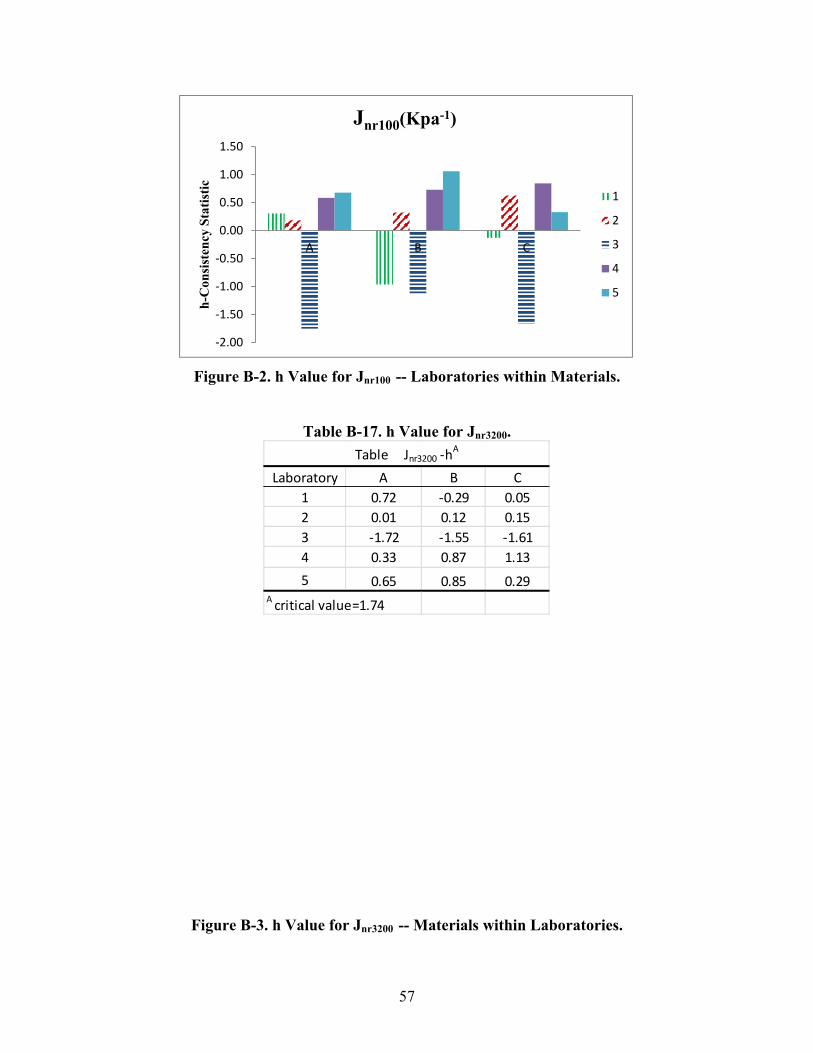
57
Figure B-2. h Value for Jnr100 -- Laboratories within Materials.
Table B-17. h Value for Jnr3200.
Figure B-3. h Value for Jnr3200 -- Materials within Laboratories.
‐2.00
‐1.50
‐1.00
‐0.50
0.00
0.50
1.00
1.50
A B C
h-C
onsi
sten
cy S
tati
stic
Jnr100(Kpa-1)
1
2
3
4
5
Laboratory A B C
1 0.72 ‐0.29 0.05
2 0.01 0.12 0.15
3 ‐1.72 ‐1.55 ‐1.61
4 0.33 0.87 1.13
5 0.65 0.85 0.29A critical value=1.74
Table Jnr3200 ‐hA
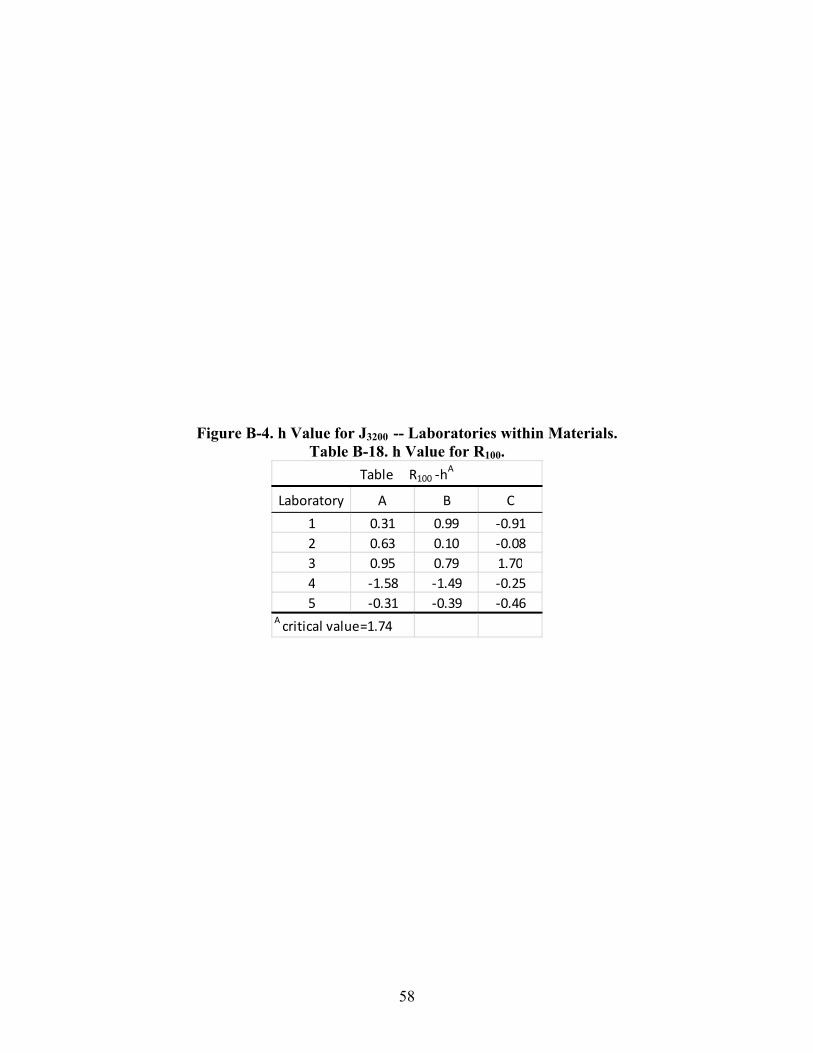
58
Figure B-4. h Value for J3200 -- Laboratories within Materials.
Table B-18. h Value for R100.
Laboratory A B C
1 0.31 0.99 ‐0.91
2 0.63 0.10 ‐0.08
3 0.95 0.79 1.70
4 ‐1.58 ‐1.49 ‐0.25
5 ‐0.31 ‐0.39 ‐0.46A critical value=1.74
Table R100 ‐hA
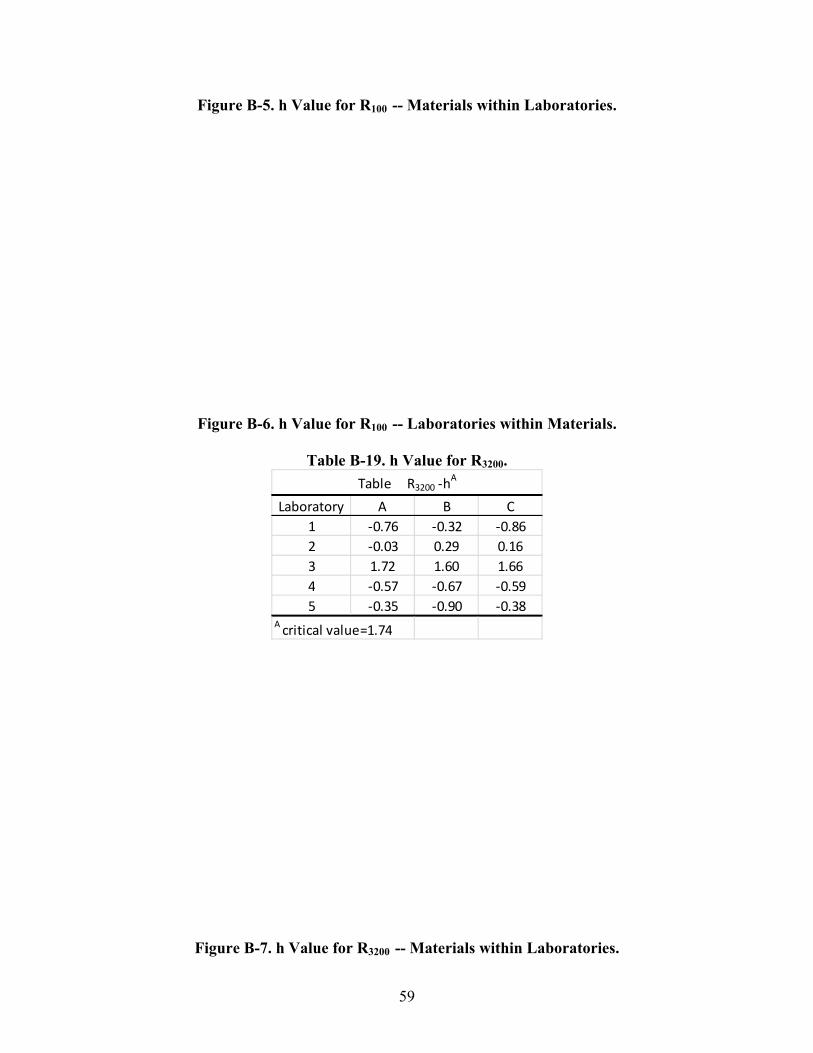
59
Figure B-5. h Value for R100 -- Materials within Laboratories.
Figure B-6. h Value for R100 -- Laboratories within Materials.
Table B-19. h Value for R3200.
Figure B-7. h Value for R3200 -- Materials within Laboratories.
Laboratory A B C
1 ‐0.76 ‐0.32 ‐0.86
2 ‐0.03 0.29 0.16
3 1.72 1.60 1.66
4 ‐0.57 ‐0.67 ‐0.59
5 ‐0.35 ‐0.90 ‐0.38A critical value=1.74
Table R3200 ‐hA
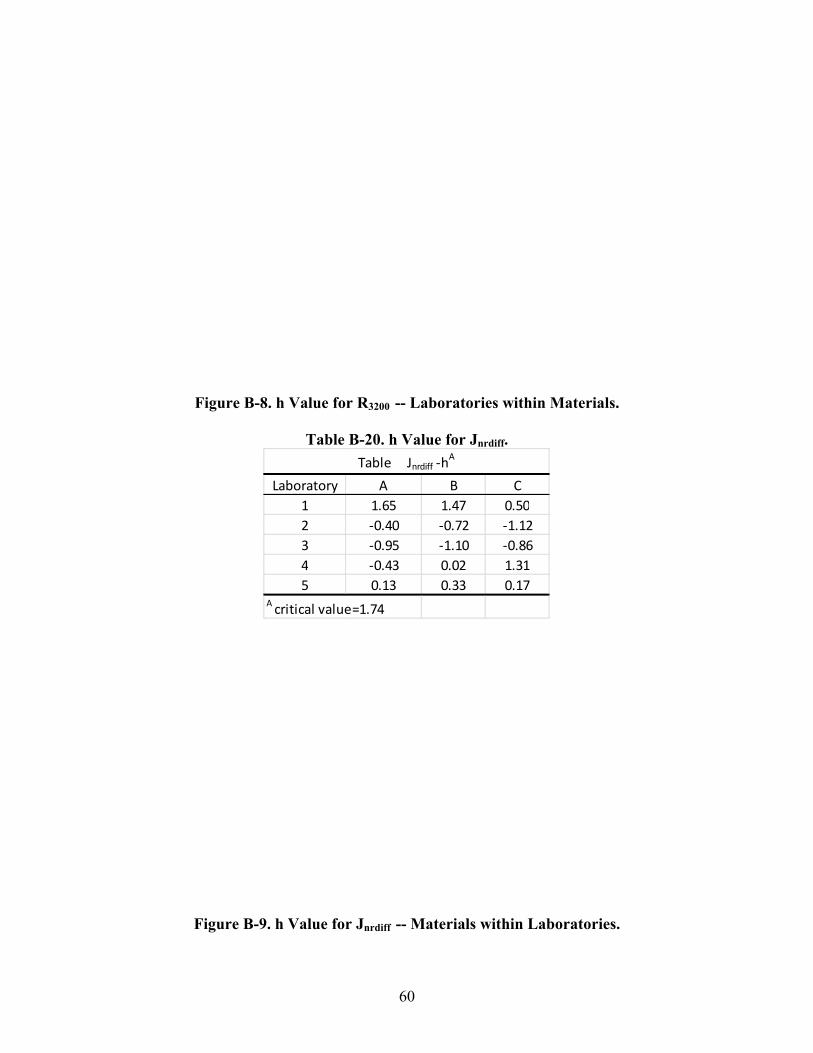
60
Figure B-8. h Value for R3200 -- Laboratories within Materials.
Table B-20. h Value for Jnrdiff.
Figure B-9. h Value for Jnrdiff -- Materials within Laboratories.
Laboratory A B C
1 1.65 1.47 0.50
2 ‐0.40 ‐0.72 ‐1.12
3 ‐0.95 ‐1.10 ‐0.86
4 ‐0.43 0.02 1.31
5 0.13 0.33 0.17A critical value=1.74
Table Jnrdiff ‐hA
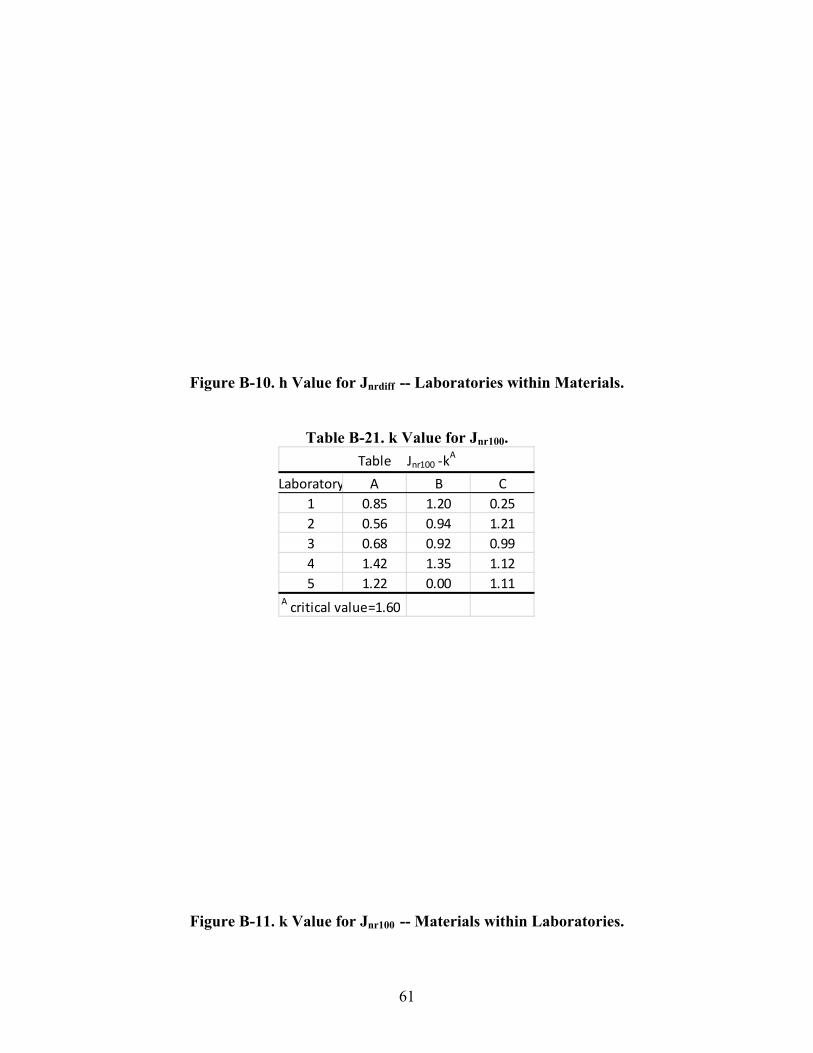
61
Figure B-10. h Value for Jnrdiff -- Laboratories within Materials.
Table B-21. k Value for Jnr100.
Figure B-11. k Value for Jnr100 -- Materials within Laboratories.
Laboratory A B C
1 0.85 1.20 0.25
2 0.56 0.94 1.21
3 0.68 0.92 0.99
4 1.42 1.35 1.12
5 1.22 0.00 1.11A critical value=1.60
Table Jnr100 ‐kA
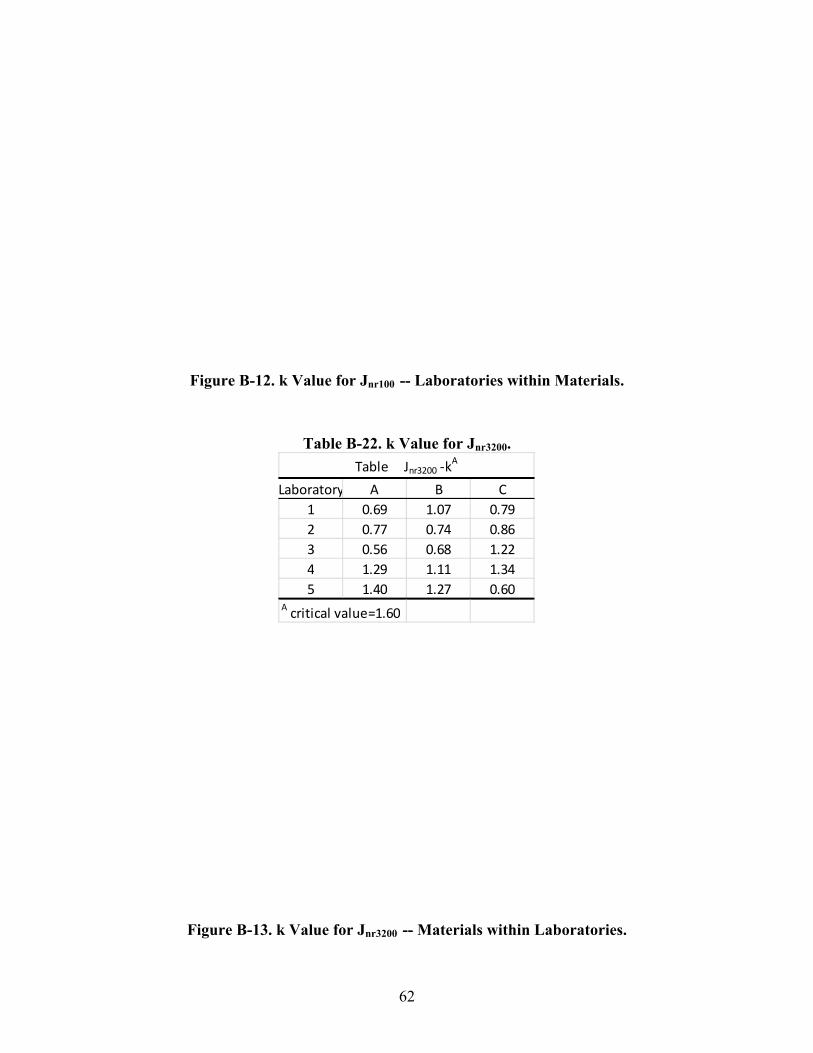
62
Figure B-12. k Value for Jnr100 -- Laboratories within Materials.
Table B-22. k Value for Jnr3200.
Figure B-13. k Value for Jnr3200 -- Materials within Laboratories.
Laboratory A B C
1 0.69 1.07 0.79
2 0.77 0.74 0.86
3 0.56 0.68 1.22
4 1.29 1.11 1.34
5 1.40 1.27 0.60A critical value=1.60
Table Jnr3200 ‐kA
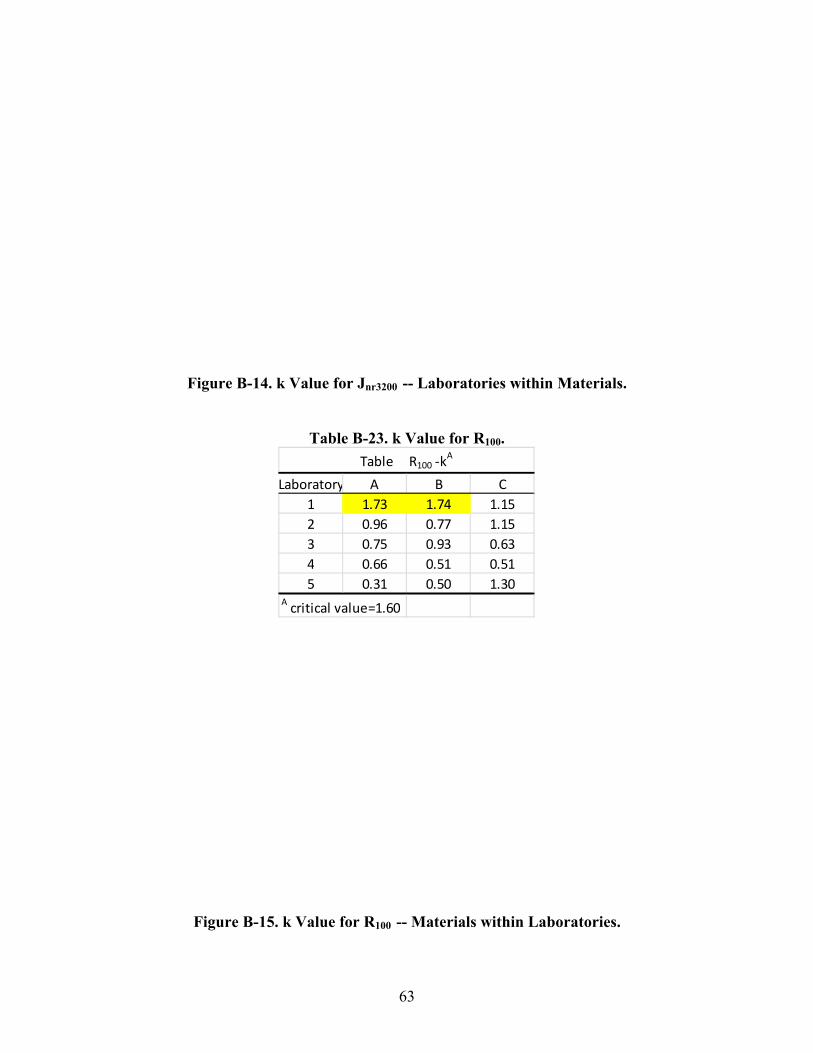
63
Figure B-14. k Value for Jnr3200 -- Laboratories within Materials.
Table B-23. k Value for R100.
Figure B-15. k Value for R100 -- Materials within Laboratories.
Laboratory A B C
1 1.73 1.74 1.15
2 0.96 0.77 1.15
3 0.75 0.93 0.63
4 0.66 0.51 0.51
5 0.31 0.50 1.30A critical value=1.60
Table R100 ‐kA
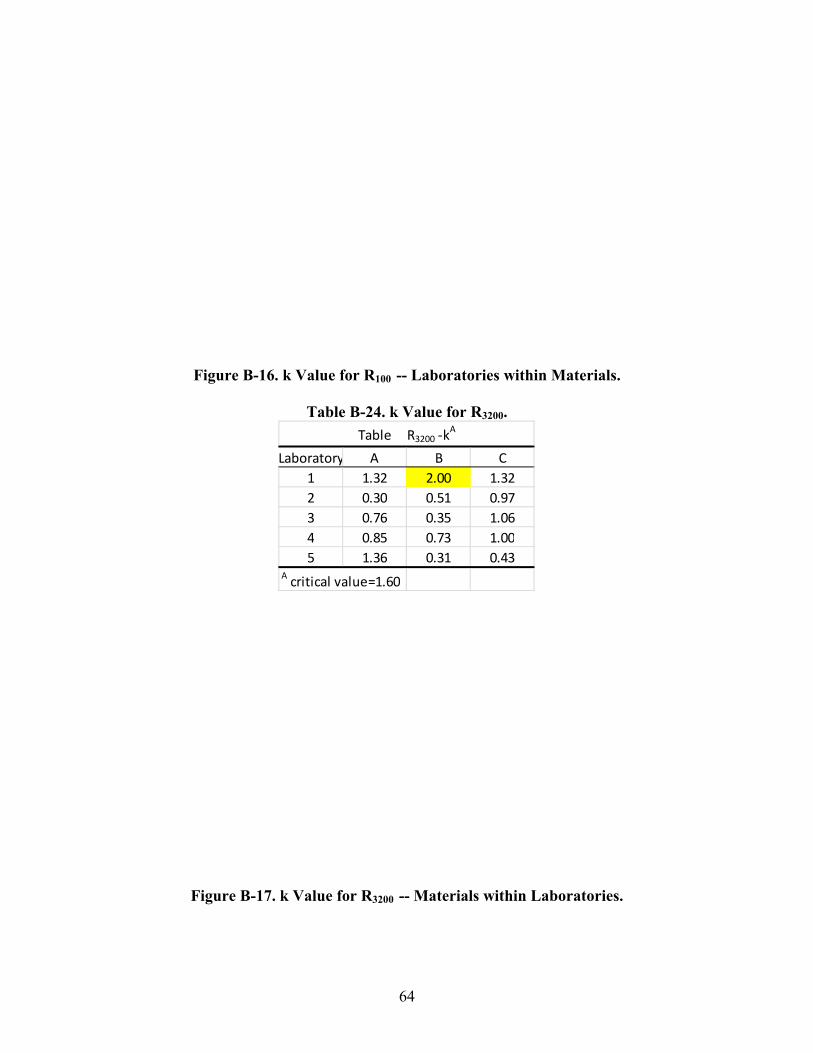
64
Figure B-16. k Value for R100 -- Laboratories within Materials.
Table B-24. k Value for R3200.
Figure B-17. k Value for R3200 -- Materials within Laboratories.
Laboratory A B C
1 1.32 2.00 1.32
2 0.30 0.51 0.97
3 0.76 0.35 1.06
4 0.85 0.73 1.00
5 1.36 0.31 0.43A critical value=1.60
Table R3200 ‐kA
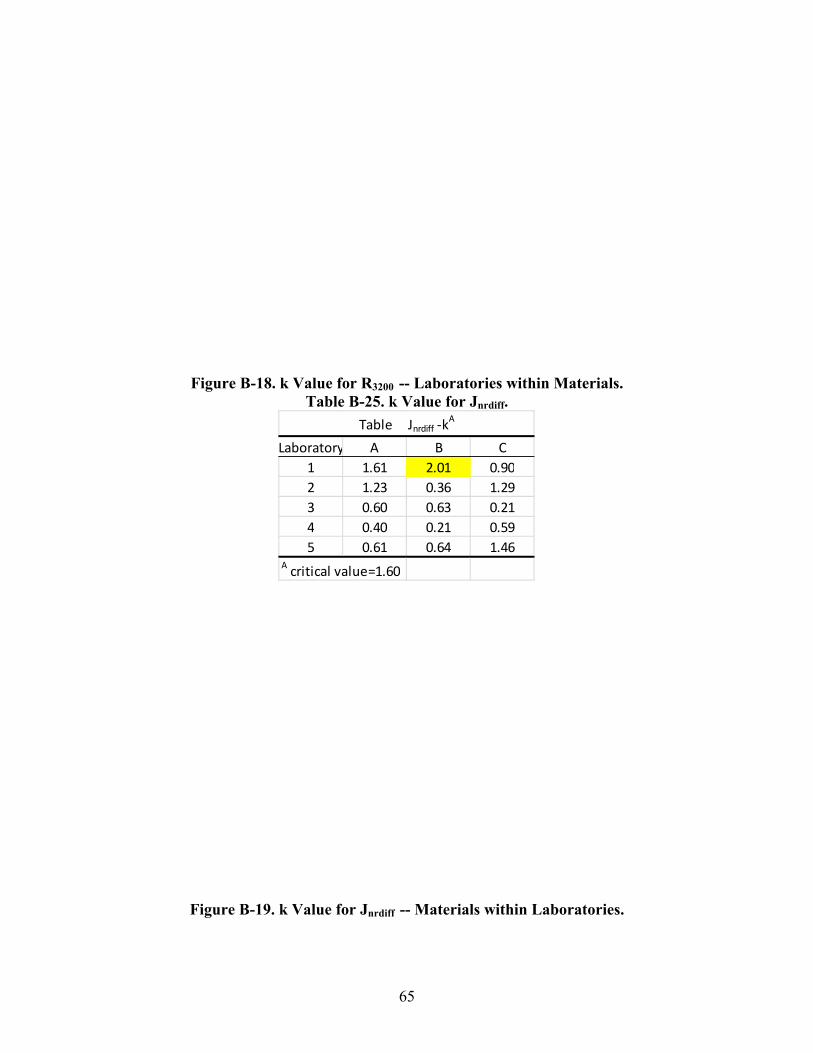
65
Figure B-18. k Value for R3200 -- Laboratories within Materials. Table B-25. k Value for Jnrdiff.
Figure B-19. k Value for Jnrdiff -- Materials within Laboratories.
Laboratory A B C
1 1.61 2.01 0.90
2 1.23 0.36 1.29
3 0.60 0.63 0.21
4 0.40 0.21 0.59
5 0.61 0.64 1.46A critical value=1.60
Table Jnrdiff ‐kA
66
Figure B-20. k Value for Jnrdiff -- Laboratories within Materials.