Embed Size (px)
Citation preview
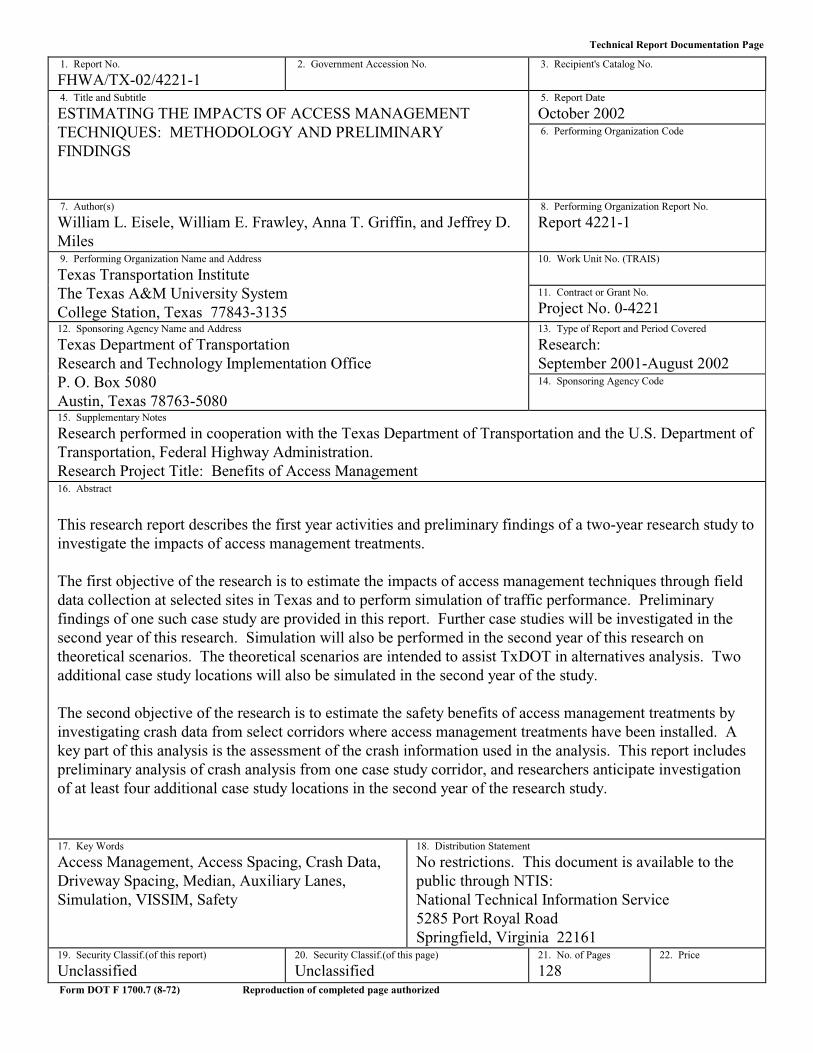
Technical Report Documentation Page
1. Report No.
FHWA/TX-02/4221-1 2. Government Accession No.
3. Recipient's Catalog No.
5. Report Date
October 2002 4. Title and Subtitle
ESTIMATING THE IMPACTS OF ACCESS MANAGEMENT TECHNIQUES: METHODOLOGY AND PRELIMINARY FINDINGS
6. Performing Organization Code
7. Author(s)
William L. Eisele, William E. Frawley, Anna T. Griffin, and Jeffrey D. Miles
8. Performing Organization Report No.
Report 4221-1
10. Work Unit No. (TRAIS)
9. Performing Organization Name and Address
Texas Transportation Institute The Texas A&M University System College Station, Texas 77843-3135
11. Contract or Grant No.
Project No. 0-4221 13. Type of Report and Period Covered
Research: September 2001-August 2002
12. Sponsoring Agency Name and Address
Texas Department of Transportation Research and Technology Implementation Office P. O. Box 5080 Austin, Texas 78763-5080
14. Sponsoring Agency Code
15. Supplementary Notes
Research performed in cooperation with the Texas Department of Transportation and the U.S. Department of Transportation, Federal Highway Administration. Research Project Title: Benefits of Access Management 16. Abstract
This research report describes the first year activities and preliminary findings of a two-year research study to investigate the impacts of access management treatments. The first objective of the research is to estimate the impacts of access management techniques through field data collection at selected sites in Texas and to perform simulation of traffic performance. Preliminary findings of one such case study are provided in this report. Further case studies will be investigated in the second year of this research. Simulation will also be performed in the second year of this research on theoretical scenarios. The theoretical scenarios are intended to assist TxDOT in alternatives analysis. Two additional case study locations will also be simulated in the second year of the study. The second objective of the research is to estimate the safety benefits of access management treatments by investigating crash data from select corridors where access management treatments have been installed. A key part of this analysis is the assessment of the crash information used in the analysis. This report includes preliminary analysis of crash analysis from one case study corridor, and researchers anticipate investigation of at least four additional case study locations in the second year of the research study. 17. Key Words
Access Management, Access Spacing, Crash Data, Driveway Spacing, Median, Auxiliary Lanes, Simulation, VISSIM, Safety
18. Distribution Statement
No restrictions. This document is available to the public through NTIS: National Technical Information Service 5285 Port Royal Road Springfield, Virginia 22161
19. Security Classif.(of this report)
Unclassified 20. Security Classif.(of this page)
Unclassified 21. No. of Pages
128 22. Price
Form DOT F 1700.7 (8-72) Reproduction of completed page authorized

ESTIMATING THE IMPACTS OF ACCESS MANAGEMENT
TECHNIQUES: METHODOLOGY AND PRELIMINARY FINDINGS
by
William L. Eisele, Ph.D., P.E. Associate Research Engineer Texas Transportation Institute
William E. Frawley, AICP Associate Research Scientist
Texas Transportation Institute
Anna T. Griffin Graduate Assistant Research
Texas Transportation Institute
Jeffrey D. Miles Undergraduate Fellow
Texas Transportation Institute
Report 4221-1 Project Number 0-4221
Research Project Title: Benefits of Access Management
Sponsored by the Texas Department of Transportation
In Cooperation with the U.S. Department of Transportation Federal Highway Administration
October 2002
TEXAS TRANSPORTATION INSTITUTE The Texas A&M University System College Station, Texas 77843-3135


v
DISCLAIMER
The contents of this report reflect the views of the authors, who are responsible for the facts and
the accuracy of the data presented herein. The contents do not necessarily reflect the official
views or policies of the Texas Department of Transportation (TxDOT) or the Federal Highway
Administration (FHWA). This report does not constitute a standard, specification, or regulation.
The engineer in charge of this project was William L. Eisele (P.E. #85445).

vi
ACKNOWLEDGMENTS
The authors would like to thank Mr. Wes McClure, P.E., and Ms. Mary Owen, P.E., the project
director and program coordinator, respectively, for providing valuable insight and support to the
research team throughout this research project.
The authors would also like to thank the TxDOT project advisory committee and the TxDOT
internal stakeholder members who provided feedback and recommendations throughout the
project. They are alphabetically listed as follows:
♦ Mr. Robert Appleton
♦ Ms. Julia Brown
♦ Mr. Stuart Corder
♦ Mr. Andrew Griffith
♦ Mr. Jim Heacock
♦ Mr. Ed Kabobel
♦ Mr. Mark Marek
♦ Ms. Rory Meza
♦ Ms. Martha Norwood
♦ Mr. Khali Persad
♦ Ms. Shelia Stifflemire
The authors would also like to thank the following individuals for their assistance in the
development of this research and research report.
♦ Mr. Eric Dusza: VISSIM programming and data collection;
♦ Mr. Ivan Lorenz: report graphics;
♦ Ms. Claire Roth: VISSIM programming and data collection;
♦ Ms. Pam Rowe: report preparation; and
♦ Ms. Casey Toycen: VISSIM programming and data collection.
vii
TABLE OF CONTENTS
LIST OF FIGURES.......................................................................................................................x
LIST OF TABLES.......................................................................................................................xii
1 Introduction.................................................................................................................1
1.1 Project Objectives..............................................................................................2
1.2 Project Procedure...............................................................................................3
1.2.1 Identify Relevant Literature ....................................................................3
1.2.2 Identify Analysis Tools and Prioritize Access Management
Techniques .........................................................................................3
1.2.3 Identify Study Corridors and Perform Data Collection...........................4
1.2.4 Analyze and Summarize Case Study ......................................................4
1.2.5 Perform Sensitivity Analysis...................................................................4
1.3 Report Organization ..........................................................................................5
2 Simulation Methodology and Preliminary Findings...................................................7
2.1 Simulation Case Study Locations ......................................................................7
2.2 VISSIM Model ..................................................................................................8
2.2.1 Inputs and Coding ...................................................................................8
2.2.2 Testing and Calibration ...........................................................................9
2.3 Discussion of Preliminary Simulation Findings ................................................9
2.4 Texas Avenue (Bryan) Case Study Location...................................................10
2.4.1 General Description ..............................................................................10
2.4.2 Traffic Operations Analysis ..................................................................12
2.4.3 Discussion .............................................................................................19
2.5 31st Street (Temple) Case Study Location .......................................................20
2.5.1 General Description ..............................................................................20
2.5.2 Traffic Operations Analysis ..................................................................22
viii
TABLE OF CONTENTS (CONTINUED)
2.6 Broadway Avenue (Tyler) Case Study Location .............................................22
2.6.1 General Description ..............................................................................22
2.6.2 Traffic Operations Analysis ..................................................................24
2.7 Theoretical Corridors.......................................................................................24
3 Crash Analysis Methodology and Findings..............................................................25
3.1 Crash Analysis Case Study Locations .............................................................25
3.2 Texas Avenue (College Station) Case Study Location....................................26
3.2.1 General Description ..............................................................................26
3.2.2 Data Collection .....................................................................................29
3.2.3 Traffic Demand .....................................................................................38
3.2.4 Crash Analysis Procedure .....................................................................39
3.2.5 Crash Analysis Results..........................................................................44
3.2.6 Comparison Group................................................................................56
3.2.7 Recommendations and Discussion........................................................58
3.3 Loop 281 (Longview) Case Study Location ....................................................59
3.3.1 General Description ..............................................................................59
3.3.2 Crash Analysis ......................................................................................60
3.4 Call Field Road (Wichita Falls) Case Study Location.....................................61
3.4.1 General Description ..............................................................................61
3.4.2 Crash Analysis ......................................................................................61
3.5 Grant Avenue (Odessa) Case Study Location .................................................62
3.5.1 General Description ..............................................................................62
3.5.2 Crash Analysis ......................................................................................62
3.6 71st Street (Tulsa, Oklahoma) Case Study Location........................................63
3.6.1 General Description ..............................................................................63
3.6.2 Crash Analysis ......................................................................................64
ix
TABLE OF CONTENTS (CONTINUED)
4 Preliminary Findings and Discussion .......................................................................65
4.1 Traffic Flow Impacts .......................................................................................65
4.2 Safety Impacts..................................................................................................66
4.3 Crash Data Availability and Reliability...........................................................66
4.4 Future Research ...............................................................................................67
5 References ...............................................................................................................69
Appendix A: VISSIM Simulation ................................................................................................71
Appendix B: Crash-Reporting Process.........................................................................................77
Appendix C: Crash Analysis Data................................................................................................91
x
LIST OF FIGURES
Figure Page
2-1 Texas Avenue Study Site in Bryan, Texas, Used for Crash Analysis ............................11
2-2 Texas Avenue Facing North from Villa Maria...............................................................11
2-3 Texas Avenue Facing North with Villa Maria in the Background .................................12
2-4 Schematic to Illustrate Approximate Driveway, Street, and U-turn Locations for
Operational Scenarios...............................................................................................16
2-5 Southbound 31st Street at Colonial Mall Entrance .........................................................21
2-6 Northbound 31st Street, North of Canyon Creek Road...................................................21
2-7 Broadway Avenue Facing North to Chimney Rock Signalized Intersection..................23
2-8 Broadway Avenue Facing South at Chimney Rock Signalized Intersection..................23
3-1 Texas Avenue Study Site in College Station, Texas, Used for Crash Analysis .............27
3-2 Raised Median Treatment on Texas Avenue Showing Cross Section ...........................28
3-3 Raised Median Treatment on Texas Avenue Showing Median Openings .....................28
3-4 Crash-Reporting Process Flowchart ...............................................................................34
3-5 Crash Diagram Symbols .................................................................................................40
3-6 Before Period at Texas Avenue and Dominik Drive ......................................................40
3-7 Before Period at Texas Avenue and George Bush Drive ...............................................41
3-8 Texas Avenue Crash Summary ......................................................................................48
3-9 Texas Avenue Crash Type Summary .............................................................................49
3-10 Raised Median Restricting Left Turns at Dominik Drive...............................................50
3-11 Map Showing Dominik Drive and Surrounding Street Network ...................................52
3-12 Summary of Injuries in the Before Period for the Texas Avenue Corridor....................55
3-13 Summary of Injuries in the After Period for the Texas Avenue Corridor ......................55
3-14 Summary of Crashes in the Comparison Group .............................................................57
3-15 Loop 281 in Longview....................................................................................................60
3-16 Call Field Road in Wichita Falls ....................................................................................61
3-17 Grant Avenue (US 385) in Odessa .................................................................................62
3-18 71st Street at Memorial Drive in Tulsa, OK....................................................................63
xi
LIST OF FIGURES (CONTINUED)
B-1 Page 1 of a ST-3, Police Crash Report ...........................................................................79
B-2 Page 2 of a ST-3, Police Crash Report ...........................................................................80
B-3 Page 1 of a ST-2, DPS “Blue Form” ..............................................................................81
B-4 Page 2 of a ST-2, DPS “Blue Form” ..............................................................................82
B-5 College Station Police Department (CSPD) Crash Data File.........................................84
B-6 Page 1 of a Crash Records Information System (CRIS) Newsletter...............................85
B-7 Page 2 of a Crash Records Information System (CRIS) Newsletter...............................86
xii
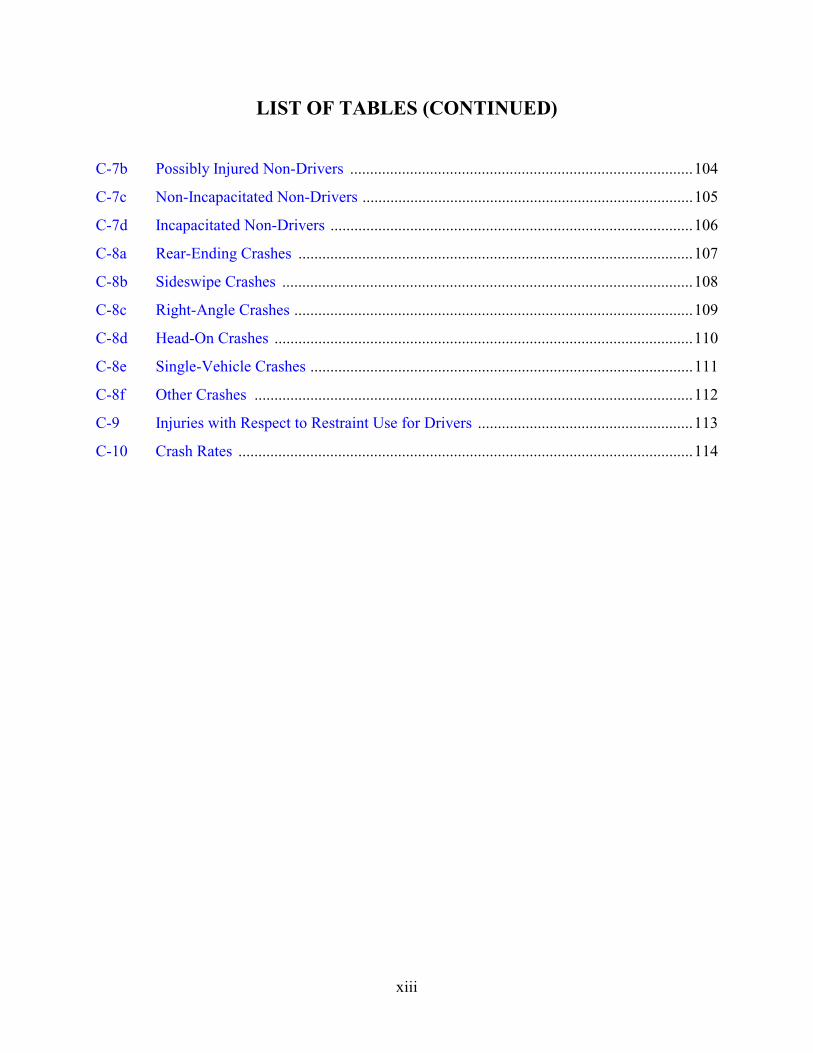
LIST OF TABLES
Table Page
2-1 Texas Avenue Existing Conflict Points..........................................................................14
2-2 Texas Avenue Proposed Condition Conflict Points .......................................................15
2-3 Texas Avenue Preliminary Travel Time Analysis Findings...........................................18
2-4 Texas Avenue Preliminary Average Delay Analysis Findings.......................................19
3-1 AADT Counts.................................................................................................................38
3-2 Entering Traffic Volumes ...............................................................................................39
3-3 Milepoint Locations Used to Calculate the Intersection and Section Crash Rates.........42
3-4 Total Conflict Points along Texas Avenue for the Before Period ..................................45
3-5 Total Conflict Points along Texas Avenue for the After Period ...................................46
3-6 Summary of Crash Reduction on the Texas Avenue Corridor .......................................47
3-7 Summary of Crashes by Crash Type...............................................................................49
3-8 Sideswipe Crashes ..........................................................................................................50
3-9 Right-Angle Crashes.......................................................................................................53
3-10 Summary Crash Rates.....................................................................................................54
3-11 Summary of Injuries .......................................................................................................54
3-12 Summary of Comparison of Texas Avenue Corridor to Comparison Group.................58
C-1 Total Crashes ..................................................................................................................94
C-2 Total People....................................................................................................................95
C-3 Drivers… ........................................................................................................................96
C-4 Non-Drivers ....................................................................................................................97
C-5 Fatalities .........................................................................................................................98
C-6a Non-Injured Drivers .......................................................................................................99
C-6b Possibly Injured Drivers ..............................................................................................100
C-6c Non-Incapacitated Drivers ...........................................................................................101
C-6d Incapacitated Drivers ...................................................................................................102
C-7a Non-Injured Non-Drivers ............................................................................................103
xiii
LIST OF TABLES (CONTINUED)
C-7b Possibly Injured Non-Drivers ......................................................................................104
C-7c Non-Incapacitated Non-Drivers ...................................................................................105
C-7d Incapacitated Non-Drivers ...........................................................................................106
C-8a Rear-Ending Crashes ...................................................................................................107
C-8b Sideswipe Crashes .......................................................................................................108
C-8c Right-Angle Crashes ....................................................................................................109
C-8d Head-On Crashes .........................................................................................................110
C-8e Single-Vehicle Crashes ................................................................................................111
C-8f Other Crashes ..............................................................................................................112
C-9 Injuries with Respect to Restraint Use for Drivers ......................................................113
C-10 Crash Rates ..................................................................................................................114

xiv
1
CHAPTER 1
INTRODUCTION
Traffic volumes and congestion have increased in recent years, particularly on arterial streets.
The primary purpose of arterial streets is the movement of vehicles, while providing necessary
access to residential and commercial developments. If unlimited access is provided directly from
businesses and/or residences to arterial streets, average speeds decrease, and the capacity of the
arterial diminishes. Frequent access also presents safety concerns by providing more locations
for potential conflicts of vehicles’ paths. Solutions in the past have involved building relief
routes to the arterial. It is very common, however, for the same problems to eventually occur on
the relief route. In some cases, tertiary relief routes have also been built.
A better, more cost efficient alternative to building relief routes is incorporating access
management techniques into the design of arterials. This practice is most successful when
originally included in the design of the arterial, but it can also be applied through retrofit projects
on existing roads. By using access management techniques such as raised medians, turn lanes,
auxiliary lanes, median opening spacing, and driveway spacing, the public investment in the
arterial is protected by preserving its function of moving vehicles. Such design methods also
provide a safer street for the motoring public by decreasing the potential number of conflict
points occurring at intersections.
In recent years, there has been increased interest in access management principles and techniques
in Texas. Several Texas Department of Transportation (TxDOT) district and division staff
members have expressed a desire to have access management guidelines in place to help them
design arterial facilities and to help manage access locations. Recent research performed by the
Texas Transportation Institute (TTI) identified recommended guidance of geometric criteria for
different access management techniques by access classification. The research project upon
which this report is based is intended to estimate the impacts of access management techniques.
2
1.1 PROJECT OBJECTIVES
The primary objectives of this research effort include the following:
1. Estimate the impacts of access management techniques through field data collection at
selected sites in Texas and simulation of traffic performance. Simulation will also be
performed on theoretical scenarios. These scenarios will be created for use by TxDOT
after completion of the research project.
2. Estimate the safety benefits of access management treatments by investigating crash data
from selected sites in Texas and Oklahoma where access management treatments are
installed. A key part of the crash analysis will be assessing the quality of the crash
information used in the analysis.
These objectives both focus on estimating the impacts of access management treatments—either
by simulation of traffic performance or by investigating crash data. In the first year of the
research project, the research team focused on portions of both objectives. Simulation of one
corridor was performed, and preliminary findings are included in this report. It should be noted
that the simulation findings are preliminary because the research team has learned more about the
abilities and limitations of the micro-simulation package Verkehr in Städten Simulation (Traffic
in Cities-Simulation) (VISSIM). The research team may re-evaluate the Texas corridor in the
second year of the study. The reader is encouraged to review section 2.3 of this report for more
information regarding the preliminary nature of the findings in this report. Further simulation
will be performed along two corridors in the second year of the study. The research team is also
developing theoretical scenarios that TxDOT can use in alternatives analysis of various arterial
street configurations with access management treatments.
The second objective was also addressed in the first year of the study. Extensive quality
assurance of the crash data along one study corridor in College Station, Texas, was performed,
and the preliminary findings are presented in this report. Preliminary findings of crash trends are
3
also reported for this location where a two-way left-turn lane (TWLTL) was replaced with a
raised median. Discussion is provided of other locations where crash data were collected, and
analysis will continue into the next year of the study.
1.2 PROJECT PROCEDURE
During the first year of the research project, the research team completed several portions of
tasks identified in the project. These are described below.
1.2.1 Identify Relevant Literature
The task to review the state-of-the-practice was removed from the original work proposal due to
a reduction in the project budget. However, the research team needed to review some literature
related to crash studies. The research team was also familiar with references on the subject
necessary for the analysis.
1.2.2 Identify Analysis Tools and Prioritize Access Management Techniques
This second task in the original proposal was also removed due to budget reductions. The
literature review was intended to identify many different simulation models and/or procedures for
use in quantifying the benefits of access management techniques. The research team chose to use
the VISSIM microscopic simulation software package based upon its ability to model median
treatments along arterial streets. The research team also investigated relevant literature on the
VISSIM model as part of this task.
This task was intended to determine which access management techniques would be investigated
in the research project. This was achieved through project advisory group meetings. The primary
access management treatments to be investigated were raised medians and driveway
consolidations.
4
1.2.3 Identify Study Corridors and Perform Data Collection
This task was also partially completed in the first year of the research project. Case study
locations were identified for both the simulation and crash studies. Researchers collected field
data at one case study location to investigate the operational improvement alternatives due to
access management techniques by simulation. Crash data were collected at four locations for the
crash analysis.
1.2.4 Analyze and Summarize Case Study
The coding and operation of the VISSIM software is quite extensive. However, preliminary
findings along one of the corridors being investigated through simulation are provided in this
report (see section 2.3 for limitations). Researchers also performed quality control of the crash
data at one case study location in the first year of this research project, and it will continue into
next year on the remaining study corridors. Preliminary crash study information is provided in
this report and will also continue into the second year of the research project.
1.2.5 Perform Sensitivity Analysis
This task is intended to be performed for varying traffic conditions and access management
treatments for which field case study locations could not be identified. Because not all access
management treatments and differing traffic conditions will be found in the case studies, this
analysis is intended to “fill the gaps” between the conditions that could be analyzed directly from
the actual case study locations and other situations of interest. At the end of the first year of this
study, the research team met with TxDOT staff to identify the most useful scenarios to create in a
VISSIM environment for TxDOT’s future use with alternatives analysis. Of the inputs needed by
VISSIM, traffic characteristics, scenarios, and other inputs of particular use to TxDOT were
identified. The scenarios for the sensitivity analysis will be more fully developed in the second
year of the research.
5
Finally, many detailed steps are required for the operation of VISSIM. The research team
developed a more simplified list of steps for use with accompanying default values and necessary
inputs for application of the scenarios by TxDOT.
1.3 REPORT ORGANIZATION
This report is organized into five chapters, as described below:
♦ Chapter 1, Introduction. This chapter presents an introduction to the research topic,
objectives, and procedures.
♦ Chapter 2, Simulation Methodology and Preliminary Findings. This chapter discusses the
VISSIM model used for simulation of traffic performance with access management
treatments. This chapter also presents preliminary findings of a case study analysis.
♦ Chapter 3, Crash Analysis Methodology and Findings. This chapter discusses the quality
assurance that was performed on the crash data obtained for the sites that were selected for the
estimation of the safety benefits of access management treatments. Preliminary findings are
also presented from one case study location.
♦ Chapter 4, Preliminary Findings and Discussion. This chapter describes the
recommendations and discussion related to the findings and ongoing activities discussed in the
report.
♦ Chapter 5, References. This chapter lists the references used in this report.

7
CHAPTER 2
SIMULATION METHODOLOGY AND PRELIMINARY FINDINGS
This chapter describes the simulation performed in VISSIM to evaluate the traffic operation
along select corridors in Texas before and after the implementation of access management
treatments. Three case studies are described. One case study location was completed in the first
year of the study, and preliminary findings of the analysis are included. Discussion of the
remaining two corridors includes descriptions of the case study locations. They will be simulated
further in the second year of this research project.
In addition to the three case study locations that are simulated in VISSIM, theoretical corridors
will be developed on which the impacts of different access management treatments will be
assessed. TxDOT will be able to use the corridors to analyze alternatives for differing traffic
operations. The theoretical corridors will be investigated further in the second year of this
research project.
2.1 SIMULATION CASE STUDY LOCATIONS
Researchers identified three case study locations for simulation analysis in Texas. Simulation
will be performed on traffic performance before and after access management alternatives are
implemented. The three case study locations are:
♦ Texas Avenue in College Station,
♦ 31st Street in Temple, and
♦ Broadway Road in Tyler.
These case study locations are described in further detail in the sections that follow.
8
2.2 VISSIM MODEL
VISSIM is a microscopic, time step, and behavior-based model developed to simulate urban
traffic and transit operations (1). This modeling tool was chosen for its unique ability to simulate
the specific, complex multiple-conflict points and dynamics associated with the TWLTL arterial
environment. The research team used the model to quantify the performance measures of travel
time and delay along the study corridors.
VISSIM is an ideal tool for modeling the change from a TWLTL to a raised median because of
the dynamic routing system, which is unique to VISSIM. When a route is taken away (i.e., a left-
turn movement is eliminated when a raised median is installed), the vehicle automatically finds
the next shortest route, which is the next median opening. VISSIM can also animate the
simulation. Therefore, the user visually identifies any problems occurring in the model and
checks the model for accuracy. This is also an informative tool that the public can easily see and
understand.
Although VISSIM is a good tool for modeling, it cannot optimize signal timings. Whenever
changes in traffic volumes or roadway geometrics are made, the user must optimize the signal
timings, allowing maximum flow of vehicles through the intersection. Comparing the
incremental benefits of various alternatives is more accurate when all the scenarios have
optimized signal timings.
2.2.1 Inputs and Coding
The first step in creating the model was gathering the necessary data. The research team obtained
an aerial photograph of the site for use as the background in VISSIM. Researchers manually
collected the necessary geometrics such as lane configurations, lane widths, driveway widths,
distance between driveways, and lengths of dedicated lanes. They also collected traffic volumes
on the mainlanes and turning movement counts at the signalized intersections and the driveways
along the corridor. These counts were taken during the noon and evening peak hours.
9
Researchers also obtained signal timings for the signalized intersections on the corridor. Finally,
the team completed travel time runs using the floating-car method (2) in both directions on the
corridor during the peak hour. The data collected during the travel times runs were used in the
calibration process.
Research team members input all the information gathered into VISSIM, which is often a tedious
task. For a new user, this can be a very time-consuming process. However, as the user becomes
more familiar with the procedures, this stage of the modeling procedure becomes easier and less
time-consuming. For a more detailed description of the inputs and coding process, refer to the
VISSIM simulation procedure in Appendix A.
2.2.2 Testing and Calibration
Once the model was completed, it was tested and calibrated. Researchers reviewed the on-screen
animation and model outputs to determine the model’s accuracy in simulating field operations.
The user then viewed the on-screen animation to check the realism of queue lengths. Computer
operators then compared the travel time outputs to those collected with the field travel times
runs. Speed distributions were altered slightly so that the model’s travel times would be similar
to the travel times collected in the field.
2.3 DISCUSSION OF PRELIMINARY SIMULATION FINDINGS
The simulation findings provided in this report are preliminary, as indicated in several locations
throughout this report. While the VISSIM model appears to be a very promising micro-
simulation tool for simulating access management treatments, there is a steep learning curve for
analysts. The research team continues to learn more about the model, and may re-evaluate the
findings of this report in the second year of this research effort.
One specific consideration within VISSIM is the fact that micro-simulation results should be
based on numerous runs of the same conditions along a corridor. The preliminary travel time and
10
delay findings provided in this report are the result of one simulation run. Final results should be
based on several operational runs from which an average can be taken due to the numerous
operational complexities occurring along a given corridor and because VISSIM is a random
model. One other consideration is the manner in which VISSIM routes vehicles, especially when
U-turns are present, and the research team will look further at this when investigating the
theoretical corridors (see section 2.7) in the second year of the research project.
2.4 TEXAS AVENUE (BRYAN) CASE STUDY LOCATION
2.4.1 General Description
Texas Avenue is a five-lane major arterial with a continuous two-way left-turn lane. The major
traffic generators along this section of Texas Avenue include fast-food restaurants, a drug store, a
bank, office buildings, and a shopping center anchored by a large video store. Various retail and
commercial developments also exist along this section. Currently, a TWLTL serves as the
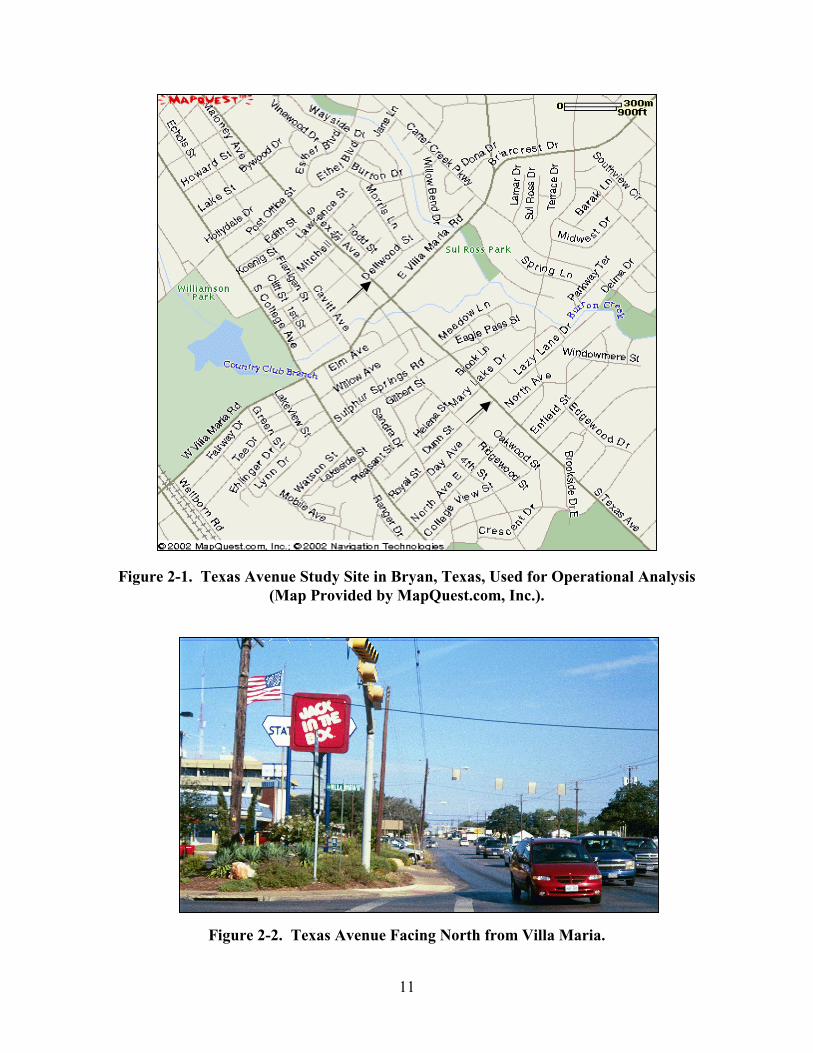
median treatment along this section of Texas Avenue. Figure 2-1 shows the study site between
the two arrows along Texas Avenue. The northbound view of the Texas Avenue corridor is
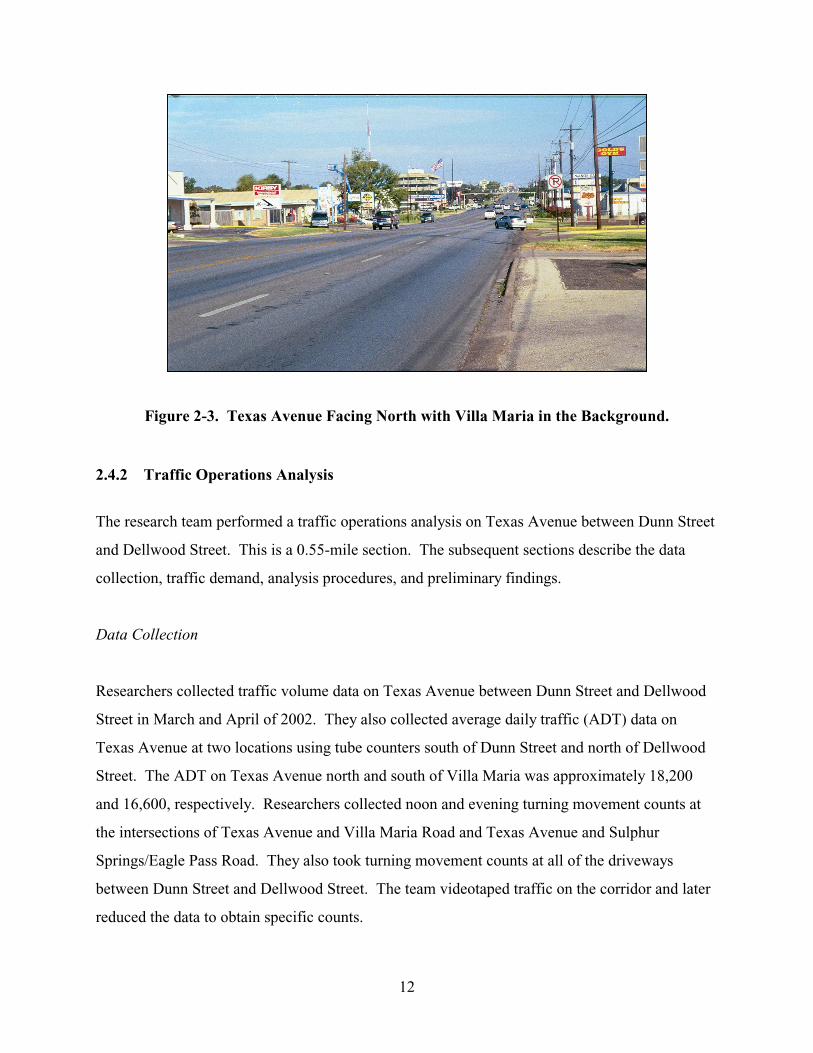
shown in Figure 2-2 from the Villa Maria signalized intersection. Figure 2-3 shows the TWLTL
along Texas Avenue with the Villa Maria intersection in the background.
11
Figure 2-1. Texas Avenue Study Site in Bryan, Texas, Used for Operational Analysis (Map Provided by MapQuest.com, Inc.).
Figure 2-2. Texas Avenue Facing North from Villa Maria.
12
Figure 2-3. Texas Avenue Facing North with Villa Maria in the Background.
2.4.2 Traffic Operations Analysis
The research team performed a traffic operations analysis on Texas Avenue between Dunn Street
and Dellwood Street. This is a 0.55-mile section. The subsequent sections describe the data
collection, traffic demand, analysis procedures, and preliminary findings.
Data Collection
Researchers collected traffic volume data on Texas Avenue between Dunn Street and Dellwood
Street in March and April of 2002. They also collected average daily traffic (ADT) data on
Texas Avenue at two locations using tube counters south of Dunn Street and north of Dellwood
Street. The ADT on Texas Avenue north and south of Villa Maria was approximately 18,200
and 16,600, respectively. Researchers collected noon and evening turning movement counts at
the intersections of Texas Avenue and Villa Maria Road and Texas Avenue and Sulphur
Springs/Eagle Pass Road. They also took turning movement counts at all of the driveways
between Dunn Street and Dellwood Street. The team videotaped traffic on the corridor and later
reduced the data to obtain specific counts.
13
Traffic Demand
Researchers evaluated existing and proposed conditions using existing traffic volumes. The
noon peak hour consisted of the highest mainlane and driveway traffic volumes; therefore, the
team used the noon peak hour volumes for the operational analysis.
For the raised median condition, existing traffic volumes were rerouted to alternative routes to
reach their destination. For example, a left-turning motorist that was prohibited by the
installation of the raised median would first turn right and then make a U-turn at the first median
opening.
Vehicle Conflict Points
As part of this study, researchers conducted an evaluation of vehicle conflict points for existing
and proposed conditions. Existing conditions of Texas Avenue consist of a five-lane arterial
with a TWLTL. At the intersections of Texas Avenue with Villa Maria Road and Eagle Pass/
Sulphur Springs Road, there is a transition to a conventional left-turn lane.
Previous research suggests that a TWLTL providing access to numerous driveways can be a
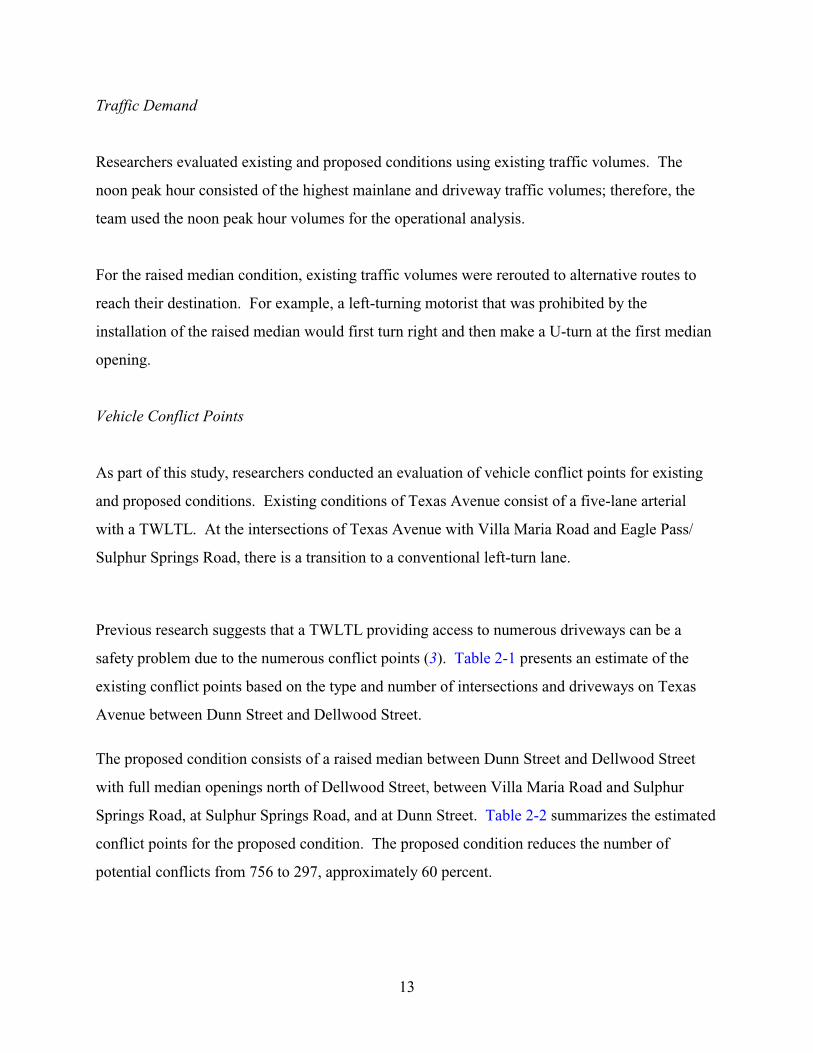
safety problem due to the numerous conflict points (3). Table 2-1 presents an estimate of the
existing conflict points based on the type and number of intersections and driveways on Texas
Avenue between Dunn Street and Dellwood Street.
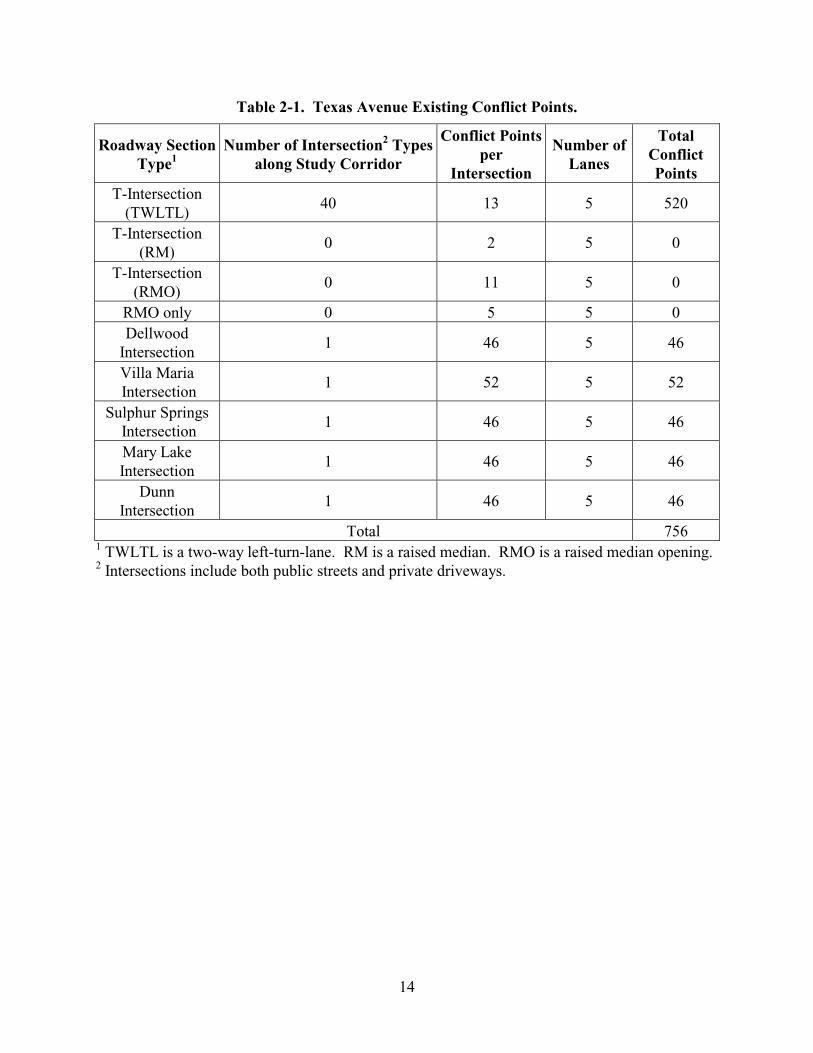
The proposed condition consists of a raised median between Dunn Street and Dellwood Street
with full median openings north of Dellwood Street, between Villa Maria Road and Sulphur
Springs Road, at Sulphur Springs Road, and at Dunn Street. Table 2-2 summarizes the estimated
conflict points for the proposed condition. The proposed condition reduces the number of
potential conflicts from 756 to 297, approximately 60 percent.
14
Table 2-1. Texas Avenue Existing Conflict Points.
Roadway Section Type1
Number of Intersection2 Types along Study Corridor
Conflict Points per
Intersection
Number of Lanes
Total Conflict Points
T-Intersection (TWLTL)
40 13 5 520
T-Intersection (RM)
0 2 5 0
T-Intersection (RMO)
0 11 5 0
RMO only 0 5 5 0 Dellwood
Intersection 1 46 5 46
Villa Maria Intersection
1 52 5 52
Sulphur Springs Intersection
1 46 5 46
Mary Lake Intersection
1 46 5 46
Dunn Intersection
1 46 5 46
Total 756 1 TWLTL is a two-way left-turn-lane. RM is a raised median. RMO is a raised median opening.2 Intersections include both public streets and private driveways.
15
Table 2-2. Texas Avenue Proposed Condition Conflict Points.
Roadway Section Type1
Number of Intersection2 Types along Study Corridor
Conflict Points per
Intersection
Number of Lanes
Total Conflict Points
T-Intersection (TWLTL)
0 13 5 0
T-Intersection (RM)
38 2 5 76
T-Intersection (RMO)
4 11 5 44
RMO only 1 5 5 5 Dellwood
Intersection 1 4 5 4
Villa Maria Intersection
1 52 5 52
Sulphur Springs Intersection
1 56 5 56
Mary Lake Intersection
1 4 5 4
Dunn Intersection 1 56 5 56 Total 297
1 TWLTL is a two-way left-turn-lane. RM is a raised median. RMO is a raised median opening.2 Intersections include both public streets and private driveways.
Analysis Procedure
Researchers used VISSIM to model 1) existing conditions, 2) optimized existing conditions,
3) proposed conditions with a raised median, 4) proposed future (higher volumes) conditions
with a raised median, and 5) future conditions (higher volumes) with the current TWLTL along
Texas Avenue. The following sections describe the details of the five conditions. The VISSIM
simulation model evaluated travel time and delay along the Texas Avenue corridor under each of
the five conditions.
1. Existing Condition. Texas Avenue is a five-lane arterial roadway with a TWLTL as the
center lane. The corridor is 0.55 miles in length. The driveway density is 40 and 50 driveways
per mile on the east and west side of Texas Avenue, respectively. The existing signal timings
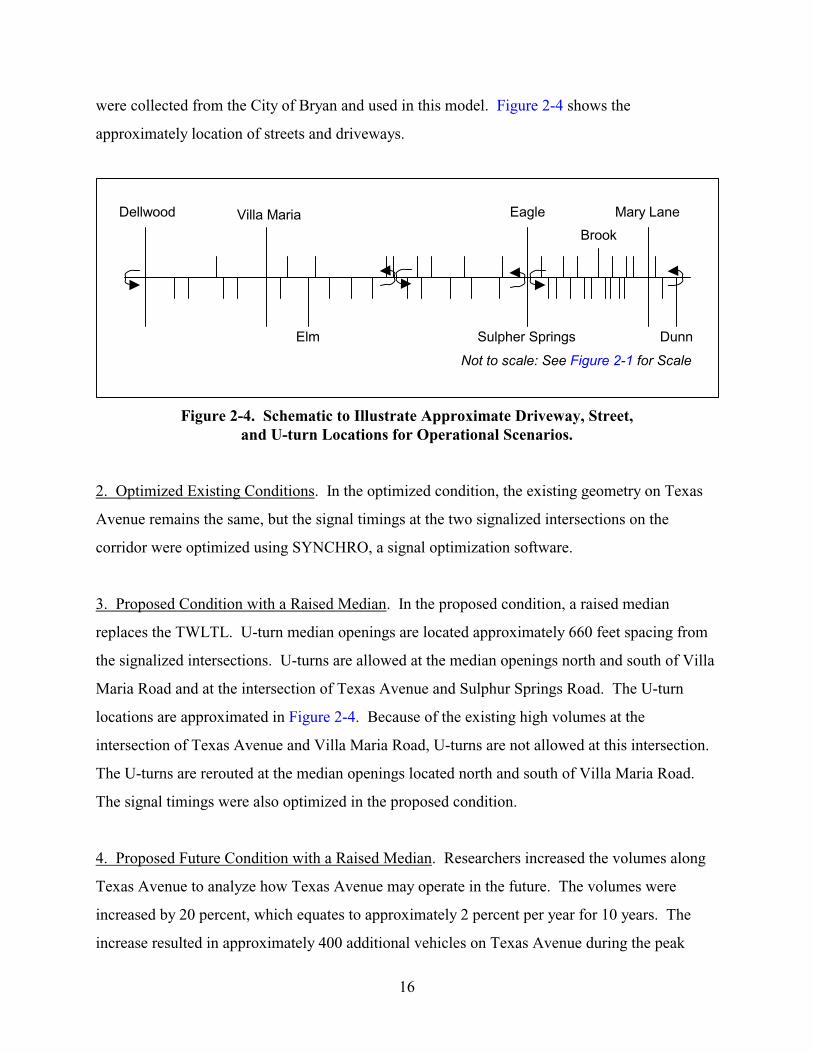
16
were collected from the City of Bryan and used in this model. Figure 2-4 shows the
approximately location of streets and driveways.
Figure 2-4. Schematic to Illustrate Approximate Driveway, Street, and U-turn Locations for Operational Scenarios.
2. Optimized Existing Conditions. In the optimized condition, the existing geometry on Texas
Avenue remains the same, but the signal timings at the two signalized intersections on the
corridor were optimized using SYNCHRO, a signal optimization software.
3. Proposed Condition with a Raised Median. In the proposed condition, a raised median
replaces the TWLTL. U-turn median openings are located approximately 660 feet spacing from
the signalized intersections. U-turns are allowed at the median openings north and south of Villa
Maria Road and at the intersection of Texas Avenue and Sulphur Springs Road. The U-turn
locations are approximated in Figure 2-4. Because of the existing high volumes at the
intersection of Texas Avenue and Villa Maria Road, U-turns are not allowed at this intersection.
The U-turns are rerouted at the median openings located north and south of Villa Maria Road.
The signal timings were also optimized in the proposed condition.
4. Proposed Future Condition with a Raised Median. Researchers increased the volumes along
Texas Avenue to analyze how Texas Avenue may operate in the future. The volumes were
increased by 20 percent, which equates to approximately 2 percent per year for 10 years. The
increase resulted in approximately 400 additional vehicles on Texas Avenue during the peak
Not to scale: See Figure 2-1 for Scale
Dellwood Villa Maria
Elm
Eagle
Sulpher Springs
Brook
Mary Lane
Dunn
17
hour. The future condition was analyzed with the five-lane cross section with a center raised
median. The high traffic volumes at the intersection of Texas Avenue and Villa Maria Road
required mitigation to continue allowing traffic flow through the intersection. Therefore, dual
left-turn lanes were added on the south, east, and west approaches of the intersection. Dual left-
turn lanes are currently present on the north approach. The signal timings were also optimized in
both of the future conditions. The median spacings are the same as for the proposed condition
(#3).
5. Future Conditions with a TWLTL. This condition is the same as #4 above except that a
TWLTL replaces the raised median.
Preliminary Findings
Table 2-3 summarizes the preliminary findings related to the travel time analysis. From the
existing condition to the optimized condition, the travel time decreased overall. Therefore,
optimizing the signal timings does lower the travel times on the corridor. This illustrates the
importance of signal optimization as a low-cost improvement. Travel times increase slightly in
the proposed condition. This phenomenon can be attributed to an overall increase in traffic on
the corridor, as some U-turning vehicles must travel farther to reach their destination. Delay is
also likely to increase at the intersections. An increase in delay is expected at the Texas Avenue
and Eagle Pass/Sulphur Springs intersection because of additional U-turning traffic. Delay is
also expected to increase at the Texas Avenue and Villa Maria intersection due to a greater
number of vehicles traveling through the intersection to reach median openings located north and
south of the intersection. Because mitigation was necessary at the intersection of Texas Avenue
and Villa Maria, it is difficult to compare the existing conditions to the future conditions.
Therefore, the proposed future condition (with a raised median) is compared to the future
condition (with a TWLTL). Travel times were lower overall when comparing the proposed
future condition with a raised median to the future condition with a TWLTL. On northbound
Texas Avenue, the average travel time is 22 seconds less for the proposed future condition,
which includes a raised median. However, on southbound Texas Avenue the travel times
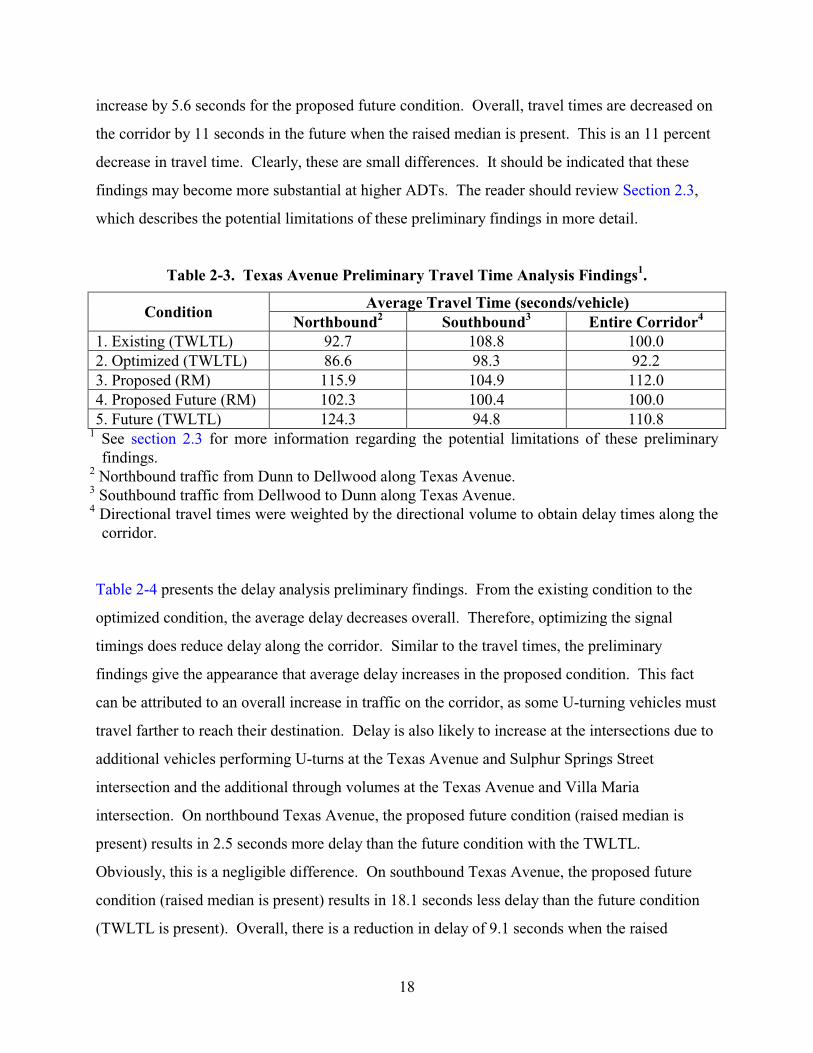
18
increase by 5.6 seconds for the proposed future condition. Overall, travel times are decreased on
the corridor by 11 seconds in the future when the raised median is present. This is an 11 percent
decrease in travel time. Clearly, these are small differences. It should be indicated that these
findings may become more substantial at higher ADTs. The reader should review Section 2.3,
which describes the potential limitations of these preliminary findings in more detail.
Table 2-3. Texas Avenue Preliminary Travel Time Analysis Findings1.
Average Travel Time (seconds/vehicle) Condition
Northbound2 Southbound3 Entire Corridor4
1. Existing (TWLTL) 92.7 108.8 100.0 2. Optimized (TWLTL) 86.6 98.3 92.2 3. Proposed (RM) 115.9 104.9 112.0 4. Proposed Future (RM) 102.3 100.4 100.0 5. Future (TWLTL) 124.3 94.8 110.8
1 See section 2.3 for more information regarding the potential limitations of these preliminary findings.
2 Northbound traffic from Dunn to Dellwood along Texas Avenue. 3 Southbound traffic from Dellwood to Dunn along Texas Avenue. 4 Directional travel times were weighted by the directional volume to obtain delay times along the
corridor. Table 2-4 presents the delay analysis preliminary findings. From the existing condition to the
optimized condition, the average delay decreases overall. Therefore, optimizing the signal
timings does reduce delay along the corridor. Similar to the travel times, the preliminary
findings give the appearance that average delay increases in the proposed condition. This fact
can be attributed to an overall increase in traffic on the corridor, as some U-turning vehicles must
travel farther to reach their destination. Delay is also likely to increase at the intersections due to
additional vehicles performing U-turns at the Texas Avenue and Sulphur Springs Street
intersection and the additional through volumes at the Texas Avenue and Villa Maria
intersection. On northbound Texas Avenue, the proposed future condition (raised median is
present) results in 2.5 seconds more delay than the future condition with the TWLTL.
Obviously, this is a negligible difference. On southbound Texas Avenue, the proposed future
condition (raised median is present) results in 18.1 seconds less delay than the future condition
(TWLTL is present). Overall, there is a reduction in delay of 9.1 seconds when the raised
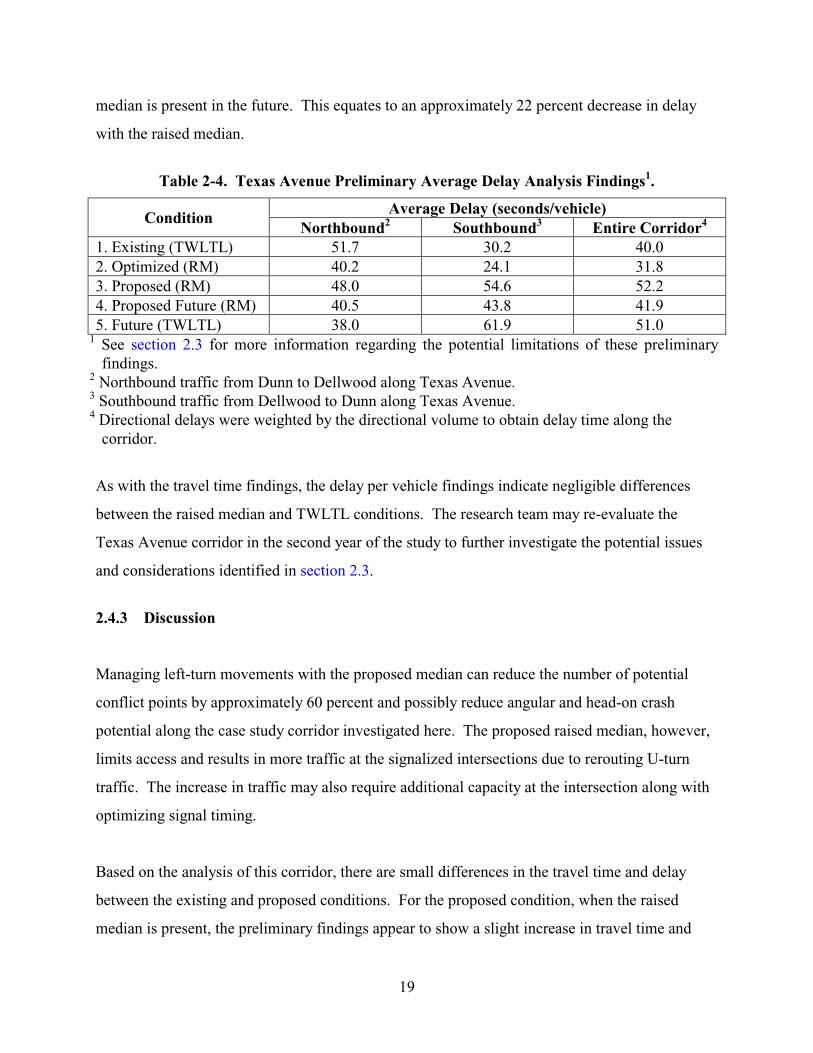
19
median is present in the future. This equates to an approximately 22 percent decrease in delay
with the raised median.
Table 2-4. Texas Avenue Preliminary Average Delay Analysis Findings1.
Average Delay (seconds/vehicle) Condition
Northbound2 Southbound3 Entire Corridor4
1. Existing (TWLTL) 51.7 30.2 40.0 2. Optimized (RM) 40.2 24.1 31.8 3. Proposed (RM) 48.0 54.6 52.2 4. Proposed Future (RM) 40.5 43.8 41.9 5. Future (TWLTL) 38.0 61.9 51.0
1 See section 2.3 for more information regarding the potential limitations of these preliminary findings.
2 Northbound traffic from Dunn to Dellwood along Texas Avenue. 3 Southbound traffic from Dellwood to Dunn along Texas Avenue. 4 Directional delays were weighted by the directional volume to obtain delay time along the
corridor.
As with the travel time findings, the delay per vehicle findings indicate negligible differences
between the raised median and TWLTL conditions. The research team may re-evaluate the
Texas Avenue corridor in the second year of the study to further investigate the potential issues
and considerations identified in section 2.3.
2.4.3 Discussion
Managing left-turn movements with the proposed median can reduce the number of potential
conflict points by approximately 60 percent and possibly reduce angular and head-on crash
potential along the case study corridor investigated here. The proposed raised median, however,
limits access and results in more traffic at the signalized intersections due to rerouting U-turn
traffic. The increase in traffic may also require additional capacity at the intersection along with
optimizing signal timing.
Based on the analysis of this corridor, there are small differences in the travel time and delay
between the existing and proposed conditions. For the proposed condition, when the raised
median is present, the preliminary findings appear to show a slight increase in travel time and
20
delay overall. This situation is attributed to an overall increase in traffic on the corridor, as some
U-turning vehicles must travel farther to reach their destination. Delay may also increase slightly
at the intersections. An increase in delay is expected at the Texas Avenue and Sulphur Springs
Street intersection because of the additional U-turning traffic. Delay is also expected to increase
at the Texas Avenue and Villa Maria intersection due to an increase in vehicles traveling through
the intersection to reach median openings located north and south of the intersection. Though
these findings are preliminary, they appear to indicate that with the installation of raised medians,
geometric intersection improvements should be anticipated.
Adding 20 percent to the traffic volumes, which equates to approximately 10 years of growth at
2 percent growth per year, requires mitigation at the intersection of Texas Avenue and Villa
Maria. Based on the analysis, installing a raised median on Texas Avenue would decrease future
travel times by 11 seconds (11 percent), and delays by 9 seconds (22 percent) on the corridor.
Finally, it should be indicated that while the VISSIM micro-simulation tool appears to be
valuable for analysis of transportation improvements including access management, there is
extensive time needed to become familiar with the software and its internal operation. The
research team continues to better understand the operation of the VISSIM software throughout
this research project. Therefore, the research team may re-evaluate these Texas Avenue findings
in the second year of this study. The reader is encouraged to review section 2.3 for additional
related information regarding the VISSIM micro-simulation.
2.5 31ST STREET (TEMPLE) CASE STUDY LOCATION
2.5.1 General Description
The second case study corridor is in Temple, Texas, on 31st Street, from Canyon Creek Road to
the Colonial Mall entrance. This road segment is a five-lane arterial that includes a TWLTL. A
wide variety of land uses abut 31st Street, including single-family residences, apartment
complexes, stand-alone retail stores, shopping centers, and office buildings. Figure 2-5 depicts
21
the northern end of the corridor, where most of the retail establishments are located. Figure 2-6
shows the southern end of the corridor, which is characterized by single-family residences, with
driveways intersecting 31st Street, as well as apartment complexes.
Figure 2-5. Southbound 31st Street at Colonial Mall Entrance.
Figure 2-6. Northbound 31st Street, North of Canyon Creek Road.
22
2.5.2 Traffic Operations Analysis
A traffic operations analysis has begun for 31st Street. The subsequent sections describe the data
collection, and traffic demand.
Data Collection
The research team collected traffic volume data on 31st Street from Canyon Creek Road to the
Colonial Mall entrance using video cameras. The videotaping included all turning and through
movements at every street and driveway intersection for 1 ¾ -hour noontime and evening
periods. Researchers reduced the video data to turning movement counts at each unsignalized
intersection and to through and turning movement counts at each signalized intersection. By
reviewing videotapes of each period, the team determined that the evening was the peak period to
use.
Traffic Demand
Data input for this corridor simulation began at the end of this project year and will continue in
fiscal year 2003, when results will be available.
2.6 BROADWAY AVENUE (TYLER) CASE STUDY LOCATION
2.6.1 General Description
The third case study corridor is along Broadway Avenue (US 69), between Loop 323 and
Chimney Rock Drive in Tyler, Texas. This road currently has three through lanes in each
direction and a TWLTL. Adjacent land uses include residential, office, commercial, and retail;
however, there are no single-family residential driveways intersecting Broadway Avenue.
Figures 2-7 and 2-8 show the three lanes in each direction and the TWLTL along with the mix of
land uses along the corridor.
23
Figure 2-7. Broadway Avenue Facing North to Chimney Rock Signalized Intersection.
Figure 2-8. Broadway Avenue Facing South at Chimney Rock Signalized Intersection.
24
2.6.2 Traffic Operations Analysis
Data Collection
The research team will use videotapes of traffic from a previous project to determine traffic
counts necessary for the computer simulation, which will occur in fiscal year 2003.
2.7 THEORETICAL CORRIDORS
In the second year of this study, the research team will create theoretical corridors for analysis.
While the actual case study locations presented here are valuable in providing an assessment of
the impacts of access management treatments, simulation of additional scenarios is necessary.
These additional scenarios will be useful to TxDOT staff for alternatives analysis. Researchers
met with TxDOT in the first year of this study to identify the most useful scenarios for their
typical needs. Access management treatments, such as raised median installation and driveway
consolidation, will be investigated for different traffic volume levels as part of this work.
25
CHAPTER 3
CRASH ANALYSIS METHODOLOGY AND FINDINGS
This chapter describes the crash analysis performed at four case study locations in Texas. This
analysis provides an estimate of the safety of corridors after the installation of access
management techniques. Researchers investigated three locations where a raised median was
installed to replace TWLTLs and two locations where raised medians were added to undivided
roads. One notable finding of this part of the project is that crash data accuracy, availability, and
usefulness vary greatly among agencies. For instance, it can be quite difficult, if not impossible,
to obtain crash data going back more than 10 years. Further details are provided in each case
study discussion.
3.1 CRASH ANALYSIS CASE STUDY LOCATIONS
Researchers identified five case study locations for crash analysis in Texas, as well as one in
Oklahoma. The five case study locations are:
♦ Texas Avenue in College Station,
♦ Loop 281 in Longview,
♦ Call Field Road in Wichita Falls,
♦ Grant Avenue in Odessa, and
♦ 71st Street in Tulsa, Oklahoma.
Researchers studied the Texas Avenue corridor first, in order to develop and refine the analysis
process that might be used on all case study corridors. Therefore, this report includes detailed
information about the Texas Avenue corridor. These case study locations are described in further
detail in the sections that follow.
26
3.2 TEXAS AVENUE (COLLEGE STATION) CASE STUDY LOCATION
3.2.1 General Description
The first case study corridor is along Texas Avenue in College Station, Texas. Researchers
investigated changes in crash characteristics along Texas Avenue from 0.2-mile south of George
Bush Drive to 0.2-mile north of University Drive. Prior to the retrofit, Texas Avenue was a five-
lane roadway with a TWLTL. In 1996, Texas Avenue was widened to six lanes and the TWLTL
was converted to a raised median. The land use on the east side of Texas Avenue is mainly
commercial. There are many traffic generators such as a large home electronics store, bookstore,
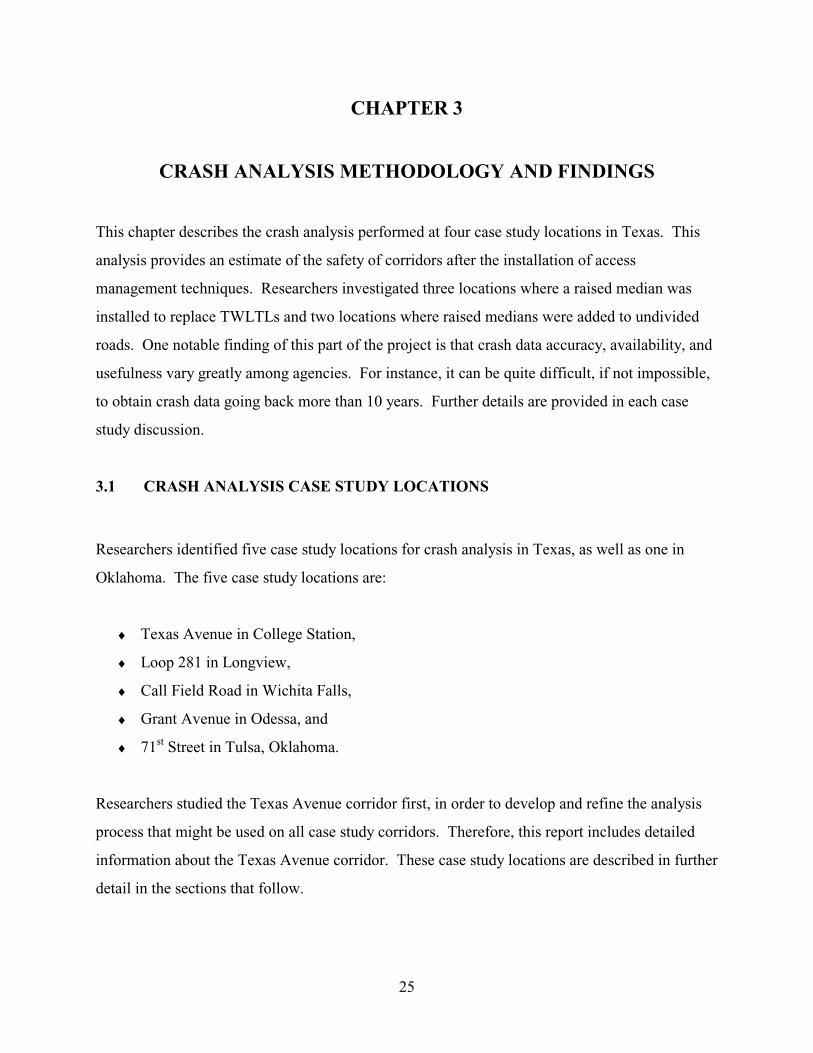
and restaurants and retail shops. Figure 3-1 shows the study site between the two arrows along
Texas Avenue. The campus of Texas A&M University borders the west side of Texas Avenue.
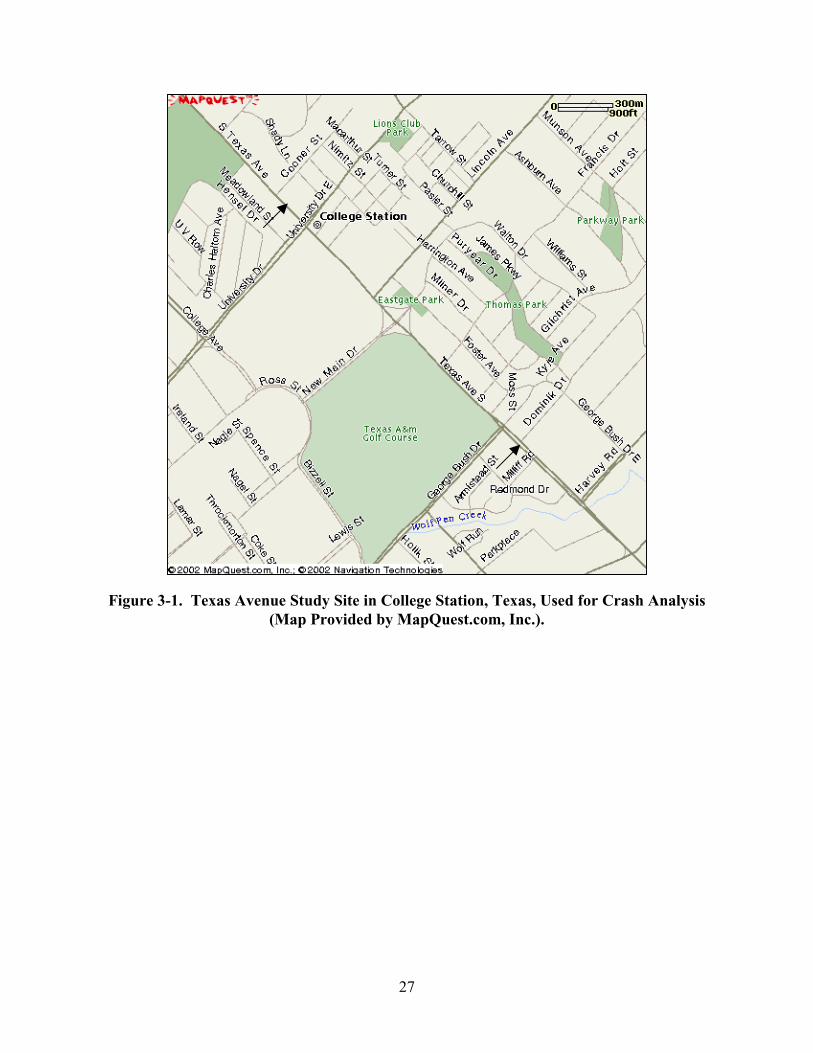
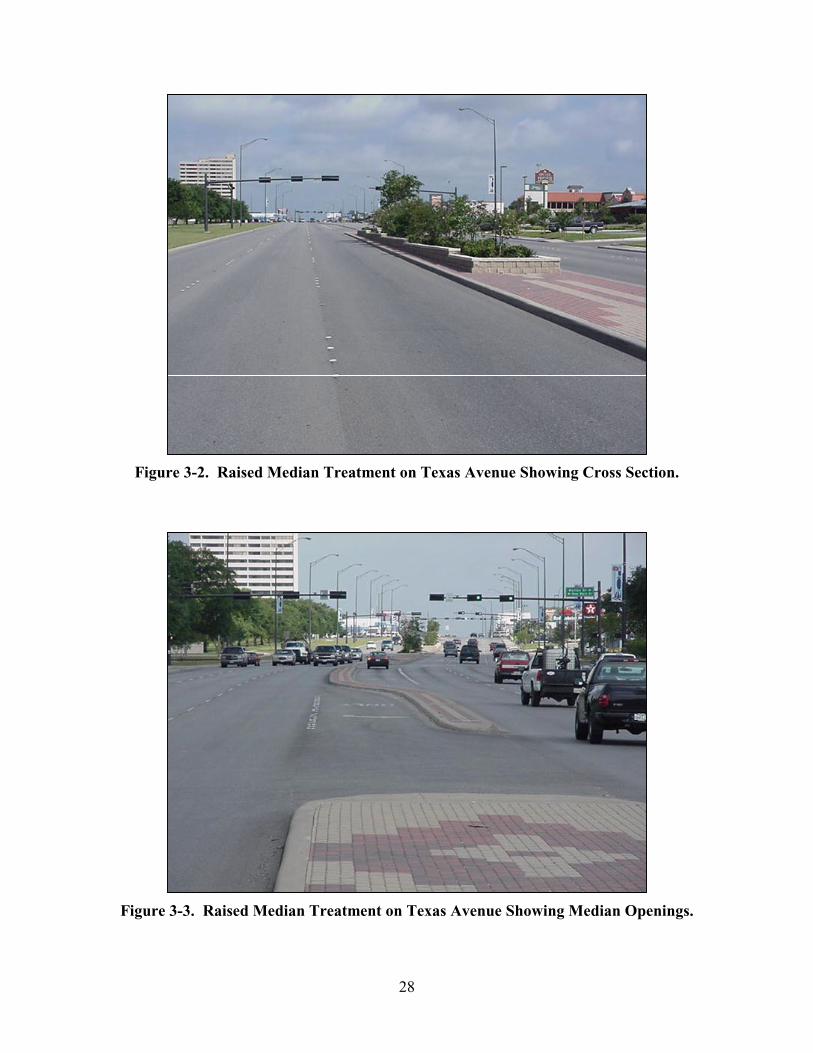
Figure 3-2 and Figure 3-3 show the raised median treatment along this portion of Texas Avenue
and has only one main entrance to the campus along this portion of the study corridor.
Researchers gathered crash data for the time period from January 1993 to June 2000 for the study
site. This study section was examined as an entire corridor and at specific locations. The
subsequent sections describe the data collection, traffic demand, analysis procedures, and
preliminary results. Portions of the Texas Avenue case study location discussion are excerpted
from reference 4.
27
Figure 3-1. Texas Avenue Study Site in College Station, Texas, Used for Crash Analysis (Map Provided by MapQuest.com, Inc.).
28
Figure 3-2. Raised Median Treatment on Texas Avenue Showing Cross Section.
Figure 3-3. Raised Median Treatment on Texas Avenue Showing Median Openings.
29
3.2.2 Data Collection
Crash data were obtained from the Accident Records Bureau (ARB) of the Texas Department of
Public Safety (DPS) in Austin. Coded crash data refers to crash information contained in the
DPS mainframe database. Currently, this information consists of all the data from the original
crash reports, with the exception of crash sketches and the exact wording of narratives, for the
most recently processed 10-year timeframe. For quality control purposes, original crash reports
retained by DPS were also collected and studied. Between the coded and original records and
through the insight of personnel working at the ARB, researchers were able to investigate the
accuracy of the crash-reporting process in the State of Texas. The authors will take the readers
step by step through the crash-reporting process, summarize the quality of the process, and
describe the specifics of the data collection.
Crash-Reporting Process
Crash reports are the beginning of the crash-reporting process. In the State of Texas, crash
reports are submitted on two possible forms, the ST-2 and the ST-3 (see Appendix B).
The ST-2 is used less often and is sent directly to the ARB by one or more of the participants in
the crash. This form is used when there is no police involvement, or when the police do not plan
to report the crash and the motorists involved still desire an official record. The ST-2 is more
commonly referred to as the “blue form,” due only to the color of the form. The form contains all
the applicable information of the crash including location, vehicle identification, damage, and
casualties.
When local agency police do not report a crash, drivers have the right and the responsibility to
report their traffic incident to the DPS with a blue form. State law places the onus on the driver
for reporting a crash that takes place on a public roadway and not the policing authority. In most
cases, if a police officer(s) stops at the scene of a crash, a report will be submitted. In property
damage only (PDO) cases where the total property damage is estimated to be less than $1,000
and no injuries were involved, the drivers may request that police not fill out a crash report
30
because the drivers intend to report the incident and are peaceably exchanging insurance and
contact information. PDOs mean no injuries occurred, and there was only vehicular and/or
roadway facility damage. In some cases, research will use equivalent property damage only
(EPDO) to include injuries, by adding the associated costs from the injuries to the PDO for
comparison and statistical purposes. The authors of this report will not use EPDOs. If the police
are not involved at the crash scene, the drivers may file a crash report either directly through the
local police or through DPS. If the crash is a PDO not exceeding $1,000 and no traffic citations
or criminal proceedings are warranted, it is highly unlikely the police will report the crash, even
if the drivers involved try to report one. In that specific instance, the police will suggest that the
drivers submit a blue form to DPS for reporting purposes.
Crash-reporting trends are the common reason behind the fewer number of blue form crash
reports. Regardless of the legal responsibility of drivers to report crashes, the current tendency of
motorists is not to report crashes that do not involve injuries, criminal charges and/or property
damage exceeding $1,000, because drivers wish to avoid higher insurance rates (5,6).
The police in the State of Texas use the ST-3 to record crashes. The ST-3 contains all the same
information as the blue form, except in more detail. This form has a location for the reporting
officer to sketch the crash and to write summary comments. These comments are based upon
statements of individuals involved and on the officer’s professional assessment of the crash
scene. One benefit of the ST-3 is that the officer’s comments should offer a more accurate and
unbiased point-of-view of the incident. The police form also includes citation, weather, and road
data. Weather conditions, road data, and crash sketches may be submitted on the blue form in
the driver narrative section; however, the ST-3 offers a less biased crash assessment because
drivers invariably will respond in their favor for insurance purposes. Once the officer’s crash
investigation is complete, the crash record will be submitted to the local police department.
Local crash processing varies in length and detail based upon the needs and goals of the local
policing authority. In College Station, Texas, the local police input certain data from the crash
31
report to a local database. The database contains information such as the crash location and the
overall severity of the crash. Overall crash severity is one way in which crashes are categorized.
The most severe disposition of individuals involved in the crash is associated with the overall
crash severity. For instance, in a crash with four possible injuries and one incapacitating injury,
the crash will have an overall severity of incapacitating injury. For example, a police officer
records a person complaining of a sore neck as a possible injury. Non-incapacitating injuries
consist of obvious scrapes and bruises that would not physically disable a person at the scene,
while an incapacitated person would have a broken limb or have excessive bleeding that would
require minimal movement and a pressure bandage (e.g., a tourniquet). A copy of a printout of
crash data offered through the College Station Police Department (CSPD) is in Appendix B.
After the data is input, the records are stored on file in the CSPD Records Department, and a
copy is shipped to the ARB. The whole process usually takes about 10 business days.
As the ST-2 and ST-3 reports arrive at the ARB, the files are immediately sorted, and the
processing begins. The whole process can be equated to an assembly line. The initial steps
include the date stamping of the incoming files and sorting by county. In the next stage, the
records are separated into three categories. For the purposes of this report, the categories will be
referred to as Group I, II and III.
The crash reports are placed into the different groups based upon the cause of the crash, the
location of the crash, the estimated replacement/repair costs involved, and the overall crash
severity. Group I contains crashes that involve PDOs less than $1,000 and crashes that do not
occur on the roadway (i.e., crashes in a private parking lot). Group II includes PDOs equal to or
in excess of $1,000 and in which the vehicles were not towed from the scene. The Group III
category consists of all crashes that take place on a public roadway that include injuries and/or
PDOs equal to or in excess of $1,000 in which the vehicles were towed. Group I crashes are the
least likely to be reported.
32
Within the grouping stage, certain information is marked on the records for later coding to an
individual’s traffic history/driving record. All traffic violations are coded to a driver’s traffic
history for state and insurance reasons. The at-fault driver(s) in a crash has the crash coded to
his/her record solely for the purposes of the state. Drivers not at fault in a crash do not have the
crash added to their personal driving records. One example of a driver not at fault is a driver of a
vehicle that is rear-ended at a stoplight. The motorist to whom the rear-ending is attributed is the
one who has the crash coded to his/her personal driving record. Another example is a driver who
crashed as the motorist evaded an animal on the roadway. However, it is possible to be at fault in
a crash and not receive a traffic citation. For example, one case in which a driver at fault will not
have his/her driving record affected is when the crash does not occur on a roadway but on private
property instead, such as a parking lot.
The state and the insurance agencies use a driver’s personal traffic history for different purposes.
The state will use this information to invalidate a driver’s license or to aid in criminal
proceedings. Insurance agencies will use the information to analyze their client’s policy to
validate premium changes or policy cancellation. However, insurance agencies only have limited
access to the data. They can only retrieve the last three years worth of data and only data
including traffic citations. The crash data is not available. The only crash data that an
individual’s insurance agent receives is what he/she submits in an insurance claim.
The coding of crash data into a DPS mainframe is the next step in the crash-reporting process.
This phase is only for Group II and III. Group I records are not included because they are the
least likely to be reported and the least severe.
The first step and the longest step in the coding occurs with the handwritten coding. During this
phase, the coding of the records is broken down into different stages. The reports are coded in
an assembly-line fashion with ARB staff coding only certain information as the record passes
through. For instance, a specific person would be tasked to code only the driver data onto a
hardcopy sheet.
33
Once the coding phase is complete, the sheets are input through a dual data entry method. While
in the earlier stages there are varying levels of checks to minimize data entry errors, the dual data
entry method is one of the best ways to reduce mistakes. Two different people input the data into
a computer; the computers compare the records; matching records are set aside for the final
mainframe upload; and the records that do not match are set aside for checking.
One further note should address the fact that the ARB is further working to improve the crash-
reporting system with the Crash Record Information System (CRIS). DPS is working with
TxDOT to fund this new system that will help automate the reporting process and make the
information more accessible in a timely manner. Members of the ARB are assisting
transportation engineering and planning by getting the crash data to different agencies that try to
make informed infrastructure safety improvements. CRIS will further enhance the abilities of the
ARB and of any other agencies that require such information. A copy of a CRIS newsletter is
located in Appendix B.
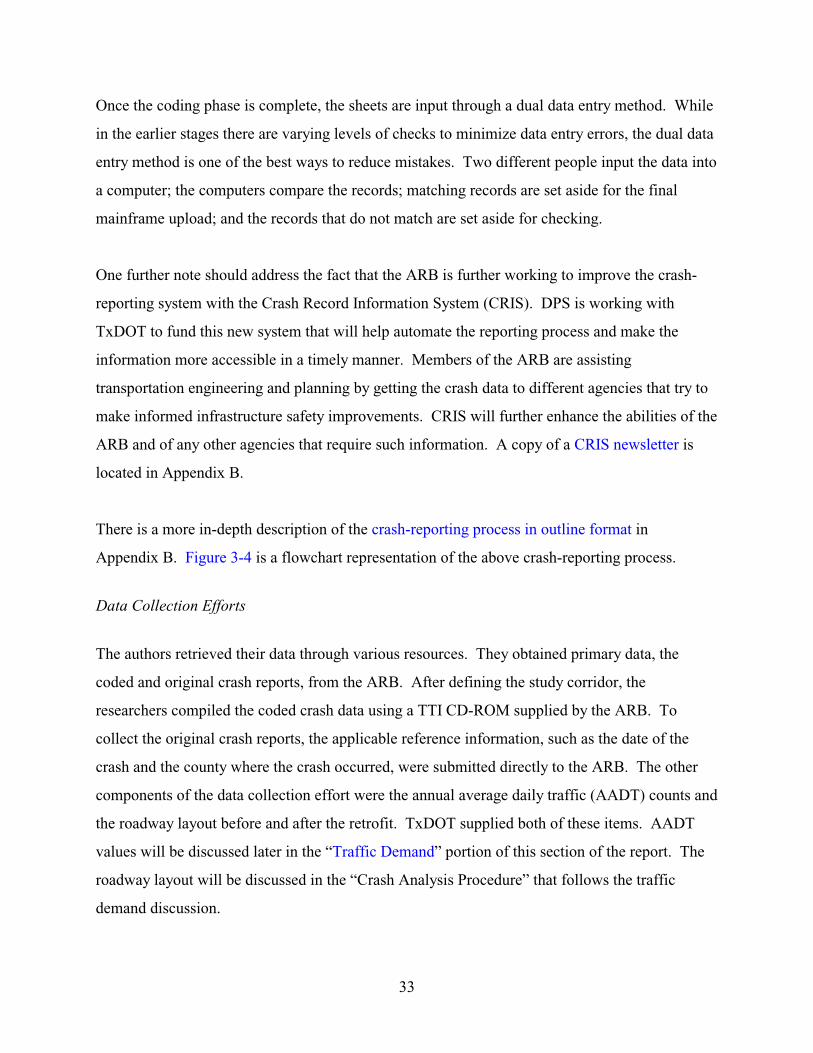
There is a more in-depth description of the crash-reporting process in outline format in
Appendix B. Figure 3-4 is a flowchart representation of the above crash-reporting process.
Data Collection Efforts
The authors retrieved their data through various resources. They obtained primary data, the
coded and original crash reports, from the ARB. After defining the study corridor, the
researchers compiled the coded crash data using a TTI CD-ROM supplied by the ARB. To
collect the original crash reports, the applicable reference information, such as the date of the
crash and the county where the crash occurred, were submitted directly to the ARB. The other
components of the data collection effort were the annual average daily traffic (AADT) counts and
the roadway layout before and after the retrofit. TxDOT supplied both of these items. AADT
values will be discussed later in the “Traffic Demand” portion of this section of the report. The
roadway layout will be discussed in the “Crash Analysis Procedure” that follows the traffic
demand discussion.
34
Figure 3-4. Crash-Reporting Process Flowchart.
Crash-Reporting Process
Police Report
Local Storage DPS
Injury and/or PDO>$1000
Data Coding
DPS Mainframe
Data Input Data Input
YES
NO
Logic Chec k
Correct
Error
DPS ARB Microfiche
35
It should be noted that crash data eventually used for the before-construction analysis were from
January 1993 to December 1994. The data used for the after-construction period were from July
1998 to June 2000. Researchers selected the before-data timeframe because in July 1995 only
PDO crashes where the vehicle had to be towed from the scene were in the crash records for
PDO. If there was no injury or the vehicle was not towed, then there was not a crash record. The
before data were filtered appropriately to ensure comparisons to the after-construction data were
consistent. Researchers used the above timeframe for the after period because June 2000 were
the latest data available, and the construction of the raised median was concluded in June 1998.
Summary of Crash-Reporting Errors
The main areas of concern for crash-reporting errors stem from the location, orientation, crash
type, and severity of the incident. After carefully looking through over 1,014 individual crash
reports, the researchers feel confident in indicating location inaccuracies are the most prevalent.
In some instances, both law enforcement and the coding staff of the ARB made data entry errors.
The mistakes were minor and were not attributed to negligence. The authors assess that there is a
considerably low quantity of crash-reporting errors, and by using the original crash reports, the
errors encountered may all be corrected.
The researchers first looked directly at the coding errors that occurred within the ARB. Out of
1,014 records studied, only 29 errors (3 percent) were recorded between the data contained by the
DPS mainframe and the data provided by the original police reports. Of the 29 coding mistakes,
eight dealt with the original written coding stage by someone who was unfamiliar with the
peculiarities of College Station. For example, SH 30 is Harvey Road, and FM 2818 is Harvey
Mitchell Parkway. There was a crash that occurred at Harvey Mitchell Parkway but was coded
for Harvey Road. For someone from College Station, the error is obvious; however, it is far
more probable that someone who is unfamiliar with the area may unknowingly code the
information incorrectly. Of those errors that did occur, the original crash report removed any
doubt as to the location of the crash.
36
Of the remaining errors, 20 were related to coding the incorrect primary road at an intersection
crash, and only one was related to the crash type. The coding mistakes for the primary roadway
are the least significant, because the mistakes are based upon the authors’ interpretation of the
data and not on the ARB coding rules. The ARB defines the primary roadway as the one that has
designation seniority. In other words, in a crash at the intersection of Texas Avenue and
University Drive, the primary roadway will be Texas Avenue because it is a state highway, and
University Drive is a farm-to-market road. The researchers believe if the crash does not occur in
the intersection (i.e., an off-setting reference distance is supplied that places the crash outside of
the intersection), then the crash should be coded on the roadway on which it occurs. Hence, the
errors were calculated accordingly.
The other source of error in crash reporting originates with the crash report submitted by the
police. The police reports studied for this project contained more than enough additional
information to enable the researchers to clarify and verify any perceived discrepancies in the
reporting of location, orientation, crash type, or severity of a crash. In their investigation, the
researchers did find erroneous reference distances used by the reporting officer(s). For example,
one police officer recorded a crash 100 feet south of Dominik Drive. After further investigation,
the researchers were able to determine through other reported information that the crash occurred
600 feet south of Dominik Drive. The reported orientation, crash type, and crash severity data
overall appeared to not contain errors. Researchers looked at errors of this type from the
perspective of internal discrepancies within the report itself. For instance, it would be considered
an error if a police officer had coded the crash severity with a death, but he/she did not record a
death with any one of the drivers or non-drivers.
The milepost position of a crash along the main roadway, as coded by DPS, is another potential
error related to crash location. This error also occurs in the handwritten coding stage; however,
this fault cannot be solely attributed to the ARB, nor is it considered a significant problem.
Because driveway openings themselves can be on the order of approximately 40 feet themselves,
accuracy of 0.01 or 0.001 of a mile (53 or 5 feet) is desirable. In the field, it would be a daunting,
if not impossible, task for officers to relay that level of accuracy by handwritten methods for the
entire State of Texas using current methods. Technologies such as global positioning systems
37
(GPS) might be used in the future to identify the crash location relative to known objects (e.g.,
traffic signs, center of curve radius). A comparison between all crash records comparing the
police report locations and the milepost locations from the TxDOT location map were adjusted to
within 5 feet to ensure the location accuracy was provided.
Common errors that were expected, but could not be verified, were related to the exact number of
vehicles involved, and the true intentions and compounding causes attributing to the crash. In
one instance, a vehicle was traveling southbound in the outside lane approaching traffic
congestion associated with the Texas Avenue and George Bush Drive signal. The motorist
attempted to move into the adjacent lane to avoid the longer queue of cars and sideswiped
another vehicle. No comments or inferences were made by the drivers or the reporting officer.
Answers to questions such as “did the driver miss his/her blind spot,” “was the other driver
speeding or changing lanes,” and “did either party have additional stimuli distracting him/her
from driving” are typically unknown, due to inaccurate eyewitness reporting and drivers
providing false information for the sake of avoiding incrimination contribute to data errors (6).
In summary, the error calculations in regard to the quality control aspect of the study were
limited to the miscalculations in the milepost location of the crashes along the main roadway.
In the above calculations, the revised data section refers to the reduction in the original raw data.
The reduction included removing all data records containing errors that could not be attributed to
DPS mistakes. These errors consisted of data input errors in the original police report, and data
the DPS coded for the wrong roadway possibly resulted from lack of familiarity with the crash
location. These cases dealing with the DPS coding the wrong roadway were not included
because it was difficult to ascertain the intent of the coding officer. The coding of a wrong
roadway occurred approximately 3 percent of the time.
Overall, these findings are promising and seem to indicate a robust data set for crash analysis
along Texas Avenue. The authors did look at coded data collected locally by the College Station
Police Department. The local data files were not used because the information was not detailed
enough for this study’s purposes.
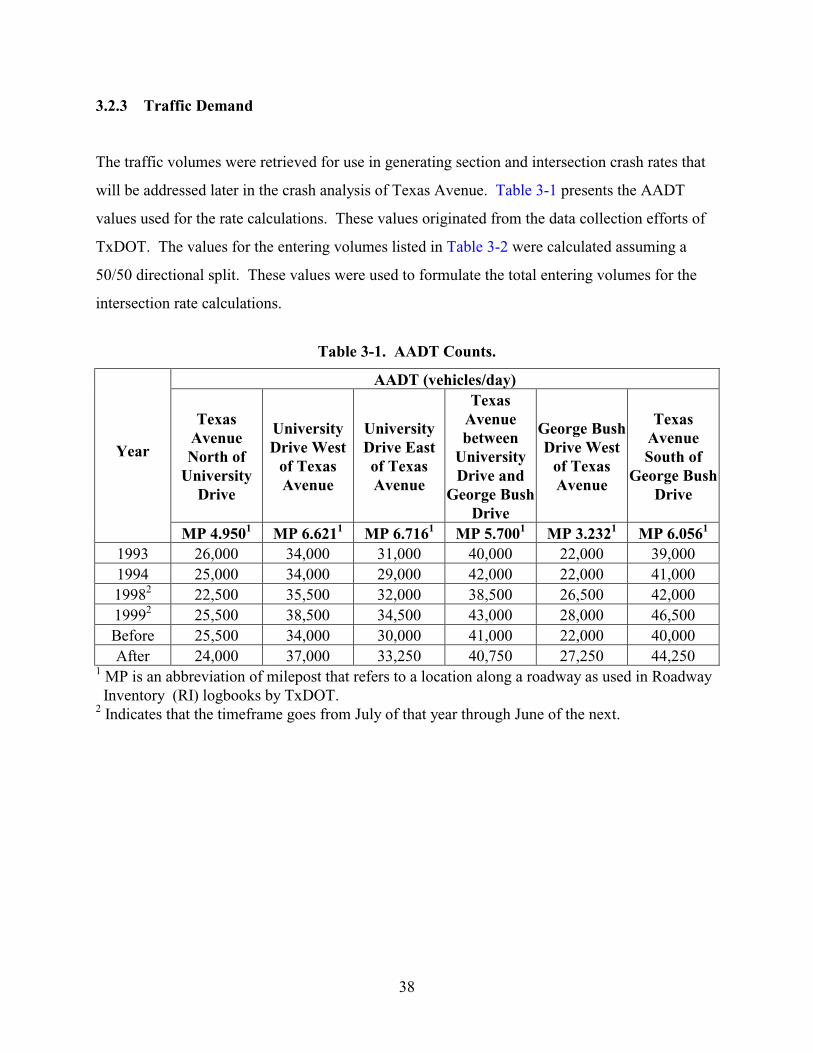
38
3.2.3 Traffic Demand
The traffic volumes were retrieved for use in generating section and intersection crash rates that
will be addressed later in the crash analysis of Texas Avenue. Table 3-1 presents the AADT
values used for the rate calculations. These values originated from the data collection efforts of
TxDOT. The values for the entering volumes listed in Table 3-2 were calculated assuming a
50/50 directional split. These values were used to formulate the total entering volumes for the
intersection rate calculations.
Table 3-1. AADT Counts.
AADT (vehicles/day)
Texas Avenue North of
University Drive
University Drive West
of Texas Avenue
University Drive East of Texas Avenue
Texas Avenue between
University Drive and
George Bush Drive
George Bush Drive West
of Texas Avenue
Texas Avenue South of
George Bush Drive
Year
MP 4.9501 MP 6.6211 MP 6.7161 MP 5.7001 MP 3.2321 MP 6.0561
1993 26,000 34,000 31,000 40,000 22,000 39,000 1994 25,000 34,000 29,000 42,000 22,000 41,000 19982 22,500 35,500 32,000 38,500 26,500 42,000 19992 25,500 38,500 34,500 43,000 28,000 46,500 Before 25,500 34,000 30,000 41,000 22,000 40,000 After 24,000 37,000 33,250 40,750 27,250 44,250
1 MP is an abbreviation of milepost that refers to a location along a roadway as used in Roadway Inventory (RI) logbooks by TxDOT.
2 Indicates that the timeframe goes from July of that year through June of the next.
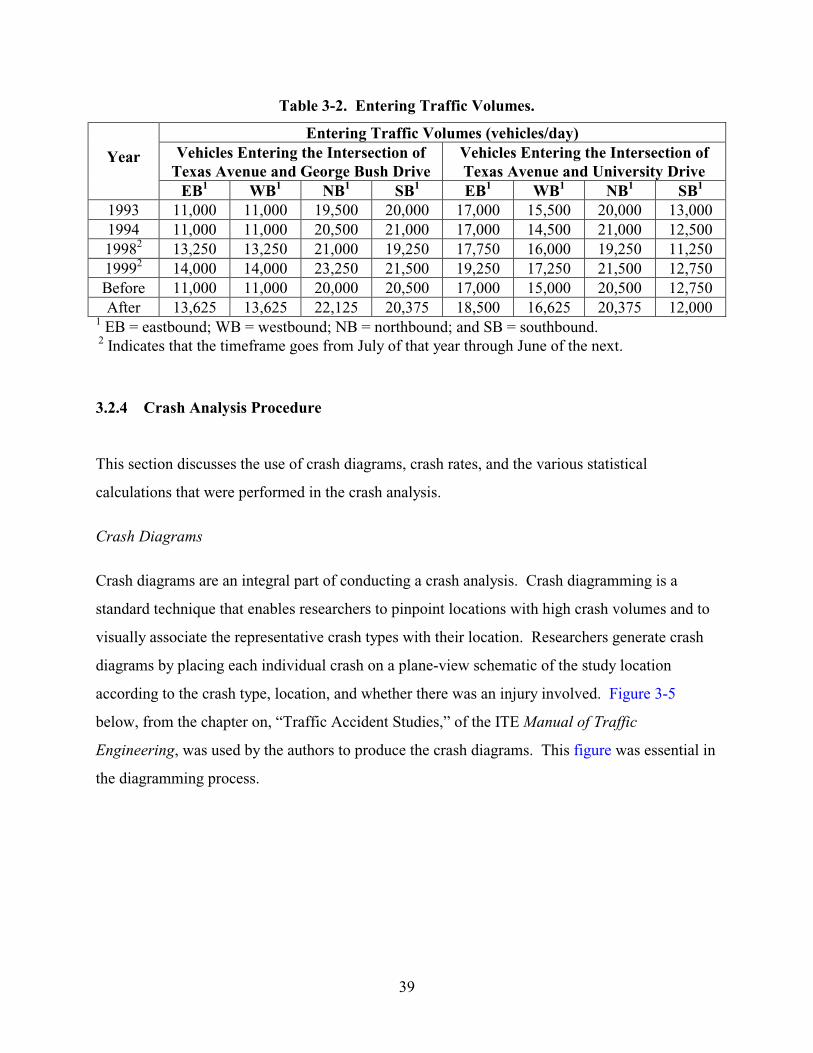
39
Table 3-2. Entering Traffic Volumes.
Entering Traffic Volumes (vehicles/day) Vehicles Entering the Intersection of
Texas Avenue and George Bush Drive Vehicles Entering the Intersection of Texas Avenue and University Drive
Year
EB1 WB1 NB1 SB1 EB1 WB1 NB1 SB1 1993 11,000 11,000 19,500 20,000 17,000 15,500 20,000 13,000 1994 11,000 11,000 20,500 21,000 17,000 14,500 21,000 12,500 19982 13,250 13,250 21,000 19,250 17,750 16,000 19,250 11,250 19992 14,000 14,000 23,250 21,500 19,250 17,250 21,500 12,750 Before 11,000 11,000 20,000 20,500 17,000 15,000 20,500 12,750 After 13,625 13,625 22,125 20,375 18,500 16,625 20,375 12,000
1 EB = eastbound; WB = westbound; NB = northbound; and SB = southbound. 2 Indicates that the timeframe goes from July of that year through June of the next.
3.2.4 Crash Analysis Procedure
This section discusses the use of crash diagrams, crash rates, and the various statistical
calculations that were performed in the crash analysis.
Crash Diagrams
Crash diagrams are an integral part of conducting a crash analysis. Crash diagramming is a
standard technique that enables researchers to pinpoint locations with high crash volumes and to
visually associate the representative crash types with their location. Researchers generate crash
diagrams by placing each individual crash on a plane-view schematic of the study location
according to the crash type, location, and whether there was an injury involved. Figure 3-5
below, from the chapter on, “Traffic Accident Studies,” of the ITE Manual of Traffic
Engineering, was used by the authors to produce the crash diagrams. This figure was essential in
the diagramming process.
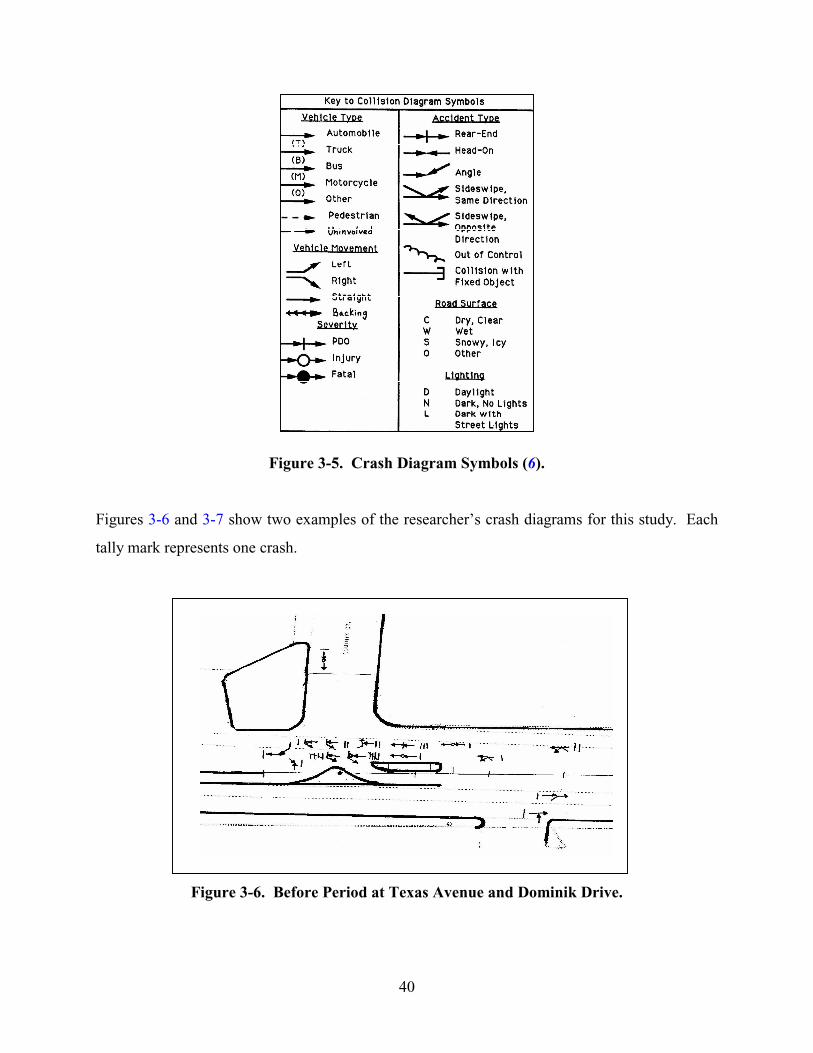
40
Figure 3-5. Crash Diagram Symbols (6).
Figures 3-6 and 3-7 show two examples of the researcher’s crash diagrams for this study. Each
tally mark represents one crash.
Figure 3-6. Before Period at Texas Avenue and Dominik Drive.
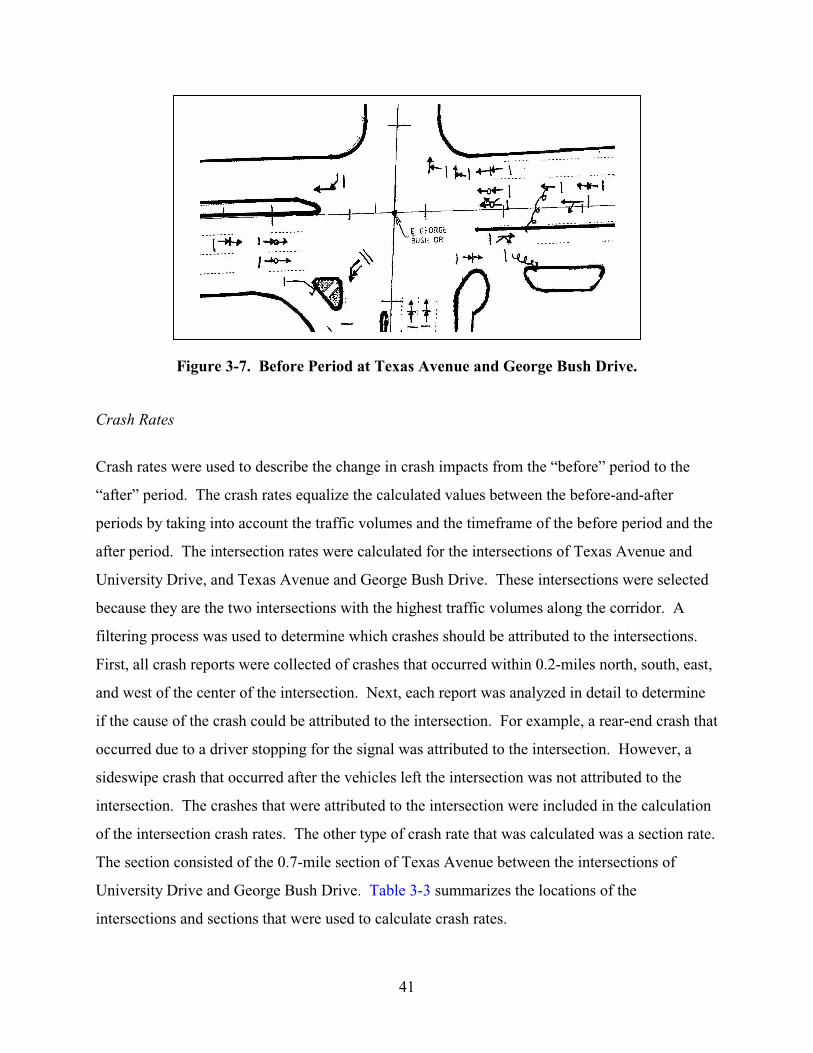
41
Figure 3-7. Before Period at Texas Avenue and George Bush Drive.
Crash Rates
Crash rates were used to describe the change in crash impacts from the “before” period to the
“after” period. The crash rates equalize the calculated values between the before-and-after
periods by taking into account the traffic volumes and the timeframe of the before period and the
after period. The intersection rates were calculated for the intersections of Texas Avenue and
University Drive, and Texas Avenue and George Bush Drive. These intersections were selected
because they are the two intersections with the highest traffic volumes along the corridor. A
filtering process was used to determine which crashes should be attributed to the intersections.
First, all crash reports were collected of crashes that occurred within 0.2-miles north, south, east,
and west of the center of the intersection. Next, each report was analyzed in detail to determine
if the cause of the crash could be attributed to the intersection. For example, a rear-end crash that
occurred due to a driver stopping for the signal was attributed to the intersection. However, a
sideswipe crash that occurred after the vehicles left the intersection was not attributed to the
intersection. The crashes that were attributed to the intersection were included in the calculation
of the intersection crash rates. The other type of crash rate that was calculated was a section rate.
The section consisted of the 0.7-mile section of Texas Avenue between the intersections of
University Drive and George Bush Drive. Table 3-3 summarizes the locations of the
intersections and sections that were used to calculate crash rates.
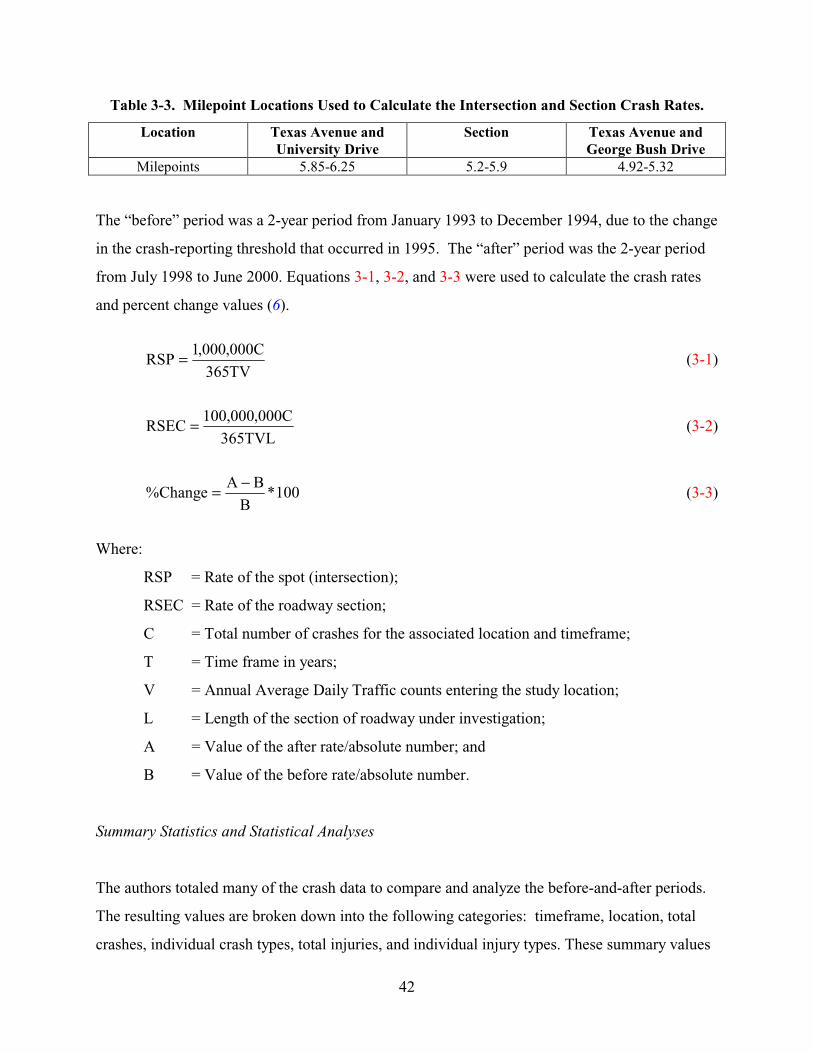
42
Table 3-3. Milepoint Locations Used to Calculate the Intersection and Section Crash Rates.
Location Texas Avenue and University Drive
Section Texas Avenue and George Bush Drive
Milepoints 5.85-6.25 5.2-5.9 4.92-5.32
The “before” period was a 2-year period from January 1993 to December 1994, due to the change
in the crash-reporting threshold that occurred in 1995. The “after” period was the 2-year period
from July 1998 to June 2000. Equations 3-1, 3-2, and 3-3 were used to calculate the crash rates
and percent change values (6).
TV365
C000,000,1RSP = (3-1)
TVL365
C000,000,100RSEC = (3-2)
100*B
BAChange%
−= (3-3)
Where:
RSP = Rate of the spot (intersection);
RSEC = Rate of the roadway section;
C = Total number of crashes for the associated location and timeframe;
T = Time frame in years;
V = Annual Average Daily Traffic counts entering the study location;
L = Length of the section of roadway under investigation;
A = Value of the after rate/absolute number; and
B = Value of the before rate/absolute number.
Summary Statistics and Statistical Analyses
The authors totaled many of the crash data to compare and analyze the before-and-after periods.
The resulting values are broken down into the following categories: timeframe, location, total
crashes, individual crash types, total injuries, and individual injury types. These summary values

43
are in tables in Appendix C and were statistically analyzed using percent changes between the
before-and-after periods and by testing the summary values of the before-and-after periods for
significance. The percent changes have already been discussed in the “Crash Rates” section of
this report. The z-statistic used in safety analyses is introduced in the text Traffic Engineering
(5). In all of the following tables, researchers used the percent change equation (Equation 3-8).
The p-value of the significance test is also provided in many of the tables in this report. When it
is <0.05, there is a significant difference between the before-and-after crashes at the α = 0.05
level of significance. The z-statistic used is shown in Equation 3-4 when A + B > 20
observations.
BA
BAZ
+
−= (3-4)
Where: A = Value of the after rate / absolute number;
B = Value of the before rate / absolute number; and
Z = Test statistic from which the p-value is looked up in a normal distribution table.
Alternatively, if the sum of A and B is greater than five observations and less than or equal to 20
observations, Equation 3-5 can be used as the test statistic to determine the associated p-value
(7).
BA
1BAZ
+−−= (3-5)
Finally, for sample sizes less than or equal to five, two Poisson distributions can be compared
using the F-statistic shown in Equation 3-6 (7). In Equation 3-6, X1 and X2 are replaced by A
and B as in Equation 3-5 ensuring that X1 > X2.
1 X
XF
2
1
+= (3-6)
44
3.2.5 Crash Analysis Results
The results of the crash analysis are summarized in the following sections.
Vehicle Conflict Points
As part of this study, researchers conducted an evaluation of vehicle conflict points for existing
and proposed conditions. Before the installation of the raised median, the conditions on Texas
Avenue consisted of a five-lane arterial with a TWLTL. At the intersections of Texas Avenue
with George Bush Drive and University Drive, there is a transition to a conventional left-turn
lane.
Previous research suggests that a TWLTL providing access to numerous driveways can be a
safety problem because of the numerous conflict points. Table 3-4 presents an estimation of
conflict points based on the type and number of intersections and driveways along the study
corridor.
The “after” geometry consists of a raised median between University Drive and George Bush
Drive, with median openings at 10 locations. Table 3-5 summarizes the estimated conflict points
for the “after” condition. The “after” condition reduces the number of potential conflicts 812 to
602, approximately 26 percent.
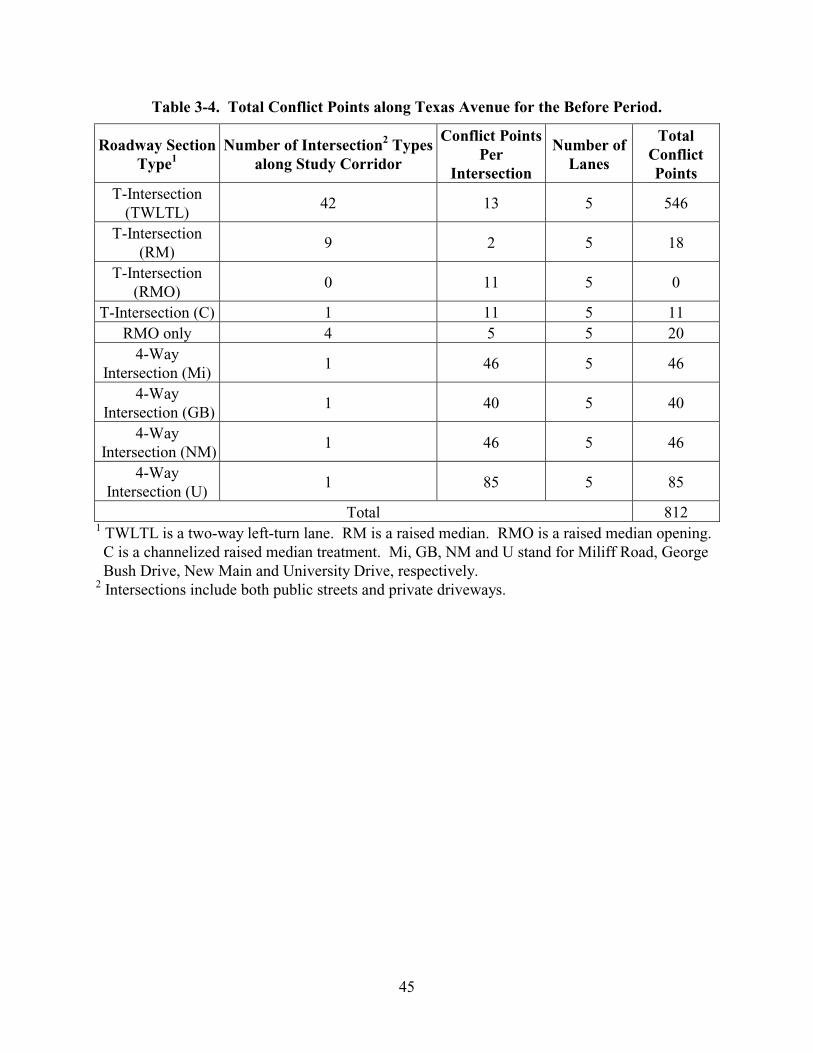
45
Table 3-4. Total Conflict Points along Texas Avenue for the Before Period.
Roadway Section Type1
Number of Intersection2 Types along Study Corridor
Conflict Points Per
Intersection
Number of Lanes
Total Conflict Points
T-Intersection (TWLTL)
42 13 5 546
T-Intersection (RM)
9 2 5 18
T-Intersection (RMO)
0 11 5 0
T-Intersection (C) 1 11 5 11 RMO only 4 5 5 20
4-Way Intersection (Mi)
1 46 5 46
4-Way Intersection (GB)
1 40 5 40
4-Way Intersection (NM)
1 46 5 46
4-Way Intersection (U)
1 85 5 85
Total 812 1 TWLTL is a two-way left-turn lane. RM is a raised median. RMO is a raised median opening. C is a channelized raised median treatment. Mi, GB, NM and U stand for Miliff Road, George Bush Drive, New Main and University Drive, respectively.
2 Intersections include both public streets and private driveways.
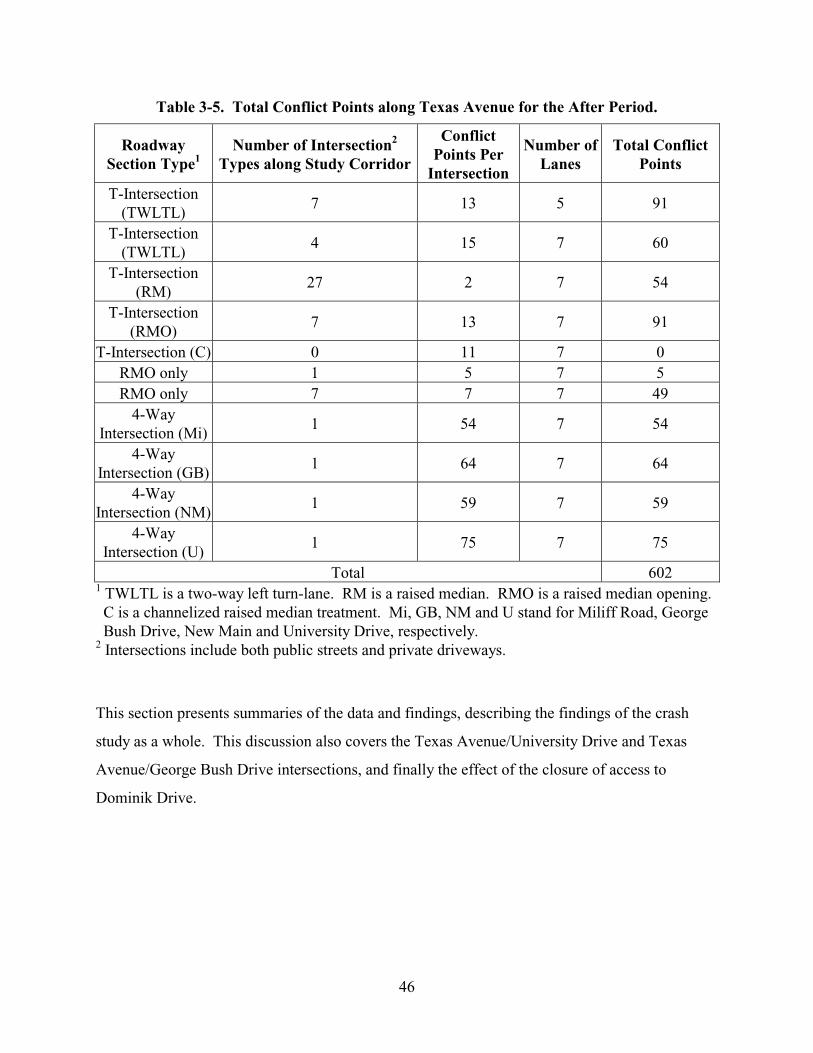
46
Table 3-5. Total Conflict Points along Texas Avenue for the After Period.
Roadway Section Type1
Number of Intersection2 Types along Study Corridor
Conflict Points Per
Intersection
Number of Lanes
Total Conflict Points
T-Intersection (TWLTL)
7 13 5 91
T-Intersection (TWLTL)
4 15 7 60
T-Intersection (RM)
27 2 7 54
T-Intersection (RMO)
7 13 7 91
T-Intersection (C) 0 11 7 0 RMO only 1 5 7 5 RMO only 7 7 7 49
4-Way Intersection (Mi)
1 54 7 54
4-Way Intersection (GB)
1 64 7 64
4-Way Intersection (NM)
1 59 7 59
4-Way Intersection (U)
1 75 7 75
Total 602 1 TWLTL is a two-way left turn-lane. RM is a raised median. RMO is a raised median opening. C is a channelized raised median treatment. Mi, GB, NM and U stand for Miliff Road, George Bush Drive, New Main and University Drive, respectively.
2 Intersections include both public streets and private driveways.
This section presents summaries of the data and findings, describing the findings of the crash
study as a whole. This discussion also covers the Texas Avenue/University Drive and Texas
Avenue/George Bush Drive intersections, and finally the effect of the closure of access to
Dominik Drive.
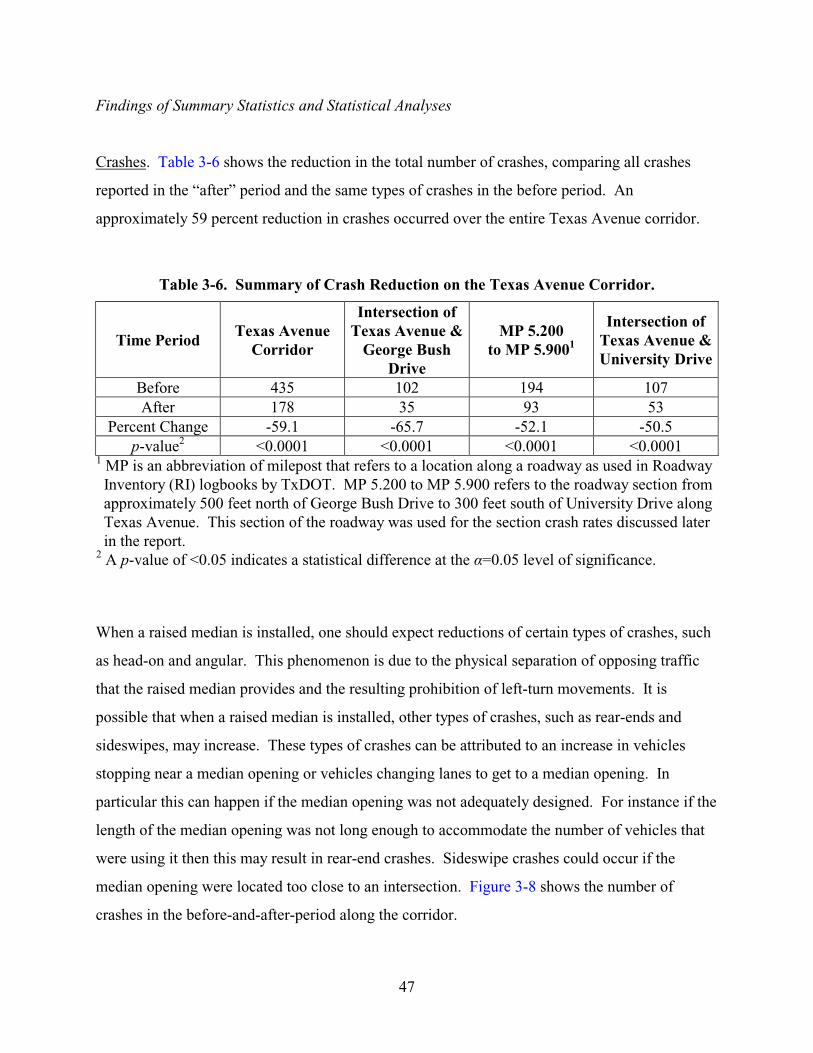
47
Findings of Summary Statistics and Statistical Analyses
Crashes. Table 3-6 shows the reduction in the total number of crashes, comparing all crashes
reported in the “after” period and the same types of crashes in the before period. An
approximately 59 percent reduction in crashes occurred over the entire Texas Avenue corridor.
Table 3-6. Summary of Crash Reduction on the Texas Avenue Corridor.
Time Period Texas Avenue
Corridor
Intersection of Texas Avenue &
George Bush Drive
MP 5.200 to MP 5.9001
Intersection of Texas Avenue & University Drive
Before 435 102 194 107 After 178 35 93 53
Percent Change -59.1 -65.7 -52.1 -50.5 p-value2 <0.0001 <0.0001 <0.0001 <0.0001
1 MP is an abbreviation of milepost that refers to a location along a roadway as used in Roadway Inventory (RI) logbooks by TxDOT. MP 5.200 to MP 5.900 refers to the roadway section from approximately 500 feet north of George Bush Drive to 300 feet south of University Drive along Texas Avenue. This section of the roadway was used for the section crash rates discussed later in the report.
2 A p-value of <0.05 indicates a statistical difference at the α=0.05 level of significance.
When a raised median is installed, one should expect reductions of certain types of crashes, such
as head-on and angular. This phenomenon is due to the physical separation of opposing traffic
that the raised median provides and the resulting prohibition of left-turn movements. It is
possible that when a raised median is installed, other types of crashes, such as rear-ends and
sideswipes, may increase. These types of crashes can be attributed to an increase in vehicles
stopping near a median opening or vehicles changing lanes to get to a median opening. In
particular this can happen if the median opening was not adequately designed. For instance if the
length of the median opening was not long enough to accommodate the number of vehicles that
were using it then this may result in rear-end crashes. Sideswipe crashes could occur if the
median opening were located too close to an intersection. Figure 3-8 shows the number of
crashes in the before-and-after-period along the corridor.
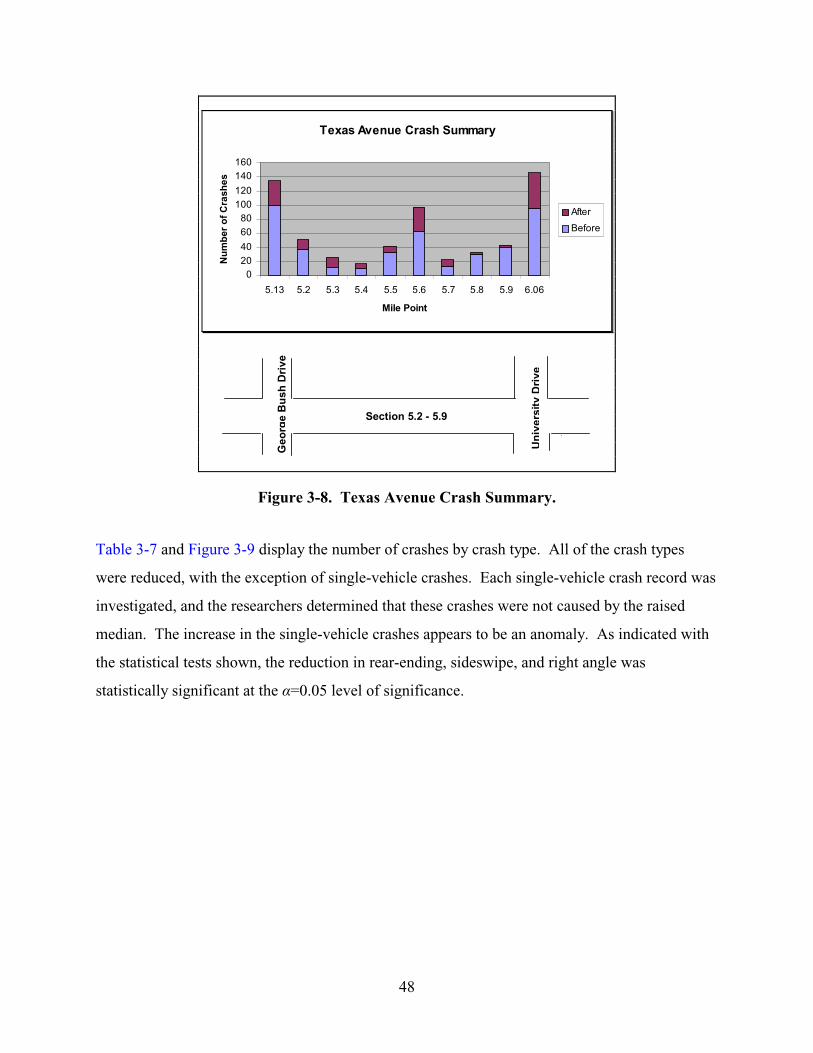
48
Figure 3-8. Texas Avenue Crash Summary.
Table 3-7 and Figure 3-9 display the number of crashes by crash type. All of the crash types
were reduced, with the exception of single-vehicle crashes. Each single-vehicle crash record was
investigated, and the researchers determined that these crashes were not caused by the raised
median. The increase in the single-vehicle crashes appears to be an anomaly. As indicated with
the statistical tests shown, the reduction in rear-ending, sideswipe, and right angle was
statistically significant at the α=0.05 level of significance.
Texas Avenue Crash Summary
02040
6080
100120
140160
5.13 5.2 5.3 5.4 5.5 5.6 5.7 5.8 5.9 6.06
Mile Point
Nu
mb
er o
f C
rash
esAfter
Before
Geo
rge
Bu
sh D
rive
Section 5.2 - 5.9
Un
iver
sity
Dri
ve
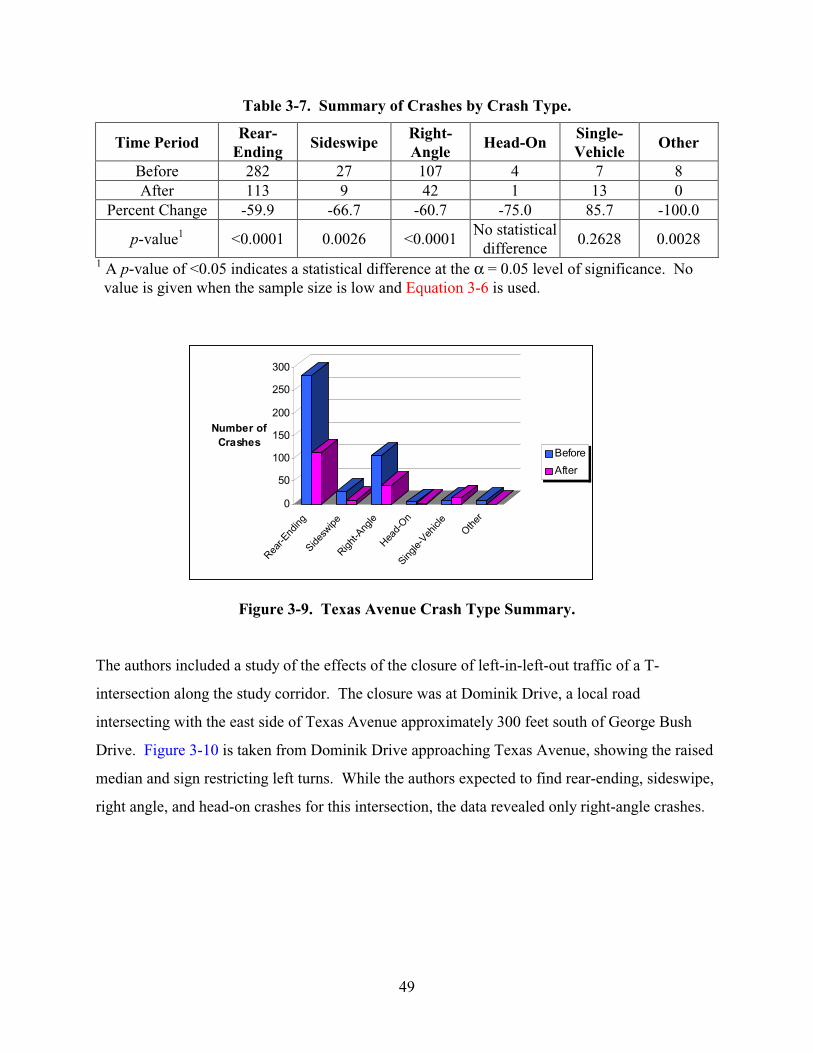
49
Table 3-7. Summary of Crashes by Crash Type.
Time Period Rear-
Ending Sideswipe
Right-Angle
Head-On Single-Vehicle
Other
Before 282 27 107 4 7 8 After 113 9 42 1 13 0
Percent Change -59.9 -66.7 -60.7 -75.0 85.7 -100.0
p-value1 <0.0001 0.0026 <0.0001 No statistical
difference 0.2628 0.0028
1 A p-value of <0.05 indicates a statistical difference at the α = 0.05 level of significance. No value is given when the sample size is low and Equation 3-6 is used.
Figure 3-9. Texas Avenue Crash Type Summary.
The authors included a study of the effects of the closure of left-in-left-out traffic of a T-
intersection along the study corridor. The closure was at Dominik Drive, a local road
intersecting with the east side of Texas Avenue approximately 300 feet south of George Bush
Drive. Figure 3-10 is taken from Dominik Drive approaching Texas Avenue, showing the raised
median and sign restricting left turns. While the authors expected to find rear-ending, sideswipe,
right angle, and head-on crashes for this intersection, the data revealed only right-angle crashes.
0
50
100
150
200
250
300
Number ofCrashes
Rear-E
nding
Sidesw
ipeRigh
t-Ang
leHea
d-On
Single-
Vehicl
e
Other
Before
After
50
Figure 3-10. Raised Median Restricting Left Turns at Dominik Drive.
There were sideswipes associated with the TWLTL along the study corridor, but none occurred at
the intersection of Dominik Drive and Texas Avenue (see Table 3-8). In one case, a motorist
exited a private drive south of Miliff Road and proceeded to use the TWLTL to travel
northbound on Texas Avenue. Using the TWLTL, the driver gained speed to enter the main
inside lane and sideswiped another vehicle. This specific location was not included in the raised
median retrofit, and a virtually identical crash occurred in both the before-and-after study
timeframes. Sideswipes decreased by 67 percent for the entire corridor, and this drop was
statistically significant (see Table 3-8).
Table 3-8. Sideswipe Crashes.
Time Period Texas Avenue Corridor Intersection of
Texas Avenue & Dominik Drive
Before 27 0 After 9 0
Percent Change -66.7 0 p-value1 0.0026 N/A
1 A p-value of <0.05 indicates a statistical difference at the α = 0.05 level of significance.
Raised MedianRaised Median
51
It was also found that the specific location of Dominik Drive at Texas Avenue in the before
period was channelized for left-turn traffic; hence, the chance for a head-on crash was minimal.
The authors reiterate that a raised median will remove the chance of a head-on crash in the center
lane, while a TWLTL does not have the physical means to reduce the opportunity for a head-on
crash.
Another scenario that the authors investigated was in relation to the proximity of Dominik Drive
and the adjacent signalized intersection of Texas Avenue and George Bush Drive (see
Figure 3-11). One of the initial concerns of the authors revolved around rear-ending crashes.
While TWLTLs decrease the number of roadway conflict points by removing turning traffic from
the mainlanes, some motorists will still take advantage of the traversable TWLTL. For example,
drivers have unprohibited access to private driveways and public streets and will drive into the
TWLTL immediately following a signalized intersection in the opposite direction of travel.
Along with the two left-turn lanes on northbound Texas Avenue, there is less than 150 feet of
southbound turn-lane to Dominik Drive and less than 150 feet of roadway between the
intersection and the turn lane. Traffic could queue into the George Bush Drive intersection
causing a rear-end crash; a rear-end crash could occur as a result of a motorist on George Bush
Drive turning right going southbound onto Texas Avenue and trying to weave across traffic when
southbound Texas Avenue has the right-of-way (ROW); or a rear-end crash could occur because
of southbound, left-turning, George Bush Drive vehicles attempting to access Dominik Drive.
While these weaving maneuvers more than likely occurred, there were no crashes attributed to
such scenarios.
52
Figure 3-11. Map Showing Dominik Drive and Surrounding Street Network (Map Provided by MapQuest.com, Inc.).
The authors then investigated crash migration (which occurs when crashes due to turning
maneuvers can no longer occur where turning maneuvers become prohibited and occur at other
intersections) in relation to the adjacent signalized intersection, and they included an
investigation of Texas Avenue south of Dominik Drive (see Figure 3-11). The motorists who
would have tried to turn left onto Dominik Drive from the southbound lanes of Texas Avenue,
would have performed one of the following: 1) traveled south down Texas Avenue, or 2) turned
right from the eastbound traffic on George Bush Drive, or 3) turned left from the westbound
traffic on George Bush Drive. The third scenario is the least likely to have occurred, because
many motorists would have taken an alternate route avoiding backtracking after going through
the signalized intersection. The two other routes offered after the retrofit are eastbound George
Bush Drive past Texas Avenue or the U-turn allowed at the end of the raised median and the
beginning of the TWLTL south of Dominik Drive.
The next set of drivers to consider are those turning left onto Texas Avenue from Dominik Drive.
The most likely rerouting path for them would be westbound on George Bush Drive to Texas
Avenue or eastbound/southbound on George Bush Drive as it turns to intersect Harvey Road.
53
Harvey Road (SH 30) runs east and west and intersects Texas Avenue south of the study
corridor.
Both left-in and left-out motorists had to reroute, but the authors did not see any corresponding
increases in crashes north or south of Dominik Drive along Texas Avenue. Right-angle crashes
decreased by 56 percent south of Dominik Drive, and there was the expected 100 percent
reduction at Dominik Drive (see Table 3-9). At the adjacent signalized intersection of George
Bush Drive and Texas Avenue, both the total crashes and the crash rates dropped by 66 and 70
percent, respectively. These findings appear to indicate that crashes are not migrating, and it
appears that the raised median has reduced crashes.
Table 3-9. Right-Angle Crashes.
Time Period Texas Avenue
Corridor
Intersection of Texas Avenue & Dominik
Drive
MP 6.190 to MP 6.2551
Before 107 16 16 After 42 0 7
Percent Change -60.7 -100 -56 p-value2 <0.0001 <0.0001 0.0602
1 MP is an abbreviation of milepost that refers to a location along a roadway as used in Roadway Inventory (RI) logbooks by TxDOT. MP 6.190 to MP 6.255 refers to the roadway section from approximately 600 feet south of George Bush Drive to 1100 feet south of George Bush Drive along Texas Avenue.
2 A p-value of <0.05 indicates a statistical difference at the α=0.05 level of significance.
Crash Rates. As indicated earlier, the authors studied the before-and-after crash rates using
Equations 3-1 and 3-2. Table 3-10 contains the summary of the crash rates and the associated
percent change. There was an overall reduction in the crash rates at the two major intersections
along the study corridor and for the section of roadway between the intersections.
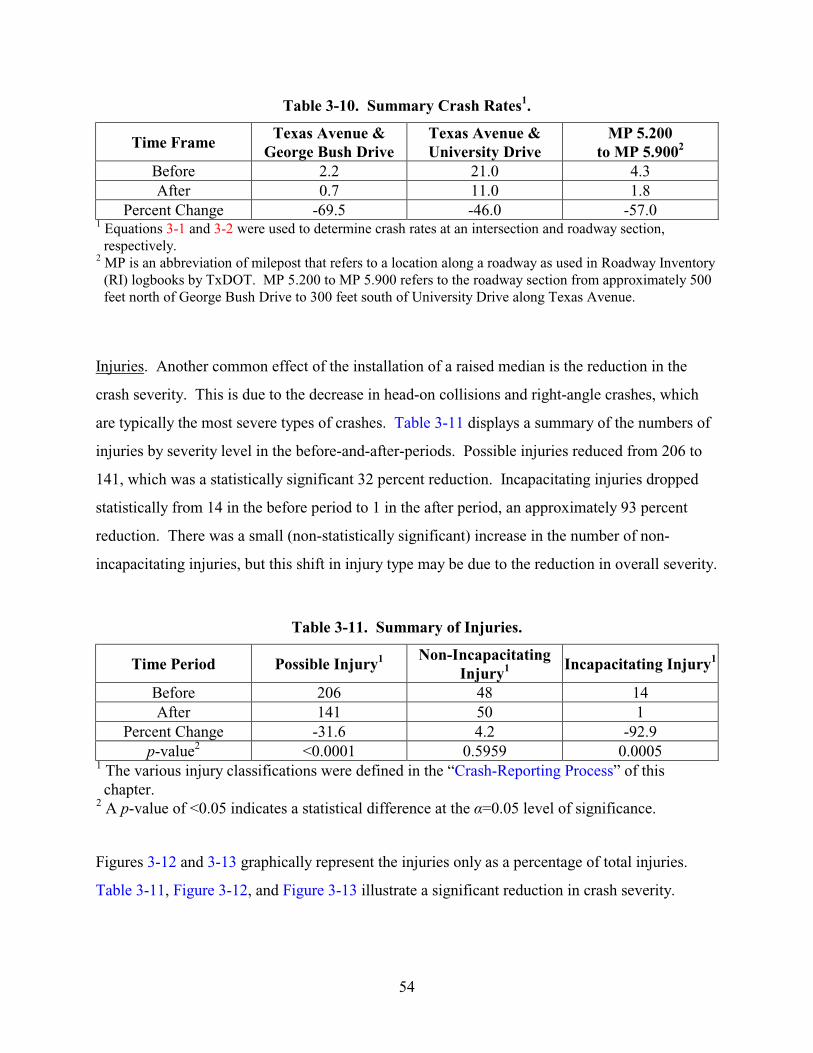
54
Table 3-10. Summary Crash Rates1.
Time Frame Texas Avenue &
George Bush Drive Texas Avenue & University Drive
MP 5.200 to MP 5.9002
Before 2.2 21.0 4.3 After 0.7 11.0 1.8
Percent Change -69.5 -46.0 -57.0 1 Equations 3-1 and 3-2 were used to determine crash rates at an intersection and roadway section,
respectively. 2 MP is an abbreviation of milepost that refers to a location along a roadway as used in Roadway Inventory
(RI) logbooks by TxDOT. MP 5.200 to MP 5.900 refers to the roadway section from approximately 500 feet north of George Bush Drive to 300 feet south of University Drive along Texas Avenue.
Injuries. Another common effect of the installation of a raised median is the reduction in the
crash severity. This is due to the decrease in head-on collisions and right-angle crashes, which
are typically the most severe types of crashes. Table 3-11 displays a summary of the numbers of
injuries by severity level in the before-and-after-periods. Possible injuries reduced from 206 to
141, which was a statistically significant 32 percent reduction. Incapacitating injuries dropped
statistically from 14 in the before period to 1 in the after period, an approximately 93 percent
reduction. There was a small (non-statistically significant) increase in the number of non-
incapacitating injuries, but this shift in injury type may be due to the reduction in overall severity.
Table 3-11. Summary of Injuries.
Time Period Possible Injury1 Non-Incapacitating
Injury1 Incapacitating Injury1
Before 206 48 14 After 141 50 1
Percent Change -31.6 4.2 -92.9 p-value2 <0.0001 0.5959 0.0005
1 The various injury classifications were defined in the “Crash-Reporting Process” of this chapter.
2 A p-value of <0.05 indicates a statistical difference at the α=0.05 level of significance.
Figures 3-12 and 3-13 graphically represent the injuries only as a percentage of total injuries.
Table 3-11, Figure 3-12, and Figure 3-13 illustrate a significant reduction in crash severity.
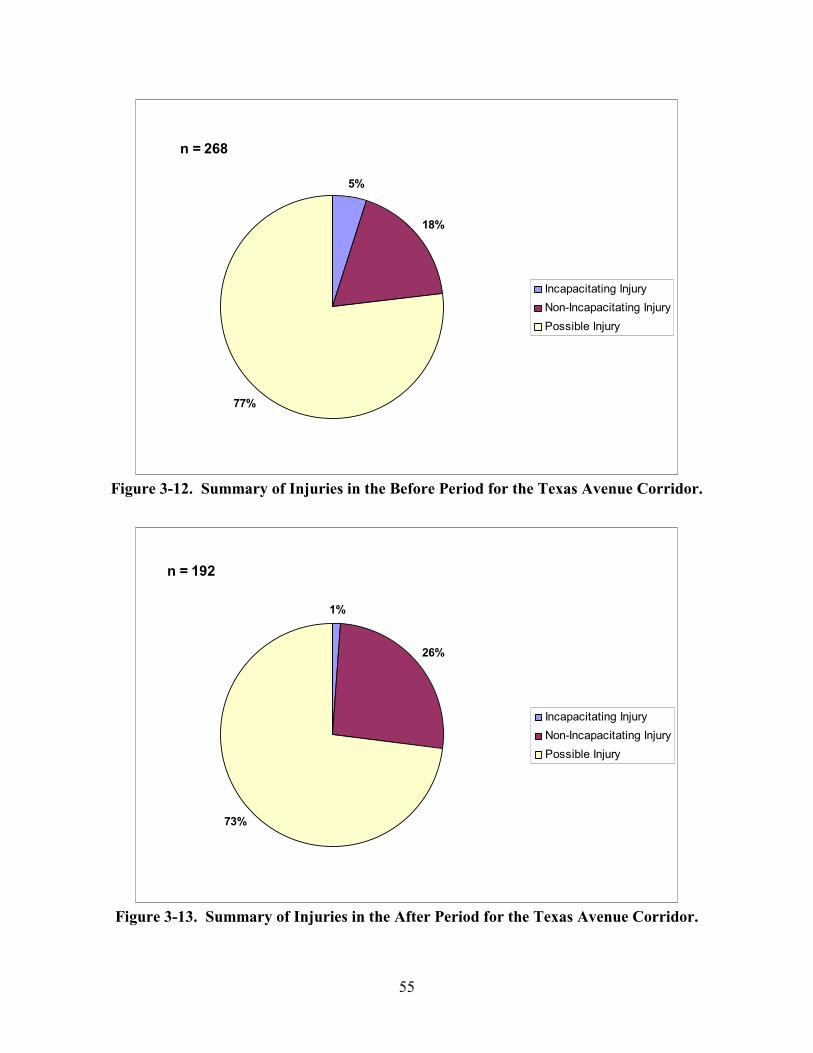
55
Figure 3-12. Summary of Injuries in the Before Period for the Texas Avenue Corridor.
Figure 3-13. Summary of Injuries in the After Period for the Texas Avenue Corridor.
n = 192
1%
26%
73%
Incapacitating Injury
Non-Incapacitating Injury
Possible Injury
n = 268
5%
18%
77%
Incapacitating Injury
Non-Incapacitating Injury
Possible Injury
56
3.2.6 Comparison Group
There are many different factors that can make a simple “before-and-after” study unreliable. The
most serious threat to the validity of the results of a “before-and-after” study is the lack of control
of potentially confounding factors (8). The underlying assumption behind a “before-and-after”
study is that the reduction in crashes from the “before” period to the “after” period is attributed to
the treatments. The following list describes confounding factors that, if not accounted for, may
make the results of a before-and-after study unreliable (8).
1. Traffic, weather, road user behavior, vehicle fleet, and other factors change over time.
Therefore the reduction in crashes or severity of crashes may be due to the change in these
factors.
2. Besides the treatment in question, there may be other treatments or programs that have been
implemented during either of the study periods.
3. The number of property damage only crashes is affected by the cost of repairs and will
change gradually over time.
4. The probability of reportable crashes being reported may be changing with time. This could
be due to a change in insurance rates.
5. The treated section of roadway may have been chosen for treatment because of an unusually
high number of crashes in the past. If so, the past crash history is “unusual.” An “unusual”
location may not be the best predictor of what would be expected in the future if the
treatment had not been applied.
To eliminate some of these factors that make the underlying assumption in the “before-and-after”
study questionable, a comparison group was used. A comparison group is applied to control all
the confounding factors that cannot be easily estimated. One study describes how it is reasonable
to assume that a large comparison group, i.e., one in which the annual count of crashes is at least
several hundred, included the effects of all factors that may produce changes over time in the
long-term expected number of crashes (9).
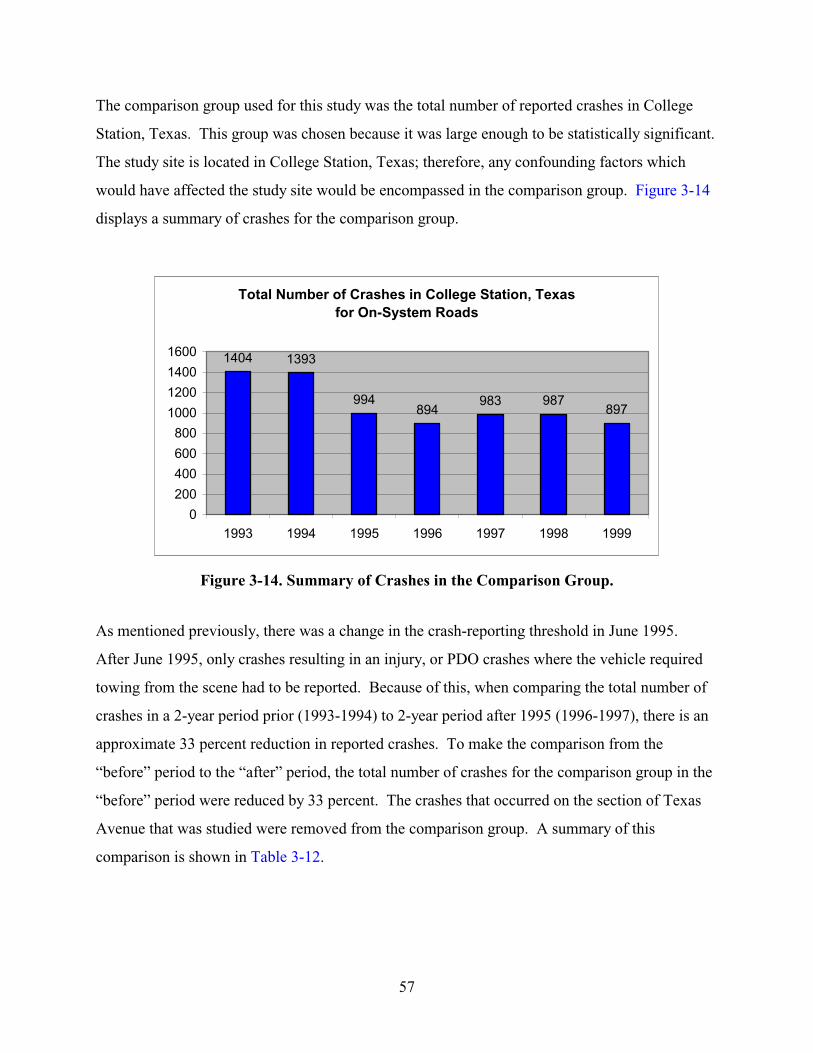
57
The comparison group used for this study was the total number of reported crashes in College
Station, Texas. This group was chosen because it was large enough to be statistically significant.
The study site is located in College Station, Texas; therefore, any confounding factors which
would have affected the study site would be encompassed in the comparison group. Figure 3-14
displays a summary of crashes for the comparison group.
Total Number of Crashes in College Station, Texasfor On-System Roads
1404 1393
994894
983 987897
0
200
400
600
800
1000
1200
1400
1600
1993 1994 1995 1996 1997 1998 1999
Figure 3-14. Summary of Crashes in the Comparison Group.
As mentioned previously, there was a change in the crash-reporting threshold in June 1995.
After June 1995, only crashes resulting in an injury, or PDO crashes where the vehicle required
towing from the scene had to be reported. Because of this, when comparing the total number of
crashes in a 2-year period prior (1993-1994) to 2-year period after 1995 (1996-1997), there is an
approximate 33 percent reduction in reported crashes. To make the comparison from the
“before” period to the “after” period, the total number of crashes for the comparison group in the
“before” period were reduced by 33 percent. The crashes that occurred on the section of Texas
Avenue that was studied were removed from the comparison group. A summary of this
comparison is shown in Table 3-12.
58
Table 3-12. Summary of Comparison of Texas Avenue Corridor to Comparison Group.
Texas Avenue Corridor Comparison Group Crashes in the Before Period 435 2,362
Reduced Crashes in the Before Period N/A1 1,582 Expected Crashes in the After Period 465 -
Crashes in the After Period 178 1,706 1 Crashes in the “before” period for the Texas Avenue were previously filtered to reflect the
change in the change in the crash-reporting threshold. The crashes in the comparison group increased by approximately 7 percent from the “before”
period to the “after” period. Therefore, it would be expected that there would also be a 7 percent
increase in crashes along the Texas Avenue corridor if there had not been any mitigation.
However, there was approximately a 60 percent reduction in total crashes on the Texas Avenue
corridor. Therefore, it appears confounding factors have not caused any part in the reduction of
crashes from the “before” to the “after” period for the Texas Avenue corridor. Therefore, the
reduction in crashes may be attributed to the raised median treatment, and not to other
confounding factors such as weather, vehicle fleet, driver behavior, cost of car repairs,
inclinations to report crashes, etc. Further research is needed to determine why there has been an
increase in crashes in College Station. This may be due to the population increase and/or to
younger drivers though the research team did not investigate this possibility.
3.2.7 Recommendations and Discussion
It appears that along the Texas Avenue corridor studied here that crashes and crash severity were
reduced by the raised median retrofit. The reduction of the crashes and the crash severity
suggests that the overall roadway safety was improved.
Closing left-turn access reduces conflict points and virtually removes the opportunity of right-
angle and head-on crashes. The removal of left-turn possibilities at Dominik Drive eliminated
right-angle crashes completely at that location. Left-turning traffic was redirected and gained
access through other means. Redirected traffic flows may result in crash migration; however, the
59
authors do not believe this occurred along this case study. However, even with the original crash
reports, it was difficult to ascertain the intent and/or the destination of the drivers.
Consequently, the researchers studied the crash characteristics of the whole corridor, and in
particular, right-angle crashes and crashes at the adjacent controlled intersection, George Bush
Drive at Texas Avenue. The authors investigated the adjacent signal because motorists may
reroute eastbound on George Bush Drive east of Texas Avenue to gain access to Dominik Drive.
The crashes for the whole corridor reduced by 59 percent and at the adjacent signal by 50
percent. Right-angle crashes south of Dominik Drive (a location that would offer a driver the
opportunity to make a U-turn and then a right-turn to gain access to Dominik Drive) reduced by
56 percent. It appears from these findings that crash migration did not occur and that the
rerouted paths by the use of a raised median resulted in a crash reduction and safer roadway.
3.3 LOOP 281 (LONGVIEW) CASE STUDY LOCATION
3.3.1 General Description
The second case study corridor is Loop 281 in Longview, Texas, between FM 63 (McCann
Road) and Spur 502 (Judson Road). This road segment was comprised of three through-lanes in
each direction, as well as a flush median that varied in width from a typical TWLTL to more than
30 feet. In the widest parts, vehicles would pull out from a driveway and line up several abreast,
waiting for acceptable gaps in which to complete left-turn movements. The raised median
project developed turn bays for full and directional turning movements (see Figure 3-15). In
addition, the raised median closed numerous left-turn opportunities that previously existed.
60
Figure 3-15. Loop 281 in Longview.
3.3.2 Crash Analysis
The Texas Department of Public Safety provided crash reports dating back to 1992,
approximately four years before the median was built in late 1996. This data set will allow the
research team to conduct a before-and-after-crash analysis of the corridor. The reports include
details about the number, severity, and locations of crashes on Loop 281. To date, the research
team has begun to categorize the crashes by type, location, etc. During fiscal year 2003, the
researchers will perform analysis with these data, as was done for the Texas Avenue corridor.
61
3.4 CALL FIELD ROAD (WICHITA FALLS) CASE STUDY LOCATION
3.4.1 General Description
The third case study corridor is along Call Field Road, in Wichita Falls, Texas. This segment of
Call Field Road, prior to improvements, had a five-lane cross-section, including a TWLTL and is
less than one-half mile in length. The adjacent land uses are primarily strip shopping centers
with a few stand-alone businesses. There are several driveways and two side streets that intersect
Call Field Road between the two end points of the segment (Kemp Blvd. and Lawrence Road).
One of the side streets, Faith Road, is an unsignalized intersection, while the other one, Rhea
Road, is signalized. The raised median closed left-turn opportunities at Faith Road, as well as
some driveways, as shown in Figure 3-16.
Figure 3-16. Call Field Road in Wichita Falls.
3.4.2 Crash Analysis
Since Call Field Road is not a state-maintained road, the research team obtained crash data from
the Wichita Falls Police Department. These data appear to be very useful, though they do not
necessarily contain the level of detail that the DPS reports usually have, nor are they in the same
format. The research team will, at a minimum, be able to develop trends in crash type, severity,
and number. Researchers have begun to categorize these data and will perform in-depth analysis
in fiscal year 2003.
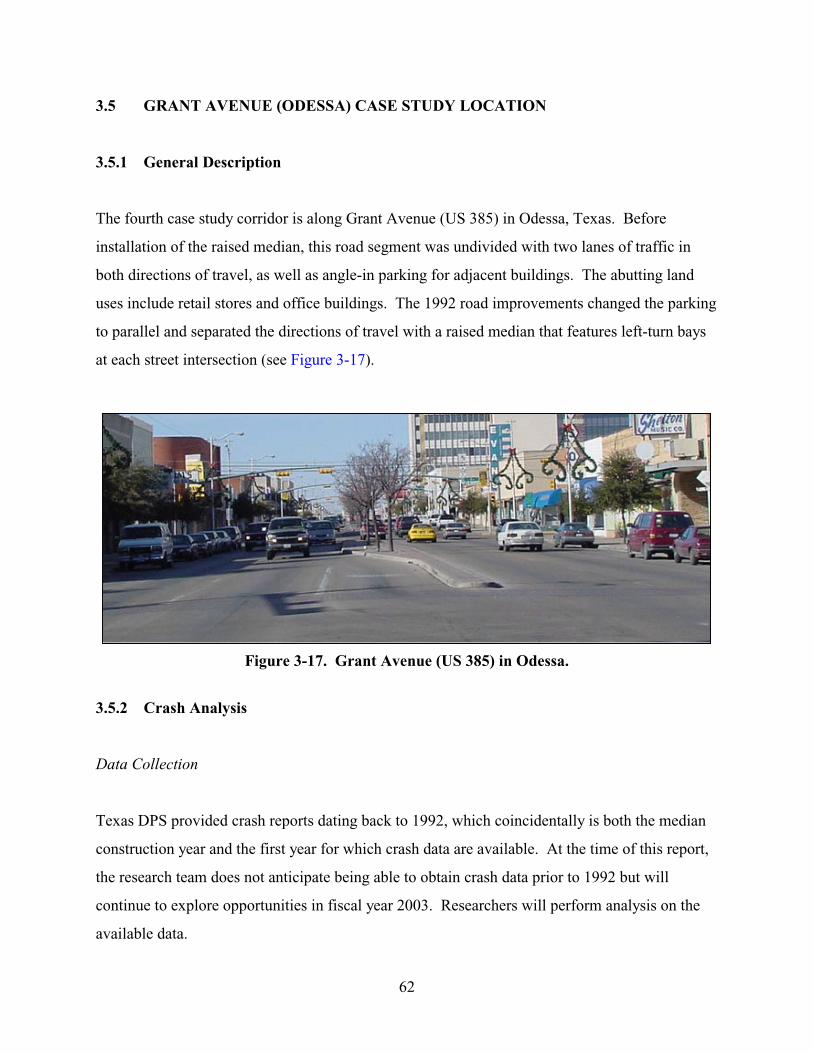
62
3.5 GRANT AVENUE (ODESSA) CASE STUDY LOCATION
3.5.1 General Description
The fourth case study corridor is along Grant Avenue (US 385) in Odessa, Texas. Before
installation of the raised median, this road segment was undivided with two lanes of traffic in
both directions of travel, as well as angle-in parking for adjacent buildings. The abutting land
uses include retail stores and office buildings. The 1992 road improvements changed the parking
to parallel and separated the directions of travel with a raised median that features left-turn bays
at each street intersection (see Figure 3-17).
Figure 3-17. Grant Avenue (US 385) in Odessa.
3.5.2 Crash Analysis
Data Collection
Texas DPS provided crash reports dating back to 1992, which coincidentally is both the median
construction year and the first year for which crash data are available. At the time of this report,
the research team does not anticipate being able to obtain crash data prior to 1992 but will
continue to explore opportunities in fiscal year 2003. Researchers will perform analysis on the
available data.
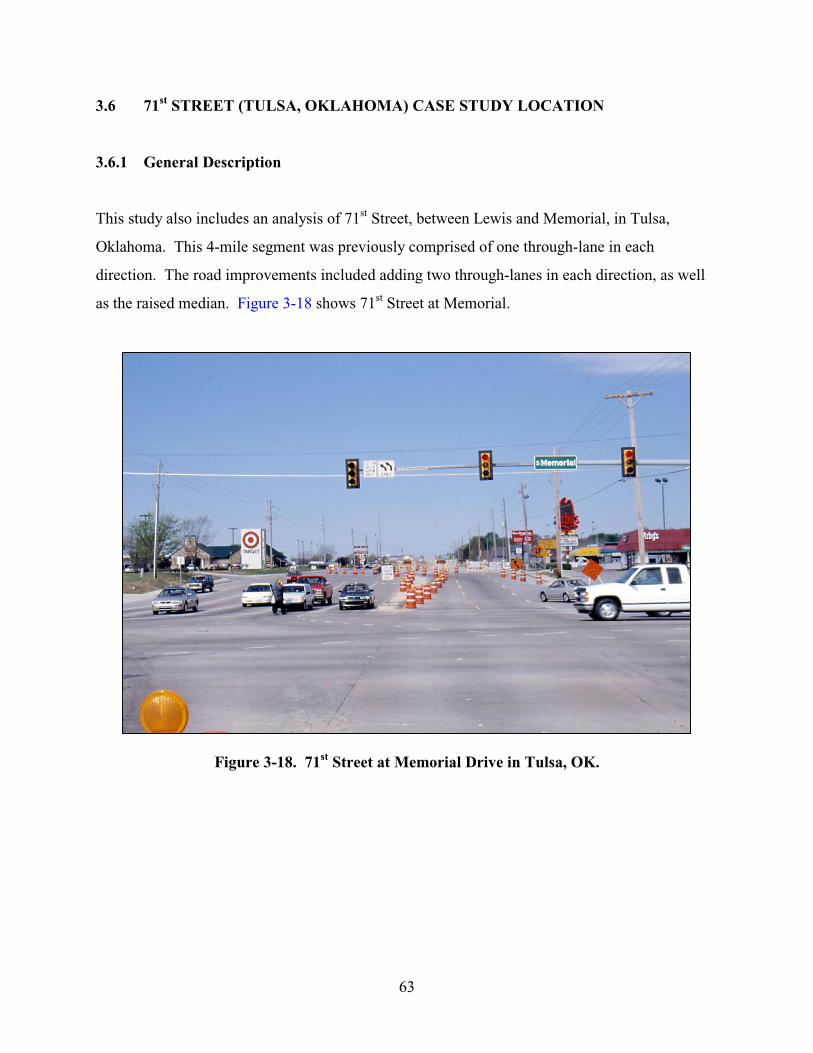
63
3.6 71st STREET (TULSA, OKLAHOMA) CASE STUDY LOCATION
3.6.1 General Description
This study also includes an analysis of 71st Street, between Lewis and Memorial, in Tulsa,
Oklahoma. This 4-mile segment was previously comprised of one through-lane in each
direction. The road improvements included adding two through-lanes in each direction, as well
as the raised median. Figure 3-18 shows 71st Street at Memorial.
Figure 3-18. 71st Street at Memorial Drive in Tulsa, OK.
64
3.6.2 Crash Analysis
Data Collection
The Oklahoma Department of Transportation provided relatively detailed crash data for this
corridor. Again, the research team discovered differences in format and detail among various
agencies that provide crash data. Initially the research team requested data for a portion of the
road segment to determine usefulness. Reviews performed to date indicate that the data are
useful, and additional data for the remainder of the corridor have been requested.
65
CHAPTER 4
PRELIMINARY FINDINGS AND DISCUSSION
4.1 TRAFFIC FLOW IMPACTS
Based on the preliminary micro-simulation findings along the Texas Avenue corridor, there
appear to be small differences in the travel time and delay between the existing (TWLTL) and
proposed conditions (raised median). The proposed condition suggests a slight increase in travel
time and delay overall. This situation is likely attributed to an overall increase in traffic on the
corridor, as some U-turning vehicles must travel farther to reach their destination. Delay may
also increase slightly at the intersections. An increase in delay is expected at the Texas Avenue
and Eagle Pass/Sulphur Springs intersection because of the additional U-turning traffic. Delay is
also expected to increase at the Texas Avenue and Villa Maria intersection due to an increase in
vehicles traveling through the intersection to reach median openings located north and south of
the intersection. Though these findings are preliminary, they appear to indicate that with the
installation of raised medians, geometric intersection improvements should be anticipated.
Adding 20 percent to the traffic volumes, which equates to approximately 10 years of growth,
requires mitigation at the intersection of Texas Avenue and Villa Maria. Based on this
preliminary VISSIM simulation, installing a raised median on Texas Avenue would decrease
future travel times by 11 seconds (11 percent) and delays by 9 seconds (22 percent) on the
corridor. This is not expected to be significant; however, beyond approximately 10 years (20
percent traffic growth), the raised median would be expected to provide additional travel time
and delay reduction. This will be further investigated with the theoretical corridors in the second
year of the study. In addition, the research team may re-evaluate the Texas Avenue corridor in
the second year of the study to further investigate the potential issues and considerations
identified in section 2.3 that highlights potential limitations of the preliminary VISSIM findings.
66
4.2 SAFETY IMPACTS
The preliminary findings from one corridor along Texas Avenue suggest that, in general, crash
rates and severity tended to decrease after the raised median was installed. In the first year of this
project, the most in-depth crash analysis and methodology development was performed on the
Texas Avenue corridor in College Station. With the statistical analysis process being refined and
fully utilized for that corridor, the research team will continue to use it on the other corridors
described in this report.
Every time that left-turns in or out of an intersection are removed, at a minimum, conflict points
are removed. Conflict points were reduced 26 percent in the retrofit project studied along Texas
Avenue. The removal of conflict points reduces the number of opportunities for vehicle paths to
cross. Crashes involving left-turning vehicles are typically head-on or right-angle, which can be
the most severe in terms of injuries and property damage.
4.3 CRASH DATA AVAILABILITY AND RELIABILITY
The investigations of this research project demonstrate that the crash data format and availability
vary among agencies. The Texas Department of Transportation provides relatively consistent
crash reports and summaries, from which much useful information can be obtained. When
working with off-state-system roads, however, one must usually rely on a local city or other
entity to provide crash data. The total number of crashes and types of crashes will always
provide insightful and fundamental information about the safety of a corridor. However, the
consistency and usefulness of locally provided data details will make some data more useful than
others for statistical analysis. Data provided by other states will vary, as well, as has been
experienced with the Tulsa, Oklahoma, case study. However, even the basic numbers of crashes
and types can provide useful information, in addition to the details included in crash reports and
summaries.
67
4.4 FUTURE RESEARCH
During fiscal year 2003, the research team will continue to analyze the corridors described in this
report, as well as others that lend themselves to investigation. An aggregation of statistical
findings of all case studies will provide useful information related to safety benefits of
implementing access management techniques. The research team will also document detailed
accounts of the variety of crash data that are available from various agencies and provide
recommendations for improving consistency in reporting.

69
CHAPTER 5
REFERENCES
1. VISSIM 3.60 User Manual. PTV Planning Transport Verkehr Ag. Germany, 2001. See also
http://www.english.ptv.de or http://www.itc-world.com.
2. Turner, S.M., W.L. Eisele, R.J. Benz, and D.J. Holdener. Travel Time Data Collection
Handbook. Report No. FHWA-PL-98-035, FHWA, U.S. Department of Transportation,
1998.
3. Bonneson, James A., and Patrick T. McCoy. Capacity and Operational Effects of Midblock
Left-Turn Lanes. NCHRP Report 395. Transportation Research Board, National Research
Council, Washington, D.C., 1997.
4. Miles, J.D. Assessing Crash Impacts of Access Management: Procedure and Results along a
Short Arterial Segment. In Compendium of Undergraduate Transportation Engineering
Fellows Student Papers, 2002. Shawn M. Turner, Editor. Report No. SWUTC/02/473700-
00003-5, Texas Transportation Institute, College Station, Texas. August 2002.
5. McShane, William R., and Roger P. Roess. Traffic Engineering. Prentice Hall, New Jersey.
1990.
6. Manual of Transportation Engineering Studies. Edited by H.G. Robertson, J.E. Hummer
and D.C. Nelson. Institute of Transportation Engineers, Washington, D.C., 2000.
7. Sachs, Lothar. Applied Statistics: A Handbook of Techniques. Springer-Verlag, New York.
1984.
8. Hauer, E. Observational Before-After Studies in Road Safety. Pergamon Press. 1997.
9. Zegeer, Charles V. Highway Accident Analysis Systems. National Cooperative Highway
Research Program Synthesis of Highway Practice, 1982.

71
APPENDIX A
VISSIM Simulation

73
VISSIM SIMULATION PROCEDURE
General Process
1. Obtain an aerial photograph of the roadway for use as your background in VISSIM.
2. Obtain roadway geometrics such as number of lanes, lane widths, and driveway widths,
distance between driveways, length of dedicated turn lanes, etc.
3. Collect traffic volumes such as mainlane counts, intersection turning movements, and
driveway volumes and turning movements.
4. Obtain any intersection signal timings.
5. Perform travel-time runs from the beginning to the end of the corridor during the peak
hour. This information will be used later to calibrate the model.
a) The peak hour was selected as the hour with the combination of the highest
mainlanes, intersection, and driveway traffic volumes.
Creating the Network
1. Input the background into VISSIM.
a) Scale the drawing using a measurement taken in the field, and save the scale.
2. Draw links for main roads and driveways.
a) Make separate links for each segment of roadway.
b) Do not draw links across intersections – you will connect these with connectors in the
next step.
c) Space driveways according to the aerial photograph, if possible. If not the distances
can be scaled off from your field measurements.
3. Draw connectors.
a) Connect each of the links across the intersection with connectors.
b) Connect all right and left turns on and off of the main road with connectors.
74
c) For left-turn connectors onto a multi-lane road, connect the left-turn in the left-most
lane.
The following steps should be completed for one driveway at a time until that driveway is
operating well.
4. Enter stop signs.
a) Place stop signs before any connectors.
5. Enter priority rules.
a) Use gap times of 3.0 – 4.0 seconds for right-turn movements.
b) Use gap times of 4.5 – 5.5 seconds for left-turn movements.
c) Note: You may have to vary these depending on the roadway widths.
6. Enter mock traffic volumes.
a) It is recommended to enter a high volume such as 100 vehicles per hour at each
driveway so you can see any potential conflicts.
7. Simulate.
a) Watch for any collisions.
b) Update priority rules until there are no collisions.
8. Move on to the next driveway.
9. Complete steps 4-7 again.
After all of the driveways are operating without collisions, move on to the following steps.
Change the traffic volumes to the actual volumes.
1. Use the routing decision tool to direct the vehicles where to go.
Be careful of putting a routing decision too close to a connector; the vehicle may miss the
connector and you will receive an error message.
75
2. Input traffic signals.
The traffic signals in VISSIM use National Electrical Manufacturers Association
(NEMA) phasing. VISSIM does not have the capability to optimize signal timing. To
optimize the signals, you will need to use software such as SYNCHRO, if you have more
than one signal. Highway capacity software could also be used if there is only one signal
or there is no coordination between the signals.
3. Evaluations.
VISSIM has the capability to collect data such as average delay, stopped delay, number of
stops, queue length, travel time, emissions, intersection delay, etc. You must set up
parameters during which you want to collect data. If you want to collect an hour of data,
researchers recommend simulating from 0-3900 seconds and collecting data from 300-
3900 seconds. This will allow time for the network to become saturated with vehicles
before the data collection begins.
4. Output.
VISSIM has the capability to determine the following values during simulation – travel
time, total delay, intersection delay, queue length, number of stops, etc. See the VISSIM
manual for a complete description of outputs. The user must designate what values
he/she wants as output. The output is separated into text files that can be easily placed
into a spreadsheet to evaluate.
5. Calibration.
After obtaining the initial output from the model, it is necessary to calibrate the model to
adequately predict the traffic conditions in the field. In this step, you will be using the
travel time data that you collected in the field. Compare the average travel times to the
travel times output by VISSIM. If there are significant differences in the travel times, you
can change the speed distributions in VISSIM until the travel times are similar.

77
APPENDIX B
Crash-Reporting Process

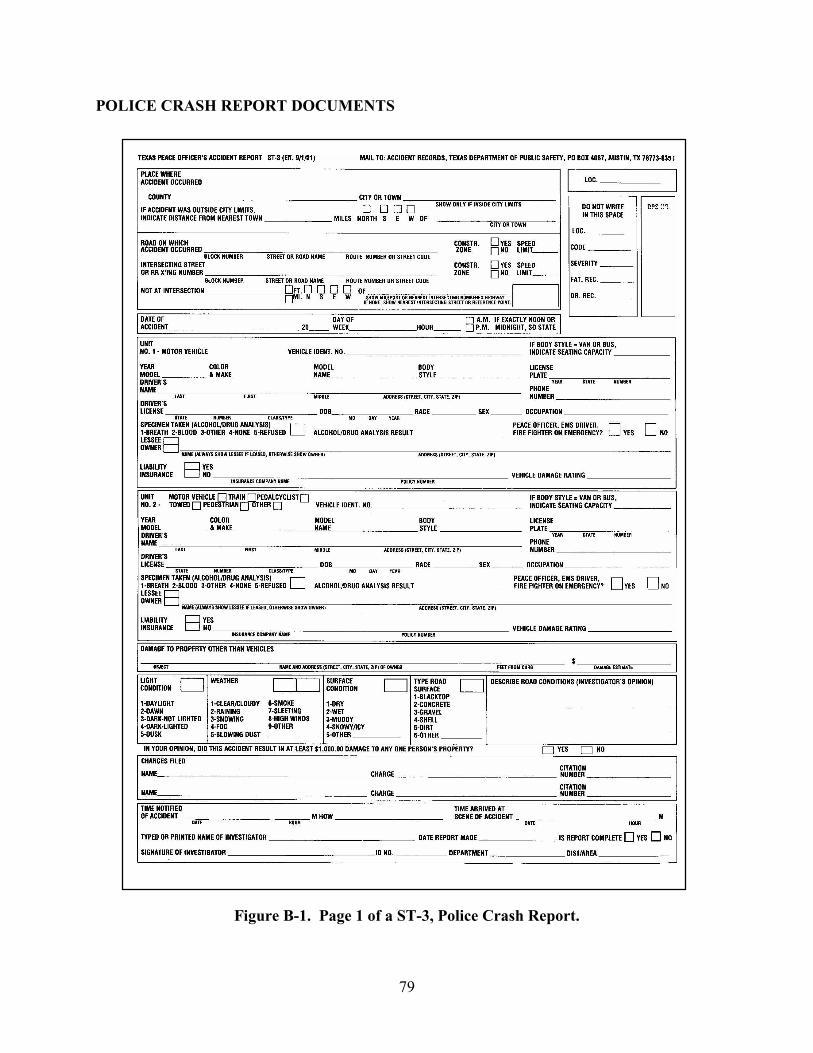
79
POLICE CRASH REPORT DOCUMENTS
Figure B-1. Page 1 of a ST-3, Police Crash Report.
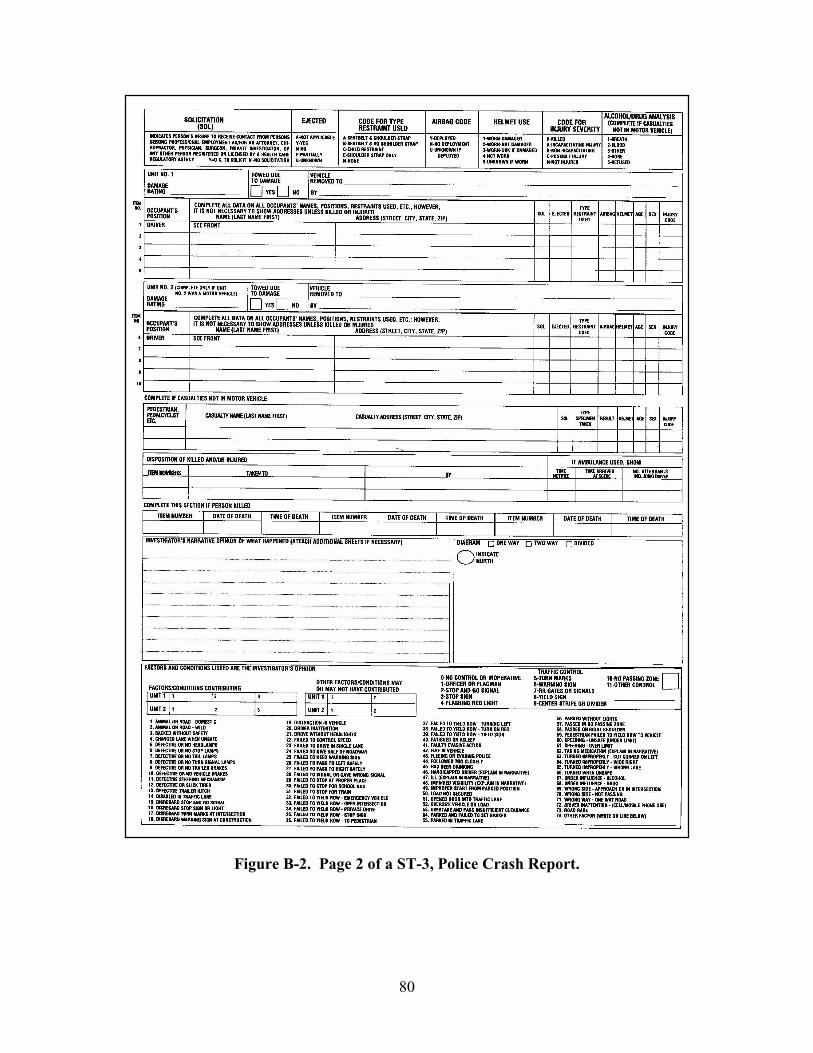
80
Figure B-2. Page 2 of a ST-3, Police Crash Report.
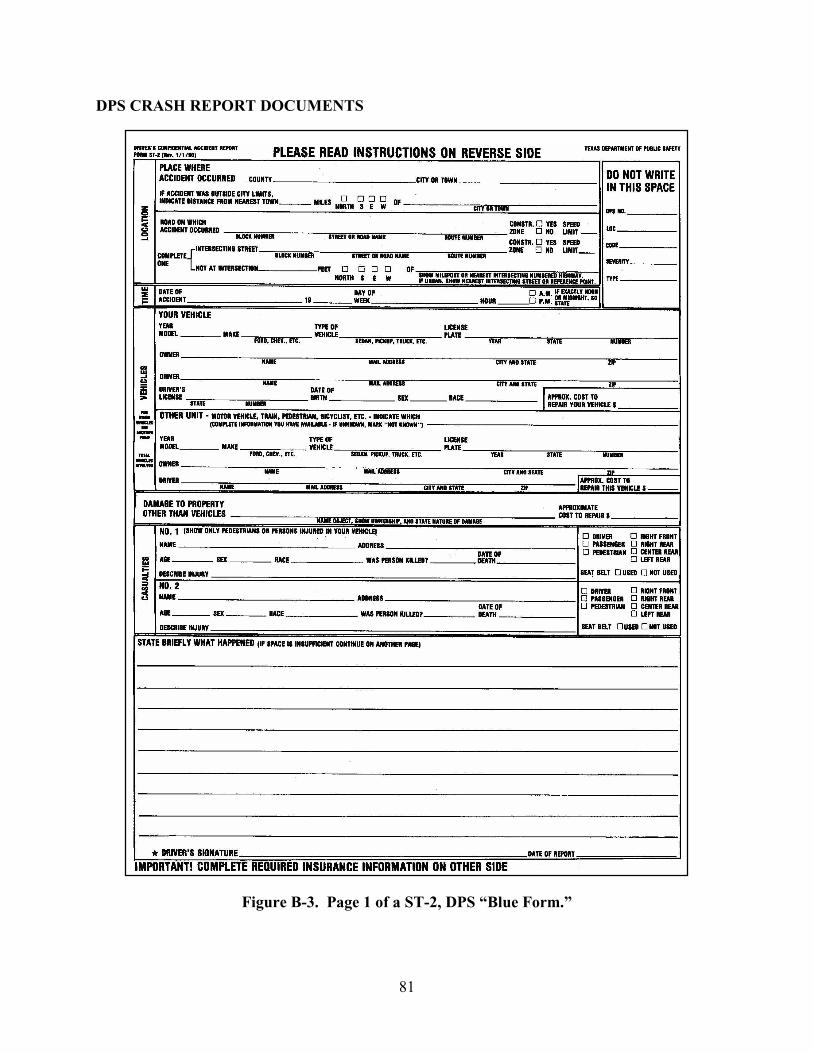
81
DPS CRASH REPORT DOCUMENTS
Figure B-3. Page 1 of a ST-2, DPS “Blue Form.”
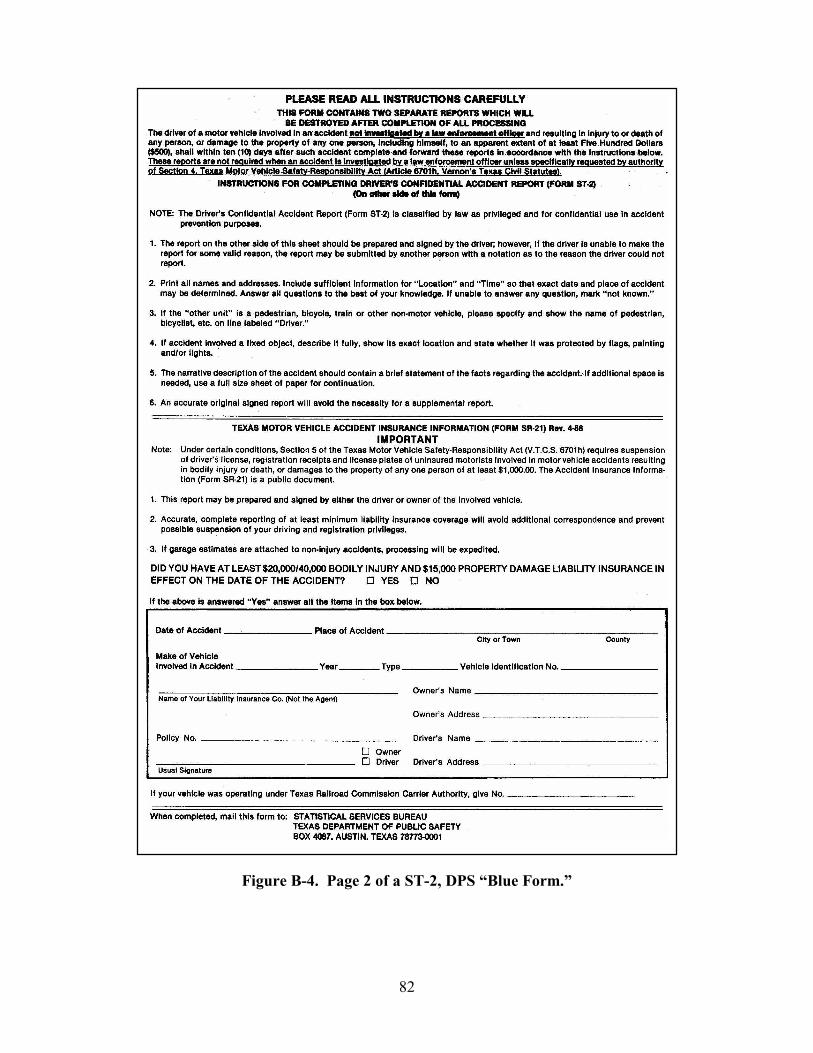
82
Figure B-4. Page 2 of a ST-2, DPS “Blue Form.”
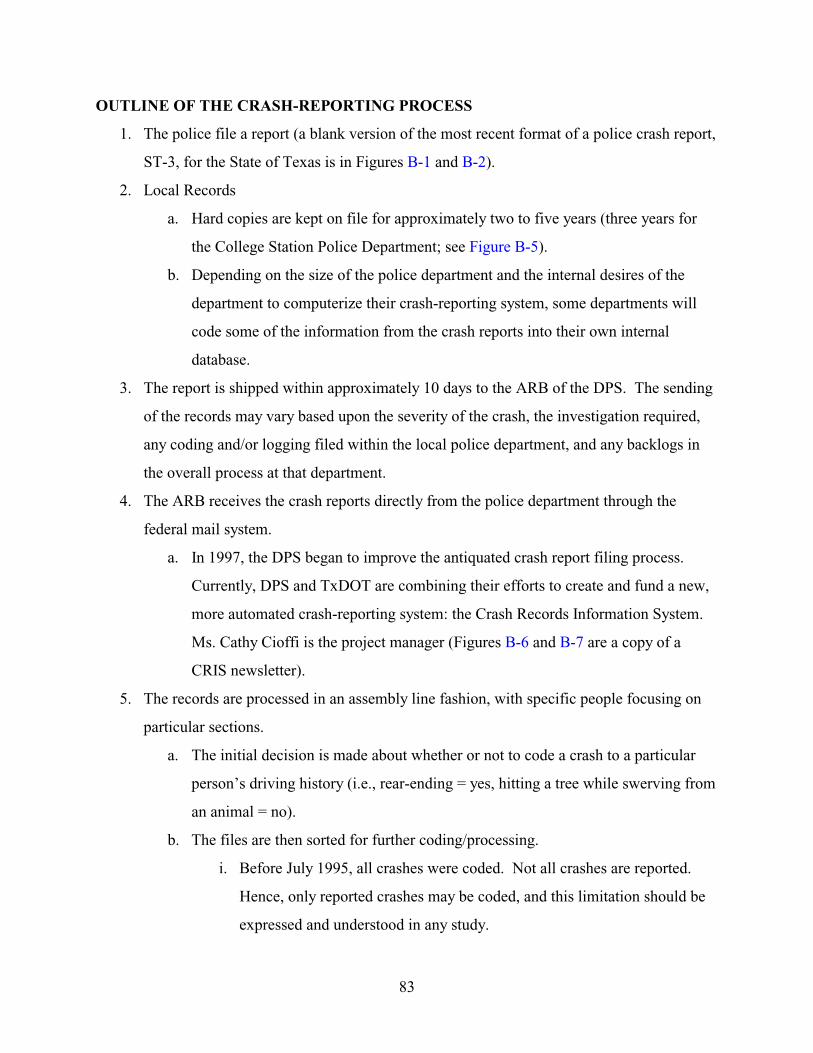
83
OUTLINE OF THE CRASH-REPORTING PROCESS
1. The police file a report (a blank version of the most recent format of a police crash report,
ST-3, for the State of Texas is in Figures B-1 and B-2).
2. Local Records
a. Hard copies are kept on file for approximately two to five years (three years for
the College Station Police Department; see Figure B-5).
b. Depending on the size of the police department and the internal desires of the
department to computerize their crash-reporting system, some departments will
code some of the information from the crash reports into their own internal
database.
3. The report is shipped within approximately 10 days to the ARB of the DPS. The sending
of the records may vary based upon the severity of the crash, the investigation required,
any coding and/or logging filed within the local police department, and any backlogs in
the overall process at that department.
4. The ARB receives the crash reports directly from the police department through the
federal mail system.
a. In 1997, the DPS began to improve the antiquated crash report filing process.
Currently, DPS and TxDOT are combining their efforts to create and fund a new,
more automated crash-reporting system: the Crash Records Information System.
Ms. Cathy Cioffi is the project manager (Figures B-6 and B-7 are a copy of a
CRIS newsletter).
5. The records are processed in an assembly line fashion, with specific people focusing on
particular sections.
a. The initial decision is made about whether or not to code a crash to a particular
person’s driving history (i.e., rear-ending = yes, hitting a tree while swerving from
an animal = no).
b. The files are then sorted for further coding/processing.
i. Before July 1995, all crashes were coded. Not all crashes are reported.
Hence, only reported crashes may be coded, and this limitation should be
expressed and understood in any study.
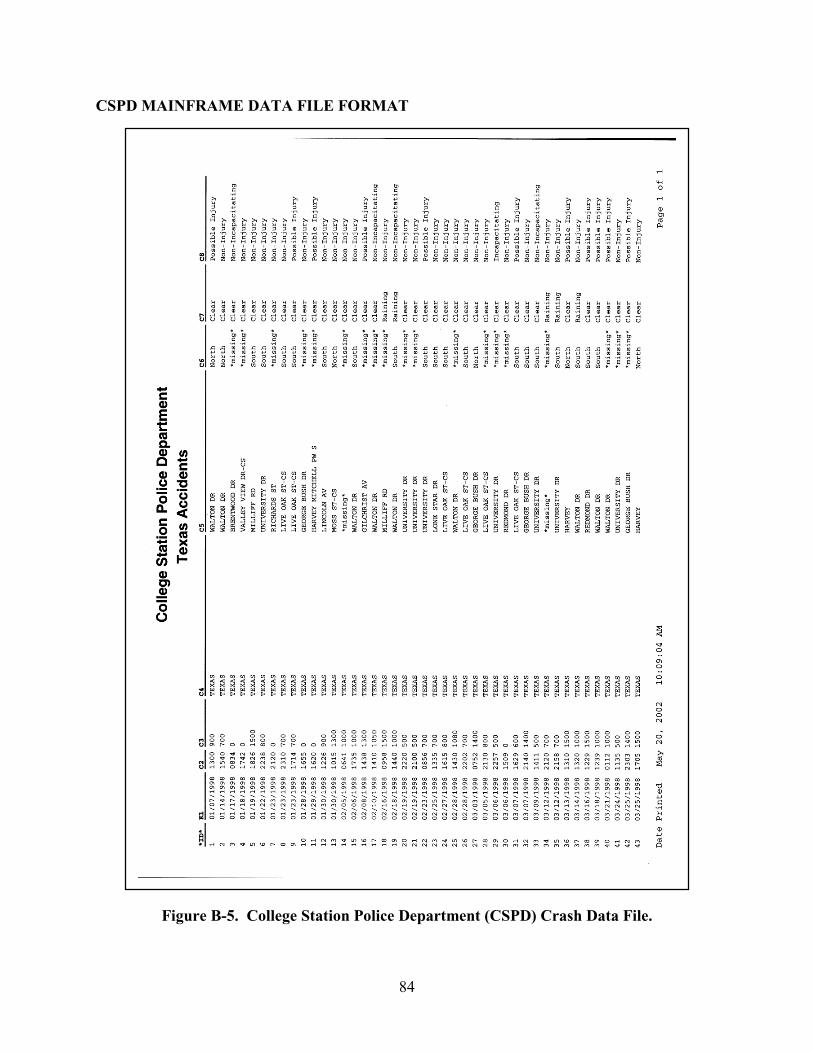
84
CSPD MAINFRAME DATA FILE FORMAT
Figure B-5. College Station Police Department (CSPD) Crash Data File.
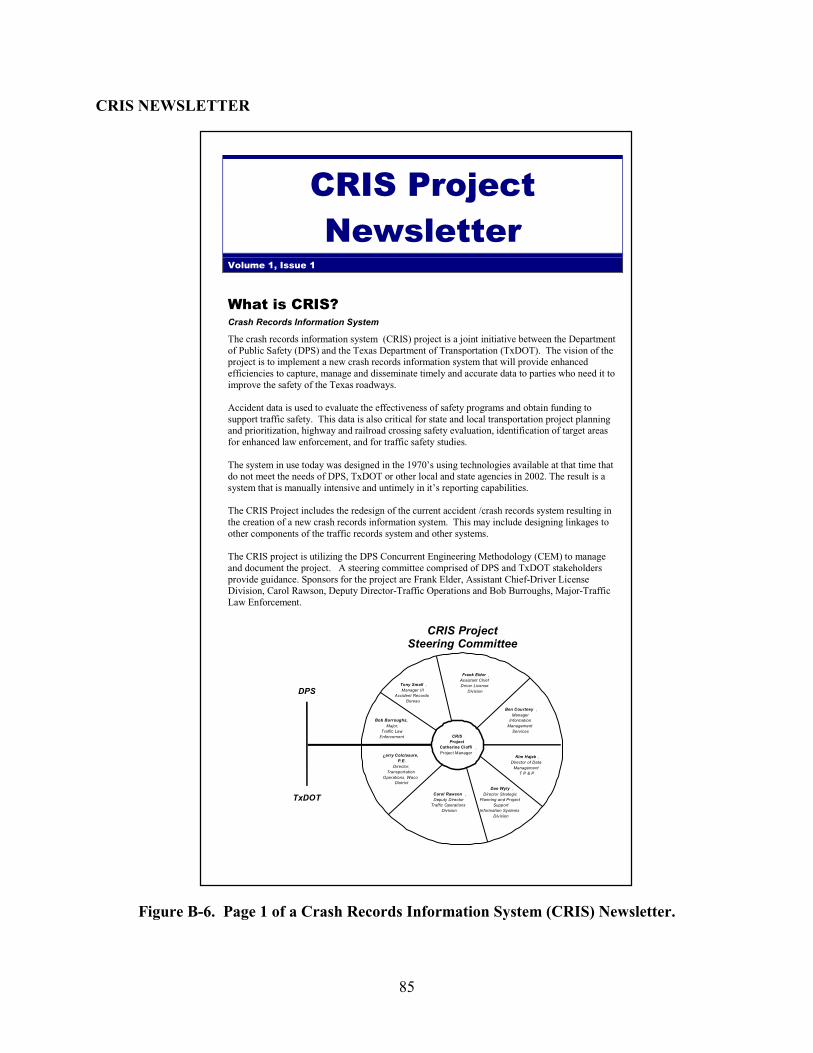
85
CRIS NEWSLETTER
Figure B-6. Page 1 of a Crash Records Information System (CRIS) Newsletter.
CRIS Project Newsletter
Volume 1, Issue 1
What is CRIS? Crash Records Information System
The crash records information system (CRIS) project is a joint initiative between the Department of Public Safety (DPS) and the Texas Department of Transportation (TxDOT). The vision of the project is to implement a new crash records information system that will provide enhanced efficiencies to capture, manage and disseminate timely and accurate data to parties who need it to improve the safety of the Texas roadways. Accident data is used to evaluate the effectiveness of safety programs and obtain funding to support traffic safety. This data is also critical for state and local transportation project planning and prioritization, highway and railroad crossing safety evaluation, identification of target areas for enhanced law enforcement, and for traffic safety studies. The system in use today was designed in the 1970’s using technologies available at that time that do not meet the needs of DPS, TxDOT or other local and state agencies in 2002. The result is a system that is manually intensive and untimely in it’s reporting capabilities. The CRIS Project includes the redesign of the current accident /crash records system resulting in the creation of a new crash records information system. This may include designing linkages to other components of the traffic records system and other systems. The CRIS project is utilizing the DPS Concurrent Engineering Methodology (CEM) to manage and document the project. A steering committee comprised of DPS and TxDOT stakeholders provide guidance. Sponsors for the project are Frank Elder, Assistant Chief-Driver License Division, Carol Rawson, Deputy Director-Traffic Operations and Bob Burroughs, Major-Traffic Law Enforcement.
CRISProject
Catherine Cioffi ,Project Manager
DPS
TxDOT
CRIS ProjectSteering Committee
Frank Elder ,Assistant ChiefDriver License
Division
Tony Small ,Manager III
Accident RecordsBureau
Ben Courtney ,Manager
InformationManagement
Services
Carol Rawson ,Deputy Director
Traffic OperationsDivision
Dan Wyly ,Director Strategic
Planning and ProjectSupport
Information SystemsDivision
Kim Hajek ,Director of Data
ManagementT P & P
Larry Colclasure,P.E.
Director,Transportation
Operations, WacoDistrict
Bob Burroughs,Major,
Traffic LawEnforcement
86
Figure B-7. Page 2 of a Crash Records Information System (CRIS) Newsletter.
Currently, we have a vendor conducting a Study & Recommend assisting the CRIS Steering Committee in making a solution approach decision. The vendor will deliver a Findings and Recommendation Report in August that will include a recommended solution approach and a cost benefit analysis. The project will take a phased approach to implementation. A Request for Offer (RFO) for the next phase of the project is expected to go out by the end of the 4th quarter 2002. The project is expected to move into the design and implementation phase by the end of the 1st quarter 2003.
The five CRIS process areas and potential technologies are graphically depicted below:
1.0Local Data
Capture
2.0Local Data
Validation &Entry
3.0Central DataValidation &
Entry
4.0Central DataReview &Analysis
5.0Central DataDistribution
GPS/GIS Accident Locating
Remote DataCapture
Security
Document Imaging
Data Entry
DataWarehousing
ElectronicPayment
GIS Data Analysis and Reporting
Workflow Management
Database Management
Document Imaging
System Hosting
Influence Direct Control
Special thanks to Rick Pearson and Tony Zamarripa of the Accident Records Bureau for their imagination and creativity in the design of the CRIS project logo.
If you are interested in receiving quarterly CRIS updates or have questions about the project, please contact: Cathy Cioffi CRIS Project Manager (512) 424-5436 [email protected]
87
ii. As of July 1995, non-injury crashes that do not result in property damage
of greater than $1,000 (i.e., tow-away crashes will exceed this and are the
usual criteria for coding property damage only crashes) are no longer
coded. Also, only injured passengers are coded. Before, all passengers
were coded.
iii. Both coded and non-coded records are stored on microfilm at the same
time. They are transferred to microfilm after the coding process is
complete, and the records are uploaded into the DPS mainframe.
c. Files to be coded will be further classified and numbered.
i. The coding process is completed using in-house written documents.
ii. These documents will be sent to another department for input into the DPS
mainframe database. CD-ROMs may be made for a particular county for
use outside of the DPS.
1. These CDs are made upon request. The CDs contain the data in a
data stream format. This format is impossible to read without the
appropriate codebook. Furthermore, it is still difficult to read
without the proper formatting software. Texas Transportation
Institute uses a statistical analysis software package, called SAS.
This program converts the data stream into a user-friendlier format
that may be imported into spreadsheet software such as Microsoft
Excel.
2. The format contains column headers, and virtually all of the data
are in numeric coding that is fairly easy to understand by anyone
who has a copy of the coding sheets.
iii. The applicable information is also coded to the driving records of the
motorists involved in a crash. A crash is only coded to someone’s
personal driving record if he/she is at fault and/or that person received a
traffic citation.
88
d. The coding process is filled with checks and editing.
i. A double input method is used, whereby two individuals enter the same
information, and a computer compares the records to find possible errors.
ii. The computer will only allow certain ranges of information to be entered
in certain fields to reduce errors. For example, some entries may only
allow text while some may only allow numbers and other entries may only
allow one number while others allow up to three digits.
e. Record A contains the summarized crash report information including the
location, number of vehicles involved, type of crash, orientation, and other
information.
f. Record B contains the driver’s and the vehicle’s descriptive information.
i. This includes whether the drivers were injured, drunk, and/or considered
at-fault.
ii. The vehicle description comprises of vehicle make and model information
and whether a vehicle defect could be attributed to the crash.
g. Record C contains only the information for the passengers in the vehicles
involved and any pedestrians, cyclists, or additional people involved (non-injured
passengers are not coded, but the total people inside each vehicle is listed).
h. All of the records are kept in the mainframe database, and hard copies of the
reports are kept on file and organized by county and date in the ARB.
i. Paper hard copies are transferred to microfilm hardcopies and held for 10
years. The records are destroyed after 10 years.
ii. DPS has an internal seven-digit coding system for referencing within the
data in the mainframe or on CD.
1. The DPS coding is reused at the beginning of every new 10-year
period.
2. The seven-digit code is not used in pulling actual records from the
stored microfilm filing system.
3. The seven-digit code is also coded with the driver’s individual
traffic record for referencing purposes.
89
i. Comments:
i. The whole process takes approximately 18 months.
ii. The actual milepost locations are accessed by the use of the roadway
inventory logbook sheets generated by TxDOT. The logbook shows the
mileposts of cross streets and important curb cuts (e.g., a fire station)
along a particular roadway.
iii. The mainframe information is updated when the coding process is
complete. In particular, the ARB uses a 13-month system to assess any
editing issues discovered through the data entry process and to address any
additional unforeseen delays.
iv. There is another form, known as the “blue form,” that may be submitted
directly to DPS by individuals who were in a crash that was not reported
by local law enforcement. A copy of the blue form is shown in
Figure B-3. Depending on the crash location, severity, and whether there
were any violations involved (i.e., hit-and-run violation), the local police
department may or may not record the crash in their own database. State
law puts the responsibility on the drivers involved to report the crash and
not the police department. Only crashes on public roadways must be
reported (e.g., parking lot crashes are not recorded) by motorists.
v. The information in the database has been used in the past to better plan
police officer route scheduling to ensure timely response to crash-prone
areas.

91
APPENDIX C
Crash Analysis Data

93
SUMMARY CRASH DATA FOR THE TEXAS AVENUE STUDY CORRIDOR
The following tables contain the summary of the data collected for the Texas Avenue study
corridor. Some clarifying notes for all of the tables are listed below.
1. The data for 2000 include only crashes through June.
2. (*) Indicates that the exact timeframe for the year in question started in July of that year
and ran through June of the following year. Consequently, 1998* actually stands for the
timeframe of July 1998 to June of 1999.
3. The Before category covers January 1993 through December of 1994.
4. The After category covers July 1998 through June of 2000.
5. The data for 1993-95 reflect the changes in July 1995, in which the state no longer
requires PDOs less the $1,000.
6. The Texas corridor category indicates the study area from roughly 0.2-miles north and
south of George Bush Drive along Texas Avenue and includes crashes along George
Bush Drive that are attributed to the signalized intersection.
7. Milepost 5.200 to MP 5.900 refers to the roadway section from approximately 500 feet
north of George Bush Drive to 300 feet south of University Drive along Texas Avenue.
8. % Change B-C indicates the change from the before period to the construction period.
9. % Change C-A indicates the change from the construction period to the after period.
10. % Change B-A indicates the change from the before period to the after period.

94
Table C-1. Total Crashes.
Time Period Texas Corridor
Intersection of Texas Avenue &
George Bush Drive
MP 5.200 to MP 5.900
Intersection of Texas Avenue & University Drive
Total 1,006 228 469 271
1993 220 42 98 57
1994 215 60 96 50
1995 125 40 54 25
1996 109 23 47 34
1997 116 22 62 31
1998 98 16 52 35
1999 87 20 43 25
2000 36 5 17 14
1998* 88 15 48 26
1999* 90 20 45 27
Before 435 102 194 107
Construction 264 50 127 85
After 178 35 93 53
%Change B-C -39.3 -51.0 -34.5 -20.6
%Change C-A -32.6 -30.0 -26.8 -37.6
%Change B-A -59.1 -65.7 -52.1 -50.5
p-value (B-A)1 <0.0001 <0.0001 <0.0001 <0.0001
See the other notes at the beginning of this appendix to clarify any of the abbreviations or other marks that are not defined here. 1A p-value of <0.05 indicates a statistical difference at the α=0.05 level of significance.
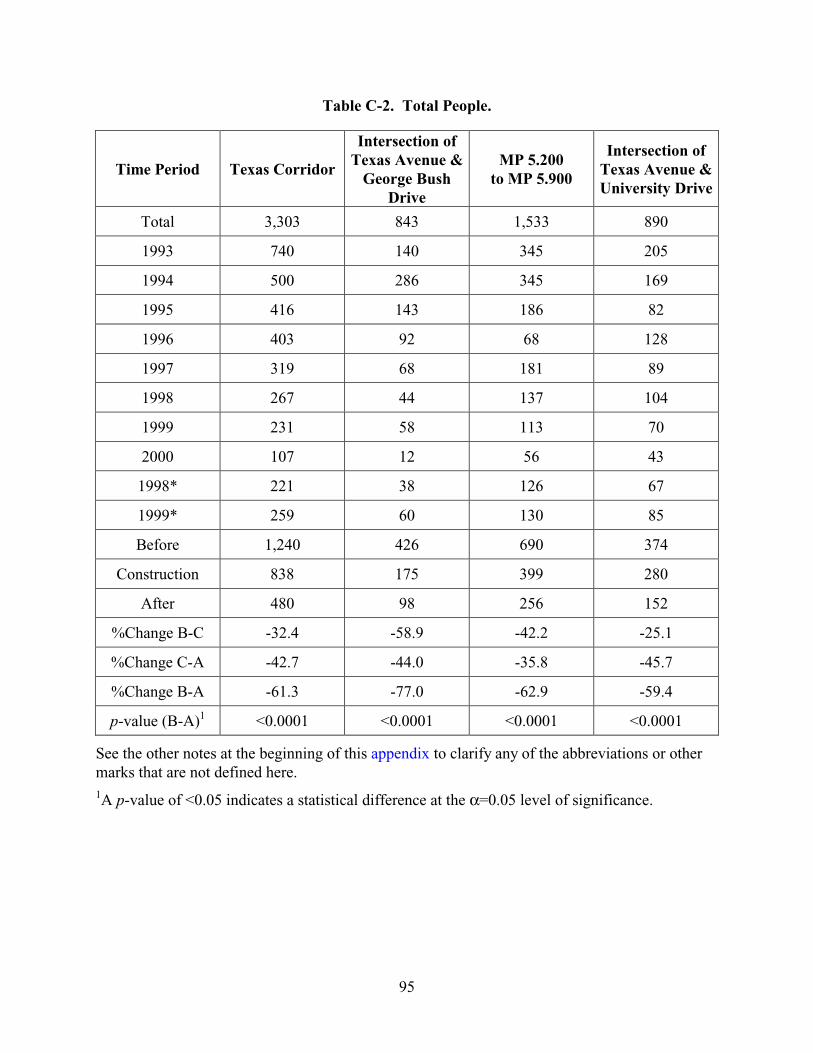
95
Table C-2. Total People.
Time Period Texas Corridor
Intersection of Texas Avenue &
George Bush Drive
MP 5.200 to MP 5.900
Intersection of Texas Avenue & University Drive
Total 3,303 843 1,533 890
1993 740 140 345 205
1994 500 286 345 169
1995 416 143 186 82
1996 403 92 68 128
1997 319 68 181 89
1998 267 44 137 104
1999 231 58 113 70
2000 107 12 56 43
1998* 221 38 126 67
1999* 259 60 130 85
Before 1,240 426 690 374
Construction 838 175 399 280
After 480 98 256 152
%Change B-C -32.4 -58.9 -42.2 -25.1
%Change C-A -42.7 -44.0 -35.8 -45.7
%Change B-A -61.3 -77.0 -62.9 -59.4
p-value (B-A)1 <0.0001 <0.0001 <0.0001 <0.0001
See the other notes at the beginning of this appendix to clarify any of the abbreviations or other marks that are not defined here. 1A p-value of <0.05 indicates a statistical difference at the α=0.05 level of significance.

96
Table C-3. Drivers.
Time Period Texas Corridor
Intersection of Texas Avenue &
George Bush Drive
MP 5.200 to MP 5.900
Intersection of Texas Avenue & University Drive
Total 2300 541 1097 636
1993 490 94 225 128
1994 500 145 229 111
1995 276 94 120 56
1996 261 57 115 85
1997 261 52 146 74
1998 232 40 121 92
1999 191 48 94 55
2000 89 11 47 35
1998* 194 35 110 58
1999* 210 49 107 66
Before 990 239 454 239
Construction 624 123 305 215
After 404 84 217 124
%Change B-C -37.0 -48.5 -32.8 -10.0
%Change C-A -35.3 -31.7 -28.9 -42.3
%Change B-A -59.2 -64.9 -52.2 -48.1
p-value (B-A)1 <0.0001 <0.0001 <0.0001 <0.0001
See the other notes at the beginning of this appendix to clarify any of the abbreviations or other marks that are not defined here. 1A p-value of <0.05 indicates a statistical difference at the α=0.05 level of significance.

97
Table C-4. Non-Drivers.
Time Period Texas Corridor
Intersection of Texas Avenue &
George Bush Drive
MP 5.200 to MP 5.900
Intersection of Texas Avenue & University Drive
Total 1003 302 436 254
1993 250 46 120 77
1994 320 141 116 58
1995 140 49 66 26
1996 142 35 55 43
1997 58 16 35 15
1998 35 4 16 12
1999 40 10 19 15
2000 18 1 9 8
1998* 27 3 16 9
1999* 49 11 23 19
Before 570 187 236 135
Construction 214 52 94 65
After 76 14 39 28
%Change B-C -62.5 -72.2 -60.2 -51.9
%Change C-A -64.5 -73.1 -58.5 -56.9
%Change B-A -86.7 -92.5 -83.5 -79.3
p-value (B-A)1 <0.0001 <0.0001 <0.0001 <0.0001
See the other notes at the beginning of this appendix to clarify any of the abbreviations or other marks that are not defined here. 1A p-value of <0.05 indicates a statistical difference at the α=0.05 level of significance.
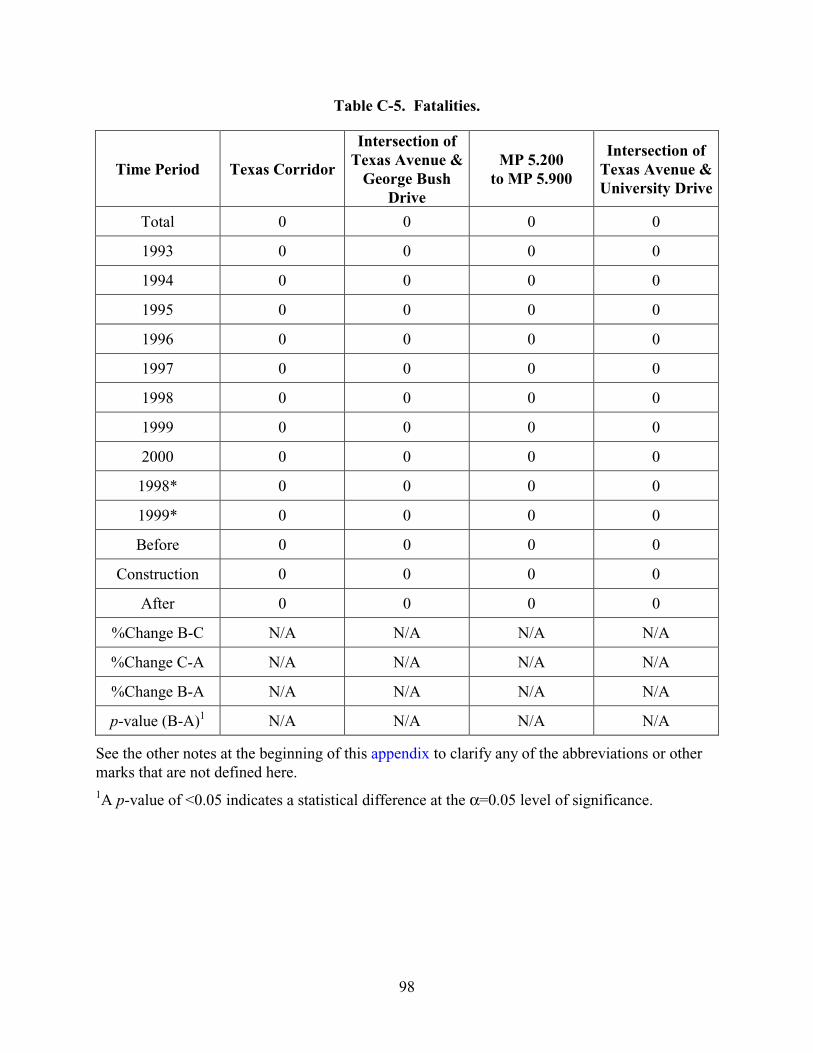
98
Table C-5. Fatalities.
Time Period Texas Corridor
Intersection of Texas Avenue &
George Bush Drive
MP 5.200 to MP 5.900
Intersection of Texas Avenue & University Drive
Total 0 0 0 0
1993 0 0 0 0
1994 0 0 0 0
1995 0 0 0 0
1996 0 0 0 0
1997 0 0 0 0
1998 0 0 0 0
1999 0 0 0 0
2000 0 0 0 0
1998* 0 0 0 0
1999* 0 0 0 0
Before 0 0 0 0
Construction 0 0 0 0
After 0 0 0 0
%Change B-C N/A N/A N/A N/A
%Change C-A N/A N/A N/A N/A
%Change B-A N/A N/A N/A N/A
p-value (B-A)1 N/A N/A N/A N/A
See the other notes at the beginning of this appendix to clarify any of the abbreviations or other marks that are not defined here. 1A p-value of <0.05 indicates a statistical difference at the α=0.05 level of significance.
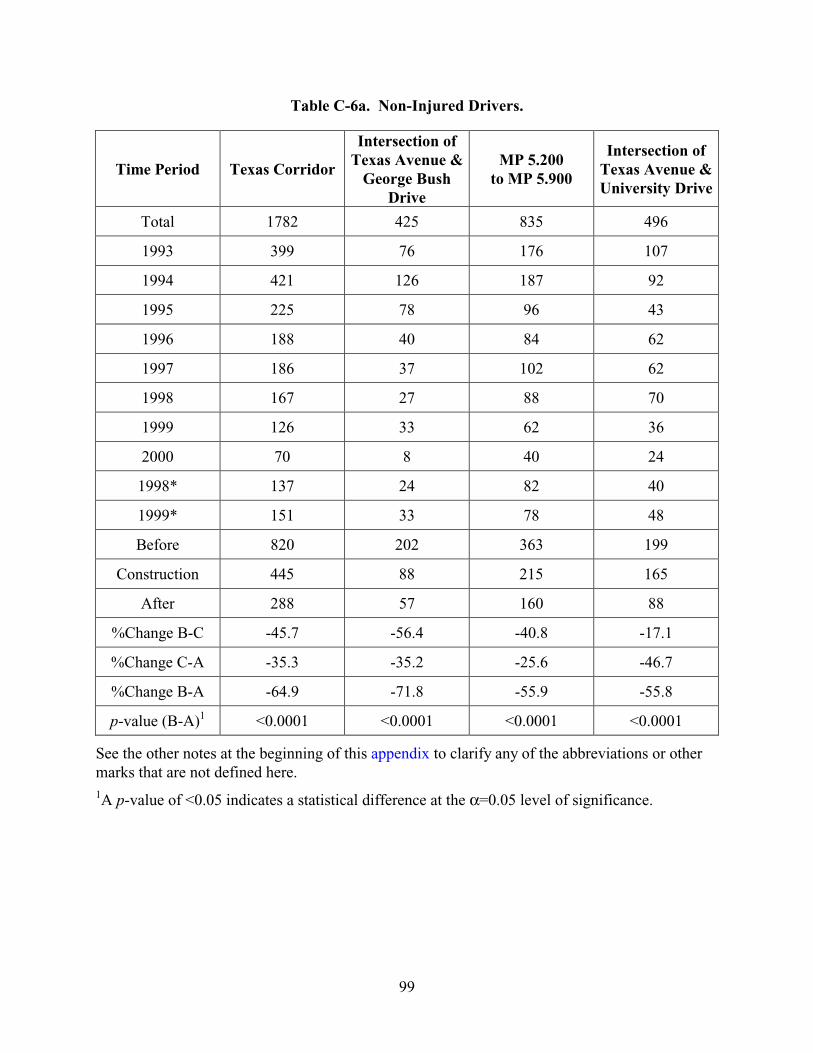
99
Table C-6a. Non-Injured Drivers.
Time Period Texas Corridor
Intersection of Texas Avenue &
George Bush Drive
MP 5.200 to MP 5.900
Intersection of Texas Avenue & University Drive
Total 1782 425 835 496
1993 399 76 176 107
1994 421 126 187 92
1995 225 78 96 43
1996 188 40 84 62
1997 186 37 102 62
1998 167 27 88 70
1999 126 33 62 36
2000 70 8 40 24
1998* 137 24 82 40
1999* 151 33 78 48
Before 820 202 363 199
Construction 445 88 215 165
After 288 57 160 88
%Change B-C -45.7 -56.4 -40.8 -17.1
%Change C-A -35.3 -35.2 -25.6 -46.7
%Change B-A -64.9 -71.8 -55.9 -55.8
p-value (B-A)1 <0.0001 <0.0001 <0.0001 <0.0001
See the other notes at the beginning of this appendix to clarify any of the abbreviations or other marks that are not defined here. 1A p-value of <0.05 indicates a statistical difference at the α=0.05 level of significance.

100
Table C-6b. Possibly Injured Drivers.
Time Period Texas Corridor
Intersection of Texas Avenue &
George Bush Drive
MP 5.200 to MP 5.900
Intersection of Texas Avenue & University Drive
Total 368 84 190 102
1993 69 16 34 19
1994 58 13 32 16
1995 37 11 19 9
1996 52 14 24 14
1997 49 6 30 10
1998 43 8 24 13
1999 48 14 23 14
2000 12 2 4 7
1998* 40 8 18 12
1999* 42 14 21 12
Before 127 29 66 35
Construction 121 22 66 33
After 82 22 39 24
%Change B-C -4.7 -24.1 0.0 -5.7
%Change C-A -32.2 0.0 -40.9 -27.3
%Change B-A -35.4 -24.1 -40.9 -31.4
p-value (B-A)1 <0.0016 0.3270 0.0086 0.1528
See the other notes at the beginning of this appendix to clarify any of the abbreviations or other marks that are not defined here. 1A p-value of <0.05 indicates a statistical difference at the α=0.05 level of significance.
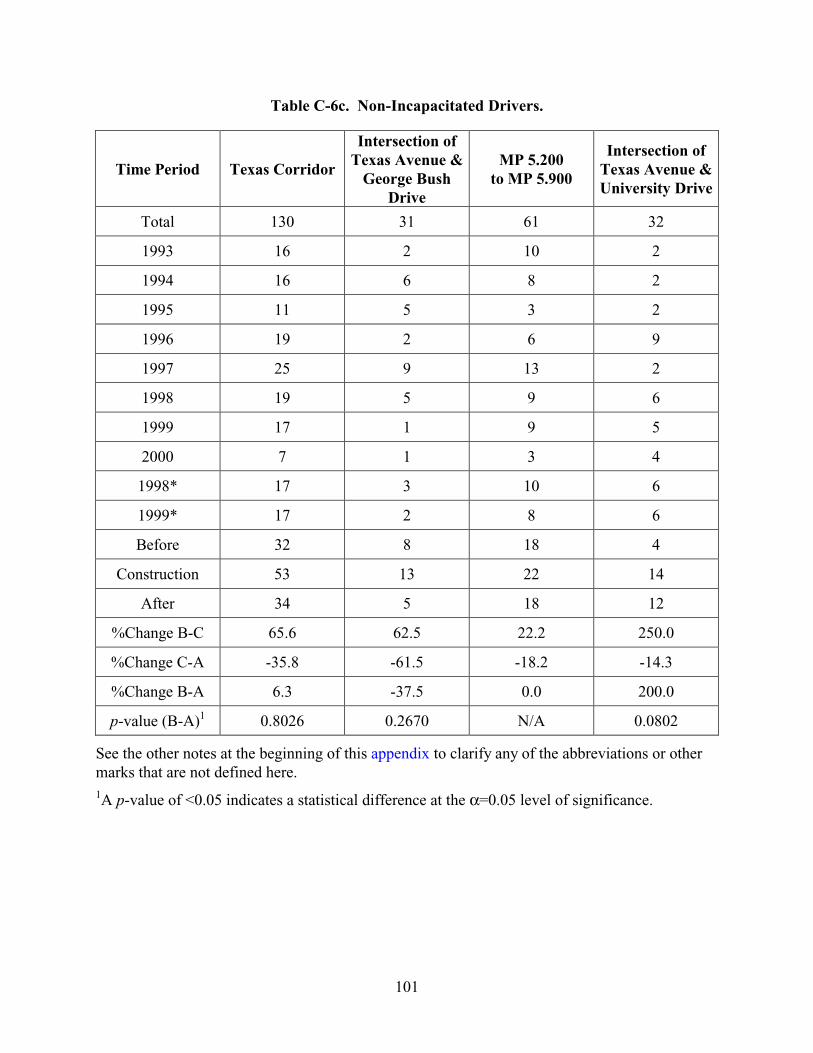
101
Table C-6c. Non-Incapacitated Drivers.
Time Period Texas Corridor
Intersection of Texas Avenue &
George Bush Drive
MP 5.200 to MP 5.900
Intersection of Texas Avenue & University Drive
Total 130 31 61 32
1993 16 2 10 2
1994 16 6 8 2
1995 11 5 3 2
1996 19 2 6 9
1997 25 9 13 2
1998 19 5 9 6
1999 17 1 9 5
2000 7 1 3 4
1998* 17 3 10 6
1999* 17 2 8 6
Before 32 8 18 4
Construction 53 13 22 14
After 34 5 18 12
%Change B-C 65.6 62.5 22.2 250.0
%Change C-A -35.8 -61.5 -18.2 -14.3
%Change B-A 6.3 -37.5 0.0 200.0
p-value (B-A)1 0.8026 0.2670 N/A 0.0802
See the other notes at the beginning of this appendix to clarify any of the abbreviations or other marks that are not defined here. 1A p-value of <0.05 indicates a statistical difference at the α=0.05 level of significance.
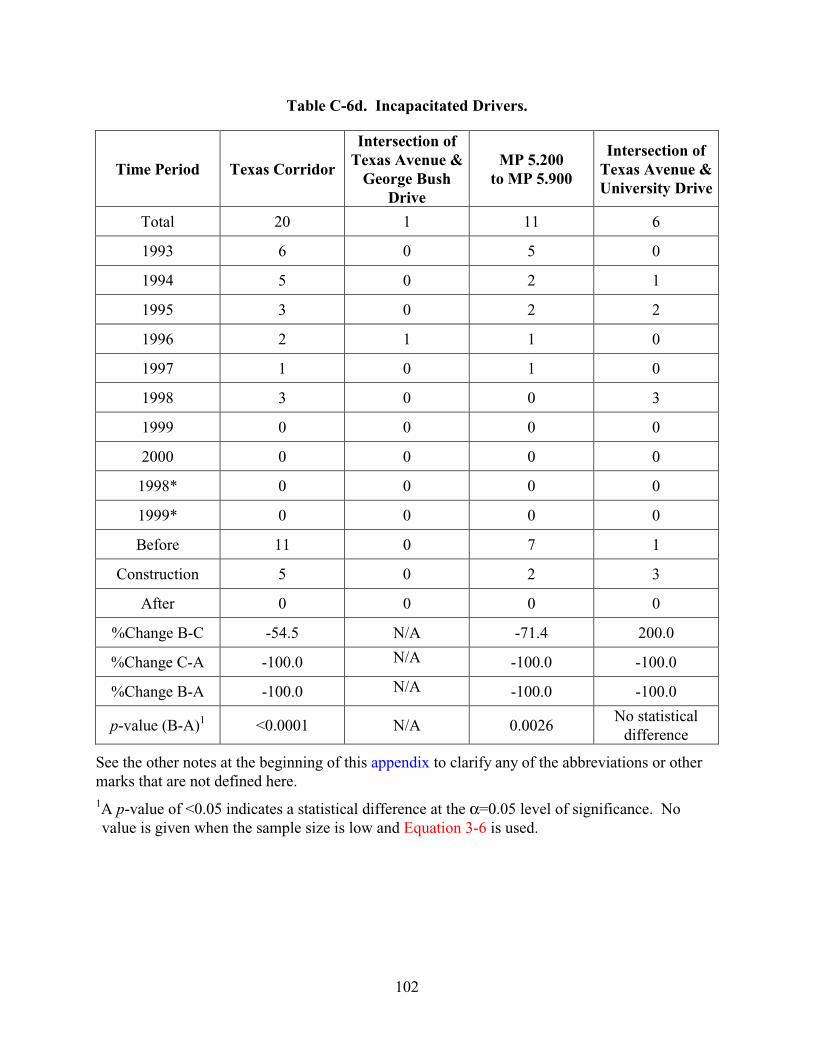
102
Table C-6d. Incapacitated Drivers.
Time Period Texas Corridor
Intersection of Texas Avenue &
George Bush Drive
MP 5.200 to MP 5.900
Intersection of Texas Avenue & University Drive
Total 20 1 11 6
1993 6 0 5 0
1994 5 0 2 1
1995 3 0 2 2
1996 2 1 1 0
1997 1 0 1 0
1998 3 0 0 3
1999 0 0 0 0
2000 0 0 0 0
1998* 0 0 0 0
1999* 0 0 0 0
Before 11 0 7 1
Construction 5 0 2 3
After 0 0 0 0
%Change B-C -54.5 N/A -71.4 200.0
%Change C-A -100.0 N/A -100.0 -100.0
%Change B-A -100.0 N/A -100.0 -100.0
p-value (B-A)1 <0.0001 N/A 0.0026 No statistical
difference
See the other notes at the beginning of this appendix to clarify any of the abbreviations or other marks that are not defined here. 1A p-value of <0.05 indicates a statistical difference at the α=0.05 level of significance. No value is given when the sample size is low and Equation 3-6 is used.
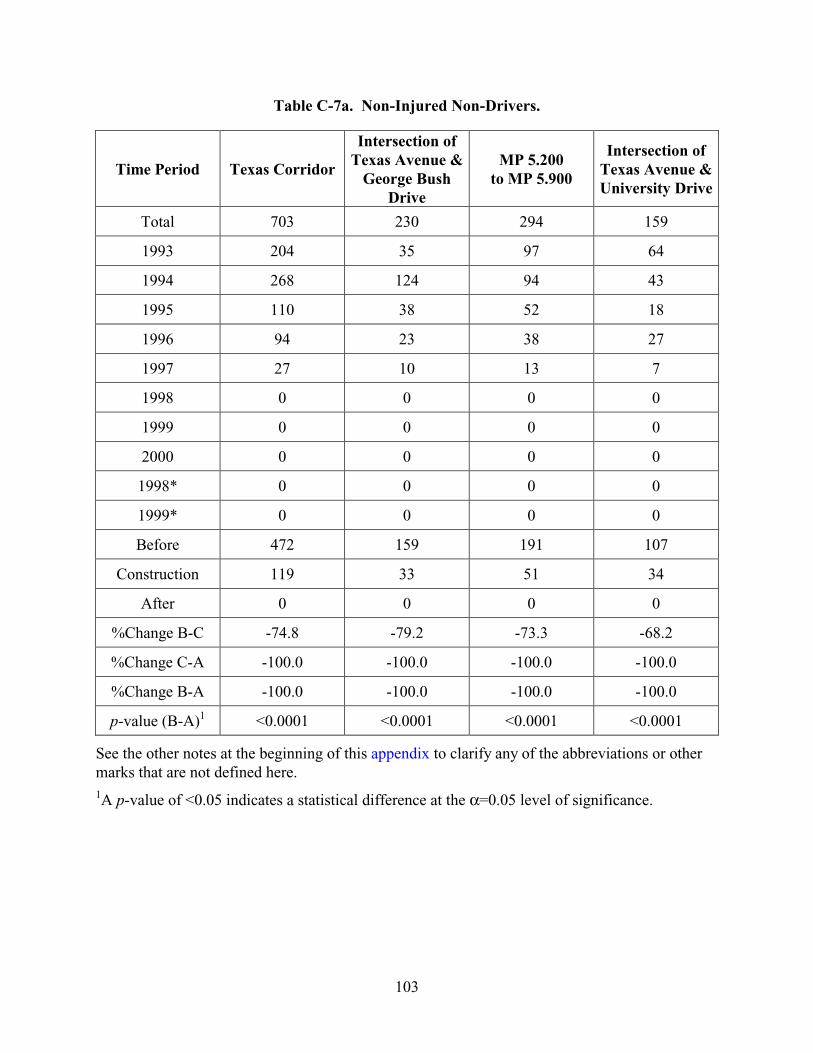
103
Table C-7a. Non-Injured Non-Drivers.
Time Period Texas Corridor
Intersection of Texas Avenue &
George Bush Drive
MP 5.200 to MP 5.900
Intersection of Texas Avenue & University Drive
Total 703 230 294 159
1993 204 35 97 64
1994 268 124 94 43
1995 110 38 52 18
1996 94 23 38 27
1997 27 10 13 7
1998 0 0 0 0
1999 0 0 0 0
2000 0 0 0 0
1998* 0 0 0 0
1999* 0 0 0 0
Before 472 159 191 107
Construction 119 33 51 34
After 0 0 0 0
%Change B-C -74.8 -79.2 -73.3 -68.2
%Change C-A -100.0 -100.0 -100.0 -100.0
%Change B-A -100.0 -100.0 -100.0 -100.0
p-value (B-A)1 <0.0001 <0.0001 <0.0001 <0.0001
See the other notes at the beginning of this appendix to clarify any of the abbreviations or other marks that are not defined here. 1A p-value of <0.05 indicates a statistical difference at the α=0.05 level of significance.
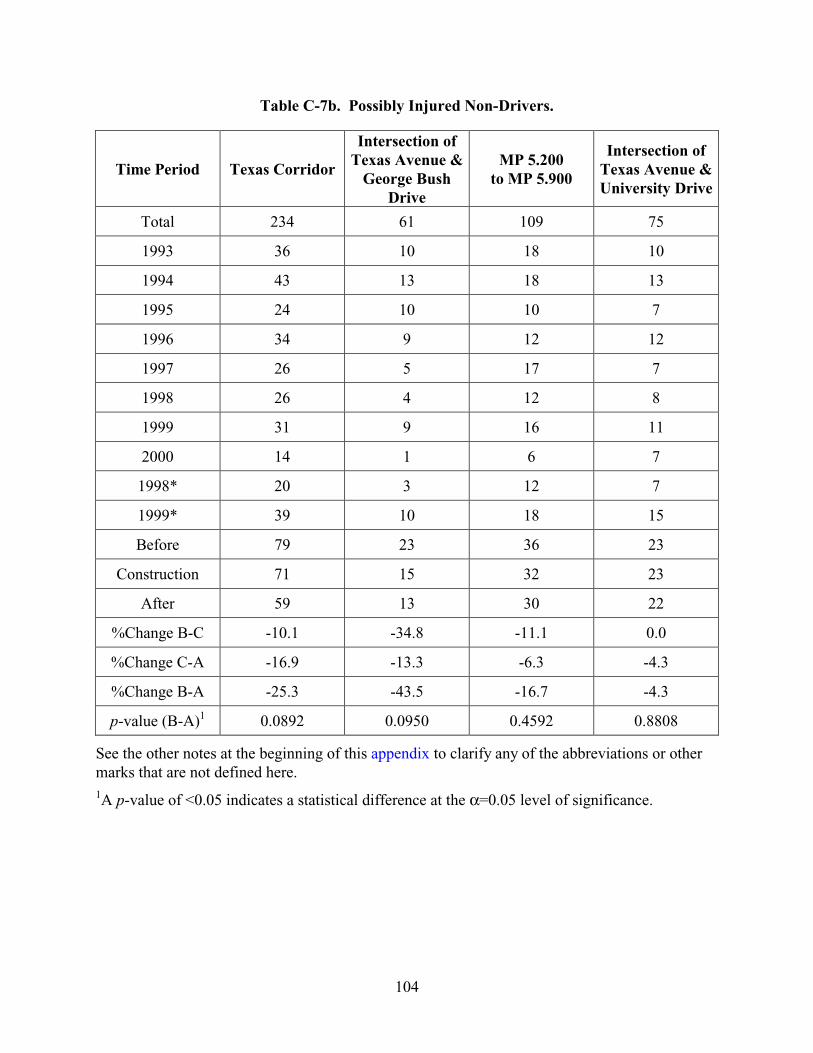
104
Table C-7b. Possibly Injured Non-Drivers.
Time Period Texas Corridor
Intersection of Texas Avenue &
George Bush Drive
MP 5.200 to MP 5.900
Intersection of Texas Avenue & University Drive
Total 234 61 109 75
1993 36 10 18 10
1994 43 13 18 13
1995 24 10 10 7
1996 34 9 12 12
1997 26 5 17 7
1998 26 4 12 8
1999 31 9 16 11
2000 14 1 6 7
1998* 20 3 12 7
1999* 39 10 18 15
Before 79 23 36 23
Construction 71 15 32 23
After 59 13 30 22
%Change B-C -10.1 -34.8 -11.1 0.0
%Change C-A -16.9 -13.3 -6.3 -4.3
%Change B-A -25.3 -43.5 -16.7 -4.3
p-value (B-A)1 0.0892 0.0950 0.4592 0.8808
See the other notes at the beginning of this appendix to clarify any of the abbreviations or other marks that are not defined here. 1A p-value of <0.05 indicates a statistical difference at the α=0.05 level of significance.
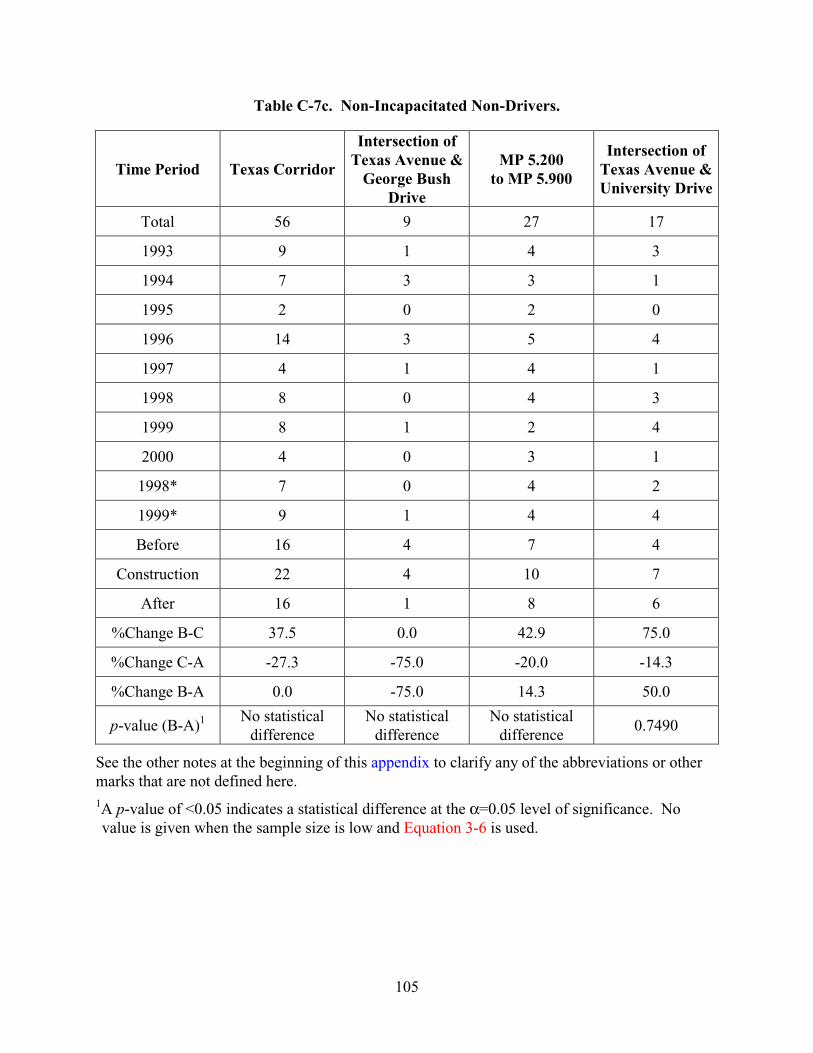
105
Table C-7c. Non-Incapacitated Non-Drivers.
Time Period Texas Corridor
Intersection of Texas Avenue &
George Bush Drive
MP 5.200 to MP 5.900
Intersection of Texas Avenue & University Drive
Total 56 9 27 17
1993 9 1 4 3
1994 7 3 3 1
1995 2 0 2 0
1996 14 3 5 4
1997 4 1 4 1
1998 8 0 4 3
1999 8 1 2 4
2000 4 0 3 1
1998* 7 0 4 2
1999* 9 1 4 4
Before 16 4 7 4
Construction 22 4 10 7
After 16 1 8 6
%Change B-C 37.5 0.0 42.9 75.0
%Change C-A -27.3 -75.0 -20.0 -14.3
%Change B-A 0.0 -75.0 14.3 50.0
p-value (B-A)1 No statistical difference
No statistical difference
No statistical difference
0.7490
See the other notes at the beginning of this appendix to clarify any of the abbreviations or other marks that are not defined here. 1A p-value of <0.05 indicates a statistical difference at the α=0.05 level of significance. No value is given when the sample size is low and Equation 3-6 is used.

106
Table C-7d. Incapacitated Non-Drivers.
Time Period Texas Corridor
Intersection of Texas Avenue &
George Bush Drive
MP 5.200 to MP 5.900
Intersection of Texas Avenue & University Drive
Total 10 2 6 3
1993 1 0 1 0
1994 2 1 1 1
1995 4 1 2 1
1996 0 0 0 0
1997 1 0 1 0
1998 1 0 0 1
1999 1 0 1 0
2000 0 0 0 0
1998* 0 0 0 0
1999* 1 0 1 0
Before 3 1 2 1
Construction 2 0 1 1
After 1 0 1 0
%Change B-C -33.3 -100.0 -50.0 0.0
%Change C-A -50.0 N/A 0.0 -100.0
%Change B-A -66.7 -100.0 -50.0 -100.0
p-value (B-A)1 No statistical difference
No statistical difference
No statistical difference
No statistical difference
See the other notes at the beginning of this appendix to clarify any of the abbreviations or other marks that are not defined here. 1A p-value of <0.05 indicates a statistical difference at the α=0.05 level of significance. No value is given when the sample size is low and Equation 3-6 is used.

107
Table C-8a. Rear-Ending Crashes.
Time Period Texas Corridor
Intersection of Texas Avenue &
George Bush Drive
MP 5.200 to MP 5.900
Intersection of Texas Avenue & University Drive
Total 631 181 315 198
1993 137 37 68 37
1994 145 49 70 39
1995 73 32 31 17
1996 64 18 28 25
1997 69 15 39 24
1998 60 11 34 25
1999 58 17 31 18
2000 25 2 14 13
1998* 55 10 32 19
1999* 58 15 33 22
Before 282 86 138 76
Construction 162 38 81 63
After 113 25 65 41
%Change B-C -42.6 -55.8 -41.3 -17.1
%Change C-A -30.2 -34.2 -19.8 -34.9
%Change B-A -59.9 -70.9 -52.9 -46.1
p-value (B-A)1 <0.0001 <0.0001 <0.0001 <0.0001
See the other notes at the beginning of this appendix to clarify any of the abbreviations or other marks that are not defined here. 1A p-value of <0.05 indicates a statistical difference at the α=0.05 level of significance.

108
Table C-8b. Sideswipe Crashes.
Time Period Texas Corridor
Intersection of Texas Avenue &
George Bush Drive
MP 5.200 to MP 5.900
Intersection of Texas Avenue & University Drive
Total 44 6 13 14
1993 17 1 1 8
1994 10 2 5 3
1995 5 2 1 0
1996 2 1 1 0
1997 1 0 0 0
1998 4 0 2 1
1999 5 0 3 2
2000 0 0 0 0
1998* 7 0 4 2
1999* 2 0 1 1
Before 27 3 6 11
Construction 3 1 1 0
After 9 0 5 3
%Change B-C -88.9 -66.7 -83.3 -100.0
%Change C-A 200.0 -100.0 400.0 N/A
%Change B-A -66.7 -100.0 -16.7 -72.7
p-value (B-A)1 0.0026 No statistical
difference 0.5286 0.0142
See the other notes at the beginning of this appendix to clarify any of the abbreviations or other marks that are not defined here. 1A p-value of <0.05 indicates a statistical difference at the α=0.05 level of significance. No value is given when the sample size is low and Equation 3-6 is used.
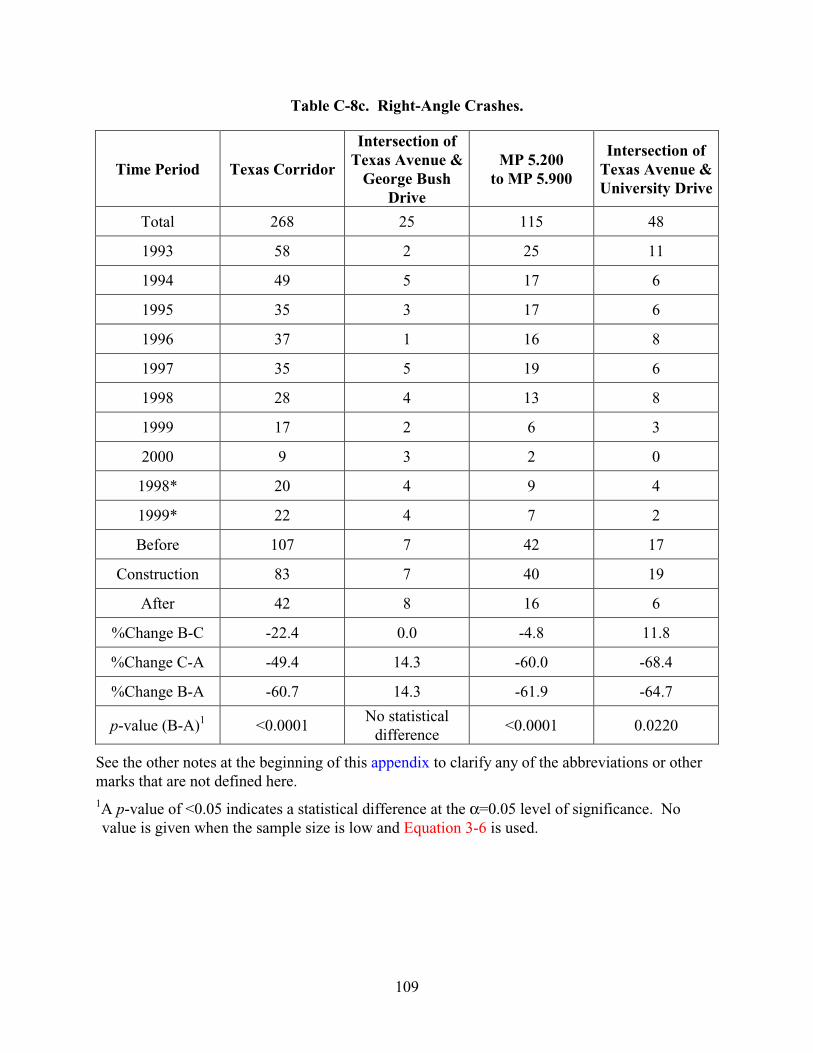
109
Table C-8c. Right-Angle Crashes.
Time Period Texas Corridor
Intersection of Texas Avenue &
George Bush Drive
MP 5.200 to MP 5.900
Intersection of Texas Avenue & University Drive
Total 268 25 115 48
1993 58 2 25 11
1994 49 5 17 6
1995 35 3 17 6
1996 37 1 16 8
1997 35 5 19 6
1998 28 4 13 8
1999 17 2 6 3
2000 9 3 2 0
1998* 20 4 9 4
1999* 22 4 7 2
Before 107 7 42 17
Construction 83 7 40 19
After 42 8 16 6
%Change B-C -22.4 0.0 -4.8 11.8
%Change C-A -49.4 14.3 -60.0 -68.4
%Change B-A -60.7 14.3 -61.9 -64.7
p-value (B-A)1 <0.0001 No statistical
difference <0.0001 0.0220
See the other notes at the beginning of this appendix to clarify any of the abbreviations or other marks that are not defined here. 1A p-value of <0.05 indicates a statistical difference at the α=0.05 level of significance. No value is given when the sample size is low and Equation 3-6 is used.
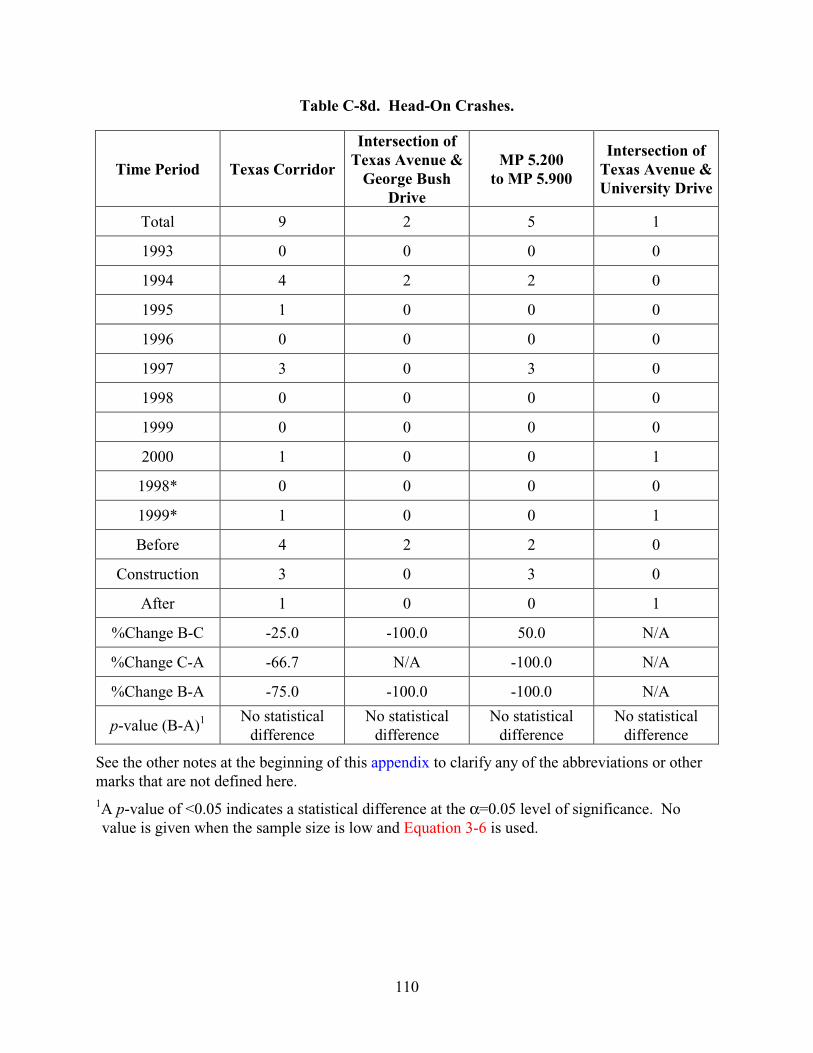
110
Table C-8d. Head-On Crashes.
Time Period Texas Corridor
Intersection of Texas Avenue &
George Bush Drive
MP 5.200 to MP 5.900
Intersection of Texas Avenue & University Drive
Total 9 2 5 1
1993 0 0 0 0
1994 4 2 2 0
1995 1 0 0 0
1996 0 0 0 0
1997 3 0 3 0
1998 0 0 0 0
1999 0 0 0 0
2000 1 0 0 1
1998* 0 0 0 0
1999* 1 0 0 1
Before 4 2 2 0
Construction 3 0 3 0
After 1 0 0 1
%Change B-C -25.0 -100.0 50.0 N/A
%Change C-A -66.7 N/A -100.0 N/A
%Change B-A -75.0 -100.0 -100.0 N/A
p-value (B-A)1 No statistical difference
No statistical difference
No statistical difference
No statistical difference
See the other notes at the beginning of this appendix to clarify any of the abbreviations or other marks that are not defined here. 1A p-value of <0.05 indicates a statistical difference at the α=0.05 level of significance. No value is given when the sample size is low and Equation 3-6 is used.

111
Table C-8e. Single-Vehicle Crashes.
Time Period Texas Corridor
Intersection of Texas Avenue &
George Bush Drive
MP 5.200 to MP 5.900
Intersection of Texas Avenue & University Drive
Total 42 12 17 7
1993 3 1 2 0
1994 4 2 1 1
1995 8 2 4 1
1996 6 3 2 1
1997 7 2 1 1
1998 6 1 3 1
1999 7 1 3 2
2000 1 0 1 0
1998* 6 1 3 1
1999* 7 1 4 1
Before 7 3 3 1
Construction 12 4 2 3
After 13 2 7 2
%Change B-C 71.4 33.3 -33.3 200.0
%Change C-A 8.3 -50.0 250.0 -33.3
%Change B-A 85.7 -33.3 133.3 100.0
p-value (B-A)1 0.2628 No statistical
difference 0.3422
No statistical difference
See the other notes at the beginning of this appendix to clarify any of the abbreviations or other marks that are not defined here. 1A p-value of <0.05 indicates a statistical difference at the α=0.05 level of significance. No value is given when the sample size is low and Equation 3-6 is used.
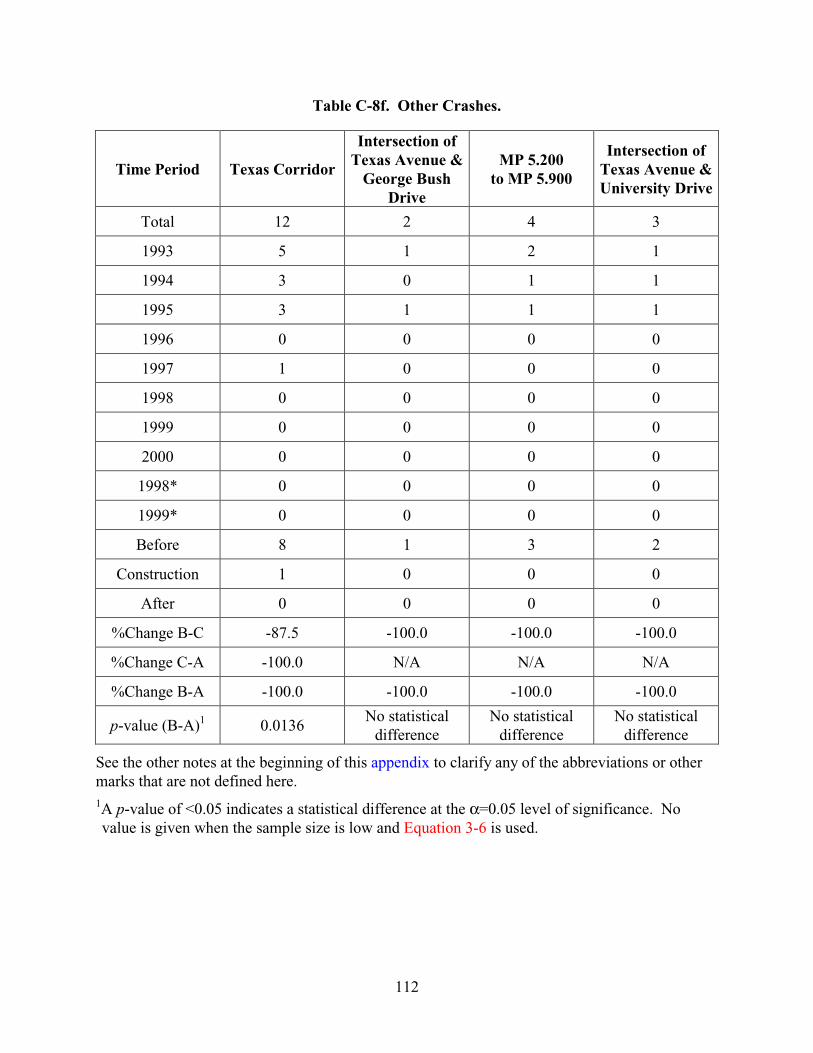
112
Table C-8f. Other Crashes.
Time Period Texas Corridor
Intersection of Texas Avenue &
George Bush Drive
MP 5.200 to MP 5.900
Intersection of Texas Avenue & University Drive
Total 12 2 4 3
1993 5 1 2 1
1994 3 0 1 1
1995 3 1 1 1
1996 0 0 0 0
1997 1 0 0 0
1998 0 0 0 0
1999 0 0 0 0
2000 0 0 0 0
1998* 0 0 0 0
1999* 0 0 0 0
Before 8 1 3 2
Construction 1 0 0 0
After 0 0 0 0
%Change B-C -87.5 -100.0 -100.0 -100.0
%Change C-A -100.0 N/A N/A N/A
%Change B-A -100.0 -100.0 -100.0 -100.0
p-value (B-A)1 0.0136 No statistical
difference No statistical
difference No statistical
difference
See the other notes at the beginning of this appendix to clarify any of the abbreviations or other marks that are not defined here. 1A p-value of <0.05 indicates a statistical difference at the α=0.05 level of significance. No value is given when the sample size is low and Equation 3-6 is used.

113
Table C-9. Injuries with Respect to Restraint Use for Drivers.
Time Period
Injury Category
Lap & Shoulder
Lap OnlyShoulder
Only Airbag None
Total 919 10 4 7 50
Non-injury 773 10 1 2 34
Possible 122 0 1 1 3
Non-Incapacitating
20 0 1 4 7
Before
Incapacitating 4 0 1 0 6
Total 351 0 0 35 18
Non-injury 263 0 0 13 12
Possible 69 0 0 10 3
Non-Incapacitating
19 0 0 12 3
After
Incapacitating 0 0 0 0 0
Non-injury <0.0001 0.0044 No
statistical difference
0.0098 <0.0001
Possible 0.0005 No
statistical difference
No statistical difference
0.0114 No statistical
difference
Non-Incapacitating
0.8728 No
statistical difference
No statistical difference
0.0802 0.0232
p-value1
Incapacitating No
statistical difference
No statistical difference
No statistical difference
No statistical difference
0.0514
See the other notes at the beginning of this appendix to clarify any of the abbreviations or other marks that are not defined here. 1A p-value of <0.05 indicates a statistical difference at the α=0.05 level of significance. No value is given when the sample size is low and Equation 3-6 is used.
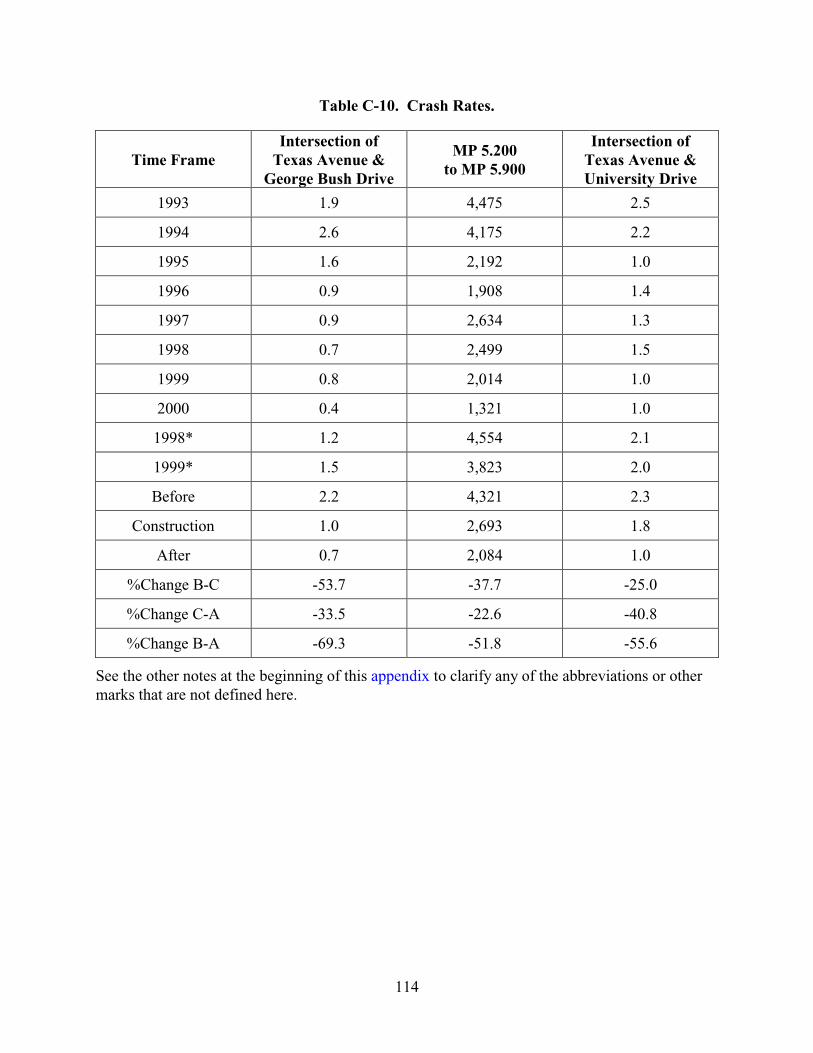
114
Table C-10. Crash Rates.
Time Frame Intersection of
Texas Avenue & George Bush Drive
MP 5.200 to MP 5.900
Intersection of Texas Avenue & University Drive
1993 1.9 4,475 2.5
1994 2.6 4,175 2.2
1995 1.6 2,192 1.0
1996 0.9 1,908 1.4
1997 0.9 2,634 1.3
1998 0.7 2,499 1.5
1999 0.8 2,014 1.0
2000 0.4 1,321 1.0
1998* 1.2 4,554 2.1
1999* 1.5 3,823 2.0
Before 2.2 4,321 2.3
Construction 1.0 2,693 1.8
After 0.7 2,084 1.0
%Change B-C -53.7 -37.7 -25.0
%Change C-A -33.5 -22.6 -40.8
%Change B-A -69.3 -51.8 -55.6
See the other notes at the beginning of this appendix to clarify any of the abbreviations or other marks that are not defined here.