Embed Size (px)
Citation preview

Water for Bio-Energy
(Technical Report by WG-BIO-ENERGY)
International Commission on Irrigation and Drainage


i
TABLE OF CONTENTS
ICID Technical Report on Bio-Energy and Water 1.0 Context and Background 1
1.1 Objective and scope 1 1.2 Country submissions 2
2.0 The Water-Bioenergy-Food Security Nexus 2 3.0 Biofuel Production the Global Picture 2
3.1 Bioethanol 2 3.2 Biodiesel 4 3.3 Land Area and Grain Used for Biofuel Feedstocks 5
4.0 Issues and Concerns 6 5.0 Impact Assessment 8 6.0 Identified Risks 8 7.0 Mitigation of Risks 9 8.0 Conclusions and Recommendation 10
8.1 Conclusions 10 8.2 Recommendations 10
References 11 Appendices 15 (Individual Country Submissions to the ICID Working Group on Water for Bio-energy and Food) Appendix A: Irrigated Oil Palm Production in Brazil for Bioenergy Uses: 17
Opportunities and Challenges (Brazil) 1.0 Opportunities and Risks 17
1.1 Palm Oil Uses 17 1.2 Palm Oil Market 17 1.3 Irrigated Oil Palm 18
Appendix B: Background study to review and assess known principles and 19 current information on biofuel production under irrigated conditions (Canada) Executive Summary 20 1.0 Introduction 21
1.1 Ethanol 21 1.2 Biodiesel 21
2.0 Biofuel Production: The Global Picture 22
2.1 Bioethanol 22 2.2 Biodiesel 24

ii
3.0 Biofuel Production: The Canadian Picture 24 4.0 Fuel Yields of Feedstock for Biofuel Production 28 5.0 Greenhouse Gas Emissions Reduction 29 6.0 Water Use for Biofuel Production 32 7.0 Land Area and Grain Used for Biofuel Feedstocks 35 8.0 Land Use Change Due to Biofuel Expansion 35 9.0 Summary of Canadian Biofuel Feedstocks 37
9.1 Corn 37 9.2 Wheat 38 9.3 Canola 39 9.4 Lignocellulosic Feedstocks 39
9.4.1 Agricultural Residues 40 9.4.2 Switchgrass 40 9.4.3 Wood 41
10.0 Economics of Biofuel Production 41 11.0 Uncertainties in Predicting Future Biofuel Demands 42 12.0 Recommendations for Biofuel Opportunities in Canada under Irrigation 44 13.0 Research and Technology Transfer Needs for Sustainable Biofuel Production 44 under Irrigation References 45 Annexes Annex 1: Biofuel blending targets and mandates (IEA 2011) 50 Annex 2: Ethanol production plants in Canada 51 Annex 3: Life cycle analysis of crops for biofuels 53 Annex 4: Locations of operational and proposed ethanol and biodiesel plants in Canada 54 Appendix C: Biofuel development in China and its potential impacts (China) 56 1.0 Background 56 2.0 Laws and policies for biofuel development in china 57 3.0 Biofuel production in China 58
3.1 Fuel ethanol 58 3.2 Biodiesel 60 3.3 Economics 60
3.3.1 Price 60 3.3.2 Tax 61 3.3.3 Subsidy 61 3.3.4 Development Plans 61 3.3.5 Issues and concerns 61 4.0 Impact assessment 62
4.1 Domestic agriculture and land resources 62 4.2 Global trade 62 4.3 Variability among regions and socio-economic settings 62 4.4 Water consumption and security 62 4.5 Risks 62 4.6 Lack of technology 62 4.7 Lack of adequate land resources 62 4.8 Threat for other industries 63 4.9 Competition between cereal and non-cereal crops over water 63

iii
5.0 Mitigation of Risks and Policy Recommendations 63
5.1 Industry regulation and management 63 5.2 Technological research and promotion 63 5.3 Incentives for the supply chain 63 5.4 Enhancement in resource and technology adaptation 63
References 63 Appendix D: Biofuels situation in India – Input to ICID TF Position Paper on Biofuels (India) 65 Abstract 1.0 Context & Background 65
1.1 Particularities of the Water, Bio-energy and Food Security Nexus 66 2.0 Bio-energy Production 66
2.1 Argument between Edible & Non-Edible Sources of Bio-diesel: 66 2.2 Indian Scenario 67 2.3 Bioethanol & Biodiesel Production in India 67 2.4 Demand for Bio-diesel Production 68 2.5 Indian Biodiesel Policy Promotion 68
3.0 Issues and Concerns 69
3.1 Food Security 69 3.2 Water Scarcity 69 3.3 Land & Ecological Degradation 69 3.4 Inequity in Development 69 3.5 Impact Assessment 70
4.0 Identified Risks 71
4.1 Food security concerns 71 4.2 Water quality concerns 71 4.3 Lack of public policies & logistic framework 71 4.4 Lack of good scientific and analytical assessment of the risks 71 and the opportunities of different kinds of technologies and development choices 4.5 Lack of research 72
5.0 Mitigation of Risks 72
5.1 Alternative feedstocks for ethanol production 72
6.0 Recommendations 73
6.1 Policies for responding to rising bioenergy demand 73 6.2 Mitigation of Negative Impacts of Biofuels 73
References 74
Appendix E: The Scope of Production and Use of Biofuels in Nepal (Nepal) 75 Abstract 1.0 Background 76 2.0 Objective 77 3.0 Methodology 77 4.0 General Scenario of Land Use 79

iv
5.0 Nepal has potential for Jatropha Production 79 6.0 The Controversy and the Future of a Biofuels Program 79 7.0 Consumption Trends of Commercial Energy Options 80 8.0 Cost and Returns from Jatropha Cultivation 80 9.0 Recommendations on Policy Measures 82 10.0 Concluding Remarks 82 References 83 Appendix F: Biofuels situation in South Africa – Input to ICID TF Position Paper on Biofuels (South Africa) 85 Abstract 1.0 Context and Background 86 2.0 Particularities of water, bio-energy and food security nexus 86 3.0 Bio-energy Production 87 4.0 Issues and concerns 87 5.0 Impact assessment 88 6.0 Identified Risks 90
6.1 Natural capital 90 6.2 Human Capital 91 6.3 Social capital 91 6.4 Physical capital 91 6.5 Financial capital 92
7.0 Mitigation of Risks 92 8.0 Recommendation 93 References

1
ICID Technical Report on Bio-energy and Water
Laurie Tollefson1 and John Harrington2
1.0 Context and Background Global concern about fossil fuel prices and availability, a renewed quest by many countries for energy independence and a widespread concern about reducing greenhouse gas emissions have been the main reasons that both developed and developing nations have looked for alternate energy sources (Tardieu and Schultz 2008). Bioenergy3 offers many new opportunities, but if not managed correctly can create risks. Biofuels are transportation or heating fuels derived from biological sources such as grains, sugar crops, starch, cellulosic materials and organic waste. There are two types of biofuels: Bioethanol and biodiesel (de Fraiture et al. 2008). Currently 85% of total global biofuel production is ethanol. Escalating fuel prices and the quest to reduce GHG emissions have triggered interest in the development of biofuels with often positive consequences on agricultural prices at the farm gate. Modern bioenergy represents a new source of demand for farmer’s products with the promise of creation of income and employment. This results in more land and resources being devoted to produce these energy crops. It provides an opportunity for some farmers to escape the poverty trap, but that may happen at the expense of food security and environmental integrity. This calls into question the ethics of diverting land, water and crops into energy crops (UNCTAD 2009). Simultaneously producing food, feed, fibre and fuel could potentially lead to environmental degradation and over exploitation of water resources. Since the main focus of ICID is on agricultural water management and increasing food production to make the world free of hunger, so the concentration of the study by WG-Bioenergy was on biofuels only. Keeping the above in view, ICID with the support of its selected national committees brought forward this technical paper with the objectives and scope given below.
1.1 Objective and scope Biofuels production and use have both positive and negative environmental and socio economic consequences, including those pertaining to water and land. Due to bio-crop production, water which is already a scarce resource in many parts of the world, will come under further stress creating competitive demand with water for food production. The expansion and intensification of bioenergy production could add to existing pressures on land and water management. Therefore, water resources management and adequate policies and strategies are needed to help in ensuring sustainability and balancing different types of use in the short and long term.
Scope This technical paper presents the views from the ICID community regarding bio-energy production and its impacts on food security. Efforts have been made to address the following questions in this paper:
What is the nexus between bio-energy, water, and food production (food security)?
How is the production and use of bioenergy products likely to influence the future state of water resources?
What are the impacts on agriculture water availability and use?
What are the data and tools required for making comprehensive impact assessments?
What are the capacity development needs for making better decisions?
How can Irrigation Authorities prepare themselves where such policy decisions are taken by national governments?
How can society mitigate negative impacts of bio-energy production?
1 Vice President Hon., ICID, Canadian National Committee, ICID (CANCID), E-mail: [email protected] 2 Agronomist, Canada Saskatchewan Irrigation Diversification Centre (E-mail : [email protected]) 3 In this report ‘Biofuel’ is used in the context of bioenergy

2
1.2 Country submissions
Submissions were solicited from ICID member nations regarding the status, policy positions, and issues relating to irrigation water use for production of biofuel feedstock. Reports were received from Brazil, Canada, China, India, Nepal, and South Africa. Overall, biofuel development is seen as benefiting the environment, as a rural development opportunity, as providing some measure of energy security, and as having varying degrees of risk to domestic food security. In general, the country submissions recognize the need to preserve resources for food production with biofuel production targeted for degraded, abandoned, or marginal cropland under rainfed conditions.
Individual country submissions are contained in Appendices A through F.
This technical paper summarizes background information and context. It is based on the existing works and state of knowledge. The new knowledge should be revised on this evolving subject as additional information is available.
2.0 The Water-Bioenergy-Food Security Nexus Water, energy and food are essential for human well-being, poverty reduction and sustainable development. Global projections indicate that demand for freshwater, energy and food will increase significantly over the next decades under the pressure of population growth and mobility, economic development, international trade, urbanization, changing diets, climate change, etc. (Hoff 2011). Agriculture is currently the largest user of water at the global level, accounting for more than 70% of total withdrawal while energy consumption in food production and the supply chain accounts for about 30% only. Energy is needed to produce, transport and distribute food as well as to pump, extract, lift, transport and treat water. Recognition of the water- energy- food nexus is an attempt to balance different uses of ecosystem resources (energy, land, water, soil, and socioeconomic factors). There clearly are interactions between water, food and energy that result in synergies or tradeoffs between groups. The advent of liquid biofuels as a source of fuel for transport added a new and complex dimension to the inter-relation between water-energy-land and therefore sustainability of food production. Under adverse socio-economic and natural resource scenarios the subsidized treatment for the growth of biofuels to gain greater security for energy for transport is at the cost of water for food. Growing bioenergy crops in an irrigated agriculture scheme may improve the energy supply but it may also result in increased water withdrawals and risks to food security. The critical link of bio-fuels with water security is ultimately whether growing crops for fuel competes for limited land and water with growing food for human consumption. Thus it is important to understand the synergies and the tradeoffs to ensure the sustainability of the environment. The nexus concept views water-energy-food as complex and intertwined. This leads to more cost effective and integrated policy making approaches. It promotes dialogue between the various sectors (FAO 2014).
3.0 Biofuel Production the Global Picture The growth of bioethanol and biodiesel production worldwide is illustrated in Figure 1. Although small in the context of total energy demand it is significant in relation to current levels of agricultural production. Rapid increase in biofuel production began in 2000 and continued through 2010 (Figure 1). Global ethanol production was 86 billion litres in 2010, an 18% increase over 2009. Biodiesel production rose to 19 billion litres, a 12% increase over 2009 (Shrank and Farahmand, 2011). In 2012, global production fell for the first time since 2000, down 0.4% from 2011 (Figure 1). Global ethanol production declined to 83.1 billion litres while biodiesel production rose to 22.5 billion litres (Prugh, 2014). Biodiesel now accounts for more than 20% of biofuel production. 3.1 Bioethanol
The United States and Brazil remained the two largest producers of bioethanol in 2010 with 49 and 28 billion litres respectively (Table 1). Ethanol production in the United States accounts for more than half of the world total and production has more than tripled over the last five years from 18 billion litres in 2005 to 51 billion litres in 2011. After several years as a net importer of ethanol, the United States became a net exporter in 2010, exporting a record 1.3 billion litres of fuel ethanol overseas, mainly to

3
Canada, Jamaica, the Netherlands, the United Arab Emirates, and Brazil (Ren21 2011). The United States has 204 ethanol plants in 29 states, almost all of which use corn as a feedstock (RFA 2012). The long-standing U.S. system of subsidy and import tariff protection for local producers of bioethanol expired on December 31, 2011. Possible medium term implications are a drop in domestic corn demand for ethanol production and increased imports of cheaper biofuel to meet the U.S. mandate.
Table 1: Ethanol production and major feedstock by country
Country
Ethanol Production
(millions of litres) Feedstock crop
(proportion of total) 2010*
2011
Estimate
2020
Projected a
United States1 49 210 51,100 63 960 Corn (100%)
Brazil2 28 000 32,500 50 395 Sugarcane (100%)
China3 2128 2217 7930 Corn (80%)
Wheat and rice (20%)
India4 1435 1934 2205 Sugarcane molasses (100%)
Canada5 1200 1351 to 18005a 2360 Corn (75%)
Wheat (24%)
Germany6 1042 1100 n/a Wheat and rye (major)
Barley, maize and triticale (minor)
France7 805-1150
(2009) NA n/a
Sugar beet (major)
Wheat, maize (minor)
Thailand8 426 528 2,111 Sugar molasses (80%)
Tapioca (20%)
Columbia9 302 (2009) NA 587 Sugarcane (100%)
Australia10 203 (2009) NA 492
Waste wheat starch (50%)
Sugarcane (18%)
Sorghum (27%)
World11 85 800 88 70012 154 962
* unless specified a OECD/FAO 2011; 1. Urbanchuk 2011; 2. Barros 2010 and REN21 2011; 3. Scott and Junyang
2011 4. Aradhey 2011; 5. Dessureault 2011; 5a: KD Communications 2011; 6. Licht 2012; 7. Henard 2010 and Biofuels Platform 2010; 8. Preechajarn and Prasertsri 2011; 9. Pinzon 2009; 10. Darby 2010. 11. Ren21 2011. 12. GRFA 2011.

4
Brazil’s ethanol production increased more than 7% in 2010 and accounted for nearly one-third of the global total. Brazil was the world’s leading ethanol exporter but continued to lose international market share to the United States, particularly in its traditional markets in Europe. Adverse weather conditions hampered global harvesting of sugarcane, pushing up prices and making subsidized U.S. corn-based ethanol cheaper in international markets (Ren21 2011). In 2011, Brazil had 441 bioethanol refineries and between 40 and 50% of light vehicle fuel was consumed as bioethanol (Barros 2010). The flex-fuel car, developed in 2003, allows consumers to freely choose between gasoline and hydrated ethanol (E100) and gas stations offer both blended gasoline (a mixture of 75% gasoline and 25 % ethanol) and 100% ethanol (Barros 2010). China produced 2 billion litres of bioethanol in 2010 and remained Asia’s largest ethanol producer, followed by India and Thailand. China’s five ethanol plants use grain (corn and wheat) and tuber (cassava) for ethanol production. Due to rising food prices in China, the government stopped approval of new fuel ethanol plants and fell short of reaching its production target in the 2005-2010 period (Scott and Junyang 2011). Over the past few years, China has been actively experimenting with non-grain feedstock such as cassava and sweet sorghum for ethanol production. Reportedly, for the ongoing five-year plan (2011-2015), the government has set a target for non-fossil energy consumption at 11.4%, an increase of 3.1% from 2010. Compared with other renewable energy sources, biofuel is expected to play a minor part in China’s diversified energy policy because of lack of sustainable supply of feedstock and appropriate technology (Scott and Junyang 2011). Production of ethanol in India, all from sugarcane, reached a high in 2007 at 2.4 billion litres, dropped to 1.1 billion litres in 2009 and has gradually been recovering to a forecast of 2.1 billion litres in 2012 (Aradhey 2011). The Indian government mandated the use of 5% ethanol (E5) blend in petrol in some states and territories in 2003 and expanded the plan to the entire country in 2008. The target is somewhat successful in years of surplus sugar production, and unfilled when sugar production declines (Aradhey 2011). There is limited scope to bringing additional area under water intensive sugarcane cultivation so alternate crops for ethanol production such as sweet sorghum, sugar beets or sweet potatoes are under experimentation. Ethanol production in Thailand increased from 426 million litres 2010 to 528 million litres in 2011, and to an estimated 580 million litres in 2012. An additional five new ethanol plants, all using tapioca as feedstock, were planned to be added to the 19 existing plants (Preechajarn and Prasertsri 2011). Thailand’s ethanol exports were estimated to have increased from 49 million litres in 2010 to 70 million litres in 2011. The proportion of tapioca vs sugar molasses used as feedstock varies somewhat between years depending on their relative price. In 2009, the European Union (EU) mandated a 10% minimum target for renewable energy to be consumed in transport by 2020. E.U. bioethanol production surged by more than 30% in 2010. France and Germany remained the largest European ethanol producers using wheat, rye and sugar beet as the major feedstock. Africa represents a small share of world ethanol production but saw continued rapid growth in production during 2010. World ethanol prices increased by more than 30% in 2010 in the context of a new commodity price spike of ethanol feedstocks, mainly sugar and maize, and firm energy prices. This situation contrasts with 2007/08 where ethanol price movements did not follow commodity price increases and ethanol profit margins were lower (OECD-FAO 2011).
3.2 Biodiesel The European Union generated 53% of the world’s biodiesel in 2010 with rapeseed as the major feedstock (Table 2). Germany was the world’s largest biodiesel producer with 2.9 billion litres. Brazil was the second largest producer with 2.45 billion litres, a 50% increase over 2009. All was for domestic consumption. Argentina close to Brazil at 2.1 billion litres was projected to increase biodiesel production to 3 billion litres by 2012 due to large investments in the sector (Joseph 2011). Both countries rely heavily on soybean for biodiesel feedstock. An increasing share of the E.U. supply of biodiesel is being imported (primarily produced from soy or palm oil) as tax incentives decline but biofuel mandates remain in effect. Also, the growing capacity of

5
European harbours, often connected to inland waterways, facilitates the import of relatively cheap international biofuels and feedstock. A large amount of recent biodiesel production growth (e.g. in Argentina and Indonesia) can be linked to exports to the E.U. (Lamers 2011). Recent analysis by the Environmental Protection Agency shows that biodiesel and renewable diesel produced from palm oil do not meet the minimum 20% lifecycle GHG reduction threshold needed to qualify as renewable fuel under the Renewable Fuel Standard (RFS) program in the United States (EPA 2011b). This may have an impact on global trade in biodiesel. World biodiesel prices increased in 2010 in a context of rising prices for rapeseed and other vegetable oils and of high crude oil prices although this price increase is smaller than for ethanol (OECD-FAO 2011). 3.3 Land Area and Grain Used for Biofuel Feedstocks
The International Energy Agency estimates that 30 million hectares or 2% of the world’s total arable area is used for biofuel feedstock production (IEA 2011) (Table 2). The same report anticipates that by 2050 the proportion will rise to 6% of the arable area. In Brazil, almost half of the sugar cane grown is used for ethanol although this is a very small proportion (1-2%) of total agricultural land. In Germany, it is estimated that 16% of the arable land is used to produce all biofuels. The USDA (2012) estimates that over 40% of the area used for corn in the U.S. is directed into ethanol production. This represents about 3% of total farm land.
Table 2: Estimates of crop volume and of cropped area used for biofuel feedstock
Country Crop Amount used
for ethanol
(Million tonnes)
Year Area (% total or
crop land area)
(Million hectares)
Reference
World All 2006
2011(e)
2050(f)
14 (1% of total arable)
30 (2% of total arable)
100 (6% of total arable)
IEA 2011
3% world’s grain supply
2010 REN21 2011
Brazil Sugarcane 296 2009 4.0 (47% of sugarcane) Barros 2010; FAO Stat 2009, 2010.
318 2010 4.3 (48% of sugarcane)
E. U. Cereals 9 2010 Flach et al. 2010
Sugar beet 10 2010 0.24 Flach et al. 2010
Rapeseed 17 2009-2011 4-5 (60-75% of total rapeseed)
Knight 2010;
USDA 2011b; Flach et al. 2010
Wheat 2008 0.5 Flach et al. 2010
Wheat 2013 (f) 1.5 Flach et al. 2010
Germany All crops 2010 (16% total arable) Lyddon 2011
U.S. Corn 117 2010 12.2 (31% of total corn) Urbanchuk 2011
Corn 127 2011(e) 13.8 (40% of total corn) USDA 2011a, 2012
Canada Corn 2.1 2009 0.23 (21% of total corn) Dessureault 2011
2.3 2010 0.26 (26% of total corn) Dessureault 2011
2.6 2011(e) 0.26 (26% of total corn) Dessureault 2011
Wheat .65-.71 2010 (e) 0.26-0.28 (3% of total wheat)
Dessureault 2011
f=forecast; e=estimate

6
4.0 Issues and Concerns
Future Bioenergy production will focus on intensified biomass production. This will put pressure on the existing natural resources and may exacerbate an already alarming situation in many parts of the world unless it is undertaken with a clear understanding and assessment of its various impacts. The main issues that need to be considered are:
Food Security: Food insecurity exists when people lack access to sufficient amounts of safe and nutritious food for growth and a healthy active lifestyle. FAO estimates that 850 million people worldwide are malnourished (FAO 2006). Agricultural feedstock dominates the production of liquid biofuels. As a result the biofuel and agricultural product markets are strongly entangled. All crops compete for inputs, land, fertilizers and water (OECD, 2006). Given the potential scale of the biofuel market, the uncertainty related to long term price developments and the large number of poor households, the question of the impact that expanding biofuel production will have on food security will be key.
Inequity in development: Although higher prices for agricultural commodities constitute an immediate threat to food security for the poor consumers worldwide, but in the longer term it can be an opportunity for agricultural development. This is realized only when the agricultural sector has the capacity to respond to the price incentives and poor farmers are able to participate in the supply response (FAO 2008).
Biodiversity: Biofuel production can impact biodiversity in positive ways but many of the impacts can also be negative. For example, wild life biodiversity can be threatened by loss of habitat when corn production is expanded. In addition many of the current biofuels are well suited to tropical areas. This encourages land use conversion from natural ecosystems into feedstock production causing a loss of biodiversity. Intensive culture of a single species can lead to a loss of genetic diversity.
Land Degradation: Biofuel production can put strain on local hydrological systems through land use changes and ecosystem degradation (such as deforestation). Land use changes can have a significant impact on soil but this impact is dependent on the farming practices used. Inappropriate practice can reduce soil organic matter and increase soil erosion. Conversely with current management practice soil can be improved with increased biofuel production. Growing perennials such as palm, sugar cane, or switchgrass as opposed to annuals can improve soil quality. Fresco (2007) notes that creating a market for agricultural residues can cause concerns unless managed correctly.
Water Quality: Biofuel crop production can also affect water quality. Conversion of forest land and pasture to maize for example may cause soil erosion, sedimentation and excess nutrient runoff into the surface and groundwater. Runge and Senauer (2007) conclude that continuously cropped corn for ethanol production replacing a corn soybean rotation will aggravate the N runoff problem. Moreira (2007) notes that where sugar cane is produced in Brazil water pollution associated with fertilizer and agrochemicals, soil erosion, sugar cane washing etc. are cause of concern. Hill et al. (2006) note that corn has the highest application rate of fertilizer and pesticide per hectare and that soybean, which requires a fraction of the N, P, and pesticides that are used on corn, has a much lower impact on water quality.
Water Quantity: Water scarcity is already a problem in many parts of the world. Water use has been growing globally at more than twice the rate of population increase in the last century, and an increasing number of regions are reaching the limit at which reliable water services can be delivered. About 70% of the freshwater withdrawn is used for agricultural production and may prove to be a key limiting factor to biofuel production. Approximately 1.2 billion people live in river basins with absolute water scarcity, where water resource development has exceeded sustainable limits (Molden et al. 2007). Contamination of water supplies by agricultural, municipal and industrial effluents further limits water consumption. Climate change is also projected to have a significant impact on water availability. It is generally agreed that climate variability and the frequency of extreme weather events will increase even in the near term in all regions.
The implications of increasing biofuel production on water supply must be considered. Currently biofuels account for about 1% of all water transpired and 2% of all irrigation water withdrawals (De Fraiture et al. 2008). Many crops currently used for biofuels such as sugar cane, oil palm and maize

7
have high water requirements and are best suited to high rainfall areas unless they can be irrigated. A large-scale expansion of energy crop production will likely change evapotranspiration appropriation for energy depending on the previous land use. In some countries this could lead to further deterioration of an already stressed water situation (Berndes 2002). India and China have already utilized most of their available natural water resources for agriculture and expansion into large scale irrigated biofuel crop production is unlikely using current crops and technologies. In contrast, Sub-Saharan Africa and Latin America have enormous potential for irrigation expansion (Muller et al. 2008). De fraiture et al. 2008 estimated that 2.0 % of total irrigation water used worldwide is currently devoted to biofuel crops. If 20% of liquid transport needs are to be met by biofuels, this would rise to 5%. It should be noted that processing of feedstocks into biofuels can use large quantities of water mainly for washing plants and seeds and for evaporative cooling.
Only 1% of the sugarcane crop in Brazil (approximately 40,000 ha) is irrigated and the proportion that is used for ethanol production is uncertain (Laclau 2009). According to Aquastat, (FAO 2003) the major feedstock crops in Germany and France (wheat, sugar beet and rapeseed) are not irrigated. It is possible that some of the maize, used as a minor feedstock in France, is irrigated but it is difficult to determine how much. In Canada, corn, wheat and canola used for biofuel production are not presently irrigated (Hussain et al. 2011; B. Beres personal communication)4. In India, sugarcane is mostly grown under full control irrigation and a litre of ethanol produced from this sugarcane requires 3,500 liters of irrigation water (de Fraiture and Berndes 2009).
In the United States about 15% of the corn crop is irrigated. The U.S. National Research Council (2008), warned that corn ethanol production increases may significantly impact water quality and availability. Predictions of future water use to grow biofuel crops in the United States are causing concern. Total domestic freshwater consumption, driven mainly by population growth, is expected to increase by nearly 7% between 2005 and 2030. Water consumed for energy production is expected to increase by nearly 70%, and water consumed for biofuel (biodiesel and ethanol) production is expected to increase by almost 250% (Elcock 2010). It has been estimated that in Nebraska USA, it requires 415 litres of water to produce one lire of ethanol. The impact does not stop when the crop is harvested since significant amounts are required to process the crop. Feedstock processing requires as much as 10 litres of water per litre of biofuel produced, and is small relative to crop needs. However, processing plants located near urban areas will often compete with cities for scarce and expensive water (de Fraiture and Berndes 2009). For example, a typical biofuel facility might produce 100 million gallons of ethanol a year and use as much water as a town of 5000
4 Brian Beres, Cereal Agronomist, Agriculture and Agri-Food Canada, Lethbridge, Alberta, Canada
Case Study: Regional Differences in Water Consumption for Corn Ethanol Production
A study of the water used for irrigation and during processing to produce ethanol from corn in the United States (Chiu et al. 2009) calculated embodied water in ethanol (EWe). EWe is defined as the sum of water used to irrigate corn for feedstock production (WIR) plus process water consumed within biorefineries (WP), divided by total ethanol production within each state. EWe is presented in liters of water per liter of ethanol. Naturally occurring, direct precipitation to corn fields was not included in WIR to isolate purely anthropogenic water consumption induced by corn ethanol production. Each state’s total consumptive water use (TCW) was defined as the sum of WIR + WP attributable to its bioethanol production.
EWe varied widely between states from 5 to 2138 L per liter of ethanol depending on regional irrigation practices. As a general trend, the EWe increased from east to west and from the Midwest to the southwest regions of the U.S. The TCW of South Dakota, Nebraska, Wyoming, Colorado, Kansas, Oklahoma, New Mexico, and Texas, which cover the Ogallala aquifer, amounted to 2.4 trillion liters in 2007, of which 68% was supplied from groundwater. In 2008, the TCW in these states was 4.5 trillion liters or about 18% of the estimated annual depletion rate of the entire Ogallala aquifer in 2000 (Chiu et al 2009). This indicates that continued use of irrigated corn to produce ethanol in these states may have significant impact on the largest fossil water reservoir in the U.S.

8
people (Service 2009). Although that amount of water isn’t significant on a national scale, it could strain local resources in some regions.
Research into crops with low water requirements is ongoing. For example, Jatropha was promoted in India as water efficient and suitable for arid and semiarid regions. However, although Jatropha persisted on arid and infertile soil, oil yields were too low under such marginal growing conditions, to make it a viable source of biodiesel (World Bank 2010). Irrigation increases yields but defeats the purpose of finding a drought resistant feedstock. In addition, irrigation made Jatropha more susceptible to pests. Cellulosic feedstock such as switchgrass and woody perennials also have low water requirements although they too grow better with irrigation and fertilization. Water requirements are a particular concern for maize and sugar cane. Many sugar producing regions of Africa and Brazil are already operating near the hydrological limitations of their river basins.
5.0 Impact Assessment Impacts of bio-energy production depend on the state of the resource base that is drawn upon. Impact assessments should form the basis for decision-making. Given the complexity of the inter-linkages between water, bioenergy production, food production, land degradation and ecological impacts, an assessment framework is critical. This will allow operators and policy makers to evaluate positive and negative effects of bioenergy development on water resources, problems with Macro-level analysis, spatial and temporal context and addressing uncertainties. The assessment framework must take into account the water intensity of proposed activities, the state of water resources, and impacts at a specific location. Life cycle analysis is the analytical tool used to calculate greenhouse gas balances. This is the result of comparing all emissions of greenhouse gases throughout the production phases and use of a biofuel and all the greenhouse gases emitted in producing and using the equivalent energy amount of the respective fossil fuel (http://www.greenfacts.org/en/index.htm). Most life cycle analyses to date have been done on cereal and oilseeds in the EU and the USA and sugar cane in Brazil. A limited amount of work has been done on vegetable oil, palm oil, cassava, jatropha, etc. Given the wide range of biofuels, feedstocks and conversion technologies we expect a wide range of emission reductions which has been shown to be the case. It has clearly been shown that second generation biofuels, although still in limited production, offer much higher emission reduction potential.
6.0 Identified Risks Bio-energy production with its positive as well as negative effects has to be evaluated in terms of the net benefits by decreasing the risks, i.e. the probability of a negative consequence. These socio-economic and environmental risks are:
(a) Food security concerns: Due to rising demand for biofuels, farmers worldwide have an increased economic incentive to grow crops for biofuel production instead of staple food production. Without political intervention, this can lead to reduced food production and increased food prices. The impacts would be greater on the poor countries or those that rely on imported food for their subsistence. An increase in biofuel demand will lead to sustained higher food prices and adversely affect poor consumers in developing and emerging countries.
(b) Water quality concerns: Bioenergy systems can influence the quality of water nearby and over long distances, with resulting consequences for biodiversity and human needs. Impacts on water quality need to be considered at the project level (point source) and watershed level (non-point source and/or cumulative effects). Biofuel production requires additional land and water resources. Biofuel production can put a strain on local hydrological systems through land use changes and ecosystem degradation such as deforestation. Producing more biofuel crops will affect water quality. Converting pastures or woodlands to maize, for example, may exacerbate soil erosion, sedimentation, and excess nutrient runoff to surface waters. Many sugar producing regions of Africa and Brazil are already operating near the hydrological limitations of their river basins. Water pollution associated with biofuel production and transformation procedures through use of fertilizers, agrochemicals, soil erosion, sugar washing are major concerns in Brazil. Biofuel crops vary in agrochemical requirements, with maize being an example of a high input crop.

9
(c) Limitations on science and available tools: Research is required to better understand both the potential and the concerns with the biofuel industry covering such areas as biofuel feedstock, water requirements, processing, GHG emissions, production on marginal land, and second generation biofuel production.
(d) Lack of public policy: The use of liquid biofuel for transport has been promoted through a series of policies that provide incentives and support for their production and use. These policies have been driven by national and domestic agendas. The driver has often been the support of farmers and rural communities. Incentives have also been based on assumptions about the positive contributions of biofuels to energy security and climate change mitigation that are increasingly being questioned. The unintended consequences, particularly in terms of market and food security, have been frequently overlooked. It is recognized that a more consistent approach toward biofuel is needed based on a better understanding of their implications, which are now emerging (FAO 2008). Policies must grasp the opportunity offered by biofuels but at the same time manage the risks that are present. Biofuel developments are shaped by several policy domains including agriculture, energy, transport, environment and trade, often without proper coordination.
(e) Lack of scientific and analytical assessment: Assessment of the risks and opportunities of different technologies and development choices is lacking. The contribution of different biofuels in reducing fossil fuel consumption varies widely when the fossil energy used as an input to production is taken into account. The fossil energy balance of a biofuel depends on such factors as feedstock characteristics, production location, agricultural practice and the source of energy used for the conversion process. Biofuels also vary in terms of their contribution to reducing greenhouse gas emissions (http://www.greenfacts.org/en/index.htm). Despite the potential benefits that some scientific studies have shown, different biofuels vary widely in their greenhouse gas balances when compared to petroleum. Depending on methods used to produce the feedstock and process the fuel, some crops can generate more greenhouse gases than do fossil fuels. There is a strong and immediate need for harmonized protocol and criteria for life cycle analyses, estimating greenhouse gas balances and evaluating environmental sustainability.
(f) Lack of regulatory framework: A limited land resource means that if bioenergy production expands in many countries without clear regulation then food production will decline and more food will have to be imported due to loss of arable land. Thus, biofuel production should be regulated and carefully promoted keeping in view all related factors such as food security, environmental impacts, greenhouse gases emission, etc.
7.0 Mitigation of Risks There are ways to avoid or mitigate the negative impacts of, and in some circumstances improve, the effects of biofuel production on the water situation. These are:
(a) To think hydrologically: Simplistic approaches lead to perverse outcomes and unintended consequences. A holistic approach with a long-term perspective is required.
(b) To base decisions on impact assessments to enable sustainable water management.
(c) To use appropriate water resources management tools to make sustainable bioenergy development possible.
(d) To develop and make available not only the appropriate tools, but also the skills and datasets to support them.
(e) To design and implement effective water-related policy instruments to help avoid long-term adverse consequences while maximizing potential benefits. These can directly and indirectly influence how bioenergy production affects water availability and water quality.
(f) To design coherent bioenergy-related water policy instruments. These need to be designed to be consistent with policies in related sectors and with existing water policy instruments, including those concerned with irrigation and other agricultural practices, and with industrial water use. Expanded use of biofuels will depend on decisions governments make. The path countries choose will ultimately determine the costs and benefits that biofuels will bring to both domestically and globally. Countries pursue different objectives when engaging in pro biofuel

10
policies. These depend on the social, economic, environmental and energy situations of the country in question. The implications of a biofuel policy put in place by a country may be global and trade-offs that are acceptable for one country may not be to another.
(g) To establish and support appropriate institutions and processes to intensify dialogue on the topic and on capacity building.
(h) To conduct further research, fill data gaps, and develop regionalized tools for technological innovation. This includes development of second generation biofuels based on cellulosic feedstock. Moving toward second generation biofuels based on lingo-cellulosic feedstock may significantly change the potential for development of biofuel and may expand it. Technology developments in improved processing, etc. will have an impact on the biofuel industry.
8.0 Conclusions and Recommendation 8.1 Conclusions The present world population of about 7.3 billion is estimated to grow to about 9.1 billion by 2050. Currently 1.2 billion people live in water scarce areas. In order to meet the growing food requirement for increased population agricultural production must be increased by approximately 70 percent globally and by 100 percent in developing countries by 2050. Accordingly present global water demand is projected to increase by 55% with increased competition among various sectors and a reduced share for agriculture. To meet the future global food demand by 2050, irrigation withdrawals may have to increase by 20% (de fraiture, 2007) with the growing population energy requirement also rapidly increasing and energy security is becoming one of the great challenges in view of limited availability of fossil fuel. Many countries view biofuels as an alternative renewal resource and a way out of petroleum based energy security troubles. Diversion of arable land and water for biofuels production is one of the major concerns as it will add pressure on land and water resources that are already stressed and may also impact food security. However, it is not the availability of land but of water that determines the limit of biofuel expansion in a region. The expansion of the biofuels industry is taking place in regions that have encountered an increased energy demand but not necessarily in the regions that are most suited to sustain the feedstocks. It is believed that biofuels have an important role to play in meeting the world`s energy needs but it should not be at the cost of food security. In the case where increased biofuel usage would leave more people denied of their daily food and water requirement, it may lead to deforestration or to international conflict and in such cases both the short and long term costs outweigh the benefits. Thus it is essential to take a balanced and holistic approach to identify and mitigate the risks and concerns for the sustainable management of food, water and energy security issues. We encourage countries that have the resources to invest in improving biofuels and pushing towards breakthroughs in water efficient biofuels – or the resources to encourage other countries to do the same – to take full advantage of this opportunity. 8.2 Recommendations In order to encourage production and use of bio-fuels in a sustainable manner the following recommendations are made:
(a) Due to the complex nature of the linkages between biofuels and food security occurring at different geographic levels, (local, national, regional, global) and temporal scales, it is essential to adopt integrated evidence based and environmentally sound approaches for biofuel policy – making and investments.
(b) Biofuel production will compete with food crops for scarce land and water resources. If all national policies and plans to increase biofuel production are implemented it is estimated that an additional 30 million ha of land will be required with an increase in irrigation water withdrawals. Since impacts for some countries who have initiated programs to boost biofuel production could be significant, it is necessary to study and analyze the impact of increased biofuel production on food and water security. For example, India and China, who are large producers and consumers of agricultural commodities, already face severe water limitations.

11
(c) Biofuels rely on many of the same policy shortcomings that impede agriculture as a route to poverty reduction. Policy requirements at a country level are required rather than on a global basis. A country by country analysis of the potential impacts of biofuels on land and water resources is required.
(d) Political intervention is often required to ensure that reduced food production and increased food prices do not occur in association with biofuel production. This is often more acute with poorer countries.
(e) Biofuel crops can reduce poverty in emerging and least developed countries where land and water resources are not under stress through increased employment and economic growth. Further studies are required to determine whether these opportunities really do improve the conditions for poor farmers.
(f) Some countries face water and land limitations while others have sufficient capacity provided improvements occur. Global policies should focus on supporting biofuel production in land and water abundant regions that are currently not involved in biofuel production.
(g) Careful impact assessment (environmental and social) should form the basis of decision making for biofuel production. Life cycle analysis is an important analytical tool. More work is required on a number of potential biofuels.
(h) There is a need for focussed attention in the following areas:
(i). A continued and enhanced research into cellulosic conversion processes is required to encourage movement toward second generation biofuels based on ligno-cellulosic feedstock.
(ii). Encouraging first generation biofuel producers to seek increasingly water efficient biofuels including better use of better irrigation methods to increase their profits since expansion will come from smarter use rather than more use of precious land and water resources.
(iii). Enabling the policy environment to encourage public-private partnerships to develop infrastructure for the purpose of efficiently irrigating biofuel feedstock including the re-use of water which may be even more successful with biofuel crops than with typical agriculture.
References
Aradhey, A. 2011. India Biofuels Annual. USDA Foreign Agricultural Service. Global Agricultural Information Network. GAIN Report Number IN1159.
Barros, Sergio. 2010. Brazil Biofuels Annual. USDA Foreign Agricultural Service. Global Agricultural Information Network. GAIN Report Number BR10006.
Beres, B.L. Randhawa, H., Eudes, F., Goyal, A., Graf, R.J. et al. 2010. A Pan-Canadian Ethanol Feedstock Study to Benchmark the Relative Performance of Triticale. AAFC Conference Poster.
Berndes, G. 2002. Bioenergy and water - the implications of large-scale bioenergy production for water use and supply. Global Environmental Change 12 : 253–271.
Biofuels Platform. 2010. Available at http://www.biofuels-platform.ch/en/infos/euk-bioethanol.php
Chui, Y-W., Walseth, B. and Wonsuh, S. 2009. Water Embodied in Bioethanol in the United States. Environ. Sci. Technol. 2009, 43, 2688–2692.
Darby, M. 2010. Australia Biofuels Annual. USDA Foreign Agricultural Service. Global Agricultural Information Network.
De Fraiture, C., Giordano, M. and Liao, Y. 2008. Biofuels and implications for agricultural water uses: blue impacts of green energy. Water Policy 10(S1), 67–81.
De Fraiture, C. and Berndes, G. 2009. Biofuels and water. Pages 139-153 in R.W. Howarth and S. Bringezu (eds.) Biofuels: Environmental Consequences and Interactions with Changing Land Use. Proceedings of the Scientific Committee on Problems of the Environment (SCOPE) International Biofuels Project Rapid Assessment, 22-25 September 2008, Gummersbach Germany. Cornell University, Ithaca NY, USA. Available at http://cip.cornell.edu/biofuels/
Dessureault, D. 2011. Canada Biofuels Annual. USDA Foreign Agricultural Service. Global Agricultural Information Network. GAIN Report Number CA11036.
Elcock, D. 2010. Future U.S. Water Consumption: The Role of Energy Production. Journal of the American Water Resources Association (JAWRA) 46(3):447-460. DOI: 10.1111/j.1752-1688.2009.00413x.

12
Environmental Protection Agency (EPA) 2011b. EPA Issues Notice of Data Availability Concerning Renewable Fuels Produced from Palm Oil Under the RFS Program. Office of Transportation and Air Quality. EPA-420-F-11-046. December 2011.
Food and Agriculture Organization of the United Nations (FAO). 2003. Agriculture, Food and Water. pp. 1-57.
Food and Agriculture Organization of the United Nations (FAO). 2006. The State of Food and Agriculture: Food aid for food security? pp. 3 – 9.
Food and Agriculture Organization of the United Nations (FAO). 2008. The State of Food and Agriculture. Biofuels, prospects, risks and opportunities. pp. 3-90.
Food and Agriculture Organization of the United Nations (FAO). 2014. The Water Energy Food Nexus. A new approach in support of food security and sustainability. pp 4-19.
Food and Agriculture Organization of the United Nations Statistics Division (FAOSTAT). 2009. Statistical databases. Available at http://faostat.fao.org/
Food and Agriculture Organization of the United Nations Statistics Division (FAOSTAT). 2010. Statistical databases. Available at http://faostat.fao.org/
Flach, B., Lieberz, S., Bendz, D. Dahlbacka, B. and Achilles, D. 2010. E.U. Biofuels Annual. USDA Foreign Agricultural Service. Global Agricultural Information Network. GAIN Report Number NL0019.
Fresco, L.O. 2007. Biomass, food and sustainability: is there a dilemma? 2006 Duisenberg Lecture, International Monetary Fund Annual Meeting, Singapore.
Hoff, H. 2011. Understanding the nexus. Background paper for the Bonn 2011 Conference: The water energy and food security nexus. Stockholm, Sweden: Stockholm Environment Institute.
Global Renewable Fuels Alliance. 2011. Press Release February 2011.
Guerrero, M. 2011. Spain Biofuels Annual. USDA Foreign Agricultural Service. Global Agricultural Information Network. GAIN Report Number SP1123.
Henard, M-C. 2010. France Biofuels Annual. USDA Foreign Agricultural Service. Global Agricultural Information Network. GAIN Report Number FR9042.
Hill et.al 2006. Environmental. Economic and energetic costs and benefits of biodiesel and ethanol biofuels. In PNAS. vol. 103, no.30, pp.11206-11209.
Hussain, M.M., Dincer, I. and Reddy, B.V. 2011. A comparative life cycle assessment of bio- and conventional fuels in a Canadian province. Intl J. Energy research 35:795-804 DOI: 10.1002/er.1742.
International Energy Agency (IEA). 2011. Technology Roadmap. Biofuels for Transport. IEA/OECD Available at http://www.iea.org/publications/freepublications/publication/technology-roadmap-biofuels-for-transport.html
Joseph, K. 2011. Argentina Biofuels Annual. USDA Foreign Agricultural Service. Global Agricultural Information Network. GAIN Report Number – no number.
KD Communications. 2011. What are the Effects of Biofuels and Bioproducts on the Environment, Crop and Food Prices and World Hunger? Grain Farmers of Ontario. Available at http://www.greenfuels.org/en/resource-centre.aspx
Knight, B. 2010. Biofuels: Their impact on crop production worldwide. Aspects of Applied Biology 101, 2010.
LaClau, J-P. 2009. Growth of the whole root system for a plant crop of sugarcane under rainfed and irrigated environments in Brazil. Field Crops Research 114:351-360.
Lamers, P. 2011. International biodiesel markets. Development in production and trade. German Union for the Promotion of Oils and Protein Plants (UFOP). Berlin, Germany.
Licht, F. 2012. FO Licht’s World Ethanol and Biofuels Report, Volume 10. Issue 15.
Lyddon, C. 2011. Focus on Germany. E.U.’s second largest grain producer features strong organic market and growing biofuels industry. World-grain.com
Molden, D., Frenken, K., Barker, R., de Fraiture, C., Mati, B., Svendsen, M., Sadoff, C., Max Finlayson C. 2007. Trends in water and agricultural development. In Molden, D. (ed) Water For Food, Water For Life: A Comprehensive Assessment of Water Management in Agriculture. London: Earthscan, and Colombo: International Water Management Institute. Available at http://www.iwmi.cgiar.org/Assessment/CRFA
Moreira 2007. Health, environment and pesticide use in a farming area in Rio de Janeiro state, Brazil. CAD. Saude Publica, Rio de Janeiro. Sup4 S612-S621.
Muller, A., Schmidhuber, J., Hoogeveen, J., and Steduto, P. 2008. Some insights in the effect of growing bioenergy demand on global food security and natural resources. Water Policy 10 (S1): 83–94.
National Research Council. Water Implications of Biofuels Production in the United States; National Academies Press: Washington, D.C., 2008; pp 19-25.
Organisation for Economic Co-operation and Development (OECD). 2006. Agricultural Market Impacts of Future Growth in the Production of Biofuels. AGR/CA/APM(2005)24/Final, Directorate for Food, Agriculture and Fisheries, Paris: OECD, 2006.
OECD/Food and Agriculture Organization of the United Nations. 2011. OECD-FAO Agricultural Outlook 2011-2020. Available at www.oecd.org/site/oecd-faoagriculturaloutlook/48202074.pdf
Pinzon, L. 2009. Columbia Biofuels Annual. USDA Foreign Agricultural Service. Global Agricultural Information Network.

13
Preechajarn, S. and Prasertsri, P. 2011. Thailand Biofuels Annual. USDA Foreign Agricultural Service. Global Agricultural Information Network. GAIN Report Number TH1088.
Prugh, T. 2014. Biofuel Production Decline. Report for WorldWatch Institute Vital Signs. March 31, 2014. Available at http://vitalsigns.worldwatch.org/vs-trend/biofuel-production-declines
REN21. 2011. Renewables 2011 Global Status Report Paris: REN21 Secretariat.
Renewable Fuels Association (RFA). 2012. Ethanol Industry Overview. Available at http:www.ethanolrfa.org/pages/statistics#C
Runge, C. and Senauer. Xxx 2008. How ethanol fuels the food crisis. In Council on Foreign Relations. pp 1-5.
Scott, R. and Junyang, J. 2011. China Biofuels Annual. USDA Foreign Agricultural Service. Global Agricultural Information Network. GAIN Report Number 11039.
Service, R. 2009. Another biofuels drawback: the demand for irrigation. Science 326:516-517.
Shrank, S. and Farahmand, F. 2011. Biofuels Regain Momentum. Report for WorldWatch Institute Vital Signs. August 30, 2011. Available at http://vitalsigns.worldwatch.org/vs-trend/biofuels-regain-momentum
Slette, J. 2011. Indonesia Biofuels Annual. USDA Foreign Agricultural Service. Global Agricultural Information Network. GAIN Report Number ID1134.
Tardieu, H. and Schultz, B. 2008. Topic 2.3 Water and Food for Ending Poverty and Hunger, Revised Draft Scoping Paper. 5th World Water Forum. New Delhi, India. Nov. 6, 2008.
United Nations Conference on Trade and Development (UNCTAD). 2009. World Investment Report: Transnational Corporations, Agricultural Production and Development. pp. 96 – 104.
United States Department of Agriculture (USDA). 2011a. Corn for Grain Yields USDA-NASS 01-12-12. Available at http://www.usda.gov
United States Department of Agriculture (USDA). 2011b. EU rapeseed output to resume growth in 2011 – just. Available at http://www.agrimoney.com/news/eu-rapeseed-output-to-resume-growth-in-2011---just--3040.html
United States Department of Agriculture (USDA). 2012. World Agriculture Supply and Demand Estimates. World Agricultural Outlook Board. March 9, 2012.
Urbanchuk, J.M. 2011. Contribution of the ethanol industry to the economy of the United States. Renewable Fuels Association. http://www.ethanolrfa.org/ Accessed Feb 3, 2011.
World Bank. 2010. Liquid Biofuels: Background Brief for the World Bank Group Energy, Sector Strategy. World Bank March 2010. 27 pp.

14

15
Appendix
Individual Country Submissions to the ICID Working Group on Water for Bio-energy and Food

16

17
Appendix A — Brazil
Irrigated Oil Palm Production in Brazil for Bioenergy Uses: Opportunities and Challenges
Edson BARCELOS5
The oil palm is a palm species originated from Occidental Africa, broadly dispersed on tropical rainy areas, but also found on marginal climate areas with low rain and accentuated hydric deficit (Nigeria, Benin, etc.). The agro-industry of palm oil is an important economic activity in several tropical countries, such Malaysia and Indonesia in Asia; Nigeria and Ivory Coast in Africa; and Colombia and Ecuador in South America. The Brazilian palm oil agro-industry faced a slow growth until the end of the last century, when, in the first decade of this century, it experienced a good expansion, reaching 140,000 hectares by 2012. Ninety per cent of this area is in Pará State, in the Amazonian region. At present, the activity represents a stagnation, without any new projects or considerable expansion, mainly due to domestic politics and markets. Presently, oil palm is the cultivated oil crop with highest productivity per area unit (4 to 5 tons of oil per hectare per year). Being a perennial crop, with its production distributed year-round and with an economic life span lasting more than 25 years, the activity promotes a continuous labor requirement with a dignifying remuneration, offering excellent opportunity for small farmers’ settlements, resulting in a sensible lifestyle improvement to all that are involved in this activity. 1.0 Opportunities and Risks 1.1 Palm Oil Uses At the world level, of the 56.2 M tons of palm oil production in 2012 (FAOSTAT, http://faostat. fao.org/) almost 80% is used by the food industry. It is important to note recently increased demand for non-food uses, such as renewable bio-energy. Today, with other traditional uses, such as soap, cosmetics, ink, etc., non-food use has grown to around 24% of global oil and fat consumption, up from around 10% in 2000. 1.2 Palm Oil Market Global oil and fat production grew from 68.7 M tons in 1985, to more than 180.0 M tons by 2012, an increase of 3,7% annually. Palm oil production of 7.5 million tons in 1985, represented 11% of the world edible oil production. By 2012 it represented 35.7% of production at 56.2 M tons of oil. In the same year, soybean oil represented 23.6% of world oil production. For the next twenty years, palm oil production will not be able to supply consumer, demand due to population growth and increased per capita consumption due to the land shortage for new plantings by major producers (e.g. Malaysia and Indonesia). This represents huge market potential for tropical countries like Brazil, with a large adapted area, to meet this future unsatisfied demand. Strategically, beside the global food security and markets demand aspects, oil palm can play a significant role in the Brazilian society and economy:
(a) As a potential diesel substitute due to its chemical characteristics, high productivity per area and lower production costs,
5 Oil Palm Researcher at EMBRAPA / Manaus / AM. Member of ABID to look at irrigated oil palm (E-mail :

18
(b) As an environmentally and economically sustainable activity. It presents opportunities for rural economic development, changing the pattern of traditional agriculture in the Brazilian Amazonia region,
(c) As a potential crop for irrigated production. Brazil has savannahs and some irrigated lands in the northeast region where the oil palm can become a good solution to crop diversification needs, with nearby markets for its production and also access to crop input suppliers,
(d) Because oil palm is 10 times more productive than soybean (5.0 versus 0.5 tons of oil/ha/year), much less area will be required to satisfy the huge oil demand in the future for food, fuel and chemical uses.
(e) Irrigated oil palm, by reusing industrial water such as sugar cane distillery wastewater (vinasse), or municipal wastewater can, besides solving environmental problems, allow this water to return to the hydrological cycle in a depolluted form, providing a great social service.
1.3 Irrigated Oil Palm Despite no commercial exploitation and little research on irrigation of oil palm in Brazil, global experiences can support and justify the proposition to have irrigated oil palm cultivation in the savannahs and irrigated regions of northeastern Brazil. A large experimental area (838 hectares) of oil palm under drip irrigation at Benin/Ouidah North Africa, was started at 1972 by the French Oil Palm Research Institute (IRHO). In climatic conditions of 800 mm/year of hydric deficit and relative humidity as low as 10 to 30%, this plantation produced 20.6 tons of fresh fruit bunches/ha/year, equivalent to 4.5 tons of crude palm oil/ha/year, on 5 mm/day of applied irrigation water. At this same site, a non-irrigated plot produced only 4 tons of fresh fruit bunches/ha/year, or 1.0 ton of crude palm oil/ha/year. In Guatemala, a 5,000 ha oil palm plantation, in conditions of 1000 mm of annual precipitation and a 7 month dry season, production of around 8 tons of oil/ha/year, is achievable under irrigation. Considering the physiological similarity between coconut and oil palm, and based on irrigated coconut results for the Brazilian northeast region, equivalent yields can be foreseen for irrigated oil palm cultivation in this region. Preliminary experimental results for trials conducted by Embrapa researchers are confirming this expectation. Yield in irrigated oil palm plantations at savannahs/cerrados in northeast Brazil of higher than 6 tons of oil per/hectare/year can be achieved using best agronomic practices over a range of soils types and condition. Defining precise figures and costs for this production are presently the challenge for researchers.

19
Appendix B — Canada
Background Study to Review and Assess Known Principles and Current Information on Biofuel Production
Under Irrigated Conditions
For: Agriculture and Agri-Food Canada Room 408 - 1800 Hamilton Street Regina, Saskatchewan S4P 4L2
Helen Fyles (E-mail: [email protected])
Chandra Madramootoo (E-mail: [email protected])
Don Smith (E-mail: [email protected])
Brace Centre for Water Resources Management Macdonald Campus
21,111 Lakeshore Road Ste. Anne-de-Bellevue, Quebec
H9X 3V9

20
Executive Summary
Biofuels, including ethanol and biodiesel, provided 2.7% of all fuel used for road transportation in 2010, and global biofuel production has been rising steadily. Worldwide, ethanol production was 18% higher in 2010 than in 2009 and biodiesel production increased by 12%. The United States dominates world ethanol production (51 billion litres in 2011) and became a net exporter for the first time in 2010. Over 40% of the corn crop in the United States is used to produce this ethanol. Brazil is also a major ethanol producer (32 billion litres in 2011) and uses sugarcane as feedstock. Canada is a small player on the world stage with a capacity of producing 1.8 billion litres of ethanol annually. Over 60% of this ethanol is produced in Ontario using corn. Globally, biodiesel production is dominated by Germany, Brazil, Argentina and France using primarily rapeseed and soybean crops for feedstocks. Each country produces between 2 and 3 billion litres annually. Canada produced 0.1-0.2 billion litres of biodiesel in 2010 with British Columbia, Ontario and Quebec roughly sharing 80% of the country’s total. Biofuel production worldwide is a result of government mandates and subsidies. The economics of biofuel production varies between crops and regions and is difficult to assess. Processing costs are lowest for ethanol made from sugarcane and highest for oil crops made into biodiesel due to the high price of the feedstocks. Biodiesel made from crops is not currently profitable without government incentives. The economics of ethanol from corn sits somewhere between the two and is strongly affected by feedstock price, processing method and marketability of by-products. The amount of energy required to turn a crop into fuel relative to the amount of energy generated by the fuel, is one measure of biofuel sustainability. Wide variations in this energy ratio exist depending on the energy used to convert crop to fuel and the amount of credit given to by-product generation. The highest values come from ethanol produced from sugarcane which is estimated to generate about 8 times more energy than is required to produce it. This compares to between 1.4 to 2.4 times for corn or wheat. Greenhouse gases emitted during feedstock generation including land use change, nitrogen fertilizer production and use, fuel extraction, distribution, delivery and use of the finished fuel by the consumer are also an important measure of the sustainability of biofuel use. These values are compared to baseline gasoline or diesel emissions, and greenhouse gas emission reduction (or creation) is estimated for each crop to fuel cycle. As with the energy ratio, there is wide variation in this value. Ethanol from agricultural residues and switchgrass has the highest reported values with greenhouse gases reduced by over 100% compared to baseline gasoline. The complete environmental impacts of biofuel production, including water use and contamination, and soil erosion, are rarely included in assessments of biofuel feedstock crop sustainability. Worldwide less than 2% of major feedstock crops are irrigated. In the United States about 15% of the corn used for ethanol production is irrigated and for each litre of ethanol produced, 5 to 2138 litres of water are used for corn irrigation and processing. Almost 70% of this water comes from the Ogallala aquifer. In the long term, such a level of groundwater use for ethanol production is not sustainable in the United States. By 2030, water consumed in the expected production of biofuels is projected to account for nearly half of the total amount of water consumed in the production of all
energy fuels. No biofuel crops are currently irrigated in Canada. Irrigation can more than double crop yields when water is limiting and, if infrastructure is already in place, it may help to develop a reliable source of biofuel crops in some areas. The price of water would have to be accounted for in any cost-benefit analysis. Where there is currently no irrigation infrastructure, the investment in off- and on-farm irrigation infrastructure and the cost of operating irrigation equipment are almost certainly not cost effective for producing biofuel feedstock. The authors feel that currently there are limited opportunities for biofuel production under irrigation in Canada. Further research into breeding and agronomics of biofuel crops, sustainable management methodologies, development of processing

21
technologies and a policy framework for sustainable biofuel production practices would be valuable for future biofuel expansion in Canada.
1.0 Introduction Biofuels provided 2.7% of all global fuel for road transportation in 2010; an increase from 2% in 2009, according to the Renewable Energy Policy Network (Ren21 2011). Most biofuel is used for road transport, with a limited amount in the marine transport sector. Interest is growing in the use of bio-oil as a potential fuel for aviation but it is still at the pilot stage. Biofuel production and use are being driven by government mandates, investments and subsidies. A summary of the mandates in some of the key fuel consuming nations and in each Canadian province are found in Appendix A. Biofuel alternatives to fossil fuels for transportation largely consist of ethanol and biodiesel. 1.1 Ethanol The addition of ethanol to gasoline increases the fuel octane rating and results in cleaner, more complete combustion. Ethanol has about 66% the energy of gasoline, and a blending rate of up to 10% ethanol does not require any engine modification (USDE 2012). Bioethanol, the most widely used liquid biofuel, is produced mainly by first generation technologies. Sugars are converted directly to ethanol from crops like sugarcane or sugar beets, or indirectly through hydrolysis of starch from crops such as corn, wheat, potatoes, or cassava. Recent breakthroughs in cellulosic conversion, or advanced biofuel technologies, promise a wider range of feedstocks for ethanol production such as agricultural residues, perennial grasses (switchgrass, Miscanthus) or woody materials. An important by-product of ethanol from sugarcane is bagasse, the fibre left over after the juice has been squeezed from the stalks. It can be used as a fuel source to heat and power sugar mills and ethanol plants and also as biomass for cellulosic ethanol production. Bioethanol produced from cereals creates the by-product distillers grains with solubles (DGS), a valuable, high-protein animal feed. It can be sold in its wet form (WDGS) to local cattle feedlots and dairies although it spoils quickly. The product can also be dried (DDGS) and sold as a high-protein ingredient for cattle, swine, poultry, or fish feed. For every 100 kg corn processed, 30 kg of DGS is produced as well as 30 kg of CO2 which is used in the food and beverage industry (Hussain et al. 2011). Other by-products of this production process include brewer’s yeast, fertilizers and weed control products (Amaizeingly Green 2012). 1.2 Biodiesel Biodiesel has similar energy density and viscosity to regular diesel but a heating value that is 12% lower. (Canakci 2006). It is a clean burning fuel which can be used in any diesel engine with few or no modifications although at blends higher than 5% engine service life can be reduced. Biodiesel can be made through a chemical process called transesterification whereby the glycerine is removed from used cooking oils, animal fats or vegetable oil. In principle, any vegetable oil can be used, with rapeseed being the primary source material in Europe, soya oil in South America and the USA, and palm oil in Southeast Asia. Plant oils vary in their fatty acid composition and therefore in their suitability, particularly in winter months, for use as biodiesel. Cold filter plugging point (CFPP), an estimate for the lowest temperature that a fuel will give trouble free flow, is 5˚ C and -12˚ C for biodiesel made from palm oil and rapeseed, respectively. From the CFPP value, biodiesel usage can be restricted to a limited time frame (e.g. summer) according to the climate. During the extraction of vegetable oils, rape or soya meal is produced as a by-product. Either of these can be used as a high-protein feed for livestock. Every 100 kg of rapeseed produces roughly 57 kg of rape grist and 43 kg of rapeseed oil, while 100 kg of soybean produces around 80 kg of

22
grist and 20 kg of oil. Separate markets exist for glycerine, primarily in the pharmaceutical industry, although currently the market is oversupplied and prices are low.
2.0 Biofuel Production: The Global Picture The rapid increase in biofuel production that began in 2000, continued through 2010 (Figure 1). Global ethanol production was 86 billion litres in 2010, 18% more than in 2009 and biodiesel production rose to 19 billion litres, a 12% increase from 2009 (Shrank and Farahmand 2011). 2.1 Bioethanol The United States and Brazil remained the two largest producers of bioethanol in 2010 with 49 and 28 billion litres respectively (Table 1). Ethanol production in the United States accounts for more than half of the world total and production has more than tripled over the last 5 years from 18 billion litres in 2005 to an expected 51 billion litres in 2011. After several years as a net importer of ethanol, the United States became a net exporter in 2010, sending a record 1.3 billion litres of fuel ethanol overseas, mainly to Canada, Jamaica, the Netherlands, the United Arab Emirates, and Brazil (Ren21 2011). The United States has 204 ethanol plants in 29 states, almost all of which use corn as a feedstock (RFA 2012). The long-standing U.S. system of subsidy and import tariff protection for local producers of bioethanol expired on December 31, 2011 and may have negative repercussions for domestic ethanol production.
Figure 1. Global bioethanol and biodiesel production 1975-2010. (Shrank and Farahmand 2011)
Brazil’s ethanol production increased more than 7% in 2010 and accounted for nearly one-third of the global total. Long the world’s leading ethanol exporter, Brazil continued to lose international market share to the United States, particularly in its traditional markets in Europe. Adverse weather conditions hampered global harvesting of sugarcane, pushing up prices and making subsidized U.S. corn-based ethanol cheaper in international markets (Ren21 2011). As of 2011, Brazil had 441 bioethanol refineries and between 40 and 50% of car fuel was consumed as bioethanol (Barros 2010). The flex-fuel car, developed in 2003, allows consumers to freely choose between gasoline

23
and hydrated ethanol (E100) and gas stations offer both gasoline (actually a mixture of 75 % gasoline and 25 % ethanol) and ethanol (100%) (Barros 2010).
Table 1. Ethanol production and major feedstock by country
Country Ethanol Production
(millions of litres)
Feedstock crop
(proportion of total ethanol
production, if known) 2010
(unless specified)
2011
(estimated)
United States1 49,210 51,100 Corn (100%)
Brazil2 28,000 32,500 Sugarcane (100%)
China3 2128 2217 Corn (80%); Wheat and rice (20%)
India4 1435 1934 Sugarcane molasses (100%)
Canada5 1200 1351 to 18005a Corn (74%); Wheat (26%)
Germany6 1042 1100 Wheat and rye (major Feedstocks); Barley,
maize and triticale (minor feedstocks)
France7 805-1150(2009) NA Sugar beet (major feedstock); Wheat, maize
(minor feedstocks)
Thailand8 426 528 Sugar molasses (80%); Tapioca (20%)
Columbia9 302 (2009) NA Sugarcane (100%)
Australia10 203 (2009) NA Waste wheat starch (50%); Sugarcane
(18%); Sorghum (27%)
World11 85800 8870012
1. Urbanchuk 2011; 2. Barros 2010 and REN21 2011; 3. Scott and Junyang 2011 4. Aradhey 2011; 5. Dessureault 2011; 5a: KD Communications 2011 6. Licht 2012; 7. Henard 2010 and Biofuels Platform 2010; 8. Preechajarn and Prasertsri
2011; 9. Pinzon 2009; 10. Darby 2010. 11. Ren21 2011. 12.GRFA 2011
China produced 2 billion litres of bioethanol in 2010 and remained Asia’s largest ethanol producer, followed by India and Thailand. China’s five ethanol plants use grain (corn and wheat) and tuber (cassava) for ethanol production. Due to China’s rising food prices, the government stopped approval of new fuel ethanol plants and fell short of reaching its production target in the 2005-2010 period (Scott and Junyang 2011). Over the past few years, China has been actively experimenting with non-grain feedstocks such as cassava and sweet sorghum for ethanol production. Reportedly, for the next five year plan (2011-2015), the government has set a target for non-fossil energy consumption at 11.4%, an increase of 3.1% from 2010. Compared with other renewable energy sources, biofuel is expected to play a minor part in China’s diversified energy policy because of lack of sustainable supply of feedstocks and appropriate technology (Scott and Junyang 2011). Production of ethanol in India, all from sugarcane, reached a high in 2007 at 2.4 billion litres, dropped to 1.1billion litres in 2009 and has gradually been working its way back up to a forecast of 2.1 billion litres in 2012 (Aradhey 2011). The Indian government mandated the use of 5% ethanol (E5) blend in petrol in some states and territories in 2003 and expanded the plan to the entire country in 2008. The target is somewhat successful in years of surplus sugar production, and unfilled when sugar production declines (Aradhey 2011). However, with an outlook of bumper sugarcane and sugar production in 2011/12, the government is likely to renew its focus and strongly implement the mandatory E5 ethanol blend. There is limited scope to bringing additional area under water intensive sugarcane cultivation and alternate crops for ethanol production such as sweet sorghum, sugar beets or sweet potatoes are under experimentation. Ethanol production in Thailand continues its upward trend from 426 to 528 million litres/y between 2010 and 2011, to an estimated 580 million litres/y in 2012. Another 5 new ethanol plants, all using tapioca as feedstock, will be added to the 19 existing plants (Preechajarn and Prasertsri 2011). Thailand’s ethanol exports are estimated to have increased from 49 million litres in 2010 to 70 million litres in 2011. The proportion of tapioca vs sugar molasses used as feedstock varies
24
somewhat between years depending on their relative prices. A bumper crop of sugarcane in 2010/2011 and record tapioca prices made molasses-based ethanol 17% cheaper to produce than tapioca-based ethanol. In 2009, the European Union mandated a 10% minimum target for renewable energy to be consumed in transport by 2020. E.U. bioethanol production surged by more than 30% in 2010. France and Germany remained the largest European ethanol producers using wheat, rye and sugar beets as major feedstocks. The E.U. imported ethanol in 2011 from the U.S. due to higher costs and production shortfalls in Europe. Output is about 625 million litres short of the 9.27 billion litres that drivers are mandated to use this year according to Bloomberg New Energy Finance (Freedman 2011). At the end of 2011, ethanol in New York Harbor was $0.78 per litre ($2.95/U.S. gal) compared with $0.85 per litre ($3.21/U.S.gal) in Rotterdam. Africa represents a tiny share of world ethanol production but saw continued rapid growth in production during 2010.World ethanol prices increased by more than 30% in 2010 in the context of a new commodity price spike of ethanol feedstocks, mainly sugar and maize, and firm energy prices. This situation contrasts with 2007/08 where ethanol price movements did not follow commodity price increases and ethanol profit margins were lower (OECD-FAO 2011).
2.2 Biodiesel The European Union generated 53% of the world’s biodiesel in 2010 with rapeseed as the major feedstock (Table 2). Germany was the world’s largest biodiesel producer with 2.9 billion litres. Brazil was the second largest producer with 2.5 billion litres, a 50% increase over 2009 and all for national consumption. Argentina was not far behind Brazil at 2.1 billion litres and is projected to increase biodiesel production to 3 billion litres by 2012 due to large investments in the sector (Joseph 2011). Both countries rely heavily on soybean for biodiesel feedstock. An increasing share of the E.U. supply of biodiesel is being imported, primarily based on soy or palm oil, as tax incentives decline but biofuel mandates remain. Also, the growing capacity of European harbours, often connected to inland waterways, facilitates the import of cheap international biofuels and feedstock. A large amount of recent biodiesel production growth (e.g. Argentina, Indonesia) can be linked to exports to the E.U. (Lamers 2011). Recent EPA analysis shows that biodiesel and renewable diesel produced from palm oil do not meet the minimum 20% lifecycle GHG reduction threshold needed to qualify as renewable fuel under the Renewable Fuel Standard (RFS) program in the United States (EPA 2011b). This may have an impact on global trade in biodiesel. World biodiesel prices increased in 2010 in a context of rising rapeseed and other vegetable oil prices and high crude oil prices although this price increase is smaller than for ethanol (OECD-FAO 2011).
3.0 Biofuel Production: The Canadian Picture Total annual biofuel production (ethanol plus biodiesel) in Canada is estimated to be between 1.46 and 2.0 billion litres (Table 1). If all ethanol production plants currently in operation are running at 100% capacity, ethanol production would be 1.83 billion litres per year, with 74% of that capacity generated using corn as the feedstock (Tables 3, 4). The remaining capacity comes from wheat (26%) and small amounts of wheat straw and wood waste. Most of Canada’s ethanol capacity is located in Ontario (63%) and Saskatchewan (20%) (Table 3). There are currently 14 operational ethanol production plants in Canada, 6 plants under construction or proposed and 4 research plants using cellulosic feedstocks. Of the ‘under construction or proposed’ plants, 2 will use municipal waste as feedstock and 1 will use agricultural residues (Appendix B). According to Coad and Bristow (2011), from 2005 to 2009, corn imports to Canada remained relatively constant while corn use for ethanol production quadrupled. This suggests that imports of corn play a minimal role in Canada’s ethanol industry.

25
Table 2. Biodiesel production and major feedstock by country
Country Biodiesel Production
(millions of litres)
Feedstock (proportion of total biodiesel production, if known)
20101 2011 (estimated)
Germany 2900 Rapeseed
Brazil2 2450 Soy bean (80%); Animal tallow (15%); Cotton seed oil (4%)
Argentina3 2100 2560 Soybean (100%)
France 2000 Rapeseed
United States4 1200 Soybean (60%); Canola (10%); Recycled
grease + Animal fats (20%); (data est. from Biodiesel Magazine Jan 2012)
Spain5 1100 739 Imported soy (43%) and palm oil (38%); Animal fats and recycled oils (12%)
Italy6 800 568 Imported Rapeseed, soy and palm oil
Indonesia7 700 Palm oil
Thailand8 600 Palm oil
Canada9,10 110-200 Animal fats (60%) A; Canola oil (14%); Yellow grease (13%)
World 19884
1. REN21 2011; NBB 2012; 2. . Barros 2010 3. Joseph 2011; 4. Urbanchuk 2011 5. Guerrero 2011; 6. Baldi 2011; 7. Slette 2011; 8. Preechajarn and Prasertsri 2010; 9. KD Communications 2011; 10. Dessureault 2011.
Table 3. Current and potential ethanol production capacity in Canada
Province Current Operational Capacity for Ethanol Production
Potential Capacity for Ethanol Production*
Million litres/year Proportion of total (%)
Million litres Proportion of total (%)
Alberta 42 2.4 398 18.6
Saskatchewan 345 20.2 345 16.1
Manitoba 130 7.6 170 8.0
Ontario 1073 62.7 1073 50.2
Quebec 120 7.0 152 7.1
TOTAL 1710 2138
*Based on assumption that all proposed production plants are built and run at full capacity. See Appendix B.

26
Table 4. Current and potential ethanol capacity by crop in Canada
Province Current Capacity for
Ethanol Production Potential Capacity for Ethanol Production*
(million litres/year)
wheat corn wheat corn
Alberta 42 362
Saskatchewan 345 345
Manitoba^ 65 65 65 65
Ontario 1073 1073
Quebec 120 120
TOTAL 452 1258 772 1258
% of Total Production
26%
74%
36%
59%
^Assume the Husky plant uses 50% corn and 50% wheat (see Appendix B for details).
Based on 2010 data, gasoline sales in Canada subject to the Renewable Fuel Standard (E5) totalled 42.75 billion litres (Coad and Bristow 2011). This means that 5% or 2.14 billion litres of ethanol is required to meet the RFS. Assuming that all plants are built, Canadian ethanol capacity will rise to 2.1 billion litres in the next few years (Appendix B). This indicates that ethanol imports or additional production capacity will be required to meet the RFS as gasoline demand in Canada grows. Ontario will continue to dominate ethanol production in the medium term, but Alberta’s share will rise from 2 to 19 % of Canadian capacity (Table 3). Corn will account for 59% of the bioethanol feedstock and wheat 36% (Table 4). The remainder will come from the organic components of municipal waste and wheat straw. The newer wheat bioethanol plants have more flexibility built-in as the pipes are larger and allow the use of other feedstocks, such as corn, when wheat feedstock may be too expensive. For example, Husky Energy’s wheat-based bioethanol plant in Minnedosa, Manitoba uses corn when wheat feedstock is unavailable or too expensive. Husky Energy has agreed that 80% of the feedstock used to produce bioethanol will come from Manitoba producers. The agreement is with the Manitoba government and expires in 2017. Canada’s limited ethanol production capacity, both in the short and medium term suggests that Canada’s entry into the global bioethanol market is still quite distant (Dessureault 2011). The capacity of biodiesel production plants in Canada is 260 million litres with British Columbia, Ontario and Quebec roughly sharing 80% of the total capacity (Table 5). It is difficult to ascertain the proportion of feedstocks used in biodiesel production from the data given by the plants because almost 50% of the capacity is said to come from multi-feedstocks which are a mixture of vegetable or cooking oils and animal fats (Table 6). According to Dessureault (2011), the share of biodiesel production from tallow (animal fats) is currently 60%. The proportion of biodiesel produced from canola oil in 2012 is forecast to rise to 42% from an estimated 20 % share in 2011. The share of biodiesel produced from yellow grease is forecast to fall to 8% in 2012 from 2011 levels of nearly 33%. A new soybean plant in Ontario will produce 16% of Canada’s biodiesel capacity.

27
Table 5. Current and potential biodiesel production capacity in Canada
Province Current Operational Capacity of
Biodiesel Production Potential Operational Capacity of
Biodiesel Production*
Million litres Proportion of total (%)
Million litres Proportion of total (%)
British Columbia 61 23 61 5.8
Alberta 0 463+ 43.7
Saskatchewan 20 7.7 20 1.9
Manitoba 33 1.3 33 3.1
Ontario 81 31.1 378 35.7
Quebec 65 25.0 105 9.9
TOTAL 260 1060
* Based on assumption that all proposed production plants are built. +Does not include 2 plants ‘on-hold’ that total 256 million litres in annual capacity. See Appendix B.
Table 6. Current and potential biodiesel production capacity by feedstock in Canada
Province Current Capacity for
Biodiesel Production by Feedstock (million litres/year)
Potential Capacity* for
Biodiesel Production by Feedstock (million litres/year)
Canola Multi-feedstock
Grease/oil Canola Multi-feedstock
Soybean Grease/oil
British Columbia 61 61
Alberta 397 66
Saskatchewan 20 20
Manitoba 33 33
Ontario 66 15 193 170 15
Quebec 55 10 95 10
TOTAL 53 121 86 450 354 170 86
% of Total Production
20%
47%
33%
42%
33%
16%
8%
*Based on assumption that all proposed production plants are built and run at full capacity. See Appendix B.
There are 12 operational biodiesel plants located in Canada with another 9 proposed or under construction and 2 currently ‘on hold’ due to financial issues. (Appendix B). If all plants are built, the biodiesel production capacity will increase to almost 1.1 billion litres (Table 5). This is double the amount required to meet the B2 mandate (Statistics Canada 2010). This expansion is happening predominantly in Ontario and Alberta. The federal government program, ecoEnergy provided eligible producers of renewable alternatives to gasoline with up to $.10/L of eligible sales for the first year in the program. Due to the less-established nature of the industry, producers of renewable alternatives to diesel were eligible for an incentive of up to $.26/L of eligible sales for the first year in the program. Funding for this program is now fully allocated (NRCAN 2012).

28
4.0 Fuel Yields of Feedstock for Biofuel Production The amount of energy produced by a unit of biofuel compared to the amount of fossil-fuel energy required to produce that unit, is equal to the energy ratio. Biofuel production from crops has two major energy inputs:
production of the feedstock crop
extraction of ethanol or biodiesel from the crop. Feedstock production requires energy inputs to plant, harvest, dry and transport the crop, including the energy required to produce fertilizer, pesticides and irrigation water and often the farm machinery itself. For corn production, energy inputs due to fertilizer are often half the total production inputs. Energy inputs vary with yields, tillage practices, soil texture, amount of chemicals applied to the crop, chemical production methods, and amount of water used for irrigation. For example, most of the ammonia plants in Canada recover a higher percentage of process-generated emissions than producers in other countries, which reduces the energy required to produce N fertilizer (NRCan 2007). Canadian corn producers use less nitrogen fertilizer than do U.S. producers because they use more manure. This also results in a smaller energy input and better fuel yield (Coad and Bristow 2011). The greatest energy input for corn ethanol production is during the extraction process at the ethanol plant (Figure 2). This amount varies depending on the technology used, installation date, and fuel and electricity sources used (Coad and Bristow 2011). For instance, an ethanol plant that uses conventional fossil fuel power for thermal energy and electricity requires considerably more energy inputs than a plant that utilizes biomass for energy. In the case of corn, stover can be used to generate energy and may represent up to a 40% savings in energy inputs (USDA 2010). In Brazil, bagasse, is used to fuel ethanol plants making them very energy efficient and contributing to the high energy use ratio for sugarcane. The proportion of energy used to convert sugarcane to ethanol at the plant is only about 10% of total energy inputs (relative to over 60% for corn) (Macedo et al 2008).
Production of ethanol 66.5%
Corn Production
17.7%
Production of
seeds,
fertilizer,
pesticides 9.8%
Figure 2. Proportion of energy used for production of ethanol from
corn grown in Ontario [From: Hussain et al. (2011)]

29
By-products generated during ethanol production are also often included in the calculation of the energy ratio as “credits”. In the case of ethanol production from corn, a by-product credit is given for the heat used to prepare dry DGG. Including this credit raises the energy ratio from 1.4 to over 1.9. Energy ratios vary widely within and between crops (Table 7). Sugarcane has the highest energy ratio, producing an output of energy that is about 800% greater than input energy. Other crops used for ethanol production have energy ratios between 1.1 and 2.4 or produce 10 to 140% more energy than is required for inputs. Biodiesel crops have somewhat high energy ratios although, with the exception of palm oil, the fuel yield/ha is generally much lower than for the ethanol crops. The amount of ethanol produced per hectare is related to the amount of starch or sugar in the crop and crop yield. Wheat and triticale have the lowest ethanol yield with less than 2000 litres/ha estimated by McLeod et al. (2010). Sugarcane and sugar beets have the highest yields although there is a very large variation in the latter. Older studies often show higher energy requirements to produce feedstocks and convert them to ethanol. The largest energy components for corn production are nitrogen and direct energy for fuel and electricity. According to USDA (2010) nitrogen use has declined by about 20% since the mid-90s. Similarly, all direct energy components have declined by about 50% since the mid-90s. Together, the nitrogen and direct energy reductions result in a 30% decline in the energy required to produce a tonne of corn. Almost 85% of Canada’s biofuel capacity has come into service since 2005 and Canada’s ethanol plants use modern, energy-efficient technologies. Models of energy requirements of biofuels in the future show continued growth in energy efficiency resulting in higher energy ratios.
5.0 Greenhouse Gas Emissions Reduction Greenhouse gas (GHG) emission assessments are related to the full fuel lifecycle from feedstock generation or extraction through the distribution and delivery and use of the finished fuel by the ultimate consumer. Mass values for all greenhouse gases are adjusted to account for their relative global warming potential. Direct and indirect emissions, including significant emissions from land use changes are part of the calculation. The resulting Life Cycle Assessment (LCA) value is the percentage increase or decrease in GHG emissions compared to a baseline of gasoline or diesel fuel, as is appropriate. In the United States, the Energy Independence and Security Act (2007) established specific greenhouse gas emission thresholds for each of four types of renewable fuels:
20% reduction in lifecycle GHG emissions for any renewable fuel produced at new facilities (those constructed after enactment),
50% reduction in order to be classified as biomass-based diesel or advanced biofuel,
60% reduction in order to be classified as cellulosic biofuel. In the EU, biofuels must have GHG emissions savings of at least 35% once the Renewable Energy Directive (RED) is implemented through national legislation (Flach et al. 2010). Starting in 2017, the GHG emission savings has to be 50%. For biofuels produced in installations for which production starts in 2017 and onwards, the GHG savings must be 60%.

30
Table 7. Energy ratios and fuel yields for various feedstock crops *High number includes by-product generation
Biofuel type Energy
Ratio
Conversion
Rate
Biofuel
yield
Country Reference
Ethanol
Output energy/input
energy
Litres ethanol/t dry
grain or crop
Litres/ha
Corn 1.7 – 2.4* 400 3600-4000 Ontario, Canada Hussain et al 2011
Corn 1.4-1.9* 417 3300
6900-7500 (from grain
+stover)
U.S.
Kansas, U.S.
USDA 2010b
Propheter 2010
Wheat 1.1-2.1 370-386 1000-3000
1657
E.U.
Canada
De Vries et al 2010; EUBIA 2007
McLeod et al 2010
Triticale 368 1757 Canada McLeod et al 2010
Sugar beet 1.5-2.1 94 3400-8000 E.U. De Vries et al 2010; USDA 2006
EUBIA 2007
Sugarcane 8-9.3 70 -83
4900 - 6767 Brazil De Vries et al 2010
Ecofys 2007; USDA 2006; Brazil Institute 2007
Cassava .85-1.11 330 (dry cassava chips)
150 (fresh roots)
1500-6000 Africa Papong and Malukul 2010; EcoFys 2007
Agricultural
residues
110-270
310-400
(theoretical)
Canada
U.S.
Mabee and Saddler 2010
GenSolutions 2007
Wood
Residues
120-300 Canada Mabee and Saddler 2010
Switch grass 98-115
203-222 (theoretical)
2,534–3,720
U.S. Vogel et al 2010
Miscanthus 3963 Kansas, U.S. Propheter 2010
Biodiesel Litres
biodiesel/t dry grain or crop
Rapeseed 2.0-2.5
470 711-1000
E.U. De Vries et al 2010; Hofman 2003
Brown 2006
Canola 2.1-2.4
4.5
470 676-900 (calc)
Canada Smith 2007
CRFA 2010
Soybean 2-3.6
2.1-2.4
460-520
(419 calc)
U.S.
Canada
De Vries et al 2010
Smith et al 2007; Hofman
2003
Brown 2006
Palm oil 4 4800-5675 Malaysia-World De Vries et al 2010; Brown
2006
Pahl 2005
Jatropha 1.4-6.0 1818 World Pahl 2005

31
Assessment of greenhouse gases emitted during the life cycle analysis is very complex and involves dozens of factors (Appendix C). The LCA value differs depending on the type of feedstock, conversion technologies, and end-use technologies. Regional differences can be significant with respect to land use and biomass production patterns. (S&T)2 (2011) compared biodiesel GHG emissions in Canada, the U.K. and concluded that biodiesel produced in Canada is far more effective at reducing GHG than in the U.K. This was due, in large part, to greater use of ammonium-based fertilizers in Canada vs nitrate-based fertilizers in the United Kingdom (UK). The latter have higher GHG emissions during fertilizer production. Reference energy systems also vary in their GHG emissions. For example, natural gas-generated electricity has a GHG emission factor of around 400 g CO2-eq/kWh (110 g CO2-eq/MJ) compared with 990 g CO2-eq/kWh (240 g CO2-eq/MJ) for coal-based electricity (Bird et al 2011.). LCA values will also change as technologies become more energy efficient and as our understanding of greenhouse gas emissions from agricultural soils improves. In their assessment of GHG emissions from the cultivation of a wide range of crops in Sweden (SLU 2011), the authors point out that direct nitrous oxide emissions from soil account for more than half of the greenhouse gas emissions from crop cultivation. However there are huge uncertainties in the estimation of N2O emissions. For example GHG emissions from winter wheat cultivation varied from 10 to 42 g CO2eq/MJ.
Table 8. Percentage change of GHG emissions during the life cycle of biofuel feedstocks
Crop Feedstock Conversion Method
(if known) Amount GHG emissions
are reduced (-) or raised (+)
Reference
Ethanol %
Corn Coal Dry Mill +13 to +34 EPA 2009
Corn Natural Gas Dry Mill -16 to +5 EPA 2009
Corn Best Case Natural Gas Dry Mill
-39 to -18 EPA 2009
Corn Biomass Dry Mill with Combined Heat and Power
-47 to -26 EPA 2009
Corn Stover -115 EPA 2009
Sugar beet -52 Flach et al. 2010
Sugarcane
-80 to -26 EPA 2009; Flach et al. 2010; Macedo et al 2008
Switchgrass -128 EPA 2009
Biodiesel
Soy bean
-31 to 4 EPA 2009
Flach et al. 2010
Rapeseed -38 Flach et al. 2010
Sunflower -51 Flach et al. 2010
Palm oil -19 Flach et al. 2010
Palm oil methane capture at oil mill -56 Flach et al. 2010
Waste vegetable or animal oils
-83 Flach et al 2010
The wide variation in GHG emission reductions reported in Table 8 reflects the complexity of the analysis described above. Even for any one feedstock converted to ethanol using the same technology, there is a large degree of uncertainty. There is a trend however, with corn having a smaller effect on GHG emission reduction than corn stover, sugarcane or switchgrass. For biodiesel feedstocks, waste vegetable or animal oils have the highest levels of GHG emission reduction. Scientific studies on indirect land use change prepared for the European Commission concluded

32
that biodiesel from E.U. rapeseed, Asian palm oil and South American soybean all emit more carbon dioxide than conventional diesel when their indirect emissions are taken into account (European Commission 2010). With countries now setting biofuel standards based on GHG emission reductions, less variable data will be required in the future. Several LCA studies have examined other environmental aspects, including local air pollution, acidification, eutrophication, ozone depletion and land use (reviewed by Cherubini 2009). These studies conclude that most bioenergy crops lead to increased negative environmental impacts through the intensive use of water, fertilizers and pesticides which may cause water scarcity and contamination of water and soil resources. Therefore, it should always be acknowledged that a positive impact on GHG emissions may carry a cost in other environmental areas. A careful analysis is needed to understand the trade-offs for every crop and region.
6.0 Water Use for Biofuel Production Water scarcity is already a problem in many parts of the world. Water use has been growing globally at more than twice the rate of population increase in the last century, and an increasing number of regions are reaching the limit at which reliable water services can be delivered. Approximately 1.2 billion people live in river basins with absolute water scarcity, where water resource development has exceeded sustainable limits (Molden et al 2007). Contamination of water supplies by agricultural, municipal and industrial effluents further limits water consumption. Climate change is also projected to have a significant impact on water availability. It is generally agreed that climate variability and the frequency of extreme weather events will increase even in the near term in all regions. Reserves of water in mountain glaciers are declining, thus affecting river flows and water availability during growing seasons (IPCC 2007). By 2020, water use is expected to increase by 40%, and 17% more water will be required for food production to meet population needs (Palaniappan and Gleick 2009). The implications of increasing biofuel production on water supply must be considered. A large-scale expansion of energy crop production will likely change evapotranspiration appropriation for energy depending on the previous land use. In some countries this could lead to further deterioration of an already stressed water situation (Berndes 2002). India and China have already exploited most of their available natural water resources for agriculture and expansion into large scale irrigated biofuel crop production is unlikely using current crops and technologies. In contrast, Sub-Saharan Africa and Latin America have enormous potential for irrigation expansion (Muller et al. 2008). De Fraiture et al (2008) estimated that 1.7% of the total irrigation water used worldwide is currently devoted to biofuel crops. If 20% of liquid transport needs are to be met by biofuels, this would rise to 5%. Only 1% of the sugarcane crop in Brazil (approximately 40,000 ha) is irrigated and the proportion that is used for ethanol production is uncertain (Laclau 2009). According to Aquastat, (FAO 2003) the major feedstock crops in Germany and France (wheat, sugar beet and rapeseed) are not irrigated. It is possible that some of the maize, used as a minor feedstock in France, is irrigated but it is not possible to determine how much. In Canada, corn, wheat and canola used for biofuel production are not presently irrigated (Hussain et al 2011; B. Beres personal communication6). In India, sugarcane is mostly grown under full control irrigation and a litre of ethanol produced from this sugarcane requires 3,500 liters of irrigation water (de Fraiture and Berndes 2009). In the United States about 15% of the corn crop used for biofuels is irrigated and the National Research Council (2008), warned that corn ethanol production increases may significantly impact water quality and availability. A study of the water used for irrigation and during processing, to produce ethanol from corn in the United States (Chiu et al. 2009), calculated embodied water in ethanol (EWe). EWe is defined as the sum of water used to irrigate corn for feedstock production (WIR) plus process water consumed within biorefineries (WP), divided by total ethanol production
6 Brian Beres, Cereal Agronomist, AAFC, Lethbridge Alberta
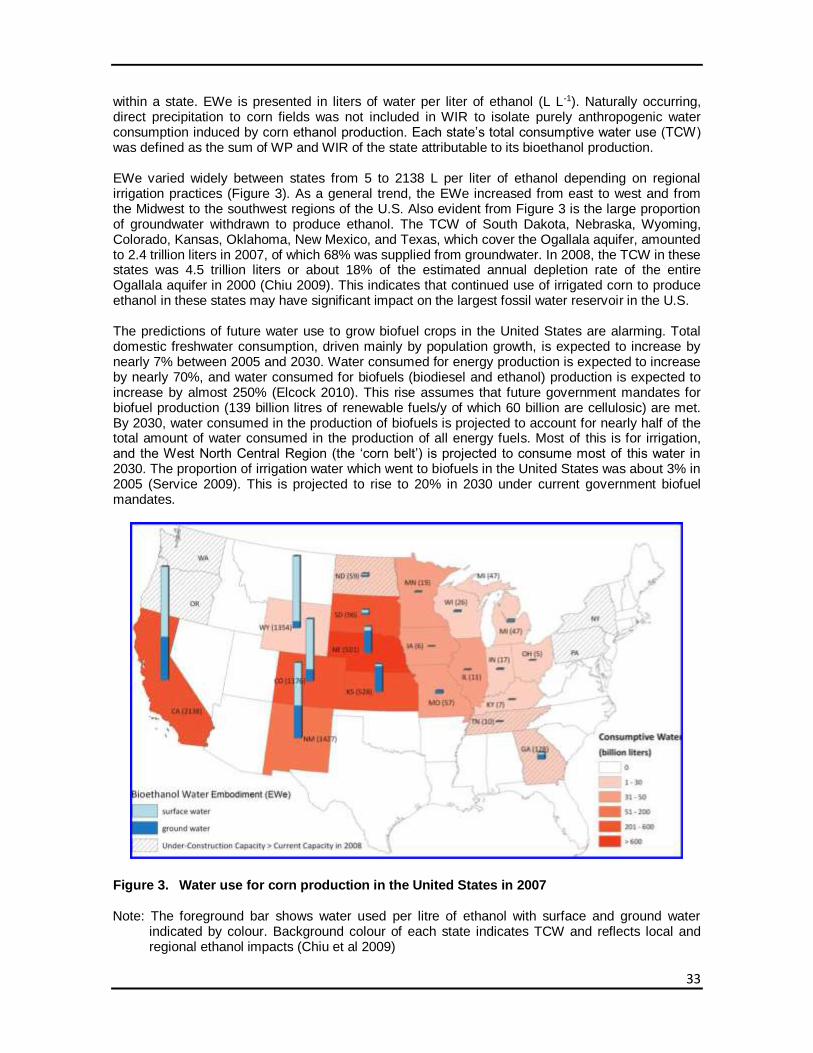
33
within a state. EWe is presented in liters of water per liter of ethanol (L L-1). Naturally occurring, direct precipitation to corn fields was not included in WIR to isolate purely anthropogenic water consumption induced by corn ethanol production. Each state’s total consumptive water use (TCW) was defined as the sum of WP and WIR of the state attributable to its bioethanol production. EWe varied widely between states from 5 to 2138 L per liter of ethanol depending on regional irrigation practices (Figure 3). As a general trend, the EWe increased from east to west and from the Midwest to the southwest regions of the U.S. Also evident from Figure 3 is the large proportion of groundwater withdrawn to produce ethanol. The TCW of South Dakota, Nebraska, Wyoming, Colorado, Kansas, Oklahoma, New Mexico, and Texas, which cover the Ogallala aquifer, amounted to 2.4 trillion liters in 2007, of which 68% was supplied from groundwater. In 2008, the TCW in these states was 4.5 trillion liters or about 18% of the estimated annual depletion rate of the entire Ogallala aquifer in 2000 (Chiu 2009). This indicates that continued use of irrigated corn to produce ethanol in these states may have significant impact on the largest fossil water reservoir in the U.S. The predictions of future water use to grow biofuel crops in the United States are alarming. Total domestic freshwater consumption, driven mainly by population growth, is expected to increase by nearly 7% between 2005 and 2030. Water consumed for energy production is expected to increase by nearly 70%, and water consumed for biofuels (biodiesel and ethanol) production is expected to increase by almost 250% (Elcock 2010). This rise assumes that future government mandates for biofuel production (139 billion litres of renewable fuels/y of which 60 billion are cellulosic) are met. By 2030, water consumed in the production of biofuels is projected to account for nearly half of the total amount of water consumed in the production of all energy fuels. Most of this is for irrigation, and the West North Central Region (the ‘corn belt’) is projected to consume most of this water in 2030. The proportion of irrigation water which went to biofuels in the United States was about 3% in 2005 (Service 2009). This is projected to rise to 20% in 2030 under current government biofuel mandates.
Figure 3. Water use for corn production in the United States in 2007 Note: The foreground bar shows water used per litre of ethanol with surface and ground water
indicated by colour. Background colour of each state indicates TCW and reflects local and regional ethanol impacts (Chiu et al 2009)

34
Feedstock processing requires as much as 10 litres of water per litre of biofuel produced, and is small relative to crop needs. However, processing plants located near urban areas will often compete with cities for scarce and expensive water (de Fraiture and Berndes 2009). For example, a typical biofuel facility might produce 100 million gallons of ethanol a year and use as much water as a town of 5000 people (Service 2009). Although this amount of water is not a lot on a national scale, it could certainly strain local resources in some regions. Research into crops with low water requirements is ongoing. For example, jatropha was promoted in India as water efficient and suitable for arid and semiarid regions. However, although jatropha persisted on arid and infertile soil, oil yields were too low under such marginal growing conditions, to make it a viable source of biodiesel (World Bank 2010). Irrigation increases yields but defeats the purpose of finding a drought resistant feedstock. In addition, irrigation made jatropha more susceptible to pests. Cellulosic feedstocks such as switchgrass and woody perennials also have low water requirements although they too grow better with irrigation and fertilization.
Table 9. Amount and area of crops used for biofuel feedstock
Country Crop Amount used for
ethanol
Year Area (% total or crop land
area)
Reference
Million tonnes Million hectares
World All 2006
2011(e)
2050(f)
14 (1% total arable)
30 (2% total arable)
100 (6% total arable)
IEA 2011
3% world’s grain supply
2010 REN21 2011
Brazil Sugarcane 296 2009 4.0 (47%of sugarcane) Barros 2010;
FAO Stat 2009,2010
318 2010 4.3 (48% of sugarcane)
E. U. Cereals 9 2010 Flach et al 2010
Sugar beets 10 2010 0.24
Rapeseed 17 2009-2011 4-5 (60-75% total rapeseed
crop)
Knight 2010;
USDA 2011b; Flach et al 2010
Wheat 2008 0.5 Flach et al 2010
Wheat 2013 (f) 1.5 Flach et al 2010
Germany All biofuel crops
2010
(16 % total arable)
Lyddon 2011
U.S.
Corn 117 2010 12.2 (31% total corn) Urbanchuk 2011
Corn 127 2011(e) 13.8 (40 % total corn) USDA 2011a,
2012
Canada Corn 2.1 2009 0.23(21% total corn) Dessureault
2011
2.3 2010 0.26(26% total corn) Dessureault 2011
2.6 2011(e) 0.26(26% total corn) Dessureault
2011
Wheat .65-.71 2010 (e) 0.26-0.28(3%total wheat) Dessureault
2011
Ontario Corn 2.8 2011 0.28 KD
Communications 2011
F=forecast; e=estimate

35
In summary, water use for biofuel production needs to be evaluated at different scales (state or province vs national), for each type of bioenergy source and the site-specific conditions in which they are grown (UNEP 2011). Maximizing the beneficial consumptive water use across a range of agricultural management regimes, from rainfed to irrigated crops is critical to sustainable biofuel production. UNEP (2011) suggests that in order to understand the use of, and impact on, water resources, a life cycle inventory (LCI), accounting for blue and green water use as well as pollution impacts should be carried out on bioenergy crops. This inventory has to be put in the context of the resource base in question and must consider the pressures on the water resource from all competing users.
7.0 Land Area and Grain Used for Biofuel Feedstocks The International Energy Agency estimates that 30 million hectares or 2% of the world’s total arable area is used for biofuel feedstock production (IEA 2011) (Table 9). The same report anticipates that by 2050, that proportion will rise to 6%. In Brazil, almost half of the sugar cane grown is used for ethanol although this is a very small proportion (1- 2%) of total agricultural land. In Germany, it is estimated that 16% of the arable land is used to produce all biofuels. The USDA (2012) estimates that over 40% of the area used for corn in the U.S. is directed into ethanol production. This represents about 3% of total farm land. It is estimated that ethanol production in Canada currently uses about 26% of the corn and 3% of the wheat growing areas (Dessureault 2011). If all ethanol plants were running at full current capacity these numbers would rise to 30 and 6% respectively (Table 10). Wheat area could rise to 10% of the total area used for wheat in Canada if all proposed plants are completed and run at full capacity. The calculation of corn area required is based on the Canadian average yield of 9 tonnes/ha. If the average for Ontario is used (10.1 tonnes/ha), the amount of land would decline by about 30,000 ha and to about 26% of total corn area used. Wheat feedstock used for ethanol theoretically uses more land than corn because of its lower crop yield (2.9 t/ha on average) and lower ethanol yield. However, as discussed below, wheat yields can be considerably higher under ideal conditions and irrigation and this would reduce the amount of land required. Canola yields up to 900 litres/ha and Alberta’s future biodiesel production would therefore require about 0.44 million ha of canola (from Table 5). This is roughly 4% of the total land used for canola in Canada.
8.0 Land Use Change Due to Biofuel Expansion As farmers react to price changes for commodities they can produce on their farms, adjustments in land-use decisions can be complex. Not only do land use decisions by individual farmers reflect the relative productivity of farmland for specific crops, but price expectations differ from one operator to the next, and decisions change from year-to-year as new expectations are formed (Wallander et al 2011). In Canada, the expansion of biofuel production to date has been accommodated without land-use changes because of improvements in seed, better agricultural practices, continued growth in crop yields, technological improvements in ethanol production, and the introduction of new crops for ethanol production (Coad and Bristow 2011). In the future however, if proposed biofuel plants are built, increased areas of wheat and canola will be necessary.

36
Table 10. Crops used and land required for each crop used to produce ethanol in Canada at current and potential operational capacity
(Assuming all ethanol plants running at 100% capacity)
Province Land Currently Required*
(hectares)
Land Required at Potential Production Capacity
(hectares)
wheat corn wheat corn
Alberta 38,600 333,000
Saskatchewan 317,000 317000
Manitoba^ 59,800 18,000 59,800 18,000
Ontario 298,000 298,000
Quebec 33,000 33,000
TOTAL 415,400 349,000 709,800 349,000
% of Total Wheat or Corn Area in Canada
6%
30%
10%
30%
*1 tonne corn produces 400 litres ethanol. Average yield 9 t/ha (AAFC 2012); 1 tonne wheat produces 375 litres ethanol. Average yield 2.9 t/ha (AAFC 2012). ^Assume the Husky plant uses 50% corn and 50% wheat.
In the United States, area planted to corn rose from 29.3 to 32.2 million hectares between 2000 and 2009 with much of the change occurring between 2006 and 2008 (USDA, National Agricultural Statistics Service, 2010). A study by Wallander et al (2011) showed that the largest source for new corn area was farms that grew primarily soybeans in 2006. However, there has not been a net decrease in soybean area. Reduced area planted to other crops such as cotton, a shift from uncultivated hay to cropland, and the expansion of double cropping (consecutively producing two crops of either like or unlike commodities on the same land within the same year) allowed soybean area to be maintained and corn area to expand (Wallander et al 2011). Increased conversion of hay or pasture to crop production, or an increase in area which is double-cropped and uses more inputs, may accelerate nutrient runoff and soil erosion. The proportion of shifts from relatively low-input crops to high-input crops (e.g., wheat to corn) or from one high-input crop to another (e.g., cotton to corn), will have environmental consequences. In 2011, the area planted to corn was estimated to be 37 million hectares, an additional increase of 13.5% in area over 2009 (USDA, National Agricultural Statistics Service, 2011). Much emphasis is put on the increases seen in corn yields over the last few decades, to provide the same fuel output on less agricultural land. However, average corn yields in the United States have fallen over the last three years from 10.3 t/ha in 2009, to 9.6 t/ha in 2010, 9.2 t/ha in 2011 (USDA 2011), possibly due to poor growing season conditions. Reduced average yields may also be a result of expanding production into areas less suited for corn or use of faster maturing corn types to allow for double cropping with soybeans. Seasonal variability and climate change will continue play a major role in corn feedstock supply in the United States. More intensive management associated with increased crop yields may have environmental consequences. Increased nitrogen application may result in increased direct N2O emissions, and more intensive farming practices may result in increased erosion and decreased soil carbon sequestration. There is a limit to how much of the continuing increase in biofuel production can take place without land use change if corn, wheat and canola are the main feedstocks. Potential tradeoffs between use of land and use of other inputs to increase production must be acknowledged and incorporated into a comprehensive analysis (Marshall et al 2011). Lignocellulosic feedstocks such as switchgrass or hybrid poplar can be grown on marginal lands not currently in use in productive agriculture. Mabee et al. (2006) estimated there are 5.3 million hectares available in Canada for such energy crops. Although cellulosic feedstocks such as perennial grasses can be grown with fewer inputs than a crop such as corn, yields can be improved

37
through the use of fertilizer, and added nutrients will be applied if increased revenues outweigh the costs (Marshall et al 2011). Several governments have taken steps to identify idle, underutilized, marginal or abandoned land and to allocate it for commercial biofuel production. In Indonesia, for example, the Department of Agriculture has reported that there are approximately 27 million hectares of “unproductive forest lands” that could be offered to investors and converted into plantations (Cotula et al 2008). However, there are likely to be major obstacles to commercial production of biofuels on marginal lands, and overuse of marginal land can result in long-term or permanent ecological damage such as salinization. Use of these lands also has social implications. In many cases, the livelihoods of poor and vulnerable groups depend on lands perceived by governments or private operators as marginal (e.g. for crop farming, herding and gathering of wild products). In India, for instance, jatropha is widely planted on “wasteland” that rural people rely on for fuelwood, food, fodder, timber and thatch. Landowners will allocate land among competing uses based on the expected net benefits of those uses, and those benefits will vary for each use depending on land quality and location. A landowner seeking to maximize profits will allocate a land parcel to the use that yields the highest expected economic return after the costs of conversion, which can include changes in machinery investments and management practices. Relative expected returns change with market conditions (commodity prices, production costs, population growth, consumer tastes, international trade, and other factors affecting the demand for land in different uses), technological advancements, and weather. The level of uncertainty surrounding future conditions will affect a landowner’s assessment of expected benefits and costs (Marshall et al. 2011).
9.0 Summary of Canadian Biofuel Feedstocks 9.1 Corn Corn, the major biofuel crop in Canada, has a relatively high starch content of about 70–72% by mass of the grain kernel (Mabee and Saddler 2010) and yields 400 litres of ethanol per tonne of corn. Average corn crop yields in Canada were reported at 9 metric tonnes per hectare for harvests between 2009 and 2011 (AAFC, 2012) and 10.1 in Ontario in 2011 (OMAFRA 2011). Although using corn to produce ethanol results in energy outputs which are greater than inputs, this number is variable and is dependent on credits given for by-products, which may or may not find a market as supplies increase. In addition, effects of intensive corn crop management on soil fertility and local water quality must be considered. Ethanol production and cattle feedstock compete directly for corn and there is controversy about how much of recent corn price increases are a result of rising demand for ethanol. Coad and Bristow (2011) reviewed interactions between ethanol demand for corn or wheat, ethanol plants supplying DDGS, and the cost of livestock feeding in Canada. They concluded that ethanol demand for corn influences livestock feed prices in a very complex way and although corn is responsible for some of the price increase, it is thought to play a smaller role than other factors such as the rising cost of fossil fuels. Genetically modified corn, recently developed by Syngenta, contains an added gene for an enzyme (amylase) that speeds the breakdown of starches into ethanol. Ethanol plants normally have to add the enzyme to corn when making ethanol. The Enogen-branded corn is being grown for the first time commercially on about 5,000 acres on the edge of America's corn belt in Kansas, following its approval by the US Department of Agriculture in 2010 (The Guardian 2011) . In its promotional material Syngenta says it will allow farmers to produce more ethanol from the corn while using less energy and water. Serious concerns about contamination of corn crops not used for ethanol production will no doubt be raised should this crop be grown in Canada.

38
Use of corn stover as well as grain for ethanol production, results in much higher yields of ethanol per hectare than grain alone (Table 9, Propheter 2010). Producing ethanol from stover will be covered in ‘Agricultural Residues’ below. 9.2 Wheat The majority of anticipated ethanol production capacity expansion in the medium term will take place in Alberta and will use wheat as a feedstock. Canadian wheat farmers view ethanol plants as an alternative market for their low-quality feed wheat, which is primarily downgraded hard red spring wheat damaged by early frost, disease or rains during harvest (Coad and Bristow 2011). However, such a supply would be too uncertain for ethanol plants and there is a need for high-yielding, low-protein wheat. Traditionally, Canadian wheat cultivars were developed to express high protein concentrations for functionality in the production of bread and pasta, extracting price premiums in the marketplace. Starch content of wheat ranges from 56-61% and is inversely related to protein content. In their trial of grains for ethanol production, McLeod et al. (2010) determined that Canada Western Soft White Spring (CWSWS), Canada Prairie Spring Red (CPSR) and Canada Spring Prairie White (CPSW) classes of wheat had the highest starch levels and produced the greatest amount of ethanol (about 380 litres/tonne). Canada Western Red Spring (CWRS) and Canada Western Amber Durum (CWAD) produced the least at about 370 litres of ethanol/tonne. Soft white spring wheats have become the standard for ethanol production, and most acres of soft wheat are now located in dryland regions of Saskatchewan, instead of the traditional irrigation belt of southern Alberta (Barker 2010). The ethanol plant at Pound-Maker Agventures in Lanigan, Saskatchewan, currently uses more than 85% AC Andrew, a low protein, high starch, high yielding Canada Western Soft White Spring. The Canadian Grain Commission has taken several steps to modify the current wheat classification system to encourage breeding and production of ethanol and feed wheats. Effective August 2008, the Grain Commission created a new class of wheat, called Canada Western General Purpose (CWGP), and it is removing the kernel visual distinguishability (KVD) requirements for the six minor wheat classes, which include CPS, Red Winter and Soft White wheats. The commission also worked on developing techniques to replace KVD requirements for registering milling wheat varieties by 2010 (Top Crop Manager 2008). Triticale may be of interest for ethanol production or other biorefinery applications as it is a high yielding cereal that has large seeds with high starch content and low protein accumulation. The perceived limitation for production is later maturity and susceptibility to ergot, but crop maturity of triticale parallels soft white spring wheat and is even preferred when compared to soft white spring types in shorter season environments. Ergot susceptibility has improved with the newer cultivars. The advantage of height is the increase in straw production, which could be a source of biomass, whether for ethanol or other forms of energy. Triticale has been studied for ethanol production and has similar starch content and ethanol production to the top three wheat classes (Beres et al 2010). However, the presence of high concentrations of pentosans in triticale and certain wheat classes can adversely affect the ethanol extraction process through increases in mash and wort viscosities (McLeod et al 2010). Ethanol facilities also have standards related to wheat diseases, such as a maximum tolerance level of Fusarium mycotoxins in the sample. It should be noted that throughout the last few decades of the 20th century, breeders worked to reduce the height of small grain cereals like triticale. This was done to reduce lodging and had the excellent additional effect of shifting biomass from stems to seeds, increasing grain yields. Shifting biomass back into the stems would change it from easily degraded starch into more recalcitrant cellulose and lignin.

39
Phelps et al (2009) reported wheat and triticale yields increased from about 5.5 tonnes/ha (82 bu/acre) to almost 10 tonnes/ha with irrigation. It is generally too cold to produce winter wheat on the Prairies although climate change may eventually alter this. Wheat trades internationally and is affected by world food prices. Using wheat for biofuel will depend on market prices and the need for the farmer to find new markets for his/her wheat crop. 9.3 Canola Canola is the major feedstock crop for biodiesel production in Canada although animal fats and yellow grease currently supply a large portion of plant production needs. Canola will become more important when the current biodiesel plant in Lloyminster, Alberta is completed and if the proposed plant in Vegreville, Alberta goes ahead (Appendix B) as both used oil seed as feedstock. The Vegreville cropping area has a high proportion of seeded hectares sown to canola as well as high average yields and oil content. According to BioStreet, the company building this processing plant, by procuring locally produced feedstock, total lifecycle GHG emissions will remain low when compared to imported feedstock such as soybean and palm oil, and quality will remain high due to the superior cold weather properties of canola. A recent study commissioned by the Canola Council of Canada demonstrates that Canadian canola biodiesel compared to petroleum diesel reduces GHG emissions by 92.5%. The introduction of new canola hybrids and biotechnological traits, along with improved agronomic practices have allowed Canadian farmers to improve canola yields over the past 15 years, to meet both food and fuel demands. Average canola yields rose 50% from 1.2 to 1.8 tonnes/hectare between 1995 and 2010 (Canola Council of Canada 2012). According to the Canola Council for Canada, Canadian farmers are already growing more than enough canola to fill the demand for both food and fuel. The federal government’s 2% biodiesel mandate would require about one million tonnes (MT) of canola seed annually. Historically, food demand has left enough carryover (ending stocks) of canola seed to fill this biofuel demand. This could however, result in lower canola exports. 9.4 Lignocellulosic Feedstocks Second generation biofuels are made from lignocellulosic biomass feedstocks using advanced technological processes that convert cellulose, found in plant structural elements such as stalks, leaves, grasses, and even trees, to ethanol. Cellulosic conversion technologies for the production of ethanol offer significant benefits over grain-based production of ethanol, including a higher ethanol yield per hectare from a diverse array of feedstocks and the use of perennial feedstocks that require less intensive management than annual grains. The amount of cellulosic material available for potential use vastly outweighs the amount of available starch based substrate. According to Gronowska et al (2009), there are between 64 and 561 million dry tonnes of biomass available in Canada. The cost of pre-processing cellulosic material to generate free glucose is much higher than that for conventional feedstock, as both mechanical and thermochemical treatments are often required. Although there is growing interest and investment in lignocellulosic feedstock for ethanol production, the technological advances are proceeding more slowly than expected. Established by the U.S. government in 2007, the mandate for cellulosic biofuel production in 2010 was 100 million gallons, rising to 250 million in 2011 and 500 million in 2012. In late 2010 the Environmental Protection Agency, which has the authority to revise the mandates, reduced the 2011 requirement by 243.4 million gallons to 6.6 million (EPA 2010). In December 2011, the 2012 mandate of 500 million gallons was lowered to 8.65 million gallons (EPA 2011). There is no mandate for cellulosic biofuels in Canada although there are several plants proposed or under construction, including municipal waste plants in Edmonton and Varennes and several operational demonstration plants. Lignol Energy Corporation, which specializes in cellulosic bioethanol and biorefining has a pilot plant in Burnaby, British Columbia that produces cellulosic

40
bioethanol. In 2010 Lignol signed a research and development agreement with Novozymes, the world’s leading producer of industrial enzymes, to make biofuel from wood chips and other forestry residues (Dessureault 2011). The partners aim to develop a process for making biofuel from forestry waste at a cost as low as $0.53/L ($2/ U.S.gallon), a price competitive with gasoline and corn bioethanol at the current United States’ market prices. With support from the Government of Canada, Iogen Corporation has built a demonstration plant to convert biomass fibers to bioethanol using enzyme technology. Located in Ottawa, Ontario, the plant can process over 25 tons of wheat straw per week, using enzymes produced in an adjacent facility. Ontario Power Generation (OPG) is looking to buy two to three million tonnes of biomass annually by 2015, the date at which the Ontario government has mandated an end to burning coal for electricity generation (Dessureault 2011). Biomass is being targeted to replace coal as soon as technical obstacles are overcome. However, a more efficient and condensed solution for the transport and handling of biomass needs to be developed. 9.4.1 Agricultural Residues Average residues for wheat, barley, and oat, are 1.3, 1.0 and 1.2 tonnes/ha, although higher weights have been recorded for wheat depending upon the harvest method employed (reviewed by Mabee and Saddler 2010). Wheat straw is predominantly comprised of cellulose, and contains on average 35% cellulose by weight. Hemicellulose makes up approximately one quarter of the weight of straw, and the most common type of hemicellulose is xylan. Thus, approximately 60% of straw can be converted to sugars and 394 litres ethanol/dry ton wheat straw produced (GenSolutions 2007). However, ethanol production from five carbon sugars in hemicelluloses is generally much less efficient than conversion of the six carbon sugars in cellulose. The amount of straw that can be removed and utilized should be based on a number of factors, such as:
value of straw for soil erosion control;
equivalent fertilizer value of the nutrients contained within the straw;
value of the straw for building soil organic matter, soil quality, and soil tilth; and
value of the straw for soil moisture conservation (Gov. Sask 2006). It should be assumed that soil conservation requirements will account for 50% or more of the total residues in many areas, and older studies indicate that particularly dry conditions could result in mandating that 100% of residues remain on the field (Mabee and Saddler 2010). Furthermore, a proportion of cereal straw will generally be utilized by farmers for livestock feed. After accounting for the factors of soil conservation, livestock feed and season variation, Bowyer and Stockmann (2001) suggested that between 15% and 40% of the total residue production would be available on average for industrial purposes. 9.4.2. Switchgrass Switchgrass is a perennial grass, native to the prairie region of North America, and has a number of characteristics which are desirable for use as a bioenergy feedstock, including high productivity, persistence and wide adaptation (Coulman et al. submitted). Switchgrass is not currently grown as a crop in Canada although several trials have taken place across the Prairie Provinces and in central Canada with the goal of creating an economically viable energy crop. Switchgrass grows rapidly, thus providing a large amount of energy potential when compared to crop residues and, as a perennial grass, it requires a minimal amount of resources to cultivate. Numerous studies have evaluated nitrogen fertilizer application and harvest management in switchgrass, identifying these management practices as critical to not only crop productivity but also to the long-term stand persistence and greenhouse gas emission or sequestration. (Reviewed by Coulman et al, submitted). However, fewer inputs of fertilizer and less fossil fuels are burned in the seeding of switchgrass than for any cereal crop (GenSolutions 2007). Plant growth promoting rhizobacteria

41
(PGPR), that increase yields and enhance nitrogen use efficiency possibly through nitrogen fixation have been isolated from switchgrass and may explain its low requirements for nitrogen fertilization (Ker et al. submitted 2012). 9.4.3. Wood Hybrid poplar is the target of large breeding programs and plantations for solid wood and pulp and paper production. It can be grown in many regions of the US and Canada but to date the amount of land in industrial plantations is still quite limited (Coulman et al. submitted). Hybrid poplars are cut from twelve to twenty-five years after planting. Fast-growing willows are also being considered for ethanol production and can be harvested in three to ten year cycles. Both crops have excellent potential for simultaneous heat and power generation through burning of wood pellets/biomass, but are not yet good candidates for bioethanol production due to the challenge of efficiently converting woody feedstocks into liquid biofuel. The wood pellet industry in Canada, especially in the west, has grown at an annual average rate of more than 20% over the last 5 years due to the steady supply of wood residues, and increasing demand from Europe. According to the Canadian Wood Pellet Association, as of 2010, Canada has 33 pellet plants with 2 million tons annual production capacity. In 2010, Canada's pellet plants operated at about 65% capacity, producing about 1.3 million tonnes per year. The province of British Columbia accounts for about 65% of Canadian production and capacity, while, collectively, the provinces of Alberta, Quebec, New Brunswick, Nova Scotia, and New Brunswick account for 35%. Contrary to the United States, where almost all the 800,000 tons of wood pellets produced are consumed domestically, more than 80% of wood pellets manufactured in Canada are exported to Europe (Dessureault 2011).
10.0 Economics of Biofuel Production The baseline for measuring the economics of biofuels is the price of gasoline and diesel. However, these fossil fuels have been heavily subsidized by government. Thus, comparison of biofuel cost per litre with “at the pump” gasoline cost does not constitute a level playing field. In addition, decades of research, much of it paid for with public money, has provided huge advances in technology that make refineries efficient and cost effective. Petro-refineries have had the time to develop full and complex economics; approximately 40% of the profits of a petro-refinery come from non-fuel products although they may make up only about 5% of the refinery output. These include monomers used to make plastics, chemicals for inks, dyes and paints, etc. Such high-value products have not yet been developed for biorefineries although it is safe to assume that there is a similar bioproducts potential. This will substantially change the overall economics of biofuel production. Rising costs of biofuel feedstocks in recent years have substantially increased production costs of biofuels. The cost of ethanol production from sugarcane, currently the most economical biofuel feedstock to produce (Table 11), was less than the price of gasoline only one year out of five between 2000 and 2010 (World Bank 2010). In the remaining years, a subsidy would have been needed to make ethanol cost-competitive with gasoline. This means that, without a subsidy, farmers would prefer to sell sugarcane to sugar producers rather than to ethanol manufacturers. This was evident in 2010 when the price of sugar rose rapidly and Brazil, which has a flexible fuel mandate, was forced to reduce the blending proportion of ethanol in gasoline from 25% to 20% (World Bank 2010). The cellulosic feedstocks in Table 11, (switchgrass and corn stover) have low production costs and high initial investment costs in the two studies reported. This latter value will decline over time as technology improves. The amount of energy in ethanol is only 66% that of gasoline which means every litre of gasoline replaced requires 1.24 litres of ethanol to produce the same energy. Drivers who fill their tanks with

42
E5 are getting slightly worse mileage than with pure gas and this mileage declines as the proportion of ethanol increases. This makes the economics of ethanol less encouraging.
Table 11. Costs associated with biofuel production
(FO Lichts 2007; Tao and Aden 2009, Fulton 2010)
Feedstock Country Net Production Cost USD/litre
Total Project Investment* USD/litre
Corn United States 0.41-0.79# 0.77
Sugarcane Brazil 0.30 0.51
Grain-based E.U. 0.58 NA
Beet-based E.U. 0.48 NA
Switchgrass^ United States 0.27 .76
Corn stover United States 0.39 1.10
Soybean United States 0.53-0.67 0.14
*Cost for a 45 MM/gal/y plant depreciated over 20 years. ^From research plots dedicated to switchgrass production in Tennessee (Fulton 2010). # From an informal estimate based on a corn price of USD 7.00/bushel.
Biodiesel economics are more unfavorable than ethanol. Biodiesel feedstock costs alone have generally been higher than petroleum diesel prices. According to Smith et al (2007), at a diesel fuel price of $1/litre, the oilseed oil price could not exceed $539/ton for biodiesel to break even. The current price for diesel is $1.10/ litre and soybean and canola oil prices are over $1100 tonne making biodiesel very expensive to produce from these feedstocks. It is interesting to note however, that although the net production cost of biodiesel from soybean is high, the capital investment for a biodiesel plant, amortized over 20 years, is low (Table 11). The transesterification process is relatively simple and consumes much less energy when compared to distillation of ethanol. Biodiesel contains 88% the amount of energy in diesel fuel so gains a few points relative to ethanol in this regard. Biofuel economics vary widely with geographic region and potential for local feedstock production. For example, the economics may be favorable in petroleum-importing landlocked or remote areas where transportation costs for imports are high and there are indigenous sources of biofuel feedstocks that can be grown at reasonable costs (World Bank 2010). The economics of exporting surplus feedstocks or biofuels depend on distance to markets as well as production costs and world prices. It should be noted that Table 11 does not include the cost of transporting the feedstock crop to the processing plant. The farmer in Iowa who has five ethanol plants within a 50 km radius of his farm will have much lower transportation costs than a farmer in Southern Alberta who has to drive his crop several hundred kilometers to reach a plant. Biofuel economics are more favorable where surplus by-products such as molasses are used as feedstocks rather than primary feedstocks. Using wastes as feedstock could also have low costs, although the economics depends directly on the cost of collecting and transporting the wastes to a biofuel manufacturing plant. In addition, wastes often have other markets: waste oils and greases can be sold to rendering companies; waste forestry materials can be made into wood pellets.
11.0 Uncertainties in Predicting Future Biofuel Demands Biofuel demand in Canada and around the world is driven by oil prices, the cost of other transportation energy alternatives (e.g. electric vehicles) and by government policies which mandate biofuel use and provide incentives for production. It is likely that high and volatile food prices and food insecurity predicted for the future will drive the focus away from the use of food crops for biofuels towards non-food crops. The effectiveness of biofuel use in reducing greenhouse gas emissions is also likely to become increasingly important. Policy changes in the E.U. and the

43
U.S. to limit carbon emissions could have a significant impact on the kinds of crops and technology that are used for biofuel production (IFPRI 2012). In the U.S. corn is the predominant source of ethanol and in some states, a large proportion of that corn is, by necessity, irrigated. Irrigated corn does not have any advantage over rain-fed corn in its yield of ethanol per ton of grain although, as with all irrigated crops, the guaranteed supply of feedstock is critical to the ethanol production plant. Corn production in the U.S. continues to be subsidized and in 2010 corn farmers received $3.5 billion in direct payments or crop insurance premium subsidies (EWG 2011). Significant water use and generous government subsidies currently ensure corn ethanol production in the U.S. If water use is constrained, subsidies decline, food prices rise or policy changes in the U.S. lower acceptable carbon emissions from bioenergy crops, the use of corn-derived ethanol will likely decline. Canadian ethanol derived from corn which does not require irrigation, and generally has lower energy requirements, may have a more optimistic future although the conflict between food and energy will remain. The yield of canola, the other significant crop for biofuel production in Canada, can be increased through irrigation although production of biodiesel would not be profitable under current market conditions. Canola prices are sufficiently high, and Canadian biodiesel subsidies sufficiently low or non-existent, that the Fame demonstration biodiesel plant in Alberta has recently converted to making canola oil due to ‘lack of investment appetite” for producing biodiesel (Oil and Oilseed News 2012). High River-based Western Biodiesel Inc., with 19 million liter/year capacity for biodiesel production closed its doors in 2011 partly because it said the federal government owed it $600,000 in incentives (Chandler 2012). As fossil fuel supplies diminish in the long term, or are disrupted in the short term by political stability in oil-producing nations, oil prices will become more volatile and more expensive. At the same time, demand for energy in Canada’s transportation sector will rise by 1.4% annually (NEB 2011). At a glance, this scenario makes the development of renewable, sustainable fuels that have the added advantage of rejuvenating rural areas, an obvious solution in many regions to meet rising transportation energy needs. Biofuels made from crops have, however, some inherent problems that result in unfavourable economics at our current level of technology. Unlike oil, which is concentrated in one place and generally unaffected by weather, biofuel feedstocks are spread out in a thin layer across a large area, and supply is affected by drought, flooding and pests. They also have a low energy density which means that the large volumes required to produce fuel, are costly to transport to processing plants. The cost of producing biofuels from crops is generally higher than the selling price, and without government incentives they would not, at current biofuel prices, be profitable. The cost of fuel production is largely due to the cost of feedstocks (corn, sugarcane, wheat, sugar beets, rapeseed, soybean) and their prices naturally follow world food prices. If land and water prices increase significantly in the future, the cost of producing biofuels will also rise. As demand for food rises worldwide, the economics of producing biofuels from crops will be a balance between the ethical issues of using food for fuel and the cost of fossil fuels vs biofuels. In the United States particularly, securing a sufficient supply of energy is a much greater problem than growing enough food. If the balance is tilted in favour of energy, this would have global consequences for food security. Canada’s E5 mandate will require an additional capacity of 700,000 million litres of ethanol per year by 2030, assuming none is imported. This will require ongoing government support which, at least for time being, seems to be stable. World trade in biofuels is also growing and changing dramatically at the moment, and also needs further study to understand potential impacts on Canada’s biofuel industry. Even with uncertainty about future government policies and world trade, it may be possible to create an economically viable biofuel industry in specific regions. For example, a small ethanol plant (20-25 million litre capacity) that is directly linked to a feedlot will have a ready market for its by-product, distiller’s grain, and can avoid the high costs of drying and transportation. This would make

44
it less susceptible to volatile food and fuel prices. Development of other valuable by-products would also help to bring down the per litre cost of producing ethanol. For example, Amaizeingly Green Products LP (formerly Collingwood Ethanol LP) a corn ethanol wet mill facility in Collingwood, Ontario has developed a number of value added co-products from corn gluten meal including a corn gluten natural fertilizer, weed control and pet food products. Co-product sales now contribute to a major percentage of the baseline revenue of the facility. Second-generation technologies—using agricultural residues, forestry products, dedicated energy crops, or municipal and other wastes—or third-generation algae-based technologies could, under certain circumstances, transform the biofuels industry away from one competing for land needed for food production, and thus make a larger contribution to energy security with much smaller adverse effects than today’s industry. While second-generation technologies may be more water efficient than currently used feedstocks, algal technologies require large amounts of water as feedstock must be grown in ponds. Crop residues are not without value and a sizable fraction is usually returned to the soil to manage organic matter and soil fertility. Some crop residues are used as animal feed and bedding (maize stover being an example), and, especially in low-income developing countries, they are burned as fuel.
12.0 Recommendations for Biofuel Opportunities in Canada under Irrigation Irrigated crops are not currently used for biofuel production in Canada. Planned expansion of biodiesel production in canola growing areas of Alberta will not use irrigated cropland (Appendix D). Bioethanol plants in Alberta are also not located near irrigated areas (Appendix D). Although expansion of ethanol production in that province will use wheat as a primary feedstock, two future plants, one proposed (Innisfail) and one under construction (Hairy Hill), are located north of irrigated areas. The high cost of transportation will make it very unlikely that any irrigated wheat will be used as feedstock in these plants. In Saskatchewan and Manitoba, ethanol plants are located at the edge of irrigated areas, but there is no evidence that irrigated crops are currently used as feedstock. Irrigation can more than double wheat yields when water is limiting and, if infrastructure is already in place, may help to develop a reliable source of biofuel crops in some areas. The price of water would have to be accounted for in any cost-benefit analysis. Where there is currently no irrigation infrastructure, the investment in off- and on-farm irrigation infrastructure and the costs of operating irrigation equipment are almost certainly not cost effective for producing biofuel feedstock. The bottom line is the price the farmer can get for his crop versus the cost of crop production and transportation. A biofuel production plant offers an alternate market for many crops. Multi-feedstock plants that can utilize crops as well as lower cost materials such as waste oils for biodiesel production, or cellulosic materials for ethanol production, would allow the farmer to obtain a fair price for his crop and reduce the overall price of feedstock to the production plant. The market will determine if an irrigated crop is viable for use as a biofuel.
13.0 Research and Technology Transfer Needs for Sustainable Biofuel Production under Irrigation
The authors feel that although there are currently limited opportunities for biofuel production under irrigation in Canada, more research needs to be carried out to develop an economically viable and stable biofuel industry. Further research into breeding and agronomics of biofuel crops, sustainable management methodologies, which may include irrigation, and plant processing technologies and by-product development, would be valuable for future biofuel expansion in Canada. In addition, the potential for genetically engineering the genes of purpose-grown feedstock for production of really high value by-products, such as pharmaceuticals, could be considered. Potential locations for future biofuel plants should also be studied and include long-term economic impacts on the food

45
and fuel sectors, environmental impacts, benefits to the farmers and local communities, and the economics of the plant itself. Although research and technology into the use of lignocellulosic feedstocks for ethanol is evolving more slowly than anticipated, perennial grasses and woody production systems are increasingly felt to be the future of ethanol production. Low water and fertilizer requirements and the fact they are not a food crop and can be grown on marginal crop lands, are strong advantages. The development of a national policy framework for sustainable biofuel production practices in Canada is also needed. Such a framework would define acceptable levels of carbon emissions from biofuel production and address implications for water resources (see Section 6.0) and agricultural land use. The policy would need to be refined at provincial, or smaller, scales.
References
AAFC, 2012. Canada: Grains and Oilseeds Outlook: 2011–12. January 17, 2012, ISSN1496-967X. Agriculture and Agri-Food Canada (AAFC), Ottawa, Canada. p. 2.
Amaizeingly Green website. http://www.amaizeinglygreen.com/ Accessed March 7, 2012.
Aradhey, A. 2011. India Biofuels Annual. USDA Foreign Agricultural Service. Global Agricultural Information Network. GAIN Report Number IN1159
Baldi, S. 2011. Italy Biofuels Annual. USDA Foreign Agricultural Service. Global Agricultural Information Network. GAIN Report Number IT1160
Barker, B. 2010. Selecting High Cereal Yield Varieties. Top Crop Manager February 2010.
Barros, Sergio. 2010. Brazil Biofuels Annual. USDA Foreign Agricultural Service. Global Agricultural Information Network. GAIN Report Number BR10006
Beres, B.L. Randhawa, H., Eudes, F., Goyal, A., Graf, R.J. et al. 2010. A Pan-Canadian Ethanol Feedstock Study to Benchmark the Relative Performance of Triticale. AAFC Conference Poster
Berndes, G. 2002. Bioenergy and water—the implications of large-scale bioenergy production for water use and supply. Global Environmental Change 12: 253–271
Biofuels Platform. 2010. http://www.biofuels-platform.ch/en/infos/eu-bioethanol.php
BioStreet. 2012. http://www.biostreetcanada.com/vegreville_energy.php
Bird, N., Cowie, A., Cherubini, F. and Jungmeier, G. 2011. Using a Life Cycle Assessment Approach to Estimate the Net Greenhouse Gas Emissions of Bioenergy. IEA Bioenergy E xExCo
Brazil Institute. 2007. The Global Dynamics of Biofuels. Woodrow Wilson International Center for Scholars
Brown, L. 2006. Plan B 2.0 Rescuing a Planet under Stress and a Civilization in Trouble NY: W.W. Norton & Co. © 2006 Earth Policy Institute.
Canakci, M. 2006. Combustion characteristics of a turbocharged DI compression ignition engine fueled with petroleum diesel fuels and biodiesel. Bioresource Technology 98: 1167-1175.
Canada Renewable Fuels Association (CRFA). 2010. Growing Beyond Oil Delivering our Energy Future. www.greenfuels.com
Canola Council of Canada. 2011. Canola A Sustainable Source for Food and Fuel. Fact Sheet available at http://www.canolacouncil.org/biodiesel/biodiesel_factsheets.aspx
Chandler, Graham. 2012. Alberta’s support for bio-fuels yields an uncertain harvest. Alberta Oil Magazine. April 9, 2012.
Cherubini, F, Birda,N.D., Cowieb, A., Jungmeiera, G., Schlamadingerc,B, Woess-Gallasch, S. 2009. Energy- and greenhouse gas-based LCA of biofuel and bioenergy systems: Key issues, ranges and recommendations. Resources, Conservation and Recycling 53:434-447
Chui, Y-W., Walseth, B. and Wonsuh, S. 2009. Water Embodied in Bioethanol in the United States. Environ. Sci. Technol. 2009, 43, 2688–2692
Coad, L and Bristow, M.. 2011. Ethanol’s Potential Contribution to Canada’s Transportation Sector. The Conference Board of Canada. 68 pp
Congressional Budget Office (CBO). 2010. Using biofuel tax credits to achieve energy and environmental policy goals. July 2010. http://www.cbo.gov/publication/25088

46
Cotula,L. N. Dyer and S. Vermeulen. 2008 Fuelling exclusion? The biofuels boom and poor people’s access to land. Published by the International Institute for Environment and Development (IIED) and FAO.
Coulman, B., Heaton, E., Lefsrud, M., Levin, D., Neale, D., Singh, J., Smith,D.L.,Whalen, J. (submitted February 2012). Lignocellulosic biofuel feedstocks. Biofpr.
Darby, M. 2010. Australia Biofuels Annual. USDA Foreign Agricultural Service. Global Agricultural Information Network.
De Fraiture, C., M. Giordano, Y. Liao. 2008. Biofuels and implications for agricultural water uses: blue impacts of green energy. Water Policy 10(S1), 67–81
De Fraiture, C. And G. Berndes. 2009. Biofuels and water. Pages 139-153 in R.W. Howarth and S. Bringezu (eds.) Biofuels: Environmental Consequences and Interactions with Changing Land Use. Proceedings of the Scientific Committee on Problems of the Environment (SCOPE) International Biofuels Project Rapid Assessment, 22-25 September 2008, Gummersbach Germany. Cornell University, Ithaca NY, USA. (http://cip.cornell.edu/biofuels/)
Dessureault, D. 2011. Canada Biofuels Annual. USDA Foreign Agricultural Service. Global Agricultural Information Network. GAIN Report Number CA11036
De Vries, S. van de Ven, G., van Ittersum, M. Giller, K. 2010 Resource use efficiency and environmental performance of nine major biofuel crops, processed by first-generation conversion techniques. Biomass and BioEnergy 34:588-601
EcoFys. 2007. Bioethanol from Cassava. Ecofys Netherlands BV, Utrecht.
Elcock, D. 2010. Future U.S. Water Consumption: The Role of Energy Production. Journal of the American Water Resources Association (JAWRA) 46(3):447-460. DOI: 10.1111/j.1752-1688.2009.00413x.
Environmental Protection Agency (EPA) 2009. Lifecycle Analysis of Greenhouse Gas Emissions from Renewable Fuels EPA-420-F-09-024, May 2009
Environmental Protection Agency (EPA). 2010. EPA Finalizes Renewable Fuel Standards for 2011. Office of Transportation and Air Quality EPA-420-F-10-056 November 2010 http://www.epa.gov/otaq/fuels/renewablefuels/420f10056.htm
Accessed Feb 8, 2012
Environmental Protection Agency (EPA) 2011. EPA Finalizes Renewable Fuel Standards for 2012. Office of Transportation and Air Quality EPA-420-F-11-044 December 2011
http://www.epa.gov/otaq/fuels/renewablefuels/regulations.htm
Accessed Feb 8, 2012
Environmental Protection Agency (EPA) 2011b. EPA Issues Notice of Data Availability Concerning Renewable Fuels Produced from Palm Oil Under the RFS Program. Office of Transportation and Air Quality. EPA-420-F-11-046. December 2011.
Environmental Working Group (EWG). 2011. 2011 Farm Subsidy Database. http://farm.ewg.org/progdetail.php?fips=00000&progcode=corn
European Biomass Industry Association (EUBIA). 2007. Bioethanol. http://www.eubia.org/212.0.html Accessed Feb 27, 2012
European Commission. 2010. Report from the Commission on indirect land-use change related to biofuels and bioliquids. Available at http://eur-lex.europa.eu/LexUriServ/LexUriServ.do?uri=CELEX:52010DC0811:EN:HTML:NOT
Flach, B., Lieberz, S., Bendz, D. Dahlbacka, B. and Achilles, D. 2010. E.U. Biofuels Annual. USDA Foreign Agricultural Service. Global Agricultural Information Network. GAIN Report Number NL0019.
FO Lichts. 2007. Ethanol production costs: a worldwide survey, a special study from FO Lichts and Agra CEAS Consulting. Agra Informa, Tunbridge Wells, Kent; 2007.
Fulton, A.D. 2010. Economic Impacts of Production, Storage, Transport, and Conversion of Switchgrass for Cellulosic Ethanol in Tennessee. M.Sc. Thesis. University of Tennessee, Knoxville.
Freedman,J. 2011. E.U. plans probe of U.S. bioethanol imports. http://www.bloomberg.com/news/2011-11-17/eu-plans-probe-of-u-s-bioethanol-imports-threatening-taxes.html
GenSolutions. 2007. Risk Assessment for Bioenergy Manufacturing Facilities in Alberta. Report submitted to Bio-Industrial Technologies Division Director Alberta Agriculture and Food.
Global Renewable Fuels Alliance. 2011. Press Release February 2011.
Government of Saskatchewan. 2006. Best Management Practices when Harvesting Surplus Cereal Straw. July 2006 http://www.agriculture.gov.sk.ca/Default.aspx?DN=9d0653b7-9839-42e5-9a72-c5f678834165

47
Gronowska, M., Joshi, S., MacLean, H.L., 2009. A review of US and Canadian biomass supply studies. Bioresources 4:341–369.
The Guardian. 2011. GM corn being developed for fuel instead of food. Accessed Feb 26, 2012 at http://www.guardian.co.uk/environment/2011/aug/15/gm-corn-development-food-fuel/print
Guerrero, M. 2011. Spain Biofuels Annual. USDA Foreign Agricultural Service. Global Agricultural Information Network.GAIN Report Number SP1123
Henard, M-C. 2010. France Biofuels Annual. USDA Foreign Agricultural Service. Global Agricultural Information Network. GAIN Report Number FR9042
Hofman, 2003. Biodiesel fuel. North Dakota State University. AE 1240
Hussain, M.M., Dincer, I and Reddy, B.V. 2011. A comparative life cycle assessment of bio- and conventional fuels in a Canadian province. Intl J. Energy research 35:795-804 DOI: 10.1002/er.1742
International Food Policy Research Institute (IFPRI). 2012. 2011 Global Food Policy Report. IFPRI, Washington, D.C.
International Energy Agency (IEA).2011. Technology Roadmap. Biofuels for Transport. IEA/OECD Available at http://www.iea.org/roadmaps/biofuels.asp
International Panel on Climate Change (IPCC). 2007. Climate Change 2007: Working Group II: Impacts, Adaptation and Vulnerability. http://www.ipcc.ch/publications_and_data/ar4/wg2/en/contents.html
Joseph, K.2011. Argentina Biofuels Annual. USDA Foreign Agricultural Service. Global Agricultural Information Network. GAIN Report Number – no number
KD Communications. 2011. What are the Effects of Biofuels and Bioproducts on the Environment, Crop and Food Prices and World Hunger? Grain Farmers of Ontario. http://www.greenfuels.org/en/resource-centre.aspx
Ker, K., Seguin, P., Driscoll, B.T. Fyles, J. W., Smith, D.L. Submitted 2012. N dynamics of switchgrass: Effects of inoculation by endophytic plant growth promoting rhizobacteria on establishment year N use efficiency. Biomass and Bioenergy
Knight, B. 2010. Biofuels: Their impact on crop production worldwide. Aspects of Applied Biology 101, 2010
LaClau, J-P. 2009. Growth of the whole root system for a plant crop of sugarcane under rainfed and irrigated environments in Brazil. Field Crops Research 114:351-360.
Lamers, P. 2011. International biodiesel markets. Development in production and trade. German Union for the Promotion of Oils and Protein Plants (UFOP). Berlin, Germany.
Lyddon, C. 2011. Focus on Germany. E.U.’s second largest grain producer features strong organic market and growing biofuels industry. World-grain.com
Mabee, W.E. and Saddler, J.N. 2010. Bioethanol from lignocellulosics: Status and perspectives in Canada. Bioresource Technology 101: 4806–4813
Mabee, W.E., Fraser, E.D.G., McFarlane, P.N., Saddler, J.N., 2006. Canadian biomass reserves for biorefining. Appl. Biochem. Biotechnol. 129, 22–40.
Macedo, I.C., Seabra, J. E.A. and Silva, J.2008..Greenhouse gases emissions in the production and use of ethanol from sugarcane in Brazil: the 2005/06 averages and a prediction for 2020. Biomass and Bioenergy 32: 582-595.
Marshall, E., Caswell, M., Malcolm, S. Motamed, M. Hrubovcak, J., Jones, C and Nickerson, C. 2011. Measuring the indirect land use change associated with increased biofuel feedstock production: a review of modeling efforts: Report to Congress. USDA Administrative Publication No. (AP054) 56 pp, February 2011
McLeod, J. G., May, W. E., Salmon, D. F., Sosulski, K., Thomas, J. B., Brown, P. D. and Vera, C. L. 2010. Changes in ethanol production potential due to species, cultivar and location on the Canadian prairie. Can. J. Plant Sci. 90: 163-171.
Molden D, Frenken K, Barker R, de Fraiture C, Mati B, Svendsen M, Sadoff C, Max Finlayson C. 2007. Trends in water and agricultural development. In Molden, D. (ed) Water For Food, Water For Life: A Comprehensive Assessment of Water Management in Agriculture. London: Earthscan, and Colombo: International Water Management Institute. Accessed at http://www.iwmi.cgiar.org/Assessment/
Muller, A., J. Schmidhuber, J. Hoogeveen, P. Steduto. 2008. Some insights in the effect of growing bioenergy demand on global food security and natural resources. Water Policy 10 (S1): 83–94.
National Biodiesel Board (NBB) 2012. The Biodiesel Bulletin February 2012.
http://www.biodiesel.org/news/bulletin/#1 Accessed Feb 3, 2012.

48
National Energy Board (NEB). 2011. Canada’s Energy Future: Energy Supply and Demand Projections to 2035. An energy market assessment. November 2011. http://www.neb-one.gc.ca/clf-nsi
National Research Council. Water Implications of Biofuels Production in the United States; National Academies Press: Washington, D.C., 2008; pp 19-25.
Natural Resources Canada (NRCAN). 2012. ecoEnergy for Biofuels Program. http://oee.nrcan.gc.ca/transportation/alternative-fuels/programs/10163
Accessed April 26, 2012.
Natural Resources Canada (NRCAN). 2007. Canadian Ammonia Producers - Benchmarking Energy Efficiency and Carbon Dioxide Emissions.
http://oee.nrcan.gc.ca/publications/infosource/home/index.cfm?act=online&id=5972&format= PDF&lang=01
Oil and Oilseed News. 2012. Canada’s biodiesel plant switched focus to edible canola oil. February 23, 2012. http://entelliprise.com/External/News_full.aspx?DocNumber=3417
Organisation for Economic Co-operation and Development (OECD). 2006. Agricultural Market Impacts of Future Growth in the Production of Biofuels. AGR/CA/APM (2005)24/Final, Directorate for Food, Agriculture and Fisheries, Paris: OECD, 2006.
OECD-FAO. 2011. OECD-FAO Agricultural Outlook 2011-2020
http://www.agri-outlook.org/document/0/0,3746,en_36774715_36775671_47877696_1_1_1_1,00.html
OMAFRA. 2011. Ontario Field Crop Report 2011 Corn Seasonal Summary. http://omafra.gov.on.ca/english/crops/field/reports/2011summary-corn.htm
Papong, S. and Malukul, P. 2010. Life-cycle energy and environmental analysis of bioethanol production from cassava in Thailand. Bioresource Technology 101:111-118
Pahl, G. 2005. Biodiesel: Growing a new energy economy. Chelsea Green Publishing Company, White River Junction, Vermont, USA. 281 p.
Palaniappan, M. and Gleick, P. 2009. Peak water. In: The World’s Water 2008-2009. The Biennial Report on Freshwater Resources. P. H. Gleick with H. Cooley, M. J. Cohen, M.Morikawa, J. Morrison, and M. Palaniappan. Pacific Institute for Studies in Development, Environment, and Security.
Phelps, S.M. B. Beres, E. Johnson, C. Pozniak, S. Chant. 2009. 2008 Western Canadian Ethanol Feedstock Trial Interim Report – Feb 10, 2009. Western Applied Research Corporation
Pinzon, L. 2009. Columbia Biofuels Annual. USDA Foreign Agricultural Service. Global Agricultural Information Network.
Preechajarn, S. and Prasertsri, P. 2011. Thailand Biofuels Annual. USDA Foreign Agricultural Service. Global Agricultural Information Network. GAIN Report Number TH1088
Propheter, J.L., Staggenborg, S.A., Wu, X and Wan, D. 2010. Performance of Annual and Perennial Biofuel Crops: Yield during the First Two Years. Agronomy Journal 102: 806-814
Prueksakornand, K. and Gheewala, S. 2008. Full Chain Energy Analysis of Biodiesel from Jatropha curcas L. in Thailand. Environmental Science & Technology 42: 3388-3393.
REN21. 2011. Renewables 2011 Global Status Report Paris: REN21 Secretariat.
Renewable Fuels Association (RFA) 2012. Ethanol Industry Overview http://www.ethanolrfa.org/pages/statistics#C
(S&T) 2 Consultants Inc. 2003. The Addition of Ethanol from Wheat to GHGEnius.Office of Energy Efficiency, Natural Resources Canada
(S&T) 2 Consultants Inc. 2010. Lifecycle Analysis Canola Biodiesel. Prepared for the Canola Council of Canada.
(S&T) 2 Consultants Inc. 2011. Biodiesel GHG Emissions, Past, Present and Future: A Report to IEA Bioenergy Task. Report T39-T1a.
Schill, S.2008. Move over Corn, Wheat’s King in Western Canada. Ethanol Producer Magazine.
Scott, R. Junyang, J. 2011. China Biofuels Annual. USDA Foreign Agricultural Service. Global Agricultural Information Network. GAIN Report Number 11039
Service, R. 2009. Another biofuels drawback: the demand for irrigation. Science 326:516-517.
Shrank, S. and Farahmand, F. 2011. Biofuels Gain Momentum. Report for WorldWatch Institute Vital Signs. August 30, 2011. vitalsigns.worldwatch.org
Slette, J. 2011. Indonesia Biofuels Annual. USDA Foreign Agricultural Service. Global Agricultural Information Network. GAIN Report Number ID1134

49
Smith, M. and Muran, M. 2009.Russia Biofuels Annual. USDA Foreign Agricultural Service. Global Agricultural Information Network. GAIN Report Number RS9036
Smith, E. G., Janzen, H. H. and Newlands, N. K. 2007. Energy balances of biodiesel production from soybean and canola in Canada. Can. J. Plant Sci. 87: 793–801.
Statistics Canada. 2011. The Supply and Disposition of Refined Petroleum Products in Canada – November 2011.
Swedish University of Agricultural Sciences (SLU). 2011. Greenhouse gas emissions from cultivation of agricultural crops for biofuels and production of biogas from manure. 2011-06-22 Dnr SLU ua 12-4067/08 revised version
Tao, L. and Aden, A. 2009. The economics of current and future biofuels. In Vitro Cell.Dev.Biol.—Plant (2009) 45:199–217x
Top Crop Manager. 2008. Aiming for Ethanol. February 2008. http://www.topcropmanager.com/content/view/1271/38/
United Nations Environment Programme (UNEP). 2011. The Bioenergy and Water Nexus. UNEP, Oeko-Institut and IEA Bioenergy Task 43, 2011.
United States Department of Agriculture (USDA). 2006. The economic feasibility of ethanol production from sugar in the United States. Office of Energy Policy and New Uses (OEPNU), Office of the Chief Economist (OCE), U.S. Department of Agriculture (USDA), and Louisiana State University (LSU).
United States Department of Agriculture (USDA). 2007. Major Land Uses. Economic Research Services. United States Department of Agriculture. http://www.ers.usda.gov/data/majorlanduses
United States Department of Agriculture (USDA) 2010a. Office of Chief Economist and World Agricultural Outlook Board. USDA Agricultural Projections to 2019. Prepared by the Interagency Agricultural Projections Committee
United States Department of Agriculture (USDA). 2010b. 2008 Energy Balance for the Corn-Ethanol Industry. Agricultural Economic Report 846. 16pp
United States Department of Agriculture, National Agricultural Statistics Service. 2010. Quick Stats Database, Crop Production Summaries, 2010, http://www.nass.usda.gov/QuickStats/index2.jsp.
United States Department of Agriculture, National Agricultural Statistics Service. 2011. U.S. Corn acreage is up in 2011, soybeans slightly down. http://www.nass.usda.gov/Newsroom/2011/06_30_2011.asp
United States Department of Agriculture. 2011a. Corn for Grain Yields USDA-NASS 01-12-12 Available at http://www.usda.gov
United States Department of Agriculture (USDA). 2011b. EU rapeseed output to resume growth in 2011 – just. http://www.agrimoney.com/news/eu-rapeseed-output-to-resume-growth-in-2011---just--3040.html
United States Department of Agriculture (USDA). 2012. World Agriculture Supply and Demand Estimates. World Agricultural Outlook Board. March 9, 2012
United States Department of Energy (USDE). 2012. Advanced Fuels and Advanced Vehicles Data Center. http://www.afdc.energy.gov/afdc/ethanol/ Accessed March 15, 2012.
United States Department of Energy (USDE). 2006. Energy Efficiency and Renewable Energy. 2006. Theoretical Ethanol Yield Calculator. http://www1.eere.energy.gov/biomass/ethanol_yield_calculator.html
United States. Department of Energy, Energy Information Administration. 2010. Annual Energy Outlook. May 2010.
Urbanchuk, J.M. 2011. Contribution of the ethanol industry to the economy of the United States. Renewable Fuels Association. http://www.ethanolrfa.org/ Accessed Feb 3, 2011
Vogel, K.P., Dien, B.S., Jung, H.G., Casler, M.D., Masterson, S.D. and Mitchel, R.B. 2010. Quantifying Actual and Theoretical Ethanol Yields for Switchgrass Strains Using NIRS Analyses Bioenergy Research 4:96-110
Wallander, S. Claassen, R. and Nickerson, C. 2011. The Ethanol Decade: An Expansion of U.S. Corn Production, 2000-09/ EIB-79 Economic Research Service/USDA
World Bank. 2010. Liquid Biofuels: Background Brief for the World Bank Group Energy Sector Strategy. World Bank March 2010. 27 pp

50
Annex 1
Table 1. Biofuel blending targets and mandates (IEA 2011)
Country/Region Current mandate/target Future mandate/target
Argentina E5, B7 n.a.
Brazil E20-25, B5
China E10 (9 provinces)
E.U. 5.75% biofuels* 10% renewable energy in transport**
India E5 E20, B20 (2017)
Thailand B3 B5
U.S. 48 billion litres renewable fuel/y of which 0.02 billion is cellulosic
139 billion litres renewable fuel/y of which 60 billion is cellulosic
Canada E5 (Newfoundland and Northern Territories exempted); B2 in some provinces
B2 nationwide by 2012
BC E5 3% biodiesel in 2010, 4% in 2011, and 5% in 2012.
Alberta E5, B2
Saskatchewan E7.5, B2
Manitoba E8.5, B2
Ontario E5, B2
Quebec E5*** (2012) B2 (2012)
New Brunswick E5 (target)
** Currently, each member state has set up different targets and mandates. **Lignocellulosic-biofuels, as well as biofuels made from wastes and residues, count twice and renewable electricity 2.5-times towards the target. ***From advanced renewable fuels

Working Group on Water for Bio-Energy and Food
Annex 2
Table 1. Ethanol production plants in Canada
Plant Province Feedstock Capacity
(million litres/year)
Status
Alberta Ethanol and Biodiesel GP Ltd
Alberta Wheat 140 Proposed
Amaizeingly Green Products L.P.
Ontario Corn 58 operational
Atlantic Bioenergy Nova Scotia Energy beets Not available Demonstration
CR Fuels Alberta Wheat 140 Proposed
Enerkem Alberta Biofuels-
Edmonton Waste-to-Biofuels Facility
Alberta Municipal solid waste (landfill waste)
36 Under construction. Completion date: 2012
Enerkem Inc – Sherbrooke Pilot Plant
Quebec Various feedstocks 475,000 litres/t
Demonstration Facility
Enerkem Inc. Westbury
Commercial-Demonstration Facility
Quebec Wood waste 5 Demonstration
Greenfield Ethanol Inc Chatham
Ontario Corn 133 Operational
Greenfield Ethanol Inc Johnston
Ontario Corn 200 Operational
Greenfield Ethanol Inc Tiverton Ontario corn 3.5 Research
Greenfield Ethanol Inc Varennes
Quebec corn 120 Operational
Greenfield-Enerkem Varennes Quebec Municipal solid waste 32 Funded
Growing Power Hairy Hill Alberta wheat 40 Under construction
Husky Energy Inc. Lloydminster
Saskatchewan wheat 130 operational
Husky Energy Inc. Minnedosa Manitoba Wheat and corn 130 operational
IGPC Ethanol Inc Ontario corn 162 operational
Iogen Corporation Ontario Wheat and barley straw
2 Demonstration
Kawartha Ethanol Inc. Ontario corn 120 operational
NorAmera BioEnergy Corporation
Saskatchewan wheat 25 operational
North West Terminal Ltd. Saskatchewan wheat 25 operational
Permolex International, L.P. Alberta wheat 42 operational
Pound-Maker Agventures Saskatchewan wheat 15 operational
Royal Dutch Shell Manitoba Wheat straw (350 t straw/day)
40 Under consideration
Suncor St. Clair Ethanol Plant Ontario Corn 400 operational
Terra Grain Fuels Inc. Saskatchewan wheat 150 operational
Total Current Capacity 1710
Total Potential Capacity 2149

52
Plant Province Feedstock Capacity
(million litres/year)
Status
Bifrost Bio-Blends Ltd. Manitoba canola 3 operational
Biocardel Quebec Inc. Quebec Multi-feedstock 40 proposed
Bio-Lub Canada.com Quebec Yellow grease 10 operational
BioStreet Canada Alberta canola 237 On hold
BIOX Corporation Ontario Multi-feedstock 66 operational
BIOX Corporation Ontario Multi-feedstock 67 proposed
Canadian Bioenergy Corp- Northern Biodiesel Ltd. Partnership (ADM)
Lloydminster,
Alberta
Canola 265 Construction start date:
spring 2012
City-Farm Biofuel Ltd. British Columbia Recycled oil/tallow 50 operational
Consolidated Biofuels British Columbia Yellow grease 10.9 operational
Drain Brothers Excavating Ontario Corn-based syrup 10 proposed
Eastman Bio-Fuels Ltd. Manitoba Canola 5 operational
FAME Biorefinery Alberta Canola, camelina, mustard
1 Demonstration
(converted back to oil, 2012)
Great Lakes Biodiesel Ontario Multi-feedstock but primarily soybeans
170 Under construction (completion 2012)
Kyoto Fuels Corp. Alberta Multi-feedstock 66 Under construction
Methes Energies Canada Ontario Yellow grease 5 operational
Methes Energies Canada Ontario Multi-feedstock 50 Under construction
Milligan Bio-Tech Inc. Saskatchewan Canola 20 operational
Noroxel Energy Ltd. Ontario Yellow grease 10 operational
The Power Alternative Alberta canola 66 Proposed
The Power Alternative Alberta canola 66 Proposed
QFI Biodiesel Quebec Multi-feedstock 10 operational
Rothsay Biodiesel
(Maple Leaf Foods)
Quebec Multi-feedstock 45 operational
Speedway International Inc. Manitoba Canola 20 operational
Western Biodiesel Alberta Multi-feedstock 19 Operational but currently on hold
TOTAL CURRENT CAPACITY
226
TOTAL POTENTIAL CAPACITY
1382
Bifrost Bio-Blends Ltd. Manitoba canola 3 operational

53
Annex 3
Life cycle analysis of crops for biofuels Greenhouse gas emissions from the production and use of transport fuels, biofuels and other bioliquids shall be calculated as:
E = eec + el + ep + etd + eu - esca – eccs – eccr – eee
E = Total emissions from the use of the fuel
eec = Emissions from the extraction or cultivation of raw materials
el = Annualized emissions from carbon stock changes caused by land use change
ep = Emissions from processing
etd = Emissions from transport and distribution
eu = Emissions from the fuel in use
esca = Emission savings from soil carbon accumulation via improved agricultural management
eccs = Emission savings from carbon capture and geological storage
eccr = Emission savings from carbon capture and replacement
eee = Emission savings from excess electricity from co-generation
From: SLU 2011

54
Annex 4
Figure. Locations of operational and proposed ethanol and biodiesel plants in Canada Irrigated areas are approximately indicated with blue cross-hatching. (Source: Canadian Renewable Fuels Association)

55


57
Appendix C — China
Biofuel development in China and its potential impacts
TIAN Fuqiang7
1.0 Background China has undergone over 30-years of rapid development. It is one of the largest economic entities in the world with expanding energy demand. An increasing proportion of imported energy as well as other resources has become a serious security problem for China’s sustainable development. Oil consumption in China reached 365.7 m tonnes in 2007, of which 53% was imported. Along with increasing fuel consumption and energy imports, environment problems have become serious during recent decades. Air pollution and greenhouse gas emission have threatened development and human well-being to the point that awareness of environment protection has been raised. For instance, the air pollution problem of main cities like Beijing, Shanghai, and Tianjin has raised great public concerns about the country’s development and urged the society to increase investment and improve the governance over the economy and the environment. The search for clean energy became urgent and at this time bio-fuels stepped into centre stage. Generally, the bio-fuel industry is beneficial for China’s agricultural and rural development. Massive lands of low soil fertility could be reused for crops like sweet potato and cassava, which are the main feedstock for bio-fuel production. The health and fertility of the lands can be sustained with a suitable bio-cycle. In addition, rotting grains that used to be wasted could be used for bio-fuel production directly without complex pre-processing. In this way, farmers as well as the whole agriculture sector could benefit from ecosystem maintenance, efficient land use and economic development. The whole society could also benefit from reduced fossil fuel consumption, improved human well-being, and sustainable development. Since 2000, China has established a series of policies to promote bio-fuel production and to upgrade its energy structure. With full consideration of food security and water consumption, biodiesel production was carefully regulated and developed. Today China has established a complete bio-fuel industry system. To date the output is still insignificant compared to the huge total energy consumption. Although society and humans can benefit from biofuel production, the concerns about feeding the world’s most populous nation could limit the growth of the biofuel industry. Food security is always one of the top issues for China. 2.0 Laws and policies for biofuel development in China Laws and policies play important roles for biofuel development in China. In 2001, the “National Standard of Denatured Fuel Ethanol” and the “National Standard of Vehicle Bioethanol” were officially released, laying the foundation of the fuel ethanol industry in the following years. Massive investment in 2002 (5 billion RMB for pilot experiment bioethanol production in Henan, Heilongjiang, Jilin and Anhui) led to the earliest consumption of E10. After the establishment of an “Expanded Pilot Testing Program of Bioethanol Gasoline for Automobiles” in 2004, E10 fuel has been used by the transportation sector in nine provinces of China. After a series of attempts to promote the experimental use and production of biofuels, the “Renewable Energy Law” was released in 2005, encouraging the use of biofuel as well as other renewable energies. Bio-ethanol production reached 1 million tons in this year.
7 Department of Hydraulic Engineering in Tsinghua University, Beijing 100084, China (E-mail : [email protected])

58
In 2007, a new policy balancing food security and new energy was set up. The biofuel expansion is suggested to be limited to non-cereal feedstock that are produced on marginal lands. Arable land suited to cereal production must not be used to produce biofuel feedstock. The twelfth five-year plan (2011-2015) has set planning objectives for the production of fuel ethanol and biodiesel of 4 million tons and 1 million tons respectively. The main problems of a lack of technology and of high cost are projected to be solved or at least partially solved by increasing subsidies, by industrialization, and by developing and applying new technology to lower the cost. Specifically, a 5% consumption tax for biofuel will be waved and biofuel production can receive a refund of the 17% Value Added Tax. Direct subsidy to biofuel plants is 2130 RMB (US$300) per ton. Subsidy to the biodiesel feedstock production base is 200 RMB/mu (US$425/ha). These subsidies are designed and applied against the background of all the aforementioned encouraging policies and laws concerning renewable energy. As shown in Table 1, total consumption of bio-energy sources was about 20 million tons in terms of standard coal in 2012. This was 0.27% of the total energy consumption of China. As a part of bio-energy, biofuel played an important role.
Table 1. Bio-energy production of China in 2012
Utilization Scale Annual Production Coal equivalent
Amount Unit Amount Unit tonnes x 10 000
Biomass power 5960 MW 14 Trillion WH 440
Household biogas 40 Million m3 13 Billion m3 930
Large-scale biogas projects 50000 Million m3 1 Billion m3 70
Biomass Briquette 6 Million tons - - 300
Fuel ethanol 2 Million tons - - 200
Biodiesel 0.6 Million tons - - 80
Total - - - - 2000
3.0 Biofuel production in China 3.1 Fuel ethanol Bioethanol, or fuel ethanol, is an alcohol made by fermentation, which is the main type of bio-fuel and the also earliest one encouraged by the Chinese government. Since 2001, ethanol blended gasoline began to be supplied in 9 provinces of Henan, Heilongjiang, Jilin, etc. During the tenth “five-years’ plan”(2001-2005), several first generation bio-fuel enterprises were founded. The fuel ethanol production of China has been steadily increasing since 2001. Fuel ethanol production is shown in Figure 1. Since 2006, there are five operating fuel ethanol refineries as shown in Table 2. A system of production, compounding, storage, delivery and marketing is established, as shown in Figure 2. However, the fuel ethanol production in China is still at its primary stage in terms of the technology. Most of the fuel ethanol is made from corn, grain and wheat. Concerns about the food supply and high prices of cereal feedstock led the industry to turn its attention at non-cereal feedstock, such as cassava, sweet sorghum, and sweet potato. They are also the main feedstock for second generation bio-fuel, which will relieve the pressure on arable land.

59
Figure 1. Fuel ethanol production in China (2005-2011) (x 10,000 t)
Table 2. Main plants for fuel ethanol production in 2006
Company/Cooperative Location
(Province) Main feedstocks Capacity (t/yr)
China Resources Alcohol Co. Heilongjiang Corn and rice 180 000
Tian Guan Fuel-Ethanol Co. Henan Wheat 410 000
BBCA Biochemical Co. Anhui Corn 400 000
Jilin Fuel Ethanol Co. Jilin Corn 470 000
Guangxi COFCO Bioenergy Co. Guangxi Cassava 120 000
Figure 2. The main fuel ethanol production centers in China in 2008

60
3.2 Biodiesel Biodiesel is still at its early development stage in China (Figure 3), compared to fuel ethanol. Since 2008, the development of biodiesel sped up. The principal biodiesel producers are Fujian Zuoyue New Energy Co. Ltd, Sichuan Gusan Biodiesel Co. Ltd, and Hainan Zhenghe Biodiesel Co. Ltd. The provinces of Jiangsu, Shandong, and Hebei are places with most biodiesel production, accounting for almost 63% of the total biodiesel production in 2012. Recently, the biodiesel industry has come under pressure from the expanding petroleum refining industry and a lack of strong policy incentives. Many biodiesel producers are operating at under their production capacity. In 2012, the capacity of biodiesel plants in China was over 2 million tons but output was only 0.88 million tons, just slightly higher than the level in 2010. The problem of over-capacity is becoming acute and the whole industry is backed into a corner.
Figure 3. Biodiesel production in China (2005-2010) (unit: 10,000t) Feedstock supply is a key factor in limiting biodiesel development in China. Vegetable oils are the main feedstock for plants elsewhere, but it is not economical for China to import them to make biodiesel. The more realistic feedstock are cooking oil, acid oil and animal fat. Waste oil and grease from Chinese cooking habits are also important economical feedstock for China. Nowadays, over 1.2 million tons of waste oil in China could be used for biodiesel production instead of being discharged directly into the ecosystem or been used elsewhere. From a long-term perspective, nonedible feedstock such as Barbados nut (Jatropha curcas), Chinese pistachio (Pistacia chinensis), and Chinese tallow tree (Sapium sebiferum) could be considered to support a larger biodiesel industry.
3.3 Economics 3.3.1 Price The price of biofuel is always an important factor when considering the markets. According to data from NDRC, the price of fuel ethanol and biodiesel is quite high. In 2007, the price of fuel ethanol in terms of feedstock was 5000 RMB/t from corn, 4000 RMB/t from sweet sorghum, and 4500 RMB/t from cassava or sweet potato. The price of biodiesel from used cooking oil is about 4000 RMB/t.

61
The real prices of biofuel are affected by the feedstock market. Therefore, the change of land use and even the grain market and relevant factors can have significant impact on the biofuel market. The average gross profit of biofuel is relatively low and many small enterprises went bankrupt in recent years. The price policy has played a balance role in the market. According to the Pilot Program Extension Plan of Ethanol Alcohol Gasoline for Vehicles and the Detailed Rules of Implementation for the Extension of the Pilot Program of Ethanol Alcohol Gasoline for Vehicles, the price of fuel ethanol is set as the price of 90 octane (#90) gasoline times a parameter of 0.9111. And in 2011, the price of fuel ethanol was adjusted as the price of #93 gasoline times 0.9111. 3.3.2 Tax As mentioned above, in order to promote the biofuel industry, a series of preferential tax policies were established. The 5% consumption tax was waived and the VAT was refunded, for both the fuel ethanol and the biodiesel industries, which effectively lowered the stress from a fixed price. But since 2011, the preferential tax policies for fuel ethanol have been adjusted along with the development of the industry. From Oct. 1st 2011 to Dec. 31st 2011, the VAT refunded percentage was 80%. The refund was reduced to 60% in 2012, 40% in 2013, 20% in 2014 and will finally cease entirely in 2015. The consumption tax was collected at 1% from Oct. 1st 2011 to Dec. 31st 2011, 2% in 2012, 3% in 2013, 4% in 2014, and will be fully reinstated at 5% in 2015. While the preferential tax policies for fuel ethanol are under adjustment, the biodiesel industry has not been affected. 3.3.3 Subsidy Since 2011, the main targets of subsidies have transferred from cereal fuel ethanol to non-cereal fuel ethanol. According to the production cost and market settings, the quota subsidy for fuel ethanol was from 1500 to 2500 RMB/t before 2011, while after 2011 it declined to 400 to 500 RMB/t. However, similar to the tax policies, the subsidy policy for the biodiesel industry has not changed. 3.3.4 Development plans The twelfth five-year plan (2011-2015) has a planning objective that the production of fuel ethanol and biodiesel would reach 3.5 million tons and 1 million tons respectively. The main problems of a lack of technology and of high cost is projected to be solved or at least partially solved by increasing subsidies, by industrialization, and by developing and applying new technology to lower the cost. According to the revised national plan, the fuel ethanol production will increase to 10 million tons/year and the biodiesel will grow to 2 million tons/year by 2020. Under this plan, E10 sales are to expand in more provinces, and E20, E85, B5 and B10 will be introduced by 2020. Although some objectives are not realized as planned, because the target is set a bright future for the biofuel industry in China is to be expected. 3.3.5 Issues and concerns Food security is always a key issue for a populous nation like China. The restricted land resource means that if the bio-energy production expands without clear regulation, food production will decline due to loss of arable land. Greater food imports from overseas will bring serious food security problems. Bioenergy development shall be carefully promoted. In addition, a large biofuel industry will definitely increase the water consumption and aggravate water scarcity in a nation facing serious water shortage. The distribution of water resources among sectors will therefore be changed and the stability of agriculture and even the whole economy may

62
be disturbed. Uncertainty for water, food and energy may lead to imbalance of the social structure.
4.0 Impact assessment 4.1 Domestic agriculture and land resources Biofuel development will change the demand-supply relation in agricultural markets and the land market. The biofuel production will increase the production and prices of feedstock crops (maize, soybean, other oilseeds and sugar), while the production and prices of other grain crops and livestock will be lowered in the short-term. The opportunity varies remarkably among sectors. 4.2 Global trade The world market of biofuel will inevitably affect China’s biofuel industry in its early stage, while the influence will decrease when China builds its own biofuel system and produces enough biofuel products. The trade of biofuel products and feedstock between China and the world will link their agricultural markets. The supply-demand relations of food, water and energy in China will be more sensitive to global issues and more trade pressure is inevitable. 4.3 Variability among regions and socio-economic settings Opportunities from China’s biofuels vary significantly for different crop regions. The biofuel industry will raise the nominal income of farmers, but the real income varies by regions and income groups. For lower income farmers, producing feedstock for biofuel will increase income but will also lead to higher expenditures for food. 4.4 Water consumption and security Development of the biofuel industry will bring more pressure on water resources. With increasing demand for feedstock used for biofuel, the water consumption for agriculture will increase. Climate change would likely result in increased demand for irrigation water. The direct and indirect impact of the biofuel industry on water scarcity and allocation is dependent on crop type, farming system (rainfed or irrigated), and socio-economic conditions. 4.5 Risks After over ten years of development, China possesses the third largest bio-fuel industry in the world, after the United States and Brazil. Due to great demand for new clean energy to support the nation’s further development, as well as consideration for energy security, the bio-fuel industry is encouraged in China. However, bio-fuel production in China is restricted by the following factors: 4.6 Lack of technology China’s biofuel production is still mainly based on first-generation technology that uses cereal crops like corn, wheat and rice as the main raw materials. The 1.5-generation technology that uses non-cereal feedstock like cassava or sweet sorghum is under promotion. Second-generation technology dependent on fiber materials shall be massively introduced and promoted in the near future. Overall, China still lacks advanced technology in biofuel production and international co-operation is extremely important for the development of a biofuel industry in this emerging market. 4.7 Lack of adequate land resources The lack of marginal land resources suitable for non-cereal crops like cassava and sweet sorghum has limited China’s effort. It is quite impossible for China to follow the pattern of United States and Brazil that possess adequate arable land. According to National Energy Administration of China, the conservative estimate of marginal land is 23.34 million hectares.

63
4.8 Threat for other industries The main non-cereal crops for biofuel production are main raw material for medicine, livestock, industry, etc. The fast development of biofuel production would increase the competition between economic sectors. A new economic structure problem will appear and some important industries may be threatened. 4.9 Competition between cereal and non-cereal crops over water The demand for more marginal arable land for raw material for the biofuel industry will also increase the consumption of water and other natural resources. This will intensify the current state of imbalance in allocations of water between social and natural systems. At the same time, the food security and water security issues together seriously restrict the effort in developing a biofuel industry that will inevitably increase the competition between cereal and non-cereal crops for water.
5.0 Mitigation of Risks and Policy Recommendations 5.1 Industry regulation and management Improve industry management and regulation to enhance the adaptation to a new market and supply-demand relation. Proper and strict project approval and market access systems need to be established and supervised. Excessive land and water consumption must be controlled within the constraints permitted by food and water security concerns. 5.2 Technological research and promotion Research on feedstock cultivation technology and fuel conversion technology should be invested in and promoted. Second-generation technologies for biofuel production should be supported with adequate finances and policies. 5.3 Incentives for the supply chain The stakeholders in the complicated supply chain of the biofuel industries and related industries must be taken into consideration and their benefits must not be fatally harmed. A complete and effective system that encourages and protects the new-born innovative industry and its fragile supply chain must be established and equipped with corresponding preferential policies. 5.4 Enhancement in resource and technology adaptation The application of biofuel should be regulated and guided by governmental agencies or industry associations to avoid the underlying uncertainties due to diversity and complexity of raw material production and markets. The technology, therefore, needs to be adaptable to the specific situation of feedstock production and local conditions in marketing, transportation and storage.
References
[1] Caleb O'Kray, Kang Wu. Biofuel in China: Development Daynamics, Policy Imperatives, and Future Growth.
[2] Huangguang Qiu, Jikun Huang, Jun Yang, Scott Rozelle, Yuhua Zhang, Yahui Zhang, and Yanli Zhang. Bioethanol development in China and the potential impacts on its agricultural economy. Applied Energy, 2010(87):76-83.
[3] Xi Chen, Chenqian Huang, Ying Chen. Development analysis and policy recommendations about Non-grain fuel ethanol industry in China. World Agriculture, 2008.9:33-36.(in Chinese)
[4] Pan Hua. Development and the trend of China's biofuel. Detergent & Cosmetics, 2009, 32(3): 11-12. (in Chinese)
64
[5] Junfang Hao. Investment Analysis of the Bio-Ethanol Industry in China. Ecological Economy, 2010(11):166-168.(in Chinese)
[6] NDRC. Development Report on China's Bio-energy Industry (2013). NDRC, 2013.(in Chinese)
[7] Fuel Ethanol Consumption in China. Available at: http://www.askci.com/news/201310/30/3016183834310.shtml. 2013.
[8] Wikipedia. Bioenergy in China. Available at: http://en.wikipedia.org/wiki/Bioenergy_in_China. 2014.
[9] Impact factors on Biodiesel Industry Development in China. Available at: http://www.askci.com/news/201306/10/109103132283.shtml. 2013.
[10] United States Securities and Exchange Commission. China Integrated Energy, Inc. (Form 10-K). Available
at: http://www.getfilings.com/sec-filings/100331/China-Integrated-Energy-Inc_10-K/. 2010.

65
Appendix D — India
Biofuels Situation in India – Input to ICID TF Position Paper on Biofuels
Amit Dutta8
Abstract Bio-energy production and use have both positive and negative environmental and socio-economic consequences, including those pertaining to water. Water, which is already a scarce resource in many parts of the world, will come under further stress providing competitive demand on water for food production. The expansion and intensification of bioenergy production could add to existing pressures on land and water management. Energy security is an essential building block for a developing country like India. In spite of several energy sector reforms, the country is facing serious energy shortages and is forced to rely heavily on imports, especially to meet the demand of the transportation sector. In such a scenario biofuel has emerged as a potential option that can not only reduce country’s dependence on foreign oil but could also help in reducing greenhouse gas emissions. Apart from contributing towards energy security, biofuels have various impacts on food and water resources. Although, the National Biofuel Policy of India has limited the production of bioethanol to molasses (a by-product of sugar industry) and of biodiesel to non-edible seed oil such as Jatropha spp. and Pongamia spp., the experts anticipate that biofuel production in India will disturb food markets and result in depletion of water resources. In this paper India’s bio-energy production and its impacts on food security have been addressed. In addition biofuel production using various feedstock, and the resulting impacts on food, water, environment, and climate change have been analyzed.
1.0 Context & Background India is sixth in the world in energy demand, accounting for 3.5% of world commercial energy consumption. Despite this, a large part of the population has no access to commercial energy from hydrocarbons at all. India’s import of crude oil was 147 million tons in 2007. In India, a larger share than in other countries is needed for transport purposes, in particular for diesel. Consumption is expected to rise 6% annually by 2011-12. Presently domestic supply can satisfy only about 25% of demand. There is a growing demand gap between production and consumption of crude oil. Indian petrol reserves are expected to last for another twenty years at most. Rising and volatile prices and respective foreign exchange costs are one of the main risk factors of the Indian economic and social development prospects. Bio-fuels provide a strategic advantage to promote sustainable development and to supplement conventional energy sources in meeting the rapidly increasing requirements for transportation fuels associated with high economic growth, as well as in meeting the energy needs of India’s vast rural population. Bio-fuels can increasingly satisfy these energy needs in an environmentally benign and cost-effective manner while reducing dependence on import of fossil fuels and thereby providing a higher degree of National Energy Security. The Indian approach to bio-fuels is based solely on non-food feedstock to be raised on degraded land or on wastelands that are not suited to agriculture, thus avoiding a possible conflict of fuel versus food security. Recent shifts in biofuel policy have advocated cultivation on marginal lands as it is widely held such lands are unsuitable for food production and are insignificant carbon sinks. It is further believed such schemes can enhance rural welfare by creating new market opportunities for the rural poor. Coupling these themes, the government of India recently enacted a biodiesel policy mandating the
8 Mr. Amit Dutta, Yes Bank Limited (E-mail: [email protected])

66
use of non-edible oilseeds such as Jatropha curcas on wastelands, a government classification of marginal lands. However, biomass feedstock from India’s wastelands currently supports an entire energy economy ranging from household fuelwood to electricity generation. Thus, India's biofuel and biomass policies are in direct competition for the same lands, which has the potential to spark territorial and class disputes. This paper tries to document different developments in the biofuel sector in India with a major focus on the present status, on policies enacted on behalf of biofuel production, on impact assessment, and on the implications on long-term sustainability and food security.
1.1 Particularities of the Water, Bio-energy and Food Security Nexus In the context of biofuel development, there has been very limited awareness and discussion of the water crisis. The current biofuel development strategy may aggravate the water crisis, and access to water could become a primary factor in the development of biofuel feedstock production. In regions already under water stress, biofuel production may further decrease freshwater availability for other development options and may limit the “right to water” both for ecosystem sustenance and for meeting peoples’ basic needs. The availability of water in developing countries is a cause of concern for agricultural productivity and for health and sanitation. In underdeveloped rural areas, where there is very high demand for access to water for irrigation, cooking and drinking, bioenergy crop production would compete for scarce water supplies. An acceleration of biofuel expansion in areas requiring additional irrigation water from already depleted aquifers could cause much greater water scarcity problems and further push up cereal prices. Poorly managed use of inputs to cultivate energy crops could pollute drinking water, adversely affecting human and animal health. According to IWMI (citation?), irrigation water in India will be affected, and 30 km3 of additional water will be required to produce the 100 million tonnes of sugarcane needed to meet the demand. This will affect food crops, necessitating their import. In 2005 more than 40 million ha was set apart to grow the oilseed plant Jatropha in the country. In developing countries like India, where there is intense pressure on farm land from current food security concerns, expanded bio-fuel production could divert land away from food crops thus exacerbating food security concerns. For example:
Diverting cereal from food and feed to fuel use has the potential to reduce food availability.
There is a risk that food and feed production will be consigned to less productive land, which may result in lower yields, while the most fertile hectares support high-value fuel crops.
2.0 Bio-energy Production 2.1 Argument between Edible & Non-Edible Sources of Bio-diesel: While the country is short of petroleum reserve, it has a large arable land base and good climatic conditions with potential to produce biomass to be processed into bio-fuels. Demand of edible oil is higher than production, so edible oils, as mainly used in Europe and the US for transport oil, are considered not eligible. As well, edible oils are much more expensive, sometimes by a factor three to five times in India. A comparison between the yields and on-farm economics of different edible and non-edible oils indicates that production of non-edible oils is expected to be more viable than of edible oils.

67
2.2 Indian Scenario The domestic production of crude oil from fossil fuels has been more or less stagnant over the years and meets only 30 per cent of the national requirement. The balance is met through imports of nearly 146 million tonnes of crude petroleum products that cost the country close to US $ 90 billion in 2008-09.
Figure: Domestic Production & Import of Crude Oil in India 1974-75 to 2008-09 This growing dependence on fossil fuels for powering the transport sector is the key reason for the country to embrace biofuel production on its own. Various other socio-economic and environmental concerns have also encouraged the shift. 2.3 Bioethanol & Biodiesel Production in India India is globally one of the largest producers of sugarcane and ethanol made from sugarcane molasses. India has about 330 distilleries with the annual production capacity of over 4.0 billion litres. In the year 2010, the country produced nearly 1.43 billion litres of ethanol, of which an estimated 50 million litres of ethanol were blended with petrol. Ethanol production is highly volatile in India due to the cyclical nature of sugarcane production and therefore, the blending of ethanol with petrol is also volatile. For instance, India produced around 2.15 billion litres of ethanol in 2008, of which 280 million litres were used for blended fuels. In 2009, ethanol production went down to 1.07 billion litres and blending to 100 million litres. Blending was down to 50 million litres in the subsequent year. Ethanol is primarily produced by the fermentation of molasses. It is estimated that, one tonne of sugarcane yields 85-100 kg of sugar (8.5–10 %) and 40 kg (4%) of molasses. The recovery of ethanol from molasses is 22 to 25 per cent as per Indian standards. Presently, only molasses produced during sugar production are available for ethanol production. Around one-fourth of it is being used for industrial purposes, while 30-35 per cent is being used for potable purposes (beverages). Three to four per cent is used for other uses. The balance of the surplus alcohol is being diverted for blending with transportation fuel. Unlike other countries, India is not using vegetable oils derived from rapeseed & mustard, soybean or oil palm for the production of biodiesel. It is because India is not self-sufficient in edible oils production and depends upon imports of palm oil and other vegetable oils in large quantities to

68
meet the domestic demand. Biodiesel is produced mostly from the non-edible oils extracted from the seeds of plants like jatropha and pongamia. 2.4 Demand for Bio-diesel Production The demand for bio-diesel in India has increased at the rate of 7.5 per cent per annum since 2004-05. Demand projections suggest that nearly 3.21 million tonnes (Mt) of biodiesel would be required for 5 per cent blending by the year 2011-12. To bring this into effect, and assuming that jatropha would be the major feedstock for biodiesel (i.e., 80 % of the requirement would be met from jatropha) with an average seed yield of 2.5 t/ha and 30 per cent biodiesel recovery rate, the area required under the crop would be 3.42 Mha. An estimated area of 26.25 M ha would be required under jatropha to meet a 20 per cent blending target by the year 2020-21, if the yield and oil content of jatropha remain the same and if no new superior feedstocks are introduced. To date only around 0.5 M ha land has been put under jatropha cultivation and the government has not initiated purchasing of biodiesel through the designated purchase centres even though MPP of Rs 26.50 per litre was announced a few years ago. Presently, Jatropha seeds are mainly crushed for oil at the village level or in small-scale plants for local use or for sale to the unorganized sector. 2.5 Indian Biodiesel Policy Promotion Central Government’s Jatropha promotion: Biodiesel program: 2003-2008 India established its biodiesel program in 2003 with the launch of the National Mission on Biodiesel (Government of India 2003). The Mission called for making mandatory a 20% biodiesel blending target by 2011-2012 using Jatropha as the primary feedstock. Although there are approximately 400 non-edible oilseed species that can be found in India, the Committee selected Jatropha for the biodiesel program because of its high oil content (40% by weight) and shorter gestation period (2-3 years) in comparison with other oilseeds (Government of India 2003). At the same time Jatropha is understood as a crop that could be grown even in wastelands. The Committee recommended cultivating Jatropha on 17.4 million hectares of underutilized and degraded wasteland (approximately 5% of India’s total land area), to reach a 20% blending target. India’s National Policy on Biofuels: 2009- Present Status On December 24, 2009, the government implemented the National Policy on Biofuels. The policy establishes 20% blending targets by 2017 for both ethanol and biodiesel. The new policy, unlike previously, is not feedstock specific. Instead, the policy calls for use of non-food feedstock grown exclusively on wastelands, both publicly and privately owned, in order to avoid conflicts with food security. According to the government, this provision distinguishes India’s policy from other countries’ biofuel programs. The policy does not mention Jatropha specifically but instead states the government will assess the potential of over 400 tree born non-edible oilseeds currently growing in India. A major highlight of the Indian Biodiesel Policy is that unlike in other developed countries, it gives due consideration to the aspect of food security of the country, and promotes only non-food feedstock for biofuel production. The Policy also exercises sufficient caution to prevent conversion of fertile lands to biofuel production. Almost all the biofuel planting programmes in the country are being undertaken on wastelands, degraded lands or forested areas. By limiting ethanol production to molasses-based feedstock, the Policy restricts excessive dependence on sugarcane which is a highly water-intensive crop. Wherever direct conversion of sugarcane juice to ethanol is permitted, it is subject to the ceiling on sugar production. Yet, there are several sticky points over which the policy is alleged to be faltering. One major contention is that there are wide variations in price and tax policies on biofuels across states and there is a need for harmonization and rationalization of these policies. In some states, the producers find the state announced prices highly non-remunerative. Also at the central level, the support prices are not revised regularly based on the changes in cost of cultivation and fluctuations in market forces.

69
3.0 Issues and Concerns 3.1 Food Security India is particularly vulnerable to food security issues. As of 2008, the United Nations Development Programme estimated that over 27% of Indians live below the poverty line and lack access to enough calories per day to sustain a healthy lifestyle. As recently as 2006, India imported 2.2 million tons of wheat in order to ensure food availability. If more food is siphoned off from the food markets into the energy market to grow the biofuel industry, it is likely that the food-versus-fuel conflict will come into play. 3.2 Water scarcity Ambitious plans in India to boost domestic production of biofuels raise serious concerns for future water supplies if traditional food crops are used. In rainfed areas, biofuel crops use ‘green water’ (water stored in the soil). But, if they use this green water more intensively than traditional land uses, biofuel crops may reduce the amount of water that ends up as ‘blue water’ in groundwater aquifers and rivers in the long run. River and groundwater systems would therefore be affected; although there is still a lot of uncertainty as to just how the production of energy crops might affect river flow downstream. For example, In the Krishna Basin in India, irrigated sugarcane could help to meet the growing demand for fuel through ethanol production. But major conflicts are already emerging between water for irrigation and environmental needs. For instance, the environmental flow requirements of the Krishna Basin are rarely met, especially during droughts, because more and more water is being withdrawn. At the moment, most sugarcane is irrigated by water pumped from underground. If sugarcane for biofuel expands and more water is drawn from rivers, this will have serious implications for the environment. 3.3 Land & Ecological Degradation In India, biodiesel is mainly produced mainly from non-edible oilseed crops like Jatropha and Pongamia, edible oil waste and animal fats. Currently, Jatropha, the major feedstock for biodiesel, occupies around 0.5 million hectares of wastelands across the country, of which 65-70 per cent are new plantations of under three years. Majority of the focus in India has been concentrated on Jatropha for production of biofuels. The issue of land degradation due to cultivation of Biofuel crops is limited in India because the majority of the feedstock comes from Jatropha which can grow on wastelands. According to a study by the International Crop Research Institute for the Semi-Arid Tropics (ICRISAT), large-scale cultivation of Jatropha can improve the soil quality of degraded lands and address climate change. Scientists at ICRISAT in Hyderabad, India have found that Jatropha plantations can also sequester carbon in abundant quantities. Jatropha plantations older than four years added as much as 1,450 kilograms of organic carbon per hectare per year through leaf fall, pruned twigs and residue after removal of oil. Also, by increasing organic carbon in soils and live root activity Jatropha plants encouraged growth of the soil's microbe population – a key indicator of soil health. Nutrient availability also improved through recycling of the biomass back into the soil. Nitrogen increased by 85 kilograms per hectare, potassium by 44 kilograms, and phosphorus by eight kilograms. Therefore currently Jatropha is seen as having potential to rehabilitate degraded lands in India. 3.4 Inequity in Development Although biofuel production promises to benefit India’s rural poor, there is also the possibility of causing harm. If land is transferred from its current uses to biofuel production, the poor will benefit from employment but may risk losing fodder for their livestock or materials for their houses and other structures. The Indian government cited that there were over 30 million hectares of wasteland available for jatropha production around the nation. However, much of this wasteland is also

70
considered Common Property Resources (CPR), land that is collectively owned by rural villages and communities. This land is generally a source of food, fuel, fodder, timber, and thatching for the poorest in India. One study reports that 12-25% of poor household incomes depend on CPR. This is going to further aggravate the inequity in development in India and increase the problems of the rural poor. 3.5 Impact Assessment Impact of Jatropha Cultivation According to survey study of NCAP on sample households at different farms at Chhattisgarh, Rajasthan & Uttarakhand, on average around 40-50 man days of labour were expected to be created per hectare per year as the plants start yielding, and would further increase as the plants reach maturity. The average plot size was of less than one quarter of a hectare in Rajasthan and a little more than half a hectare in Chhattisgarh. The yields were more or less similar across the states and farm-categories and were between 2-3 tonnes per hectare at third year. In all sample households, more than 80 per cent of the employment created in jatropha cultivation activities was supplied from within the family. In all the three states farmers were found to apply fertilizers and manures only in the first year. The farmers applied both manures and fertilizers in Rajasthan, while in the other two states they applied only manures. None of the farms in any of the locations was found to follow any crop protection measures. Impact of Biofuels on Farmers, Industry and Overall Population The biofuel industry could have significant positive impacts on the health, education, and productivity of the rural poor in India. Some anticipate that the biofuel industry will create new jobs for the poorest communities in India because biofuel production requires mostly unskilled labor, which is widely available in rural areas. Although many people worry that biofuels decrease food security, others counter that the opposite is true. Their argument is that food security is determined by one’s ability to purchase food at the market price rather than by the abundance or shortage of food. If higher incomes result from increased employment, the rural poor will have more access to food even if prices rise. Furthermore, biofuel production has the potential to increase access of rural communities to cleaner, more reliable energy. Although biofuel production has the potential to benefit India’s rural poor, there is also the possibility of causing harm. If land is transferred from its current use to biofuel production, the poor will benefit from employment but may risk losing fodder for their livestock or materials for their houses and other structures. The wellbeing of the urban poor could be particularly endangered by the biofuels, in contrast with the rural poor who may have some opportunities to benefit. Although the urban poor do not risk losing their land to biofuel production, they don’t gain employment opportunities or income increases from an expanded biofuel industry either. If India produces biofuels from food commodities on a large-scale or if other countries around the world decide to do so, global food prices will likely rise. The rural poor may be less affected by increased food prices as a result of their ability to produce their own food and live outside the global food market or due to their increased income as a result of biofuel production in rural areas. The urban poor have more at stake because their food security is more tightly linked to fluctuations in the global food market and because they are unlikely to reap any benefits or additional income from the biofuels industry. There are also numerous questions concerning exactly who will benefit from the biofuel industry — small farmers or large corporations? As a result of the fact that so little is known about jatropha, small farmers are unlikely to risk planting jatropha, which will not reap any profits for 2 to 3 years, if at all. They are more likely to plant more conventional crops such as sugarcane, which can better ensure benefits but potentially endanger the food security of the entire poor population. For these reasons, larger companies might become the larger stakeholders in the biofuel industry, which

71
could lead to greater losses but also greater gains. It remains to be seen whether biofuels widen or narrow the inequality gap.
4.0 Identified Risks 4.1 Food security concerns Sugarcane and edible vegetable oils such as palm oil are two of the most common feedstocks for biofuel production around the world. However, there are concerns that India must steer clear of these two feedstock sources in order to avoid serious problems of food insecurity. India is already the largest consumer of the sugar in the world. If sugar were then additionally diverted to the biofuel industry, the food industry would be less able to meet its demand. UN researchers suggest that sorghum and tropical sugar beets would be better suited to drive India’s bioethanol production. Similarly, India’s demand for vegetable oil already outstrips its supply. However, non-edible oils could be used to produce biodiesel. 4.2 Water quality concerns Currently, it takes 3,500 liters of irrigation water to produce one liter of ethanol from sugarcane. Many experts say that as a result, India must look to drought resistant crops such as jatropha to avoid enormous water shortages as a result of biofuel production. However, it is unclear how much water jatropha needs to produce its maximum yield. If jatropha requires a significant amount of irrigation to reach its potential, it is almost assured that water shortages will increase in frequency. It is also possible that the biofuel industry’s demand for water would take water away from food production, which could further exacerbate food insecurity in India. 4.3 Lack of public policies & logistic framework From a logistical standpoint, India is not ready to invest heavily in fuels because the political and physical infrastructure necessary to support the industry currently does not exist. Although the Indian government proposed the National Mission on Biofuels in 2003, the government still lacks the political backing to realistically implement a program of that magnitude. The Mission provides governmental suggestion on developing the biofuel industry. However, there is little policy to make sure these guidelines are followed. Moreover the physical infrastructure to support a proposed biofuel industry of that size is lacking. While there are a significant number of industrial plants that can process bioethanol, there are very few capable of producing biodiesel. In India the demand for diesel is over five times higher than the demand for petrol. Thus if India is serious about biodiesel from jatropha or other oil seed plants, it must invest significantly in acquiring additional and advanced technologies in oil extraction, transesterification, and storage for biodiesel oil. For example, prior to 2006, there were no transesterification plants capable of producing commercial biodiesel. Now there are only a handful of transesterification plants in operation and they do not operate at full capacity. India needs to scale up its efforts drastically if it hopes to produces fuels with 20% biofuel by 2017 4.4 Lack of good scientific and analytical assessment of the risks and the opportunities of different kinds of technologies and development choices Pro-biofuels experts claim that the impacts of biofuels can be mitigated through two major types of technological innovation. First, nations can focus on cellulosic biofuel technologies that use byproducts or waste products of food and other crops to create biofuels. Technologies necessary for this option to be feasible are just starting to become available but are relatively expensive. Similarly, investments in existing technologies that increase agricultural productivity could soften the impact of biofuels especially when coupled with technologies for cellulosic biofuel production. The choice does not necessarily need to be between food and fuel. However, the elimination of this conflict is highly dependent on India’s willingness to invest in new technologies.

72
4.5 Lack of research Much research is undoubtedly necessary to better understand the capabilities and downfalls of biofuels. A huge number of questions remain and more are still surfacing. For example, whether Jatropha will be economically viable compared to oil, whether indirect and environmental costs of biofuels will outweigh the direct benefits, or whether impoverished farmers will significantly benefit, all are still unanswered. Some believe that research needs to come before the Indian government invests major sums into biofuel development policy particularly those policies based around Jatropha. Others have indicated that India must work to improve its agricultural practices before it moves forward with the rest of its biofuel agenda. Unfortunately, however, there still is not enough information/research done about Jatropha to prove to the Ministry that the Government would get a substantial return on its investment.
5.0 Mitigation of Risks Extensive programmes on biofuels based on agricultural feedstock can have considerable implications for the food and livelihood security of the people in a country. The recent debates over the rising food prices and the associated fallouts as a result of large-scale shift of area from food crops to biofuel feedstock crops have created concerns among the policymakers, scientists and common man in both developed and developing countries. It is mainly because, the market response of a shift against food crops at the global level may affect not only the agricultural sector but other sectors of economy also, irrespective of the level of participation of a country in biofuel production. Moreover, huge sums of outlays for subsidies on biofuels essentially means a shift of money away from the poor and vulnerable who end up spending more on food due to increased food prices, with little income left for energy purchases, even though energy costs may decrease. 5.1 Alternative Feedstock for Ethanol Production The concerns regarding the feedstock availability, economic viability and sustainability of molasses-based ethanol have necessitated the search for alternative feedstocks to produce ethanol. Sweet sorghum has been found to be one such potential source of raw material for commercial ethanol production due to various advantages. Sweet sorghum is similar to grain sorghum, has rapid growth, wide adaptability, sugar rich stalks, and high biomass producing ability. It is suitable for seed propagation and mechanized crop production. The growing period (four months) and water requirement (8000 m3/ha over two crops) of sweet sorghum is only one-fourth of that of sugarcane. Moreover, the ethanol yield from two crops of sweet sorghum per year is higher than that obtained from molasses. At the present rates of feedstock, per litre cost of production of sweet sorghum-based ethanol (Rs 17–19) is considerably lower than that of molasses-based ethanol (Rs 24–32). Adequate extension efforts, coupled with repeated field trials and industrial trials all over the country are required to sensitize the farmers and distillers to enable large-scale adoption of sorghum. Tropical sugar beet is another potential feedstock for ethanol production, even though the potential for commercial exploitation has not been widely tested in India. Field trials conducted by Tamil Nadu Agricultural University (TNAU) have shown that tropical sugar beet can be successfully cultivated in India on large-scale. Sugar beet is a crop of 5–6 months duration and grows well in sandy loam soil. The ability of this crop to thrive well in saline and alkaline soils is of special significance. Ethanol can be directly produced from the sugar beet juice at an average recovery rate of 80–90 litres of ethanol/tonne of sugar beet. The ethanol yield from sugar beet (6000–6400 litre/ha) is far higher than from sugarcane molasses and sweet sorghum, and can be realized at a very low cost of production (Rs 12–14/litre). Sugar beet can also be used as a source of sugar.

73
Concurrently, India has to look for improved technology and management practices to maximize the efficiency from the existing feedstock. In order to realize this goal, a shift in the focus of research towards developing lower-cost second generation biofuels is needed along with sufficient (and sustained) political resolve to make adequate investments. The government should also take efforts to reflect the changing priorities in its policies.
6.0 Recommendation 6.1 Policies for Responding to Rising Bioenergy Demand
Biofuel development should be carefully designed, so as not to crowd out investments in roads, general agricultural development, health, nutrition and other efforts aimed at climate change mitigation and adaptation.
Policy should ensure that smallholders, including women farmers, have access to resources, infrastructure, services and organizations so that they can participate in biofuel production on a fair basis. Policies need to examine the environmental consequences of biofuel development and avoid unsustainable practices.
Increased investment in overall agricultural productivity will help smallholders to increase their own food production and to be able to engage in the biofuel market. It may even be possible for farmers to leap-frog to second generation cellulosic biofuel technologies, creating energy and emission efficiency gains.
Global cooperation is needed on R&D to bring technologies on line that will allow production of biofuels from non-food crops, thereby avoiding tradeoffs among food, feed, fiber and fuel uses of staple crops.
Participatory decision-making and cross-sectoral policy coordination should be institutionalized in the area of bioenergy. The clear allocation of the roles of duty-bearers and rights-holders may also increase government responsiveness, as well as accountability and transparency.
6.2 Mitigation of Negative Impacts of Biofuels Appropriate policies can make bioenergy development more pro-poor and environmentally sustainable. Poor farmers might be able to grow energy crops on degraded or marginal land not suitable for food production. Appropriate soil and fertilizer management practices will have to be tailored to soil type and climatic conditions, otherwise bioenergy production may aggravate land degradation, generate GHG emissions and cause environmental problems through soil erosion and degradation of water quality. Also, further investment is needed in developing technologies to convert cellulose to energy. This could provide developing country farmers, including smallholders, with a use for crop residues like stalks and leaves, which would be converted into ethanol for electricity, thereby benefiting both poor farmers with additional income and also poor consumers with cheaper energy. Smaller-scale and rural-based production will open up opportunities for biofuel to be pro-poor. Organizing groups of smallholders through contract farming schemes to grow and market biomass to processing plants may be most effective for this. In summary, even though India’s biofuel programme sufficiently addresses the larger concerns of food security, rural livelihood security, gender empowerment, etc., there are several aspects which need further attention and concerted involvement. This paper tries to elucidate issues as economic viability and long-term sustainability of sugarcane-based ethanol programme, commercial feasibility of Jatropha-based biodiesel, technological challenges constraining the development of a second generation biofuels industry, etc. Therefore, the immediate challenge before India is to bridge the existing gaps in the biofuel sector and to usher in a more consumer-friendly and market-oriented bio-energy revolution in the country which should be not only pro-poor but also environmentally sustainable.

74
To protect the poor and food- insecure people from adverse effects of the rapid growth of the biofuel sector there is a need to develop policies for food and fuel to be linked to safeguard food security, to assist those negatively impacted by climate change and the expansion of biofuels production and to raise awareness among policymakers to provide for integration of local, regional or international policies that affect the agricultural sector and the rural economy.
References
FAO (Food and Agriculture Organization) (2008) Biofuels: Prospects, risks and opportunities, The State of Food and Agriculture, Rome.
FAPRI (Food and Agricultural Policy Research Institute) (2010) World Biofuels: Agricultural Outlook, Iowa.
Licht, F. O. (2009) World Ethanol and Biofuels Report
GAIN Report (2011) Biofuels Policy Overview, Report No. IN 1159, USDA Foreign Agriculture Service.
GoI (Government of India) (2003) Report of the Committee on Development of Biofuels, Planning Commission, New Delhi.
GoI (Government of India) (2008) Agricultural Statistics at Glance. Ministry of Agriculture, New Delhi.
GoI (Government of India) (2009) National Policy on Biofuels. Ministry of New and Renewable Energy, New Delhi.
National Centre for Agricultural Economics and Policy Research (NCAER) Biofuels in India: Potential, Policy and Emerging Paradigms (Policy Paper 27)
Institute for Agriculture and Trade Policy – “Biofuels and Global Water Challenges”

75
Appendix E — Nepal
The Scope of Production and Use of Biofuels in Nepal
*Uttam Raj Timilsina9 *Bibek Kanta Neupane10
Abstract Developing countries are facing the problem of energy shortage. With growing demand and increasing prices of imported petroleum products, they are being compelled to shift towards the development and use of biofuels as supplementary energy sources. A major concern is that achieving energy security through increased biofuel development could intensify food insecurity in many developing countries. The impact would be greater on poorer countries, if edible food grains get converted into biofuels. Thus, proper attention should be given to promote use of non-edible feedstock such as Jatropha and others grown on uncultivable waste lands. Nepal is entirely dependent on imported fossil fuels. The current price of imported petroleum product is high relative to the current economic status of Nepal. Short supply and frequent price rise of petroleum products is leading to dissatisfaction. Moreover, transportation and distribution of petroleum products to remote and hilly areas impose additional costs. Consumption of diesel, kerosene, petrol, and aviation fuel was 67.1 %, 6.1%, 17.7% and 9.1% of total petroleum use respectively during the year 2009/10. Petroleum imports and consumption increased by 31.3 % during 2010/11, representing an annual cash payment equivalent to $US 900 million. Currently, the Government of Nepal, development partners and the private sector are showing interest in production and utilization of domestic biofuels. Considering the limited availability of arable lands and rapid population growth, available productive agricultural land cannot be diverted to the production of biofuels. Thus, large-scale production of crop-based bioethanol is not an option for Nepal. Lands normally not suitable for major food crops production could be helpful for non-edible feedstocks such as Jatropha, if produced commercially. However, the concept of biofuels is still new for Nepal. Large scale cultivation of Jatropha will need institutional support for sustainable production. It will definitely help to address the problem of energy scarcity as well as to reduce the external dependency of fossil fuels in the country. Moreover, it also contributes to some extent to boost the economy of the country by reducing the existing trends of imported petroleum products. Currently the production of Jatropha is in the pilot study phase. Approximately 12 000 hectares of uncultivated land has been used for Jatropha plantings in various parts of Nepal. Moreover, there is urgent need to bring riverside flood prone lands, flood damaged lands and deforested public lands into the intensive cultivation of Jatropha. Climatic conditions such as weather, annual precipitation, altitudes and soil characteristics for Jatropha cultivation are favorable in Nepal. However, further studies are needed to understand the issues related to development of Jatropha based biofuels in Nepal. The government strategy for energy plans, programs and implementation are almost entirely dependent upon external financial resources. The Government policy is not attracting private sector investment in commercial production of bio-energy using non-edible feedstock. Development partners may have an interest in the development of bio-fuels which can contribute to boost the economy of rural people and ultimately to contribute food security as well as meet the growing energy demand. Moreover, there is an urgent need of conceptual understanding among the
9 Deputy Director General for Irrigation Management at the Department of Irrigation and Member Secretary, NENCID (Email:
[email protected], [email protected]). 10 Program Coordinator for Sustainable Energy and Technology Management Pvt. Ltd. (SETM) (Email:

76
stakeholders for policy reformulation to build collaboration on irrigated agriculture, food security, and bio-energy development in Nepal.
1.0 Background Per capita energy consumption is often considered as an indicator of economic status and wellbeing of the people, society and country. Nepal’s per capita energy consumption at 15 Gigajoules is one of the lowest in the world. Almost 90 percent of the energy is consumed in the residential sector, which indicates that the consumption of energy in the production and commercial sector is meagerly low. Access to sustainable forms of energy is pre-requisite to social and economic transformation in the rural areas and to improve the quality of life of the people. This paper looks into the possibility of production and use of biofuels and their use as sustainable and alternative source of energy. Considering Nepal’s agro-climatic diversity, wide ranging plants suited to biofuel production have been identified for promotion in different agro-climatic zones. While production of biofuel is expected to enhance decentralized energy access and energy security at the local level and to provide a sustainable fuel source for wide ranging rural and urban applications, this will also lessen the ever increasing burden on the import of petroleum fuels. Since the production of biofuel will essentially be concentrated to the rural areas, this will create positive impetus for enhancement of the rural economy through increased employment and creation of alternative economic opportunities. Developing countries are continuing the uphill battle for economic growth and poverty reduction. At the same time, their struggle are also relating to serious energy crises and consistently increasing petroleum price. These countries are also expected to face higher consequences of climate change despite the fact their share in the consumption of petroleum fuel and emission rates of greenhouse gases is much lower. In Nepal, the new initiative of biofuel production concentrates on production of biodiesel as an alternative to petroleum fuel based. Jatropha curcas L., popularly called Jatropha has been identified as promising species for production of oil that can be used to substitute for diesel fuel upon some processing. Jatropha is receiving increased attention due to its specific characteristics of being drought resistant and its ability to grow on marginal lands. This plant is found widely in semi-domesticated form in tropical and subtropical areas of the country but its exploitation has not been made on a commercial scale. The key advantages associated to promotion of Jatropha is that it is easy to establish, grows quickly, requires little care and will grow even in poor soils (except waterlogged areas). Seeds of Jatropha are crushed to extract oil which can be processed to prepare fuel that can be used to power a diesel engine. Considering the predominantly agrarian economy of the country and large tracts of marginal lands, promotion of Jatropha fits into the agro-climatic environment. Combining the cultivation of Jatropha with the environmental considerations, the scope of biofuel production becomes still broader. In addition, considering Nepal’s ever increasing petroleum budget and huge amount of foreign currency going towards import of petroleum fuels, promotion under biofuel production create added economic benefit. The Government of Nepal started a biofuel program, Jaibik Indhan Karyakram, beginning in the 2009/10 fiscal year with the allocation of $US 0.625 million. In the program Jatropha was selected as potential plant for the production of oil for biodiesel processing. In fiscal year 2010/2011, $US 0.028 million was allocated to the program for production, processing and promotional activities. The focus of the National Bio-fuel Program is the promotion of Jatropha curcas by implementing various activities such as training and capacity building, establishment of a Jatropha nursery and germplasm garden, installation of transesterification units, and development of promotional materials. The program is supported by the Alternative Energy Promotion Centre (AEPC), the government agency entrusted with the responsibility of promoting of appropriate alternative energy technologies in the country. A number of entrepreneurs have made investments in the processing

77
of Jatropha-based biodiesel production due to the emphases of the government and to economic opportunities in the production and processing of biodiesel. A number of demonstrations on Jatropha cultivation and use of extracts have been made in different parts of the country, which are successful to some extent, for increasing awareness on the potential of Jatropha as an alternate source of renewable fuel. Some of the companies established at present include Everest Bio-Diesel, High Himalayan Agro Nepal and Crystal Bio-Energy Nepal (which also invested in establishing commercial scale farms for Jatropha cultivation).
2.0 Objective Within the established opportunity and potential for production of biodiesel in the country stated above, this study was undertaken with three-fold objectives:
(a) To analyze the scope of biofuels in a developing country, (b) To assess the consumption and trend of modern energy options, and (c) To suggest policy measures for biofuel promotion in the country.
3.0 Methodology In the framework of the study objectives, this study involved analysis of secondary data from different sources and other pertinent information. The key focus of the study has been on identifying the areas of policy reform that will create a supporting environment for the promotion of biofuel in the country.
4.0 General Scenario of Land Use The distribution of land use in the country is shown in Table 1. The area under forest is 5.828 million hectares (ha) followed by arable land which covers 4.121 million ha. Arable land further can be divided into cultivated land areas (edible crops production) and potential but not cultivated land which covers 3.091 million ha and 1.03 million ha respectively. Land area in pasture, wetland and other land uses are 1.766 million ha, 0.383 million ha and 2.62 million ha respectively.
Table 1. Occupied land area pattern
Land Classification Million hectares
Cultivated land Areas (Edible crops) 3.091
Possible arable land (Non cultivated land) 1.03
Subtotal Arable Land Areas 4.121
Forest land Areas 5.828
Pastureland Areas 1.766
Wetland 0.383
Others 2.62
Total land area 14.718
*Data source: Agriculture Information and communication Centre, Agriculture Diary 2012
The landlocked country Nepal is categorized in three ecological regions: High Mountain and Himalayas, Mountains and low hills and Plain areas of the Terai Region (Figure 1). The Terai region has good potential for year round crop production wherever irrigation is available. Therefore, Terai is considered the food basket of the country. Similarly, the mountain region is suitable for livestock farming where large pasturelands can be seen. Compared to Terai, a large part of the
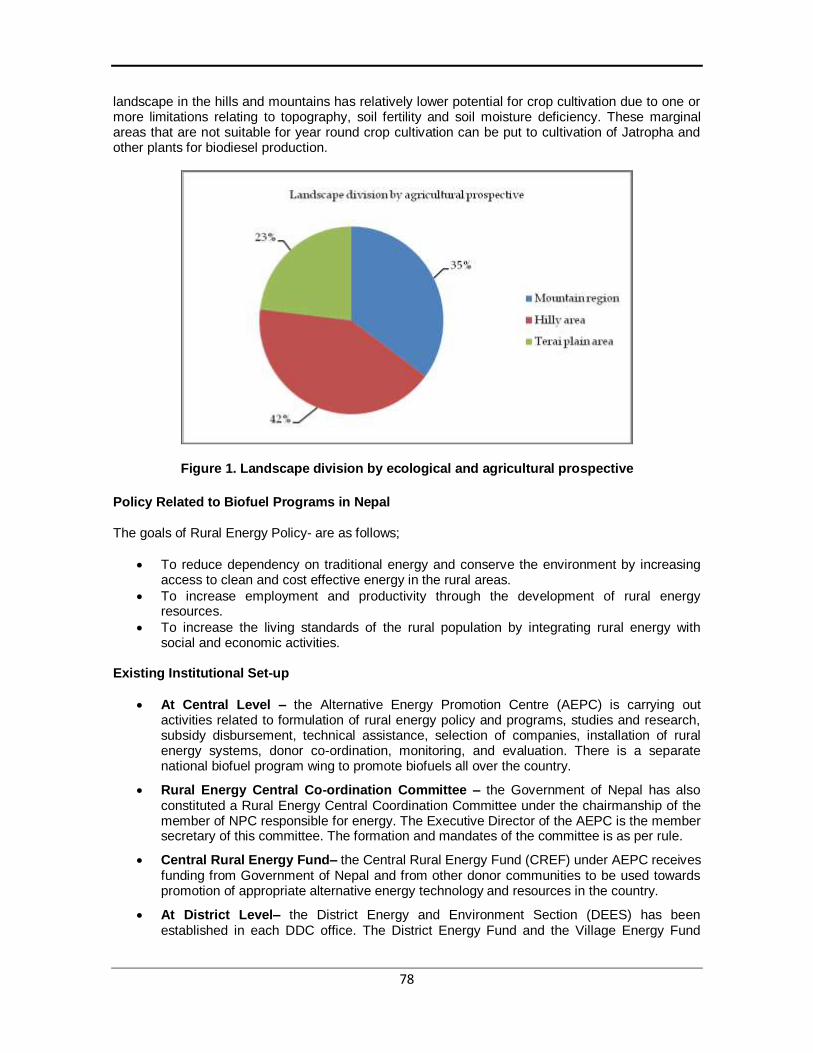
78
landscape in the hills and mountains has relatively lower potential for crop cultivation due to one or more limitations relating to topography, soil fertility and soil moisture deficiency. These marginal areas that are not suitable for year round crop cultivation can be put to cultivation of Jatropha and other plants for biodiesel production.
Figure 1. Landscape division by ecological and agricultural prospective
Policy Related to Biofuel Programs in Nepal The goals of Rural Energy Policy- are as follows;
To reduce dependency on traditional energy and conserve the environment by increasing access to clean and cost effective energy in the rural areas.
To increase employment and productivity through the development of rural energy resources.
To increase the living standards of the rural population by integrating rural energy with social and economic activities.
Existing Institutional Set-up
At Central Level – the Alternative Energy Promotion Centre (AEPC) is carrying out activities related to formulation of rural energy policy and programs, studies and research, subsidy disbursement, technical assistance, selection of companies, installation of rural energy systems, donor co-ordination, monitoring, and evaluation. There is a separate national biofuel program wing to promote biofuels all over the country.
Rural Energy Central Co-ordination Committee – the Government of Nepal has also constituted a Rural Energy Central Coordination Committee under the chairmanship of the member of NPC responsible for energy. The Executive Director of the AEPC is the member secretary of this committee. The formation and mandates of the committee is as per rule.
Central Rural Energy Fund– the Central Rural Energy Fund (CREF) under AEPC receives funding from Government of Nepal and from other donor communities to be used towards promotion of appropriate alternative energy technology and resources in the country.
At District Level– the District Energy and Environment Section (DEES) has been established in each DDC office. The District Energy Fund and the Village Energy Fund

79
have also been established to promote and expand rural energy availability at the district and village levels.
5.0 Nepal has Potential for Jatropha Production Development of commercial bio-fuel has a great potential in Nepal. This can reduce dependency on imported petroleum products. Many species of Jatropha found in Nepal have sufficient fatty acid content to convert them into bio-diesel. Although it has been found that Jatropha can be grown on barren and waste lands where production of other corps is not possible, for high yield the following factors are important:
Climate: Terai and Siwalik range have tropical and subtropical climates which are favorable for the growth and development of Jatropha.
Rainfall: Although Jatropha is a drought resistant plant, it requires at least 1200 mm annual rainfall for high yield. Average annual rainfall in Nepal is 1500 mm to 2500 mm.
Elevation of land: Most of the lands in Terai regions are between 60 m and l000 m altitude. This altitude is favorable for Jatropha cultivation.
Availability of technical manpower and farm labor: There is large pool of technical personnel trained in agriculture, forestry and natural resources management who can be effectively engaged in the promotional programs relating to biofuels. There are sufficient laborers who can be effectively engaged in the production and processing activities. This will help increase employment opportunities at the local level.
Market: Nepal imports its entire petroleum needs. Given the established potential of biodiesel as an alternative to petroleum fuel, there will be a huge established market for bio-diesel within the country.
6.0 The Controversy and the Future of a Biofuels Program Around the globe biofuels have created a stir. The prices of maize and wheat have increased at an alarming rate as they are being used to extract ethanol, the alcohol used for motor fuel. The cars are guzzling away the food that we eat, making us more vulnerable to hunger. The rich people are able to purchase the ethanol but the poor are facing the high rise in their prices. Jatropha cultivation has provided a solution to this war for food between cars and people which is also in a way a contest between the developed and the developing world. There is an immense potential for commercial production of biofuels in Nepal. Around 30% of the land area in the country are marginal lands potentially unsuitable for cultivation of food crops but favorable for the cultivation of Jatropha. Apart from Jatropha, there are many other non-edible oilseeds that can be cultivated on the wastelands for production of biodiesel. It is anticipated that 10% of the area that is favorable for cultivation of Jatropha could produce enough biodiesel to substantially substitute for fossil diesel use in the country. While production and promotion of Jatropha appears to be an acceptable option for energy self-reliance, there are associated controversies concerning the consequences to food security and the environment in the long term. The controversy relating to consequences of Jatropha cultivation on food security emerges essentially from the experience from the developed world where commercial viability and policy incentives attracted commercial growers to put large tracts of agricultural land into production of biofuels and also to use food crops for production of biodiesel. There are also controversies relating to possibilities for the long-term storage of biodiesel and its blends. The possibility of long term storage needs further research.

80
7.0 Consumption Trends of Commercial Energy Options In Nepal, more than 90% of the energy supply originates from traditional sources, such as wood, agricultural residue and animal wastes. Less than one third of the rural population has access to electricity. The commercial sources of energy such as petroleum, coal and electricity are used mainly for the industrial, transport and domestic sectors with negligible use in the agricultural sector. This is because agriculture in Nepal is still highly labor intensive with little mechanization. Collection of firewood has been the main cause of deforestation. Air pollution is a serious concern in urban areas due essentially to vehicular pollution. The transport sector is the largest contributor to total emissions of pollutants in urban areas followed by emissions from households, industries and commercial activities. Nepal is dependent upon imported petroleum fuel from India. The consumption trend of fossil petroleum fuel in the country for past two years shows a sharp increase in the import and sale of all kinds of fossil fuels (Table 2).
Table 2. Supply and distribution (Import and sales)
Fiscal Year Petrol Diesel Kerosene Jet Fuel Light Diesel
Furnace Oil
LPG (MT)
2010/2011 188082 652764 43399 99990 228 1434 159286
2009/2010 162902 608065 52714 82824 240 2612 141171
Fiscal Year Petrol Diesel Kerosene Jet Fuel Light Diesel
Furnace Oil
LPG (MT)
2010/2011 187641 655128 49495 101314 227 1415 159286
2009/2010 162275 612505 55788 82631 238 2589 141171
Source: www.nepaloil.com.np
The price rise for petroleum fuel has been another area of concern in Nepal and in other developing counties. The Government of Nepal has been providing subsidies to Nepal Oil Corporation to maintain the price of petroleum fuels in the country. Under a deregulation policy, the government has come up with a price adjustment mechanism based on the changes in the price of the fuel in the international market. Despite this adjustment, the subsidies for the fuels essential for household use, such as kerosene and LPG, have been continued, which is estimated to cost an average of US$ 19.5 million monthly.
8.0 Cost and Returns from Jatropha Cultivation Estimated costs and returns from the Jatropha cultivation in Nepal are difficult to analyze considering that commercial production of Jatropha and large scale use of biodiesel is yet to be tested. There will also be streams of non-tangible costs and benefits of Jatropha cultivation emerging from primary, secondary and tertiary chains of production, processing and marketing of Jatropha. Jatropha is highly resistant to drought, thrives in arid areas, and requires as little as thirty liters of water a month during the non-rainy season. Animals do not eat this plant and thus it is safe from them. The plant produces oil-bearing seeds within six months of planting and can last over thirty years without replacement when managed properly. Cultivation of plants around field boundaries boosts crop yields by pre-empting browsing livestock. Its root system and leaf-shed improve soil stability and quality. Its seeds contain thirty per cent or more oil, which can be easily expelled and extracted. By-product residues would then be available to boost crop yields and at the same time reduce the consumption of costly and imported chemical alternatives.

81
Leaving aside the uncertainties in the costs and benefits of Jatropha cultivation for biodiesel production in the country, the expected outputs from Jatropha cultivation in the present context are expected to be:
A lessening of the energy crisis in Nepal, at least in the rural areas, which will also lessen to some extent the expenditure towards petroleum imports,
Increased investment in biofuel production and processing, creating opportunities for employment and income diversification in the rural areas, and
Environment protection and biodiversity conservation, especially in the watershed areas that are degraded due to continued natural and anthropogenic forces.
At the national level, promotion of biofuels will create opportunities for new industries and technology, additional employment and commercial activities. Environmental benefits resulting from the promotion of Jatropha and other biofuel plants will have long and enduring impacts in the correction and restoration of degraded watersheds in terms of improvement in soil fertility; increase in water yield and in arresting the process of erosion and land degradation. Utilization of plant oil to meet the energy demand in the rural areas would help conserve the forest area in the country. Jatropha has potential for use as bio-fence; hence cultivation of Jatropha around the field boundaries would protect the valuable crops from browsing livestock and improve the micro-climate for crop production. Continued efforts are however required to build awareness of the people, entrepreneurs and others stakeholders on the benefits of production of biofuels. The biofuel projects underway in the country, which rely on private-sector participation, need to be supported to demonstrate the potential for future expansion. Some of the barriers relating to promotion of biofuels in the country are identified in Table 3. These are social, economic, technical and institutional in nature. Addressing these barriers would mean increasing incentive for investments in production, processing and commercial activities relating to biofuels.
Table 3. Barriers in the Promotion of Biofuels in Nepal
Barrier Type Reasons
Institutional Limited institutional capacity for research and development, demonstration, and implementation
Market Lack of marketing systems; limited access to markets; infrastructure and services
Awareness Information Lack of awareness and access to information on biofuels
Financial Inadequate financing arrangements for production, processing and marketing of biodiesel
Economic Unfavorable cost; poverty; price imbalances
Technical Lack of access to technology; inadequate maintenance capacity
Capacity Lack of skilled human resource and training facilities
Social No grass root participation by local people
Environment No proper valuation of environmental costs and benefits
Policy Lack of proper co-ordination between public and market regulatory mechanisms

82
9.0 Recommendations on Policy Measures Nepal has yet to formulate a biofuel policy, however the government has initiated a biofuel program which has created impetus for biofuel promotion in the country. The efforts of the government have succeeded in attracting the involvement of a small number of producers and entrepreneurs in Jatropha cultivation in different parts of the country. There are strong needs to create an environment that would create a multiplier effect in the promotion of Jatropha and other biofuels. Some of the policy interventions suggested based on the findings of this study for promotion of Jatropha as a biofuel are: 1. Formulation of a Biofuels Board
To coordinate policies amongst different government agencies,
To promote public debate instead of closed-door policy formulation, and
To evaluate and approve large-scale production proposals under a public-private partnership model.
2. A Pro Food Security Approach
To transfer or convert marginal and wasteland for growing energy crops, keeping aside the prime agricultural land for diversified food crop production, and
To support local level government entities (VDCs, DDCs) in updating land use information and in regulating land use for production of Jatropha.
3. Community Based Biofuel Production
To involve small holders and landless farmers in cooperative farming,
To mobilize local level government entities in the monitoring process, and
To identify endemic non-edible oil crops suited to biofuel production. 4. Private Investment
To encourage the private sector to invest in the production and processing of Jatropha and other biofuels through credit facilities and tax rebates for shared risk, and
To evaluate and approve projects through the proposed Biofuel Board. 4. Investing in Research and Development
To partner with universities, and research institutions at home and abroad to improve upon the processes and technology available for the production and processing of biofuels.
10.0 Concluding Remarks Biofuel feedstock (i.e. Jatropha spps.) cultivation in Nepal is a new concept; however there can be an integrated approach to create both income growth and a supply of bio-diesel for economic development. At the same time, producing more bio-fuels will reduce existing energy expenditures and allow developing countries to put more of their resources into health, education and other basic needs services. For the full potential development of bio-fuels, without creating new development stress, the promotion of bio-fuels production needs to be carefully planned and implemented in a sustainable manner.

83
The promotion and dissemination of Jatropha cultivation in wastelands, marginal, and abandoned riparian land to produce biodiesel feedstock and to support poverty reduction provides opportunity for rural development through poverty reduction in rural areas. We are heavily dependent on fossil fuel; the fluctuation in fuel price is one of the greatest problems to the Nepalese economy. Considering aspects like climate change, fossil fuel reserve depletion, and fuel politics for economic enhancement, Nepal needs to enter into the age of bio-fuel. Reduced dependency on imported fuel simultaneously means saving foreign exchange, overcoming losses, creating opportunities for employment and rural development and last, but not least, reducing carbon emissions. Clean, available fuel impacts positively on health and drudgery and ultimately on economic productivity. The cultivation of Jatropha also supports the conservation of degraded lands and use of abandoned landslide areas.
References
1. ISRC, 2008. Village Development Committee Profile of Nepal, A Socio-Economic Development Database of Nepal. Intensive Study & Research Centre.
2. ISRSC, 2004. District Development Profile of Nepal, 2004. Informal Sector Research & Study Centre.
3. Nawa Raj Dhakal, Senior Training Officer (AEPC), 2008. Government Policy and Programme on Biofuel in Nepal Report.
4. Neupane B.K., 2010. Possibility of Commercial Jatropha Farming to Reduce the Rural Poverty and Fuel Dependency in Nepal. A thesis prepared for partial fulfillment of M. A. in Rural Development, Tribhuvan University, Nepal.
5. Parajuli. R., 2009. Feasibility Study on the Use of Jatropha Oil for Pumping Drinking Water in Khadaulibazar Village of Doti District Nepal. A thesis prepared for partial fulfillment of M. Sc. in Renewable Energy Engineering, Institute of Engineering.
6. www.aepc.gov.np
7. www.nepaloil.com.np
8. www.winrock.org.np


85
Appendix F-South Africa
Biofuels Situation in South Africa –
Input to ICID TF Position Paper on Biofuels
A.J. Sanewe11, A S Roux12, G Jewitt13, R Kunz14
Abstract South Africa is a water stressed country that is generally characterized by low rainfall and high evapotranspiration. The average annual rainfall is considerably below the world average and ranges from less than 200 mm p.a. in some areas in the West of the country to greater than 800 mm p.a. in the East. The country generally has limited crop production potential with only about 16% (17 million ha) of land being arable. Although primary agriculture only contributes 2-3% to South Africa’s GDP and 8.5% to formal employment, agriculture has a significant indirect role in the country’s economy through forward and backward linkages. Biofuel production is an agricultural crop which the national strategy argues can have significant job creation benefits: The Department of Trade and Industry’s Industrial Policy Action Plan suggests 125 000 direct jobs could be created should a 10% blending target be set. The rural landscape is typified by high levels of poverty with approximately 70% of the country’s poor residing in these areas and a significant proportion of the total population experiencing food insecurity. Hence, as with other developing countries, food security at the household, community, regional and national level is of paramount importance. The global debate on the potential negative impact of biofuels on food security informed the development of the Biofuels Industrial Strategy of South Africa in 2007. The goal of the 5 year strategy is a 2% biofuel penetration (400 million litres annually by 2013). The strategy identified sugarcane and sugar beet for bio-ethanol production and soya beans, sunflower and canola (rapeseed) for biodiesel production. Recent studies indicate that grain sorghum, especially the faster growing sweet sorghum variety with a shorter growing season, is an alternative that can be used in combination with sugar beet, which can only be grown in winter due to our hot summers. The primary focus of the strategy is rural development and opportunities for the poor as well as job creation, therefore under-utilized land in specific production (former homeland) areas have been targeted. Although the strategy does not exclude irrigated crops, it does recognize that the country’s water resources will be severely impacted if there is widespread irrigation. It also acknowledges that irrigated cropping for biofuels will have to compete with other uses for the scarce resource. However, since the development of the biofuels strategy, the Department of Water Affairs has effectively issued a moratorium on irrigated crops for biofuel production. A recently completed Water Research Commission study on the water use of crops/trees for biofuels in South Africa mapped potential growing areas for crops identified in the Biofuels Industrial Strategy (BIS). The optimal growing areas for these crops, under dry land conditions, are mainly in the eastern and northern regions of the country. The study investigated the potential impact of producing these crops on water resources. With the exception of sugarcane, the study found that production of rain fed biofuel crops is unlikely to negatively impact on water resources. A second ongoing study seeks to strengthen assumptions made in this desktop study through field trials, where the water use and productivity of crops with good biofuel feedstock potential are monitored and more detailed modeling will be undertaken. To date, the project has highlighted the risks associated with production of some of the crops named in the BIS, in particular sugar beet, which trials have shown to be low yielding and disease prone in South Africa’s warm climate.
11 Research Manager1, Water Research Commission, Pretoria, South Africa (E-mail : [email protected])
12 Director2, Western Cape Department of Agriculture, Stellenbosch, South Africa (E-mail: [email protected])
13 Professor, University of KwaZulu Natal, Pietermaritzburg, South Africa (E-mail : [email protected]) 14 Lecturer, University of KwaZulu Natal, Pietermaritzburg, South Africa (E-mail : [email protected])

86
Significant challenges face the emerging biofuel industry with regard to natural, social, human, physical and financial capital. Effective co-operative governance among the various role players will be essential in ensuring a successful industry. Although the current biofuels strategy only supports the use of first generation feedstock and proven commercial processes, it encourages research on alternative feedstock and the development of second and third generation technologies. Key words: Biofuels, Crop production, Water use, South Africa
1.0 Context and Background South Africa is a water stressed country that generally experiences low, unreliable and insufficient rainfall and high evapotranspiration. The average annual rainfall of 465 mm is well below the world average of 857 mm p.a. (Mwenge et al., 2008). The rainfall ranges from less than 200 mm in some areas in the West of the country to greater than 800 mm in the East. Much of the country consists of grasslands, woodlands and shrubs with less than 20% of land being arable. Until 2006, South Africa was a net exporter of agricultural products. Primary agriculture accounts for 2-3% of GDP and 8.5% of formal employment, however the agricultural sector generally contributes 20-30% to the country’s economy through forward and backward linkages (Vink and Van Rooyen, 2009; Water Research Commission, 2010). Despite its status as a middle income country, South Africa has extremely high levels of absolute poverty. A large proportion of households are food insecure with one survey finding that 52% of 13.7 million households experience hunger and a further 33% are at risk (Hart, 2009; Labadarios et al., 2008). Food security and poverty alleviation are priorities at national, provincial and local levels. However, Government at all levels faces challenges in implementing food security programmes (Hart, 2009). The prime cause of the household food insecurity problem can be attributed to chronic poverty and unemployment (Altman et al., 2009; HRSC, 2007).
2.0 Particularities of Water, Bio-energy and Food security Nexus The main reason for producing biofuel and bioenergy feedstocks is to produce fuel on a sustainable basis. However, one of the critical components in their production is feedstock water use. In South Africa, water availability is deemed more limiting to feedstock production potential than land availability. High yielding crops thus cannot be planted in areas with limited water resources. Feedstocks can however be planted in marginal environments where rainfall is limited and irrigation of feedstocks are not viable nor permitted. Some feedstocks may utilise more water than the natural vegetation and may therefore be declared a stream flow reduction activity in terms of the Water Act (Act 36 of 1998). Irrigated energy crops are unlikely to compete economically with high-value irrigated food crops such as fruit and vegetables but may be able to compete with low-value crops such as small grains. The production of irrigated feedstocks for biofuels and bioenergy can therefore have a negative impact on food security and are not recommended by the Department of Water Affairs. Agriculture has been viewed as one avenue to improve rural development and enhance rural livelihoods (Machete, 2004). South Africa has a dual agricultural economy consisting of a highly developed commercial farming sector as well as a resource-poor subsistence farming community. Most of the potential arable land of 17 million ha in South Africa is utilised for large-scale commercial rainfed crop production with commercial irrigated agriculture on 1.6 million ha. Smallholder crop production (mainly practiced by black farmers), which accounts for 18% of the potential arable fields and 6% of the irrigated land, lags far behind the commercial sector. (Backeberg and Sanewe, 2010; Vink and Van Rooyen, 2009). In 2006, 1.3 million rural households (10% of the population) had access to land for farming, but farming was not the main source of income (Vink and Van Rooyen, 2009).

87
It has been suggested that the significant poverty rate among the black agricultural population indicates the failure of agriculture to pull people out of poverty and that agriculture could reduce rural poverty when farming is commercialised (Machete, 2004; Pauw, 2007). A successful smallholder farmer has been classified as one who is highly productive and participates in markets and earns sufficient cash income, particularly from agriculture to enjoy a lifestyle that is free from poverty (Van Averbeke and Mohammed, 2006). The Land Redistribution for Agricultural Development (LRAD) programme was one of the ways in which Government sought to redress the imbalances of the past. LRAD was developed to provide the poor with land for residential and productive uses to improve their income and quality of life. The programme planned to improve nutrition and incomes of the rural poor who want to farm on any scale and to empower beneficiaries to improve their economic and social well being (DoA, 2001). Unfortunately, the LRAD programme has not achieved its desired outcome and in most cases the programme has failed (Vink and Van Rooyen, 2009; FAO, 2009). The Food and Agriculture Organization of the United Nations (FAO, 2009) report cites possible reasons for the widespread failure of the land reform projects including, amongst others, inadequate business plans, limited experience in commercial farming and financial management, and insufficient access to advisory services. Most rural households rely on government support through pensions and social grants as well as remittances (Van Averbeke, 2008).
3.0 Bio-energy Production According to the Department of Minerals and Energy (now Department of Energy), the production of biofuels can contribute to the objectives of land reform and restitution programmes by providing sustainable market access for farmers who benefit from these programmes (DME, 2007). The Biofuel Industrial Strategy of the Republic of South Africa, with its target of 2% biofuel penetration within five years, was primarily developed to address issues of poverty and economic development. Like many countries in Africa, developing a biofuels sector is seen as an opportunity to promote rural development, create jobs and provide opportunities to the poor (FAO, 2008). Its aim is to bridge the gap between the developed commercial farming sector and the resource-poor farming sector (historically disadvantaged under the previous government). It looks at creating commercial agricultural areas and providing firm opportunities for new and emerging farmers in the former homeland areas (DME, 2007). The majority of black, mostly subsistence, farmers are in the former homeland areas (Figure 1) (Altman et al., 2009). The biofuel strategy identifies 3 million ha of under-utilised high potential land in the former homeland areas that can be used to grow crops for biofuel production although other reports suggest that 2 million ha is arable and 50% of this land is of moderate to high potential (Van Zyl and Van Rooyen, 1991; Botha and De Lange, 2005). One prospective area for development in the former homelands area is the Mzimvubu Economic Development Zone in the Eastern Cape which has a potential dryland crop production area of 500 000 ha. Most of this land, situated in rural areas plagued by poverty, unemployment, poor infrastructure and reliance on social welfare grants, has not been cultivated in the last 20 years (AsgiSA Eastern Cape, 2009). The South African Government is of the view that almost all the previous productive land in the former homelands can be brought into full production once a firm market has been secured (DME, 2007). Consideration of certain feedstocks, currently excluded from the biofuel strategy, will only be entertained once certainty on the ability of the currently under-utilised land to produce has been ascertained.
4.0 Issues and concerns As a result of the global debate on the potential negative impact of biofuels on food security, specific crops i.e. soya beans, canola and sunflower for biodiesel and sugarcane and sugar beet for bioethanol production were chosen. Staple food crops i.e. wheat and maize were excluded in the initial phase of development. The inclusion of alternative feed stocks, such as Jatropha curcas, was

88
also suspended pending further research. The strategy emphasizes that support will only be provided for proven commercial processes, i.e. first generation technologies.
Figure 1. Former homeland areas and commercial and subsistence crop production areas in
South Africa (Source: Department of Minerals and Energy, 2009) Of the two crops mentioned in the biofuel strategy for bioethanol production farmers, both commercial and small-scale, are more familiar with sugarcane. Sugarcane is widely grown in the eastern regions of the country mainly in Mpumalanga and KwaZulu-Natal provinces. Production is mostly by commercial growers with small-scale farmers accounting for about 16% of the total area under production and about 0.1% of the total cane produced (Table 1). Very little sugarcane is currently grown in the former homeland areas under irrigation or dry land conditions. Almost all of the current sugarcane industry’s production area falls outside the former homeland areas and therefore would not be supported by the biofuel strategy (Funke et al., 2009). However, knowledge about best management practices and advisory services for sugarcane growers is available within the country through the South African Cane Growers’ Association and other organisations. On the other hand very little sugar beet is currently produced commercially in South Africa. Little local knowledge (with the exception of a few commercial farmers and researchers) is available on the production of sugar beet in South Africa and advisory services have limited experience in growing the crop.
5.0 Impact Assessment On the whole field crop production in South Africa declined by 19% between 1991 and 2007 whilst the population growth increased by 32% during the same period (NAMC, 2007). South Africa has not demonstrated a long term ability to produce oilseeds or substantially increase production to meet human and animal requirements (GAIN, 2009). Currently limited quantities of canola are produced in the winter rainfall areas of the Western Cape, with very little production elsewhere in the country (Table 1). No change in production is projected in the medium to long term (BFAP, 2010). In contrast, the area under soyabeans increased from 165 400 ha and that of sunflower

89
increased from 564 300 ha in 2007/08 (Table 1) (DAFF, 2008). Some reports indicate that South Africa will be a net exporter of sunflower and soyabeans in the foreseeable future (BFAP, 2010). The potential summer rainfall areas for soyabeans and sunflower production are in the eastern regions of the country with sunflower having the largest potential growing area (Jewitt et al., 2009). Similarly, the potential growing area for dryland production of sugarcane is the eastern parts of the country and that of sugarbeet (with a much larger potential growing area) is the eastern and northern parts of the country. Although all the crops identified in the biofuel strategy can be produced in certain areas of the preferred regions (former homeland areas), very little production of these crops currently takes place. All three feedstocks in the biofuel strategy for biodiesel production are mainly produced by commercial farmers. It is estimated that South Africa will need at least 307 375 ha of land for crop production to meet its 2% biofuel penetration target (Von Maltitz and Brent, 2008). Table 1. Area planted and tonnes produced in 2008/09 season of soyabeans, sunflower and sugarcane and area planted and tonnes of canola produced for the 2009 production season.
Crop Tonnes Hectares
Soyabeans1 516, 000 237,750
Canola2 40,350 35,060
Sunflower1 801,000 635,800
Sugarbeet* Neg Neg
Sugarcane – Smallholder3 1 727 185 68 357
Sugarcane – Commercial3 15 835 159 311 947
Source: 1. DAFF, 2010a; 2. DAFF, 2010b; 3. South African Cane Growers’ Association, 2009; *Note: Production of sugarbeet in South Africa is negligible
A recently completed Water Research Commission scoping study mapped the potential growing areas of various crops for biofuel production in South Africa (Jewitt et al., 2009). The study showed that based on climatological drivers, the cultivation of canola, cassava, Jatropha curcas, soyabeans, sugarcane, sugarbeet, sunflower and sweet sorghum can be considered in suitable production areas. The scoping study also investigated the potential impact of dryland production of the crops on the country’s water resources. The National Water Act (1998) requires that any land use shown to have a significant impact on the country’s water resources should be declared a Stream Flow Reduction Activity (SFRA). The impact of land use change on water resources may be better assessed against the land use replaced; the impact will differ whether converting indigenous vegetation to croplands, intensifying production or using marginal or fertile land. The preliminary investigation on water use of crops for biofuels estimated the water use of various crops, using the ACRU Agrohydrological Modelling System (Schulze, 1995), relative to the natural baseline vegetation (Jewitt et al., 2009). The classification used for the natural baseline vegetation was the Acocks Veld Types (1988). The dominant Acocks Veld Types in the eastern region of the country is the Temperate, Transitional Forest and Shrub, the Pure Grassveld and False Grassveld (Acocks, 1988). The study, based on climatological factors only, found that with the exception of sugarcane dryland production of soyabeans, canola, sunflower and sugarbeet would potentially use less water than the dominant Acocks Veld Type and is therefore unlikely to negatively impact on the country’s water resources (Table 2). Sugarcane is currently considered a ‘candidate crop’ for SFRA. (Jewitt et al., 2009).

90
Table 2. Median annual streamflow reduction (water use) of crop relative to that of the dominant Acocks Veld Type
Biofuel Crop (feedstock) % Reduction
Biodiesel
Soyabeans ˂ -60 to ˃ -20
Canola ˂ -140 to ˃ -50
Sunflower ˂ -70 to ˃ -15
Bioethanol Sugarbeet ˂ -110 to ˃ -40
Sugarcane ˂ -10 to ˃ 50
Source: Jewitt et al., 2009
Although the biofuel strategy does not specifically exclude irrigated crop production, it does recognize that the country’s water resources will be severely impacted if there is widespread irrigation and that irrigated cropping for biofuels will have to compete with other uses for scarce water resources. In its report on “Biofuels: Prospects, risks and opportunities”, the FAO (2008) cautions that the irrigated production of biofuel feedstocks can have a great impact on local water resources balances, particularly in water stressed areas. This is the view of the Department of Water Affairs, who subsequent to the development of the biofuel strategy, issued official notification to the Department of Energy of its firm disapproval of any biofuel production from irrigated feedstock in the light of the country’s limited water resources. Despite this concern a joint venture between the Industrial Development Corporation (IDC), the Central Energy Fund (CEF) and the Agrarian Research Development Agency (ARDA) has established a project to irrigate large areas of land for sugarbeet production in the Eastern Cape province. This collaboration with the Department of Rural Development and Land Reform (DRDLR) will result in sugarbeet being grown along the Fish River as feedstock for a bioethanol plant with a yearly capacity of 90 million liters. Over the past few months several farms in the province have been sold to the Department for the project (Farmer’s Weekly, 2010).
6.0 Identified Risks The Biofuel Industrial Strategy of South Africa has noble objectives with regard to poverty alleviation and rural development. However, the country faces significant challenges with regard to natural, social, human, physical and financial capital in implementing the strategy and establishing a sustainable biofuel industry. 6.1 Natural capital Although the Water Research Commission study on the impact of crop production for biofuels on water resources indicates that dryland production of four of the five crops in the biofuel strategy will not be significant, its potential impact on biodiversity has raised concern. In a paper prepared for the Department of Environmental Affairs and Tourism (now Department of Environmental Affairs), it is reported that greater areas of productive land are likely to be required to grow bioenergy crops and therefore land currently supporting biodiversity may be converted to monoculture crops. Moreover, converting previously natural lands will disrupt ecosystem services ultimately impacting on the livelihoods of rural populations and biodiversity (Haywood, 2008). The potential negative impact of land use change on the environment has been widely reported (FAO, 2008; Von Maltitz and Brent, 2008; OFID, 2009). Best management practices with regard to soil and water management, pest and disease control whilst adapting to climate variability and climate change will be critical.

91
6.2 Human Capital The biofuel strategy primarily seeks to empower previously disadvantaged black farmers and provide a market for their produce. The focus is on supporting emerging (commercial) farmers and not subsistence farmers. Sustainable production and harvesting of the crops mentioned in the strategy is critical in ensuring that planned biofuel processing plants have a constant supply of feedstock and are therefore economically viable in the long term. The challenges confronting smallholder crop production in South Africa were reported by Fanadzo et al. (2010) who observed the lack of technical skills among smallholder irrigation farmers in the Eastern Cape on aspects such as basic agronomic practices and water management. In its report on establishing emerging farmers in South Africa, compiled by local researchers, the FAO (2009) suggested that successful emerging farmers tend to have previous personal experience in small-scale commercial agriculture as managers and decision-makers or had relied mainly on small-scale agriculture for their livelihood. It further points out that South Africa largely lacks this type of farmer. It suggests that the general absence of peasant tradition among contemporary black people in the country is an important constraint to achieving a class of new small-scale black commercial farmers (FAO, 2009). Developing human capital will therefore be important in ensuring that farmers are able to produce good crops. Training and skills development for farmers as well as equipping advisory services i.e. extension services should be central to implementing the biofuel strategy. Fanadzo et al. (2010) recommend that farmers attend ‘back to basics’ training programmes in the areas of crop and water management. The biofuel strategy duly acknowledges that Government needs to ensure the training and capacity building of previously disadvantaged communities and emerging entrepreneurs. However, it is important that government initiatives to reduce poverty through smallholder agricultural development focus on those that are interested and/or have the capacity to farm successfully. Diverse strategies will need to be developed to ensure that specific farming areas, in the former homeland areas, are assisted to reach their agricultural potential (Machete, 2004). 6.3 Social capital The biofuel strategy suggests that emerging farmers could organize themselves into co-operatives to maximize benefits and access to markets; the strategy also envisages contracts between farmer co-operatives and individual biofuel producers. However, the primary cause for many difficulties experienced in many collective projects is inadequacies in formulating the rights (and obligations) of individuals and the lack of attention to clearly defined arrangements governing individual economic incentives (FAO, 2009). Another limitation to smallholder crop production for biofuels in the former homeland areas of South Africa is the land tenure arrangements that do not encourage commercial production; therefore developing and implementing effective land tenure policies is essential (Raswant et al., 2008). Despite having access to land resources in communal areas, and elsewhere, many communities experience poverty. If farmers have secure rights they will have the decision-making power and will be active participants in the productive use of the land (Backeberg, 2010). 6.4 Physical capital South Africa has no large-scale commercial bioethanol or biodiesel plant (GAIN, 2009). Only one license was issued to a manufacturer for commercial production of biofuels by the beginning of last year (DME, 2009). Several small-scale plants use waste vegetable oil as feedstock for biodiesel on farm whilst some large retail food stores use biodiesel from waste oil for their distribution vehicles. No significant changes are expected in the industry as biodiesel is relatively expensive to produce and better returns can be obtained by selling the vegetable oil into the human consumption market (BFAP, 2010). Several of the planned large-scale biofuel plants rely on the use of irrigated feedstock; irrigated sugarbeet for bioethanol production in the Eastern Cape has yet to receive the firm commitment of a significant number of the target group of farmers to produce the crop.

92
6.5 Financial capital Inadequate incentives and commitments stipulated in the biofuel strategy have been reported to be insufficient to create a sustainable biofuel industry (GAIN, 2009; Funke et al., 2009). The production of liquid biofuels in many countries is currently not considered economically viable without subsidies or incentives given the agricultural production and biofuel processing technologies and the comparative price of crude oil (FAO, 2009). Considerable upfront capital for infrastructure such as roads, rail and storage facilities are required in order to ensure production of crops for biofuels in the designated (homeland) areas. The cost of development of agricultural land is significantly more in the former homelands than in the developed commercial farming areas. It has been estimated that R4.7 billion (excluding roads and other related infrastructure) is required as initial investment to develop the 500 000 ha in the Mzimvubu Economic Development Zone in the Eastern Cape (AsgiSA Eastern Cape, 2009).
7.0 Mitigation of Risks Active Government support is clearly vital in developing a sustainable biofuel industry in South Africa (Funke et al., 2009; GAIN, 2009). An important consideration in establishing the emerging industry will be how the biofuel production system will differ from the food production system to make it possible for the biofuel system to re-energise and sustain farming in the targeted smallholder areas. Options may include developing a support system which ensures the provision of services, inputs and markets, resulting in the selected biofuel crops progressively becoming the crops of choice among existing and possible new smallholder farmers. It may require encouraging joint venture agreements (contract farming) where rural homesteads make available their natural resources (land, water) in return for cash income. Land will be cropped by companies, which offer jobs, skills development and training to local people. Co-operative governance involving several Government departments as well as other key role players such as the Industrial Development Corporation and the Central Energy Fund will be needed. Lessons learnt from the poor implementation of various well intended policies, strategies and programmes such as that for food security, land reform and water allocation reform will be valuable platforms on which to build a sustainable biofuel industry. Biofuels as a new and emerging industry requires extensive research (Von Maltitz and Brent, 2008). Research and development of second generation technologies could significantly enhance the future role of biofuels (FAO, 2008). Although the current biofuel strategy only supports the use of first generation technologies, it does encourage research and development in alternative feedstock and second generation technologies. Technical barriers to commercial production of biofuels from cellulosic feedstock currently limit the economic viability of adopting these technologies at present (OECD/IEA, 2008; OFID, 2009). However, if the Government’s long term primary focus of biofuel production in South Africa remains on job creation, rural development and creating opportunities for the poor, the development and use of second generation (and third generation) technologies will need to be aligned to national priorities. Little information is available, at present, on the large-scale cultivation of some alternative feedstocks. According to the FAO (2010), decisions about planting Jatropha curcas in countries in South Asia and Sub-Saharan Africa have been made without the backing of sufficient science-based knowledge. They recommend that research on various aspects of Jatropha curcas production including genetic improvement of varieties, and on cultivation practices such as water conservation and integrated pest and nutrient management is needed. The impact of planting Jatropha curcas on water resources was shown in a Water Research Commission study not to have negative effect on annual streamflow in South Africa, but its impact on biodiversity and its potential invasiveness remains in question (Holl et al., 2007). Invasive alien plants that are currently growing in the country have been suggested as possible feedstock for biofuels. Further research is currently being conducted by the Water Research Commission on the water use of crops and trees for biofuel production in selected bio-climatic zones in the country, following the initial scoping study.

93
The six year research project aims to investigate in more detail the water use of, amongst others, currently grown and potential alternative first (such as sugarbeet and sweet sorghum) and second generation crops and cropping systems including annual and perennial crops/trees.
8.0 Recommendation Based on the South African experience, the following recommendations are made towards the compilation of an ICID position paper on the production of biofuels and bioenergy feedstocks:
The rural population of South Africa, particularly in the former homeland areas, faces high levels of poverty and unemployment despite many communities having access to land and water for crop production. Much of the former homeland areas are suitable for dryland production of crops identified in the biofuels strategy, however very little productive activity takes place at present. The biofuel industrial strategy aims to improve rural development in previously neglected areas of the country and provide opportunities for smallholder (commercial) agricultural enterprises and employment.
Crop production, which saw a decline over a 16 year period, is mainly practiced by large-scale commercial farmers. South Africa has not been able to sustain the production of oilseeds to meet its human and animal needs over the long term. Major challenges face the development of a sustainable biofuel industry and the establishment of significant numbers of emerging farmers in the former homeland areas to provide sufficient feedstock for manufacturers to invest in, and maintain, biofuel plants.
Successful implementation of the biofuel strategy will require close inter-departmental relations and good co-operative governance. Government has a key role to play in creating an enabling environment for the emerging industry.
The provision of training and skills development in crop husbandry and water management, amongst others, coupled with improvement to the current land tenure arrangements is essential.
Further research on alternative feedstocks, their actual water requirements and biofuel processing technologies is required.
References
Acocks, J.P.H. 1988. Veld Types of South Africa. Memoirs of the Botanical Survey of South Africa 57: 1-146. Government Printer, Pretoria.
Altman, M., Hart, T.G.B., Jacobs, P.T. 2009. Household food security status in South Africa. Agrekon 48 (4): 345-361
AsgiSA Eastern Cape, 2009. Biofuels and food security. Paper presented on 17 March 2009 by Simpiwe Somdyala, Chief Executive Officer of AsgiSA Eastern Cape. Province of the Eastern Cape
Backeberg, G.R. 2010. Improving rural livelihoods with rainwater harvesting and conservation on communal croplands in South Africa: Opportunities and obstacles. In Behl, R.K., Merbach, W., Meliczek, H., Kaetsch, C. (Editors). Crop Science and Land Use for Food and Bio-energy. Agrobios (International), Jodhpur, India.
Backeberg, G.R. and Sanewe A.J. 2010. Towards productive water use and household food security in South Africa. Paper accepted for presentation at the 6th Asian Regional Conference of the International Commission on Irrigation and Drainage (ICID) to be held in Indonesia, 10-16 October 2010.
BFAP, 2010. The South African Agricultural Baseline 2010. Bureau for Food and Agricultural Policy (BFAP), South Africa.
Botha, M.E., De Lange, M. 2005. Revitalisation of smallholder rainfed and irrigated agriculture: A guide for farmer trainers and facilitators. Report No. TT 254/1-3/05, Water Research Commission, Pretoria.
DAFF, 2008. Commercial summer crops: calculated final area and crop production figures - 2007/08 production season. Crop Estimates Committee, 27 November 2008. Department of Agriculture, Forestry and Fisheries (DAFF), Pretoria

94
DAFF, 2010a. Summer crops: Area planted and fifth production forecast for 2009/10 production season. Crop Estimates Committee, 24 June 2010. Department of Agriculture, Forestry and Fisheries (DAFF), Pretoria
DAFF, 2010b. The final area planted and crop figures of winter crops for the 2009 production season. Crop Estimates Committee, 6 May 2010. Department of Agriculture, Forestry and Fisheries (DAFF), Pretoria
DME. 2007. Biofuels Industrial Strategy of the Republic of South Africa. Department of Minerals and Energy (DME). Pretoria.
DME, 2009. Biofuels Industry Development in South Africa. Department of Minerals and Energy (DME), Renewable Energy Directorate. Pretoria
DoA. 2001. Speech on land distribution in South Africa by Minister for Agriculture and Land Affairs, Ms Thoko Didiza, 8 August 2001. Department of Agriculture (DoA). Sandton Convention Centre, Johannesburg.
Fanadzo, M., Chiduza, C., Mnkeni, P.N.S., Van der Stoep, I., Stevens, J. 2010. Crop production management practices as a cause for low water productivity at Zanyokwe Irrigation Scheme. Water SA, 36 (1): 27-36
FAO, 2008. Biofuels: Prospects, risks and opportunities. The state of food and agriculture. Food and Agriculture Organization (FAO) of the United Nations, Rome, Italy.
FAO, 2009. A review of experiences of establishing emerging farmers in South Africa: Case lessons and farmer support within land reform programmes. Capacity Development in Food and Agriculture Policies (3). Food and Agriculture Organization (FAO) of the United Nations, Rome, Italy.
FAO, 2010. Jatropha: A smallholder bioenergy crop – The potential for pro-poor development. Integrated crop management, Vol. 8-2010. Food and Agriculture Organization (FAO) of the United Nations, Rome, Italy.
Farmer’s weekly, 2010. The great Fish River sugarbeet plan. Article in Farmer’s Weekly magazine, 20 August 2010: 50-52.
Funke, T., Strauss, P.G., Meyer, F. 2009. Modelling the impacts of the industrial biofuels strategy on the South African agricultural and biofuel subsectors. Agrekon 48 (3): 223-244
GAIN, 2009. Biofuels annual report: Republic of South Africa. Prepared by Dirk Esterhuizen for the Global Agricultural Information Network (GAIN), USDA Foreign Agricultural Service.
Hart, T.G.B. 2009. Food security review: South Africa and Southern Africa. Centre for Poverty Employment and Growth. Human Sciences Research Council (HSRC), Pretoria.
Haywood, D.L. 2008. Emerging issues paper: Biofuels. Paper prepared for the Department of Environmental Affairs and Tourism, Pretoria.
Holl, M.A., Gush, M.B., Hallowes, J., Versfeld, D.B. 2007. Jatropha curcas in South Africa: An assessment of its water use and bio-physical potential. Report No 1479/1/07, Water Research Commission, Pretoria.
HRSC. 2007. Achieving food security in South Africa: Characteristics, stressors and recommendations to 2019. Report to the office of the Presidency (June). Human Sciences Research Council (HSRC), Pretoria.
Jewitt, G.PW. Wen, H.W., Kunz, R.P., Van Rooyen, A.M. 2009. Scoping study on water use of crops/trees for biofuels in South Africa. Report No 1772/1/09, Water Research Commission, Pretoria.
Labadarios, D., Swart, R., Maunder, E.M.W., Kruger, H.S., Gericke, G.J., Kuzwayo, P.M.N., Ntisie, P.R., Steyn, N.P., Schloss, I., Dhansay, M.A., Jooste, P.L., Dannhauser, A. 2008. Executive summary of the National Food Consumption Survey Fortification Baseline (NFCS-FB-I) South Africa 2005. South African Journal of Clinical Nutrition 21 (3) (Suppl. 2): 247-300.
Machete, C.L., Mollel, N.M., Ayisi, K., Mashatola, M.B., Anim, F.D.K., Vanasche, F. 2004. Smallholder irrigation and agricultural development in the Olifants River Basin of Limpopo Province: Management transfer, productivity, profitability and food security issues. Report No. 1050/1/04. Water Research Commission, Pretoria.
Mwenge Kahinda, J., Sejamoholo, B.B.P., Taigbenu, A.E., Boroto, J.R., Lillie, E.S.B., Taute, M., Cousins, T. 2008. Water resources management in rainwater harvesting: An integrated systems approach. Report No 1563/1/08, Water Research Commission, Pretoria.
NAMC, 2007. The South African Food Cost Review: 2007. Markets and Economic Research Centre, National Agricultural Marketing Council (NAMC), Pretoria.
National Water Act, 1998. Act No. 36, as published in the Government Gazette Volume 398, No. 19182, 20 August 1998. Cape Town
OECD/IEA, 2008. From 1st to 2nd generation biofuel technologies: An overview of current industry and RD&D activities. Organisation for Economic Co-operation and Development (OECD) and the International Energy Agency (IEA), France.
OFID, 2009. Biofuels and food security: Implications of an accelerated biofuels production. OFID pamphlet series, summary prepared by IIASA. The OPEC Fund for International Development (OFID), Vienna, Austria.
Pauw, K.W. 2007. Agriculture and poverty: Farming for food or farming for money. Agrekon 46 (2): 195-217

95
Raswant, V., Hart, N., Romano, M. 2008. Biofuel Expansion: Challenges, Risks and Opportunities for Rural Poor People. Paper prepared for the Round Table organized during thre Thirty-first session of IFAD’s Governing Council, 14 February 2008.
Schulze, R.E. 1995. Hydology and Agrohydrology: A Text to Accompany the ACRU Agrohydrological Modelling System. Report No TT 69/95, Water Research Commission, Pretoria.
South African Cane Growers’ Association, 2009. Grower Survey: Statistics for March 2009. http://www.sacanegrowers.co.za. Accessed 1 July 2010
Van Averbeke, W. 2008. Best management Practices for Small-Scale Subsistence Farming on Selected Irrigation Schemes and Surrounding Areas through Partcipatory Action Research in Limpopo Province. Report No. TT 344/08. Water Research Commission, Pretoria
Van Averbeke, W., Mohamed, S.S. 2006. Smallholder farming styles and development policy in South Africa: The case of Dzindi Irrigation Scheme. Agrekon 45 (2): 136-157
Van Zyl, J., Van Rooyen, J. 1991. Agricultural production in South Africa. In: De Klerk, M. (ED.). A harvest of discontent: The land question in South Africa. Cape Town: Institute for a Democratic Alternative for South Africa.
Vink, N., Van Rooyen, J. 2009. The economic performance of agriculture in South Africa since 1994: Implications for food security. Development Planning and Division Working Paper Series No. 17, Development Bank of Southern Africa (DBSA), Midrand
Von Maltitz, G.P., Brent, A. 2008. Assessing the biofuel options for Southern Africa. Science real and relevant: 2nd CSIR Biennial Conference, 17-18 November 2008. Council for Scientific and Industrial Research, Pretoria.
Water Research Commission, 2010. Core Strategy and business plan – Key Strategic Area: Water Utilisation in Agriculture. Internal document. Pretoria.


![Microsoft Powerpoint - Technical Presentation on Bio-Towers[1]](https://img.pdfslide.us/doc/110x75/577cd5b71a28ab9e789b74ad/microsoft-powerpoint-technical-presentation-on-bio-towers1.jpg)