Embed Size (px)
Citation preview

7/30/2019 Technical Report 1 - CEng
http://slidepdf.com/reader/full/technical-report-1-ceng 1/62
The Development and Integration
of Advanced Control andMonitoring Systems
in the Built Environment
7/30/2019 Technical Report 1 - CEng
http://slidepdf.com/reader/full/technical-report-1-ceng 2/62
Page 2 of 69
Contents
1 INTRODUCTION 4
2 AIM 5
3 BACKGROUND 6
4 TECHNICAL CONTENT 8
4.1 Why use building control and monitoring systems? 8
4.2 Control theory 8
4.3 Types of systems available 9
4.3.1 Closed systems 10
4.3.2 Open systems 12
4.3.3 Closed systems using “Open” protocols 14
4.4 Requirements for an effective control protocol 15
4.4.1 Comparison of BACnet, KNX and Lonworks 17
4.4.2 BACnet 17
4.4.3 LonWorks 17
4.4.4 KNX (EIB European Installation Bus) 18
4.5 Methods available for integrating systems utilizing singlevendor or legacy systems compared with open protocolsystems such as BACnet®, LonWorks® etc. 19
4.5.1 Integration by network sharing 19
4.5.2 “Fully integrated” systems 21
4.6 Cable and component reductions with integrated systems 25
4.7 Resilience and risk 29
4.8 Self-monitoring of BMS, control and alarm systems 32
4.8.1 Off-line self-diagnostic testing 33
4.8.2 On-line self-testing self-diagnosing systems 36
7/30/2019 Technical Report 1 - CEng
http://slidepdf.com/reader/full/technical-report-1-ceng 3/62
Page 3 of 69
4.8.2.1 High level on-line self-diagnosing systems 36
4.8.2.2 Low level on-line self-diagnosing systems 37
4.9 Integration of building services control systems with other specialist
engineering control, monitoring and reporting systems 40
4.10 Social benefits 44
4.11 Reduced installation and commissioning requirements for integratedsystems 46
4.12 Environmental benefits 49
4.13 Capital and revenue costs benefits 50
4.13.1 VBHQ 50
4.13.2 Integrated systems in the healthcare sector 52
4.14 Controls assurance compliance 52
5 CONCLUSIONS 55
6 EVALUATION AND REFLECTION 59
7 REFERENCE SOURCES 64
8 BIBLIOGRAPHY 65
9 GLOSSARY OF TERMS 66
10 APPENDICES 69
Appendix 1 A different approach to medical gas alarm systems
Appendix 2 A practical example of integrated systems
Appendix 3 Advanced self monitoring of control systems
Appendix 4 Cost comparisons
Appendix 5 Abbreviated list of open protocols
7/30/2019 Technical Report 1 - CEng
http://slidepdf.com/reader/full/technical-report-1-ceng 4/62
Page 4 of 69
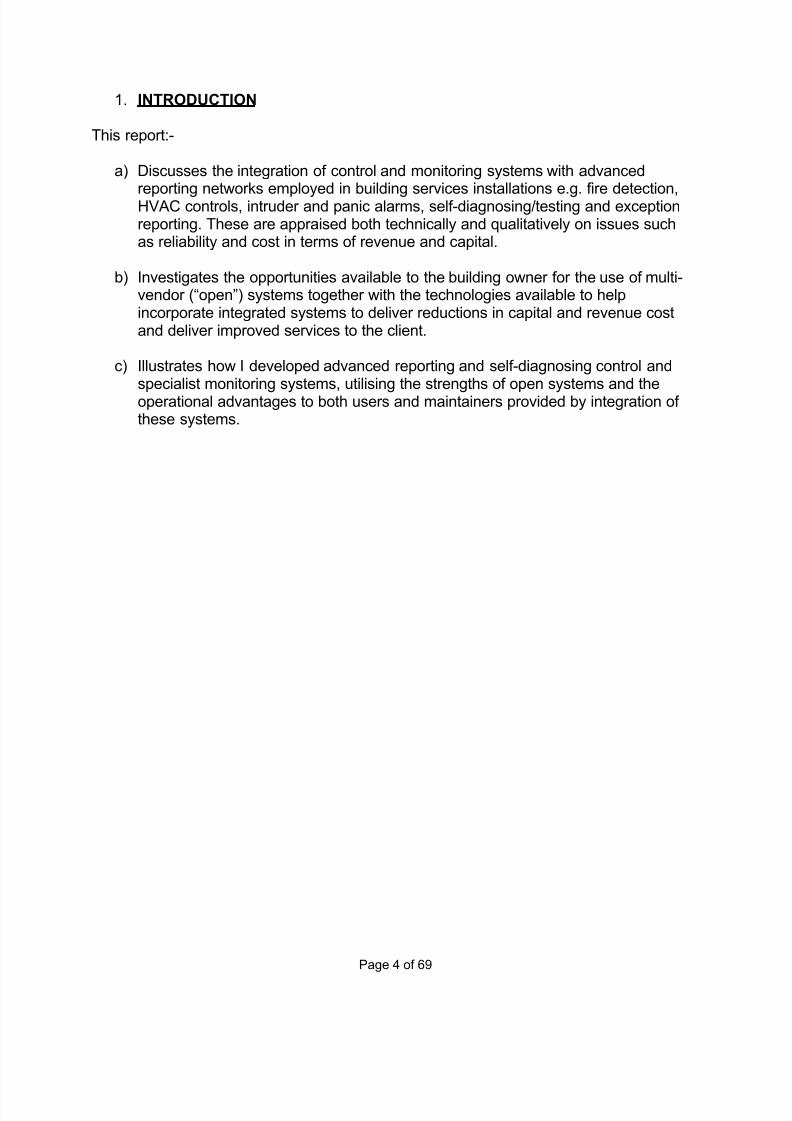
1. INTRODUCTION
This report:-
a) Discusses the integration of control and monitoring systems with advanced
reporting networks employed in building services installations e.g. fire detection,HVAC controls, intruder and panic alarms, self-diagnosing/testing and exceptionreporting. These are appraised both technically and qualitatively on issues suchas reliability and cost in terms of revenue and capital.
b) Investigates the opportunities available to the building owner for the use of multi-vendor (“open”) systems together with the technologies available to helpincorporate integrated systems to deliver reductions in capital and revenue costand deliver improved services to the client.
c) Illustrates how I developed advanced reporting and self-diagnosing control andspecialist monitoring systems, utilising the strengths of open systems and theoperational advantages to both users and maintainers provided by integration of these systems.

7/30/2019 Technical Report 1 - CEng
http://slidepdf.com/reader/full/technical-report-1-ceng 5/62
Page 5 of 69
2. AIMS
To demonstrate the following:-
a) basic control theory, including control algorithms relating to systems in the built
environment;
b) types of systems available;
c) the advantages and disadvantages of current systems from a technical view point;
d) methods available for integrating systems utilizing single vendor or legacysystems compared with open protocol systems such as BACnet®, LonWorks® etc.;
e) the benefits, if any, of integrated systems in terms of:-i. reliability,ii. capital costs,iii. revenue costs,iv. opportunities for energy conservation, through connectivity benefits,v. introduction of full system logs to comply with controls assurance
requirements,vi. self diagnosing systems to improve system availability,vii. self testing systems such as fire alarms, emergency lights etc.,viii. customer empowerment with respect to:-
a. Local Control,b. Feed Back and Reporting,c. Interfaces
7/30/2019 Technical Report 1 - CEng
http://slidepdf.com/reader/full/technical-report-1-ceng 6/62
Page 6 of 69
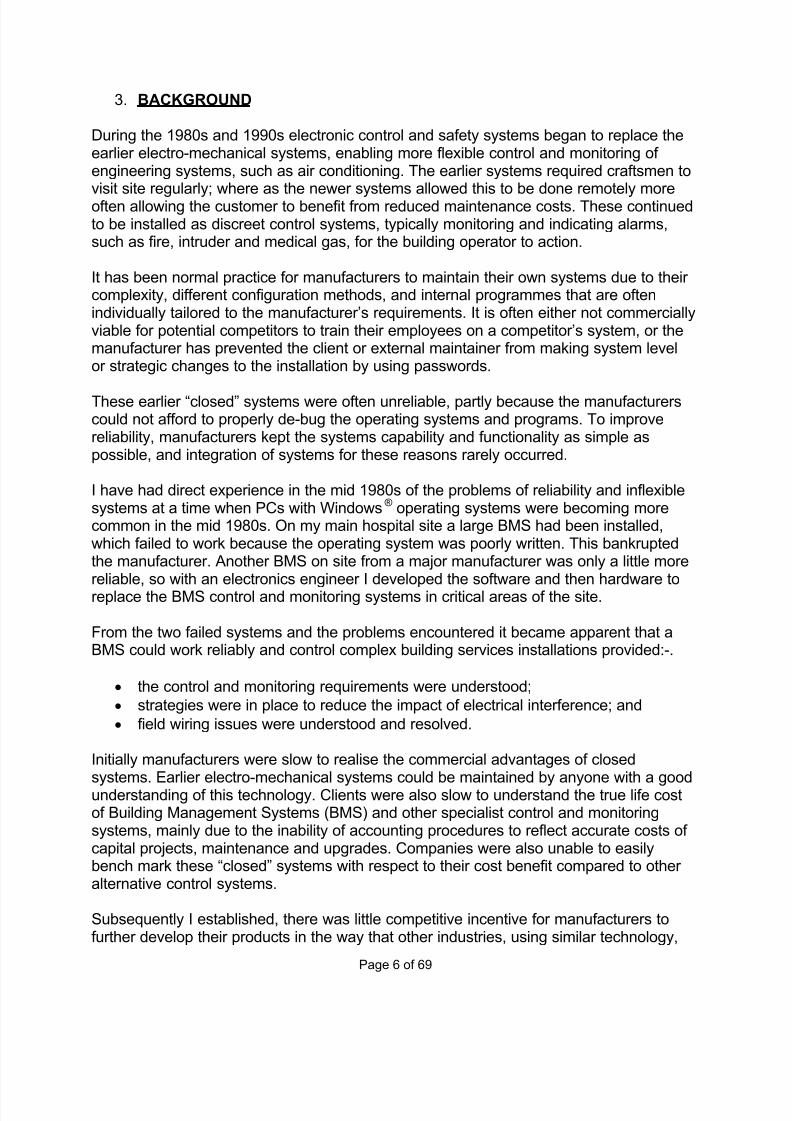
3. BACKGROUND
During the 1980s and 1990s electronic control and safety systems began to replace theearlier electro-mechanical systems, enabling more flexible control and monitoring of engineering systems, such as air conditioning. The earlier systems required craftsmen to
visit site regularly; where as the newer systems allowed this to be done remotely moreoften allowing the customer to benefit from reduced maintenance costs. These continuedto be installed as discreet control systems, typically monitoring and indicating alarms,such as fire, intruder and medical gas, for the building operator to action.
It has been normal practice for manufacturers to maintain their own systems due to their complexity, different configuration methods, and internal programmes that are oftenindividually tailored to the manufacturer’s requirements. It is often either not commerciallyviable for potential competitors to train their employees on a competitor’s system, or themanufacturer has prevented the client or external maintainer from making system levelor strategic changes to the installation by using passwords.
These earlier “closed” systems were often unreliable, partly because the manufacturerscould not afford to properly de-bug the operating systems and programs. To improvereliability, manufacturers kept the systems capability and functionality as simple aspossible, and integration of systems for these reasons rarely occurred.
I have had direct experience in the mid 1980s of the problems of reliability and inflexiblesystems at a time when PCs with Windows® operating systems were becoming morecommon in the mid 1980s. On my main hospital site a large BMS had been installed,which failed to work because the operating system was poorly written. This bankruptedthe manufacturer. Another BMS on site from a major manufacturer was only a little morereliable, so with an electronics engineer I developed the software and then hardware toreplace the BMS control and monitoring systems in critical areas of the site.
From the two failed systems and the problems encountered it became apparent that aBMS could work reliably and control complex building services installations provided:-.
• the control and monitoring requirements were understood;
• strategies were in place to reduce the impact of electrical interference; and
• field wiring issues were understood and resolved.
Initially manufacturers were slow to realise the commercial advantages of closedsystems. Earlier electro-mechanical systems could be maintained by anyone with a goodunderstanding of this technology. Clients were also slow to understand the true life costof Building Management Systems (BMS) and other specialist control and monitoringsystems, mainly due to the inability of accounting procedures to reflect accurate costs of capital projects, maintenance and upgrades. Companies were also unable to easilybench mark these “closed” systems with respect to their cost benefit compared to other alternative control systems.
Subsequently I established, there was little competitive incentive for manufacturers tofurther develop their products in the way that other industries, using similar technology,

7/30/2019 Technical Report 1 - CEng
http://slidepdf.com/reader/full/technical-report-1-ceng 7/62
Page 7 of 69
found necessary. An example of this is the in the automotive industry, where theintegration of once separate systems is bringing marketing and competitive benefits.
For these reasons, “open” systems such as BACnet® and the LonWorks® Protocol weredeveloped, allowing clients to develop with like minded integration companies, moreflexible and often cheaper, innovative BMS and other specialist control and monitoring
systems and bring these to the market place.
I became interested in the advantages offered by “open” systems in the mid 1990s;installing my first system in 1998. Since then, this initial pilot system has been extendedand has been used in over 40 projects as part of my Health Trust’s capital program onnumerous health care sites.
The development of “open” systems has allowed me to innovate numerous control andmonitoring strategies and to integrate many BMS and other specialist control andmonitoring systems.
The experience gained in implementing and operating integrated open protocol controlsystems over seven years has provided me the opportunity to research the opportunitiesand constraints applicable in the building services sector.

7/30/2019 Technical Report 1 - CEng
http://slidepdf.com/reader/full/technical-report-1-ceng 8/62
Page 8 of 69
4. TECHNICAL CONTENT
4.1 Why use building control and monitoring systems?
Building control and monitoring systems are installed in buildings for a variety of reasons.
These include:-
• To maintain comfortable working/living conditions (for the greater comfort of mankind†);
• to improve the productivity of its occupants and any process carried out in thebuilding;
• compliance with legislation and standards;
• provision of a controlled environment for example:-hospital operating theatres;clean rooms (integrated circuit manufacture);
• to protect the building and its occupants against loss e.g. prevent damage to
equipment, flood, loss of power;• to minimise energy used;
• to minimise maintenance costs (including periodic alteration and refurbishment).
Ultimately the amount of control and monitoring installed in a building is determined bythe legislative requirements and the cost effectiveness of the control and monitoringsystems compared with the improvements in productivity and revenue costs for thebuilding. For example by productivity improvements achieved when people work in abuilding with the optimal environmental conditions1.
In general, the cheaper a given system is to install and run and the greater the benefit to
the building owner and occupier the more likely it is that it will be installed. This in itself has the additional benefit that more examples of the system will be installed whichtherefore reduces the installation and maintenance costs further. In conclusion, if controland monitoring systems give the customer greater benefits with a reduced capital outlay,the more widespread their installation will be.
For the development and integration of advanced control and monitoring systems to beof use to building owners and occupiers, these techniques and systems must meet thisobjective.
4.2 Control theory
For the purpose of this report the most important aspect of control theory is the benefitsof closed-loop control as opposed to open-loop control.
† Motto of the Chartered Institute of Building Services Engineers1 Wyon D P, Current indoor Climate Problems and there possible solution, Indoor Environment 1994; pages 123-129
7/30/2019 Technical Report 1 - CEng
http://slidepdf.com/reader/full/technical-report-1-ceng 9/62
Page 9 of 69
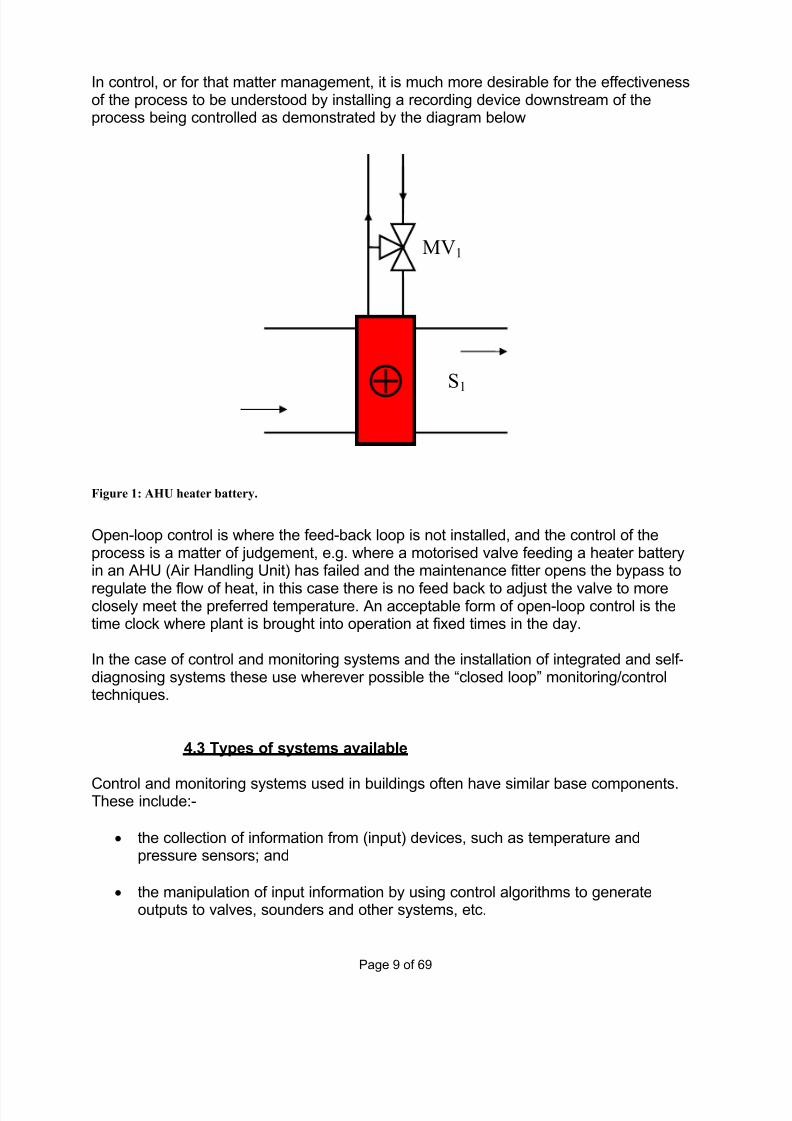
In control, or for that matter management, it is much more desirable for the effectivenessof the process to be understood by installing a recording device downstream of theprocess being controlled as demonstrated by the diagram below
Figure 1: AHU heater battery.
Open-loop control is where the feed-back loop is not installed, and the control of theprocess is a matter of judgement, e.g. where a motorised valve feeding a heater batteryin an AHU (Air Handling Unit) has failed and the maintenance fitter opens the bypass to
regulate the flow of heat, in this case there is no feed back to adjust the valve to moreclosely meet the preferred temperature. An acceptable form of open-loop control is thetime clock where plant is brought into operation at fixed times in the day.
In the case of control and monitoring systems and the installation of integrated and self-diagnosing systems these use wherever possible the “closed loop” monitoring/controltechniques.
4.3 Types of systems available
Control and monitoring systems used in buildings often have similar base components.These include:-
• the collection of information from (input) devices, such as temperature andpressure sensors; and
• the manipulation of input information by using control algorithms to generateoutputs to valves, sounders and other systems, etc.
⊕S
1
MV1
7/30/2019 Technical Report 1 - CEng
http://slidepdf.com/reader/full/technical-report-1-ceng 10/62
Page 10 of 69
The collection and utilisation of data is achieved by digital communications and use of microprocessors.
Control systems can be split into three categories:-
•closed systems (proprietary systems);• open systems (such as LonWorks®, BACnet®), using open protocols;
• closed systems using open protocol to communicate between controllers, butusing non-standard variable types such as temperature, speed, etc.
4.3.1 Closed systems
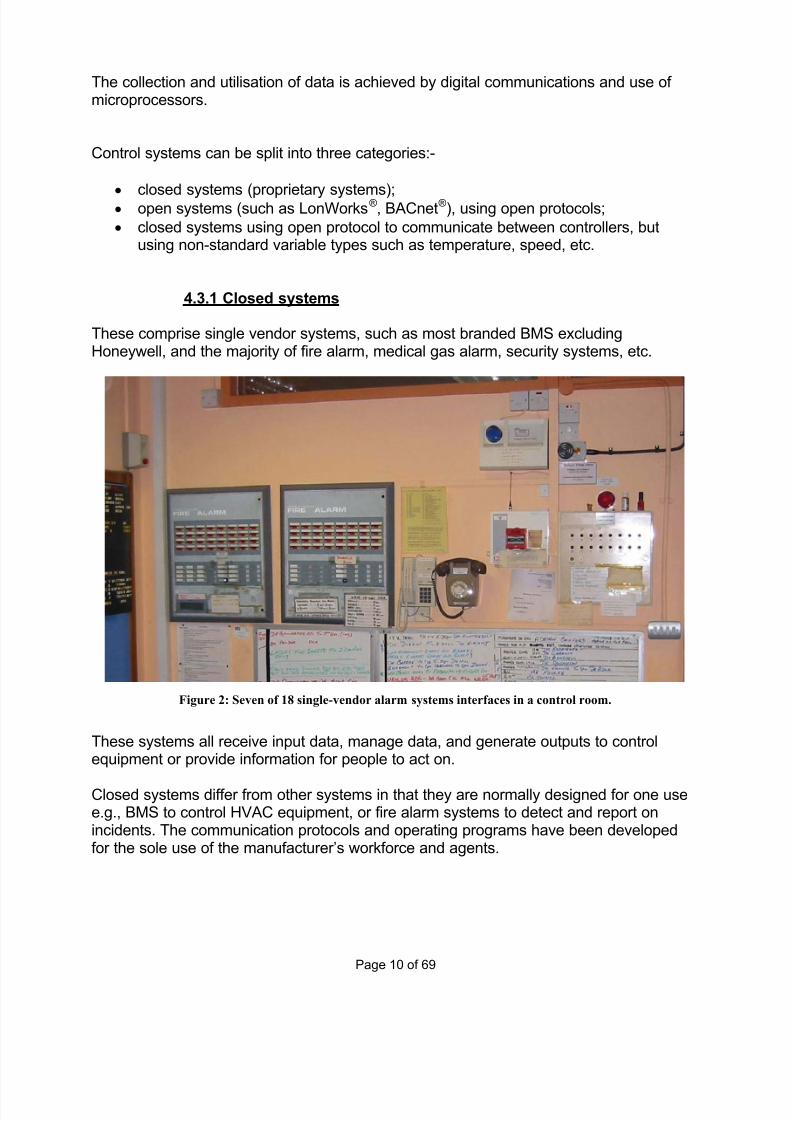
These comprise single vendor systems, such as most branded BMS excludingHoneywell, and the majority of fire alarm, medical gas alarm, security systems, etc.
Figure 2: Seven of 18 single-vendor alarm systems interfaces in a control room.
These systems all receive input data, manage data, and generate outputs to controlequipment or provide information for people to act on.
Closed systems differ from other systems in that they are normally designed for one usee.g., BMS to control HVAC equipment, or fire alarm systems to detect and report onincidents. The communication protocols and operating programs have been developedfor the sole use of the manufacturer’s workforce and agents.
7/30/2019 Technical Report 1 - CEng
http://slidepdf.com/reader/full/technical-report-1-ceng 11/62
Page 11 of 69
These systems are relatively expensive to develop and enhance, compared with thoseutilising “open” system protocols as outlined below. The reasons for this extra cost are:-
• The communication protocols and language being developed individually bycompanies for use in their own systems,
• the operating programs whilst often using industry-standard programminglanguages are developed by companies for their own systems;
• programs used in “closed” systems tend to be simple and with fewer embellishments because:-
o development and testing costs are borne by the individual manufacturer;
o simpler systems are more reliable with less to go wrong;
o training requirements for their service staff are reduced, both initially and
for updates.
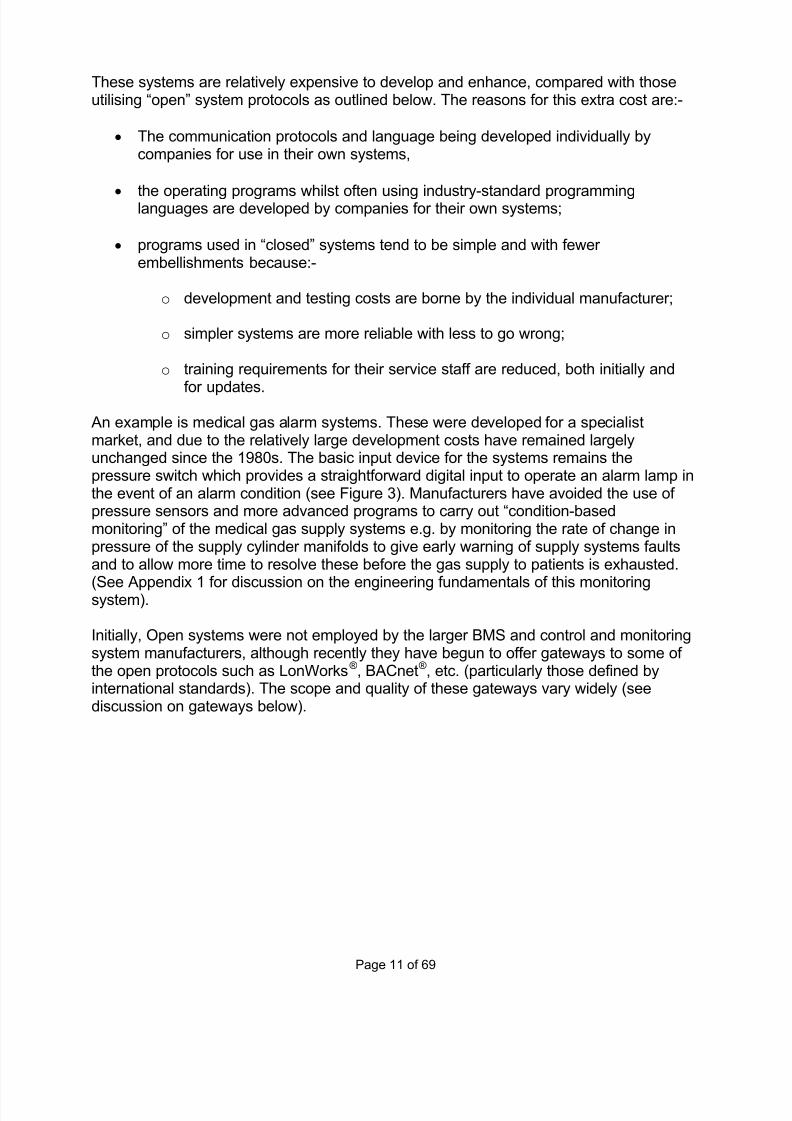
An example is medical gas alarm systems. These were developed for a specialistmarket, and due to the relatively large development costs have remained largelyunchanged since the 1980s. The basic input device for the systems remains thepressure switch which provides a straightforward digital input to operate an alarm lamp inthe event of an alarm condition (see Figure 3). Manufacturers have avoided the use of pressure sensors and more advanced programs to carry out “condition-basedmonitoring” of the medical gas supply systems e.g. by monitoring the rate of change inpressure of the supply cylinder manifolds to give early warning of supply systems faultsand to allow more time to resolve these before the gas supply to patients is exhausted.
(See Appendix 1 for discussion on the engineering fundamentals of this monitoringsystem).
Initially, Open systems were not employed by the larger BMS and control and monitoringsystem manufacturers, although recently they have begun to offer gateways to some of the open protocols such as LonWorks®, BACnet®, etc. (particularly those defined byinternational standards). The scope and quality of these gateways vary widely (seediscussion on gateways below).
7/30/2019 Technical Report 1 - CEng
http://slidepdf.com/reader/full/technical-report-1-ceng 12/62
Page 12 of 69
Figure 3: Single vendor medical gas alarm system interface-
Maintenance and servicing costs tend to be higher, as the majority of systems aremaintained by the manufacturer with little or no competition for maintenance availablefrom alternative companies. Consequently, there is little incentive to keep prices down.Where the manufacturer has appointed independent agents, the manufacturer still setsthe software and component costs to the agents. In effect, a local monopoly exists as themanufacturer knows that the owner will have to pay again for new infrastructure for mostreplacement systems. Infrastructure upgrades make up a significant cost of systemmaintenance (as well as system extensions, and refurbishments).
Where there are significant benefits from integrating control and monitoring systems (e.g.fire alarm system manufactured by x being integrated with system y or a BMS to be
integrated with complex plant such as large chillers), manufacturers sometimes developgateways. These act as translators to convey often limited information from one systemto the other. This benefits the manufacturers saving them the cost of developing controlstrategies from scratch and taking on extra risk for control and management of the other system of which the manufacturer may have little or no knowledge. The gatewayconverts one communication protocol and communication language of the host system tothat of the receiving system. This often requires the development of new hardware andsoftware with additional penalties of reduced reliability and in practice a limited number of parameters that can be sent through the “gateway” largely as a result of the time andresource needed to develop these more fully.
4.3.2 Open systems
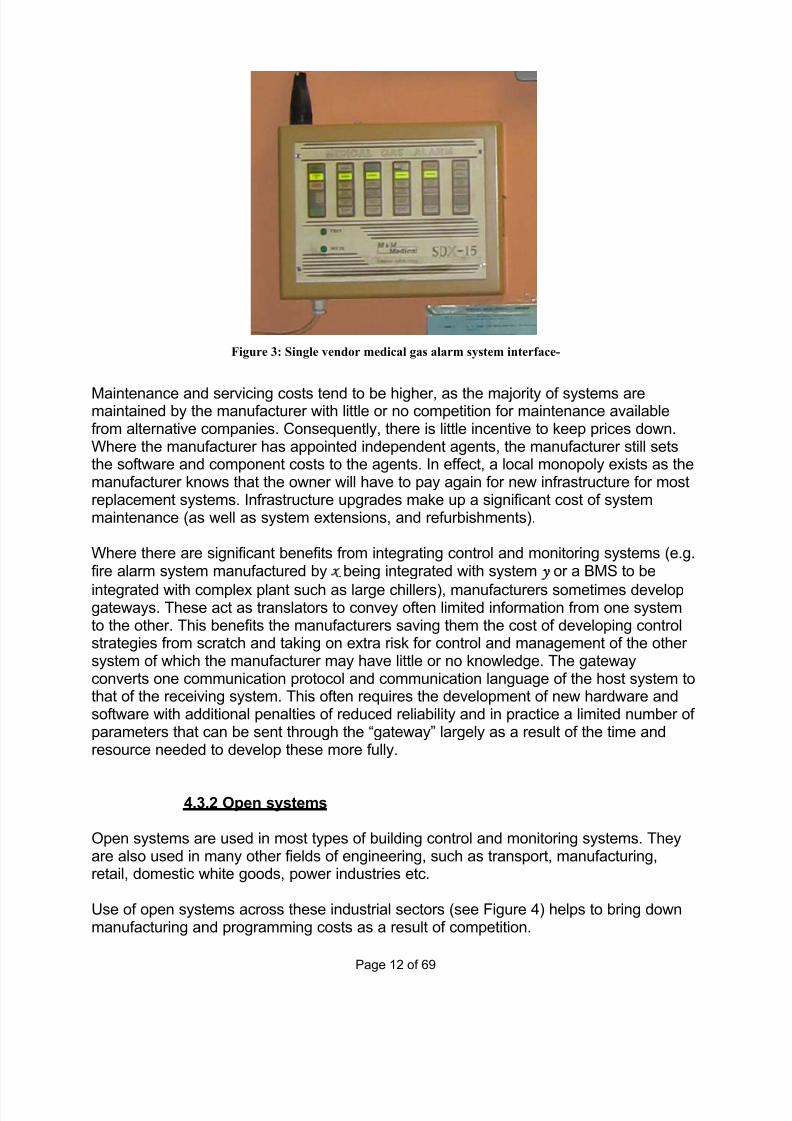
Open systems are used in most types of building control and monitoring systems. Theyare also used in many other fields of engineering, such as transport, manufacturing,retail, domestic white goods, power industries etc.
Use of open systems across these industrial sectors (see Figure 4) helps to bring downmanufacturing and programming costs as a result of competition.

7/30/2019 Technical Report 1 - CEng
http://slidepdf.com/reader/full/technical-report-1-ceng 13/62
Page 13 of 69
Figure 4: LONWORKS applications by market sector worldwide.
Open systems have evolved due to the high cost of developing bespoke operating
systems, and because they have the potential for use in many industrial and commercialsectors.
The advantages include:-
• development costs are shared by many companies;
• alliances between companies to share control and monitoring programdevelopment costs;
• single large companies use “open” systems to provide common communicationsprotocols and operating systems to bring together and offer significantdevelopment cost reductions for the many different types of control and monitoringsystems they manufacture;
• single companies set up with the sole purpose of developing an open protocol for other companies to incorporate into their control and monitoring systems e.g.Echelon (LonWorks®);
• utilisation of ASHRAE standard protocol to enable the management andintegration of building services e.g. BACnet®;
• systems using open protocols can be offered by many manufacturers andinstallers, and this makes the procurement of open systems nearly 100%competitive (often the only non competitive element being Licences);
• open systems are attractive to manufacturers because they reduce risk by utilisinga widely used system operating within a defined international standard;
• development costs are reduced due to a greater pool of integrators familiar withthe protocol from which to draw information. Code and control algorithms can be

7/30/2019 Technical Report 1 - CEng
http://slidepdf.com/reader/full/technical-report-1-ceng 14/62
Page 14 of 69
shared between what were once considered different systems, e.g. intruder alarmsystems with fire alarm systems, saving development costs;
• components are cheaper because of competition and much larger productionquantities (spread over many industries);
• components and the embedded software are much more reliable and resilient dueto their use in so many systems. Problems are reported and discussed openly andresolved, and because of this, people working with open systems tend to havemore confidence in the protocol, feeling that as information is shared openlybetween more people than the would have been the case with closed systems,the risk associated with the discovery of a previously unknown problem isreduced;
• because open systems are used in many market places, manufacturers often co-operate to share development costs etc. because they are using the sametechnologies in different market places.
Honeywell is the principal major manufacturer to fully embrace open systems. Their interest in interoperability between their control system products led them to selectLonWorks® as their platform;
Because the development and manufacturing costs are lower for a given product, moreadvanced control and monitoring facilities are becoming both cost effective andcommercially available. This in itself provides an effective marketing tool for manufacturers to attract new customers. (See Appendices 2 and 3 where I havedeveloped advanced control and monitoring techniques illustrating my understanding of basic engineering principals.)
With the exception of Honeywell, companies using open protocol systems as the back-bone of their control and monitoring systems have tended to be smaller, possiblybecause the large costs for the development and upgrade of closed systems would haveimpaired their ability to finance developments and be competitive.
4.3.3 Closed systems using “open” protocols
These systems offer a half-way house for some manufacturers who wish to retain controlof their systems whilst reducing their development costs compared with closedproprietary systems. In the case of a LonWorks® system the manufacturer retains controlby using non conforming Standard Network Variable Types2 (SNVTs) this prevents other closed or open manufacturers using the LonTalk® protocol to access another closedsystem. Typically these systems are limited to use by a single manufacturer.
2 LonMark ® SNVT Master List Version 12 June 2003 Echelon Corporation
7/30/2019 Technical Report 1 - CEng
http://slidepdf.com/reader/full/technical-report-1-ceng 15/62
Page 15 of 69
4.4 Requirements for an effective control protocol
This is best discussed by listing the desirable characteristics of a control and monitoringsystem protocol. Followed by comparing protocols, with respect to the more advancedand embracing open systems such as LonWorks
®.
Any control protocol must meet several requirements, not all technical, e.g. they:-
• must work in the built environment;
• must be capable of easy installation on construction sites and occupied buildings;
• be simple and quick to commission and test;
• be easy to use, manage and maintain; and
• have the ability to be modified to encompass new developments andrequirements;
• an open protocol that is freely available for any stakeholder to use.
Developing these requirements, the stakeholders would want an open protocol system tohave the following characteristics:-
• high speed communications capable of passing the higher quantity of datagenerated from self diagnosing systems and system logs;
• reliable protocol, preferably backed up by an agreed international standard;
• a strong support organisation for integrators, designers and clients;
• a protocol that can handle priority messages (e.g. for life safety systems);
• a protocol that can handle acknowledged messaging (i.e. it confirms receipt of information packet), these need to confirm a communication path is healthybetween two points, often controllers, and that the frequency is adjustable. This isparticularly important for systems fulfilling more “mission critical” tasks or utilisingmore advanced self diagnosing techniques these also work better with protocols
operating at higher band widths;
• a protocol that allows the customer to minimise the impact of component failure,e.g. allow cabling and routers to be installed resiliently for critical systems, and for the installation of smaller controllers to be economic so that the failure of acontroller does not result in significant loss of facility;
• a protocol that allows many systems, perhaps installed by different integrators, touse the same controller and network at the same time;

7/30/2019 Technical Report 1 - CEng
http://slidepdf.com/reader/full/technical-report-1-ceng 16/62
Page 16 of 69
• for there to be no more than a small charge for licences or other payments directto the developer of the protocol;
• for the protocol to permit the use of network-powered control devices. E.g. by thenetwork powering detectors, sensors, speakers, lights (emergency) etc. thereforeallowing manufacturers greater freedom to provide imaginative flexible products;
• for the protocol to be widely used. E.g. not only in building services but in other market places, e.g. manufacturing, domestic and transport;
• for the protocol to allow networks to be arranged to suit the most convenientcabling installation and for controllers to be available in a variety of sizes again tosuit site conditions;
• for the protocol to be transportable over several communication paths, e.g.shielded or unshielded Twisted Pair cable, infra-red, radio, fibre optic, power line,etc.
• be suited for use with all types of building services control and monitoring systemsand not be designed primarily for HVAC or manufacturing, as with Modbus®;
• have all major components e.g. controllers, routers etc. available from manymanufacturers.
An open protocol used for control and monitoring systems, needs to meet manyrequirements both technical and non technical, and all aspects need to be satisfied for itsuse to be practical and economical and to meet the needs of all stakeholders particularlythe end-use client.
The customer has many protocols to chose from but very few fulfil all the characteristicsabove (See Appendix 5 for an abbreviated list of open protocols, also known as fieldbuses).
It is not the purpose of this technical report to objectively select the optimal protocol asthese may vary according to each organisation’s needs. The more popular protocols,such as BACnet®, KNX®, and LonWorks® all meet most of the criteria above, though Ibelieve when I started to install open protocol systems in the late 1990s the system thatbest meets the requirements of control and monitoring systems in the healthcare field,particularly for integrated and advanced monitoring systems, is LonWorks® with their
LonTalk®
protocol.
A short discussion of principal differences will high-light why careful selection of protocolis important when linking to proprietary, or installing, new control and monitoringsystems.

7/30/2019 Technical Report 1 - CEng
http://slidepdf.com/reader/full/technical-report-1-ceng 17/62
Page 17 of 69
4.4.1 Comparison of BACnet, KNX and Lonworks
4.4.2 BACnet
Strengths:-
• scalable: a complete communication protocol for the management, automation,and field levels;
• completely open: manufacturers can implement the protocol without any licensingfees;
• specifically designed to meet the needs of the building industry;
• being established as a world standard through ISO and other bodies. No other protocol is under consideration;
• constantly evolving: Built-in mechanism for updating and enhancing the standardthrough industry consensus (although this may also be a disadvantage);
• there is no vested interest controlling the development of BACnet.
Weaknesses:-
• no standardized programming language: proprietary programming tools must bebought from each manufacturer;
• no standard configuration tools: proprietary configuration tools must be boughtfrom each manufacturer;
• expensive for manufacturers to develop;
• BACnet is a written standard that is subject to interpretation by manufacturers: themanufacturer has to write his own operating system to comply with the standardand this is both expensive and liable to need debugging, giving rise to many of thedisadvantages associated with “closed” systems.
4.4.3 LonWorks
Strengths:-
• widest implementation over a wide range of applications due to early entry intomarket;
• standard programming tools;

7/30/2019 Technical Report 1 - CEng
http://slidepdf.com/reader/full/technical-report-1-ceng 18/62
Page 18 of 69
• simple for manufacturers to implement through standardized tools and becausethe protocol is pre-configured on the neuron chip;
• has power line carrier RF (Radio Frequency) and IR (Infra Red) implementation-BACnet does not;
• all Lon solutions require multiple software packages to configure the system, suchas Lon Maker, Visio, and OSS2000 These are all lower cost programs than mostrival systems;
• Lon is a technology that complies with the standard written after it was put intouse. The technology is replicated in all neuron chips, whilst this reducescompetitiveness (see weaknesses); this technically is a strength as only one set of software bugs would need to be rectified, reducing overall expenditure.
Weaknesses:-
• not scalable. Limited by speed of the Neuron chip;
• limited facility for programming complex routines or large algorithms such asadvanced self-diagnosis and careful programming is required (alternatively useexternal processor can be used for advanced function);
• licensing fees built into the cost of LNS (LonWorks network services) and neuronchip payable to Echelon;
• proprietary hardware. Neuron chips must be purchased with a licensing fee to
Echelon;
• LNS network tools are proprietary and must be purchased from EchelonCorporation.
4.4.4 KNX (EIB European Installation Bus)
Strengths:-
• designed for ease of installation and commissioning, and is best suited for simplecontrol applications for this reason;
• KNX standard now expanded to incorporate operation over Ethernet.
Weaknesses:-
• KNX is popular in Europe as a field bus protocol in the building industry but hasnot been visible outside that region;
7/30/2019 Technical Report 1 - CEng
http://slidepdf.com/reader/full/technical-report-1-ceng 19/62
Page 19 of 69
• KNX was initially developed for the field level with a data signalling rate of 9,600bit/s. A faster speed is available, but is not offered to CENELEC for incorporationinto standard;
• power supply polarity sensitive.
This is a far from exhaustive list, but it serves to demonstrate that careful selection isneeded. (also See Appendix 5)
My experience and developments in installing integrated and advanced monitoringsystems have all been based on using LonWorks®. Most of the control, monitoring andmanagement techniques I have developed could also be achieved if any of the other major open protocol systems available were used.
4.5 Methods available for integrating systems utilizing single-vendor or legacy systems compared with open protocol systems such as
BACnet
®
, LonWorks
®
etc.
4.5.1 Integration by Network Sharing
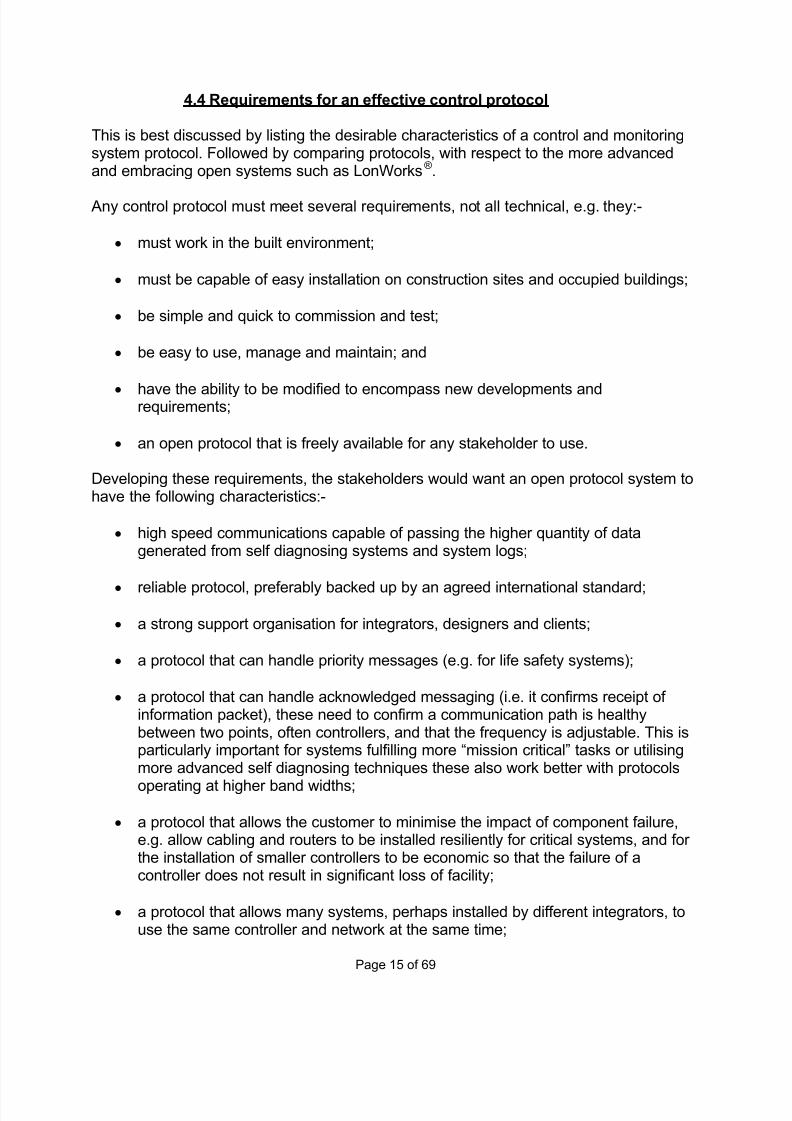
In the controls field there are several meanings that can be applied to integration. In thiscase, integration by network sharing is where several individual systems are combinedtypically through “gateways” so that each system can be viewed at a PC screen(s). Thisis inconvenient for the user to get an overall view of the systems a number of interfaceshave to be visited. Systems can be integrated (so they can be viewed on a single screen)often at great cost. Often information from one system has to be entered into each of the
other systems and updated as the building use changes over time. The separate system“head ends” often share little information between systems, but when information sharingtakes place this will normally be through a PC or Server resulting in a potential singlepoint of failure if the PC or Server breaks down in this example, apart from beinginconvenient, any alarms generated will not get through. The figure below showsintegration of various open type systems, but these could easily include fire alarms andother specialised systems, in place of say the BACnet® sub-network.
7/30/2019 Technical Report 1 - CEng
http://slidepdf.com/reader/full/technical-report-1-ceng 20/62
Page 20 of 69
This method of integration relies heavily on gateways where each control and monitoringsystem is supplied by a propriety manufacturer. Gateways tend to be limited in theamount of information they pass on. They also have the following weaknesses:-
• unless there is redundancy in the system each gateway represents a single pointof failure;
• as can be seen from figure 5 above, having less gateways, increases thecommunications cabling required as each sub-net has to be wired back to thenearest gateway for that particular system. This tends to increase costs;
• gateways between proprietary systems are uncommon as the manufacturers canalter their protocol without reference to others, potentially rendering the gatewaydysfunctional or inoperative. Gateways are more common between proprietarysystems and open protocol systems that have an international standard definingtheir make up e.g. LonWorks®, BACnet®;
•gateway Programs from proprietary communication protocols tend to be less wellwritten and less reliable than those from defined open systems and definedcommunications protocols (e.g. TCP/IP) because of the relatively smallmanufacturing quantities for these;
• as will be discussed later, this type of networking/communications arrangementtends to be more expensive and less reliable than the defined open systems.
Figure 5: Integration by network sharing, gateways connect the
control networks to the TCP/IP backbone.

7/30/2019 Technical Report 1 - CEng
http://slidepdf.com/reader/full/technical-report-1-ceng 21/62
Page 21 of 69
Figure 6: Grundfos pump G10 Lon gateway between
manufacturers and LonTalk protocol.
Due to the limitations above, limited ability of gateways and the comparative
inexperience of manufacturers integrating their systems with others, most limit their integration to using volt-free contacts to exchange information.
4.5.2 “Fully integrated” systems
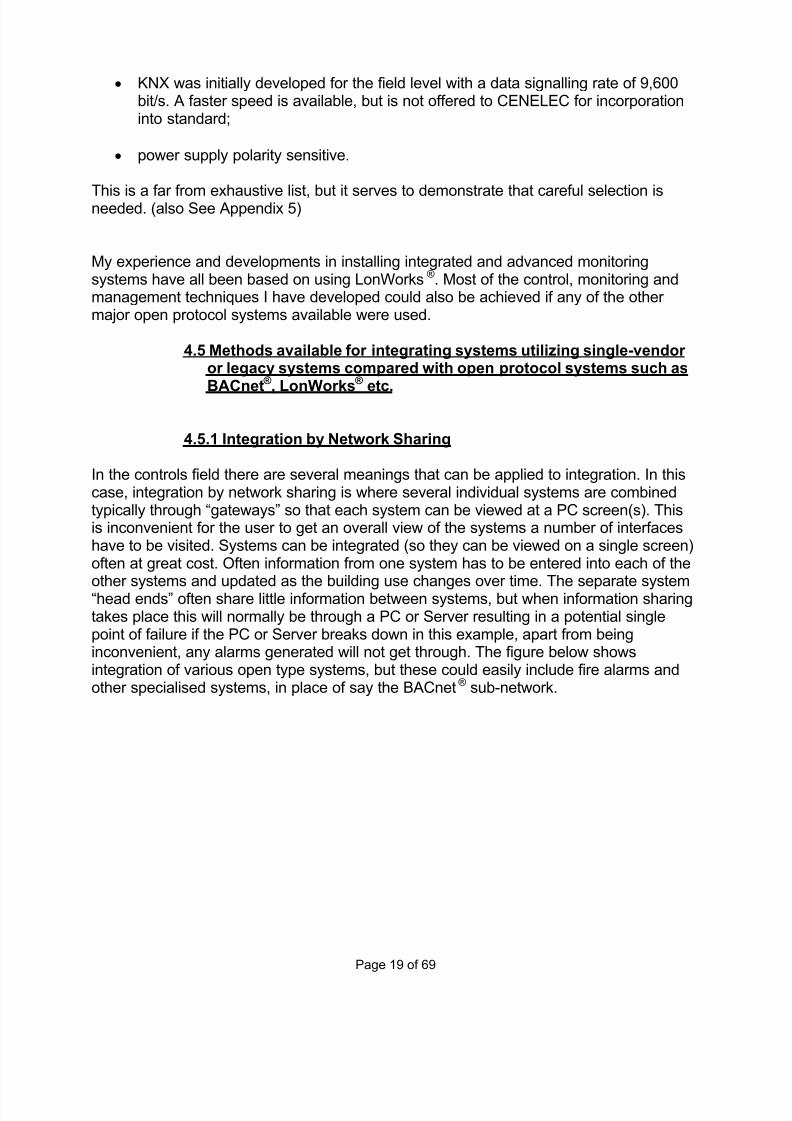
A system that offers many more opportunities is the “fully integrated” system, wherecontrol and monitoring information is shared directly between controllers; PCs beingmainly used as a management tool to make modifications and receive information fromthe system. Figure 7 illustrates that control and monitoring systems are similar in thatthey all have:-
• Inputs;
• Input information, data processing, and the result being sent to;
• Outputs.
7/30/2019 Technical Report 1 - CEng
http://slidepdf.com/reader/full/technical-report-1-ceng 22/62
Page 22 of 69
Figure 7: Principle relationships of control and monitoring systems.
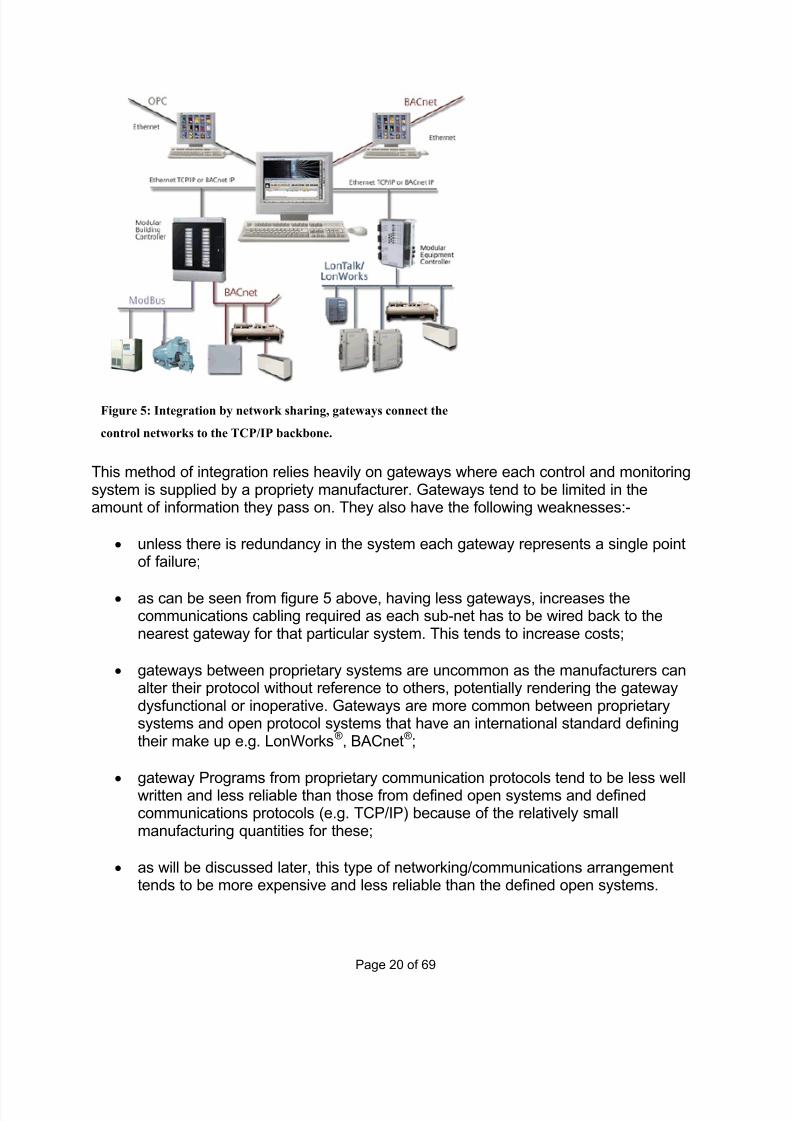
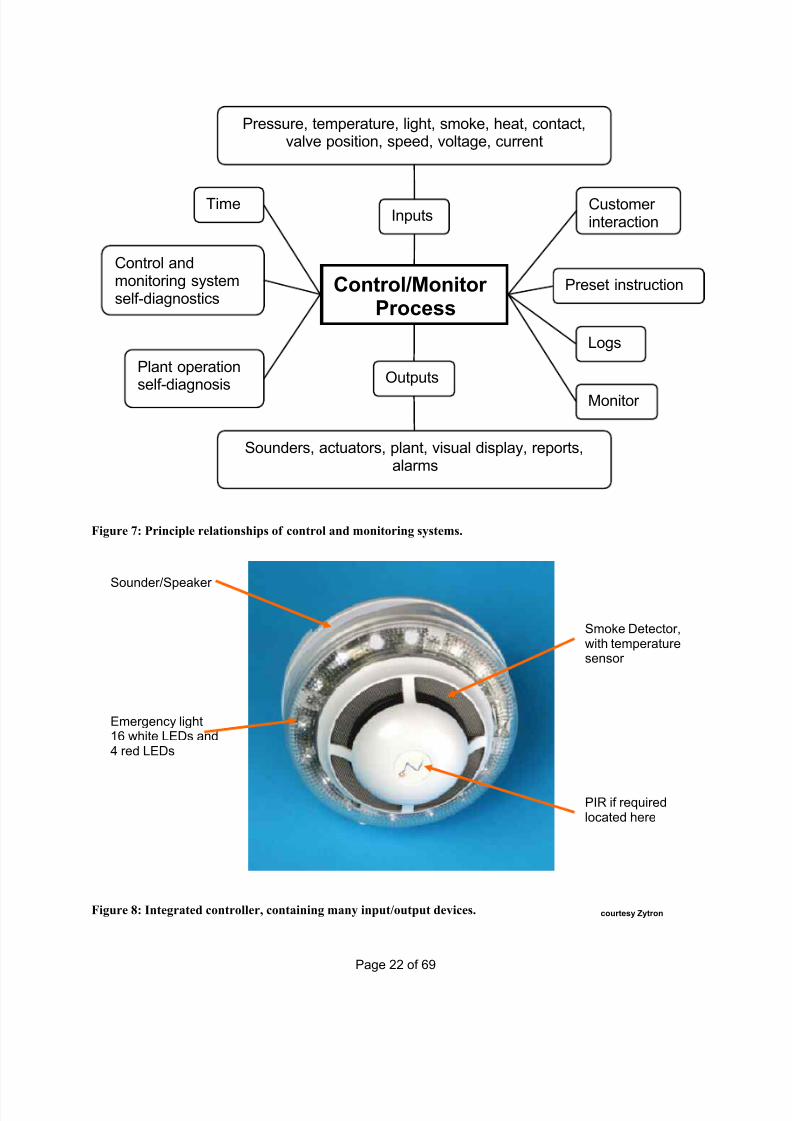
Figure 8: Integrated controller, containing many input/output devices. courtesy Zytron
Control/Monitor Process
Inputs
Pressure, temperature, light, smoke, heat, contact,valve position, speed, voltage, current
Time
Preset instruction
Outputs
Monitor
Logs
Customer interaction
Sounders, actuators, plant, visual display, reports,alarms
Control andmonitoring systemself-diagnostics
Plant operation
self-diagnosis
Sounder/Speaker
Smoke Detector,with temperaturesensor
PIR if requiredlocated here
Emergency light16 white LEDs and4 red LEDs

7/30/2019 Technical Report 1 - CEng
http://slidepdf.com/reader/full/technical-report-1-ceng 23/62
Page 23 of 69
This method of integration is still in its infancy, there being few protocols that can supportthis level of integration, and no single proprietary systems manufacturer provides a fullyintegrated solution. (See Appendix 2 for a practical example of the integrated systems.)
With this method of integration, input/output devices are connected to controllers whichcontrol and manage the flow of information from what would traditionally have been
separate systems. In many cases an input/output device or sensor information is usedfor several purposes. For instance in a building, many input/output devices such astemperature sensors and passive infra-red detectors, are often duplicated, because theyindividually control plant or provide information for other systems. This duplicates wiringand components which have to be individually commissioned and maintained.
With integrated systems, a controller receives information from sensors and/or other controllers and provides outputs to further controllers and/or devices to achieve thedesired action. (The controllers do not belong to a particular system.) The advantage of this is that they are located closer to the input/output devices. This has the additionalbenefits of requiring:-
• Fewer physical input/output Points,
• Fewer controllers,
• Less cabling,
• Simpler and fewer networks.
The following are examples of integrated devices:-
A passive infra-red detector in a room can be used to:-
• turn on the heating or ventilation systems;
• indicate the presence of an intruder;• turn on the lighting in the room when occupied.
A sounder in a room can be used to warn of a:-
• fire;
• patient call;
• intruder;
• attack;
• other security situations;
• process equipment malfunction;• high/Low temperature;
• open door (controlled environment);
• or any other audio output.
7/30/2019 Technical Report 1 - CEng
http://slidepdf.com/reader/full/technical-report-1-ceng 24/62
Page 24 of 69
At the display and head end of the control and monitoring system there are further integration benefits when using:-
• enunciator panels;
• displays;
• head end PCs.
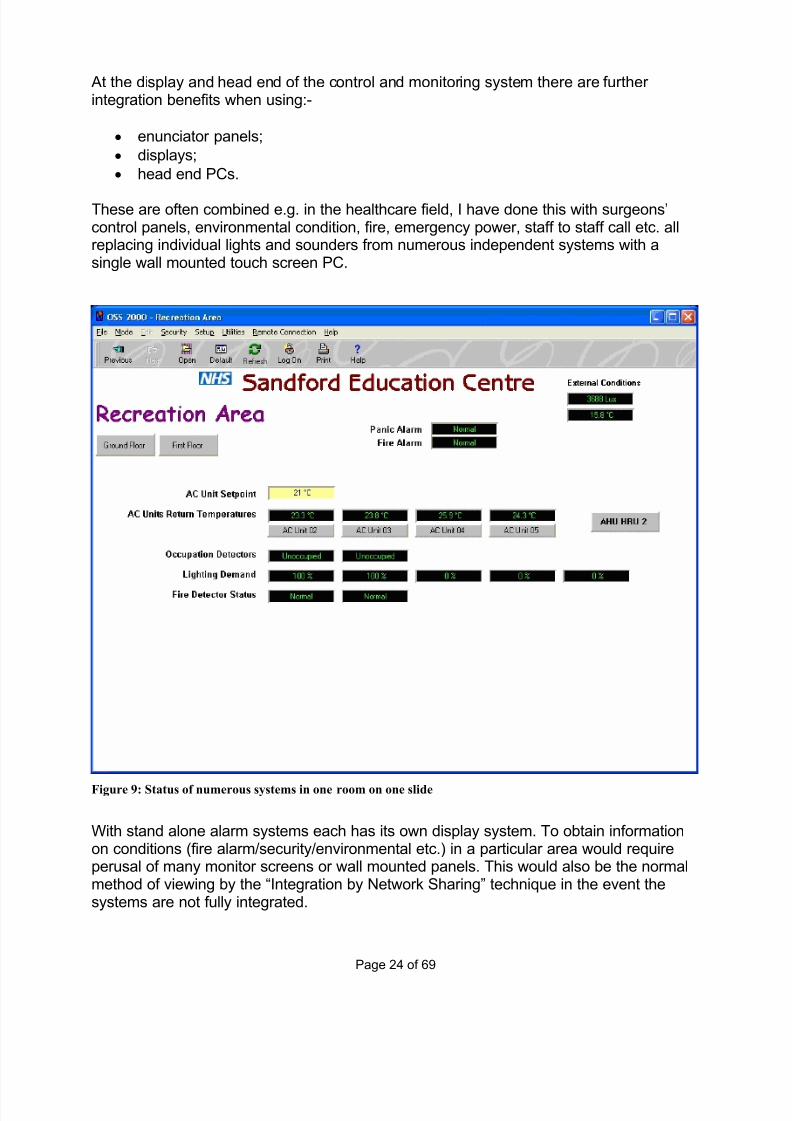
These are often combined e.g. in the healthcare field, I have done this with surgeons’control panels, environmental condition, fire, emergency power, staff to staff call etc. allreplacing individual lights and sounders from numerous independent systems with asingle wall mounted touch screen PC.
Figure 9: Status of numerous systems in one room on one slide
With stand alone alarm systems each has its own display system. To obtain informationon conditions (fire alarm/security/environmental etc.) in a particular area would requireperusal of many monitor screens or wall mounted panels. This would also be the normalmethod of viewing by the “Integration by Network Sharing” technique in the event thesystems are not fully integrated.
7/30/2019 Technical Report 1 - CEng
http://slidepdf.com/reader/full/technical-report-1-ceng 25/62
Page 25 of 69
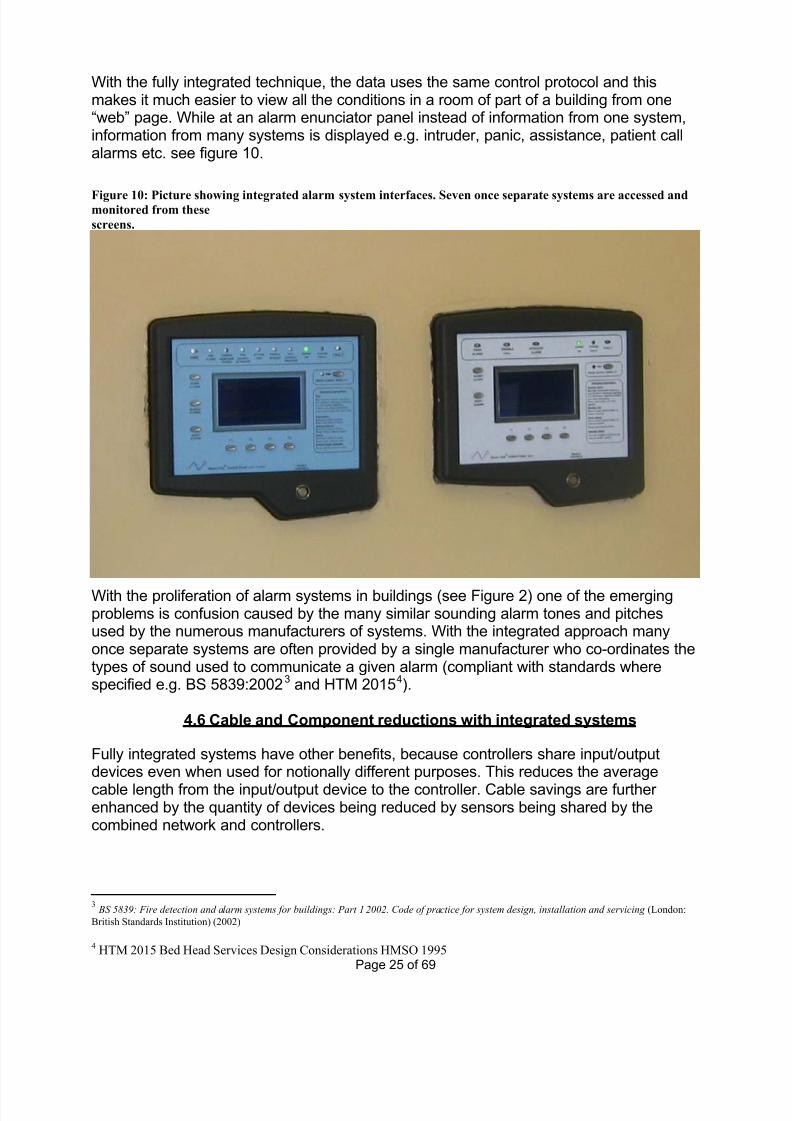
With the fully integrated technique, the data uses the same control protocol and thismakes it much easier to view all the conditions in a room of part of a building from one“web” page. While at an alarm enunciator panel instead of information from one system,information from many systems is displayed e.g. intruder, panic, assistance, patient callalarms etc. see figure 10.
Figure 10: Picture showing integrated alarm system interfaces. Seven once separate systems are accessed andmonitored from these
screens.
With the proliferation of alarm systems in buildings (see Figure 2) one of the emergingproblems is confusion caused by the many similar sounding alarm tones and pitchesused by the numerous manufacturers of systems. With the integrated approach manyonce separate systems are often provided by a single manufacturer who co-ordinates thetypes of sound used to communicate a given alarm (compliant with standards wherespecified e.g. BS 5839:20023 and HTM 20154).
4.6 Cable and Component reductions with integrated systems
Fully integrated systems have other benefits, because controllers share input/outputdevices even when used for notionally different purposes. This reduces the average
cable length from the input/output device to the controller. Cable savings are further enhanced by the quantity of devices being reduced by sensors being shared by thecombined network and controllers.
3 BS 5839: Fire detection and alarm systems for buildings: Part 1 2002. Code of practice for system design, installation and servicing (London:
British Standards Institution) (2002)
4 HTM 2015 Bed Head Services Design Considerations HMSO 1995
7/30/2019 Technical Report 1 - CEng
http://slidepdf.com/reader/full/technical-report-1-ceng 26/62
Page 26 of 69
With even the simplest office building five control and monitoring systems are typicallyrequired:-
• fire alarm;
• intruder alarm;
• temperature control;
• lighting control;• emergency Light.
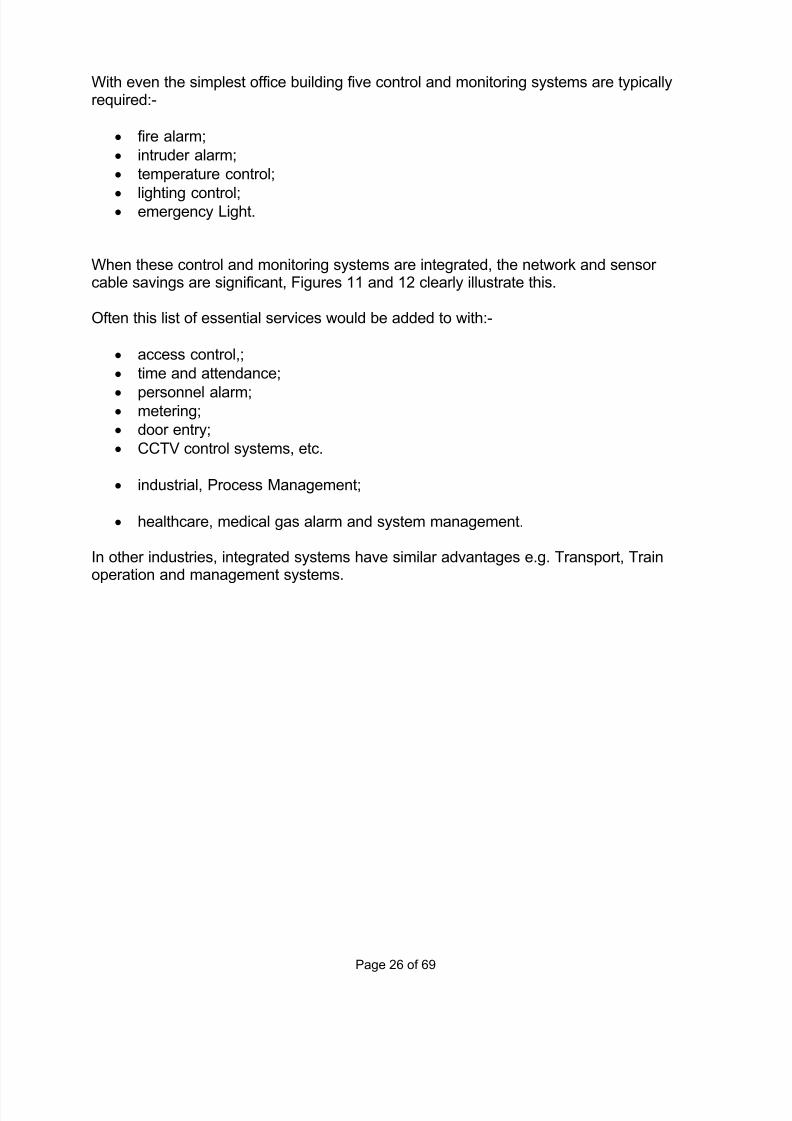
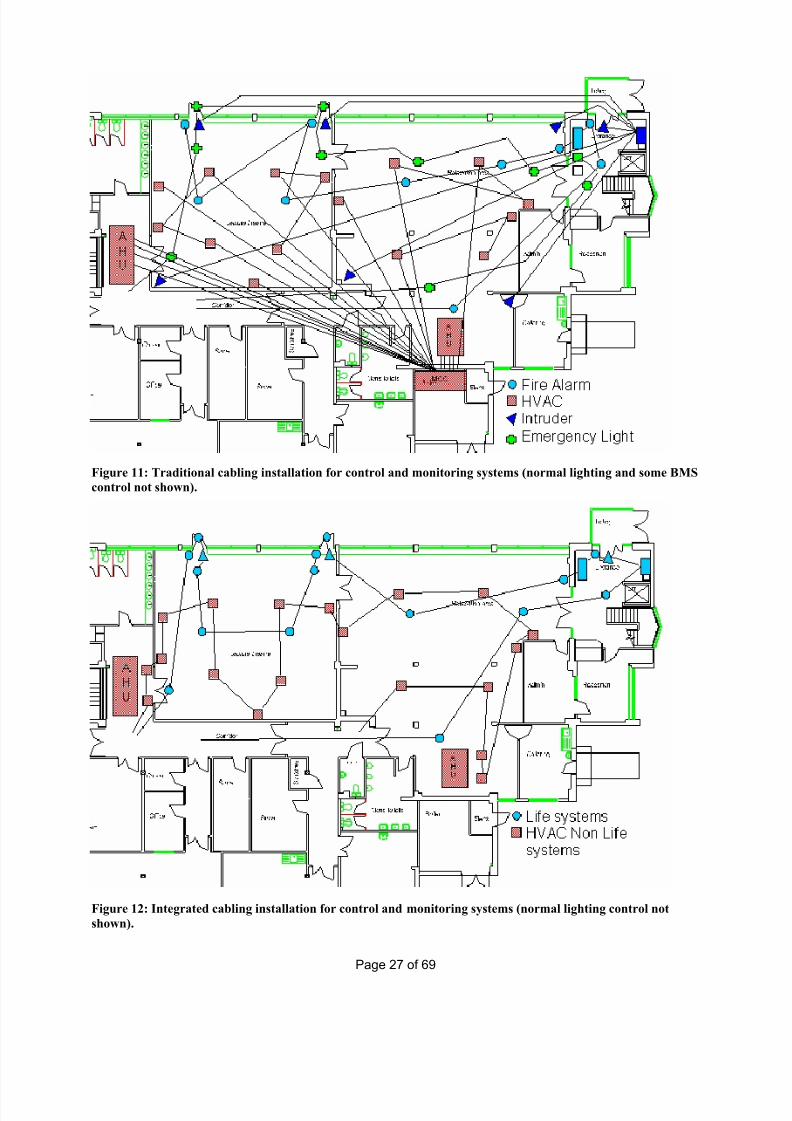
When these control and monitoring systems are integrated, the network and sensor cable savings are significant, Figures 11 and 12 clearly illustrate this.
Often this list of essential services would be added to with:-
• access control,;
• time and attendance;
• personnel alarm;• metering;
• door entry;
• CCTV control systems, etc.
• industrial, Process Management;
• healthcare, medical gas alarm and system management.
In other industries, integrated systems have similar advantages e.g. Transport, Trainoperation and management systems.
7/30/2019 Technical Report 1 - CEng
http://slidepdf.com/reader/full/technical-report-1-ceng 27/62
Page 27 of 69
Figure 11: Traditional cabling installation for control and monitoring systems (normal lighting and some BMS
control not shown).
Figure 12: Integrated cabling installation for control and monitoring systems (normal lighting control not
shown).
7/30/2019 Technical Report 1 - CEng
http://slidepdf.com/reader/full/technical-report-1-ceng 28/62
Page 28 of 69
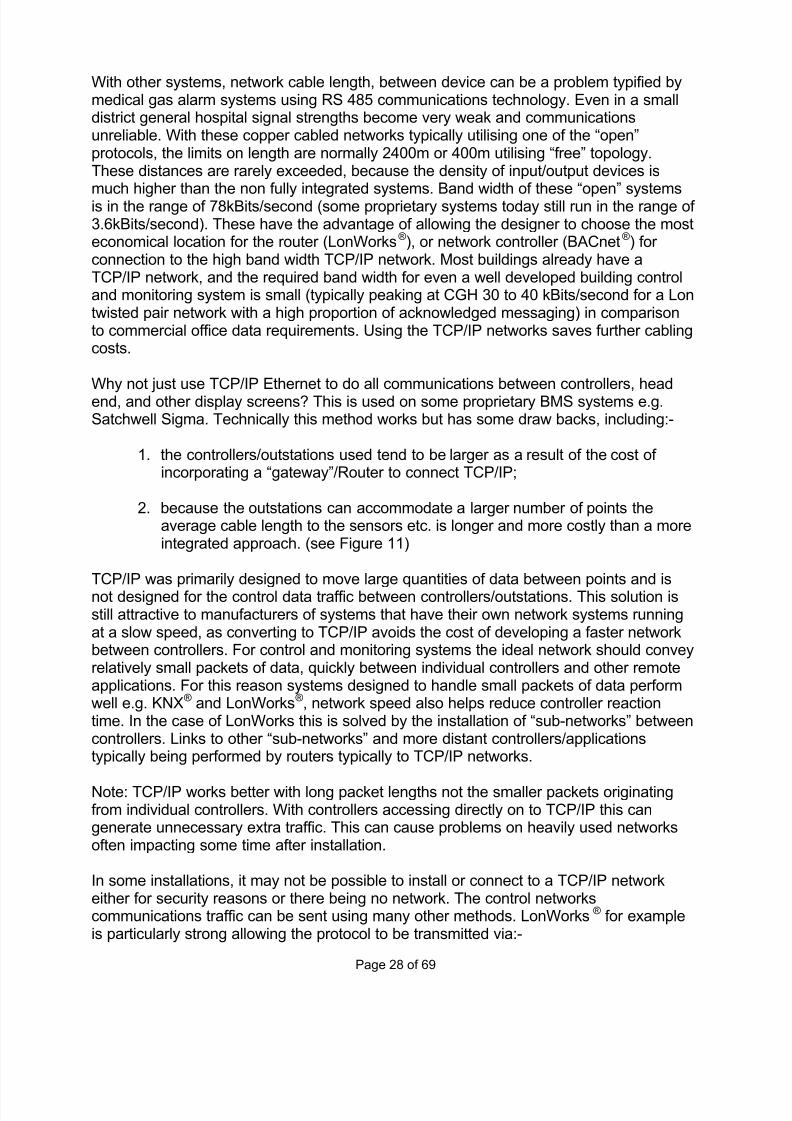
With other systems, network cable length, between device can be a problem typified bymedical gas alarm systems using RS 485 communications technology. Even in a smalldistrict general hospital signal strengths become very weak and communicationsunreliable. With these copper cabled networks typically utilising one of the “open”protocols, the limits on length are normally 2400m or 400m utilising “free” topology.These distances are rarely exceeded, because the density of input/output devices is
much higher than the non fully integrated systems. Band width of these “open” systemsis in the range of 78kBits/second (some proprietary systems today still run in the range of 3.6kBits/second). These have the advantage of allowing the designer to choose the mosteconomical location for the router (LonWorks®), or network controller (BACnet®) for connection to the high band width TCP/IP network. Most buildings already have aTCP/IP network, and the required band width for even a well developed building controland monitoring system is small (typically peaking at CGH 30 to 40 kBits/second for a Lontwisted pair network with a high proportion of acknowledged messaging) in comparisonto commercial office data requirements. Using the TCP/IP networks saves further cablingcosts.
Why not just use TCP/IP Ethernet to do all communications between controllers, headend, and other display screens? This is used on some proprietary BMS systems e.g.Satchwell Sigma. Technically this method works but has some draw backs, including:-
1. the controllers/outstations used tend to be larger as a result of the cost of incorporating a “gateway”/Router to connect TCP/IP;
2. because the outstations can accommodate a larger number of points theaverage cable length to the sensors etc. is longer and more costly than a moreintegrated approach. (see Figure 11)
TCP/IP was primarily designed to move large quantities of data between points and isnot designed for the control data traffic between controllers/outstations. This solution isstill attractive to manufacturers of systems that have their own network systems runningat a slow speed, as converting to TCP/IP avoids the cost of developing a faster networkbetween controllers. For control and monitoring systems the ideal network should conveyrelatively small packets of data, quickly between individual controllers and other remoteapplications. For this reason systems designed to handle small packets of data performwell e.g. KNX® and LonWorks®, network speed also helps reduce controller reactiontime. In the case of LonWorks this is solved by the installation of “sub-networks” betweencontrollers. Links to other “sub-networks” and more distant controllers/applicationstypically being performed by routers typically to TCP/IP networks.
Note: TCP/IP works better with long packet lengths not the smaller packets originatingfrom individual controllers. With controllers accessing directly on to TCP/IP this cangenerate unnecessary extra traffic. This can cause problems on heavily used networksoften impacting some time after installation.
In some installations, it may not be possible to install or connect to a TCP/IP networkeither for security reasons or there being no network. The control networkscommunications traffic can be sent using many other methods. LonWorks® for exampleis particularly strong allowing the protocol to be transmitted via:-

7/30/2019 Technical Report 1 - CEng
http://slidepdf.com/reader/full/technical-report-1-ceng 29/62
Page 29 of 69
• Fibre optics
• Twisted Pair
• Infra Red
• Coax
• Power lines
• Radio
These methods of communication have been used where no other suitable networkexists as illustrated below:-
The data for several million electricity meters in Italy is collected via power lines. Inaddition information from the meters in the homes of participating customers is used tolimit power usage by controlling Lon devices in heavy power consuming equipmentprincipally “white goods” such as washing machines, dishwashers, etc. to date27,000,000 Neuron® devices are in use for this application.
In historic buildings, utilising radio and communication over power cables, LonWorks® avoids installing communication cabling.
4.7 Resilience and Risk
One of the reasons given for not using “open” and fully integrated systems is that if thenetwork breaks down, more systems will be lost. This is not the case.
In a hospital for example there are typically over 20 control and monitoring systems,
often maintained by as many companies. The Trust uses numerous maintenancecompanies to maintain these systems. The Trust often has no choice but to use themanufacturer of the proprietary systems. These manufactures are often not able toattend to the fault as quickly as the Trust would like, but it has no choice, because of thepropriety nature of the systems. Even with the newer proprietary systems service is littlebetter. On the other hand it is not practical or possible for the Trust to employ staff tomaintain these systems because of the sheer number of systems and therefore staffingcosts. The resources needed for each system would include:-
• Time/Money
• Training,
• Test equipment,• Supplies of spares,
• Knowledge,
• Experience.
If the number of systems were reduced by using fully integrated system techniques, thetypical number of control and monitoring systems falls from over 20 down to two; thecontrollers sub network e.g. LonWorks®, and the TCP/IP network. The relatively largeTCP/IP network is already maintained typically by the organisations’ IT department. It
7/30/2019 Technical Report 1 - CEng
http://slidepdf.com/reader/full/technical-report-1-ceng 30/62
Page 30 of 69
can clearly be seen, that it is quite viable for most organisations to be able to directlyemploy their own specialist familiar with a single system. For the controller network it isnow feasible to resource the expertise and test equipment to maintain this.
Do TCP/IP and controller sub networks fail at the same time?
The answer is rarely, if ever. TCP/IP and by definition controller sub networks are formedfrom separate smaller networks or segments connecting switchers and routers (asrequired) to make up the buildings’ or complexes’ wide area network (WAN). Theswitchers and routers act as isolators in the case of a failure. The way TCP/IP networksare normally installed in organisations makes this backbone more resilient. Because theorganisations’ IT usage is essential to its operation, networks between building anddepartments are made resilient exampled by the installation of secondary links in case of a failure. These also help the resilience of the integrated control and monitoring systems.
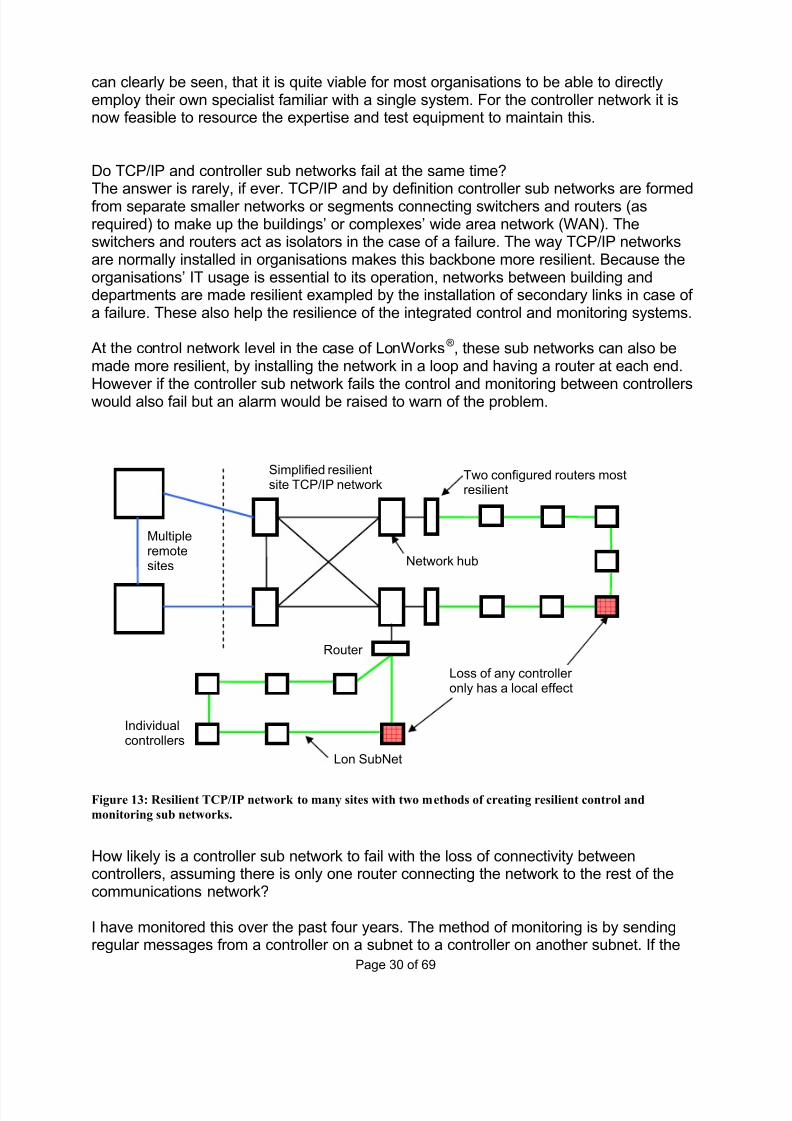
At the control network level in the case of LonWorks®, these sub networks can also bemade more resilient, by installing the network in a loop and having a router at each end.However if the controller sub network fails the control and monitoring between controllerswould also fail but an alarm would be raised to warn of the problem.
Figure 13: Resilient TCP/IP network to many sites with two methods of creating resilient control and
monitoring sub networks.
How likely is a controller sub network to fail with the loss of connectivity betweencontrollers, assuming there is only one router connecting the network to the rest of thecommunications network?
I have monitored this over the past four years. The method of monitoring is by sendingregular messages from a controller on a subnet to a controller on another subnet. If the
Simplified resilientsite TCP/IP network
Individualcontrollers
Router
Network hub
Multipleremotesites
Loss of any controller only has a local effect
Two configured routers mostresilient
Lon SubNet

7/30/2019 Technical Report 1 - CEng
http://slidepdf.com/reader/full/technical-report-1-ceng 31/62
Page 31 of 69
messages do not get through for more than five minutes in a 24 hour period an emailconfirming the failed sub net is generated by the controller, via the head end PC. Anemail is also generated if the sub network remains healthy. This is repeated to give acomplete picture of the networks health (this also validates the operation of the TCP/IPnetwork). Based on the above criterion a LonWorks subnet might fail once in six months.Of the remaining down times, these are caused by planned installation and modifications
to the network, both at sub net and network levels.
Figure 14: Network health
reports.
The main causes of failure tend to be cable breaks or controller breakdown. Both wouldresult in some loss of connectivity and function of the system(s), but as indicated abovethe organisation is more able to resource a quicker repair, reducing the effect of a loss toless than with traditional systems.
7/30/2019 Technical Report 1 - CEng
http://slidepdf.com/reader/full/technical-report-1-ceng 32/62
Page 32 of 69
4.9 Integration of building services control systems with other specialist engineering control, monitoring and reporting systems
In the early 1990s i was able to develop basic integration techniques as a part of thedesign phase of projects. At that time I linked the operation of radiant heating in aworkshop with the setting and un-setting of an intruder alarm utilising volt free contacts,allowing heating to be available when the building was occupied (during call outs and outof hours repairs). This was about the limit of integration at that time without a very muchlarger budget to develop bespoke programs.
With the advent and use of “open” protocol systems the opportunities for integration werenot obvious. I continued by integrating the access control and intruder alarm systemswith the operation of heating systems much as before but taking advantage of the“logical” connections offered by integrated communications. These also gave other benefits. From a single integrated network in a small building, it was economic to connectthis to the TCP/IP network and provide remote access to the building services, accesscontrol and intruder alarm systems. This allowed a common access control data base tobe setup for the access control systems, only requiring one data base to be keptupdated. There are other systems that have similar benefits including:-
• time and attendance systems;
• cashless vending systems;
• asset/personnel location systems.
Vending machine management and small scale catering (typically petrol stationforecourt) systems; these are used for stock level/replenishment management,controlling pilfering, maintenance management. In these cases an “open” protocolsystem LonWorks® is being used in the development of these because of its strengthsfor control and ease of conversion into other transmission protocols such as TCP/IP andmobile phones for transmission to base.
I have connected Smoke damper control and reporting systems to “open” networks,allowing exception reports to be generated if any dampers close incorrectly. Thedampers are closed when required by the fire alarm (if this is integrated) and co-ordinated with the location of the fire. I have installed this facility on larger ventilationsystems, because the dampers are networked with the AHUs, it is much easier toprogram shutting down the correct plant in a fire as the plant run signal is conditional onthe fire dampers associated with the AHU being open. The operation/condition of the firedampers is accessible from PCs by the fire brigade/maintenance etc. This user interfaceis easily modified to take account of any changes, and the screen is also much moreuser friendly especially to the fire fighters than the more common engraved panel withLEDs and buttons with a framed plan to the side.
7/30/2019 Technical Report 1 - CEng
http://slidepdf.com/reader/full/technical-report-1-ceng 33/62
Page 33 of 69
This lead to the integration of various alarm and monitoring systems and user interfacesutilising LonWorks® sub-nets and TCP/IP backbone WANs, including:-
Panic Alarms,
Disabled WC alarms,
Nurse Call systems,
User/maintenance interfaces at all PCs in the Trust
User/maintenance interfaces through wall mounted touch screen PCs have been usedin:-
• hospital clinics for:-o nurse call systems;o
plant alarms;o general alarms.
• operating theatres for:-o staff/staff call;o plant alarms;o general alarms;o environmental conditions.
• wards for:-o nurse call systems;o
plant alarms;o general alarms.
• specialist pharmaceutical facilities for:-o room pressurisation conditions;o room pressurisation alarms;o room temperature conditions;o HEPA filter operating conditions;o HEPA filter alarms;o fridge condition and alarms;o plant alarms;o
energy usage.
Through any networked PC, other systems include:-
• Electrical services management
• Electrical metering including PF, MD, THD, etc.
• Fire alarms, emergency lighting installations, etc.
7/30/2019 Technical Report 1 - CEng
http://slidepdf.com/reader/full/technical-report-1-ceng 34/62
Page 34 of 69
These are in addition to the more usual building services controls.
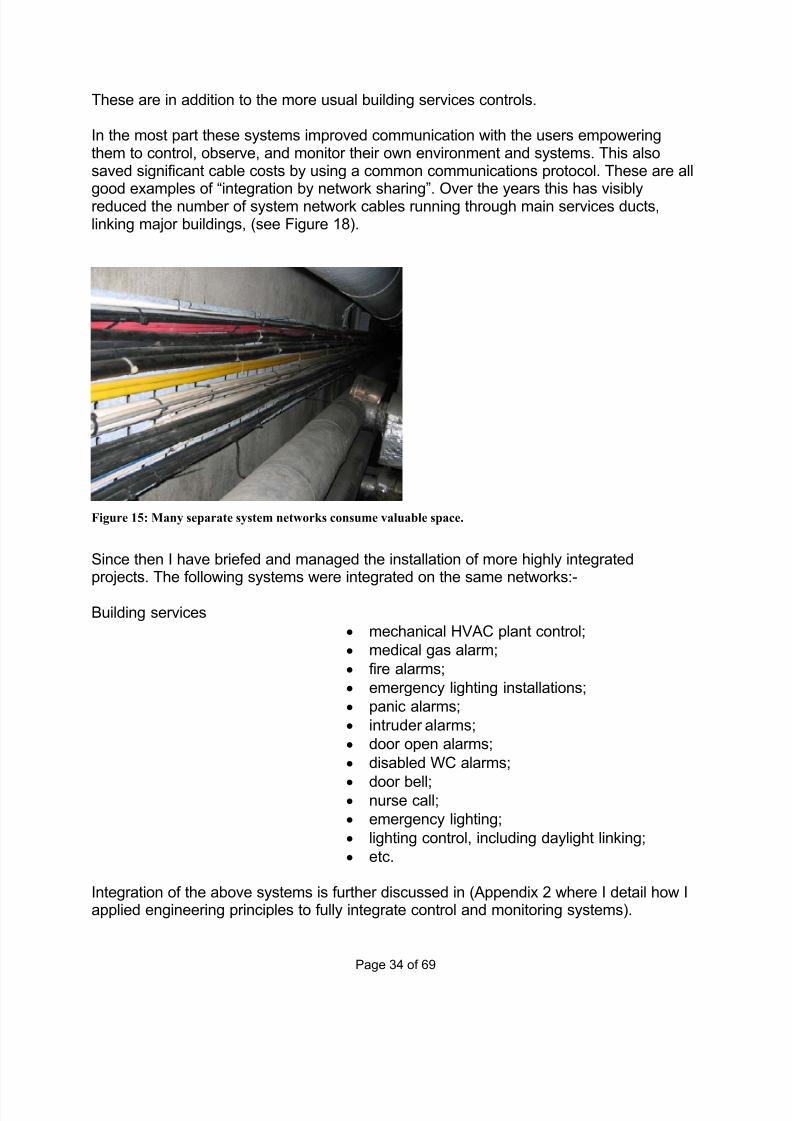
In the most part these systems improved communication with the users empoweringthem to control, observe, and monitor their own environment and systems. This alsosaved significant cable costs by using a common communications protocol. These are all
good examples of “integration by network sharing”. Over the years this has visiblyreduced the number of system network cables running through main services ducts,linking major buildings, (see Figure 18).
Figure 15: Many separate system networks consume valuable space.
Since then I have briefed and managed the installation of more highly integratedprojects. The following systems were integrated on the same networks:-
Building services
• mechanical HVAC plant control;
• medical gas alarm;
• fire alarms;
• emergency lighting installations;
• panic alarms;
• intruder alarms;
• door open alarms;
• disabled WC alarms;
• door bell;• nurse call;
• emergency lighting;
• lighting control, including daylight linking;
• etc.
Integration of the above systems is further discussed in (Appendix 2 where I detail how Iapplied engineering principles to fully integrate control and monitoring systems).
7/30/2019 Technical Report 1 - CEng
http://slidepdf.com/reader/full/technical-report-1-ceng 35/62
Page 35 of 69
4.10 Social benefits,
Fully integrated control systems deliver more benefits to the system users in a number of ways. These include:-
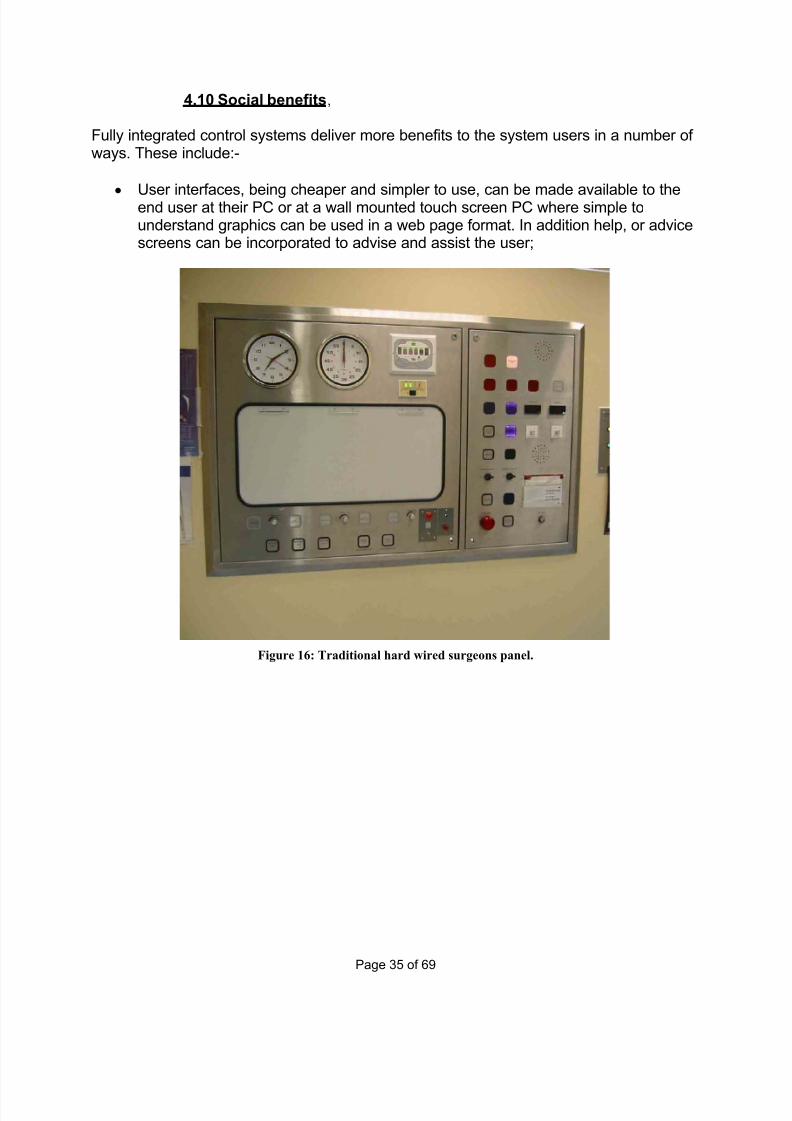
•User interfaces, being cheaper and simpler to use, can be made available to theend user at their PC or at a wall mounted touch screen PC where simple tounderstand graphics can be used in a web page format. In addition help, or advicescreens can be incorporated to advise and assist the user;
Figure 16: Traditional hard wired surgeons panel.
7/30/2019 Technical Report 1 - CEng
http://slidepdf.com/reader/full/technical-report-1-ceng 36/62
Page 36 of 69
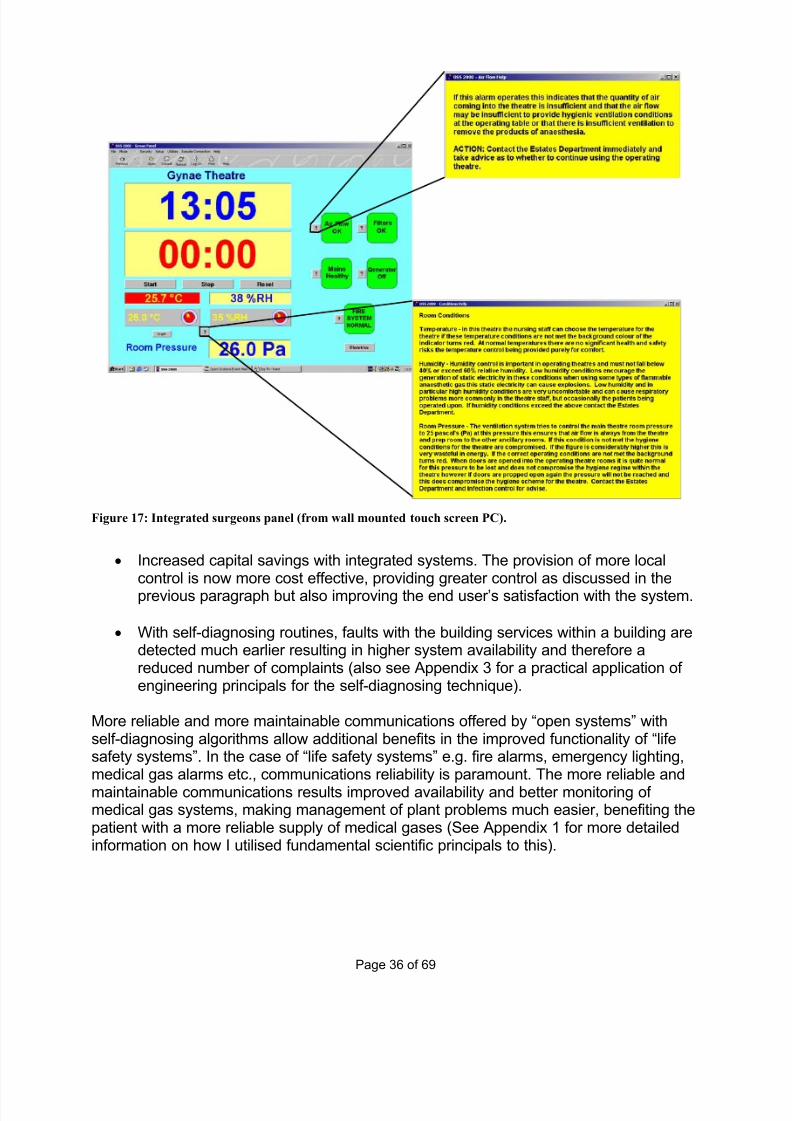
Figure 17: Integrated surgeons panel (from wall mounted touch screen PC).
• Increased capital savings with integrated systems. The provision of more localcontrol is now more cost effective, providing greater control as discussed in theprevious paragraph but also improving the end user’s satisfaction with the system.
• With self-diagnosing routines, faults with the building services within a building aredetected much earlier resulting in higher system availability and therefore areduced number of complaints (also see Appendix 3 for a practical application of engineering principals for the self-diagnosing technique).
More reliable and more maintainable communications offered by “open systems” withself-diagnosing algorithms allow additional benefits in the improved functionality of “lifesafety systems”. In the case of “life safety systems” e.g. fire alarms, emergency lighting,medical gas alarms etc., communications reliability is paramount. The more reliable andmaintainable communications results improved availability and better monitoring of medical gas systems, making management of plant problems much easier, benefiting thepatient with a more reliable supply of medical gases (See Appendix 1 for more detailedinformation on how I utilised fundamental scientific principals to this).

7/30/2019 Technical Report 1 - CEng
http://slidepdf.com/reader/full/technical-report-1-ceng 37/62
Page 37 of 69
4.11Reduced installation and commissioning requirements for integrated systems
The installation of control and monitoring systems in buildings makes up a significant partof most refurbishment and new build projects: They also require significant periods of
time to be allocated in the construction program to install and commission. Any changesto these systems that reduce the time taken to install and commission can only help theconstruction process. With even a simple building requiring six or more systems, thiswould normally require cabling to be installed for the six non-integrated systems,requiring significant support and containment systems.
In addition, significant time has to be allocated to the commissioning of these, oftenrequiring a great deal of co-ordination by the engineering contractors to ensure thespecialist contractors commissioning do not clash with the commissioning of other control and monitoring systems.
With a fully integrated system, the cabling installation is significantly reduced (see capitalcosts benefits), because one communications cable is used for all systems.
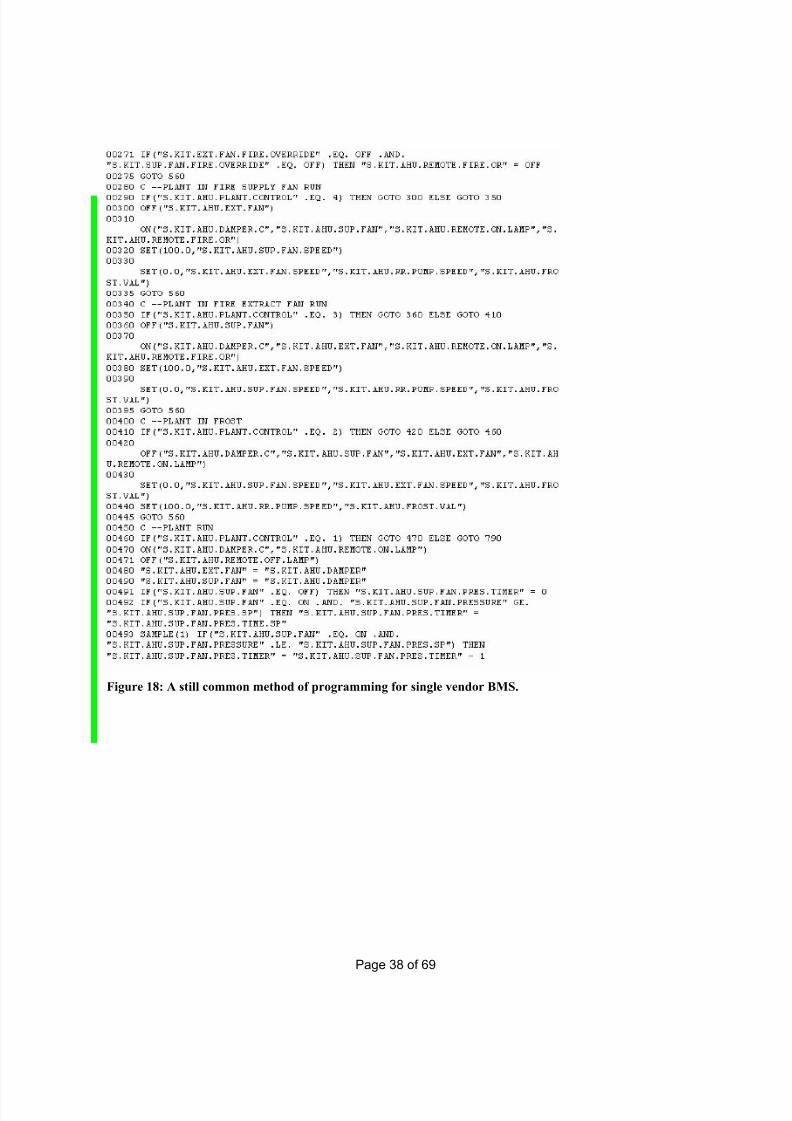
The time taken to program the system is also reduced, though even with traditionalsystems this could be reduced from the current times. The reductions with integratedsystems are greater because there are fewer companies involved. Because they are allworking on the same communications system any coordination issues between thecompanies are easily resolved. The tools used by the integrators are also standardisedfor integrated systems often using MS Visio, and smart controls visual control (seeFigure 22 and 23). These commercially available programming tools are used in manyindustries (these are rarely used to program traditional systems as the manufacturers of these use there own home grown programming tools [see figure 21], for which findingintegrators familiar with there use is more difficult).
7/30/2019 Technical Report 1 - CEng
http://slidepdf.com/reader/full/technical-report-1-ceng 38/62
Page 38 of 69
Figure 18: A still common method of programming for single vendor BMS.
7/30/2019 Technical Report 1 - CEng
http://slidepdf.com/reader/full/technical-report-1-ceng 39/62
Page 39 of 69
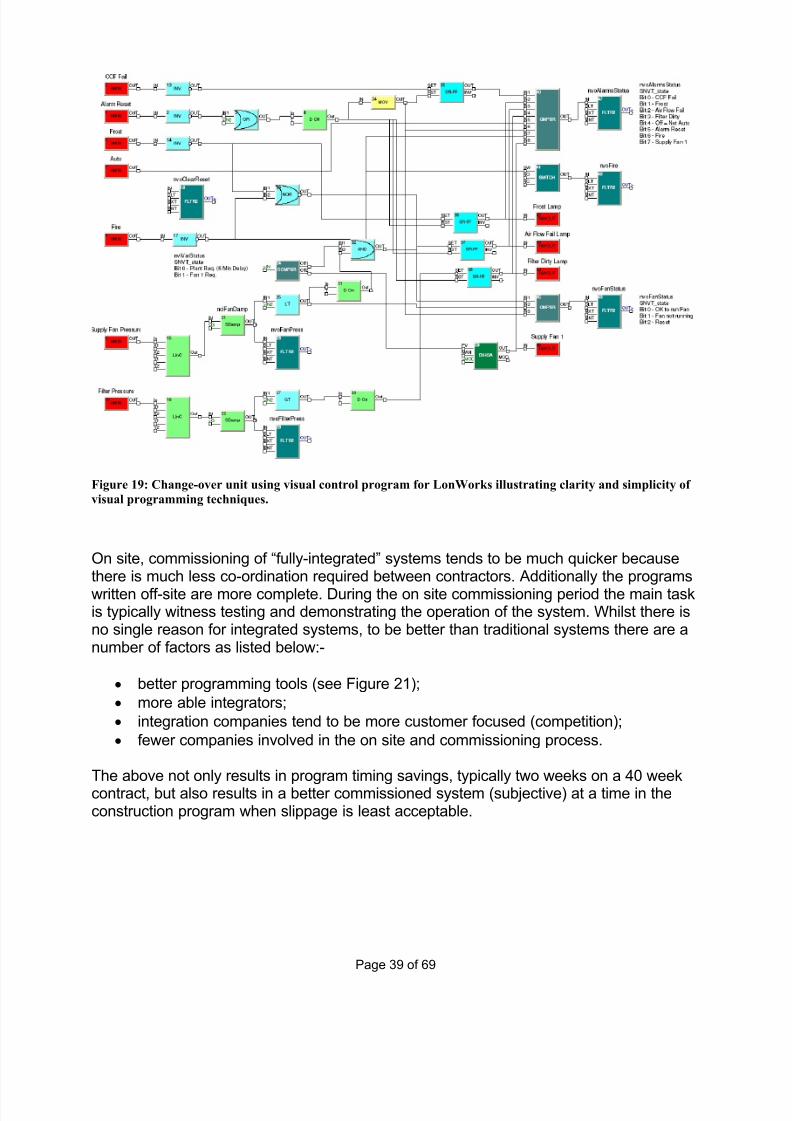
Figure 19: Change-over unit using visual control program for LonWorks illustrating clarity and simplicity of
visual programming techniques.
On site, commissioning of “fully-integrated” systems tends to be much quicker becausethere is much less co-ordination required between contractors. Additionally the programs
written off-site are more complete. During the on site commissioning period the main taskis typically witness testing and demonstrating the operation of the system. Whilst there isno single reason for integrated systems, to be better than traditional systems there are anumber of factors as listed below:-
• better programming tools (see Figure 21);
• more able integrators;
• integration companies tend to be more customer focused (competition);
• fewer companies involved in the on site and commissioning process.
The above not only results in program timing savings, typically two weeks on a 40 weekcontract, but also results in a better commissioned system (subjective) at a time in theconstruction program when slippage is least acceptable.
7/30/2019 Technical Report 1 - CEng
http://slidepdf.com/reader/full/technical-report-1-ceng 40/62
Page 40 of 69
4.12 Environmental benefits
In addition to the environmental benefits of reduced cabling and components needed for a system to perform a specified task as previously discussed, there are also benefits
arising from additional energy savings from a better commissioned and maintainedsystem (self-diagnosing).
Whilst no formal evaluation has taken place, with the large capital savings from “fully-integrated” systems, the reduction in materials (normally highly engineered) must besignificant. These continue through the buildings operational life as the sensors andgeneral components used tend to be of a higher quality and are fewer in number.Reduced replacements are also needed during the life of the building as a result.
With any products or systems, when improvements in manufacturing, design, cost, etc.are made they tend to become more commonly used. This is as true with integrated
systems as PCs and mobile phones in the past.
As with PCs, backward compatibility has allowed the market to expand and utilisecommon interfaces such as USB ports. “Open” systems are backward compatibletherefore with additions, changes and refurbishments in the future, only the componentsthat need changing will be changed.
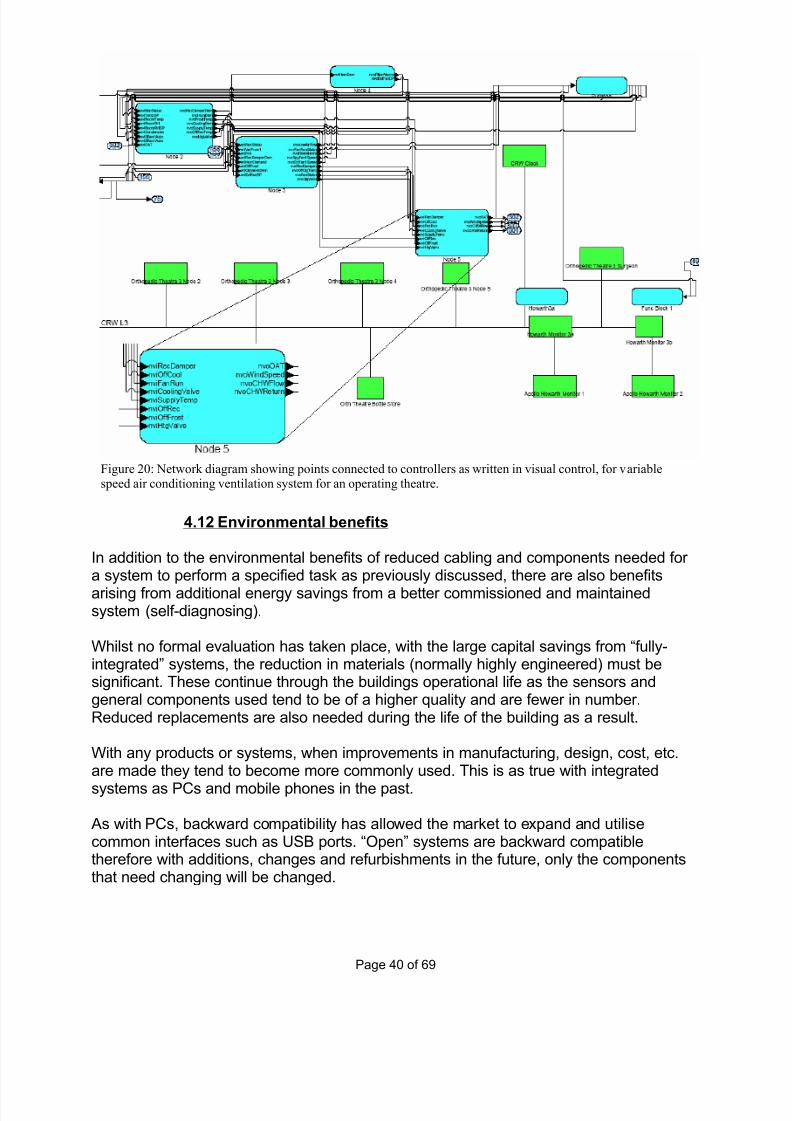
Figure 20: Network diagram showing points connected to controllers as written in visual control, for variablespeed air conditioning ventilation system for an operating theatre.

7/30/2019 Technical Report 1 - CEng
http://slidepdf.com/reader/full/technical-report-1-ceng 41/62
Page 41 of 69
Appendix 1
A different approach to Medical Gas Alarm Systems
A) Objective
In this Appendix I aim to illustrate use of appropriate software, innovation, fitness for purpose, analysis, practical problems, technical knowledge, relevant equipment (in thiscase relevant software) and application of engineering practices (in terms of design,commissioning and maintenance).
B) Advanced Medical Gas Alarm Systems
Challenge:-
To collectively improve reliability of gas flow to the patient and therefore patient safetyand gas availability.
To use reliability centred maintenance techniques making use of known system andsensor characteristics:-
To improve the effectiveness of capital expenditure on medical gas deliverysystems
To improve management of the piped medical gas installation at XXXXX Hospital,by improving system operation
To improve availability of the systems and reduce “near miss” incidents includingo Leak and incorrect cylinder change procedure alarmso Heavy usage plant alarmo Heavy gas usage warning alarmo System self monitoring techniques
B1) Reducing Capital Spend
The value of the installation at XXXXX General Hospital is in the region of £1.5Mcomprising many plants and pipe-work systems.
Over the years I have observed many design related problems including:-
• Installation of unnecessary plant;
• Install unnecessary Pipework;
• Undersized emergency manifolds (see later section for discussions on thissubject).
Designers have tended to specify either larger plant and or pipe-work installations, thedesigners sighting design flow rates from the national design standard for medical gas
7/30/2019 Technical Report 1 - CEng
http://slidepdf.com/reader/full/technical-report-1-ceng 42/62
Page 42 of 69
installations HTM 2022 5 as the reason for the new pipe installations and plant. In thecase of plant replacements even site based evidence of under utilised plant 6 (from hoursrun clocks) historically has not been accepted as evidence for sufficient existing plantcapacity.
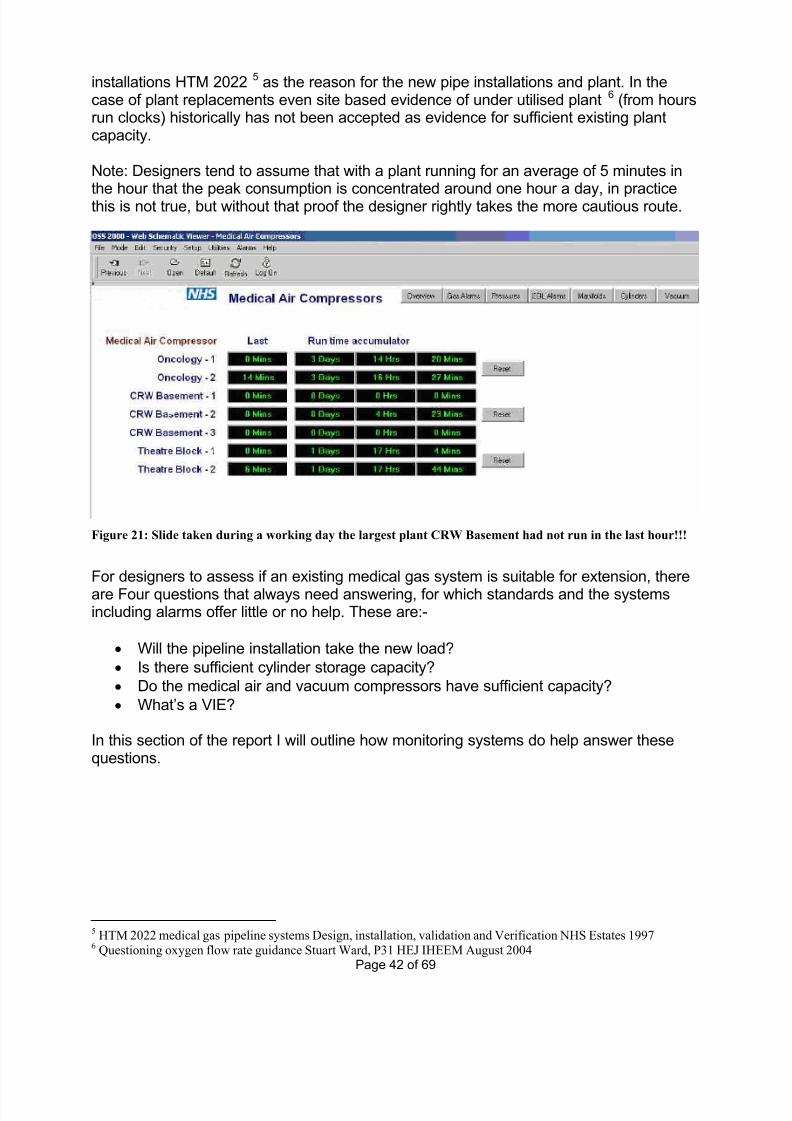
Note: Designers tend to assume that with a plant running for an average of 5 minutes in
the hour that the peak consumption is concentrated around one hour a day, in practicethis is not true, but without that proof the designer rightly takes the more cautious route.
Figure 21: Slide taken during a working day the largest plant CRW Basement had not run in the last hour!!!
For designers to assess if an existing medical gas system is suitable for extension, there
are Four questions that always need answering, for which standards and the systemsincluding alarms offer little or no help. These are:-
• Will the pipeline installation take the new load?
• Is there sufficient cylinder storage capacity?
• Do the medical air and vacuum compressors have sufficient capacity?
• What’s a VIE?
In this section of the report I will outline how monitoring systems do help answer thesequestions.
5 HTM 2022 medical gas pipeline systems Design, installation, validation and Verification NHS Estates 19976 Questioning oxygen flow rate guidance Stuart Ward, P31 HEJ IHEEM August 2004
7/30/2019 Technical Report 1 - CEng
http://slidepdf.com/reader/full/technical-report-1-ceng 43/62
Page 43 of 69
B2) Improve Availability of Systems
As medical gas installations are life support systems they are always provided withemergency back up plant, or manifolds of cylinders. On numerous occasions these havebeen found nearly empty, or just above the alarm level. In practice, in an emergency theremaining quantity of gas would be exhausted very quickly leading to a medical
emergency.
Other systems with similar problems include medical air and vacuum plant, wherecompressors are found to be running continuously, e g caused by medical gas regulatorsbeing left open (more noticeable on smaller systems).
B3) To Reduce “Near Misses’
Exampled by leaks on manifolds or only one cylinder being changed on a large manifoldhave lead to the virtual exhaustion of the gas supply system.
B4) Existing medical gas and vacuum installations
Whilst there is a well developed standard for medical gas alarms and installations,1,7,4
HTM 2022 is understandably pessimistic about gas usage and does not incorporate themonitoring techniques available from more advanced monitoring systems (the alarmsystem utilises only pressure switches) to bring advanced warning of developing plantfaults and incorrect procedures or the feed back information to allow the designinformation to be updated.
The standard was initially developed and published in 1972 as HTM 22, and came aboutafter a number of problems were experienced abroad and in the UK:-
• Supply failures
• Wrong gas administered to patient
• Poor gas quality etc.
With respect to this report the standards1,4 specify the:-
• Operating pressures of the various gas and vacuum delivery systems
• Typical design gas flow rates
• Gas alarm systems.
1. Operating Pressures
Regarding system operating pressures these are allowed to vary between predeterminedlimits to allow the practical installation of the delivery systems. These limits are set toprevent the quantity of gas delivered to the patient from varying too widely (regulation atpoint of use is by needle valve). The object of the Facilities Manager is to have installeda medical gas system that just meets these delivery pressure requirements with sufficientextra capacity installed as required.
7 NHS Model Engineering Specification C11 Medical Gases 1996
7/30/2019 Technical Report 1 - CEng
http://slidepdf.com/reader/full/technical-report-1-ceng 44/62
Page 44 of 69
2. Flow Rates
These were developed following investigations at a number of hospitals prior to thepublication of the standard, and have lead to significant over sizing of plant and pipelinesystems within the UK (and other countries)
2. The Facilities Manager’s objectives are
similar to the “operating pressures” above.
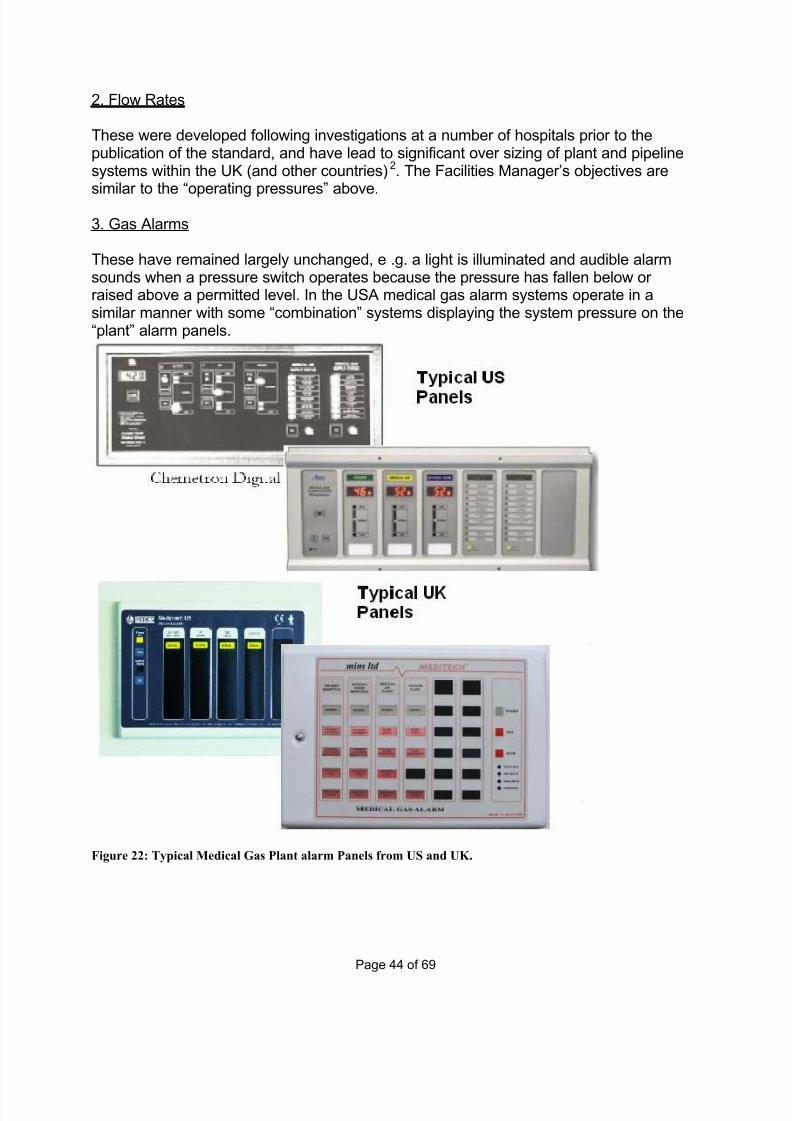
3. Gas Alarms
These have remained largely unchanged, e .g. a light is illuminated and audible alarmsounds when a pressure switch operates because the pressure has fallen below or raised above a permitted level. In the USA medical gas alarm systems operate in asimilar manner with some “combination” systems displaying the system pressure on the“plant” alarm panels.
Figure 22: Typical Medical Gas Plant alarm Panels from US and UK.
7/30/2019 Technical Report 1 - CEng
http://slidepdf.com/reader/full/technical-report-1-ceng 45/62
Page 45 of 69
In conclusion the base operating requirements are well founded, but the installationswould benefit from value engineering and would benefit operationally from conditionbased monitoring systems to improve reliability and availability8 of systems.
When the existing medical gas alarm system at XXXXX General Hospital neededreplacing I took the opportunity to address the issues raised above.
The new medical gas monitoring system (completed July 2004) comprises:-
• A traditional medical gas alarm system
• Pressure sensors located at the end of each system’s index run
• Pressure sensors located on each manifold
• Digital inputs from each compressor motor
• A screen based copy of the medical gas alarm panels, plus graphic report pagesfor the additional monitoring systems that could be viewed on any PC in the Trust.
5. Index run pressure sensors
These perform several useful functions, and I have set these to two stages of alarm bothhigh and low (vacuum high only), to give advanced warning of:-
A low pressure (high pressure for vacuum) alarm when the system is operating at near capacityOr
A faulty pressure reducing valve or valve set to the wrong pressure
Or
A faulty vacuum plant control (high pressure)
These alarms give useful automated feed back on the health of the medical gas systems.The first stage gives a warning intended to allow time for management to start planningto resolve the implications of the alarm.
6. Calculating Spare System Capacity
There are two ways the information from these sensors can be used to estimate sparecapacity on the system, these are as follows:-
8 Reliability-Centred Approach Evaluated William R Steele IHEEM February 2005
7/30/2019 Technical Report 1 - CEng
http://slidepdf.com/reader/full/technical-report-1-ceng 46/62
Page 46 of 69
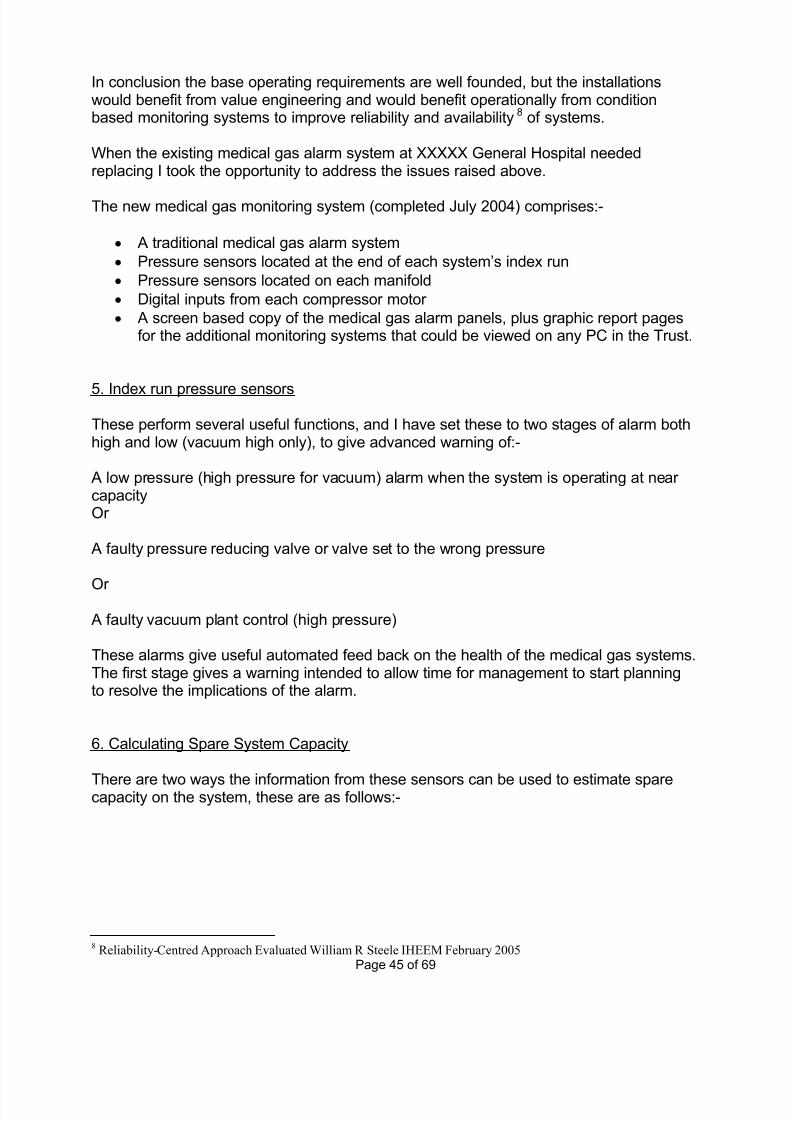
6.1. Estimation of capacity using index EOL pressure logs
System curves are used in fluid flow systems such as ventilation and wet heatingsystems to assist with fan/pump re-commissioning following system extension toestimate the new speed of the fan/impeller. This can equally be applied to medical gaspipeline installations, to ascertain the remaining spare capacity in the system as follows:-
Figure 23: Sample pressure log for EOL pressure sensor on index run of Oxygen pipeline.
Data
Permitted supply pressure tolerance at ward or departments1 Table 19
±20%Maximum pressure tolerance at ward or departments 4.92 bar
Minimum pressure tolerance at ward or departments )( min Dep 3.28 bar
Actual line pressure at pressure reducing valve oxygen(adjusted for accuracy) )( o P 4.8 bar
Minimum line pressure at EOL (end of line) from log (index run) )( min EOL 4.25 bar
Maximum line pressure at EOL (information only) 4.6 bar Monitoring Sensor overall accuracy )( PS ±0.01 bar
Alarm Pressure Switch operating differential )( DP 0.1 bar
Note system nominal design operating pressure is 4.0 bar
To find the working pressures available after sensor accuracies are taken into account

7/30/2019 Technical Report 1 - CEng
http://slidepdf.com/reader/full/technical-report-1-ceng 47/62
Page 47 of 69
Minimum pressure at index run )( 2i P
bar
P DP Dep i
38.31.028.3
2min
=+
=+
Note: In the current edition of HTM 2022 the minimum pressure at the face of theterminal is required to be 3.55bar this has been used in this calculation and not the areaalarm low pressure setting. Note this pressure is at variance with the low pressure alarm
)( min Dep
Minimum line pressure at EOL )( 1i P
bar
P PS EOL i
24.41.025.4
1min
=−
=−
The system curve formula may be adapted to give the available capacity expressed as aratio or percentage
( )2Qk R =
Because at this point the system has not been altered the system constant will remainunchanged and cancelled out. The formula can be developed to give the revised value of R if the volume flow of the system is increased
2
1
2
1
2
2
1
2
1
2
=
=
Q
Q
R
R
k k
R R
R in this case is the differential pressure between the supply pressure and the end of index run pressure.
The formula can be modified to:-
2
1
2
11
22
2
1
2
1
2
=
−
−
=
Q
Q
P P
P P
Q
Q
R
R
io
io
As with this method of calculation the initial volume flow rate is not known, 2Q can only
be represented as a ratio of 1Q
7/30/2019 Technical Report 1 - CEng
http://slidepdf.com/reader/full/technical-report-1-ceng 48/62
Page 48 of 69
1
2
11
22
2
1
2
11
22
Q
Q
P P
P P
Q
Q
P P
P P
io
io
io
io
=−
−
=
−
−
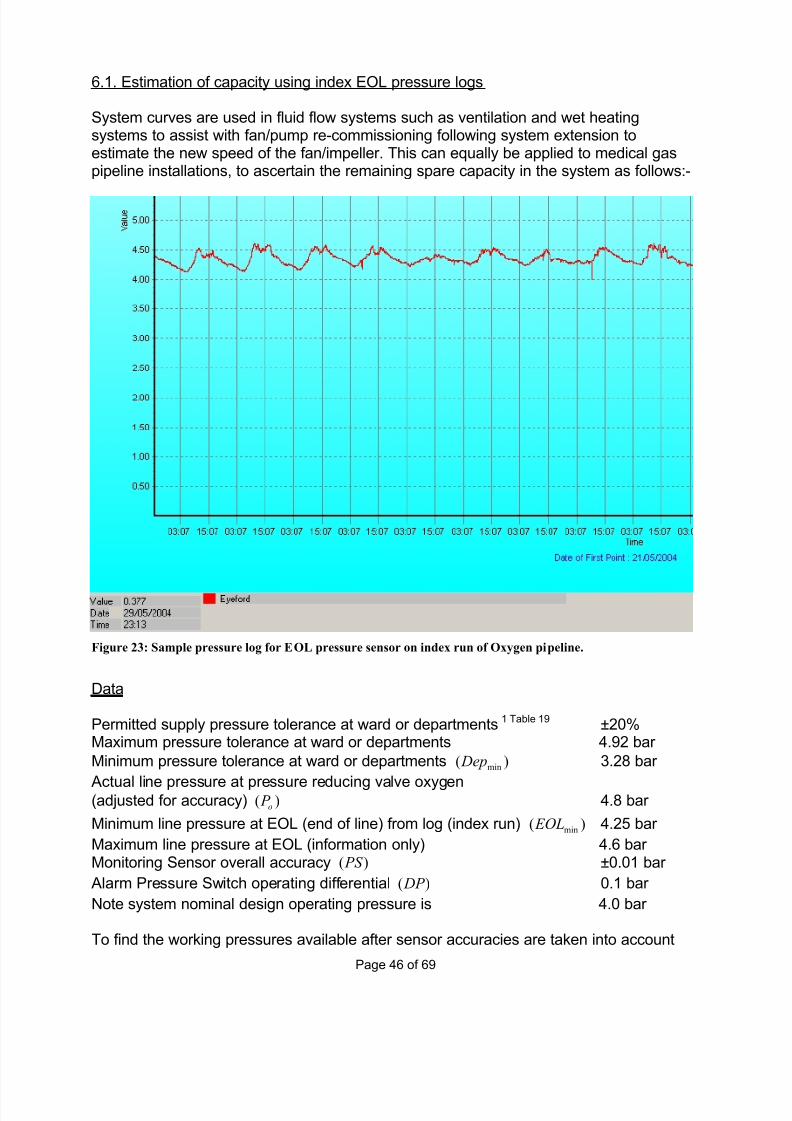
To substitute percentage capacity available %)(cap the volume flow aspects are
modified as follows:-
( ) %1001
11
22
1
2
11
22
capQ
and
Q P P
P P
Q
Q
P P
P P
Ratio
Ratio
io
io
io
io
=•−
=−
−
=−
−
Substituting data gives
( )( ) %49100149.1
%1001
49.124.48.4
55.38.4
11
22
=•−=•−
=−
−
=−
−
capQ
and
Q P P
P P
Ratio
Ratio
io
io
This figure is of direct use when evaluating spare system capacity to allow for futureincrease in consumption over the site. If an additional load is proposed e.g. a wardblock, from this capacity calculation it may be safe to conclude the system has sufficientcapacity for the new load without further calculation, dependant of the new loads point of connection.
To determine if an existing system has sufficient capacity for a planned extension isdifficult, there are rarely if ever devices e g meters recording flow or pressure. Thedesigner has little to go on. The traditional approach is to load up the system schematicwith the theoretical loads based on the diversified flow rates given in the various sectionsof HTM 2022:1997. These are perceived by the industry2 as a whole as being over pessimistic leading to over design, so these flow diversities, when applied to the existingsystem lead the designer to think there is little scope for accommodating additionalloads.
7/30/2019 Technical Report 1 - CEng
http://slidepdf.com/reader/full/technical-report-1-ceng 49/62
Page 49 of 69
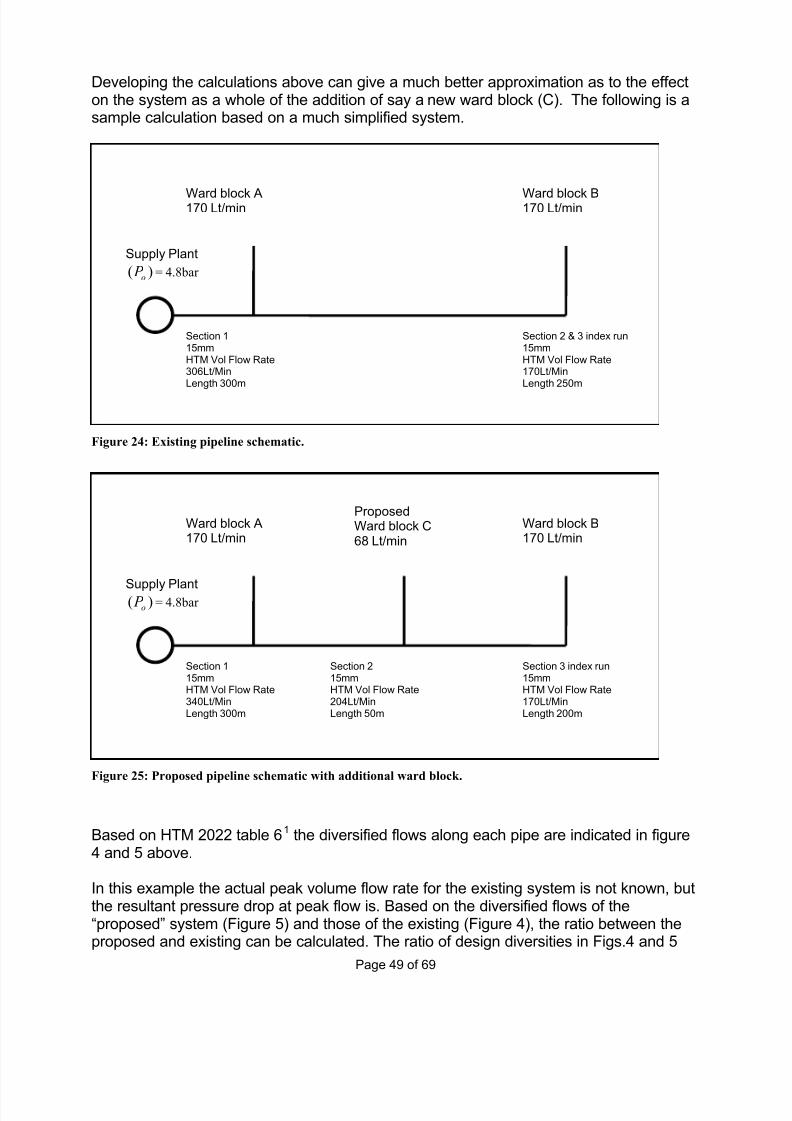
Developing the calculations above can give a much better approximation as to the effecton the system as a whole of the addition of say a new ward block (C). The following is asample calculation based on a much simplified system.
Figure 24: Existing pipeline schematic.
Figure 25: Proposed pipeline schematic with additional ward block.
Based on HTM 2022 table 61 the diversified flows along each pipe are indicated in figure4 and 5 above.
In this example the actual peak volume flow rate for the existing system is not known, butthe resultant pressure drop at peak flow is. Based on the diversified flows of the“proposed” system (Figure 5) and those of the existing (Figure 4), the ratio between theproposed and existing can be calculated. The ratio of design diversities in Figs.4 and 5
Ward block A170 Lt/min
Ward block B170 Lt/min
Section 115mmHTM Vol Flow Rate306Lt/MinLength 300m
Section 2 & 3 index run15mmHTM Vol Flow Rate170Lt/MinLength 250m
Supply Plant
)( o P = 4.8bar
Ward block A170 Lt/min
ProposedWard block C68 Lt/min
Ward block B170 Lt/min
Section 115mmHTM Vol Flow Rate340Lt/MinLength 300m
Section 215mmHTM Vol Flow Rate204Lt/MinLength 50m
Section 3 index run15mmHTM Vol Flow Rate170Lt/MinLength 200m
Supply Plant)( o P = 4.8bar

7/30/2019 Technical Report 1 - CEng
http://slidepdf.com/reader/full/technical-report-1-ceng 50/62
Page 50 of 69
indicates the peak flow rate would increase by 11% (340Lt/min/306Lt/min), and to thisshould be added a contingency dependent on where the connection is to be maderelative to the point of origin. If the calculated spare capacity were in the region of 30%the risk should be minimal, because this is based on the peak actual oxygenrequirements from the wards. Finally the pipeline resistances can be calculated to checkthe pipe installation, can pass the increased flow to the point of connection. A worked
example based on Figures 4 and 5 is outlined in Tables 1 and 2. Tables 3 and 4 givecomparisons with HTM 2022 diversified flows.
The designer has a much improved basis from these index run pressure logs for makingdesign decisions. Without this information, there is no physical basis for decisionmaking, unless the area alarms have warned of low pressure in the past. Pressureswitches give no idea of how close the system is to failing, however the common practiceof supplies to new wards being run from the plant and not the pipeline that can take theadditional flow.
In practice an additional load on the system will be connected to a single point of thepipe-work installation. One of the disadvantages of pressure switch alarms is that theoperator of the system has no idea what the actual system pressure is downstream of the supply pressure gauge. If there is no alarm registered, the only conclusion that canbe drawn is that the line pressure is above the minimum and below the maximumpermitted. The advantage with pressure sensors is they display the actual pressure andif these are logged at one minute intervals, the quantity of pressure data makes aninformed decision very much easier.
The minimum line pressure recorded in the log indicates the time of maximum flow onthe system, as outlined in the calculations above. Note, in theory if all the outlets at theend of the index run were open and few at the origin of the pipeline, it is possible for thisto record a low line pressure at the end of the index run, because of the high flowthrough the relatively small pipes at the end of the system. Statistically this is not likely,however if most of the load is near to the origin of the system, this will have a lesser effect on the end of line pressure, resulting in a slightly higher pressure at the end of linepressure sensor than the actual load would suggest. For these reasons it is sensible toallow a contingency to cover this eventuality.
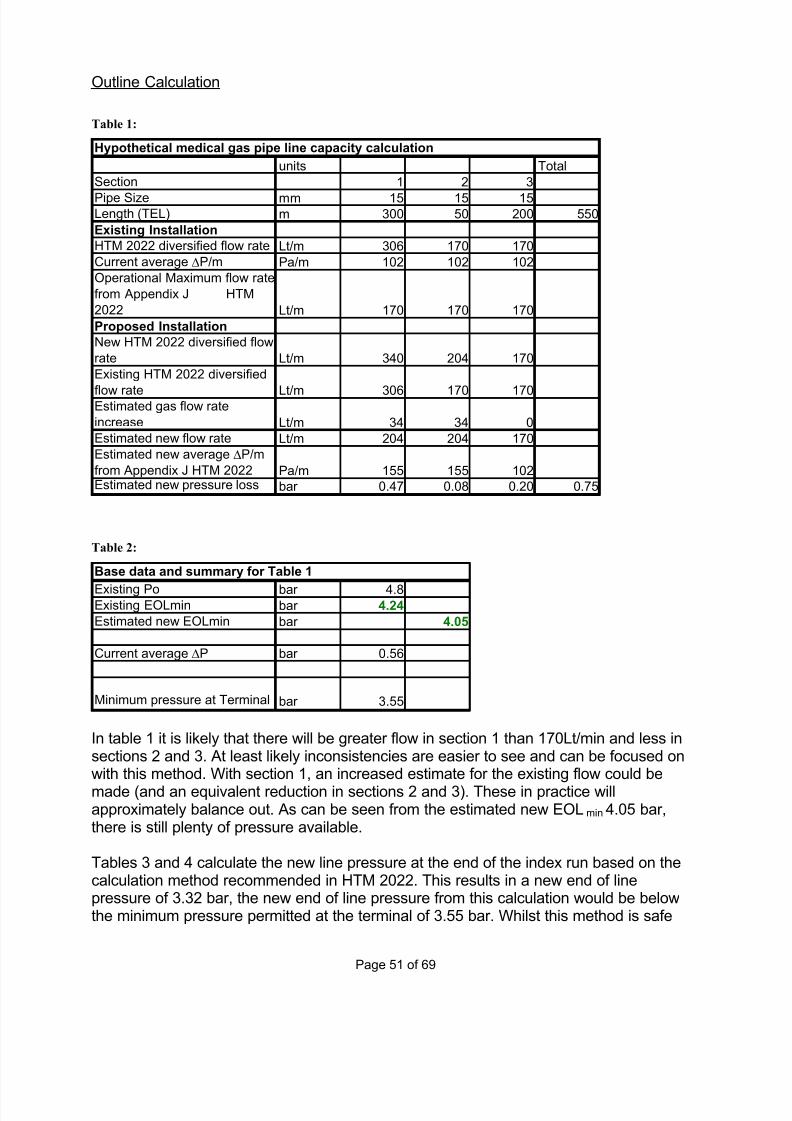
7/30/2019 Technical Report 1 - CEng
http://slidepdf.com/reader/full/technical-report-1-ceng 51/62
Page 51 of 69
Outline Calculation
Table 1:
units Total
Section 1 2 3
Pipe Size mm 15 15 15Length (TEL) m 300 50 200 550
Existing Installation
HTM 2022 diversified flow rate Lt/m 306 170 170
Current average ∆P/m Pa/m 102 102 102
Operational Maximum flow rate
from Appendix J HTM
2022 Lt/m 170 170 170
Proposed Installation
New HTM 2022 diversified flow
rate Lt/m 340 204 170
Existing HTM 2022 diversified
flow rate Lt/m 306 170 170Estimated gas flow rate
increase Lt/m 34 34 0
Estimated new flow rate Lt/m 204 204 170
Estimated new average ∆P/m
from Appendix J HTM 2022 Pa/m 155 155 102Estimated new pressure loss bar 0.47 0.08 0.20 0.75
Hypothetical medical gas pipe line capacity calculation
Table 2:
Existing Po bar 4.8Existing EOLmin bar 4.24
Estimated new EOLmin bar 4.05
Current average ∆P bar 0.56
Minimum pressure at Terminal bar 3.55
Base data and summary for Table 1
In table 1 it is likely that there will be greater flow in section 1 than 170Lt/min and less insections 2 and 3. At least likely inconsistencies are easier to see and can be focused onwith this method. With section 1, an increased estimate for the existing flow could bemade (and an equivalent reduction in sections 2 and 3). These in practice willapproximately balance out. As can be seen from the estimated new EOLmin 4.05 bar,there is still plenty of pressure available.
Tables 3 and 4 calculate the new line pressure at the end of the index run based on thecalculation method recommended in HTM 2022. This results in a new end of linepressure of 3.32 bar, the new end of line pressure from this calculation would be belowthe minimum pressure permitted at the terminal of 3.55 bar. Whilst this method is safe
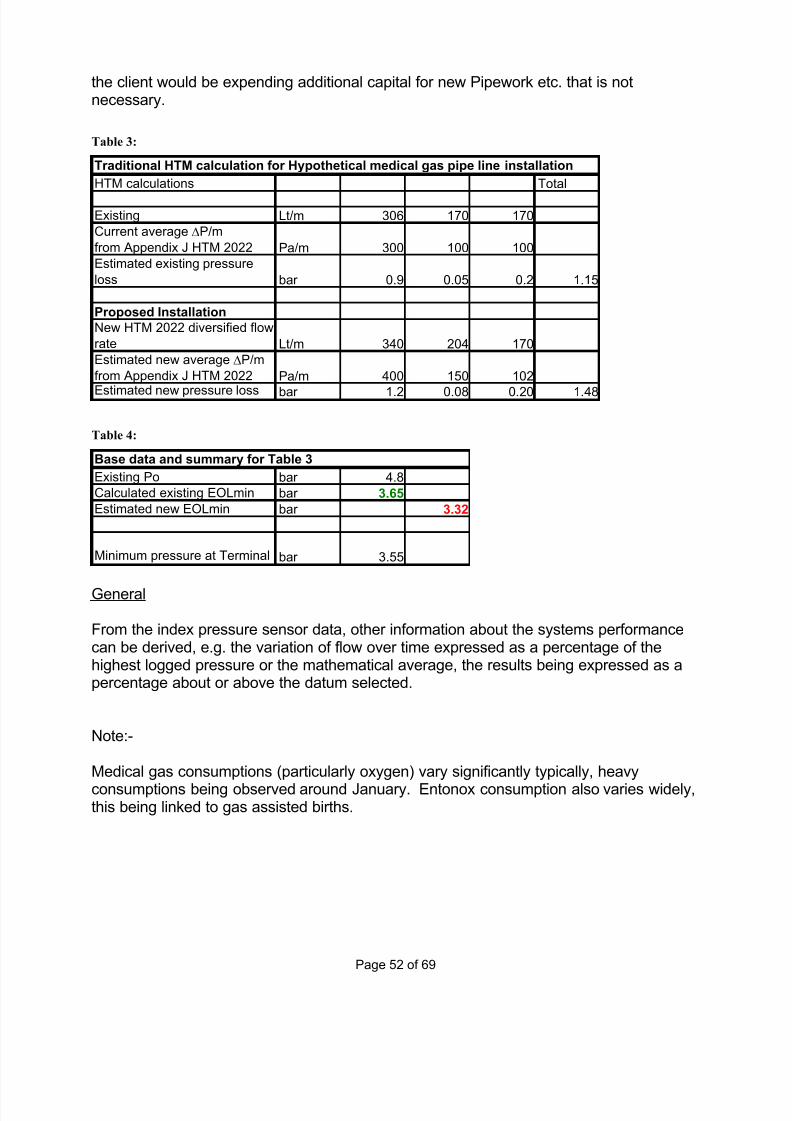
7/30/2019 Technical Report 1 - CEng
http://slidepdf.com/reader/full/technical-report-1-ceng 52/62
Page 52 of 69
the client would be expending additional capital for new Pipework etc. that is notnecessary.
Table 3:
HTM calculations Total
Existing Lt/m 306 170 170
Current average ∆P/m
from Appendix J HTM 2022 Pa/m 300 100 100
Estimated existing pressure
loss bar 0.9 0.05 0.2 1.15
Proposed Installation
New HTM 2022 diversified flow
rate Lt/m 340 204 170
Estimated new average ∆P/m
from Appendix J HTM 2022 Pa/m 400 150 102
Estimated new pressure loss bar 1.2 0.08 0.20 1.48
Traditional HTM calculation for Hypothetical medical gas pipe line installation
Table 4:
Existing Po bar 4.8
Calculated existing EOLmin bar 3.65
Estimated new EOLmin bar 3.32
Minimum pressure at Terminal bar 3.55
Base data and summary for Table 3
General
From the index pressure sensor data, other information about the systems performancecan be derived, e.g. the variation of flow over time expressed as a percentage of thehighest logged pressure or the mathematical average, the results being expressed as apercentage about or above the datum selected.
Note:-
Medical gas consumptions (particularly oxygen) vary significantly typically, heavy
consumptions being observed around January. Entonox consumption also varies widely,this being linked to gas assisted births.

7/30/2019 Technical Report 1 - CEng
http://slidepdf.com/reader/full/technical-report-1-ceng 53/62
Page 53 of 69
6.2 Estimation of Capacity using Index EOL Pressure Logs and usage Logs
An approximation of available system capacity can be gained by the pressure changeobserved in the index sensor, the supply pressure at the origin of the supply system(physical pressure gauge), and the quantity of gas used. The method of logging the gas
quantity consumed is discussed later.
For useful information to be gained, during the sample period neither the pressuresensor at the origin of the system or the index run pressure sensor should be adjusted.
Also there should be no gaps in the usage log.
The resultant capacity information can be used as a guide to indicate the general extracapacity available for additional gas usage. The figure is only true if the increase isapplied to all points of gas usage in the system at the same rate, this in itself is useful e goxygen usage is currently increasing at 4% to 6% per year. This can be projectedforward to help generate an action plan, to modify the system, before problems arise.
As with estimating system capacity using index EOL pressure logs above, the sameformula can be used to form the basis for this calculation technique.
1
2
11
22
Q
Q
P P
P P
io
io =−
−
In this case the EOL index pressure sensor log is viewed and the time is recorded withthe value of the lowest pressure. The corresponding manifold pressure log can beretrieved, and the pressure differential decrease calculated. From this the peak flow canbe calculated.
)( 1Q Can now be inserted in to the equation to give the value for )( 2Q
Note: It would also be possible to use the manifold pressure logs to calculate themaximum pressure loss, but this is more complex to identify with readily availablesoftware. It is easier to search for a minimum end of line pressure in a spread sheet.
As can be seen above these techniques give a much better approximation to better enable effective management of medical gas pipeline systems.
In conclusion information gained in this way can be used to provide proof that there issufficient capacity to allow extensions of the system, leading to an overall capital spendreduction, often far in excess of the capital cost to install the monitoring system(£30,000). Precautions should still be taken when interpreting the information from thesystem. The installation of these additional sensors has a further advantage in that whenthe extension is completed, it provides a 1st and 2nd stage monitoring system to provepressure drops are within the specified requirements (also providing feed back to refinethe design process).
6.3 Active Monitoring of Emergency Medical Gas Manifolds
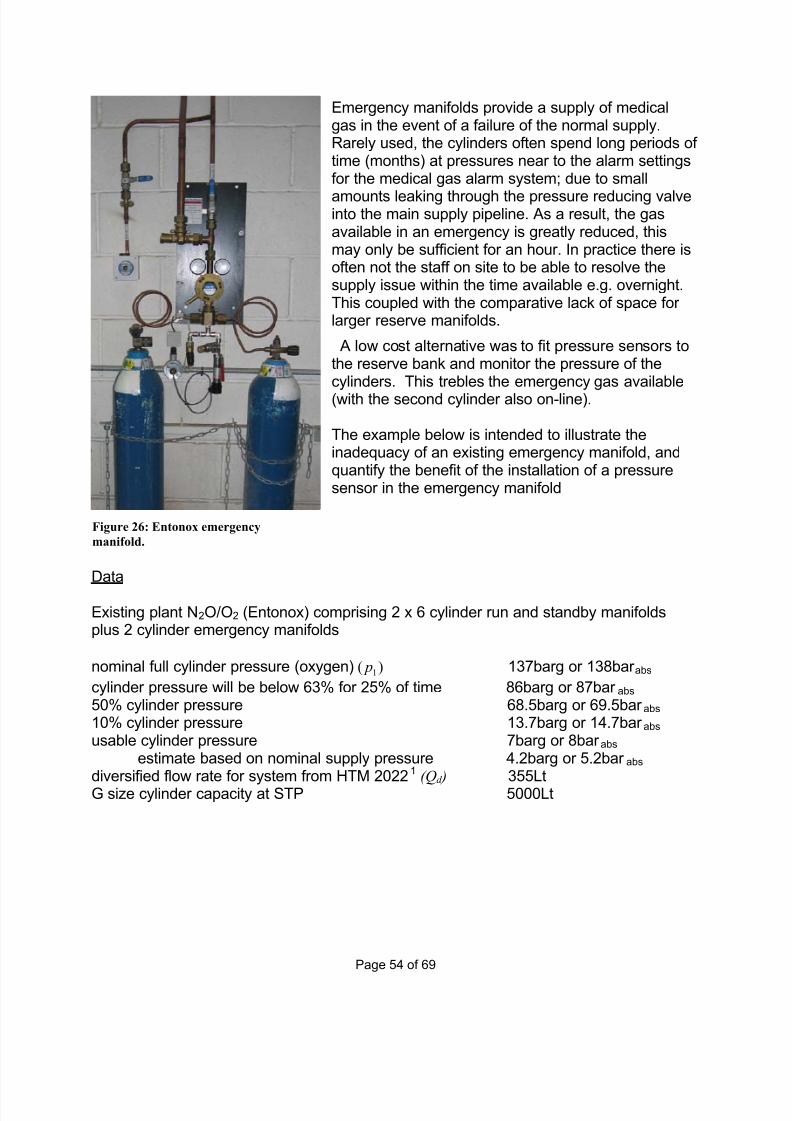
7/30/2019 Technical Report 1 - CEng
http://slidepdf.com/reader/full/technical-report-1-ceng 54/62
Page 54 of 69
Emergency manifolds provide a supply of medicalgas in the event of a failure of the normal supply.Rarely used, the cylinders often spend long periods of time (months) at pressures near to the alarm settingsfor the medical gas alarm system; due to small
amounts leaking through the pressure reducing valveinto the main supply pipeline. As a result, the gasavailable in an emergency is greatly reduced, thismay only be sufficient for an hour. In practice there isoften not the staff on site to be able to resolve thesupply issue within the time available e.g. overnight.This coupled with the comparative lack of space for larger reserve manifolds.
A low cost alternative was to fit pressure sensors tothe reserve bank and monitor the pressure of thecylinders. This trebles the emergency gas available(with the second cylinder also on-line).
The example below is intended to illustrate theinadequacy of an existing emergency manifold, andquantify the benefit of the installation of a pressuresensor in the emergency manifold
Data
Existing plant N2O/O2 (Entonox) comprising 2 x 6 cylinder run and standby manifoldsplus 2 cylinder emergency manifolds
nominal full cylinder pressure (oxygen) )( 1 p 137barg or 138bar abs
cylinder pressure will be below 63% for 25% of time 86barg or 87bar abs 50% cylinder pressure 68.5barg or 69.5bar abs 10% cylinder pressure 13.7barg or 14.7bar abs usable cylinder pressure 7barg or 8bar abs
estimate based on nominal supply pressure 4.2barg or 5.2bar abs diversified flow rate for system from HTM 20221 (Qd ) 355LtG size cylinder capacity at STP 5000Lt
Figure 26: Entonox emergency
manifold.
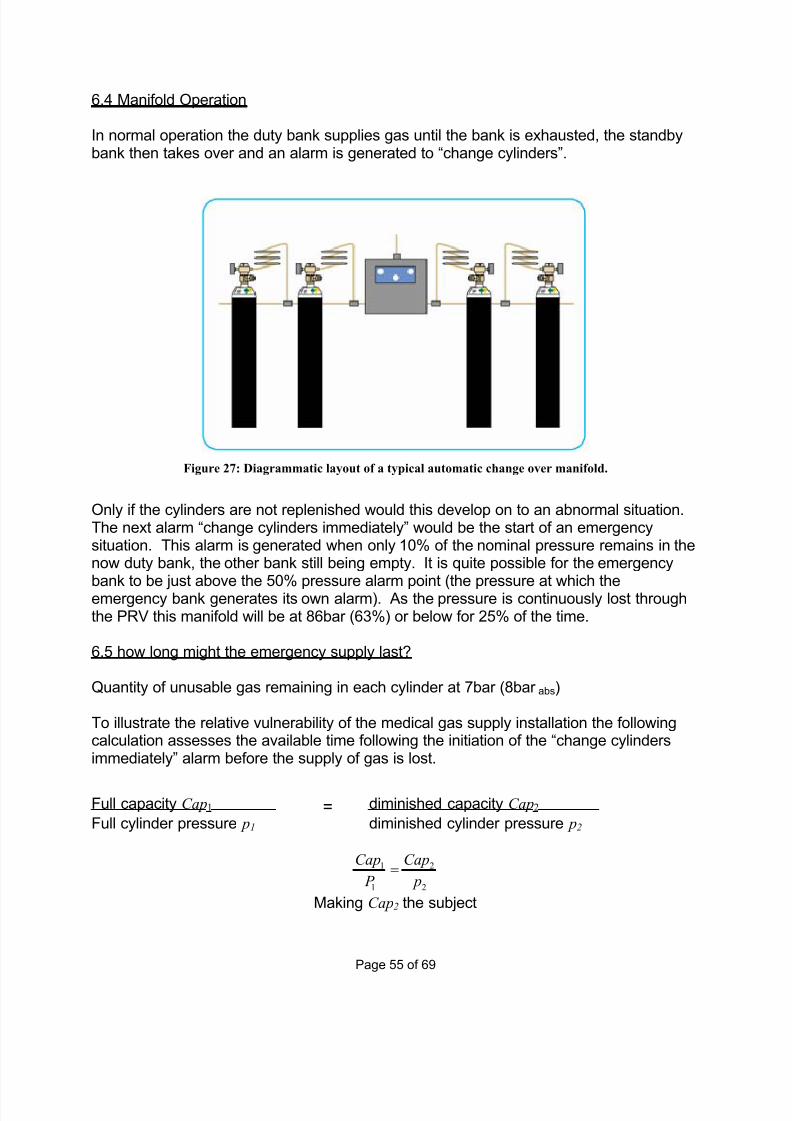
7/30/2019 Technical Report 1 - CEng
http://slidepdf.com/reader/full/technical-report-1-ceng 55/62
Page 55 of 69
6.4 Manifold Operation
In normal operation the duty bank supplies gas until the bank is exhausted, the standbybank then takes over and an alarm is generated to “change cylinders”.
Figure 27: Diagrammatic layout of a typical automatic change over manifold.
Only if the cylinders are not replenished would this develop on to an abnormal situation.The next alarm “change cylinders immediately” would be the start of an emergencysituation. This alarm is generated when only 10% of the nominal pressure remains in thenow duty bank, the other bank still being empty. It is quite possible for the emergencybank to be just above the 50% pressure alarm point (the pressure at which theemergency bank generates its own alarm). As the pressure is continuously lost throughthe PRV this manifold will be at 86bar (63%) or below for 25% of the time.
6.5 how long might the emergency supply last?
Quantity of unusable gas remaining in each cylinder at 7bar (8bar abs)
To illustrate the relative vulnerability of the medical gas supply installation the followingcalculation assesses the available time following the initiation of the “change cylindersimmediately” alarm before the supply of gas is lost.
Full capacity Cap1 = diminished capacity Cap2
Full cylinder pressure p1 diminished cylinder pressure p2
2
2
1
1
p
Cap
P
Cap=
Making Cap2 the subject

7/30/2019 Technical Report 1 - CEng
http://slidepdf.com/reader/full/technical-report-1-ceng 56/62
Page 56 of 69
Lt Capor
Lt Cap
Cap
P
pCapCap
barabs 290
290
138
85000
8
2
2
1
212
=
=
•=
=
Usable gas for a cylinder at 10% nominal pressure (Cap14.7barabs )
Lt Cap
Cap
or
Lt Cap
Cap
P
pCapCap
barabs
barabs
242
290532
532
138
7.145000
7.14
7.14
2
2
1
212
=
−=
=
•=
=
Usable gas for a cylinder at 63% nominal pressure (Cap87barabs )
Lt Cap
Cap
or
Lt Cap
Cap
P
pCapCap
barabs
barabs
2862
2903152
3152
138
875000
87
87
2
2
1
212
=
−=
=
•=
=
Gas available for use as the “change cylinders immediately” alarm is initiated
6No. cylinders at 10% (Duty)
Lt Duty
Duty
CylindersCap Duty barabs
1452
6242
7.14
=
×=
•=
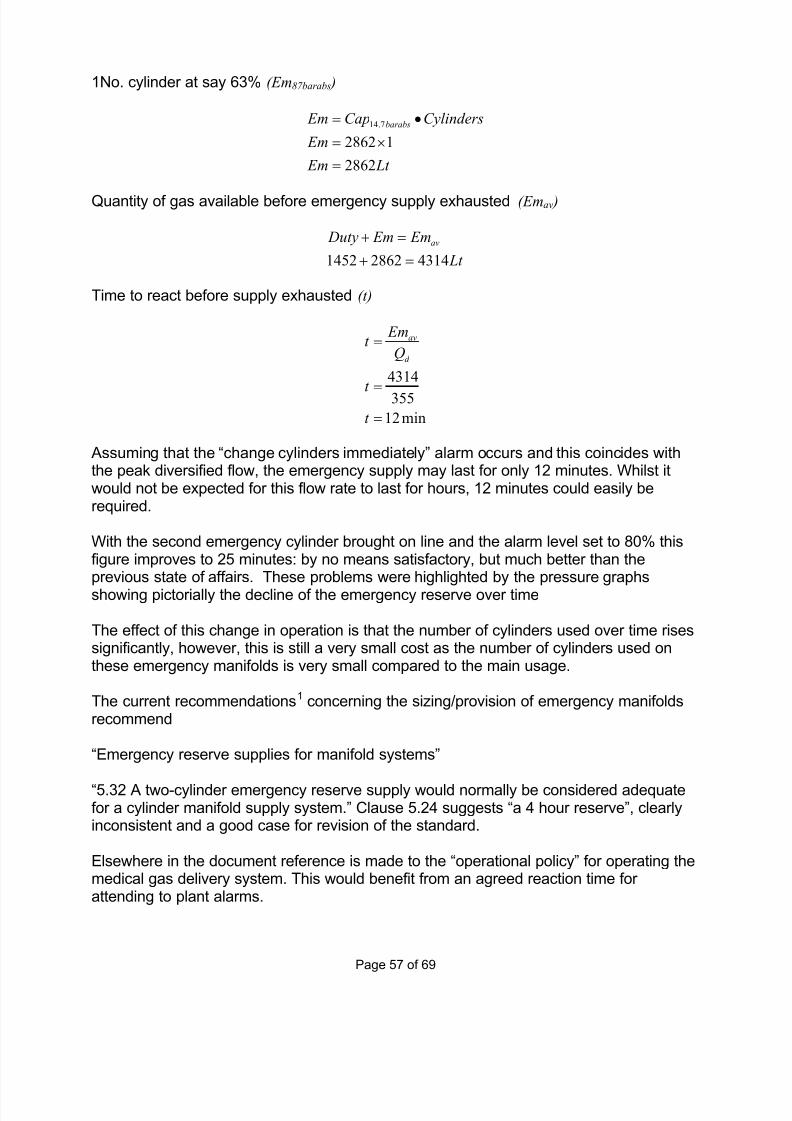
7/30/2019 Technical Report 1 - CEng
http://slidepdf.com/reader/full/technical-report-1-ceng 57/62
Page 57 of 69
1No. cylinder at say 63% (Em87barabs )
Lt Em
Em
CylindersCap Em barabs
2862
12862
7.14
=
×=
•=
Quantity of gas available before emergency supply exhausted (Emav )
Lt
Em Em Duty av
431428621452 =+
=+
Time to react before supply exhausted (t)
min12
355
4314
=
=
=
t
t
Q
Emt
d
av
Assuming that the “change cylinders immediately” alarm occurs and this coincides withthe peak diversified flow, the emergency supply may last for only 12 minutes. Whilst itwould not be expected for this flow rate to last for hours, 12 minutes could easily berequired.
With the second emergency cylinder brought on line and the alarm level set to 80% thisfigure improves to 25 minutes: by no means satisfactory, but much better than theprevious state of affairs. These problems were highlighted by the pressure graphs
showing pictorially the decline of the emergency reserve over time
The effect of this change in operation is that the number of cylinders used over time risessignificantly, however, this is still a very small cost as the number of cylinders used onthese emergency manifolds is very small compared to the main usage.
The current recommendations1 concerning the sizing/provision of emergency manifoldsrecommend
“Emergency reserve supplies for manifold systems”
“5.32 A two-cylinder emergency reserve supply would normally be considered adequatefor a cylinder manifold supply system.” Clause 5.24 suggests “a 4 hour reserve”, clearlyinconsistent and a good case for revision of the standard.
Elsewhere in the document reference is made to the “operational policy” for operating themedical gas delivery system. This would benefit from an agreed reaction time for attending to plant alarms.

7/30/2019 Technical Report 1 - CEng
http://slidepdf.com/reader/full/technical-report-1-ceng 58/62
Page 58 of 69
It should be noted that the guidance only contains information on peak diversified flowrates, not prolonged consumption rates that would be necessary to assist with the correctsizing of emergency manifolds.
The pressure sensor provides additional facilities to improve reliability and availability,these are:-
• Monitor pressure to both cylinders and change at 80%
• Monitor pressure to detect a leak or a leaking Pressure Reduction Valve
• The reserve of gas is observable at all times
• The gas pressure is logged for record purposes (good controls assurance)
• The pressure sensor is notionally recalibrated each time the cylinders arechanged (see note below).
Note: The pressure sensor cannot in this case be self tested by using say the averagepeak pressure of say the last four cylinder pressure changes. Whilst this would negatemost of the effect of the new cylinder pressures for temperature effects on pressure
between summer and winter (approximately 9% from 30 deg c to 5 deg c). Any sensor drift will also be included in this average, so it would not be sensible to recalibrate thepressure sensor each time the cylinders are change. Instead the sensor could calibrateitself to say ±10% of the nominal full cylinder pressure. As yet this has not been set up.

7/30/2019 Technical Report 1 - CEng
http://slidepdf.com/reader/full/technical-report-1-ceng 59/62
Page 59 of 69
6.6 Pressure changes in cylinders due to temperature change
To demonstrate the variance of pressure in medical gas cylinders under differingtemperatures e.g. summer/winter
Data
Summer temperature in manifold room maximum )( 2T 30°C or 303°K
Winter temperature in manifold room minimum )( 1T 5°C or 278°K
Nominal full cylinder pressure (oxygen) )( 1 p 137barg or 138bar abs
From a combination of Charles’s Law and Boyle’s Law
2
22
1
11
T
v p
T
v p=
As cylinder volume is constant 21 vv =
absbar p
p
T
T p p
v
v
T
T p p
150
278
303138
2
2
1
212
2
1
1
212
=
•=
=
•=
Or about 9%
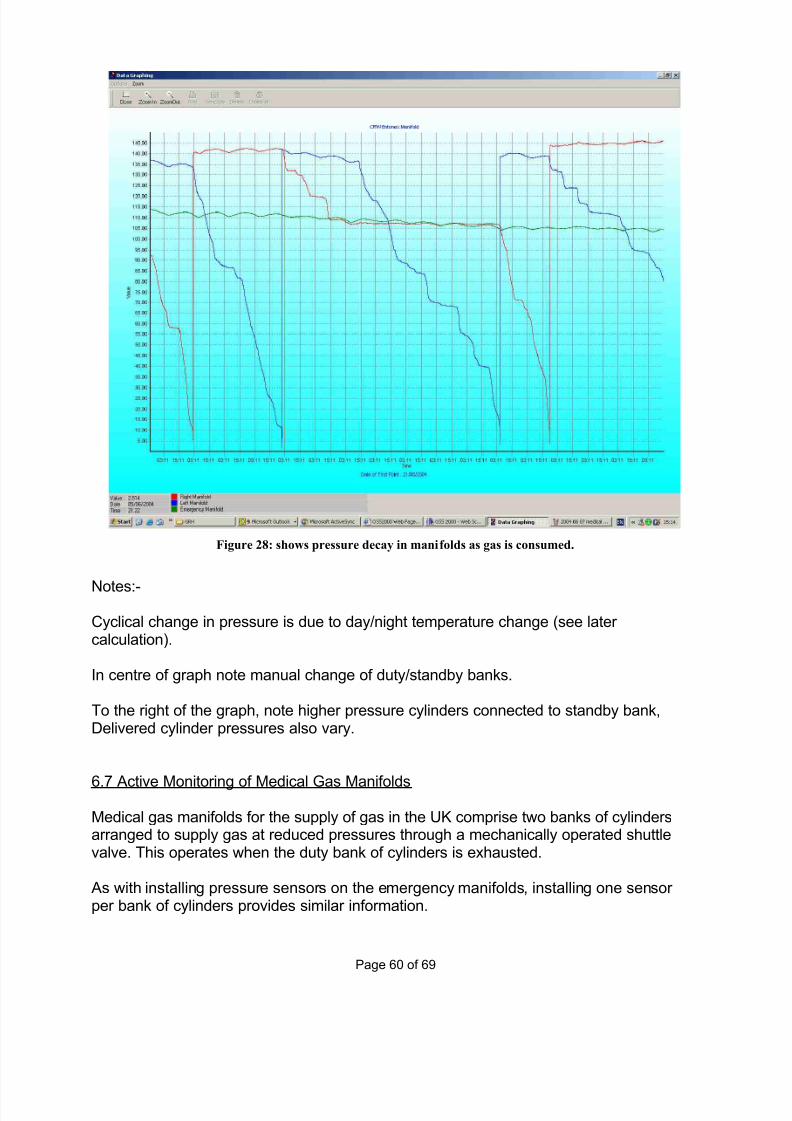
7/30/2019 Technical Report 1 - CEng
http://slidepdf.com/reader/full/technical-report-1-ceng 60/62
Page 60 of 69
Figure 28: shows pressure decay in manifolds as gas is consumed.
Notes:-
Cyclical change in pressure is due to day/night temperature change (see later calculation).
In centre of graph note manual change of duty/standby banks.
To the right of the graph, note higher pressure cylinders connected to standby bank,Delivered cylinder pressures also vary.
6.7 Active Monitoring of Medical Gas Manifolds
Medical gas manifolds for the supply of gas in the UK comprise two banks of cylindersarranged to supply gas at reduced pressures through a mechanically operated shuttlevalve. This operates when the duty bank of cylinders is exhausted.
As with installing pressure sensors on the emergency manifolds, installing one sensor per bank of cylinders provides similar information.

7/30/2019 Technical Report 1 - CEng
http://slidepdf.com/reader/full/technical-report-1-ceng 61/62
Page 61 of 69
These sensors can be used to provide information that can be used to prove “sparecapacity” or verify the satisfactory delivery pressure of the Pipework system as discussedabove.
Additionally these sensors are used to reduce the occurrence of “near misses”associated with the medical gas installation by detecting:-
• When only one cylinder is changed in a bank of cylinders,
• A leak on a bank of cylinders
• The quantity of gas used over a period of time
• The rate of gas flow does not exceed the manufacturer’s recommendations
• A ‘self’ calibration routine can be set up for manifold sensors
• The system can record (from logs) how long cylinder changes take
6.7 Incorrect cylinder change and leak detection procedure
Normally when cylinders are changed, all are replaced at the same time, however, onseveral occasions in the past only one has been changed leaving only one full cylinder on a bank of perhaps six,
Unfortunately, because of the design of current medical gas alarm systems the action of changing the first cylinder satisfies the audible and visual alarm. Therefore, when thebank is next “on line” the bank becomes exhausted in approximately one sixth of thenormal time. This will always occur when the other bank is empty!!
For the hospital, the bank has just changed over and the cylinders need changing (aprocess that can take time in a busy hospital). This is often shortly followed by the
“change cylinder immediately” alarm and in less than say 10 minutes the emergencycylinder will be in use. To avoid this, information from the pressure sensor can giveadvanced warning by monitoring the accelerated rate of pressure loss. This triggers after a delay of 5 minutes after change over. By using Charles’s law to calculate the extraavailable gas, this gives an extra hour to resolve the situation.
Because of the seasonal nature of some gas usages, the alarm value is set by a rollingaverage of how long each of the last four banks was on line. This is converted in to anaverage rate of usage and generates an alarm when the rate of pressure drop rises byover 100%.
In a similar fashion, a leak on a bank of cylinders is detected if the pressure on thestandby manifold reduces by more than 15% before changing over. The alarm thresholdis based on the percentage change in pressure based on the minimum and maximummanifold temperature using a combination of Boyle’s Law and Charles’s Law to provethis will be less than 15% (actual 9%). See above calculation.
An alternative to prevent the wrong number of cylinders or part used cylinders from beingput on to the manifold would be to install one pressure switch in each cylinder “pig tail”wired in series and interlock the “full” signal with the “Cylinder change” alarm. Thissolves one problem only at a similar or greater cost, than the pressure sensors.

7/30/2019 Technical Report 1 - CEng
http://slidepdf.com/reader/full/technical-report-1-ceng 62/62
6.9 Self Calibration of sensors
Because the manifold shuttle valve operates at a fixed pressure, when this change over occurs this is detected by the sensor and the pressure drop ceases. When a fall inpressure is observed by the other detector this confirms the change over has taken place
(thus proving that there is gas being used and that gas flow has not just stoppedbecause usage has subsided). Providing this occurs at the correct pressure (a toleranceof say 10% should be allowed) this confirms both the satisfactory operation of the shuttlevalve and the pressure sensor.
The above illustrates an example of careful selection of sensors and an understanding of engineering principles used to solve a variety of capital and facilities managementissues.
7.0 Conclusions
More development would be needed for the procedures to be transferred into a bespokeadvanced medical gas alarm system ideally utilising an “open Protocol” to improveconnectivity, reliability and cost. Whilst there are clear operational benefits these aregained by the use of fully networked systems used to convey the messages from manyother systems using more advanced communication and display tools.
Finally a VIE is a Vacuum Insulated Evaporator used to store liquid oxygen!4,800 Words
D References
1 HTM 2022 medical gas pipeline systems Design, installation, validation and VerificationNHS Estates 1997
2 Questioning oxygen flow rate guidance Stuart Ward, MSc BA CEng FCIBSE FIHEEMMASHRAE P31 HEJ IHEEM August 2004
3 Reliability-Centred Approach Evaluated William R Steele HEJ IHEEM February 2005
4 NHS Model Engineering Specification C11 Medical Gases 1996