Embed Size (px)
Citation preview
Technical Performance Measures
Josh Lincoln Jordan Bridgeman

Presentation Outline
• Intro to Technical Performance Measurements o What are TPMs? o Who uses TPMs? o What purpose do TPMs serve? o How are TPMs used? o How often are TPMs used?
• JWST TPM Examples • Intrepid Lunar Rover TPM examples • Summary
Introduction to TPMs
What are Technical Performance Measures?
Who uses TPMs?
What purpose do TMPs serve?
How are TPMs used?
How often are TPMs used?
What are TPMs • TPM defenition: “The continuing prediction and
demonstration of the degree of anticipated or actual achievement of selected technical objevtives. It includes an analysis of any differences between the achievement to date, current estimate, and the specific requirement.” (Sears & Taylor, 1984)
• Measure of system technical performance that has been chosen as an indicator of system success.
• Based on driving requirements or technical parameters of high risk or significant metrics (power, mass, data rate, intrument performance, etc).
• The trends of past, successful projects have been used to create contingency guidelines for new projects.
Who Uses TPMs? • Technical Performance Measures are mainly used by
systems engineers. However, the value and insight gained from using TPM metrics can be passed down to any member of a project.
• Because TPMs are used to enhance the understanding of a mission's chance of success (risk), then everyone, including upper management, can benefit from understanding current and predicted risk values.
• For engineers and scientists, a problem area within a system's design can be identified and special attention can be given to it in order to mitigate the source of risk.
What Purpose Do They serve
• Measures system performance as an indicator for mission success.
• Tracking TPMs and comparing them against current and expected performance, provides an early warning system to protect against deficiencies and excess. Risk management.
• TPMs that violate their contingency, should trigger action by the systems engineer.
• Final delivered system performance can be estimated by extending a TPM trendline.
How are TPMs Used?
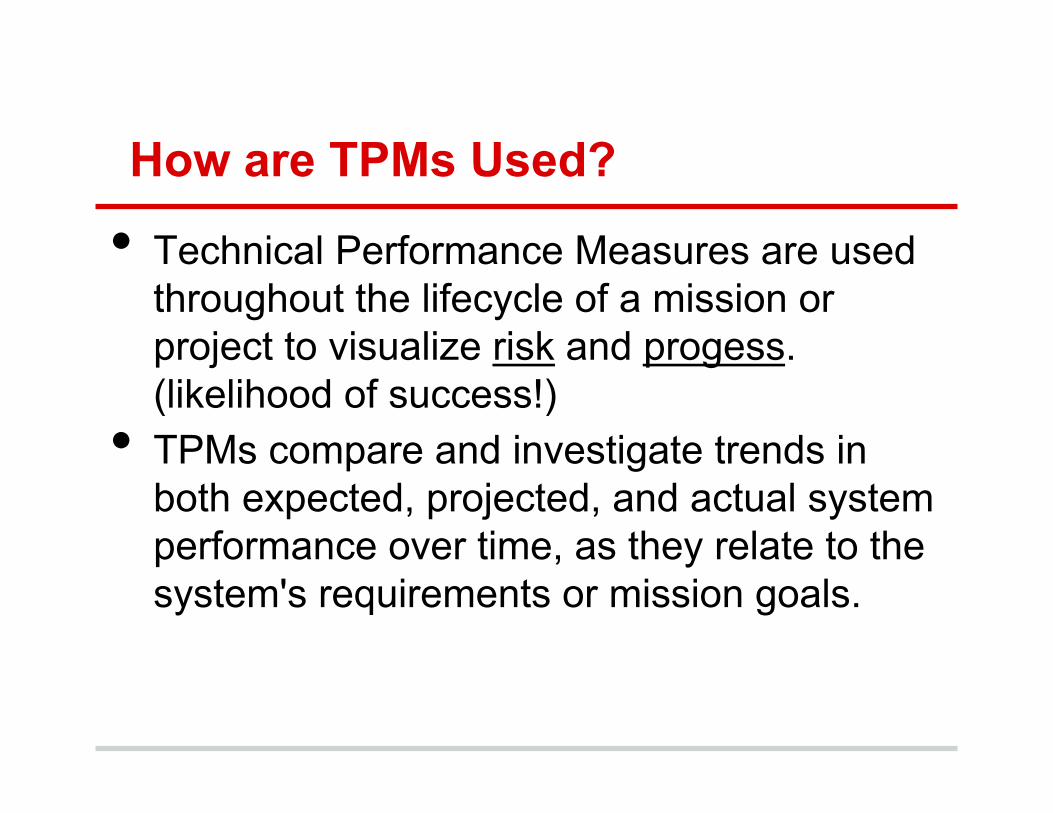
• Technical Performance Measures are used throughout the lifecycle of a mission or project to visualize risk and progess. (likelihood of success!)
• TPMs compare and investigate trends in both expected, projected, and actual system performance over time, as they relate to the system's requirements or mission goals.
How Often are TPMs Used?
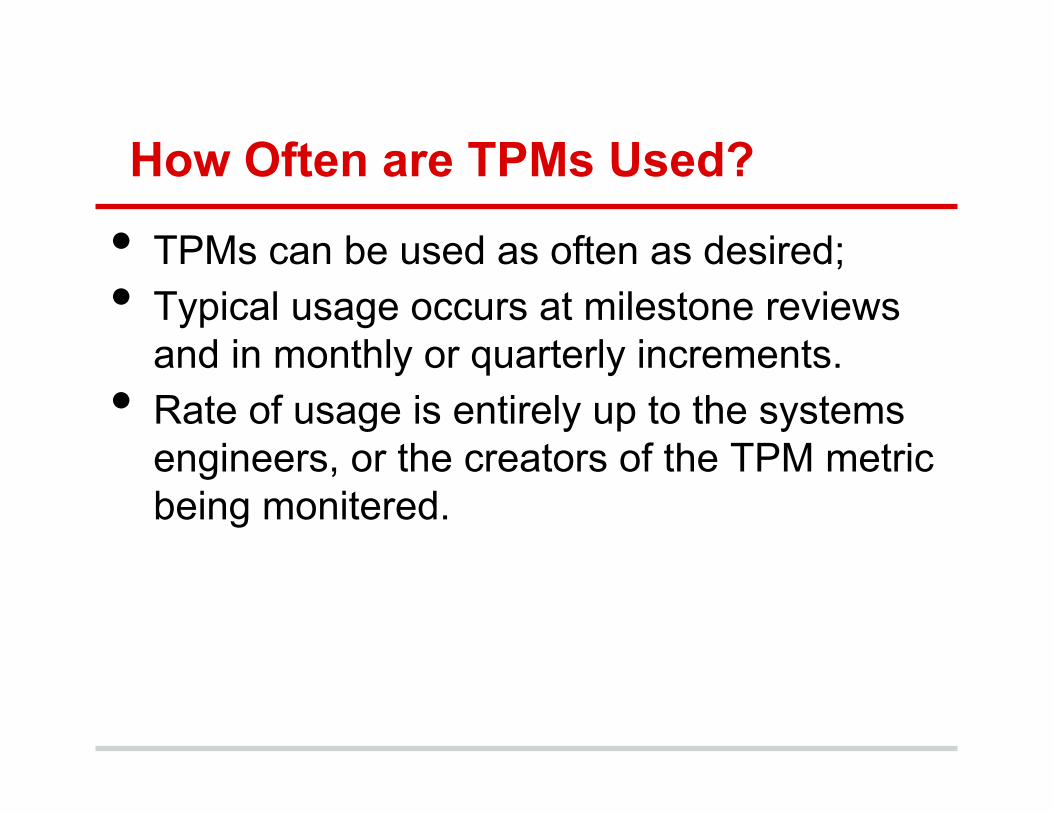
• TPMs can be used as often as desired; • Typical usage occurs at milestone reviews
and in monthly or quarterly increments. • Rate of usage is entirely up to the systems
engineers, or the creators of the TPM metric being monitered.
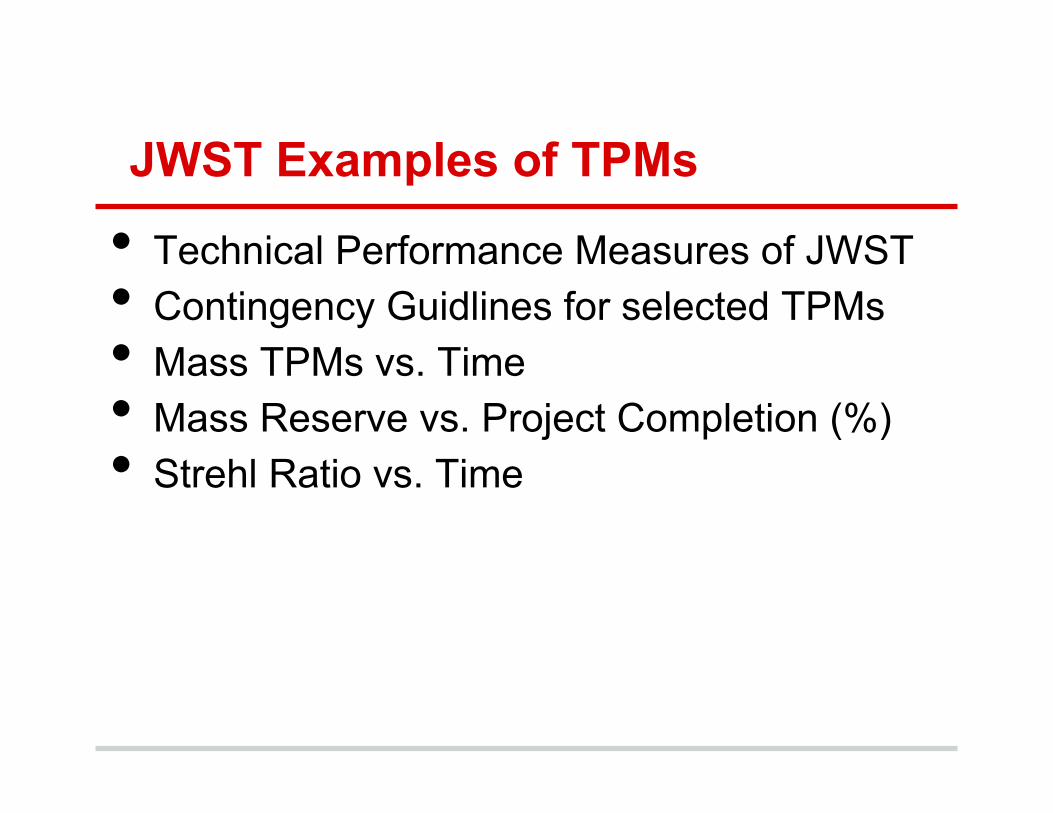
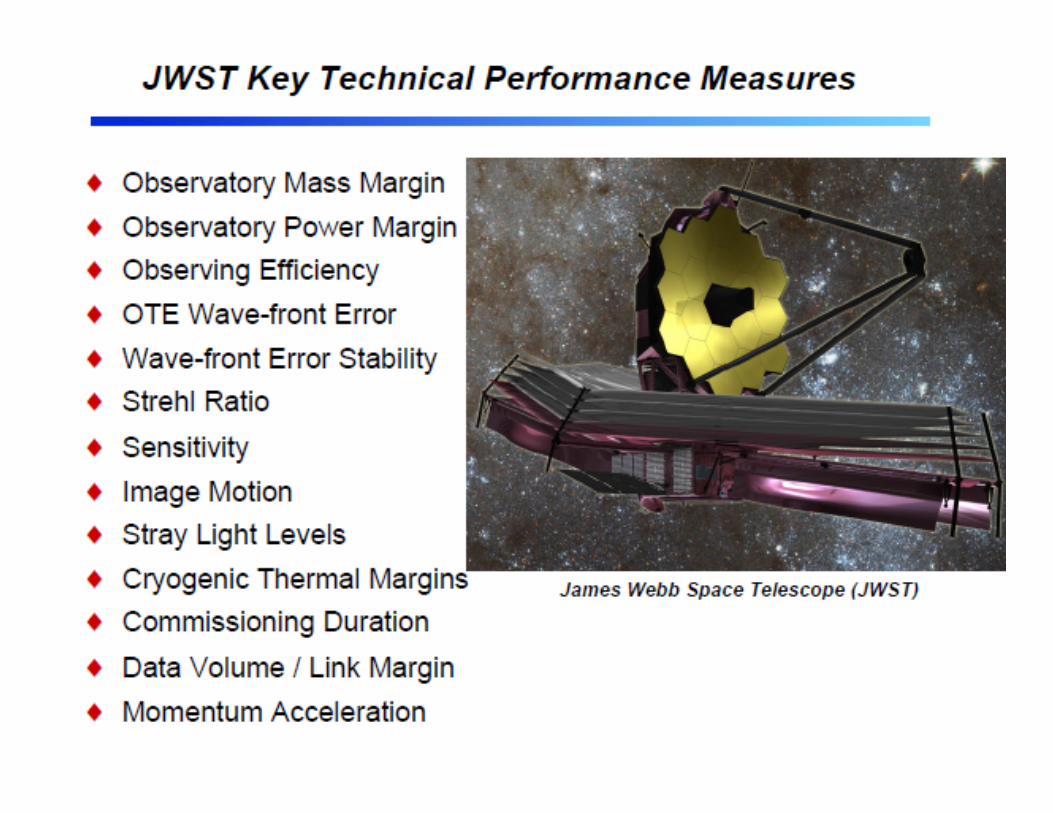
JWST Examples of TPMs
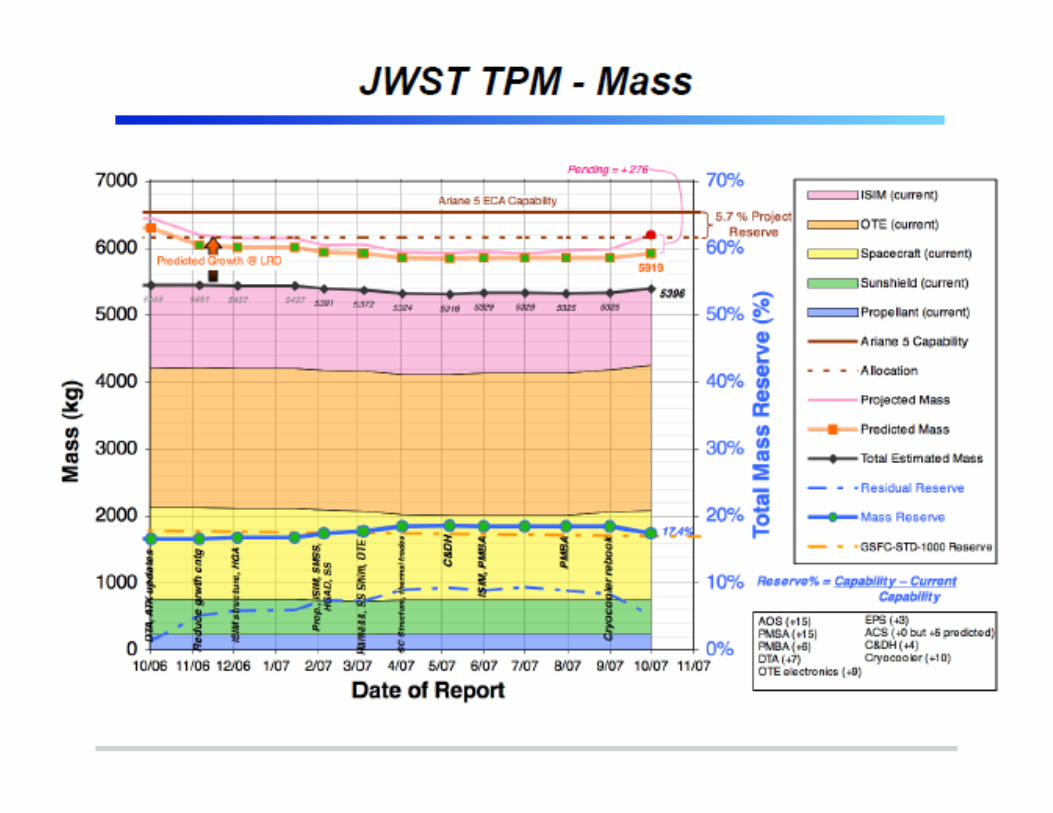
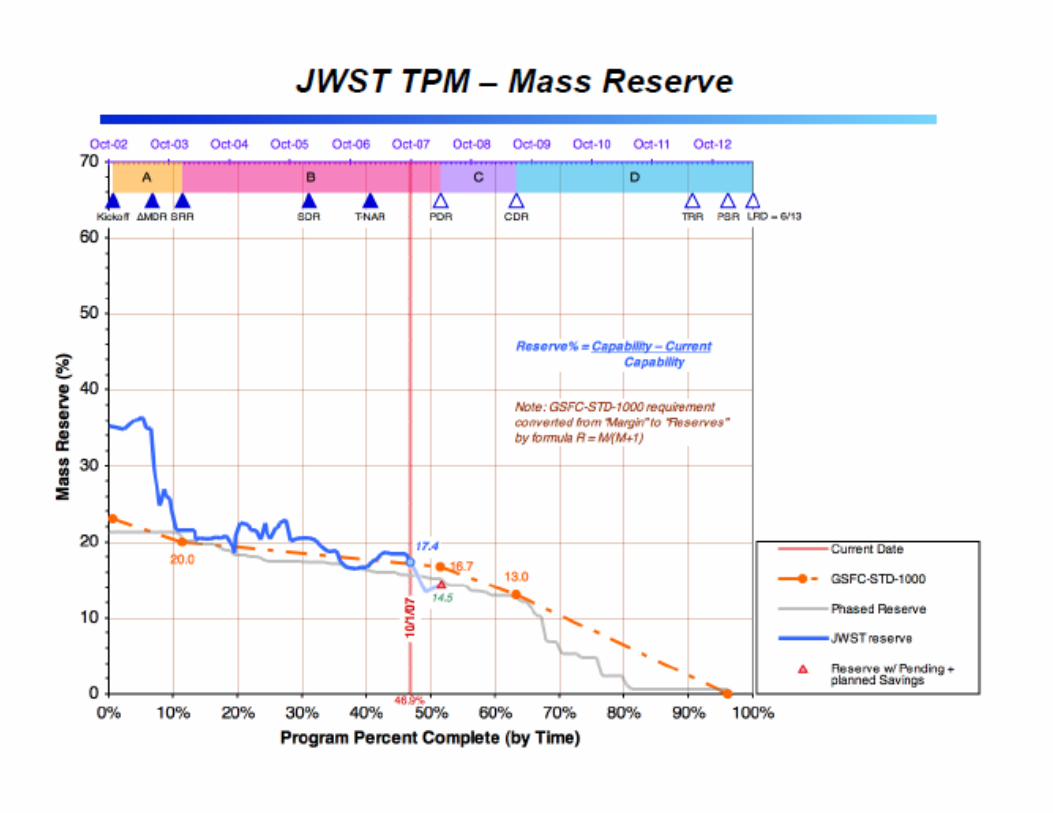
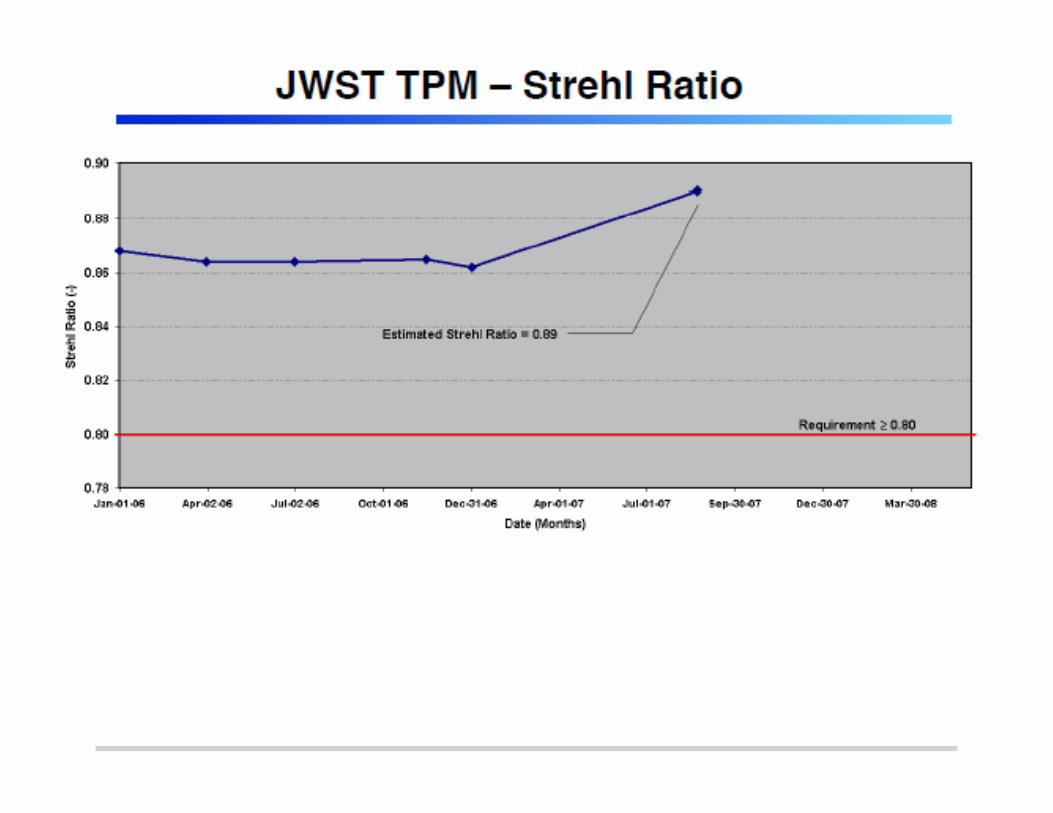
• Technical Performance Measures of JWST • Contingency Guidlines for selected TPMs • Mass TPMs vs. Time • Mass Reserve vs. Project Completion (%) • Strehl Ratio vs. Time

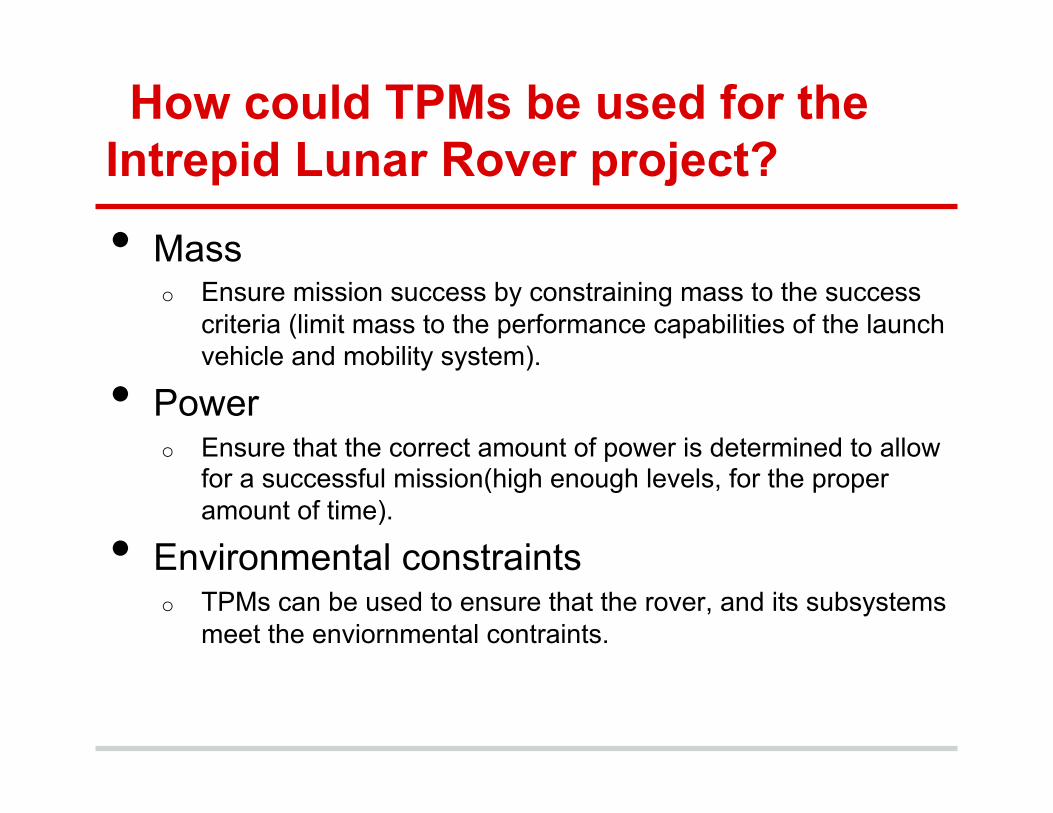
How could TPMs be used for the Intrepid Lunar Rover project?
• Mass o Ensure mission success by constraining mass to the success
criteria (limit mass to the performance capabilities of the launch vehicle and mobility system).
• Power o Ensure that the correct amount of power is determined to allow
for a successful mission(high enough levels, for the proper amount of time).
• Environmental constraints o TPMs can be used to ensure that the rover, and its subsystems
meet the enviornmental contraints.
Mobility Example • The mobility team could use specific TMP metrics to
track the rover's mass values (expected/current estimate/maximum) in order to compare them to their drivetrain's torque output capabilities (expected/current estimate/minimum).
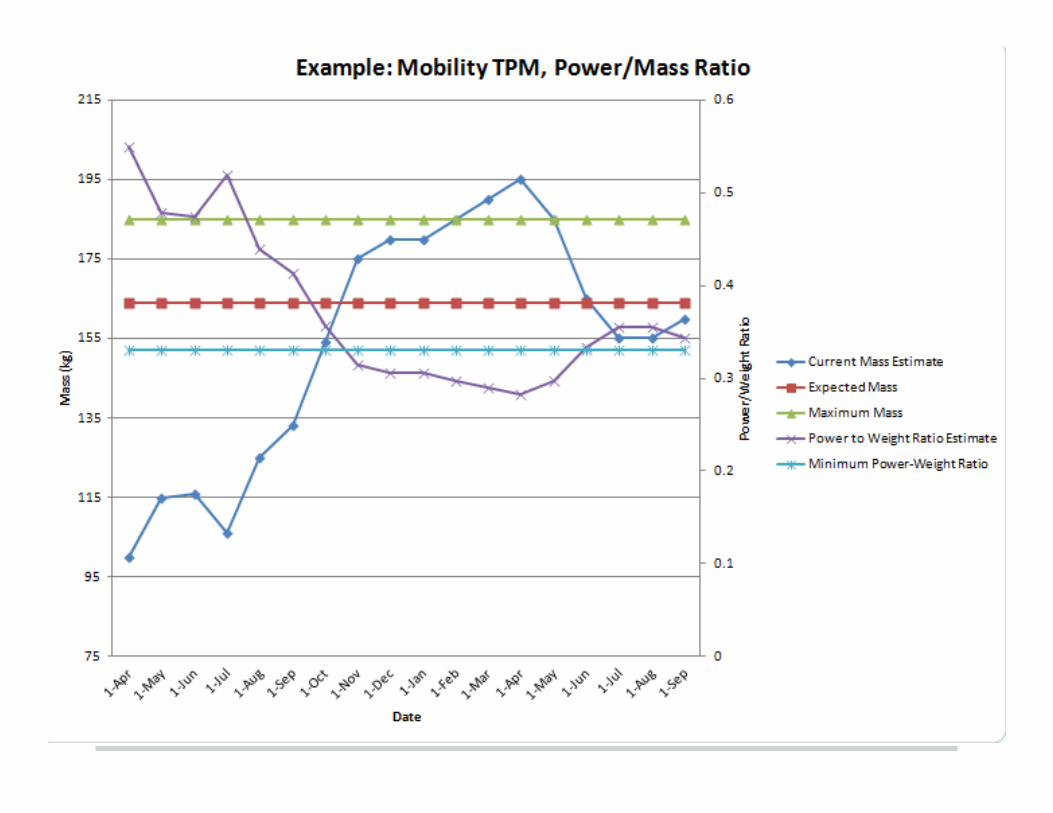

Mobility Example (cont.) • This could help identify the risk associated with the
power to weight ratio of the rover. If the data trends indicate that there may be a problem in the future, immediate changes can be made to the design or the requirements in order to mitigate the chance of unacceptable risk in the future.
Communications Example • Communications will need to track their current
expected bit rate, and compare that to their expected maximum bitrate. If their current expected bit rate is not within contingency of the maximum expected, then design choices need to be made to reduce the risk associated with the TPM not being within contingency.
Instrumentation Example • Instrumentation may be using a new or developing (low TRL)
instrument. If the instrument they are planning to use is still in development, the expected sensitivity of the instrument may be greater than the demonstrated sensitivity of the instrument.
• In order to track the risk associated with including this instrument in a design, the Instrument team could track the demonstrated sensitivity vs. the instrument's expected sensitivity and compare the data to the minimum sensitivity required to meet the mission objectives. A critical milestone date may be set, where another instrument with a higher TRL level must be selected if the risk associated with the developing instrument is past a chosen threshold.
SMARTS example • The Smarts team may want to track their expected and
maximum data storage capability against each subsystem's allocation (expected/current estimate/maximum).
• This way, they can make sure that there is minimal risk associated with the chosen data storage capabilities derived from their system requirements.

Power Example • TPM can be used to track the current and expected
power levels with a given contingency and margin. • Helps identify risk if current values exceed expected
values, based on the TPM trendline. • Power level example:
o Contingency: current best estimate vs. maximum expected value. § Contingency 15%: 85W vs. 100W
o Margin: maximum expected value vs. maximum possible value. § Margin:30% 100W vs. 140W
Summary of Technical Performance Measurements • TPMs are performance measurements used to ensure
mission success • TPMs drive development and influence decisions that
impact and (hopefully) reduce mission risk. • TPMs should change mission-to-mission; they should
be chosen based on what is most critical within a design or a project lifecycle
• TPMs are used throughout the project lifecycle to indicate expected vs. actual system maturity
References
Sears, T. B., & Taylor, E. P. (1984). Technical performance measurement handbook