Embed Size (px)
Citation preview
TECHNICAL PAPERS SUPPORTING SAP 2012
Proposed Carbon Emission Factors and Primary Energy
Factors for SAP 2012
Reference no. STP11/CO204
Date last amended 12 December 2011
Date originated 11 October 2011
Author(s) Christine Pout, BRE

Summary This paper presents the rationale behind the proposed methodological changes for calculating emission factors to be used in SAP 2012. It discusses scope and boundary conditions for the inclusion of emission sources and considers the extent to which emission factors should reflect expected changes in the fuel supply chain in the future. It also considers the advantages and disadvantages of using system average values and marginal emission factors for grid supply fuels, the exclusion of carbon dioxide emissions from bio-genic sources and the potential benefits of ‘time of use’ emission factors. The proposed changes to the emission factors are compared to the methodology used to calculate the SAP 2009 emission factors and include considerations of other proposed methodologies, in particular the recommendations of the Zero Carbon Hub1. A definition of primary energy is provided and an equivalent methodology is proposed for primary energy factors as well as for carbon emission factors. Provisional emission factors and primary energy factors generated using the proposed methodologies are presented together with the data sources used and any assumptions made. These provisional factors are based on the data sources that are currently available and it is intended that they will be revised ahead of the release of SAP 2012 to reflect more recent/additional data sources that become available. As the same conversion factors are required for SBEM some additional factors which are specific to non-domestic buildings, are also included.
1 Zero Carbon Hub, Carbon Compliance for Tomorrow’s New Homes. A review of the modelling tool and assumptions, An overview of Findings and Recommendations.
Contents
1 Introduction 1
2 Proposed Methodological Improvements for Emission Factors 2
2.1 Include the impact of CO2, CH4 and N2O emissions measured as CO2e 2 2.2 Include upstream transport emissions and emissions sources outside of the UK within the
system boundary 2 2.3 Apply a system average emission factors to grid supply fuels displaced by onsite
generation e.g., electricity exported to the grid 4 2.4 Emission factors should relate to the energy supply system for the relevant compliance
period 7 2.5 Continued exclusion of carbon dioxide emissions from combustion of bio-genic fuel
sources 9 3 Potential Future Methodological Change for CO2 emission factors 10
3.1 Use of end use specific emission factors for grid supply electricity 10 4 Primary Energy Factors 11
5 Preliminary Emission Factors and Primary Energy Factors 12
5.1 Indicative emission factors for future compliance periods 14 5.2 Preliminary Primary Energy Factors 15 6 Description of Fuel Types and Their Application in SAP 17
7 Data Sources and Assumptions for the Preliminary SAP 2012 emission factors 20
1 Proposed Carbon Emission Factors and Primary Energy Factor for SAP 2012
1 Introduction
The emission factors in SAP and SBEM are used to calculate carbon emissions in order to demonstrate compliance with Part L of the Building Regulations. In addition to being used for determining compliance with minimum standards they are also used to generate EPCs. Here the purpose is to measure the (standardised) carbon (or primary energy) performance with the aim of encouraging comparison between (similar) buildings. This may also encourage the selection of more energy and/or carbon efficient premises at the point of sale or rent. EPCs also provide recommendations for improving the energy efficiency of a building. From October 2012 SAP will also be used to calculate energy savings for the Green Deal. Primary energy factors are currently used in SAP to calculate the primary energy use of heating systems. The current version of SBEM does not include any primary energy calculations. The 2013 versions of both the domestic and non-domestic NCM tools will need to calculate primary energy consumption in line with the requirements of the recast EPBD.
2 Proposed Carbon Emission Factors and Primary Energy Factor for SAP 2012
2 Proposed Methodological Improvements for Emission Factors
This section identifies the proposed methodological improvements and the rationale behind them.
2.1 Include the impact of CO2, CH4 and N2O emissions measured as CO2e Carbon dioxide (CO2) is one of the main products of fuel combustion but it is not the only greenhouse gas that is emitted. Nitrous oxide (N2O) and methane (CH4) are also released as a result of energy consumption. N2O is a side product of the fuel combustion process as the heat produced causes the oxidation of nitrogen in the surrounding air and it is also released directly from the energy supply chain, in particular from the cultivation of soils which form part of the production process for bio-fuels. Methane can be released directly into the air at various points along the energy supply chain including, oil and gas exploration, natural gas leakage from gas pipelines and coal mines and also from incomplete combustion. Both N2O and CH4 are more potent greenhouse gases than CO2 with global warming potentials of 21 and 310, respectively (compared to 1 for CO2). Although the global warming impact of CH4 and N2O from energy use is generally small compared to that of CO2 for most fossil fuel energy sources, they can make up a significant proportion of the emission impact, in particular for fuels from biomass sources. The SAP 2009 emission factors only included CO2 so extending coverage to incorporate other greenhouse gases (GHGs) would provide a more accurate reflection of the impacts of energy use. It is therefore recommended that the emission factor methodology include the impacts of CO2, CH4 and N2O measured as CO2e (CO2 equivalent). This change is in line with the methodology recommended by the Zero Carbon Hub2.
2.2 Include upstream transport emissions and emissions sources outside of the UK within the system boundary
In addition to the emissions released directly from fuel combustion at the point of use (or at the power station in the case of electricity) there are other emission sources that occur upstream of the final user which should also be included in order to reflect the total environmental impact of energy use. These upstream sources include fugitive emissions, such as the natural gas leakage and emissions arising from fuel and electricity used during the production and distribution processes.
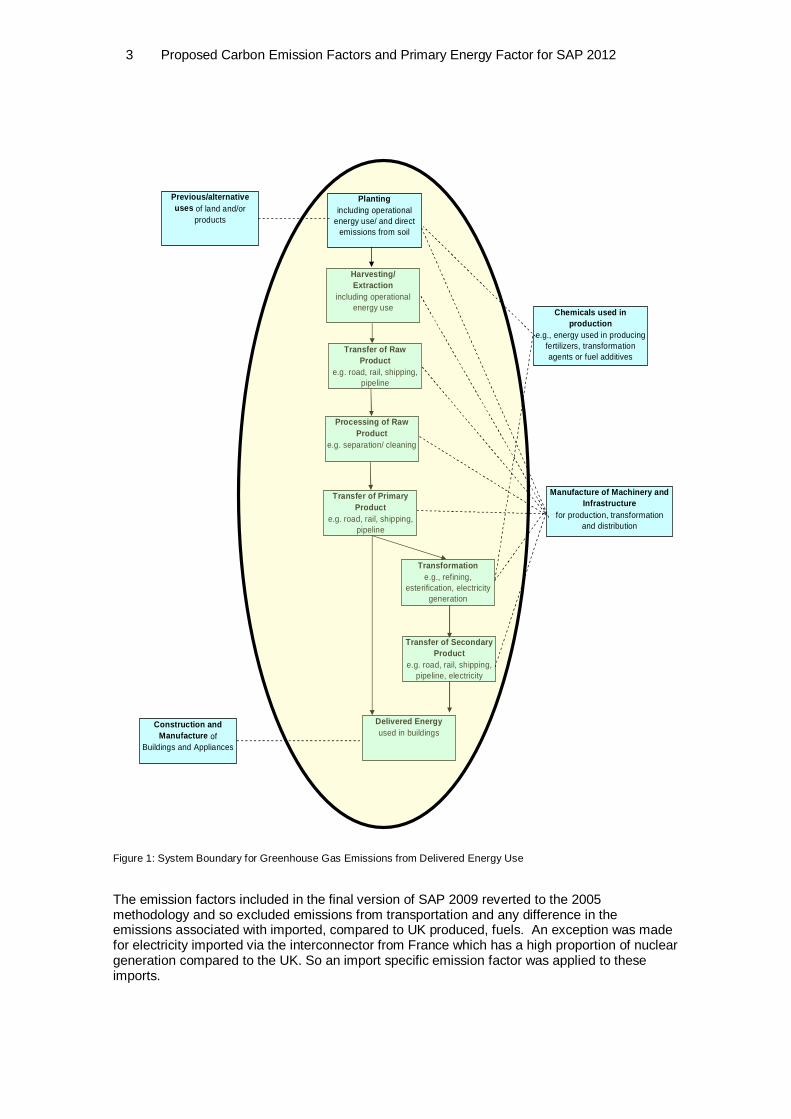
Figure 1 shows the system boundary that was proposed in the SAP 2009 consultancy. Here the system boundary is deemed to start when production begins: for fossil fuels this will be extraction, and for fuels derived from biomass this will be cultivation. For waste products this will be transportation from the location where the waste is produced. The final stage included in the boundary is energy use in the building.
2 Zero Carbon Hub, Carbon Compliance for Tomorrow’s New Homes. A review of the modelling tool and assumptions. An overview of Findings and Recommendations.
3 Proposed Carbon Emission Factors and Primary Energy Factor for SAP 2012
Figure 1: System Boundary for Greenhouse Gas Emissions from Delivered Energy Use
The emission factors included in the final version of SAP 2009 reverted to the 2005 methodology and so excluded emissions from transportation and any difference in the emissions associated with imported, compared to UK produced, fuels. An exception was made for electricity imported via the interconnector from France which has a high proportion of nuclear generation compared to the UK. So an import specific emission factor was applied to these imports.
Harvesting/Extraction
including operational energy use
Transfer of Raw Product
e.g. road, rail, shipping, pipeline
Transformation e.g., refining,
esterification, electricity generation
Transfer of Secondary Product
e.g. road, rail, shipping, pipeline, electricity
Delivered Energy used in buildings
Previous/alternative uses of land and/or
products
Manufacture of Machinery and Infrastructure
for production, transformation and distribution
Construction and Manufacture of
Buildings and Appliances
Processing of Raw Product
e.g. separation/ cleaning
Transfer of Primary Product
e.g. road, rail, shipping, pipeline
Chemicals used in production
e.g., energy used in producing fertilizers, transformation agents or fuel additives
Plantingincluding operational
energy use/ and direct emissions from soil
4 Proposed Carbon Emission Factors and Primary Energy Factor for SAP 2012
Taking account of emissions associated with transporting fuels and extending the coverage of upstream emissions beyond the UK boundary is appropriate because GHG emissions have a global impact and this methodology would more accurately reflect the total environmental impacts. This could be particularly important for imports of liquefied natural gas where upstream emissions from compression and shipping are significant Whilst it could be argued that including non-UK emission sources is not consistent with the National Atmospheric Emissions Inventory approach, this is not an issue as SAP is a compliance/rating tool and does not contribute to accounting at the national level. In some instances the data collection and analysis requirements may be disproportionately large compared to the additional accuracy they confer. Where this is the case, applying upstream emission for UK based production or European average values for imported fuels should provide a reasonable estimate of upstream emissions associated with imported energy. It is therefore recommended that the emission factor methodology should be revised to include transport emissions and emissions that occur outside of the UK for energy imports in so far as data availability allows. This recommendation is in line with the methodology recommended by the Zero Carbon Hub3.
2.3 Apply a system average emission factors to grid supply fuels displaced by onsite generation e.g., electricity exported to the grid
The SAP 2009 emission factors are system average values, except for electricity displaced from the grid from onsite electricity generation where a marginal emission factor is applied4. System average and marginal values are described in the following box.
3 Zero Carbon Hub, Carbon Compliance for Tomorrow’s New Homes. A review of the modelling tool and assumptions, An overview of Findings and Recommendations. 4 This was a combined marginal factor based on a 50:50 mix of the operational and build marginal plant, where the operational marginal plant was determined from an analysis of a plant that is switched on and off in response to changes in demand (dispatch analysis) and build marginal plant was assumed to be CCGT.
5 Proposed Carbon Emission Factors and Primary Energy Factor for SAP 2012
System Average Emission Factors System average values reflect the emissions associated with energy use over a specified period of time, e.g., a year. They provides an equitable means of determining environmental impacts across all users, so one set of factors can be used for a range of applications. System average values are relatively simple to calculate. Marginal Emission Factors Marginal emissions factors are determined compared to a defined baseline over a specified period. It is appropriate to use marginal factors where there is a change in emissions compared to the specified baseline. The marginal emission factor is determined by the generation plant(s) that is expected to increase or decrease its contribution to the overall generation mix in response to changes in demand. Operational (or short term) marginal plant represents the generation plant that is switched on or off in response to instantaneous changes in demand, whilst build marginal plant is determined by the type of plant that is expected to be built if demand increases and reflects longer term impacts of changes in demand. A 50:50 mix of operational and build marginal plant is often used to represent the medium term view of marginal plant. There several alternative methods that can be used to determine the operational marginal plant. Four options are provided in the UNFCC/CCNUCC Methodological tool A
The UNFCC methodology identifies 4 potential methods for calculating the operational margin factor. These are:
a) Simple operational margin – The average emission factor for electricity generation from all sources that are not low cost or must run (e.g., solar, wind, natural hydro and nuclear) averaged over three years – Only appropriate where low cost and must run plant accounts less than 50% of the generation capacity (For the UK low cost and must run plant is currently < 20%).
b) Simple adjusted margin – As above but takes into account instances where low cost and must run plant occurs at the margin (for the UK this is likely to occur infrequently and would probably yield a very similar result to a)).
c) Dispatch data analysis – The order which plant is switched on and off in response to changes in demand. (This is essentially the method that was used for the 2009 factors – the difference is that we excluded low cost and must run plant from the analysis. It could be argued that this should provide a more accurate assessment of marginal plant than the UNFCC method).
d) Average Operational margin – The system average value. This should only be used where it is not possible to use one of the other methods.
Calculating the operational marginal plant for the same supply system can potentially yield very different results, which indicates an inherent uncertainty that surrounds this value. Marginal emission factors require detailed information and analysis of the energy supply chain to determine the baseline and to determine the changes that are likely to occur to the supply mix when demand changes. There is also likely to be an inherently high level of uncertainty associated with marginal values. A UNFCC/CCNUCC Methodological tool: “Tool to calculate baseline, project and/or leakage emissions from electricity consumption (version 0) N.B. This tool was specifically developed for calculating emission reductions from CDM projects.
6 Proposed Carbon Emission Factors and Primary Energy Factor for SAP 2012
For most energy sources, energy supplies are relatively homogeneous in terms of their carbon impacts, so the system average and marginal values will be identical. However, for electricity and other grid supply sources e.g., natural gas5, this is not necessarily the case. System average emission factors are appropriate for measuring and reporting emissions attributable to actual or predicted energy consumption as it provides an equitable reflection of the carbon impacts across all end uses. Whilst for calculating the effect of increased (or decreased) energy use at the overall system level, for example for scenario modelling of policy options, a marginal emission factor may be appropriate. For SAP 2005 a decision was taken to apply a marginal emission factor to electricity exported to the grid (whilst the system average value was applied to grid electricity supply) in order to encourage greater take up of on-site electricity generation. This was justified on the basis that it would lead to additional energy savings in comparison to those included in the system average emission factors as, at that time, on-site renewable electricity generation was not explicitly included in the energy projections. This differentiation was initially removed in the SAP 2009 consultation values as it was recognised that policies were in place to support the uptake of on-site electricity generation and these were implicitly included in the electricity generation projections and hence the system average values. Furthermore, it removed the inconsistency in the treatment of different types of carbon saving technologies6. Although in the final SAP 2009 the factors reverted wholesale to the SAP 2005 methodology. The most recent energy projections (which are used to calculate the system average values) specifically take account of planned policy action, including EPBD and ZCH which are driving energy efficiency improvements in the building stock and the impact of FITs and the RHI. Therefore, using marginal emission factors for calculating the impact of the avoided electricity generation would effectively be double counting the effect of installing on site electricity generation. This is because the system average value takes into account transmission and distribution losses so applying it to electricity generation displaced from the grid by on-site generation effectively addresses the fact that on site generation does not incur the losses associated with grid supply energy. The marginal value for electricity in SAP 2009 was calculated based on a 50:50 mix of build marginal plant (which was taken as CCGT plant) which is identified as the new build plant in the IAG methodology for policy appraisal7, and operational marginal plant, determined by dispatch analysis excluding low cost and must run plants (essentially a combination of methods a) and c) of the UNFCC methodology). The IAG methodology for policy appraisal advocates the marginal values based on new build CCGT be applied to all electricity use. Whilst the IAG approach to determining the marginal emission factor may be appropriate for long term policy appraisal purposes, it is not necessarily suitable for a compliance/rating tool
5 This is becoming more important as imports of liquefied natural gas are expected to make up a greater proportion of natural gas used in the UK in the future and they have a higher carbon impact compared to natural gas piped directly from the North Sea 6 E.g. on site renewable electricity generation compared to increased equipment energy efficiency. 7 Valuation of energy use and greenhouse gas emissions for appraisal and evaluation October 2011 DECC/HM Treasury
7 Proposed Carbon Emission Factors and Primary Energy Factor for SAP 2012
SAP and SBEM are compliance/rating tools and need to provide an equitable reflection of carbon impacts across all end uses and building types. Also, as the system average value for grid supply energy takes into account transmission and distribution losses, applying this value to displaced electricity generation credits onsite generation with avoiding these losses.
It is therefore recommended that a system average emission factor be applied to both energy use and to energy generation avoided from grid supply energy sources (e.g., electricity exported to the grid from on site generation). This differs from the Zero Carbon Hub’s approach which recommends that marginal factors (based on the UNFCC approach8) should be applied to both grid supply energy use and to exports to the grid.
2.4 Emission factors should relate to the energy supply system for the relevant compliance period
For most energy sources the carbon impacts are not expected to change over time so it is reasonable to assume that the current emission factor provides the best indication of future factors. This is not the case for grid supply energy sources and in particular, for electricity where substantial changes in the generation mix can be anticipated. The SAP 2009 emission factors are based on the most recently available information except for grid supply electricity which was based the projected supply. For SAP 2012 it will be necessary to consider the impact of increasing amounts of imported liquefied natural gas (LNG) in the UK gas grid on the emission factor for mains gas. The SAP 2009 electricity emission factor was based on the projected average value between 2010 and 2015 (i.e. a five year period). This period was chosen to reflect the timescale over which new build projects are likely to be using the 2009 version of the NCM calculation tools, e.g., the three year compliance period plus an additional two years to allow for time lags between approval and building completion. However, there are arguments for projecting emission factors over both a longer and a shorter timescale as outlined below. Longer timescale (15 years) A longer term forecast provides a better basis for considering future policy options. Also, from a design perspective choosing a timeframe which reflects the lifetime of the building design choices is appropriate. Accordingly, the ZCH9 recommends the adoption of a 15 year projected value on the basis that this reflects the operational life of the heating system installed and hence the expected lifetime emissions for a new installation. It does need to be noted, however, that there are disadvantages in using such a long time period. The level of uncertainty about the future mix of energy supply increases the further into the future that predictions are made. This is particularly pertinent for electricity generation where the most recent DECC energy projections indicate substantial decarbonisation of the grid in future years. Furthermore, subsequent changes to building services can occur which mean that
8 United Nations Framework on Climate Change Committee: “Tool to calculate baseline, project and/or leakage emissions from electricity consumption” V 01. 9 Zero Carbon Hub, Carbon Compliance for Tomorrow’s New Homes. A review of the modelling tool and assumptions, An overview of Findings and Recommendations
8 Proposed Carbon Emission Factors and Primary Energy Factor for SAP 2012
the actual energy performance of the building will diverge from the “as designed” state over the course of a few years. There is also a concern that using a projected emission factor could lead to a perverse outcome for electricity where the use of an emission factor that expects the decarbonisation of the grid to occur could encourage building designers to choose an electric, rather than fossil fuel, heating system. This could increase the electricity demand so it greatly exceeds projections. As the amount of low carbon and renewable electricity generation sources are much more limited than those for fossil fuels, this is likely to lead to a higher system average value than was initially predicted. Shorter timescale (3 years) The GHG protocol for project accounting10 provides guidance on the measurement of GHG savings for all project based GHG initiatives and programmes. This provides a set of principles with regard to setting baselines and the measurement of GHG savings. Whilst it is primarily concerned with ex post emissions assessments, the principles are equally valid for ex ante assessments. The GHG protocol for project accounting promotes the use of conservative assumptions where uncertainty is high. Given the historical volatility of the electricity generation mix there is clearly a high level of uncertainty associated with future generation and this uncertainty will become greater in future years. Considering a relatively short timeframe for future emission factors is therefore in keeping with the GHG protocol for project accounting principles. Furthermore a short timeframe is more appropriate for the main purpose for which SAP is used. SAP calculations are mostly used for assessing emissions for EPCs, largely for existing buildings but also for new dwellings. The emissions at the time of the assessment are most relevant in this context and this argues for a short time period for projections. Given this, and also the anticipated three year periods that are associated with successive Building Regulations compliance requirements, a three year period seems the most appropriate option (five years has been used previously). Furthermore, the emphasis on SAP being used for existing buildings will increase when the Green Deal (which will require a SAP assessment to be carried out for all participating properties) is introduced from 2012. Recommendation Given the above it is recommended that SAP provide emission factors for both short (3 years) and long (15 years) time periods, instead of the current 5 year period. Of course, the figures for 3 and 5 years are quite similar, as can be seen in the preliminary figures presented later. The short time period would be the preferred, more reliable, figure being used for the main purpose of SAP (i.e. producing EPCs, for which the performance at the time of assessment is of greatest interest). The long time period figure would be provided as an alternative to be used for situations in which consideration of the potential impacts over time are of particular interest (keeping in mind that there are inevitable uncertainties and that these can be rather large). In line with the recommendations of the zero carbon hub11, it is further recommended that projected emission factors be produced for future compliance periods and that these values be updated annually to provide an indication of future emission factors for grid supply fuels.
10 The GHG Protocol for Project Accounting, World Business Council for Sustainable Development/World Resources Institute, 2004 11 Zero Carbon Hub, Carbon Compliance for Tomorrow’s New Homes. A review of the modelling tool and assumptions, An overview of Findings and Recommendations.
9 Proposed Carbon Emission Factors and Primary Energy Factor for SAP 2012
2.5 Continued exclusion of carbon dioxide emissions from combustion of bio-genic fuel sources
Carbon emissions that arise directly from the combustion of bio-genic materials12 (provided they are derived from sustainable biomass sources) form part of the carbon cycle and so do not lead to a net increase in atmospheric CO2 emissions when viewed over the long term. Thus, excluding carbon dioxide arising directly from combustion of bio-genic carbon is justified and in line with major end user carbon accounting methodologies e.g., GHG reporting protocol13. In the UK most biomass sources are from proven sustainable sources, much of which is derived from the waste stream, so excluding carbon dioxide emissions from bio-genic sources is entirely appropriate. However direct emissions of CH4 and N2O from combustion and all other non-bio-genic upstream GHG emission sources should be included. It is recommended that carbon dioxide emissions from the combustion of bio-genic fuel sources continue to be excluded from the SAP emission factors.
12 Derived from plant or animal sources. 13 The GHG Protocol for Project Accounting, World Business Council for Sustainable Development/World Resources Institute, 2004
10 Proposed Carbon Emission Factors and Primary Energy Factor for SAP 2012
3 Potential Future Methodological Change for CO2 emission factors
3.1 Use of end use specific emission factors for grid supply electricity The carbon emission factor for grid supply electricity in the UK exhibits discernable diurnal and seasonal variations. These variations arise primarily because more carbon intensive fossil fuel plants tend to have higher running costs than options such as nuclear and renewable generation14. Therefore a carbon intensive plant is more likely to be run at times when electricity demand is high; hence the emission factor will tend to be higher at times when electricity demand is high. It can be argued that, rather than using a single average annual emission factor for all end uses, different factors should be provided that take account of how energy demand patterns for a particular end use varies over the course of a year. This is likely to lead to lower emission factor for say, electric storage heating (which reflects the higher proportion of low carbon electricity generation that typically operates at night) compared to lighting (which is more likely to coincide with times when electricity demand and hence the carbon intensity of electricity is high). Whilst it would be desirable for the SAP emission factors to reflect the impact of different operating schedules, the 2012 SAP calculation procedure is not currently able to model application specific use patterns in sufficient detail to permit the use of variable factors to calculate emissions. It is recommended that the use of variable emission factors be considered for future versions of SAP.
14 Other reasons include planned maintenance which tends to be scheduled to coincide with periods of low demand
11 Proposed Carbon Emission Factors and Primary Energy Factor for SAP 2012
4 Primary Energy Factors
Primary energy factors are used in SAP 2009 to calculate the primary energy use of heating systems. The 2012 versions of both the domestic and non-domestic15 NCM tools will need to calculate primary energy consumption in line with the requirements of the recast EPBD.
The definition of primary energy used to calculate the SAP factors can be summarised as follows: Primary energy includes all energy found in nature that has not been subjected to any conversion or transformation process. It includes the energy contained in raw fuels as well as other forms of energy received as input to the energy supply system. Primary energy covers both renewable and non-renewable energy sources and the definition used here is in accordance with EN 15316-4-5 which states that "....Waste heat, surplus heat and regenerative heat sources are included by appropriate primary energy factors.“
The primary energy factors are calculated using the same methodological scope and timescales as for the CO2 emission factors. Whilst for most fuels defining this is relatively straightforward there are some fuels where clarity is required regarding the point at which primary energy sources are measured. Renewable energy sources such as solar, natural flow hydro and wind generation are capturing abundant natural energy sources. To treat the electricity generated by these sources as primary energy a statistical convention assigns these a primary energy factor of 1 at the point of generation. Any subsequent energy use associated with the distribution of energy from renewable sources and losses should be included in the primary energy factor. Similarly biomass sources and waste used to produce energy should also be assigned a primary energy factor of 1 and any subsequent energy use or losses that occur prior to delivery should be included. Electricity generated from nuclear sources is a more complex issue as it is often derived from plutonium which is not naturally occurring and is therefore classed as a secondary energy source. So the primary energy factor for nuclear electricity should also take account of any energy use associated with nuclear fuel processing as well as thermal losses that occur during steam generation and the subsequent generation and supply of electricity. The recommendation is that primary energy factors should include renewable and non- renewable sources and be determined using the same scope and timeframe that is used to calculate the emission factors.
15 The current version of SBEM does not include any primary energy calculations.
12 Proposed Carbon Emission Factors and Primary Energy Factor for SAP 2012
5 Preliminary Emission Factors and Primary Energy Factors
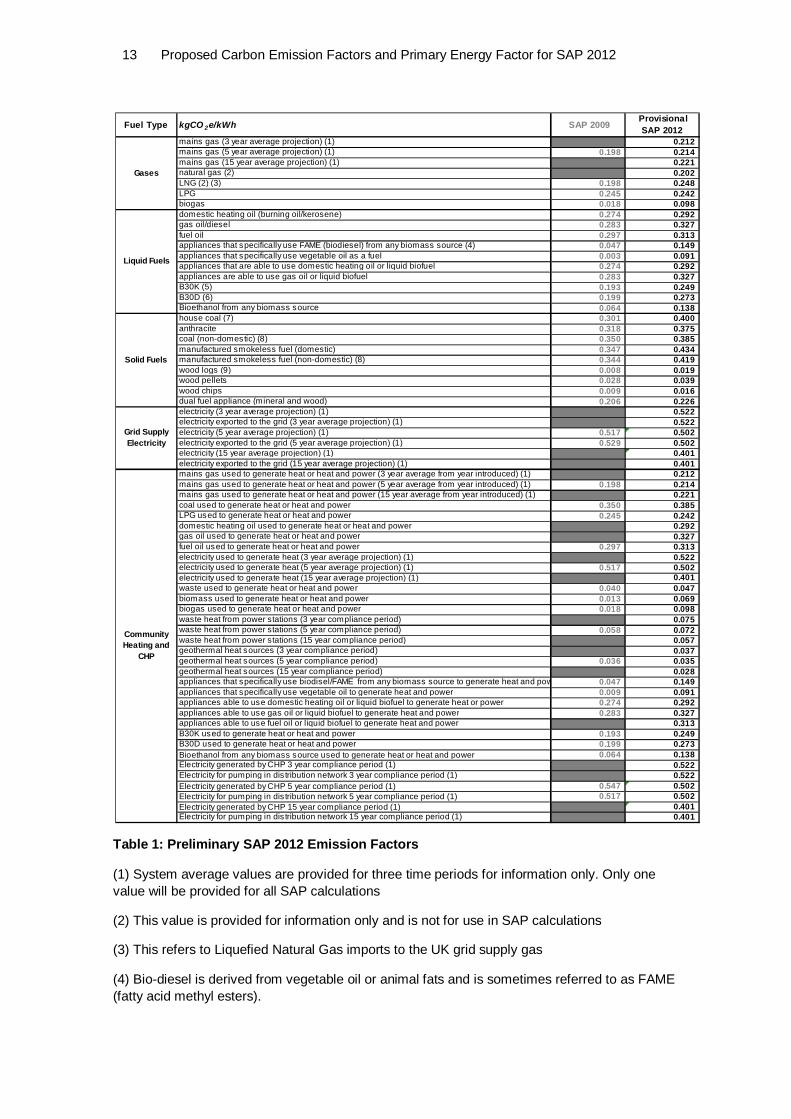
Preliminary emission factors for SAP 2012 were calculated using the recommendations for revising the methodology as described in this paper. These preliminary emission factors are presented in Table 1 alongside the SAP 2009 values.
For most fuels the 2012 emission factors are slightly higher than the 2009 values due to the inclusion of CH4 and N2O emissions and the extension of the upstream scope to include all transport and overseas emission sources. However, for bio-fuels the 2012 values are often significantly higher. This is primarily due to the high levels of N2O released from soil cultivation, and for bio-diesel and bio-ethanol in particular, significant transport emissions arising along the energy supply chains.
For grid supply fuels changes in the supply mix also lead to additional changes in the emission factors. For electricity, the increased scope of emissions used for the 2012 factors is more than offset by the higher proportion of renewable and low carbon generation in the energy supply mix, leading to a net reduction in the emission factors when viewed over a 5 year projection period. In contrast, increasing amounts of imported LNG in mains supply gas causes an increase.
It should be noted that the values presented in this section are subject to revision and emission factors for some fuels may be added or removed in the final version of SAP 2012 16
In the future for fuels used to generate heat or heat and power it may be possible to use the data held in the proposed community heating database to calculate system specific emission factors. These system specific emission factors would reflect the mix of fuels consumed, and the efficiency with which heat or heat and electricity is generated, and they would be determined using the emission factors for individual fuels already provided in SAP. However, it is not envisaged that a system specific approach will be possible for SAP 2012.
A more detailed description of the fuel types and the circumstances under which they should be used in SAP is provided in Section 6 and the data sources and any assumptions used to derive the preliminary 2012 values are provided in Section 7 of this paper.
16 We have already become aware of additional information which indicates that the proportion of plastic in waste is higher than that assumed in the data source used to calculate the preliminary emission factor. As a consequence, the factor for waste used to generate heat or heat and power which appears in final version of SAP 2012 is expected to be higher than the value presented here.
13 Proposed Carbon Emission Factors and Primary Energy Factor for SAP 2012
Table 1: Preliminary SAP 2012 Emission Factors
(1) System average values are provided for three time periods for information only. Only one value will be provided for all SAP calculations
(2) This value is provided for information only and is not for use in SAP calculations
(3) This refers to Liquefied Natural Gas imports to the UK grid supply gas
(4) Bio-diesel is derived from vegetable oil or animal fats and is sometimes referred to as FAME (fatty acid methyl esters).
Fuel Type kgCO 2e/kWh SAP 2009 Provisional
SAP 2012 mains gas (3 year average projection) (1) 0.212 mains gas (5 year average projection) (1) 0.198 0.214 mains gas (15 year average projection) (1) 0.221 natural gas (2) 0.202 LNG (2) (3) 0.198 0.248 LPG 0.245 0.242 biogas 0.018 0.098 domestic heating oil (burning oil/kerosene) 0.274 0.292 gas oil/diesel 0.283 0.327 fuel oil 0.297 0.313 appliances that specifically use FAME (biodiesel) from any biomass source (4) 0.047 0.149 appliances that specifically use vegetable oil as a fuel 0.003 0.091 appliances that are able to use domestic heating oil or liquid biofuel 0.274 0.292 appliances are able to use gas oil or liquid biofuel 0.283 0.327 B30K (5) 0.193 0.249 B30D (6) 0.199 0.273 Bioethanol from any biomass source 0.064 0.138 house coal (7) 0.301 0.400 anthracite 0.318 0.375 coal (non-domestic) (8) 0.350 0.385 manufactured smokeless fuel (domestic) 0.347 0.434 manufactured smokeless fuel (non-domestic) (8) 0.344 0.419 wood logs (9) 0.008 0.019 wood pellets 0.028 0.039 wood chips 0.009 0.016 dual fuel appliance (mineral and wood) 0.206 0.226 electricity (3 year average projection) (1) 0.522 electricity exported to the grid (3 year average projection) (1) 0.522 electricity (5 year average projection) (1) 0.517 0.502 electricity exported to the grid (5 year average projection) (1) 0.529 0.502 electricity (15 year average projection) (1) 0.401 electricity exported to the grid (15 year average projection) (1) 0.401 mains gas used to generate heat or heat and power (3 year average from year introduced) (1) 0.212 mains gas used to generate heat or heat and power (5 year average from year introduced) (1) 0.198 0.214 mains gas used to generate heat or heat and power (15 year average from year introduced) (1) 0.221 coal used to generate heat or heat and power 0.350 0.385 LPG used to generate heat or heat and power 0.245 0.242 domestic heating oil used to generate heat or heat and power 0.292 gas oil used to generate heat or heat and power 0.327 fuel oil used to generate heat or heat and power 0.297 0.313 electricity used to generate heat (3 year average projection) (1) 0.522 electricity used to generate heat (5 year average projection) (1) 0.517 0.502 electricity used to generate heat (15 year average projection) (1) 0.401 waste used to generate heat or heat and power 0.040 0.047 biomass used to generate heat or heat and power 0.013 0.069 biogas used to generate heat or heat and power 0.018 0.098 waste heat from power stations (3 year compliance period) 0.075 waste heat from power stations (5 year compliance period) 0.058 0.072 waste heat from power stations (15 year compliance period) 0.057 geothermal heat sources (3 year compliance period) 0.037 geothermal heat sources (5 year compliance period) 0.036 0.035 geothermal heat sources (15 year compliance period) 0.028 appliances that specifically use biodisel/FAME from any biomass source to generate heat and power 0.047 0.149 appliances that specifically use vegetable oil to generate heat and power 0.009 0.091 appliances able to use domestic heating oil or liquid biofuel to generate heat or power 0.274 0.292 appliances able to use gas oil or liquid biofuel to generate heat and power 0.283 0.327 appliances able to use fuel oil or liquid biofuel to generate heat and power 0.313 B30K used to generate heat or heat and power 0.193 0.249 B30D used to generate heat or heat and power 0.199 0.273 Bioethanol from any biomass source used to generate heat or heat and power 0.064 0.138 Electricity generated by CHP 3 year compliance period (1) 0.522 Electricity for pumping in dis tribution network 3 year compliance period (1) 0.522 Electricity generated by CHP 5 year compliance period (1) 0.547 0.502 Electricity for pumping in dis tribution network 5 year compliance period (1) 0.517 0.502 Electricity generated by CHP 15 year compliance period (1) 0.401 Electricity for pumping in dis tribution network 15 year compliance period (1) 0.401
Gases
Liquid Fuels
Solid Fuels
Grid Supply Electricity
Community Heating and
CHP
14 Proposed Carbon Emission Factors and Primary Energy Factor for SAP 2012
(5) A blend of 30% bio-diesel and 70% kerosene
(6) A blend of 30% bio-diesel and 70% gas oil/diesel
(7) This value should be used outside of smoke control zones
(8) For use in SBEM only
(9) This value should only be used for appliances specifically designed for wood logs and where adequate storage facilities are available.
5.1 Indicative emission factors for future compliance periods
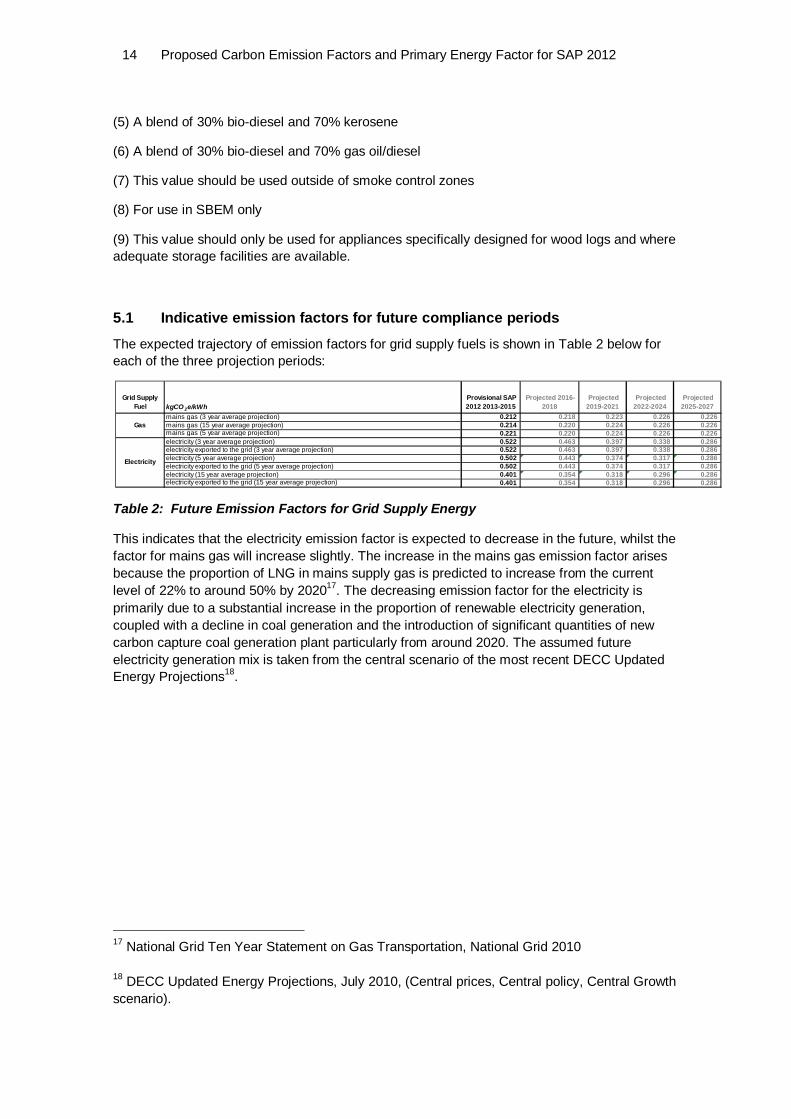
The expected trajectory of emission factors for grid supply fuels is shown in Table 2 below for each of the three projection periods:
Table 2: Future Emission Factors for Grid Supply Energy
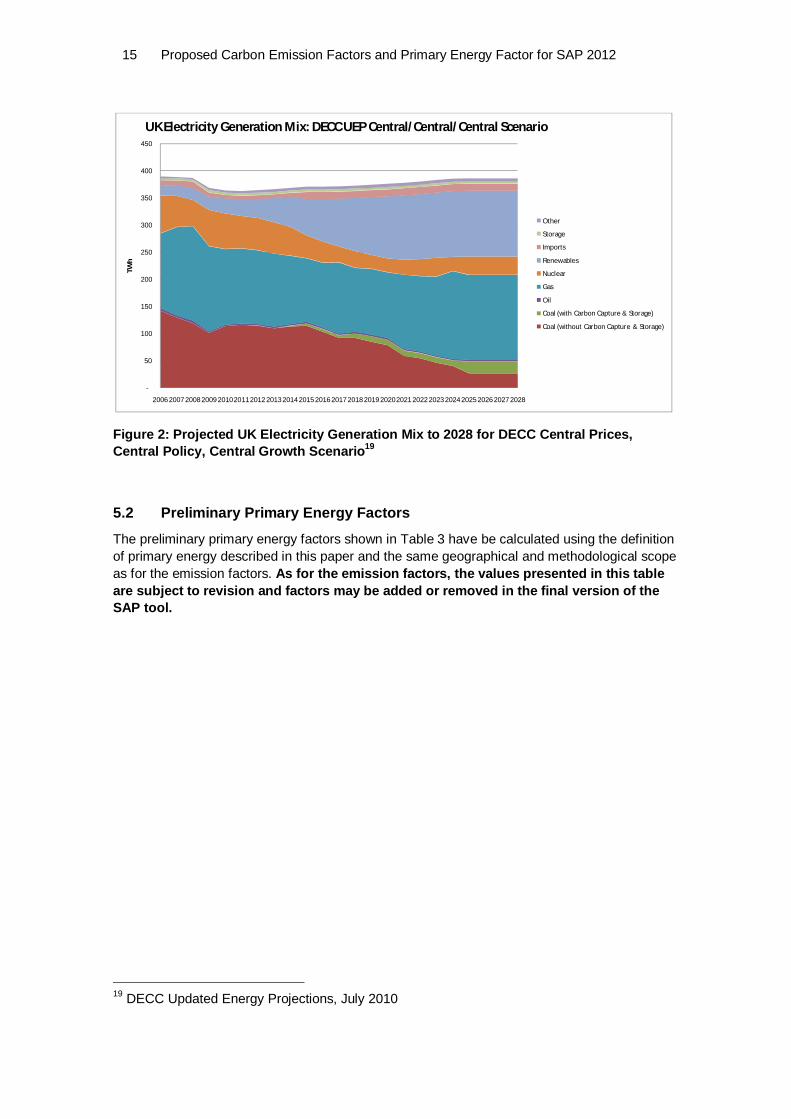
This indicates that the electricity emission factor is expected to decrease in the future, whilst the factor for mains gas will increase slightly. The increase in the mains gas emission factor arises because the proportion of LNG in mains supply gas is predicted to increase from the current level of 22% to around 50% by 202017. The decreasing emission factor for the electricity is primarily due to a substantial increase in the proportion of renewable electricity generation, coupled with a decline in coal generation and the introduction of significant quantities of new carbon capture coal generation plant particularly from around 2020. The assumed future electricity generation mix is taken from the central scenario of the most recent DECC Updated Energy Projections18.
17 National Grid Ten Year Statement on Gas Transportation, National Grid 2010 18 DECC Updated Energy Projections, July 2010, (Central prices, Central policy, Central Growth scenario).
Grid Supply Fuel kgCO 2e/kWh
Provisional SAP 2012 2013-2015
Projected 2016-2018
Projected 2019-2021
Projected 2022-2024
Projected 2025-2027
mains gas (3 year average projection) 0.212 0.218 0.223 0.226 0.226 mains gas (15 year average projection) 0.214 0.220 0.224 0.226 0.226 mains gas (5 year average projection) 0.221 0.220 0.224 0.226 0.226 electricity (3 year average projection) 0.522 0.463 0.397 0.338 0.286 electricity exported to the grid (3 year average projection) 0.522 0.463 0.397 0.338 0.286 electricity (5 year average projection) 0.502 0.443 0.374 0.317 0.286 electricity exported to the grid (5 year average projection) 0.502 0.443 0.374 0.317 0.286 electricity (15 year average projection) 0.401 0.354 0.318 0.296 0.286 electricity exported to the grid (15 year average projection) 0.401 0.354 0.318 0.296 0.286
Gas
Electricity
15 Proposed Carbon Emission Factors and Primary Energy Factor for SAP 2012
Figure 2: Projected UK Electricity Generation Mix to 2028 for DECC Central Prices, Central Policy, Central Growth Scenario19
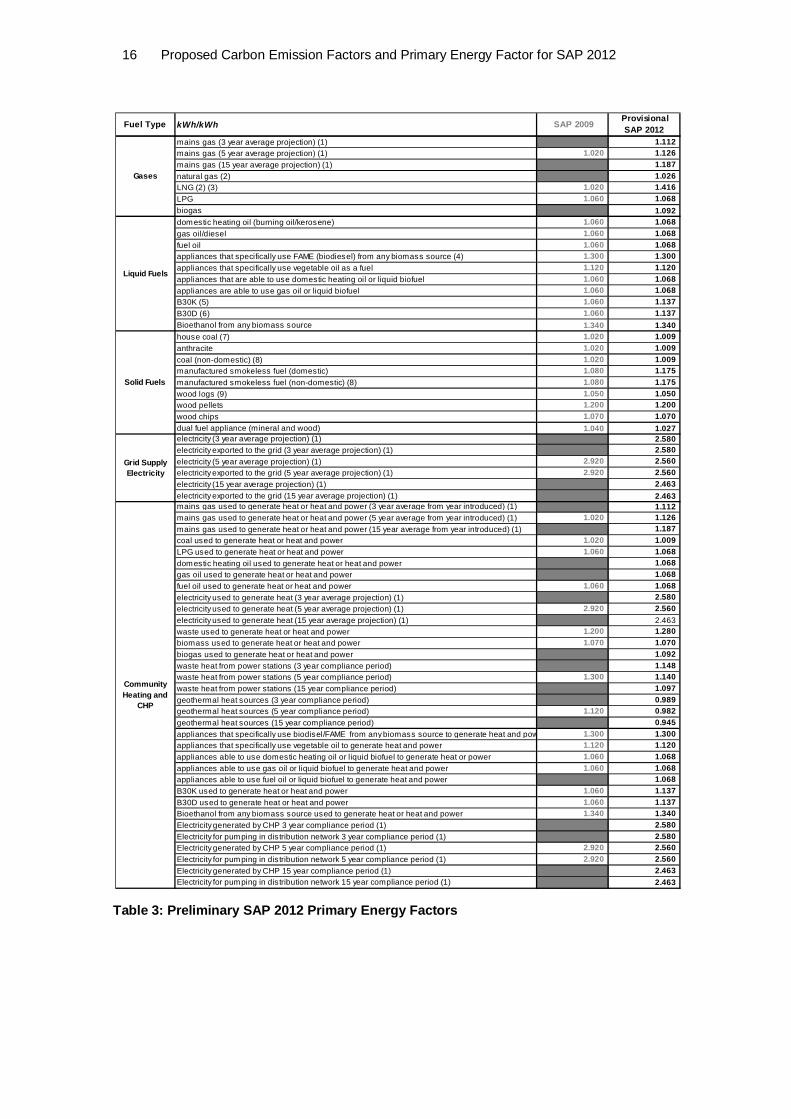
5.2 Preliminary Primary Energy Factors
The preliminary primary energy factors shown in Table 3 have be calculated using the definition of primary energy described in this paper and the same geographical and methodological scope as for the emission factors. As for the emission factors, the values presented in this table are subject to revision and factors may be added or removed in the final version of the SAP tool.
19 DECC Updated Energy Projections, July 2010
-
50
100
150
200
250
300
350
400
450
2006 2007 2008 2009 2010 2011 2012 2013 2014 2015 2016 2017 2018 2019 2020 2021 2022 2023 2024 2025 2026 2027 2028
TWh
UK Electricity Generation Mix: DECC UEP Central/Central/Central Scenario
Other
Storage
Imports
Renewables
Nuclear
Gas
Oil
Coal (with Carbon Capture & Storage)
Coal (without Carbon Capture & Storage)
16 Proposed Carbon Emission Factors and Primary Energy Factor for SAP 2012
Table 3: Preliminary SAP 2012 Primary Energy Factors
Fuel Type kWh/kWh SAP 2009 Provisional
SAP 2012 mains gas (3 year average projection) (1) 1.112 mains gas (5 year average projection) (1) 1.020 1.126 mains gas (15 year average projection) (1) 1.187 natural gas (2) 1.026 LNG (2) (3) 1.020 1.416 LPG 1.060 1.068 biogas 1.092 domestic heating oil (burning oil/kerosene) 1.060 1.068 gas oil/diesel 1.060 1.068 fuel oil 1.060 1.068 appliances that specifically use FAME (biodiesel) from any biomass source (4) 1.300 1.300 appliances that specifically use vegetable oil as a fuel 1.120 1.120 appliances that are able to use domestic heating oil or liquid biofuel 1.060 1.068 appliances are able to use gas oil or liquid biofuel 1.060 1.068 B30K (5) 1.060 1.137 B30D (6) 1.060 1.137 Bioethanol from any biomass source 1.340 1.340 house coal (7) 1.020 1.009 anthracite 1.020 1.009 coal (non-domestic) (8) 1.020 1.009 manufactured smokeless fuel (domestic) 1.080 1.175 manufactured smokeless fuel (non-domestic) (8) 1.080 1.175 wood logs (9) 1.050 1.050 wood pellets 1.200 1.200 wood chips 1.070 1.070 dual fuel appliance (mineral and wood) 1.040 1.027 electricity (3 year average projection) (1) 2.580 electricity exported to the grid (3 year average projection) (1) 2.580 electricity (5 year average projection) (1) 2.920 2.560 electricity exported to the grid (5 year average projection) (1) 2.920 2.560 electricity (15 year average projection) (1) 2.463 electricity exported to the grid (15 year average projection) (1) 2.463 mains gas used to generate heat or heat and power (3 year average from year introduced) (1) 1.112 mains gas used to generate heat or heat and power (5 year average from year introduced) (1) 1.020 1.126 mains gas used to generate heat or heat and power (15 year average from year introduced) (1) 1.187 coal used to generate heat or heat and power 1.020 1.009 LPG used to generate heat or heat and power 1.060 1.068 domestic heating oil used to generate heat or heat and power 1.060 1.068 gas oil used to generate heat or heat and power 1.060 1.068 fuel oil used to generate heat or heat and power 1.060 1.068 electricity used to generate heat (3 year average projection) (1) 2.580 electricity used to generate heat (5 year average projection) (1) 2.920 2.560 electricity used to generate heat (15 year average projection) (1) 2.463 waste used to generate heat or heat and power 1.200 1.280 biomass used to generate heat or heat and power 1.070 1.070 biogas used to generate heat or heat and power 1.092 waste heat from power stations (3 year compliance period) 1.148 waste heat from power stations (5 year compliance period) 1.300 1.140 waste heat from power stations (15 year compliance period) 1.097 geothermal heat sources (3 year compliance period) 0.989 geothermal heat sources (5 year compliance period) 1.120 0.982 geothermal heat sources (15 year compliance period) 0.945 appliances that specifically use biodisel/FAME from any biomass source to generate heat and power 1.300 1.300 appliances that specifically use vegetable oil to generate heat and power 1.120 1.120 appliances able to use domestic heating oil or liquid biofuel to generate heat or power 1.060 1.068 appliances able to use gas oil or liquid biofuel to generate heat and power 1.060 1.068 appliances able to use fuel oil or liquid biofuel to generate heat and power 1.060 1.068 B30K used to generate heat or heat and power 1.060 1.137 B30D used to generate heat or heat and power 1.060 1.137 Bioethanol from any biomass source used to generate heat or heat and power 1.340 1.340 Electricity generated by CHP 3 year compliance period (1) 2.580 Electricity for pumping in distribution network 3 year compliance period (1) 2.580 Electricity generated by CHP 5 year compliance period (1) 2.920 2.560 Electricity for pumping in distribution network 5 year compliance period (1) 2.920 2.560 Electricity generated by CHP 15 year compliance period (1) 2.463 Electricity for pumping in distribution network 15 year compliance period (1) 2.463
Gases
Liquid Fuels
Solid Fuels
Grid Supply Electricity
Community Heating and
CHP
17 Proposed Carbon Emission Factors and Primary Energy Factor for SAP 2012
6 Description of Fuel Types and Their Application in SAP
A description of the fuel types and the circumstances under which each of the factors should be used is provided below Natural gas: Gas that has been piped directly from gas fields before being introduced into the UK mains supply system. LNG (Liquefied Natural Gas): Gas that has been liquefied and shipped to the UK before entering the UK mains supply system. LPG (Liquid Petroleum Gases): Used for appliances that use propane or butane. It is generally only used where mains supply gas is not available. LPG is derived from oil and pressurised into liquid for distribution and may be bulk supply (stored in tanks) or supplied in reusable cylinders. Bio-gas: Use for appliances that exclusively use methane that has been generate from bio-genic sources. Sources of bio-gas include landfill sites and fermentation of animal waste and vegetable matter. This factor should only be used where appliances are directly connected to a bio-gas supply source. Domestic heating oil/burning oil/kerosene (28 sec oil): Use with appliances that are designed to use domestic heating oil. Domestic heating oil is a low viscosity refined petroleum product predominantly used as a heating fuel domestic scale appliances. Gas oil/diesel (35 sec oil): Use with appliances that are designed to use gas oil/diesel. Gas oil is a medium viscosity refined petroleum product predominantly used as heating fuel in commercial scale appliances. Fuel oil: Use with appliances that are designed to use fuel oil. Fuel oil is a high viscosity refined petroleum product predominantly used as a heating fuel large industrial scale applications. Bio-diesel from any biomass source: Use with appliances that are designed to run exclusively on bio-diesel. Bio-diesel is derived from vegetable oil or animal fats and consists of long-chain alkyl (methyl, propyl or ethyl) esters and is sometimes referred to as FAME (fatty acid methyl esters). The emissions associated with this fuel can vary greatly depending on the biomass source and production methods and the distribution chain. The emission factor provided here is based on the current mix of bio-fuels used in the UK and excludes direct CO2 emissions from fuel combustion which are of bio-genic origin. Vegetable oil: Use for appliances designed to run exclusively on vegetable oil. Vegetable oil used as a fuel may be derived from virgin sources or from used vegetable oil. Domestic heating oil or liquid bio-fuels (Dual Fuel Appliances): Use for appliances that can use either domestic heating oil or liquid bio-fuels. Currently there are very few appliances available that are able to run and known to run on domestic heating oil or bio-diesel. Therefore, the amount of liquid bio-fuels (bio-diesel or vegetable oils) that are used in appliances that can also use domestic heating oil will be very small. In the absence of statistical information, it is assumed that the ratio of domestic heating oil:liquid bio-fuel is 100:0. Hence the emission factor for domestic heating oil represents the current UK fuel mix for these appliances. This situation may change in the future.
18 Proposed Carbon Emission Factors and Primary Energy Factor for SAP 2012
Gas oil or liquid bio-fuels (Dual Fuel Appliances): This factor should be used for appliances that can use either gas oil or liquid bio-fuels. Currently there are very few appliances available that are able to run/known to run on gas oil or bio-diesel. Therefore, the amount of liquid bio-fuels (bio-diesel or vegetable oils) that are used in appliances that can also use gas oil will be very small. In the absence of statistical information, it is assumed that the ratio of gas oil:liquid bio-fuel is 100:0. Hence the emission factor for gas oil represents the current UK fuel mix for these appliances. This situation may change in the future. Fuel oil or liquid bio-fuels (Dual Fuel Appliances): Use for appliances that can use either fuel oil or liquid bio-fuels. Currently there are very few appliances available that are able to run/known to run on fuel oil or bio-diesel. Therefore, the amount of liquid bio-fuels (bio-diesel or vegetable oils) that are used in appliances that can also use fuel oil will be very small. In the absence of statistical information, it is assumed that the ratio of fuel oil:liquid bio-fuel is 100:0. Hence the emission factor for fuel oil represents the current UK fuel mix for these appliances. This situation may change in the future. B30K: Use for appliances that are designed to run exclusively on B30K. B30K is a 30:70 mix of bio-diesel and domestic heating oil. B30D: Use for appliances that are designed to run exclusively on B30D. B30D is a 30:70 mix of bio-diesel and gas oil. Bio-ethanol from any biomass source: Use for appliances that exclusively run on bio-ethanol. Bio-ethanol is ethanol that has been derived from vegetable oil or animal fats. The emission factor excludes direct CO2 emissions from fuel combustion as it is bio-genic in origin. House coal: Use for domestic appliances that are designed to use coal and are outside of smoke control zones. The factor given represents an average value for bituminous coal supplied to the domestic sector. Anthracite: Use for appliances that are designed to run on anthracite which is permitted inside smoke control zones. Anthracite is a purer more compressed form of coal which contains minimal hydrocarbons and tars and generally has high heat content compared to other types of coal and can be used in smokeless zones. Coal (non-domestic): For use in SBEM not SAP. The factor given is an average value for coal supplied to the non-domestic sector. Manufactured smokeless fuel (domestic): Use for appliances that are designed to run on smokeless solid fuels which are permitted inside smoke control zones. Smokeless solid fuels covers coke produced for domestic/commercial use such as Coalite, and briquetted fuels such as Phurnacite and Homefire. Manufactured smokeless fuel (non-domestic): For use in SBEM not SAP. Use for appliances that are designed to run on smokeless solid fuels which are permitted inside smoke control zones. Smokeless solid fuels covers coke produced for domestic/commercial use such as Coalite, and briquetted fuels such as Phurnacite and Homefire. Wood logs: Use for appliances designed exclusively for burning wood logs and should only be used for buildings where adequate storage is provided for wood logs. The emission factor excludes direct CO2 emissions from fuel combustion as it is bio-genic in origin. Wood pellets: Use for appliances designed exclusively for burning wood pellets. This emission factor excludes direct CO2 emissions from fuel combustion as it is bio-genic in origin. Wood chips: Use for appliances designed exclusively for burning wood chips. This emission factor excludes direct CO2 emissions from fuel combustion as it is bio-genic in origin.
19 Proposed Carbon Emission Factors and Primary Energy Factor for SAP 2012
Mineral or wood solid fuels (Dual Fuel Appliances): Use for solid fuel appliances that are designed to burn both wood and mineral solid fuels. This emission factor is based on the UK average mix of solid fuels used in the domestic sector. Electricity: Use for all electrical appliances. The factor given is based on projected system average values over the stated period. Electricity exported to the grid: Use for any electricity generated from on site renewables which is exported to the grid. The factor given is based on projected system average values over the stated period. Geothermal heat sources: Use for district heating supplied from geothermal sources. Biomass used to generate heat or heat and power: This factor should be used for district heating schemes fired by biomass sources. Direct CO2 emissions are excluded as they are of bio-genic origin Waste used to generate heat or heat and power: Use for appliances that use waste to generate either heat or heat and power. Direct CO2 emissions from the proportion of waste that is derived from bio-genic sources are excluded, but direct CO2 emissions from plastic are included as they are derived from fossil fuel sources. Waste heat from power stations: Use for district heating supplied by waste heat from power stations Electricity generated by CHP: Use for all electricity generated by CHP regardless of the generation fuel. The factor given is based on projected system average values over the stated period. Electricity for pumping in distribution network: Use for electricity used for pumping for district heating schemes regardless of the fuel used to generate heat.
20 Proposed Carbon Emission Factors and Primary Energy Factor for SAP 2012
7 Data Sources and Assumptions for the Preliminary SAP 2012 emission factors
The scope of emissions included in the conversion factors provided in Defra/DECC company guidelines for greenhouse gas reporting 20 is identical to that recommended here. The 2011 Defra/DECC company reporting factors are intended for use with actual energy consumption data and are based on the most recently available data sources, which mostly relates to 2010 (and for grid supply electricity they also provided historical and international emission factors). For most energy sources the carbon impacts are not expected to change over time so it is appropriate to use the most recent Defra/DECC factors directly in SAP 2012. For the majority of fuel types, the Defra/DECC factors use the UK greenhouse gas inventory21 as the source for direct emissions (e.g., from fuel combustion), whilst the indirect emissions are based on European average upstream values22 taken from “well to wheel” lifecycle emissions data23. However, the Defra/DECC factors do not cover all the fuels that are required for SAP, and for grid supply fuels, specifically electricity and mains gas, projected emission factors are also required. The specific data sources and assumptions used to calculate the preliminary SAP 2012 emission factors are catalogued below. Mains gas: Based on the projected ratio of LNG:natural gas in UK grid supply gas (22% 2013 to 2015, 23% 2013-2017 and 43% 2013-2027), Data sources: National Grid Ten Year Gas Transportation Statement, 2010 24, emission factors for piped natural gas and liquefied natural gas. Natural gas: Taken directly from the 2011 Defra/DECC GHG Conversion factors. Data sources: Direct emissions = UK values from NAEI, Indirect emissions = European averages taken from JEC WTW (4) LNG: Taken directly from Defra/DECC 2011 Defra/DECC GHG Conversion factors. Data sources: Direct emissions = UK values from NAEI (3), Indirect emissions = European averages taken from JEC WTW (4) LPG: Taken directly from Defra/DECC 2011 Defra/DECC GHG Conversion factors. Data sources: Direct emissions = UK values from NAEI (3), Indirect emissions = European averages taken from JEC WTW (4)
20 2011 Guidelines for Defra/DECC GHG Conversion Factors for Company Reporting 21 UK Greenhouse Gas Inventory 2009 - UK NIR 2010 (Issue 3), AEA 22 European average values will implicitly take into account both UK based and overseas emissions 23 Well to Wheel Analysis of Future Automotive Fuels and Powertrains in the European Context, JRC/EUCAR/CONCAWE, Version 3 2008 update. 24 National Grid Ten Year Statement on Gas Transportation, National Grid 2010
21 Proposed Carbon Emission Factors and Primary Energy Factor for SAP 2012
Bio-gas: Taken directly from Defra/DECC 2011 Defra/DECC GHG Conversion factors. Data source: Biomass Energy Centre 201025 Domestic heating oil/burning oil/kerosene (28 SEC): Taken directly from the 2011 Defra/DECC GHG Conversion factors. Data sources: Direct emissions = UK values from NAEI (3), Indirect emissions = European averages taken from JEC WTW (4) Gas oil/diesel (35 SEC): Taken directly from the 2011 Defra/DECC GHG Conversion factors. Data sources: Direct emissions = UK values from NAEI (3), Indirect emissions = European averages taken from JEC WTW (4) Fuel oil: Taken directly from the 2011 Defra/DECC GHG Conversion factors. Data sources: Direct emissions = UK values from NAEI (3), Indirect emissions = European averages taken from JEC WTW (4) Bio-diesel (from any biomass source): Taken directly from the 2011 Defra/DECC GHG Conversion factors. Data sources: Defra/DECC 2011 (2): Based on UK lifecycle GHG conversion factors from the RFA26 - from default emission factors for each bio-fuel source and the current UK mix of sources. Vegetable oil: In the absence of a reliable source of statistical information on the sources of vegetable oils used as fuel in building, the emission figure provided here is based on that for virgin rape seed oil. Data Sources: UK lifecycle GHG conversion factors from the RFA for bio-diesel from Rape Seed Oil – Partial data only i.e., excluding emissions arising from esterification(7) Domestic heating oil /liquid bio-fuel (Dual Fuel Appliances): In the absence of statistical information, it is assumed that the current UK ratio of domestic heating oil:liquid bio-fuel is 100:0. Data source: as for domestic heating oil Gas oil/liquid bio-fuel (Dual Fuel Appliances): In the absence of statistical information, it is assumed that the current UK ratio of gas oil:liquid bio-fuel is 100:0 . Data source: as for gas oil Fuel oil/liquid bio-fuel (Dual Fuel Appliances): In the absence of statistical information, it is assumed that the current UK ratio of fuel oil:liquid bio-fuel is 100:0 . Data source: as for fuel oil B30K: A 30:70 mix of bio-diesel and domestic heating oil. Data sources: as for domestic heating oil and bio-diesel (from any biomass source) B30D: A 30:70 mix of bio-diesel and gas oil. Data sources: as for gas oil and bio-diesel (from any biomass source) Bio-ethanol (from any biomass source): Taken directly from the 2011 Defra/DECC GHG Conversion factors. Data sources: UK lifecycle GHG conversion factors from the RFA (7) - from default emission factors for each bio-fuel source and the current UK mix of sources. House coal: An average value average value for bituminous coal supplied to the domestic sector. Data sources: Direct emissions = UK Greenhouse gas emissions inventory value (2), Indirect emissions = European averages taken from JEC WTW (4) Anthracite: An average UK value. Direct emissions = UK values for NAEI (2), Indirect emissions = European averages taken from JEC WTW (4)
25 Forest Research (research agency of the UK Forestry Commission) via biomassenergycentre.org.uk, accessed 2010 26 Renewable Fuels Agency, Quarterly Report 10 2011
22 Proposed Carbon Emission Factors and Primary Energy Factor for SAP 2012
Coal (non-domestic): Taken directly from the 2011 Defra/DECC GHG Conversion factors. Data sources: Direct emissions = UK values from NAEI (2), Indirect emissions = European averages taken from JEC WTW (4) Manufactured smokeless fuel (domestic): Average UK domestic value. Data sources: Direct emissions = UK values from NAEI (2), Indirect emissions = upstream emissions from the input fuel (coal) are European averages taken from JEC WTW (4) plus typical emissions per kWh product from transformation process where emissions are from NAEI GHG Inventory 2009 (X) and amount of product from DUKES27 production 2009 Manufactured smokeless fuel (non-domestic): Average UK non-domestic value. UK value. Data sources: Direct emissions = UK values from NAEI (2), Indirect emissions = upstream emissions from the input fuel (coal) are European averages taken from JEC WTW (4) plus typical emissions per kWh product from transformation process where emissions are from NAEI GHG Inventory 2009 (X) and amount of product from DUKES28 production 2009 Wood logs: Taken directly from the 2011 Defra/DECC GHG Conversion factors, based on heat produced from long logs. Data sources: Biomass Energy Centre 201029 Wood pellets: Taken directly from the 2011 Defra/DECC GHG Conversion factors, based on heat produced from wood pellets produced from UK forest residues. Data sources: Biomass Energy Centre 201030 Wood chips: Taken directly from the 2011 Defra/DECC GHG Conversion factors, based on heat produced from wood chips from UK forest residues. Data sources: Biomass Energy Centre 201031 Mineral or wood solid fuel (Dual Fuel Appliances): This emission factor is based on the UK average value for all solid fuels used in the domestic sector and their respective emission factors, Data sources: mix of domestic solid fuels from DUKES 201132 Electricity: Projected average value for UK grid supply electricity over the stated period, where the projected electricity generation mix is based on DECCs Central Prices, Central Policy, Central Growth scenario and assumes current generation efficiencies and transmission and
27 Digest of UK Energy Statistics 2011, Table 2.5 28 Digest of UK Energy Statistics 2011, Table 2.5 29 BEAT tool: Life Cycle Greenhouse Gas emissions for production of domestic heat by combustion of long logs, Produced by Anna Evans, Vicki Shaw, Maha Elsayed and Nigel Mortimer of North Energy Associates Ltd., on 14 August 2007 for DEFRA Project NFO434 "Bio-energy Technologies Environmental Impact Assessment Tool" 30 BEAT tool: Life Cycle Greenhouse Gas emissions for production of wood pellets from UK forest residues, Produced by Anna Evans, Vicki Shaw, Maha Elsayed and Nigel Mortimer of North Energy Associates Ltd., on 14 August 2007 for DEFRA Project NFO434 "Bio-energy Technologies Environmental Impact Assessment Tool" 31 BEAT tool: Life Cycle Greenhouse Gas Emissions for Production of wood pellets from UK forest residues, Produced by Anna Evans, Vicki Shaw, Maha Elsayed and Nigel Mortimer of North Energy Associates Ltd., on 14 August 2007 for DEFRA Project NFO434 "Bio-energy Technologies Environmental Impact Assessment Tool" 32 Digest of UK Energy Statistics 2011, Table 2.1 and Table 7.1

23 Proposed Carbon Emission Factors and Primary Energy Factor for SAP 2012
distribution losses. Data Sources: Generation mix: Updated Energy Projections33, Generation efficiencies DUKES 2011 Electricity exported to the grid: As for electricity Mains gas used to generate heat or heat and power: As for mains gas Coal used to generate heat or heat and power: As for non-domestic coal LPG used to generate heat or heat and power: As for LPG Domestic heating oil used to generate heat or heat and power: As for domestic heating oil Gas oil used to generate heat or heat and power: As for gas oil Fuel oil used to generate heat or heat and power: As for fuel oil Electricity used to generate heat: As for electricity Waste used to generate heat or heat and power: This is based on a lifecycle assessment of heat generated from Biomass Refuse Derived Fuel (RDF) from Municipal Solid Waste using the Fairport Process.34. Data sources: Biomass Energy Centre 2010 35. Wood pellets used to generate heat or heat and power: See wood pellets Wood chips used to generate heat or heat and power: See wood chips Biomass used to generate heat or heat and power: In the absence of national statistical data sources on the biomass fuels used to generate heat or heat and power, the emission factor is based on the mix of biomass fuel sources used in the UK to generate electricity. Applying emission factors as follows; wood chip factor for plant biomass (straw and wood), waste emission factor to animal biomass (e.g., poultry litter) and bio-gas emission factor to bio-gas. Data sources: generation mix: Energy Trends36, emission factors: as for wood chips, waste and bio-gas Bio-gas used to generate heat or heat and power: As for bio-gas Waste heat from power stations: This is based on the reduction in electricity generation that is expected to occur when a power station is producing heat at a high enough temperature to provide district heating. It is based on an assumed 1kW reduction in electricity output for each 7kW of heat generated. 33 DECC Updated Energy Projections, July 2010, (Central Prices, Central Policy, Central Growth Scenario) 34 NB. A more recent information source on waste used to generate heat or heat and power has been identified since the preliminary emission factor was calculated. 35 BEAT tool: Life Cycle Greenhouse Gas Emissions for Production of Heat by Combustion of High Biomass Refuse Derived Fuel (RDF) from Municipal Solid Waste using the Fairport Process. Produced by Anna Evans, Vicki Shaw, Maha Elsayed and Nigel Mortimer of North Energy Associates Ltd., on 14 August 2007 for DEFRA Project NFO434 "Bio-energy Technologies Environmental Impact Assessment Tool" 36 DECC Quarterly Energy Trends, July 2011, Table 7.1
24 Proposed Carbon Emission Factors and Primary Energy Factor for SAP 2012
Geothermal heat sources: The emission factor is based on data for a single deep geothermal district heating scheme and relates to electricity used to pump heat. Data source: Southampton district heating scheme37. Bio-diesel from any biomass source to generate heat and power: As for biomass from any biomass source Vegetable oil to generate heat and power: As for vegetable oil Domestic heating oil or liquid bio-fuel to generate heat or power (Dual Fuel Appliances): As for Domestic heating oil or liquid bio-fuel Gas oil or liquid bio-fuel to generate heat or power (Dual Fuel Appliances): As for Gas oil or liquid bio-fuel Fuel oil or liquid bio-fuel to generate heat or power (Dual Fuel Appliances): As for Fuel oil or liquid bio-fuel B30K to generate heat or heat and power: As for B30K B30D to generate heat or heat and power: As for B30D Bio-ethanol from any biomass source to generate heat or heat and power: As for Bio-ethanol from any biomass source. Electricity generated by CHP: As for Electricity Electricity for pumping in distribution networks: As for Electricity
37 Private communication Simon Woodward, Utilitcom