Embed Size (px)
Citation preview
© IIAR 2017 1
Abstract
New measurement methods make it possible to design energy-efficient Low Charge Evaporator Systems Controlling both the injection of refrigerant according to the Evaporator load and Defrost cycle “demand defrost” while also increasing safety aspect when using natural refrigerants as Ammonia.
Requirements to reduce global warming (GWP) and CO2 emissions lead to a desire to use natural refrigerants. This has initiated numerous new efforts and developments worldwide. Application of new measurement principles and design methods in the refrigeration industry may significantly impact the achievement of lower global electrical energy consumption by realizing reductions of 20 to 40% (Jensen, 2015). At the same time safety may be increased by minimizing the refrigerant amount through “LOW CHARGE SYSTEMS” with a charge reduction factor of 30 to 50 times for Ammonia DX systems (Nelson, 2013). The heat transfer coefficient within the evaporators is highly dependent on the flow pattern, mass flux and the Vapor Quality.
This paper describes a new sensor system for optimizing Evaporator Control including description of the measurement principle for measuring the phase of refrigerant as Vapor Quality with an “X” sensor that measures degree of dryness and a demand defrost sensor measuring ice build-up on the air cooler surface. The paper also provides information about sensor design, laboratory testing, system design, field testing, application, summary and conclusions.
Technical Paper #1
New Refrigerant Quality Measurement and Demand Defrost Methods
Michael Elstroem, BTecMan & MarEng.
Technical Manager, HB Products A/S Boegekildevej 21,
DK-8361 Hasselager Denmark. [email protected]


Technical Paper #1 © IIAR 2017 3
New Refrigerant Quality Measurement and Demand Defrost Methods
Introduction
Five years of experience in testing and installation on ammonia systems have
proven that an “X” Vapor Quality Sensor mounted in the exit of an evaporator
optimizes the entire system and makes it possible to control and limit the amount
of refrigerant in the evaporator under all loads by only supplying the refrigerant
needed to the evaporator depending on the load. Experience in using the same Vapor
Quality Sensor on HFC plant shows that it provides the same benefits of minimizing
superheat and optimizing the evaporator efficiency. Further optimization is possible
by installing a defrosting sensor on the outside of the air-cooler tubes in the air inlet
side, the sensor measures the ice layer thickness and can start defrosting at desired
ice layer thickness “Defrost on demand.”
Hot-gas defrost can be optimized by using the “X” sensor for measuring and control
draining of condensate hot-gas to ensure that the entire heat exchanger area is
utilized optimally and thus minimizing defrosting time. The “X” and Defrost sensor
is an optimal solution from an energy performance point of view by optimize the
operation and function during both frost and defrost operation, and at the same time
increase safety by ensuring that the evaporator tubes is empty for liquid before start
and stop hot-gas defrost, this prevent risk of liquid hammering.
How It Works
The sensor is based on the capacitive measurement principle in which two or more
measuring electrodes/conductors measure the charges and change in electrical field/
resistance depending on difference in the dielectric properties of various media.
Hereby the ratio between vapor and liquid amounts is measured instantaneously, i.e.,
without delay as a Void Fraction measurement.
4 © IIAR 2017 Technical Paper #1
2017 IIAR Natural Refrigeration Conference & Heavy Equipment Expo, San Antonio, TX
What is an electrical capacitor?
A capacitor is a component designed to create and hold an electric field, which means that
capacitors can store energy. It takes energy to pull electric charges apart and so establish
an electric field between the separated conductors. Capacitors are like small batteries.
Capacitance is a measure of how much charge is needed to produce a given potential
difference between two separated conductors. In other words, capacitance is defined
as the ratio of the amount of charge stored to the resulting voltage difference. The
insulating material between the conductors is known as the dielectric. Typical
dielectrics used in electronic systems are ceramics, plastics and air.
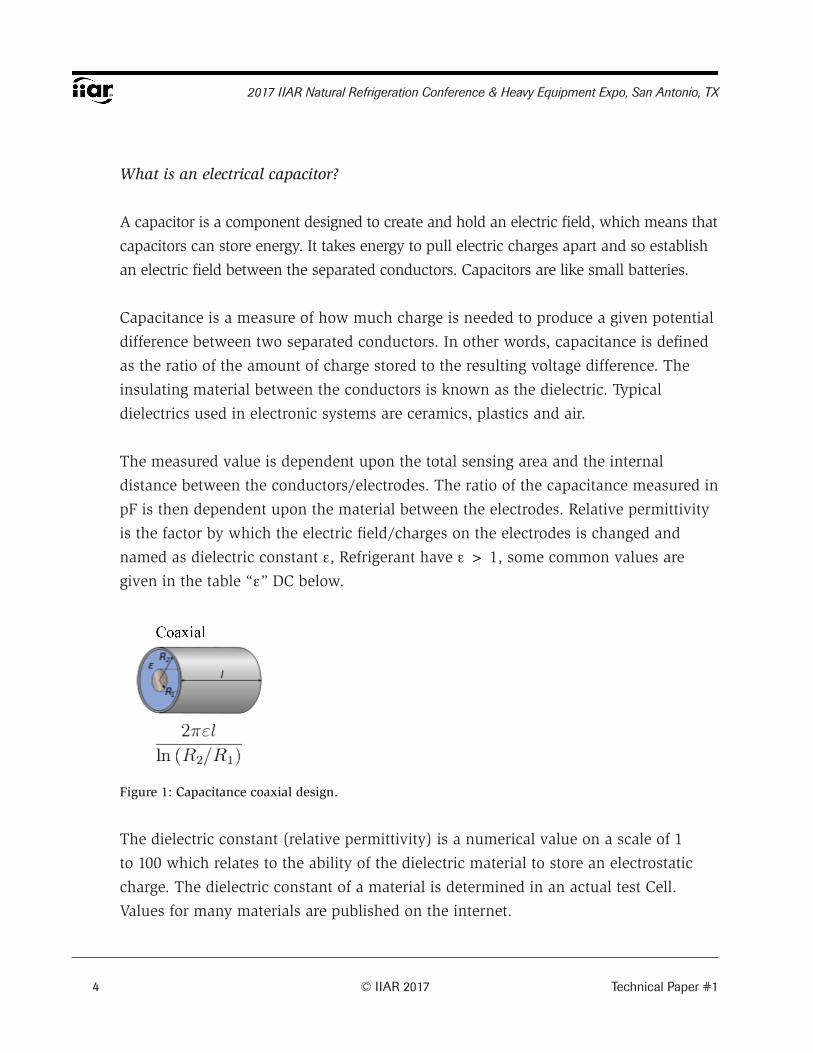
The measured value is dependent upon the total sensing area and the internal
distance between the conductors/electrodes. The ratio of the capacitance measured in
pF is then dependent upon the material between the electrodes. Relative permittivity
is the factor by which the electric field/charges on the electrodes is changed and
named as dielectric constant ε, Refrigerant have ε > 1, some common values are
given in the table “ε” DC below.
Figure 1: Capacitance coaxial design.
The dielectric constant (relative permittivity) is a numerical value on a scale of 1
to 100 which relates to the ability of the dielectric material to store an electrostatic
charge. The dielectric constant of a material is determined in an actual test Cell.
Values for many materials are published on the internet.
Technical Paper #1 © IIAR 2017 5
New Refrigerant Quality Measurement and Demand Defrost Methods
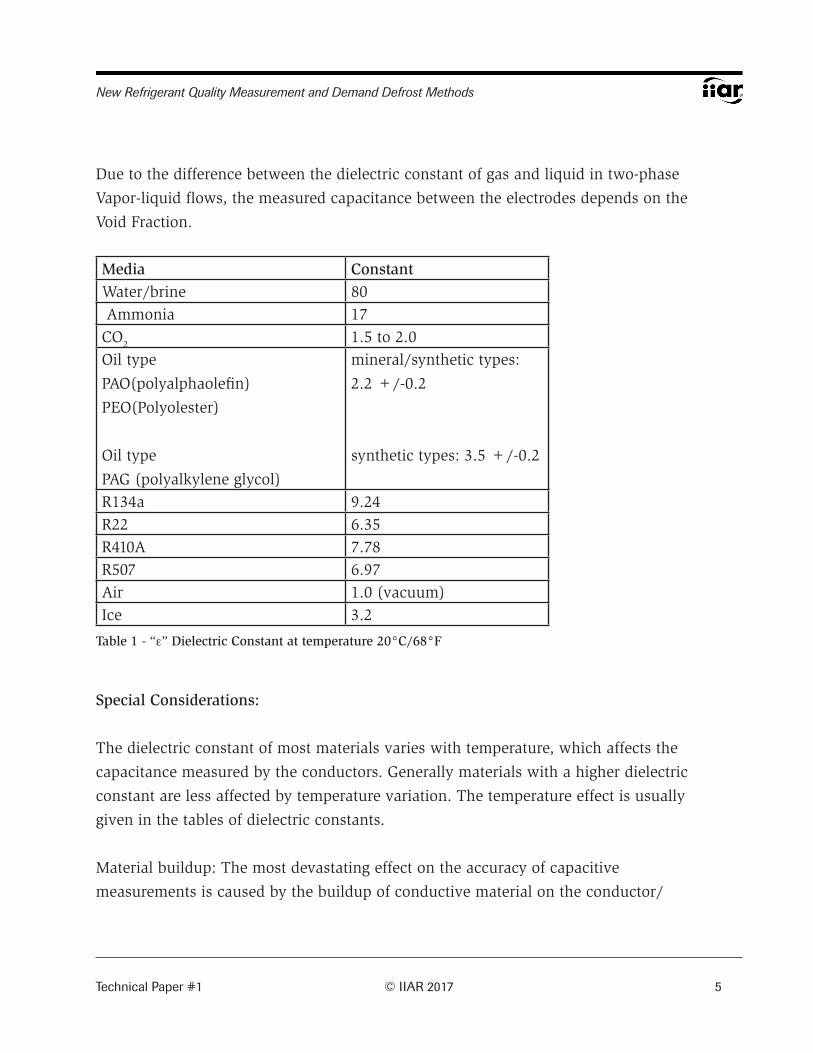
Due to the difference between the dielectric constant of gas and liquid in two-phase
Vapor-liquid flows, the measured capacitance between the electrodes depends on the
Void Fraction.
Media ConstantWater/brine 80 Ammonia 17 CO2 1.5 to 2.0 Oil type
PAO(polyalphaolefin)
PEO(Polyolester)
Oil type
PAG (polyalkylene glycol)
mineral/synthetic types:
2.2 +/-0.2
synthetic types: 3.5 +/-0.2
R134a 9.24 R22 6.35R410A 7.78R507 6.97Air 1.0 (vacuum)Ice 3.2
Table 1 - “ε” Dielectric Constant at temperature 20°C/68°F
Special Considerations:
The dielectric constant of most materials varies with temperature, which affects the
capacitance measured by the conductors. Generally materials with a higher dielectric
constant are less affected by temperature variation. The temperature effect is usually
given in the tables of dielectric constants.
Material buildup: The most devastating effect on the accuracy of capacitive
measurements is caused by the buildup of conductive material on the conductor/

6 © IIAR 2017 Technical Paper #1
2017 IIAR Natural Refrigeration Conference & Heavy Equipment Expo, San Antonio, TX
sensor surface. Non-conductive buildup is not as serious since it only represents a
small part of the total capacitance. Oil is non-conductive, metal impurities in dirt is
an example of a material that is conductive.
Chemicals may affect the insulating material. The accuracy of the capacitive
measurements can be influenced by the absorption of chemicals (refrigerant) into the
insulating material causing swelling.
Parameters which influence the flow pattern and have strong impact on heat transfer:
In thermodynamics, Vapor Quality is the mass fraction between
vapor and liquid/vapor in a saturated wet mixture; i.e. saturated
vapor has a quality of 1.0, and pure liquid has a quality of 0.
Quality “X” can be calculated by dividing the mass of the vapor
by the mass of the total mixture.
Figure 2: h log p diagram

Technical Paper #1 © IIAR 2017 7
New Refrigerant Quality Measurement and Demand Defrost Methods
Experience has proven that the sensor measures in the superheated area range up to
+5K. The sensor is independent by the boiling point and measure directly degree of
dryness.
Void Fraction:
The volumetric Void Fraction is defined as the ratio of the volume occupied by the
liquid (wet vapor) in the tube and the total volume of the tube. It can thus be seen as
an average of the cross sectional Void Fraction over the tube.
Figure 2: Void Fraction compared to vapor quality
8 © IIAR 2017 Technical Paper #1
2017 IIAR Natural Refrigeration Conference & Heavy Equipment Expo, San Antonio, TX
For vapor qualities above 0.5, there is approximately a linear link to the Void Fraction.
The “X” sensor measures vapor quality as the ratio of the vapor and liquid part in a
two-phase flow as a volumetric Void Fraction measurement. This is the ratio of the
total volume occupied by the liquid amount in the sensor part to the total volume
of the suction pipe/tube. The measured capacitance in pF can’t be directly linked to
the mass Void Fraction, for sensor setup it’s necessary to use data from laboratory
testing where data from a liquid mass flow sensor are compared with the capacitive
measurement in pF from the “X” sensor. A table with calibration data from laboratory
testing proved that is possible to calibrate the capacitive sensor to react as an “X”
sensor.
Explanation of observed and measured flow patterns at the outlet of an over-feed
evaporator:
To ensure high efficiency and thus good heat transfer at low differential temperature
“ETD” (heat transfer rate) the heat exchangers should be designed dynamically with
sufficiently high vapor velocity (15 to 30m/sec.) to obtain and secure annular flow
where the whole internal surface of the evaporator tubes is exposed. New evaporator
design with internal surface enhancement and special distributors optimizes the
entire system.
Flow pattern in two-phase flow varies depending on the type of refrigerant, tube
diameter, Vapor Quality, mass flux and flow orientation.
Ammonia will usually have a stratified two phase flow pattern in horizontal pipes
and often slug or plug flow in rising pipes, and should therefore be designed
specifically. Optimum efficiency is achieved by measuring the X-value at evaporator
exit and controlling the liquid feed to the evaporator in response to the quality
signal. Liquid overfeed should be minimized, and re-circulation rates from 1.1 to
1.5 will normally be sufficient to achieve maximum evaporator capacity. Figure 4

Technical Paper #1 © IIAR 2017 9
New Refrigerant Quality Measurement and Demand Defrost Methods
shows a time-based flow pattern. It shows that by measuring the vapor quality you
can measure and regulate liquid feed depending on the evaporator load to obtain
optimum flow pattern. The sensor signal is a mirror image of the situation inside the
piping, for example, is it possible to measure if the evaporator is overfed or starved.
Slug flow with short intervals indicates overfeed, while plug flow at long intervals
indicates a starved evaporator (requires more refrigerant).
Figure 3: Sensor response to a changing flow pattern and phase shift

10 © IIAR 2017 Technical Paper #1
2017 IIAR Natural Refrigeration Conference & Heavy Equipment Expo, San Antonio, TX
Figure 4: Flow vs. Capacitance (C nom is capacitance value in pF)
Figure 5 shows flow vs. capacitance for different flow patterns measured at Ghent
University. For two phase flow, the dielectric constant of both phases strongly
influences the measured capacity. Therefore, the dielectric constant of both phases is
derived from actual measurements of the capacitive signal in pF (De Kerpel, 2013).
Electronic Measuring Circuit
Circuit for measuring capacitance change based upon a programmable digital signal
processor (DSP) which performs a frequency scan.
Capacitive sensors are found in a wide range of equipment, from consumer
electronics to industrial/process control. Examples of products are hygrometers that
Technical Paper #1 © IIAR 2017 11
New Refrigerant Quality Measurement and Demand Defrost Methods
indicate humidity changes: pressure, liquid level sensors and accelerometers are also
using capacitive sensing.
As a specific example similar to the vapor quality sensing is a capacitive humidity
sensor (RH). In this type of sensor, the dielectric material is designed to absorb
water vapor from the external environment when exposed. The electrical capacitance
increases as the dielectric material absorbs water. Due to the fact that the dielectric
coefficient increases with increased moisture it is a direct measure for the relative
humidity.
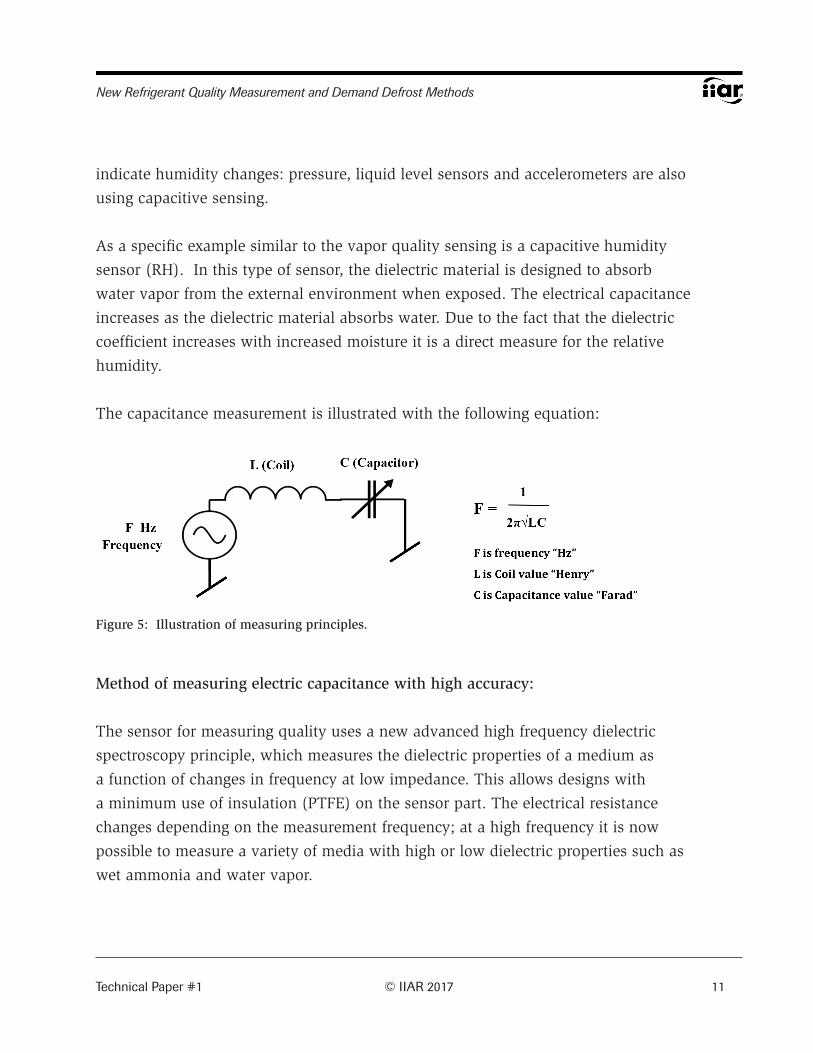
The capacitance measurement is illustrated with the following equation:
Figure 5: Illustration of measuring principles.
Method of measuring electric capacitance with high accuracy:
The sensor for measuring quality uses a new advanced high frequency dielectric
spectroscopy principle, which measures the dielectric properties of a medium as
a function of changes in frequency at low impedance. This allows designs with
a minimum use of insulation (PTFE) on the sensor part. The electrical resistance
changes depending on the measurement frequency; at a high frequency it is now
possible to measure a variety of media with high or low dielectric properties such as
wet ammonia and water vapor.
12 © IIAR 2017 Technical Paper #1
2017 IIAR Natural Refrigeration Conference & Heavy Equipment Expo, San Antonio, TX
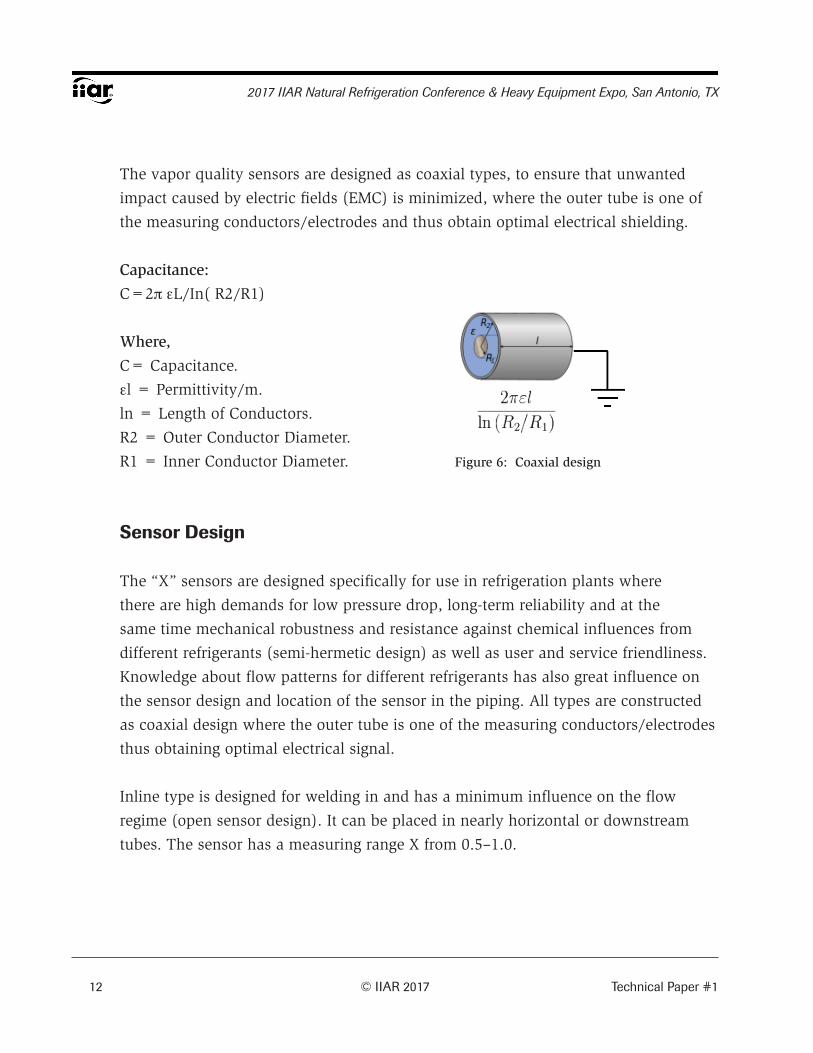
The vapor quality sensors are designed as coaxial types, to ensure that unwanted
impact caused by electric fields (EMC) is minimized, where the outer tube is one of
the measuring conductors/electrodes and thus obtain optimal electrical shielding.
Capacitance:
C=2π εL/In( R2/R1)
Where,
C= Capacitance.
εl = Permittivity/m.
ln = Length of Conductors.
R2 = Outer Conductor Diameter.
R1 = Inner Conductor Diameter. Figure 6: Coaxial design
Sensor Design
The “X” sensors are designed specifically for use in refrigeration plants where
there are high demands for low pressure drop, long-term reliability and at the
same time mechanical robustness and resistance against chemical influences from
different refrigerants (semi-hermetic design) as well as user and service friendliness.
Knowledge about flow patterns for different refrigerants has also great influence on
the sensor design and location of the sensor in the piping. All types are constructed
as coaxial design where the outer tube is one of the measuring conductors/electrodes
thus obtaining optimal electrical signal.
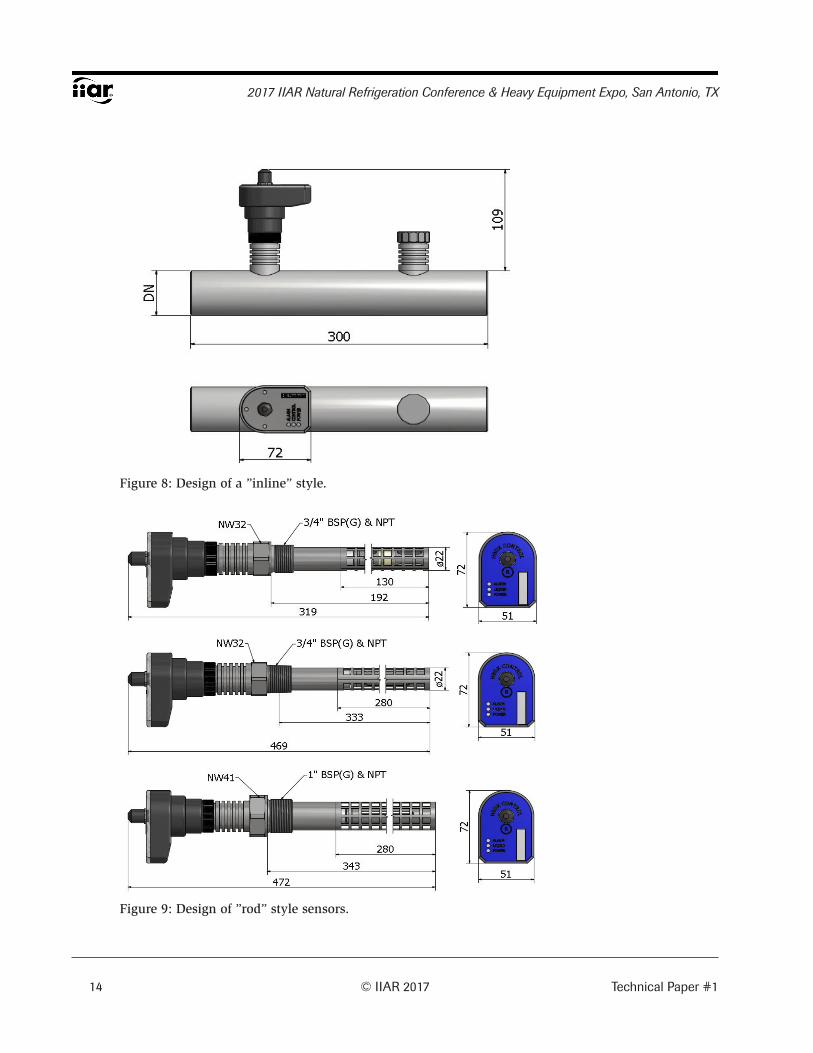
Inline type is designed for welding in and has a minimum influence on the flow
regime (open sensor design). It can be placed in nearly horizontal or downstream
tubes. The sensor has a measuring range X from 0.5–1.0.

Technical Paper #1 © IIAR 2017 13
New Refrigerant Quality Measurement and Demand Defrost Methods
Rod style type 1” in. is designed for screw mounting in the bottom of a bend or T
connection, of pipe sizes DN80 to DN300. The sensor manipulates and affects only a
part of the flow regime to obtain maximum signal. The sensor has a measuring range
X from 0.5–0.95 and is used primarily for overfeed control of circulation numbers on
pump circulation or flooded evaporators. It can also be used for riser optimization to
control and minimize the pressure drop in risers at varying loads.
Rod style ¾ in. is designed for screw mounting in the bottom of a bend or T
connection, of pipe sizes DN25 to DN200. The sensor manipulates and affects only
a part of the flow regime to obtain maximum signal, has a measuring range X from
0.6–1.0, and can be used for control of both DX evaporators and the circulation
numbers on pump/flooded systems.
General info:
• All types must be installed in piping with fall/slope of minimum 1 degree in flow
direction to ensure that there is no accumulation of refrigerant during standstill
and at low loads. It is not recommended using the sensor in upward oriented flow
because there is a risk that liquid flow will reverse under the influence of a low
gas flow, gravity and Vapor Quality, the measuring will be influenced and react
with a non-homogeneous signal pattern (slugging).
• In-line type sensors can be mounted freely; the influences from bends are minimal
and will not affect the measurement.
• Rod style types could, dependent upon plant design, be mounted in flow or
counter flow direction at a position where the sensor will be exposed and capture
the refrigerant. For optimal operation it should be mount at the bottom of a bend
and tube (all types of refrigerants).
14 © IIAR 2017 Technical Paper #1
2017 IIAR Natural Refrigeration Conference & Heavy Equipment Expo, San Antonio, TX
Figure 8: Design of a ”inline” style.
Figure 9: Design of ”rod” style sensors.
Technical Paper #1 © IIAR 2017 15
New Refrigerant Quality Measurement and Demand Defrost Methods
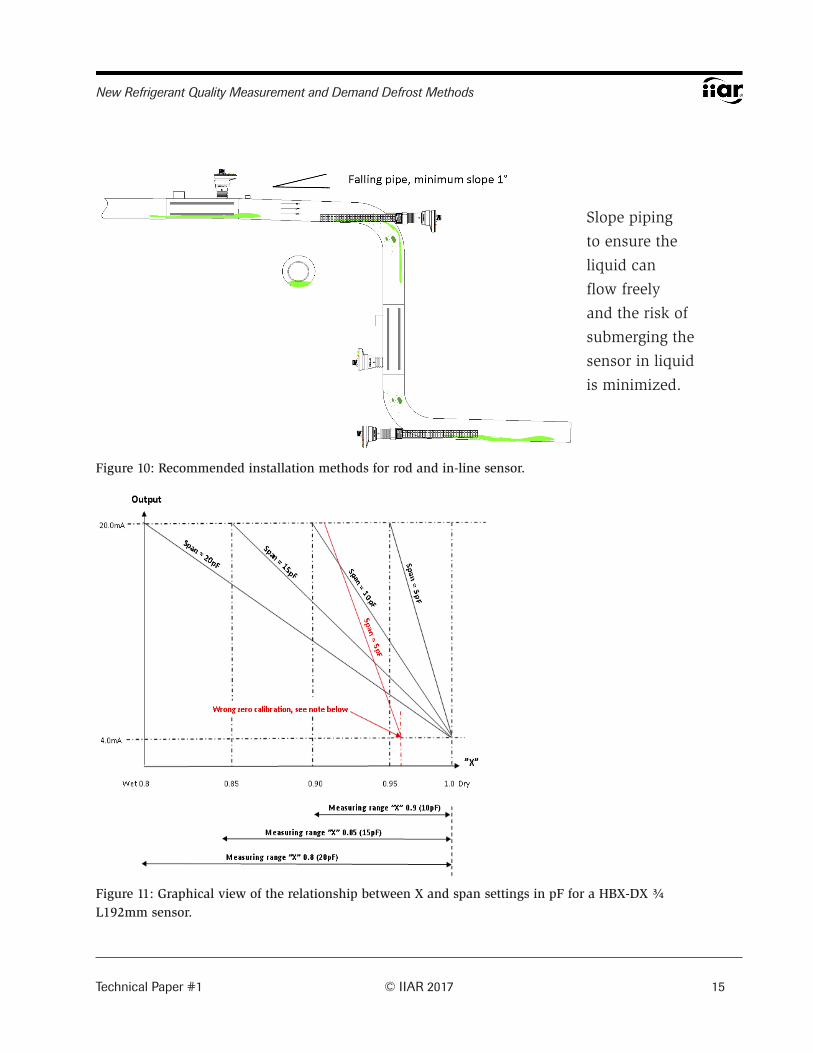
Figure 10: Recommended installation methods for rod and in-line sensor.
Figure 11: Graphical view of the relationship between X and span settings in pF for a HBX-DX ¾ L192mm sensor.
Slope piping
to ensure the
liquid can
flow freely
and the risk of
submerging the
sensor in liquid
is minimized.

16 © IIAR 2017 Technical Paper #1
2017 IIAR Natural Refrigeration Conference & Heavy Equipment Expo, San Antonio, TX
Laboratory Tests
Laboratory tests show that calibrating the sensor to react as an “X” sensor that
directly measures the degree of dryness where:
• “X”0.5 = 50% liquid
• “X”1.0 = dry vapor
The system used for laboratory testing is designed to establish a two-phase ammonia
flow where the vapour quality can be determined.
Figure 12: PI diagram for the Laboratory testing.

Technical Paper #1 © IIAR 2017 17
New Refrigerant Quality Measurement and Demand Defrost Methods
In the setup, the following data is logged for use in the data processing.
The test is conducted with the following sensors:
1. Gas volume flow [m3/s] Orifice acc. DIN1952 [-]
2. Gas temperature [°C] PT100 76755
3. Gas pressure [bar] Danfoss AKS33 8570
4. Liquid mass flow [kg/s] Danfoss Mass 2100 4772
5. Liquid temperature [°C] Danfoss Mass 2100 [-]
6. Liquid pressure [bar] Danfoss AKS33 [-]
7. Sensor inlet pressure [bar] Danfoss AKS33 8592
8. Sensor pressure drop [mbar] Yokogawa EJA110A 81835
The test system is adjusted to the desired test point and a steady state condition
is achieved. This condition is maintained for 10 minutes where the last five
minutes is used as data for the results. The data is collected in a lab view based
data acquisitioning system developed and maintained by the Danish Technological
Institute with a logging frequency of five seconds. Subsequently, the data is
processed in a calculation model in the Engineering Equation Solver. The signal
from the X sensor is a 4-20 mA signal, which is scalable to any desired range. Based
on the measured mA signal, the raw sensor signal has been calculated. During test,
the signal from the sensors has also been visually read via the X Tools software to
exclude subsequent calculation errors.
18 © IIAR 2017 Technical Paper #1
2017 IIAR Natural Refrigeration Conference & Heavy Equipment Expo, San Antonio, TX
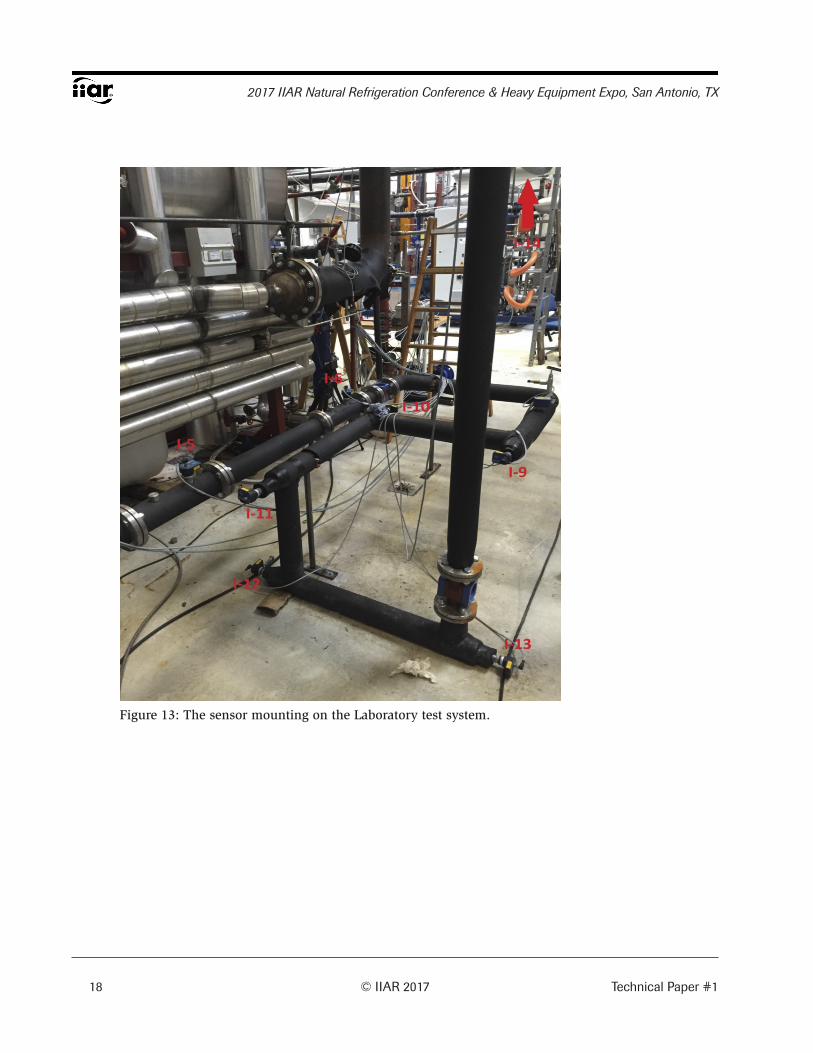
Figure 13: The sensor mounting on the Laboratory test system.
Technical Paper #1 © IIAR 2017 19
New Refrigerant Quality Measurement and Demand Defrost Methods
Low Charge Design
DX Operation:
A DX evaporator is designed for dry operation, where all the liquid is evaporated in
the evaporator. A controller and an expansion valve add refrigerant according to the
load to ensure dry gas exits at the evaporator outlet.
The desire to use the world’s most energy-efficient refrigerant, ammonia, in dry
expansion refrigeration systems has led to many challenges and has rightfully earned
the reputation of being a poor solution that does not always work well. There have
been many problems, and over time, many attempts have been made without any
significant breakthroughs. It was necessary to compromise from the normal DX
design and install liquid separators before the compressors and set superheating
very high in order to avoid liquid flood-back and potential compressor damage. High
superheating, and inefficient/non-dynamic evaporators combined with ammonia’s
high latent heat of vaporization have caused most of the challenges. Altogether, this
has led to very poor energy efficiency. It is also a fact that water in the ammonia
changes the boiling point and thus the superheat values calculated on the basis of
pressure and temperature; 1% water in the ammonia increases the boiling point
by around 5K towards the end of the evaporation process (Nelson, 2010). In DX
evaporators, the water concentration in the ammonia will increase as evaporation
progresses. Gradually this leads to an increase in boiling point, which conventional
superheat control will identify as a “false” superheat signal and react accordingly.
In addition, the water content in an ammonia refrigeration system will reduce the
system capacity and hence reduce coefficient of performance (COP).
Evaporator design: To ensure high efficiency and to obtain good heat transfer at
low differential temperature “ETD” (heat transfer rate) the heat exchangers should
be designed with sufficiently high vapor velocity to obtain and secure annular flow
where the entire internal surface of the tubes is exposed to boiling refrigerant. New
20 © IIAR 2017 Technical Paper #1
2017 IIAR Natural Refrigeration Conference & Heavy Equipment Expo, San Antonio, TX
evaporator designs with internal surface enhancement and special liquid distributors
optimize the entire system.
Experience gathered from four ammonia systems set up in Australia shows that the
systems with vapor quality measurement/control are more energy efficient and do
not result in pressure variations of the same magnitude as DX systems based on
superheat controlled refrigerant injection (Jensen, 2015).
Measuring Superheat: The reason why the vapor quality sensor measures liquid
when the superheat measurement indicates superheated vapor is due to facts that
non evaporated small liquid drops/mist is carried over by the vapor/gas flow in the
evaporator outlet. The liquid drops consist mostly of refrigerant, and can also contain
small amount of water and oil droplets. The sensor is very sensitive and reacts to
both refrigerant and water.
Cold store in Melbourne:
Freezing: 3 DX evaporators -31°C/-24°F evaporating temperature, unit refrigeration
capacity approx. 60kW, refrigerant operating charge of 1.42kg/3lb per evaporator.
Medium temperature: 1 DX evaporator’s -3°C/26.6°F evaporating temperature,
refrigeration capacity approx. 37W, refrigerant operating charge 2.5kg/5lb.
Ante room: 2 DX evaporators, evaporating temperature - 3°C/26.6°F, unit
refrigeration capacity approx. 58kW, refrigerant operating charge 4.4kg/9lb per
evaporator.
The main points regarding the implementation of the system in Melbourne are:
• Use of aluminium evaporators with patented tank distributors and internal surface
enhancement in low-temperature evaporators

Technical Paper #1 © IIAR 2017 21
New Refrigerant Quality Measurement and Demand Defrost Methods
• Use of piston compressors with very low oil carry-over (<3 ppm at the design
point – less at reduced rotational speed)
• Use of piston compressors arranged for air cooling
• Frequency converters on all compressors and fan motors
• The possibility of switching between superheat based refrigerant injection control
and gas quality based injection control
• Oversized evaporative condenser
• Use of internally smooth stainless steel pipes for all interconnecting refrigerant
pipe lines
• High-pressure float control between the condenser and the intercooler
• Return of the condensate formed during hot gas defrost directly to the intercooler,
using a high-pressure float and dedicated condensate return lines
• Two hot gas solenoid valves per cold store evaporator enabling warming of the
drain pan prior to defrosting the evaporator coil
• Desiccant dryer in the freezer, which distributes the dry air to the doors using air
distribution ducts
• Automatic evaporator fan speed control, optimised on the basis of the entering
temperature difference between the air and ammonia for the individual evaporator
• Possibility of regulating the cold store temperature directly using compressor
capacity modulation
• Evaporative condenser made entirely from stainless steel
• System refrigerant charge, 480 kg – low temperature capacity approx. 177kW,
high-temperature capacity approx. 140kW, total volume facility approx. 42,600
m³, estimated yearly specific energy consumption 21-23kWh/m³*a
The elimination of superheat measurement for evaporator control can be used
for reducing the temperature difference “ETD” between the ammonia and air
temperature (the plant in Melbourne measured “ETD” down to 2.5K) – especially
in case of partial load. This reduces the system energy consumption because the
compressors operate with the highest possible suction pressure in all operational
situations. It also minimizes the volume of the gas, thus the compressor works less

22 © IIAR 2017 Technical Paper #1
2017 IIAR Natural Refrigeration Conference & Heavy Equipment Expo, San Antonio, TX
and thereby uses less energy. Compared to HFC , it is possible to increase energy
efficiency by 40% with an ammonia DX system. Compared with a liquid overfeed
system, energy efficiency is increased by up to 25% with a low charge NH3 system
(depending on the system design) (Jensen, 2015) while the refrigerant inventory in
the evaporators is reduced by a factor 30 to 50 (Nelson, 2013).
Figure 14: Sensor mounted in the outlet of a DX Air-Cooler in Australia.
Figure 15: DX evaporator with “X” sensor and defrost on Demand Control system.

Technical Paper #1 © IIAR 2017 23
New Refrigerant Quality Measurement and Demand Defrost Methods
Figure 16: Graph of a DX controlled air-cooler/evaporator.
Elimination of Wet Return Lines in Ammonia Systems
Using a vapor quality sensor enables optimization of the most important key
elements in a refrigeration system:
Control and elimination of wet suction lines in ammonia systems is now possible.
The challenges associated with risers and wet return lines/piping in industrial
refrigeration systems can be addressed by measuring and controlling the amount of
refrigerant supplied to the evaporator.

24 © IIAR 2017 Technical Paper #1
2017 IIAR Natural Refrigeration Conference & Heavy Equipment Expo, San Antonio, TX
In low-temperature ammonia systems the pressure loss in the return line to the
compressor is significant for the capacity of the compressor and the efficiency of the
system. The design of the return line whether wet or dry will have to be carried out
to give a minimum pressure loss.
Theory: 0.1 bar pressure loss in the suction line corresponds to 2°C at evaporating
temperature -35°C/-31°F 2°C improvement on the suction temperature gives a COP
improvement of app. 8% for a one stage ammonia compressor.
The solution to the vertical two-phase flow problem is referred to as a "riser" and it is
quite well known, but often executed incorrectly. To ensure liquid transport upwards,
the velocity must be high enough for the liquid to be transported through shear
forces on the gas/liquid surface. When the velocity is sufficiently high, the liquid will
flow on the inside surface of the pipe and the gas will flow in the center of the pipe
named in a pattern termed “annular flow”. Failing to obtain the correct flow pattern
can result in a number of different situations, but all are a result of too large vertical
piping. All situations involve penalties as pressure loss. Usually, the vertical pipe is
almost completely filled with liquid. The gas will bubble through it, either as small
bubbles or as larger plugs. In any case, there is a static pressure difference between
the top and bottom of the vertical pipe that imparts a pressure/temperature penalty
on the evaporator, reducing its capacity, or on the compressor, lowering its suction
pressure - or a combination of both. Another scenario is liquid collecting in a low
part of the piping until its volume has increased the gas velocity to a point where the
liquid is shot to the top of the vertical piping. Naturally, that involves a very unsteady
operation of the plant and should also be avoided.
A satisfactory design of a riser involves checking all running conditions of the
system. Especially partial load needs to be considered as gas flow is proportional to
the load and therefore the gas flow is lowest at partial load. At the same time, the
pressure loss at full load needs to be within acceptable limits to avoid the dynamic
penalty. In some applications (such as a batch freezing process) the load approaches

Technical Paper #1 © IIAR 2017 25
New Refrigerant Quality Measurement and Demand Defrost Methods
zero at the end of the freezing cycle. A riser designed for this very small load will
have an unacceptably high pressure loss at the beginning of the freezing cycle and
will most likely make a satisfactory freezing performance impossible. It`s difficult
to design a riser which may work well for the duration of the freezing process. If
dimensioned to function optimal for low load operation pressure drop at full load will
be extremely large, conversely, a riser which is dimensioned to function optimally at
full load will have problems to operate under partial load, practice is to design a riser
so it works well down to 50% loads. Another solution for a batch process is to have
a double riser which has a large riser for the start-up process with high evaporating
temperatures and a smaller riser for operation at low temperatures.
Source: Facts from the project ”High-efficiency systems for energy reduction in
industrial refrigeration plants with ammonia” ( Moensted, 2010).
By measuring the “X” vapor quality and using the signal to control and regulate
the refrigerant feed to the freezer/ evaporator and simultaneously measure the flow
pattern depending on the load, it will be possible to optimize the riser function and
ensure minimal pressure loss.
A riser system with an “X” Sensor is illustrated in Figure 17.
26 © IIAR 2017 Technical Paper #1
2017 IIAR Natural Refrigeration Conference & Heavy Equipment Expo, San Antonio, TX
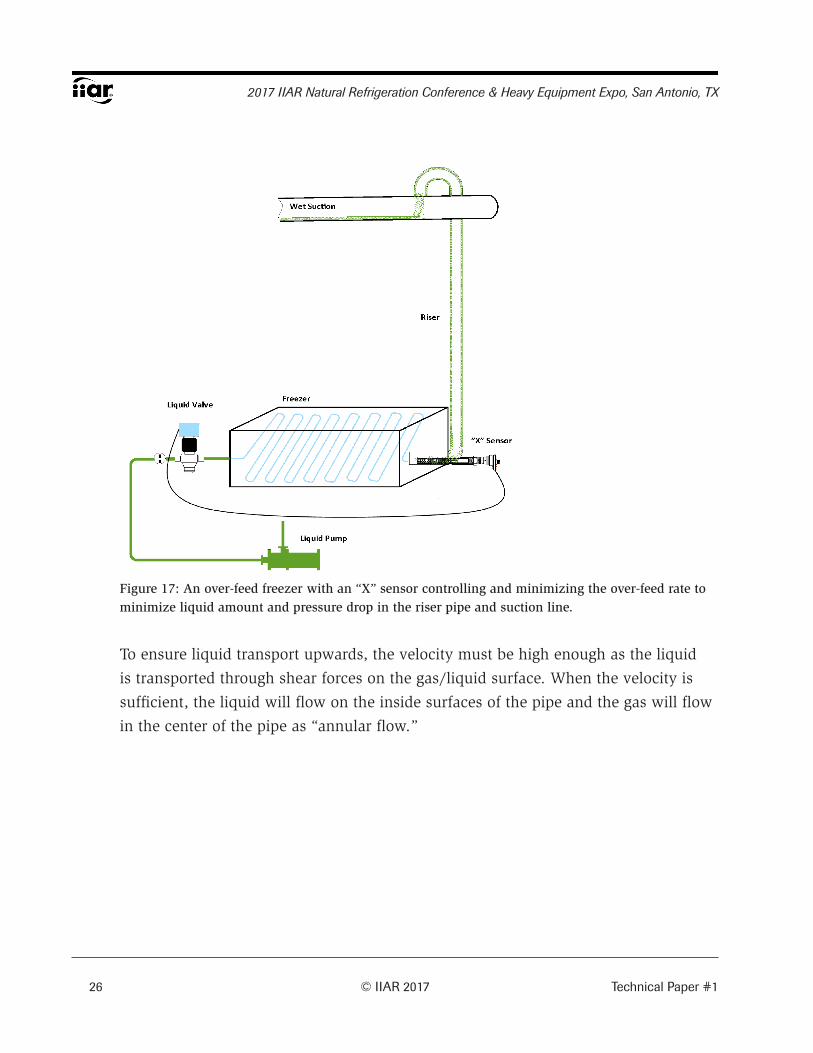
Figure 17: An over-feed freezer with an “X” sensor controlling and minimizing the over-feed rate to minimize liquid amount and pressure drop in the riser pipe and suction line.
To ensure liquid transport upwards, the velocity must be high enough as the liquid
is transported through shear forces on the gas/liquid surface. When the velocity is
sufficient, the liquid will flow on the inside surfaces of the pipe and the gas will flow
in the center of the pipe as “annular flow.”
Technical Paper #1 © IIAR 2017 27
New Refrigerant Quality Measurement and Demand Defrost Methods
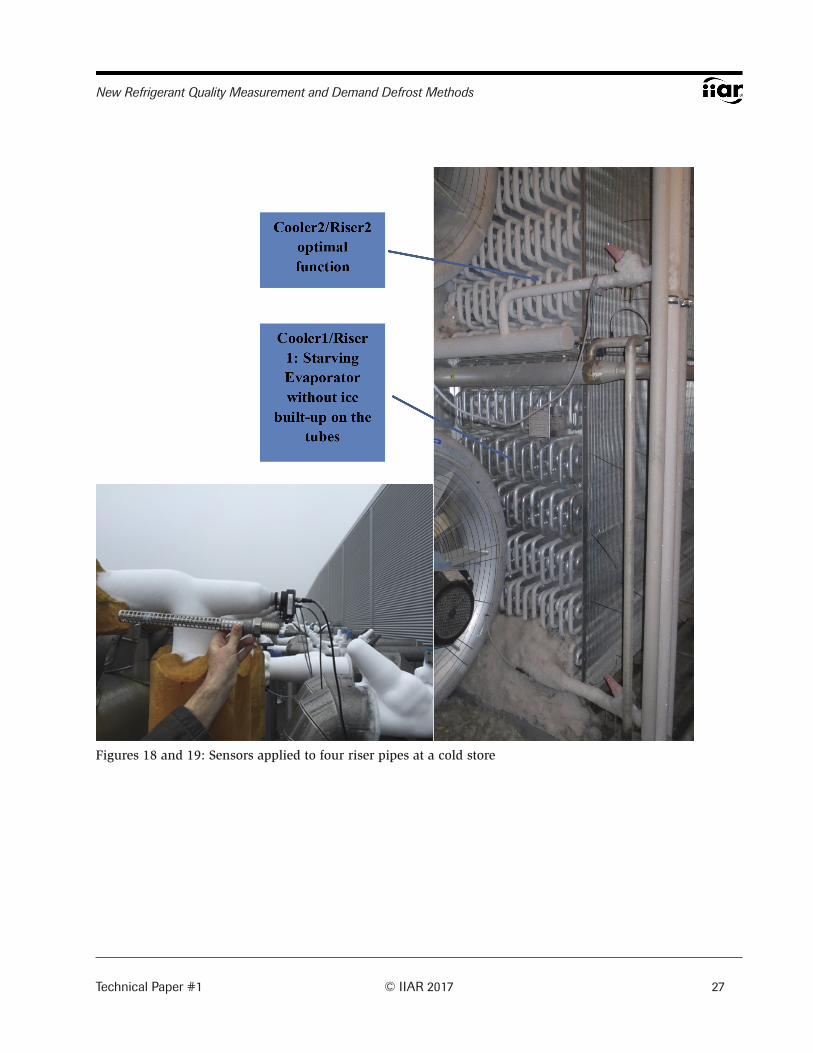
Figures 18 and 19: Sensors applied to four riser pipes at a cold store
.
28 © IIAR 2017 Technical Paper #1
2017 IIAR Natural Refrigeration Conference & Heavy Equipment Expo, San Antonio, TX
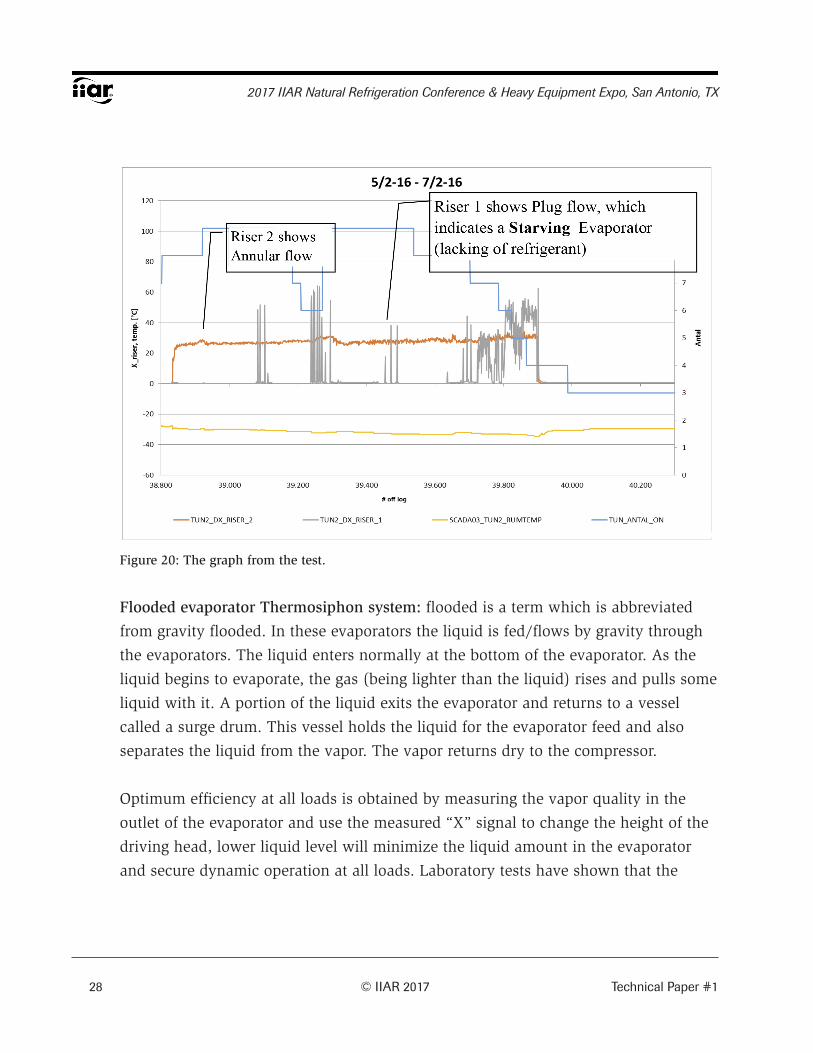
Figure 20: The graph from the test.
Flooded evaporator Thermosiphon system: flooded is a term which is abbreviated
from gravity flooded. In these evaporators the liquid is fed/flows by gravity through
the evaporators. The liquid enters normally at the bottom of the evaporator. As the
liquid begins to evaporate, the gas (being lighter than the liquid) rises and pulls some
liquid with it. A portion of the liquid exits the evaporator and returns to a vessel
called a surge drum. This vessel holds the liquid for the evaporator feed and also
separates the liquid from the vapor. The vapor returns dry to the compressor.
Optimum efficiency at all loads is obtained by measuring the vapor quality in the
outlet of the evaporator and use the measured “X” signal to change the height of the
driving head, lower liquid level will minimize the liquid amount in the evaporator
and secure dynamic operation at all loads. Laboratory tests have shown that the
Technical Paper #1 © IIAR 2017 29
New Refrigerant Quality Measurement and Demand Defrost Methods
highest possible evaporator temperature is obtained with an “X” value from 0.7 to
0.85 (Circulation rate 1.2 to 1.4) (Christensen, 2016).
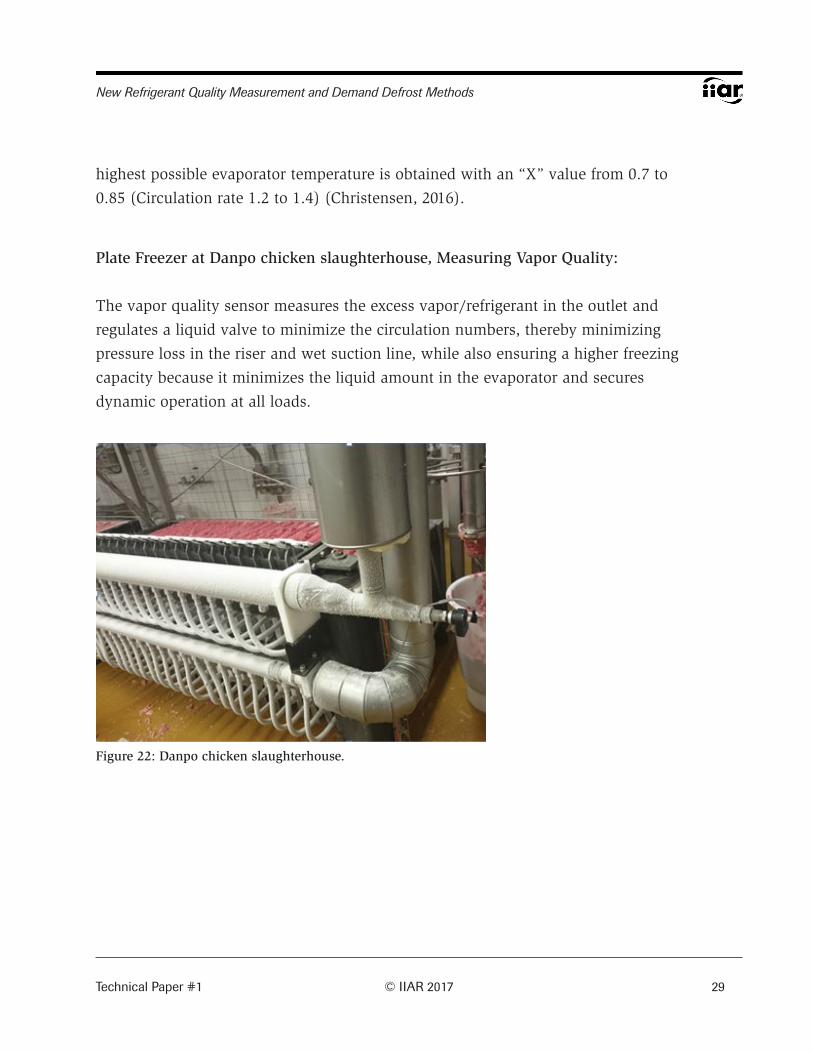
Plate Freezer at Danpo chicken slaughterhouse, Measuring Vapor Quality:
The vapor quality sensor measures the excess vapor/refrigerant in the outlet and
regulates a liquid valve to minimize the circulation numbers, thereby minimizing
pressure loss in the riser and wet suction line, while also ensuring a higher freezing
capacity because it minimizes the liquid amount in the evaporator and secures
dynamic operation at all loads.
Figure 22: Danpo chicken slaughterhouse.

30 © IIAR 2017 Technical Paper #1
2017 IIAR Natural Refrigeration Conference & Heavy Equipment Expo, San Antonio, TX
Figure 23: Graph from the Plate Freezer in a chicken slaughterhouse, measuring Vapor Quality(green) without control and meat temperature (purple).
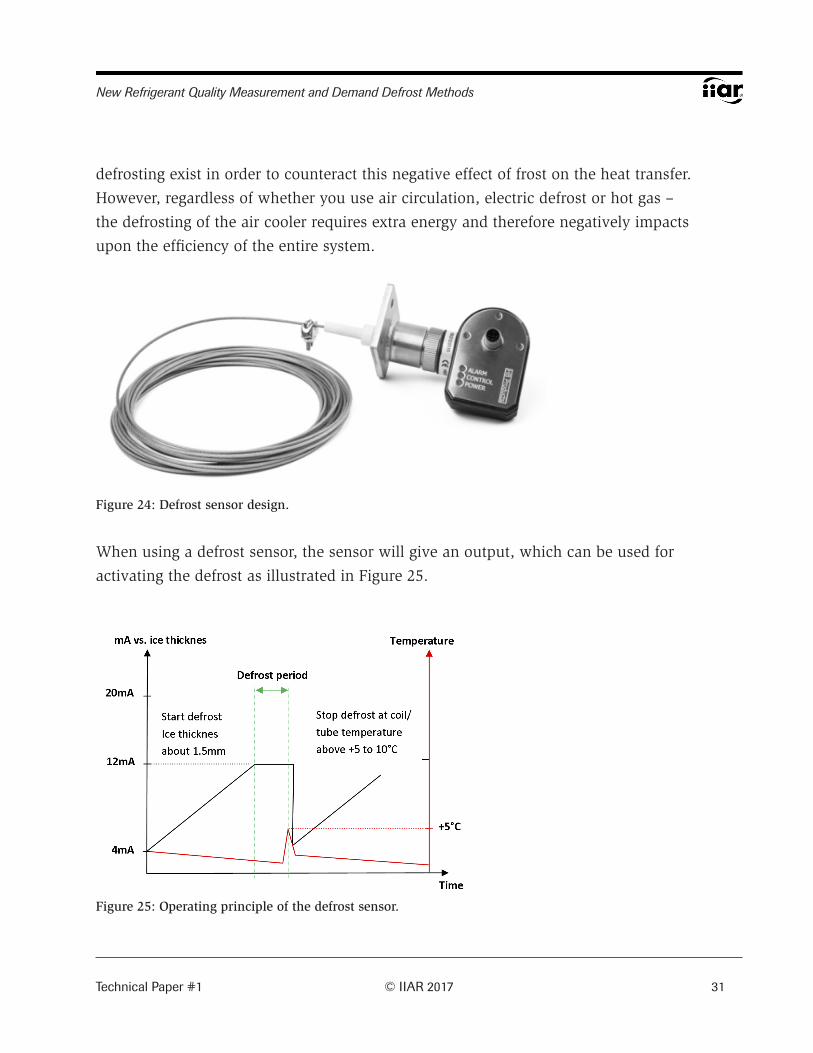
Sensor design for measuring frost/ice thickness:
The sensor is based on the capacitive measuring principle in which an insulated steel
wire acts as one of the conductors/electrodes, and the evaporator fins and tubes act
as the second conductor. Change of the measured signal occurs when ice is build-
up between the fins. The ice thickness has an impact on the measurement and can
therefore be used for starting the defrost process. The basic problem is not new. In
most applications employing air coolers that operate at evaporation temperatures
below 0°C/32F there is a risk of frost formation on the air coolers surfaces. As a
result of the frost, heat transfer is reduced, resulting in a decrease of the air cooler’s
efficiency. The build-up of frost is caused by the dehumidification in the refrigerated
room. When the air cooler draws the moisture from the air and the goods stored
in the room, this moisture in turn settles as frost on the outer surface of the air
cooler. How quickly the frost builds up depends on several different factors: The
stored goods, the level of humidity, the frequency of entries as well as the general
humidity in the surrounding air at the respective location. Different methods of
Technical Paper #1 © IIAR 2017 31
New Refrigerant Quality Measurement and Demand Defrost Methods
defrosting exist in order to counteract this negative effect of frost on the heat transfer.
However, regardless of whether you use air circulation, electric defrost or hot gas –
the defrosting of the air cooler requires extra energy and therefore negatively impacts
upon the efficiency of the entire system.
Figure 24: Defrost sensor design.
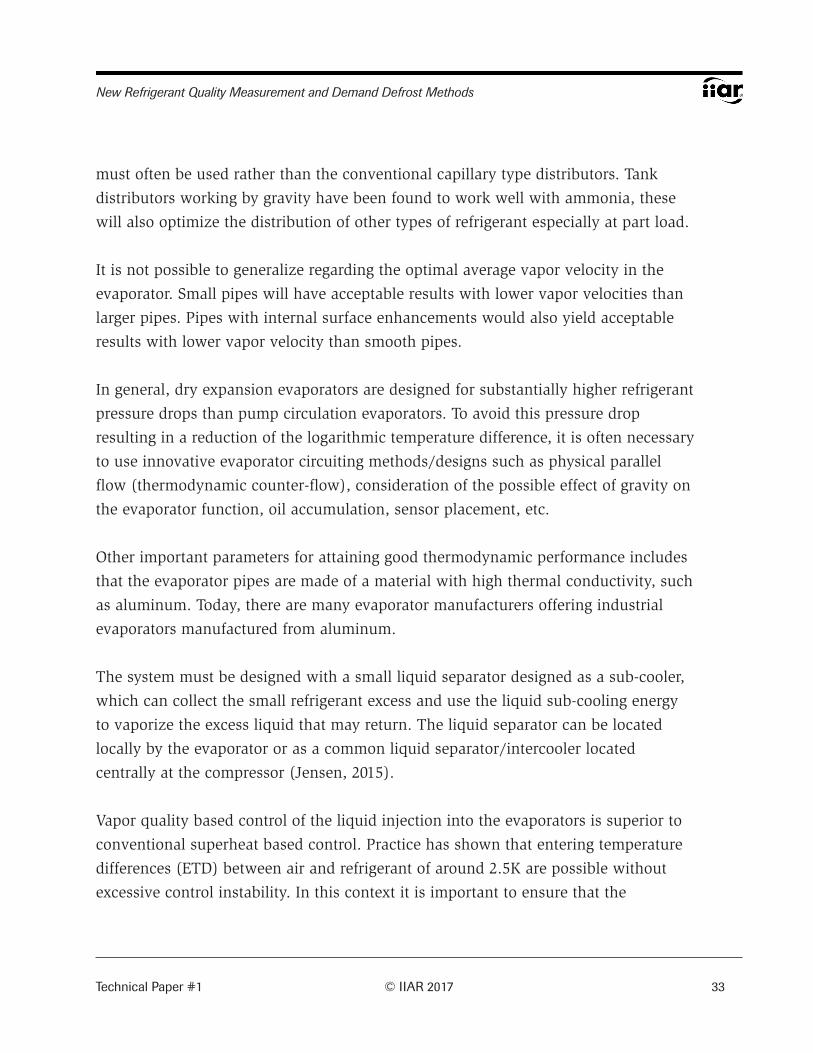
When using a defrost sensor, the sensor will give an output, which can be used for
activating the defrost as illustrated in Figure 25.
Figure 25: Operating principle of the defrost sensor.

32 © IIAR 2017 Technical Paper #1
2017 IIAR Natural Refrigeration Conference & Heavy Equipment Expo, San Antonio, TX
The defrost sensor can be mounted on the evaporator as illustrated in Figure 26.
Figure 26: Shows the defrost sensor mounted on an air cooler.
Summary
Summary on system design: In general, dry-expansion evaporator design requires
that users are perfectly aware of the capacity range within which the evaporator will
be used. These considerations are also important for evaporators that are installed
for pump re-circulation, but the consequences of an incorrect number of channels
are easier to compensate for in a pump re-circulation system than in a dry expansion
system with limited refrigerant charge.
In a dry expansion system (especially using ammonia as the refrigerant) the choice of
evaporator tube diameter is often of great importance. The distribution of refrigerant
can also result in difficulties simply because flashing of the refrigerant will cause a
two-phase flow in the distributor system. In these situations other distributor types
Technical Paper #1 © IIAR 2017 33
New Refrigerant Quality Measurement and Demand Defrost Methods
must often be used rather than the conventional capillary type distributors. Tank
distributors working by gravity have been found to work well with ammonia, these
will also optimize the distribution of other types of refrigerant especially at part load.
It is not possible to generalize regarding the optimal average vapor velocity in the
evaporator. Small pipes will have acceptable results with lower vapor velocities than
larger pipes. Pipes with internal surface enhancements would also yield acceptable
results with lower vapor velocity than smooth pipes.
In general, dry expansion evaporators are designed for substantially higher refrigerant
pressure drops than pump circulation evaporators. To avoid this pressure drop
resulting in a reduction of the logarithmic temperature difference, it is often necessary
to use innovative evaporator circuiting methods/designs such as physical parallel
flow (thermodynamic counter-flow), consideration of the possible effect of gravity on
the evaporator function, oil accumulation, sensor placement, etc.
Other important parameters for attaining good thermodynamic performance includes
that the evaporator pipes are made of a material with high thermal conductivity, such
as aluminum. Today, there are many evaporator manufacturers offering industrial
evaporators manufactured from aluminum.
The system must be designed with a small liquid separator designed as a sub-cooler,
which can collect the small refrigerant excess and use the liquid sub-cooling energy
to vaporize the excess liquid that may return. The liquid separator can be located
locally by the evaporator or as a common liquid separator/intercooler located
centrally at the compressor (Jensen, 2015).
Vapor quality based control of the liquid injection into the evaporators is superior to
conventional superheat based control. Practice has shown that entering temperature
differences (ETD) between air and refrigerant of around 2.5K are possible without
excessive control instability. In this context it is important to ensure that the

34 © IIAR 2017 Technical Paper #1
2017 IIAR Natural Refrigeration Conference & Heavy Equipment Expo, San Antonio, TX
possibility of liquid hold-up in the evaporator is minimized. The estimated impact on
energy efficiency in percentage is a range from about 5% to 15%.
Vapor quality based control also impacts on the system and responds with very small
pressure variations in the suction line compared to superheat control. While sensor
functions are not sensitive to the water content in the ammonia refrigerant, boiling
point will still be affected, but the sensor reacts on both moisture and refrigerant and
ensures proper operation.
The refrigerant charge in an evaporator is a function of internal volume, circuit
loading, and feed method. Use of low overfeed evaporators will reduce pressure drop
in all portions of wet suction piping. This reduction in pressure drop will significantly
reduce the work required at the compressor over the lifespan of the facility, resulting
in electricity savings and lower overhead costs.
Additionally, internally enhanced tubes allow the use of top-fed evaporators for a
significant operating charge reduction and surge volume decrease. The second item
of note is the surge volume requirement of the re-circulators. When an evaporator
operates at part load, at a low TD, the amount of ballast liquid increases because
significantly less vapor volume is present to displace the liquid and less velocity
is available to sweep it from the tubes. This charge fluctuation from 100% design
load down to a part load condition must be accounted for in the re-circulator vessel
design. For smooth, trouble free system operation, the internal volume of the re-
circulator vessel must be great enough to accommodate this ballast liquid as it leaves
the evaporators when they are loaded up. At the same time, enough vapor separation
space must remain in the vessel to prevent liquid carryover (Welch, 2016).
Technical Paper #1 © IIAR 2017 35
New Refrigerant Quality Measurement and Demand Defrost Methods
References
Christensen, R. (2016) “CC_2016_02_Alfa_Laval_U_turn_and_Ammonia_heat_pump_
Optimisation” Refrigeration Seminar Helsinki 2016.
De Kerpel, Kathleen (2014-2015). “Refrigerant Two-Phase Flow Behaviour and
Pressure Drop” Ghent University, Belgium.
Jensen S.S. 2015, Operating Experiences with NH3 Dry Expansion Systems Servicing
Refrigerated Distribution Centres, Proceedings 2015 IIAR Ammonia Refrigeration
Conference and Exhibition, San Diego, California.
Jensen S.S. 2015, Recent Advances in Ammonia Dry Expansion Applications.
Proceedings 2015 International Congress of Refrigeration, August 16-22, Yokohama,
Japan.
Moensted, A. (2010). “High-efficiency systems for energy reduction in industrial
refrigeration plants with ammonia.” Danish Technological Institute, Elforsk Non riser
project, PSO PROJECT NUMBER: 340-010.
Nelson B, 2010. “Thermodynamic Effects of Water in Ammonia on Evaporator
Performance”. Proceedings 2010 IIAR Ammonia Refrigeration Conference and
Exhibition, San Diego, California.
Nelson, B. 2016. “DX AMMONIA PIPING HANDBOOK 3RD EDITION, REV A. Colmac
Coil.
Welch, J. 2016. “Low recirculation rate evaporators.” Welch Engineering, 2016 IIAR
Industrial Refrigeration Conference & Exhibition, Orlando, FL

36 © IIAR 2017 Technical Paper #1
2017 IIAR Natural Refrigeration Conference & Heavy Equipment Expo, San Antonio, TX
Appendix A: Sample Test Results
Figure 27 shows all tested HBX- DX/OVC sensors plotted as a function of the output
signal from the sensor in mA. The signal output ranges from 4–20mA, and the quality
ranges from 0.5 to as close to 1 as possible. The plot covers -30 °C/-22 °F ammonia
with a gas velocity of 24.5 m/s.
Figure 27: The graph from the laboratory test.
Sensor I-5 is a 2 in. in-line sensor mounted in vertical piping. The graph for I-5 lines
up closely to the graphs for sensors I-9 and I-11. These two sensors are both ¾ in.
rod style sensors and are mounted counter current in vertical piping, which gives
them a similar liquid flow into the sensor as with the in-line sensor.

Technical Paper #1 © IIAR 2017 37
New Refrigerant Quality Measurement and Demand Defrost Methods
Sensor I-6 is also a 2 in. in-line sensor but the output signal from this sensor is larger
than from sensor I-5. This is due to so-called splash rings added to this sensor as an
improvement to strengthen the output signal. The splash rings cause the liquid to
splash up in the sensor, thus strengthening the output signal.
Sensor I-10 is a rod style ¾ in. sensor mounted co-current. This sensor gives in this
case the highest output signal. The high output signal could appear because of liquid
accumulation in the elbow pipe where the sensor is mounted.
Sensors I-12 and I-13 are both rod style 1 in. sensors respectively mounted co-current
and counter current in a p-trap just before the riser. Naturally, liquid accumulation
will occur in the p-trap, which gives the sensors a medium-high signal. Sensor I-13
gives the highest signal of the two because it is mounted just at the bottom of the
riser. I-12 is mounted in the beginning of the p-trap.
Sensor I-14 is a 1 in. rod style sensor mounted co-current in the top of the riser.
The sensor output signal aligns closely with the output signal of I-12, although the
sensors are mounted in two very different places. They do have in common that they
are 1 in. sensors and mounted co-current.
The plot shows that the mounting of the sensor has a large influence on the
measurements.
All graphs in the plot are more or less linear in the range of quality 0.6–1, which
makes it possible to read the quality. For sensor I-10 the measurement stands out at a
quality of 0.7.
The tests show that the temperature of the two-phase flow does not have a significant
influence on the measurements. On the contrary, the velocity is of great importance,
especially at low velocities.

Notes:
38 © IIAR 2017 Technical Paper #1
2017 IIAR Natural Refrigeration Conference & Heavy Equipment Expo, San Antonio, TX