Embed Size (px)
Citation preview
world Trade reporT 2010
240
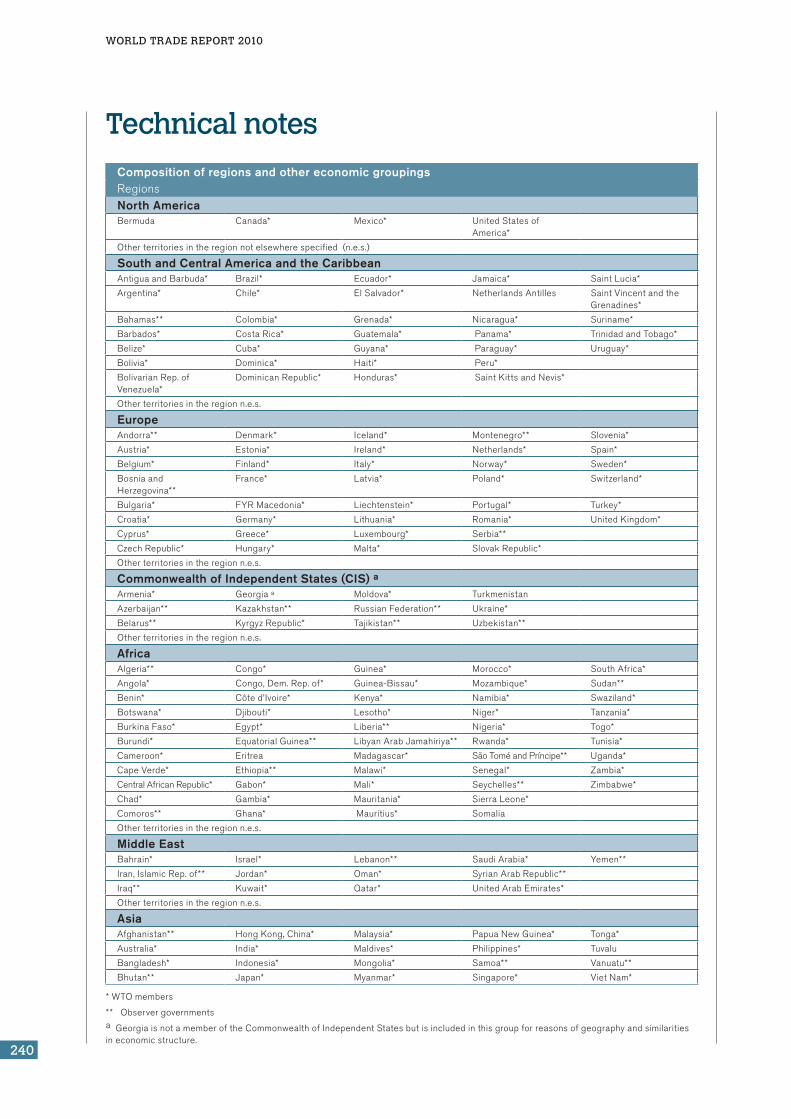
Technical notescomposition of regions and other economic groupingsRegionsnorth America Bermuda Canada* Mexico* UnitedStatesof
America*
Otherterritoriesintheregionnotelsewherespecified(n.e.s.)
south and central America and the caribbean AntiguaandBarbuda* Brazil* Ecuador* Jamaica* SaintLucia*
Argentina* Chile* ElSalvador* NetherlandsAntilles SaintVincentandtheGrenadines*
Bahamas** Colombia* Grenada* Nicaragua* Suriname*
Barbados* CostaRica* Guatemala* Panama* TrinidadandTobago*
Belize* Cuba* Guyana* Paraguay* Uruguay*
Bolivia* Dominica* Haiti* Peru*
BolivarianRep.ofVenezuela*
DominicanRepublic* Honduras* SaintKittsandNevis*
Otherterritoriesintheregionn.e.s.
europe Andorra** Denmark* Iceland* Montenegro** Slovenia*
Austria* Estonia* Ireland* Netherlands* Spain*
Belgium* Finland* Italy* Norway* Sweden*
BosniaandHerzegovina**
France* Latvia* Poland* Switzerland*
Bulgaria* FYRMacedonia* Liechtenstein* Portugal* Turkey*
Croatia* Germany* Lithuania* Romania* UnitedKingdom*
Cyprus* Greece* Luxembourg* Serbia**
CzechRepublic* Hungary* Malta* SlovakRepublic*
Otherterritoriesintheregionn.e.s.
commonwealth of Independent states (cIs) a Armenia* Georgiaa Moldova* Turkmenistan
Azerbaijan** Kazakhstan** RussianFederation** Ukraine*
Belarus** KyrgyzRepublic* Tajikistan** Uzbekistan**
Otherterritoriesintheregionn.e.s.
Africa
Algeria** Congo* Guinea* Morocco* SouthAfrica*
Angola* Congo,Dem.Rep.of* Guinea-Bissau* Mozambique* Sudan**
Benin* Côted’Ivoire* Kenya* Namibia* Swaziland*
Botswana* Djibouti* Lesotho* Niger* Tanzania*
BurkinaFaso* Egypt* Liberia** Nigeria* Togo*
Burundi* EquatorialGuinea** LibyanArabJamahiriya** Rwanda* Tunisia*
Cameroon* Eritrea Madagascar* SãoToméandPríncipe** Uganda*
CapeVerde* Ethiopia** Malawi* Senegal* Zambia*
CentralAfricanRepublic* Gabon* Mali* Seychelles** Zimbabwe*
Chad* Gambia* Mauritania* SierraLeone*
Comoros** Ghana* Mauritius* Somalia
Otherterritoriesintheregionn.e.s.
middle east Bahrain* Israel* Lebanon** SaudiArabia* Yemen**
Iran,IslamicRep.of** Jordan* Oman* SyrianArabRepublic**
Iraq** Kuwait* Qatar* UnitedArabEmirates*
Otherterritoriesintheregionn.e.s.
Asia Afghanistan** HongKong,China* Malaysia* PapuaNewGuinea* Tonga*
Australia* India* Maldives* Philippines* Tuvalu
Bangladesh* Indonesia* Mongolia* Samoa** Vanuatu**
Bhutan** Japan* Myanmar* Singapore* VietNam*
*WTOmembers
**ObservergovernmentsaGeorgiaisnotamemberoftheCommonwealthofIndependentStatesbutisincludedinthisgroupforreasonsofgeographyandsimilaritiesineconomicstructure.

tecHnIcAL notes
241
composition of regions and other economic groupings (cont’d)RegionsAsia(cont’d)BruneiDarussalam* Kiribati Nepal* SolomonIslands*
Cambodia* Korea,Republicof* NewZealand* SriLanka*
China* LaoPeople’sDem.Rep.** Pakistan* Taipei,Chinese*
Fiji* Macao,China* Palau Thailand*
Otherterritoriesintheregionn.e.s.
OtherGroupsAcP (African, caribbean and Pacific countries) Angola Côted’Ivoire Haiti Niger SouthAfrica
AntiguaandBarbuda Cuba Jamaica Nigeria Sudan
Bahamas Djibouti Kenya Niue Suriname
Barbados Dominica Kiribati Palau Swaziland
Belize DominicanRepublic Lesotho PapuaNewGuinea TimorLeste
Benin EquatorialGuinea Liberia Rwanda Togo
Botswana Eritrea Madagascar SaintKittsandNevis Tonga
BurkinaFaso Ethiopia Malawi SaintLucia TrinidadandTobago
Burundi Fiji Mali SaintVincentandtheGrenadines
Tuvalu
Cameroon Gabon MarshallIslands Samoa Uganda
CentralAfricanRepublic
Gambia Mauritania SãoToméandPríncipe UnitedRepublicofTanzania
Chad Ghana Mauritius Senegal Vanuatu
Comoros Grenada Micronesia Seychelles Zambia
Congo Guinea Mozambique SierraLeone Zimbabwe
Congo,Dem.Rep.of Guinea-Bissau Namibia SolomonIslands
CookIslands Guyana Nauru Somalia
Africa North Africa
Algeria Egypt LibyanArabJamahiriya Morocco Tunisia
Sub-Saharan Africa
Western Africa
Benin Gambia Guinea-Bissau Mauritania Senegal
BurkinaFaso Ghana Liberia Niger SierraLeone
CapeVerde Guinea Mali Nigeria Togo
Côted’Ivoire
Central Africa
Burundi CentralAfricanRepublic Congo EquatorialGuinea Rwanda
Cameroon Chad Congo,Dem.Rep.of Gabon SãoToméandPríncipe
Eastern Africa
Comoros Ethiopia Mauritius Somalia Tanzania
Djibouti Kenya Seychelles Sudan Uganda
Eritrea Madagascar
Southern Africa
Angola Lesotho Mozambique SouthAfrica Zambia
Botswana Malawi Namibia Swaziland Zimbabwe
TerritoriesinAfricanotelsewherespecified
Asia East Asia (including Oceania):
Australia Indonesia Malaysia Samoa Tuvalu
BruneiDarussalam Japan Mongolia Singapore Vanuatu
Cambodia Kiribati Myanmar SolomonIslands VietNam
China Korea,Rep.of NewZealand Taipei,Chinese
Fiji LaoPeople’sDem.Rep. PapuaNewGuinea Thailand
HongKong,China Macao,China Philippines Tonga
West Asia:
Afghanistan Bhutan Maldives Pakistan SriLanka
Bangladesh India Nepal
OthercountriesandterritoriesinAsiaandthePacificnotelsewherespecified
*WTOmembers
world Trade reporT 2010
242
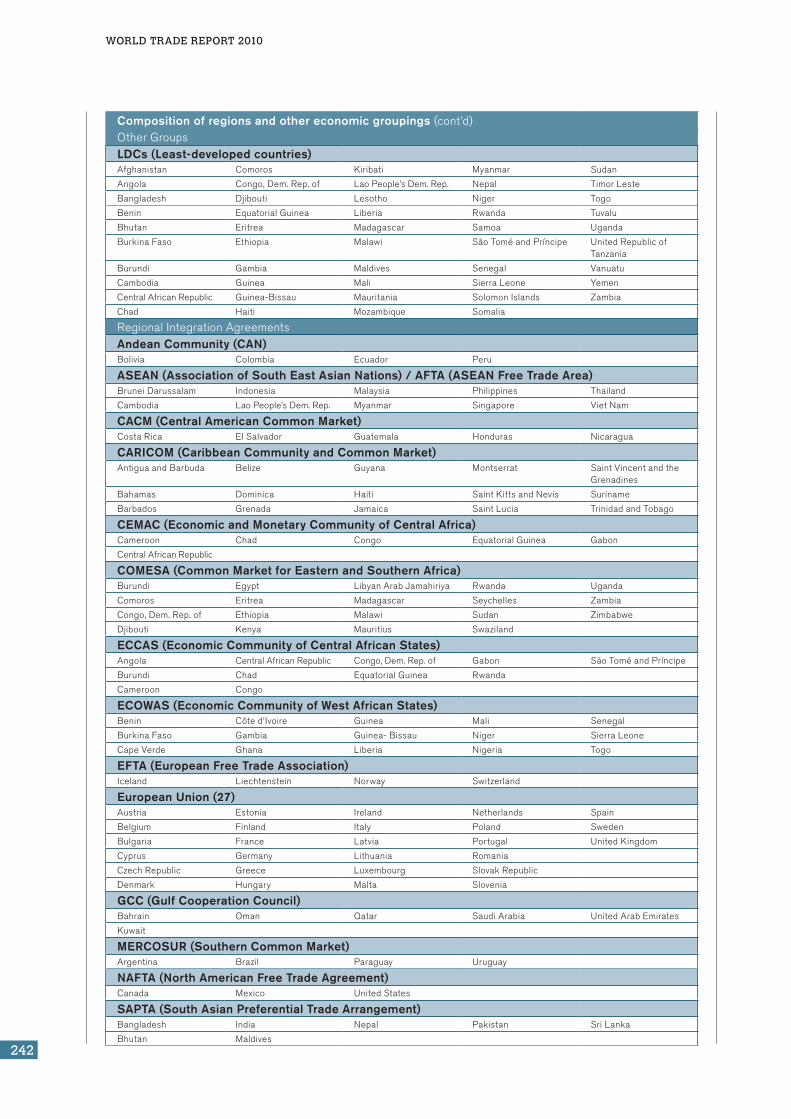
composition of regions and other economic groupings (cont’d)OtherGroupsLDcs (Least-developed countries) Afghanistan Comoros Kiribati Myanmar Sudan
Angola Congo,Dem.Rep.of LaoPeople’sDem.Rep. Nepal TimorLeste
Bangladesh Djibouti Lesotho Niger Togo
Benin EquatorialGuinea Liberia Rwanda Tuvalu
Bhutan Eritrea Madagascar Samoa Uganda
BurkinaFaso Ethiopia Malawi SãoToméandPríncipe UnitedRepublicofTanzania
Burundi Gambia Maldives Senegal Vanuatu
Cambodia Guinea Mali SierraLeone Yemen
CentralAfricanRepublic Guinea-Bissau Mauritania SolomonIslands Zambia
Chad Haiti Mozambique Somalia
RegionalIntegrationAgreementsAndean community (cAn) Bolivia Colombia Ecuador Peru
AseAn (Association of south east Asian nations) / AFtA (AseAn Free trade Area) BruneiDarussalam Indonesia Malaysia Philippines Thailand
Cambodia LaoPeople’sDem.Rep. Myanmar Singapore VietNam
cAcm (central American common market) CostaRica ElSalvador Guatemala Honduras Nicaragua
cARIcom (caribbean community and common market) AntiguaandBarbuda Belize Guyana Montserrat SaintVincentandthe
Grenadines
Bahamas Dominica Haiti SaintKittsandNevis Suriname
Barbados Grenada Jamaica SaintLucia TrinidadandTobago
cemAc (economic and monetary community of central Africa) Cameroon Chad Congo EquatorialGuinea Gabon
CentralAfricanRepublic
comesA (common market for eastern and southern Africa) Burundi Egypt LibyanArabJamahiriya Rwanda Uganda
Comoros Eritrea Madagascar Seychelles Zambia
Congo,Dem.Rep.of Ethiopia Malawi Sudan Zimbabwe
Djibouti Kenya Mauritius Swaziland
eccAs (economic community of central African states) Angola CentralAfricanRepublic Congo,Dem.Rep.of Gabon SãoToméandPríncipe
Burundi Chad EquatorialGuinea Rwanda
Cameroon Congo
ecoWAs (economic community of West African states) Benin Côted’Ivoire Guinea Mali Senegal
BurkinaFaso Gambia Guinea-Bissau Niger SierraLeone
CapeVerde Ghana Liberia Nigeria Togo
eFtA (european Free trade Association) Iceland Liechtenstein Norway Switzerland
european union (27) Austria Estonia Ireland Netherlands Spain
Belgium Finland Italy Poland Sweden
Bulgaria France Latvia Portugal UnitedKingdom
Cyprus Germany Lithuania Romania
CzechRepublic Greece Luxembourg SlovakRepublic
Denmark Hungary Malta Slovenia
Gcc (Gulf cooperation council) Bahrain Oman Qatar SaudiArabia UnitedArabEmirates
Kuwait
meRcosuR (southern common market) Argentina Brazil Paraguay Uruguay
nAFtA (north American Free trade Agreement) Canada Mexico UnitedStates
sAPtA (south Asian Preferential trade Arrangement) Bangladesh India Nepal Pakistan SriLanka
Bhutan Maldives

tecHnIcAL notes
243
composition of regions and other economic groupings (cont’d)RegionalIntegrationAgreementssADc (southern African Development community) Angola Lesotho Mauritius SouthAfrica Zambia
Botswana Madagascar Mozambique Swaziland Zimbabwe
Congo,Dem.Rep.of Malawi Namibia UnitedRepublicofTanzania
WAemu (West African economic and monetary union) Benin Côted’Ivoire Mali Senegal Togo
BurkinaFaso Guinea-Bissau Niger
WTOmembersarefrequentlyreferredtoas“countries”,althoughsomemembersarenotcountriesintheusualsenseofthewordbutareofficially“customsterritories”.The definition of geographical and other groupings inthis reportdoesnot implyanexpressionofopinionbytheSecretariatconcerningthestatusofanycountryorterritory, thedelimitationof its frontiers,nor therightsandobligationsofanyWTOmemberinrespectofWTOagreements. The colours, boundaries, denominationsandclassificationsinthemapsofthepublicationdonotimply, on the part of the WTO, any judgement on thelegalorotherstatusofanyterritory,oranyendorsementoracceptanceofanyboundary.
Throughoutthisreport,SouthandCentralAmericaandthe Caribbean is referred to as South and CentralAmerica. The Bolivarian Republic of Venezuela; HongKong Special Administrative Region of China; theRepublicofKorea;andtheSeparateCustomsTerritoryofTaiwan,Penghu,KinmenandMatsuare referencedas Bolivarian Rep. of Venezuela; Hong Kong, China;Korea,Republicof;andTaipei,Chineserespectively.
world Trade reporT 2010
244
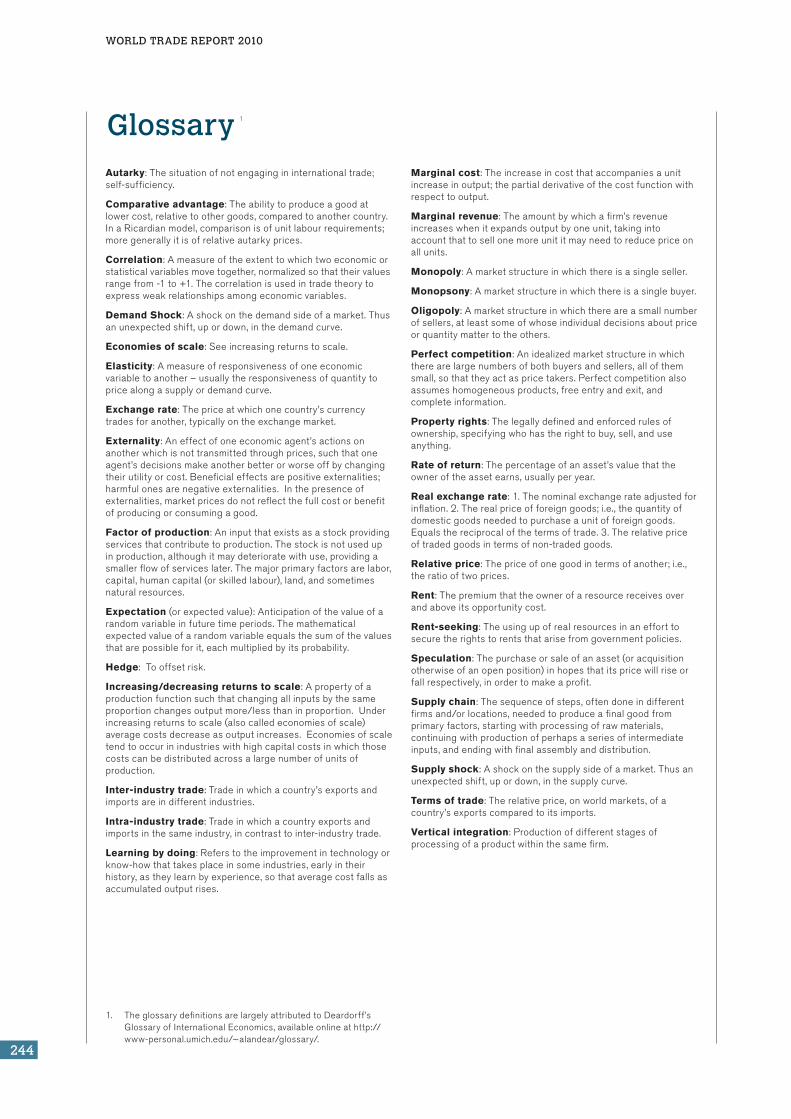
Glossary 1
Autarky:Thesituationofnotengagingininternationaltrade;self-sufficiency.
Comparative advantage:Theabilitytoproduceagoodatlowercost,relativetoothergoods,comparedtoanothercountry.InaRicardianmodel,comparisonisofunitlabourrequirements;moregenerallyitisofrelativeautarkyprices.
Correlation:Ameasureoftheextenttowhichtwoeconomicorstatisticalvariablesmovetogether,normalizedsothattheirvaluesrangefrom-1to+1.Thecorrelationisusedintradetheorytoexpressweakrelationshipsamongeconomicvariables.
Demand Shock:Ashockonthedemandsideofamarket.Thusanunexpectedshift,upordown,inthedemandcurve.
Economies of scale:Seeincreasingreturnstoscale.
Elasticity:Ameasureofresponsivenessofoneeconomicvariabletoanother–usuallytheresponsivenessofquantitytopricealongasupplyordemandcurve.
Exchange rate:Thepriceatwhichonecountry’scurrencytradesforanother,typicallyontheexchangemarket.
Externality:Aneffectofoneeconomicagent’sactionsonanotherwhichisnottransmittedthroughprices,suchthatoneagent’sdecisionsmakeanotherbetterorworseoffbychangingtheirutilityorcost.Beneficialeffectsarepositiveexternalities;harmfulonesarenegativeexternalities.Inthepresenceofexternalities,marketpricesdonotreflectthefullcostorbenefitofproducingorconsumingagood.
Factor of production:Aninputthatexistsasastockprovidingservicesthatcontributetoproduction.Thestockisnotusedupinproduction,althoughitmaydeterioratewithuse,providingasmallerflowofserviceslater.Themajorprimaryfactorsarelabor,capital,humancapital(orskilledlabour),land,andsometimesnaturalresources.
Expectation(orexpectedvalue):Anticipationofthevalueofarandomvariableinfuturetimeperiods.Themathematicalexpectedvalueofarandomvariableequalsthesumofthevaluesthatarepossibleforit,eachmultipliedbyitsprobability.
Hedge:Tooffsetrisk.
Increasing/decreasing returns to scale:Apropertyofaproductionfunctionsuchthatchangingallinputsbythesameproportionchangesoutputmore/lessthaninproportion.Underincreasingreturnstoscale(alsocalledeconomiesofscale)averagecostsdecreaseasoutputincreases.Economiesofscaletendtooccurinindustrieswithhighcapitalcostsinwhichthosecostscanbedistributedacrossalargenumberofunitsofproduction.
Inter-industry trade:Tradeinwhichacountry’sexportsandimportsareindifferentindustries.
Intra-industry trade:Tradeinwhichacountryexportsandimportsinthesameindustry,incontrasttointer-industrytrade.
Learning by doing:Referstotheimprovementintechnologyorknow-howthattakesplaceinsomeindustries,earlyintheirhistory,astheylearnbyexperience,sothataveragecostfallsasaccumulatedoutputrises.
Marginal cost:Theincreaseincostthataccompaniesaunitincreaseinoutput;thepartialderivativeofthecostfunctionwithrespecttooutput.
Marginal revenue:Theamountbywhichafirm’srevenueincreaseswhenitexpandsoutputbyoneunit,takingintoaccountthattosellonemoreunititmayneedtoreducepriceonallunits.
Monopoly:Amarketstructureinwhichthereisasingleseller.
Monopsony:Amarketstructureinwhichthereisasinglebuyer.
Oligopoly:Amarketstructureinwhichthereareasmallnumberofsellers,atleastsomeofwhoseindividualdecisionsaboutpriceorquantitymattertotheothers.
Perfect competition:Anidealizedmarketstructureinwhichtherearelargenumbersofbothbuyersandsellers,allofthemsmall,sothattheyactaspricetakers.Perfectcompetitionalsoassumeshomogeneousproducts,freeentryandexit,andcompleteinformation.
Property rights:Thelegallydefinedandenforcedrulesofownership,specifyingwhohastherighttobuy,sell,anduseanything.
Rate of return:Thepercentageofanasset’svaluethattheowneroftheassetearns,usuallyperyear.
Real exchange rate:1.Thenominalexchangerateadjustedforinflation.2.Therealpriceofforeigngoods;i.e.,thequantityofdomesticgoodsneededtopurchaseaunitofforeigngoods.Equalsthereciprocalofthetermsoftrade.3.Therelativepriceoftradedgoodsintermsofnon-tradedgoods.
Relative price:Thepriceofonegoodintermsofanother;i.e.,theratiooftwoprices.
Rent:Thepremiumthattheownerofaresourcereceivesoverandaboveitsopportunitycost.
Rent-seeking:Theusingupofrealresourcesinanefforttosecuretherightstorentsthatarisefromgovernmentpolicies.
Speculation:Thepurchaseorsaleofanasset(oracquisitionotherwiseofanopenposition)inhopesthatitspricewillriseorfallrespectively,inordertomakeaprofit.
Supply chain:Thesequenceofsteps,oftendoneindifferentfirmsand/orlocations,neededtoproduceafinalgoodfromprimaryfactors,startingwithprocessingofrawmaterials,continuingwithproductionofperhapsaseriesofintermediateinputs,andendingwithfinalassemblyanddistribution.
Supply shock:Ashockonthesupplysideofamarket.Thusanunexpectedshift,upordown,inthesupplycurve.
Terms of trade:Therelativeprice,onworldmarkets,ofacountry’sexportscomparedtoitsimports.
Vertical integration:Productionofdifferentstagesofprocessingofaproductwithinthesamefirm.
1. TheglossarydefinitionsarelargelyattributedtoDeardorff’sGlossaryofInternationalEconomics,availableonlineathttp://www-personal.umich.edu/~alandear/glossary/.

ABBRevIAtIons AnD symBoLs
245
abbreviations and symbolsAC alternatingcurrentASEAN AssociationofSoutheastAsianNationsBITs bilateralinvestmenttreatiesBTU BritishthermalunitCAREC CentralAsianRegionalEconomicCooperationCECA ComprehensiveEconomicCooperationAgreementCEQ CouncilonEnvironmentalQualityCFP CommonFisheriesPolicyCIS CommonwealthofIndependentStatesCITES ConventiononInternationalTradeinEndangeredSpeciesofWildFaunaandFloraCO2 carbondioxideCPI ConsumerPriceIndexCRRA constantrelativeriskaversionCTS CouncilforTradeinServicesDC directcurrentDWFN distantwatersfishingnationdwt deadweighttonneEAEC EurasianEconomicCommunityECT EnergyCharterTreatyEEZ ExclusiveEconomicZoneEITI ExtractiveIndustriesTransparencyInitiativeEKC environmentalKuznetscurveEMH EfficientMarketHypothesisEU EuropeanUnionFAO FoodandAgricultureOrganizationFDI foreigndirectinvestmentFTAs freetradeagreementsGATS GeneralAgreementonTradeinServicesGATT GeneralAgreementonTariffsandTradeGDP grossdomesticproductGEF GlobalEnvironmentFundGFTs governmentfinancialtransfersGLindex Grubel-LloydindexGPA AgreementonGovernmentProcurementHS HarmonizedSystemICA internationalcommodityagreementIDB IntegratedDatabaseIEA InternationalEnergyAgencyIMF InternationalMonetaryFundITQs individualtransferablequotasITTA InternationalTropicalTimberAgreementkt kilotonneLNG liquifiednaturalgasLPG liquifiedpetroleumgasm³ cubicmetreMEA multilateralenvironmentalagreementMERCOSUR SouthernCommonMarketMFN most-favourednationMoU MemorandumofUnderstandingNAFTA NorthAmericanFreeTradeAgreementNRBPs naturalresource-basedproductsNTM non-tariffmeasureNYMEX NewYorkMercantileExchangeOECD OrganizationforEconomicCo-operationandDevelopmentOPEC OrganizationofthePetroleumExportingCountriesOTC over-the-counterPPMs processandproductionmethodsPTAs PreferentialtradeagreementsR&D researchanddevelopmentRFMOs RegionalFisheriesManagementOrganisationsSAFEX SouthAfricanFuturesExchangeSCMs SubsidiesandCountervailingMeasuresTAC totalallowablecatchTBT TechnicalBarrierstoTradeTIFA TradeandInvestmentFrameworkAgreementTJ terajouleToP take-or-pay

world Trade reporT 2010
246
TPR TradePolicyReviewTRIPS Trade-RelatedAspectsofIntellectualPropertyRightsUK UnitedKingdomUN UnitedNationsUNCLOS UnitedNationsConventionontheLawoftheSeaUNCTAD UnitedNationsConferenceonTradeandDevelopmentUNEP UnitedNationsEnvironmentProgrammeUNFCC UnitedNationsFrameworkConventiononClimateChangeVMS vesselmonitoringsystems
Thefollowingsymbolsareusedinthispublication:... notavailable0 figureiszeroorbecamezeroduetorounding- notapplicable$ UnitedStatesdollars€ euro£ UKpound

LIst oF FIGuRes, tABLes, Boxes AnD mAPs
247
list of figures, tables, boxes and maps
I The trade situation in 2009-10
Figures
Fig.1 Volumeofworldmerchandiseexports,1965-2009 20
Fig.2 RatioofworldexportsofgoodsandcommercialservicestoGDP,1981-2009 21
Fig.3 Worldmerchandiseexportsbyregion,2007Q1-2009Q4 21
Fig.4 RealGDPandtradegrowthofOECDcountries,2008-09 22
Fig.5 Exportpricesofselectedprimaryproducts,January2000-January2010 23
Fig.6 Exportpricesofselectedprimaryproducts,2007-09 23
Fig.7 Dollarexchangeratesofselectedcurrencies,January2000-January2010 23
Fig.8 GrowthinthevolumeofworldmerchandisetradeandGDP,1999-2009 24
Fig.9 Realmerchandisetradegrowthbyregion,2009 25
Tables
Table1 Worldtradeinmanufacturedgoodsbyproduct,2008Q1-09Q4 21
Table2 GDPandmerchandisetradebyregion,2007-09 24
Table3 Worldexportsofmerchandiseandcommercialservices,2005-09 26
Table4 Worldexportsofcommercialservicesbymajorcategory,2009 27
Appendixtables
App.Table1 Worldmerchandisetradebyregionandselectedcountry,2009 28
App.Table2 Worldexportsofcommercialservicesbyregionandselectedcountry,2009 29
App.Table3 Merchandisetrade:Leadingexportersandimporters,2009 30
App.Table4 Merchandisetrade:Leadingexportersandimportersexcludingintra-EU(27)trade,2009 31
App.Table5 Leadingexportersandimportersinworldtradeincommercialservices,2009 32
Appendixfigures
App.Fig.1 Monthlymerchandiseexportsandimportsofselectedeconomies,January2006-January2010 33

world Trade reporT 2010
248
II Trade in natural resources
B. Naturalresources:Definitions,specificitiesandtradepatterns
Figures
Fig.1 MonthlyUnitedStatesoilproduction,Jan.1920-Jan.2010 48
Fig.2 Worldfisheriesproduction,1990-2007 48
Fig.3 TotalworldCO2emissionsbylevelofdevelopment,1971-2007 50
Fig.4 WorldCO2/GDPandCO2percapita,1971-2007 50
Fig.5 Nominalandrealcrudeoilprices,Jan.1970-Oct.2009 54
Fig.6 Worldnaturalresourcesexportsbyproduct,1990-2008 55
Fig.7 Worldmerchandiseexportsbyproduct,1990-2008 56
Fig.8 Worldproductionoffossilfuelsbyproduct,1970-2008 56
Fig.9 Sharesofproductgroupsinworldmerchandisetradesince1900 57
Fig.10 Naturalresourcesexportsofregionsbydestination,2008 58
Fig.11 Naturalresourcesexportsofregionsbyproduct,2008 58
tables
Table1 Countrieswiththelargestdeclinesinforestedland,1990-2005 51
Table2 Exportconcentrationandshareofnaturalresourcesinmerchandiseexports,2006 52
Table3 Grubel-Lloyd(GL)indicesforselectedeconomies,2008 53
Table4 AverageGLindicesformanufacturesandnaturalresources,2008 53
Table5 Naturalresourcesexportsbyregion,2008 57
Boxes
Box1 Iselectricityanaturalresource? 55
Box2 Theevolutionofthemarketforcrudeoiltradefromlong-termcontractstoexchangetrading 62
Box3 Chevron–acaseofverticalintegration 63
C. Tradetheoryandnaturalresources
Figures
Figure12 PerfectcompetitionandtheHotellingrule 76
Figure13 Outputandpricepathsinperfectcompetitionandmonopoly 78
Figure14 Openaccessandoptimalharvestofnaturalresources 84
Figure15 Biodiversity,ecologicalproductivityandtrade 90
Figure16 ApermanentreductioninGDPfollowingaresourceboom 93
Figure17 Realpricesofselectedcommodities,Jan.2000-Aug.09 97
Figure18 Realpricesofenergycommodities:oil,naturalgasandcoal,Jan.2000-Aug.09 98
Figure19 Realpricesofnickel,plywoodandfish,Jan.2000-July09 98
Figure20 NotionalamountsoutstandingofOTCcommodityderivatives,June1998-June2009 101
Figure21 Naturalgas–long-shortpositionsbyclassofinvestor,June2006-July09 101
Figure22 Copper–long-shortpositionsbyclassofinvestor,June2006-Aug.09 102
Figure23 UnitedStatesmonthlyoilstocksandoilprice,Jan.1986-Aug.2009 102
Figure24 Worldoilconsumptionandconsumption-to-provedreservesratio,1980-2008 103
Figure25 Worldoilrefinerycapacities,consumptionandconsumption-to-refinerycapacitiesratio,1980-2008 104

LIst oF FIGuRes, tABLes, Boxes AnD mAPs
249
tables
Table6 Theeffectsoftradeonthecommonaccessproblem(smallcountrycase) 91
Boxes
Box4 Virtualtradeinwater 74
Box5 Whatisarent? 77
Box6 Whyarenaturalresourcespronetocartelization? 79
Box7 Whatarepropertyrights? 82
Box8 Rentsandopenaccess 83
Box9 Theroleofdemand 85
Box10 Krugman’smodelofDutchdiseasewithlearning-by-doing 92
Box11 HowBotswanaescapedtheresourcecurse 96
Box12 Economicimplicationsofthechangingnatureofoilpriceshocks 97
Box13 Investmentincommodityfutures:providinginsurance 99
D Tradepolicyandnaturalresources
Figures
Figure26 Structureoftariffprotection,bystageofprocessing 115
Figure27 Structureoftariffprotectionindevelopedcountries,bystageofprocessing 115
Figure28 Exporttaxesbynaturalresource-upperboundestimates 116
Figure29 Exporttaxesonminingproductsbysubheading-upperboundestimates 118
Figure30 Naturalresourcesexportscoveredbyexporttaxes-upperboundestimatesforselectedcountries 119
Figure31 Theeffectofatariffonnaturalresources(staticmodel) 124
Figure32 Theeffectofatariffonnaturalresources(two-periodmodel) 125
Figure33 Theeffectofaquotainperiod1 129
Figure34 Effectofaproductiontax 133
Figure35 Effectofasubsidyontrade 135
Figure36 Overallincomegainfromregionalintegration 143
tables
Table7 Simpleaverageappliedtariffratesinnaturalresourcesectors,2007 114
Table8 Boundratesinnaturalresourcesectors,2007 115
Table9 Numberoftarifflinesaffectedbynon-tariffmeasures,bytype 116
Table10 ExportrestrictionsonnaturalresourcesnotifiedtotheWTO 119
Table11 TaxesonfuelsinOECDcountries,2008 120
Table12 Fueltaxesinnon-OECDcountries,1991 120
Table13 GovernmentfinancialtransfersbyOECDcountriestofisheries,2006 121
Table14 Fisheriessubsidiesinyear2003:developingcountriesandcustomsterritories 122
Table15 Effectoftradeliberalizationonpollutiontaxes 140
Boxes
Box14 Datalimitations–non-tariffmeasures 116
Box15 Datalimitations–exporttaxesandquantitativerestrictions 117
Box16 Investmentsinnaturalresources–acaseof“exportrestriction-jumping”FDI? 117
Box17 Datalimitations–subsidies 121
Box18 Welfareeffectsofanexporttax:thecaseofalargecountry 126
Box19 Exporttaxesasatooltoaddressresourcevolatility,dominanceandtariffescalationproblems 127

world Trade reporT 2010
250
Box20 Exportrestrictionsinthetropicallumberindustry 131
Box21 Alpinemeadows 132
Box22 Aretheregoodsubsidies?Thecaseofvesselbuy-backschemes 135
Box23 TheCaseofCentralAsiaandtheGreatLakesRegioninAfrica 144
Box24 TheEuropeanUnion’sCommonFisheriesPolicy 146
Annex tables
AnnexTable1 Averageappliedandboundtariffratesinnaturalresourcesectors,2007 151
AnnexTable2 AppliedMFNtariffratesofprocessedproducts,2007 156
AnnexTable3 OECDgovernmentfinancialtransferstofishing 158
E Naturalresources,internationalcooperationandtraderegulation
Boxes
Box25 HistoricaloverviewofnaturalresourcesintheGATT/WTO 163
Box26 “Commercialpresence”modeofsupplyundertheGATS:Rulesrelevantforinvestmentinservices 165
Box27 GeneralexceptionsintheGATSandtheprotectionoftheenvironment 169
Box28 Whatistheeconomicrationalefortradeagreements? 184
Statisticalappendix
App.Table1 Worldprovedoilreservesbycountryandregion,2008 206
App.Table2 Leadingexportersandimportersofnaturalresourcesincludingintra-EUtrade,2008 207
App.Table3 Leadingexportersandimportersofnaturalresourcesexcludingintra-EUtrade,2008 208
App.Table4 Leadingexportersandimportersoffishincludingintra-EUtrade,2008 209
App.Table5 Leadingexportersandimportersoffishexcludingintra-EUtrade,2008 210
App.Table6 Leadingexportersandimportersofforestryproductsincludingintra-EUtrade,2008 211
App.Table7 Leadingexportersandimportersofforestryproductsexcludingintra-EUtrade,2008 212
App.Table8 Leadingexportersandimportersoffuelsincludingintra-EUtrade,2008 213
App.Table9 Leadingexportersandimportersoffuelsexcludingintra-EUtrade,2008 214
App.Table10 Leadingexportersandimportersofminingproductsincludingintra-EUtrade,2008 215
App.Table11 Leadingexportersandimportersofminingproductsexcludingintra-EUtrade,2008 216
App.Table12 Importsofnaturalresourcesbypartnerregionandsupplierformajoreconomies,2008 217
App.Map1 Netexportersoffishandfishproducts,2008orlatestyear 219
App.Map2 Netexportersofforestryproducts,2008orlatestyear 220
App.Map3 Netexportersoffuels,2008orlatestyear 221
App.Map4 Netexportersofnon-ferrousmetals,2008orlatestyear 222
App.Map5 Netexportersoforesandotherminerals,2008orlatestyear 223
App.Map6 Totalrenewablefreshwaterresourcespercapita,2008 224
App.Map7 Energyproduction/totalprimaryenergysupply(energyself-sufficiency),2007 225
App.Map8 Oilproduction/totalprimaryenergysupplyofoil(oilself-sufficiency),2007 226
App.Map9 Totalprimaryenergysupply/GDP(energyintensityofGDP),2007 227
App.Map10 Totalprimaryenergysupply/population(percapitaenergysupply),2007 228

LIst oF FIGuRes, tABLes, Boxes AnD mAPs
251
wTo members(AsofendJune2010)
AlbaniaAngolaAntiguaandBarbudaArgentinaArmeniaAustraliaAustriaBahrain,KingdomofBangladeshBarbadosBelgiumBelizeBeninBoliviaBotswanaBrazilBruneiDarussalamBulgariaBurkinaFasoBurundiCambodiaCameroonCanadaCapeVerdeCentralAfricanRepublicChadChileChinaColombiaCongoCostaRicaCôted’IvoireCroatiaCubaCyprusCzechRepublicDemocraticRepublicoftheCongoDenmarkDjiboutiDominicaDominicanRepublicEcuadorEgyptElSalvadorEstoniaEuropeanUnionFijiFinlandFormerYugoslavRepublicof
MacedoniaFranceGabonTheGambiaGeorgiaGermanyGhanaGreeceGrenadaGuatemala
GuineaGuineaBissauGuyanaHaitiHondurasHongKong,ChinaHungaryIcelandIndiaIndonesiaIrelandIsraelItalyJamaicaJapanJordanKenyaKorea,RepublicofKuwaitKyrgyzRepublicLatviaLesothoLiechtensteinLithuaniaLuxembourgMacao,ChinaMadagascarMalawiMalaysiaMaldivesMaliMaltaMauritaniaMauritiusMexicoMoldovaMongoliaMoroccoMozambiqueMyanmarNamibiaNepalNetherlandsNewZealandNicaraguaNigerNigeriaNorwayOmanPakistanPanamaPapuaNewGuineaParaguayPeruPhilippinesPolandPortugalQatarRomania
RwandaSaintKittsandNevisSaintLuciaSaintVincent&theGrenadinesSaudiArabiaSenegalSierraLeoneSingaporeSlovakRepublicSloveniaSolomonIslandsSouthAfricaSpainSriLankaSurinameSwazilandSwedenSwitzerlandChineseTaipeiTanzaniaThailandTogoTongaTrinidadandTobagoTunisiaTurkeyUgandaUkraineUnitedArabEmiratesUnitedKingdomUnitedStatesofAmericaUruguayVenezuela(BolivarianRepublicof)VietNamZambiaZimbabwe

world Trade reporT 2010
252
Previous World Trade Reportstrade Policy commitments and contingency measures
2009
WORLD TRADE REPORT 2009
World Trade Report The World Trade Report is an annual publication that aims to deepen understanding about trends in trade, trade policy issues and the multilateral trading system. The theme of this year’s Report is “Trade policy commitments and contingency measures”. The Report examines the range of contingency measures available in trade agreements and the role that these measures play. Also referred to as escape clauses or safety valves, these measures allow governments a certain degree of flexibility within their trade commitments and can be used to address circumstances that could not have been foreseen when a trade commitment was made. Contingency measures seek to strike a balance between commitments and flexibility. Too much flexibility may undermine the value of commitments, but too little may render the rules unsustainable. The tension between credible commitments and flexibility is often close to the surface during trade negotiations. For example, in the July 2008 mini-ministerial meeting, which sought to agree negotiating modalities – or a final blueprint – for agriculture and non-agricultural market access (NAMA), the question of a “special safeguard mechanism” (the extent to which developing countries would be allowed to protect farmers from import surges) was crucial to the discussions. One of the main objectives of this Report is to analyze whether WTO provisions provide a balance between supplying governments with necessary flexibility to face difficult economic situations and adequately defining them in a way that limits their use for protectionist purposes. In analyzing this question, the Report focuses primarily on contingency measures available to WTO members when importing and exporting goods. These measures include the use of safeguards, such as tariffs and quotas, in specified circumstances, anti-dumping duties on goods that are deemed to be “dumped”, and countervailing duties imposed to offset subsidies. The Report also discusses alternative policy options, including the renegotiation of tariff commitments, the use of export taxes, and increases in tariffs up to their legal maximum ceiling or binding. The analysis includes consideration of legal, economic and political economy factors that influence the use of these measures and their associated benefits and costs.
9 789287 035134
ISBN 978-92-870-3513-4
WORLD TRADE REPORT 2009 - Trade Policy Com
mitm
ents and Contingency Measures
Trade Policy Commitments and Contingency Measures
Cover photos (from left to right): Image copyright Quayside, 2009; Image copyright Christian Lagerek, 2009; Image copyright Guido Vrola, 2009;
The2009Reportexaminestherangeandroleofcontingencymeasuresavailableintradeagreements.Oneof theReport’smainobjectives is toanalysewhetherWTOprovisions provide a balance between supplying governments with the necessaryflexibilitytofacedifficulteconomicsituationsandadequatelydefiningtheseinawaythatlimitstheiruseforprotectionistpurposes.
trade in a Globalizing World
2008
Trade in a Globalizing World
WORLD TRADE REPORT 2008
World Trade Report The World Trade Report is an annual publication that aims to deepen understanding about trends in trade, trade policy issues and the multilateral trading system.
International trade is integral to the process of globalization. Over many years, governments in most countries have increasingly opened their economies to inter-national trade, whether through the multilateral trading system, increased regional cooperation or as part of domestic reform programmes. Trade and globalization more generally have brought enormous benefits to many countries and citizens. Trade has allowed nations to benefit from specialization and to produce more efficiently. It has raised productivity, supported the spread of knowledge and new technologies, and enriched the range of choices available to consumers. But deeper integration into the world economy has not always proved to be popular, nor have the benefits of trade and globalization necessarily reached all sections of society. As a result, trade scepticism is on the rise in certain quarters.
The purpose of this year’s Report, whose main theme is “Trade in a Globalizing World”, is to remind ourselves of what we know about the gains from international trade and the challenges arising from higher levels of integration. The Report addresses a range of interlinking questions, starting with a consideration of what constitutes globalization, what drives it, what benefits does it bring, what challenges does it pose and what role does trade play in this world of ever-growing inter-dependency. The Report asks why some countries have managed to take advantage of falling trade costs and greater policy-driven trading opportunities while others have remained largely outside international commercial relations. It also considers who the winners and losers are from trade and what complementary action is needed from policy-makers to secure the benefits of trade for society at large. In examining these complex and multi-faceted questions, the Report reviews both the theoretical gains from trade and empirical evidence that can help to answer these questions.
ISBN 978-92-870-3454-0
WORLD TRADE REPORT 2008 - Trade in a Globalizing W
orld
The 2008 Report provides a reminder of what we know about the gains frominternational trade and highlights the challenges arising from higher levels ofintegration.Itaddressesthequestionofwhatconstitutesglobalization,whatdrivesit,whatbenefitsitbrings,whatchallengesitposesandwhatroletradeplaysinthisworldofever-growinginter-dependency.
sixty years of the multilateral trading system : Achievements and challenges
2007
wo
rld tra
de o
rga
niza
tion
w
orld
trad
e report 2007
iSBn 978-92-870-3401-4
2007WORLD TRADE REPORT
On1January2008themultilateral tradingsystemcelebrated its60thanniversary.TheWorldTradeReport2007celebratesthislandmarkanniversarywithanin-depthlookat theGeneralAgreementonTariffs andTrade (GATT) and its successor theWorld Trade Organization — their origins, achievements, the challenges they havefacedandwhatthefutureholds.
exploring the Links between subsidies, trade and the Wto
2006
2006WORLD TRADE REPORT
wo
rld
tra
de o
rg
an
izatio
n
WO
RLD
TRA
DE R
EPORT 2006
TheWorldTradeReport2006focusesonhowsubsidiesaredefined,whateconomictheorycantellusaboutsubsidies,whygovernmentsusesubsidies,themostprominentsectorsinwhichsubsidiesareappliedandtheroleoftheWTOAgreementinregulatingsubsidiesininternationaltrade.TheReportalsoprovidesbriefanalyticalcommentariesoncertaintopicaltradeissues.
trade, standards and the Wto
2005
2005WORLD TRADE REPORT
wo
rld
tra
de o
rg
an
izatio
n
WO
RLD
TRA
DE R
EPORT 2006
The World Trade Report 2005 seeks to shed light on the various functions andconsequencesofstandards,focusingontheeconomicsofstandardsininternationaltrade, the institutionalsetting forstandard-settingandconformityassessment,andthe roleofWTOagreements in reconciling the legitimatepolicyusesof standardswithanopen,non-discriminatorytradingsystem.
coherence
2004
2004WORLD TRADE REPORT
wo
rld
tra
de o
rg
an
izatio
n
WO
RLD
TRA
DE R
EPORT 2006
TheWorldTradeReport2004focusesonthenotionofcoherenceintheanalysisofinterdependentpolicies:theinteractionbetweentradeandmacroeconomicpolicy,theroleofinfrastructureintradeandeconomicdevelopment,domesticmarketstructures,governance and institutions, and the role of international cooperation in promotingpolicycoherence.
trade and Development
2003
2003WORLD TRADE REPORT
wo
rld
tra
de o
rg
an
izatio
n
WO
RLD
TRA
DE R
EPORT 2006
TheWorldTradeReport2003focusesondevelopment.Itexplainstheoriginofthisissueandoffersaframeworkwithinwhichtoaddressthequestionoftherelationshipbetweentradeanddevelopment,therebycontributingtomoreinformeddiscussion.

This report is also available inFrench and Spanish.
To order, please contact:WTO Publications
World Trade Organization154, rue de Lausanne
CH-1211 Geneva 21Tel: (41 22) 739 52 08Fax: (41 22) 739 54 58
Email: [email protected] WTO bookshop:
http://onlinebookshop.wto.org
ISBN 978-92-870-3708-4Printed in Switzerland
Report designed by Services Concept
© World Trade Organization 2010
Photo creditsCover and page 41: Souda Tandara-Stenier
Cover and page 45: Karolina Szufnara - iStockphotoCover and page 73: Montferney - Fotolia
Cover and page 113: Brad Sauter - ShutterstockCover and page 161: Christian Lagerek - ShutterstockCover and page 201: Darren J. Bradley - Shutterstock
Page 3: Jay Louvion.Page 19: choicegraphx - iStockphoto
Page 39: Martin Harvey - Getty Images
The World Trade Report is an annual publication that aims to deepen understanding about trends in trade, trade policy issues and the multilateral trading system.
The 2010 World Trade Report is split into two main parts. The first is a brief summary of the trade situation in 2009-2010. The second part focuses on the special theme of natural resources.
Website: www.wto.orgGeneral enquiries: [email protected]: +41 (0)22 739 51 11
What is the World Trade Report?
Using this report
Find out more

9 789287 037084
World Trade Report
The World Trade Report 2010 focuses on trade in natural resources, such as fuels, forestry, mining and fisheries. The Report examines the characteristics of trade in natural resources, the policy choices available to governments and the role of international cooperation, particularly of the WTO, in the proper management of trade in this sector.
A key question is to what extent countries gain from open trade in natural resources. Some of the issues examined in the Report include the role of trade in providing access to natural resources, the effects of international trade on the sustainability of natural resources, the environmental impact of resources trade, the so-called natural resources curse, and resource price volatility.
The Report examines a range of key measures employed in natural resource sectors, such as export taxes, tariffs and subsidies, and provides information on their current use. It analyses in detail the effects of these policy tools on an economy and on its trading partners.
Finally, the Report provides an overview of how natural resources fit within the legal framework of the WTO and discusses other international agreements that regulate trade in natural resources. A number of challenges are addressed, including the regulation of export policy, the treatment of subsidies, trade facilitation, and the relationship between WTO rules and other international agreements.
“I believe not only that there is room for mutually beneficial negotiating trade-offs that encompass
natural resources trade, but also that a failure to address these issues could be a recipe for
growing tension in international trade relations. Well designed trade rules are key to ensuring
that trade is advantageous, but they are also necessary for the attainment of objectives such as
environmental protection and the proper management of natural resources in a domestic setting.”
Pascal Lamy, WTO Director-General
World
Trad
e Rep
ort 2010 T
rade in natural resources
World Trade Report 2010Trade in natural resources