Embed Size (px)
Citation preview

Technical Note on Nutrition in East Asia and the Pacific (EAP)
The World Bank Jakarta: Nutrition Series
September 2011
Pub
lic D
iscl
osur
e A
utho
rized
Pub
lic D
iscl
osur
e A
utho
rized
Pub
lic D
iscl
osur
e A
utho
rized
Pub
lic D
iscl
osur
e A
utho
rized
Pub
lic D
iscl
osur
e A
utho
rized
Pub
lic D
iscl
osur
e A
utho
rized
Pub
lic D
iscl
osur
e A
utho
rized
Pub
lic D
iscl
osur
e A
utho
rized
2
TABLE OF CONTENTS
1. PREVALENCE OF MALNUTRITION AND THE DOUBLE BURDEN OF MALNUTRITION IN THE
EAP REGION .................................................................................................................... 3
2. DETERMINANTS OF MALNUTRITION: UNDER- AND OVERNUTRITION............................... 5
3. UNDERNUTRITION PREVALENCE AND TRENDS ................................................................ 8
4. CONSEQUENCES OF UNDERNUTRITION AND STUNTED GROWTH ................................... 10
5. PREVALENCE AND TRENDS IN OVERWEIGHT AND OBESITY ............................................ 11
6. CONSEQUENCES OF OVERNUTRITION AND OBESITY ...................................................... 12
7. MATERNAL MALNUTRITION .......................................................................................... 13
8. MICRONUTRIENT DEFICIENCIES ..................................................................................... 14
9. EQUITY ISSUES IN MALNUTRITION ................................................................................ 15
3
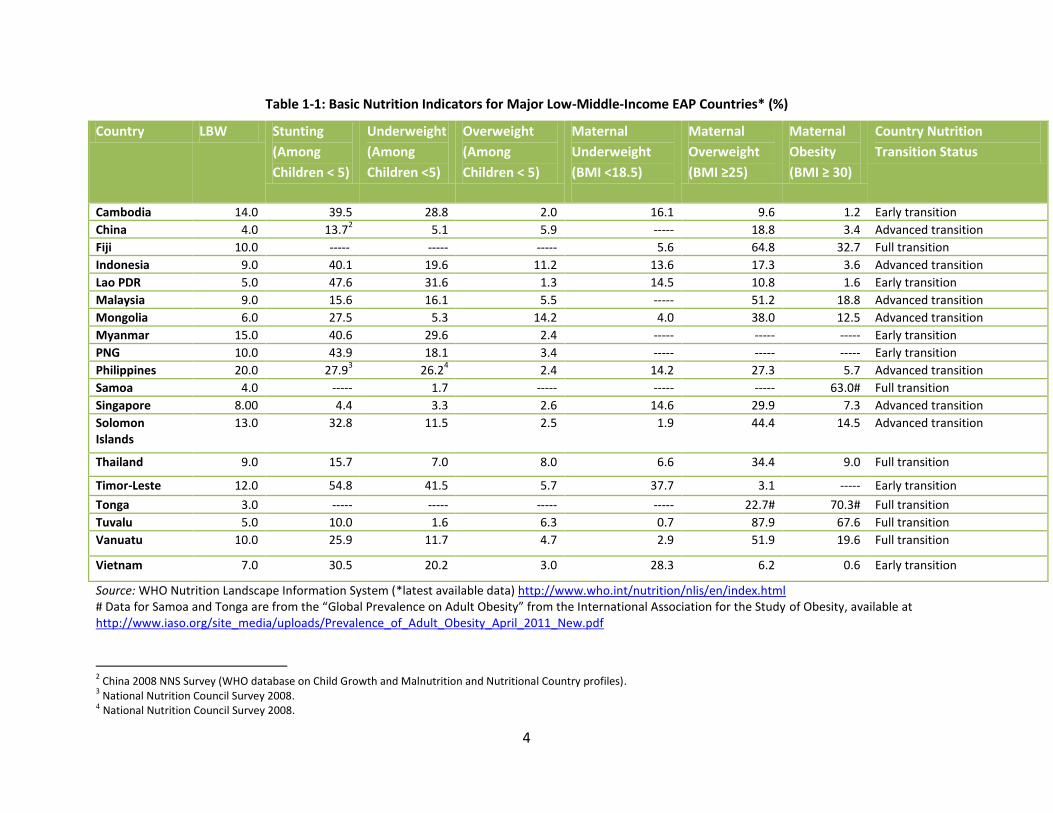
1. PREVALENCE OF MALNUTRITION AND THE DOUBLE BURDEN OF MALNUTRITION IN THE EAP REGION
The East Asia and Pacific (EAP) region represents the global spectrum of nutritional well-being (Table
1-1). Stunting rates among children under five range from less than 5 percent in Singapore, Fiji and
Samoa to 40 percent in Cambodia and 55 percent in Timor-Leste. Low birthweight (LBW), a strong
predictor of both child undernutrition and later life overnutrition, ranges from 3 percent in Tonga to 15
percent in Myanmar and Cambodia and 20 percent in the Philippines. Maternal underweight, measured
as BMI1 <18.5 and a determinant of LBW and child stunting, is very high in Timor-Leste and Vietnam, but
low in Mongolia. There are some other outliers as well with the Solomon Islands having very high LBW
and stunting, yet also very high levels of maternal overweight. Maternal obesity is very high in all of the
Pacific Islands with 63 percent in Samoa, 70 percent in Tonga and 68 percent in Tuvalu.
1 Body mass index (BMI) is defined as the individual's body weight divided by the square of his or her height. The formula
universally used in medicine produces a unit of measure of kg/m2.
4
Table 1-1: Basic Nutrition Indicators for Major Low-Middle-Income EAP Countries* (%)
Country LBW Stunting
(Among
Children < 5)
Underweight
(Among
Children <5)
Overweight
(Among
Children < 5)
Maternal
Underweight
(BMI <18.5)
Maternal
Overweight
(BMI ≥25)
Maternal
Obesity
(BMI ≥ 30)
Country Nutrition
Transition Status
Cambodia 14.0 39.5 28.8 2.0 16.1 9.6 1.2 Early transition
China 4.0 13.72 5.1 5.9 ----- 18.8 3.4 Advanced transition
Fiji 10.0 ----- ----- ----- 5.6 64.8 32.7 Full transition
Indonesia 9.0 40.1 19.6 11.2 13.6 17.3 3.6 Advanced transition
Lao PDR 5.0 47.6 31.6 1.3 14.5 10.8 1.6 Early transition
Malaysia 9.0 15.6 16.1 5.5 ----- 51.2 18.8 Advanced transition
Mongolia 6.0 27.5 5.3 14.2 4.0 38.0 12.5 Advanced transition
Myanmar 15.0 40.6 29.6 2.4 ----- ----- ----- Early transition
PNG 10.0 43.9 18.1 3.4 ----- ----- ----- Early transition
Philippines 20.0 27.93 26.2
4 2.4 14.2 27.3 5.7 Advanced transition
Samoa 4.0 ----- 1.7 ----- ----- ----- 63.0# Full transition
Singapore 8.00 4.4 3.3 2.6 14.6 29.9 7.3 Advanced transition
Solomon Islands
13.0 32.8 11.5 2.5 1.9 44.4 14.5 Advanced transition
Thailand 9.0 15.7 7.0 8.0 6.6 34.4 9.0 Full transition
Timor-Leste 12.0 54.8 41.5 5.7 37.7 3.1 ----- Early transition
Tonga 3.0 ----- ----- ----- ----- 22.7# 70.3# Full transition
Tuvalu 5.0 10.0 1.6 6.3 0.7 87.9 67.6 Full transition
Vanuatu 10.0 25.9 11.7 4.7 2.9 51.9 19.6 Full transition
Vietnam 7.0 30.5 20.2 3.0 28.3 6.2 0.6 Early transition
Source: WHO Nutrition Landscape Information System (*latest available data) http://www.who.int/nutrition/nlis/en/index.html # Data for Samoa and Tonga are from the “Global Prevalence on Adult Obesity” from the International Association for the Study of Obesity, available at http://www.iaso.org/site_media/uploads/Prevalence_of_Adult_Obesity_April_2011_New.pdf
2 China 2008 NNS Survey (WHO database on Child Growth and Malnutrition and Nutritional Country profiles).
3 National Nutrition Council Survey 2008.
4 National Nutrition Council Survey 2008.
5
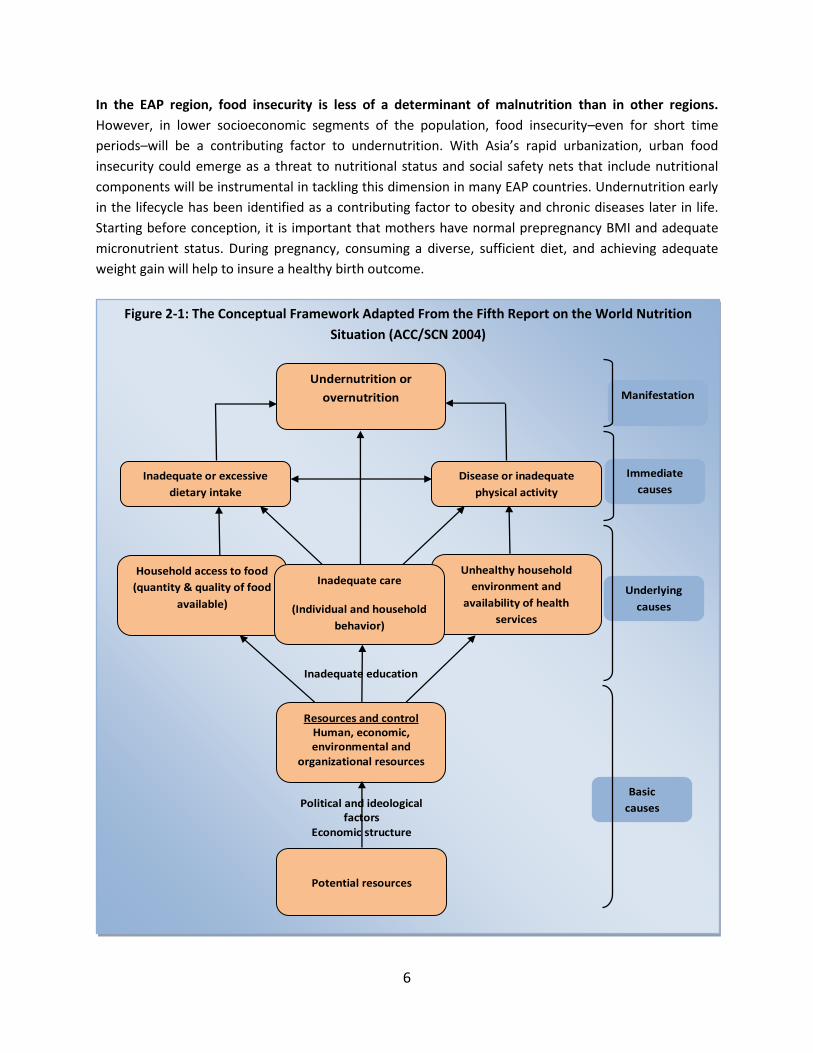
2. DETERMINANTS OF MALNUTRITION: UNDER- AND OVERNUTRITION 2.1 Determinants of Undernutrition
The UNICEF conceptual framework in Figure 2-1 (adapted by ACC/SCN 2004) illustrates the
determinants of malnutrition according to three levels of analysis:
1. The immediate causes of malnutrition include inadequate or excessive dietary intake and
disease or inadequate physical activity. In the case of undernutrition, infectious diseases not
only deprive the body of vital nutrients, but also reduce the body’s nutrient absorption
capacity–for example intestinal parasites cause anemia and nutrient deprivation, while malaria
increases the risk of iron deficiency. The nutritional value of the food consumed also affects
nutritional outcomes. In EAP rice is the single largest source of calories, however, rice is
particularly deficient in protein and iron, which means that diets need to be augmented with
other sources of nutrients, such as animal protein, legumes, and vegetables, which might not be
accessible to poorer segments of the population.
2. The underlying causes of undernutrition include insufficient food access (with a focus on
quality of the food available) and inadequate maternal and child care practices, especially
suboptimal breastfeeding practices. In the EAP region, poor caring practices result from a
combination of traditions and beliefs, time demands of women’s work, lack of access and/or
low-quality health services, and marketing practices of manufacturers of breast-milk substitutes
among others. Initiation of breastfeeding within one hour of birth is very low (15 percent overall
in Asia), while exclusive breastfeeding to six months is also low (only in DPR Korea Cambodia,
China, Mongolia, and some Polynesian islands is it greater than 50 percent). Few mothers
continue to nurse their child for the first two years of life, a practice highly recommended to
improve infant health and nutritional status. Poor complementary feeding practices include late
introduction of solid foods, giving foods with inadequate nutrient density, feeding too
infrequently, low dietary diversity and using contaminated food and/or water.
Poor access to clean water and sanitation and poor hygiene practices resulting in increased
infections such as diarrheal disease, and inadequate access to health services is another
underlying cause. Clean water, sanitation, and hygiene interventions probably have a far greater
potential for improving linear growth than previously estimated given new information about
the impact of tropical enteropathy, which may reduce growth via decreased nutrient absorption
and increased immune stress (Humphrey 2009).
3. The basic causes of undernutrition include, among others, low maternal education, gender
inequity, and trade and agricultural policies. Agricultural practices often do not support the
production of nutrient-dense, diverse foods for household consumption, and social safety nets
often do not prioritize nutritional impacts of programs (for example, supplementary food items
should be fortified). Poverty, isolation, and minority ethnicity all increase the likelihood of
undernutrition.
6
In the EAP region, food insecurity is less of a determinant of malnutrition than in other regions.
However, in lower socioeconomic segments of the population, food insecurity–even for short time
periods–will be a contributing factor to undernutrition. With Asia’s rapid urbanization, urban food
insecurity could emerge as a threat to nutritional status and social safety nets that include nutritional
components will be instrumental in tackling this dimension in many EAP countries. Undernutrition early
in the lifecycle has been identified as a contributing factor to obesity and chronic diseases later in life.
Starting before conception, it is important that mothers have normal prepregnancy BMI and adequate
micronutrient status. During pregnancy, consuming a diverse, sufficient diet, and achieving adequate
weight gain will help to insure a healthy birth outcome.
Figure 2-1: The Conceptual Framework Adapted From the Fifth Report on the World Nutrition
Situation (ACC/SCN 2004)
Basic
causes
Underlying
causes
Immediate
causes
Manifestation
Resources and control Human, economic, environmental and
organizational resources
Potential resources
Inadequate education
Undernutrition or
overnutrition
Political and ideological factors
Economic structure
Disease or inadequate
physical activity
Inadequate or excessive
dietary intake
Household access to food
(quantity & quality of food
available)
Unhealthy household
environment and
availability of health
services
Inadequate care
(Individual and household
behavior)
7
2.2 Determinants of Overnutrition
At the other end of the nutritional spectrum, overnutrition, comprising both overweight and obesity,
is characterized by a complex set of interactions rooted in individual behavior and lifestyle choices.
The OECD has identified three main determinants of the obesity epidemic (OECD 2010):
1. Supply-side factors, such as the role of the private sector and industries in providing and
marketing food with high fat and sugar content, especially in the advanced transition countries
and emerging markets, thereby contributing to unhealthy eating behaviors, and changes in
demand. Since the Green Revolution of the 1960s, multinational markets have also made it easy
to consume highly processed food that is characterized by low nutrient density and high energy
content. Instant noodles in Asia are a good example of this phenomenon; they widely
consumed, particularly by the poorer population segments.
2. Government policies in a number of areas including agriculture, transportation, and urban
planning–all of which contribute to negative changes in lifestyle and changes in the composition
of diets.
3. Changes in working conditions, which have led to a more sedentary lifestyle, decreased physical
activity, and increasing levels of work-related stress.
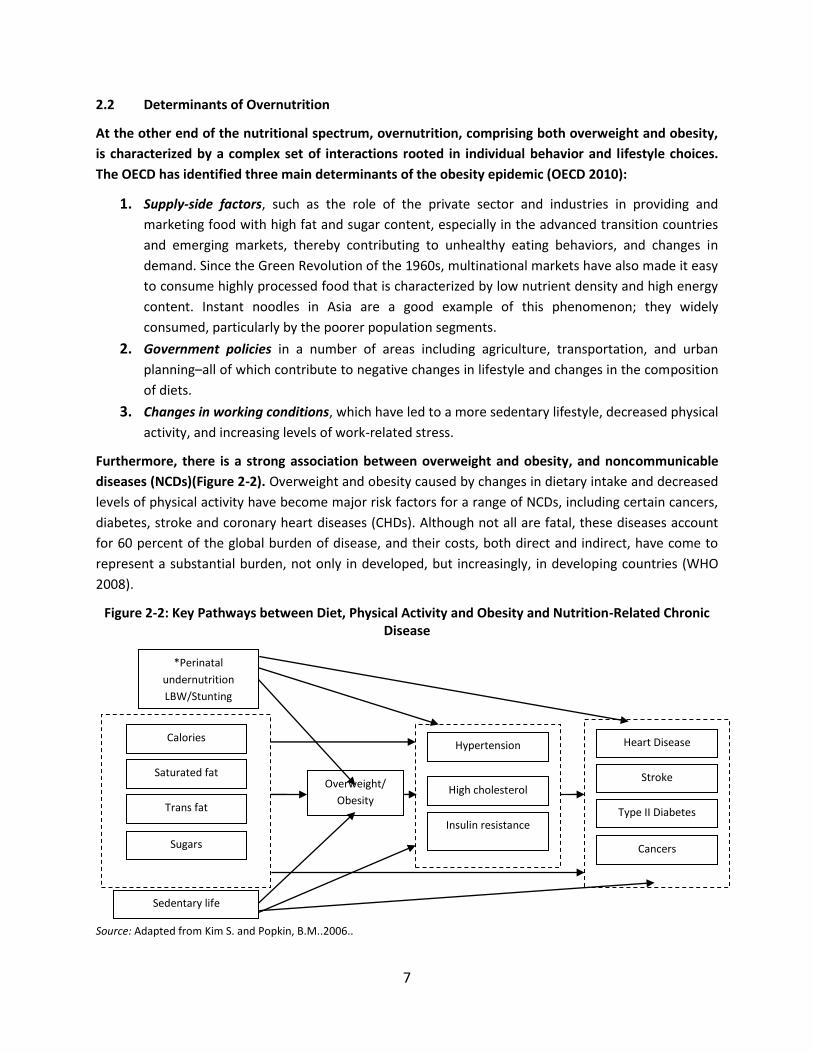
Furthermore, there is a strong association between overweight and obesity, and noncommunicable
diseases (NCDs)(Figure 2-2). Overweight and obesity caused by changes in dietary intake and decreased
levels of physical activity have become major risk factors for a range of NCDs, including certain cancers,
diabetes, stroke and coronary heart diseases (CHDs). Although not all are fatal, these diseases account
for 60 percent of the global burden of disease, and their costs, both direct and indirect, have come to
represent a substantial burden, not only in developed, but increasingly, in developing countries (WHO
2008).
Figure 2-2: Key Pathways between Diet, Physical Activity and Obesity and Nutrition-Related Chronic Disease
Source: Adapted from Kim S. and Popkin, B.M..2006..
*Perinatal
undernutrition
LBW/Stunting
Calories
Saturated fat
Trans fat
Sugars
Sedentary life
Overweight/
Obesity
Hypertension
High cholesterol
Insulin resistance
Heart Disease
Stroke
Type II Diabetes
Cancers

8
0
5
10
15
20
25
30
35
40
45
50
1987 1994 1999 2004
Cambodia
China
Indonesia
Lao PDR
Philippines
Thailand
Vietnam
3. UNDERNUTRITION PREVALENCE AND TRENDS East Asia shows positive trends in reducing underweight, with several countries on track to achieve
MDG 1(c) including DPR Korea, Vietnam, and Malaysia. There are, however, variations between
countries–stunting rates, although leveling off, still remain very high across the whole region–and the
prevalence of underweight has been declining slowly in the poorer countries. In Timor-Leste, Cambodia
and Lao PDR, stunting affects almost half of all children under five (Table 1-1, Figure 3-1), and whilst not
at this level, in Indonesia, the Philippines, Solomon Islands, Vietnam and Mongolia, stunting remains a
public health concern with rates higher than 20 percent of children under five. More moderate rates of
stunting are found in Thailand, Malaysia and China.
Figure 3-1: Prevalence of Stunting and Underweight in EAP*
Source: WHO (2010b). *Data are most recent available within the past five years.
In terms of trends over time, China has performed remarkably well on reduction of stunting, as has
Thailand. Other countries show more moderate declines over the period 1990-2008, with rates
remaining high (see Figure 3-2).
Figure 3-2: Trends in Underweight in EAP
Source: WHO (2010b). Data are most recent available within the past five years.
0102030405060
Pe
rce
nta
ge (
%)
Underweight in children <5 Stunting in children <5
9
0
10
20
30
40
50
60
70
1993 1998 2003 2008
Cambodia
China
Indonesia
Lao PDR
Philippines
Thailand
Vietnam
Figure 3-3: Trends in Stunting in EAP
Source: WHO (2010b). Data are most recent available within the past five years.
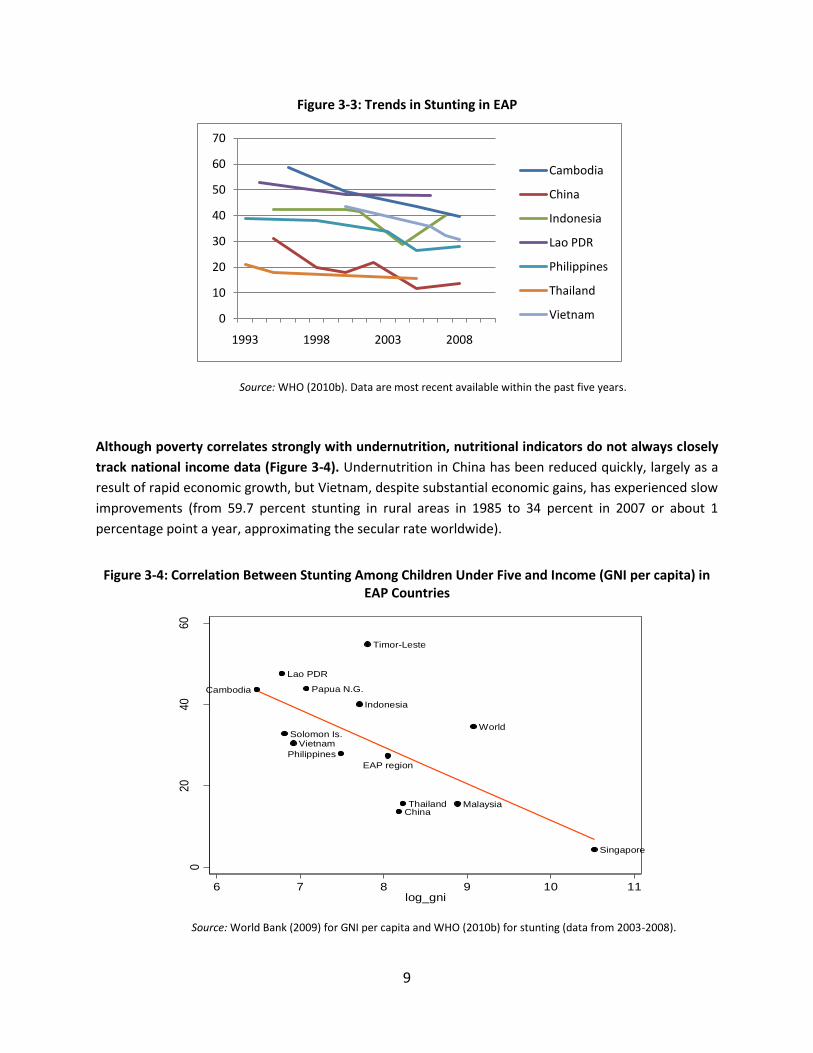
Although poverty correlates strongly with undernutrition, nutritional indicators do not always closely
track national income data (Figure 3-4). Undernutrition in China has been reduced quickly, largely as a
result of rapid economic growth, but Vietnam, despite substantial economic gains, has experienced slow
improvements (from 59.7 percent stunting in rural areas in 1985 to 34 percent in 2007 or about 1
percentage point a year, approximating the secular rate worldwide).
Figure 3-4: Correlation Between Stunting Among Children Under Five and Income (GNI per capita) in
EAP Countries
Source: World Bank (2009) for GNI per capita and WHO (2010b) for stunting (data from 2003-2008).
China
Indonesia
Lao PDR
Malaysia
Papua N.G.
Singapore
Solomon Is.
Thailand
Timor-Leste
Vietnam
World
EAP region
Cambodia
Philippines
020
40
60
Stu
ntin
g
6 7 8 9 10 11log_gni
10
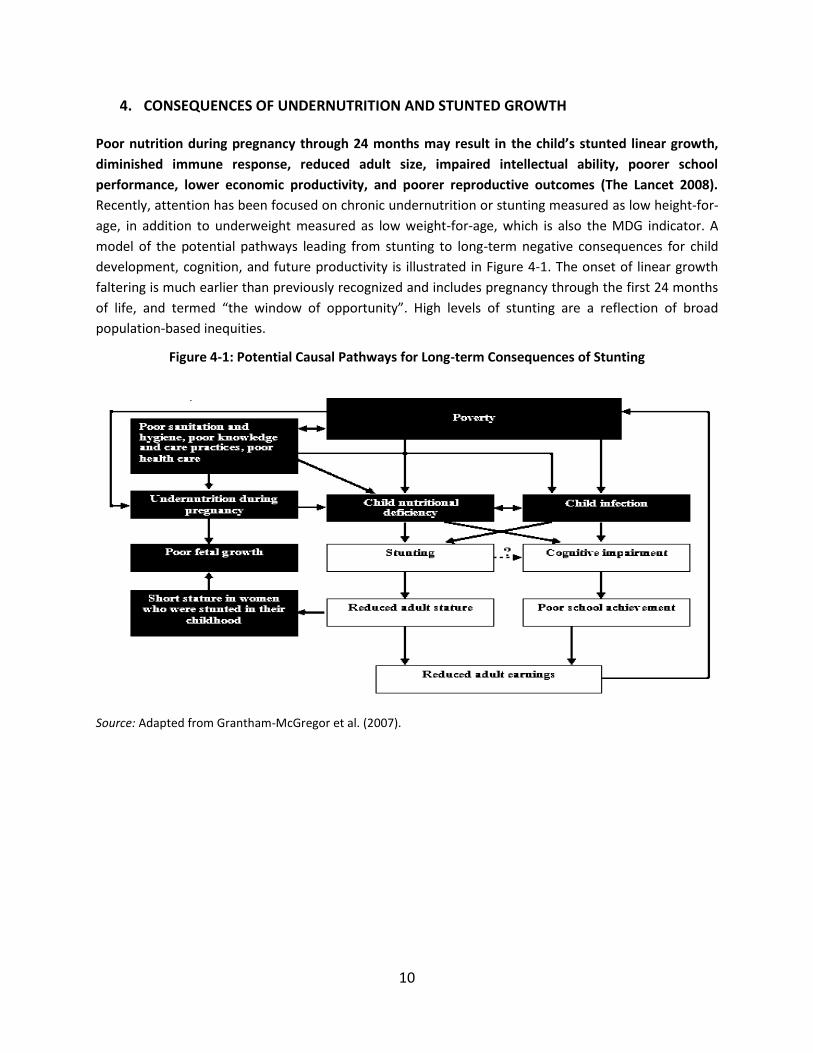
4. CONSEQUENCES OF UNDERNUTRITION AND STUNTED GROWTH Poor nutrition during pregnancy through 24 months may result in the child’s stunted linear growth,
diminished immune response, reduced adult size, impaired intellectual ability, poorer school
performance, lower economic productivity, and poorer reproductive outcomes (The Lancet 2008).
Recently, attention has been focused on chronic undernutrition or stunting measured as low height-for-
age, in addition to underweight measured as low weight-for-age, which is also the MDG indicator. A
model of the potential pathways leading from stunting to long-term negative consequences for child
development, cognition, and future productivity is illustrated in Figure 4-1. The onset of linear growth
faltering is much earlier than previously recognized and includes pregnancy through the first 24 months
of life, and termed “the window of opportunity”. High levels of stunting are a reflection of broad
population-based inequities.
Figure 4-1: Potential Causal Pathways for Long-term Consequences of Stunting
Source: Adapted from Grantham-McGregor et al. (2007).
11
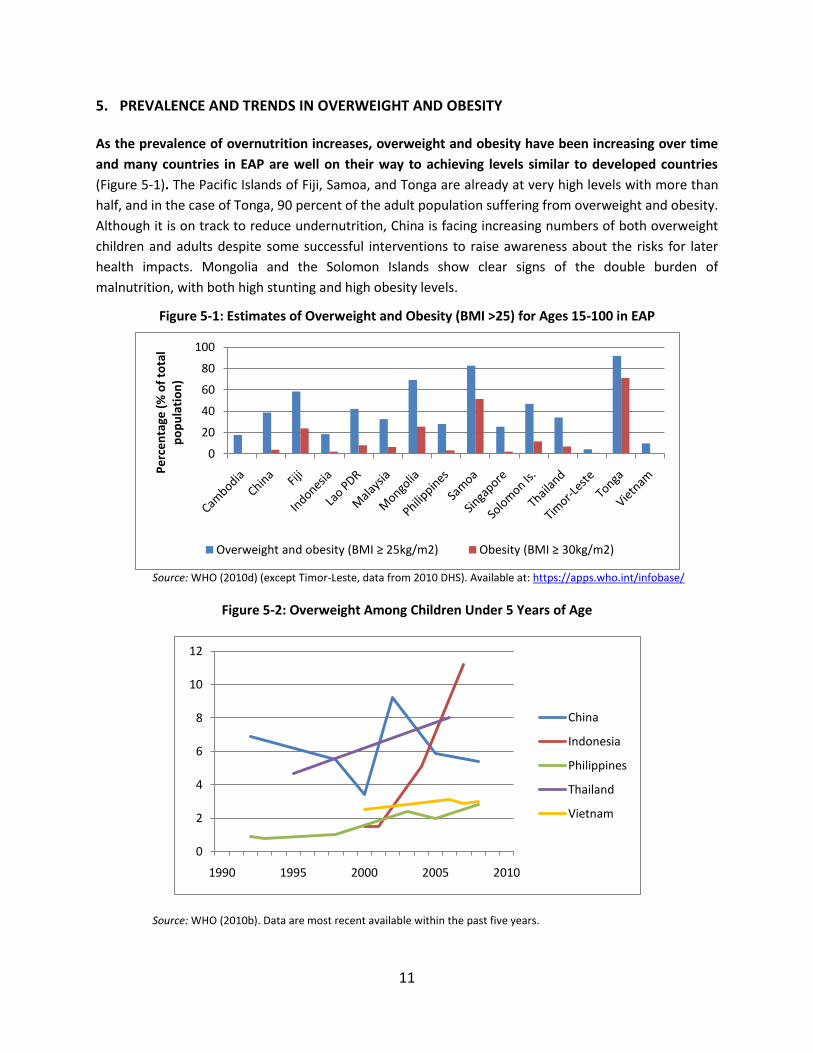
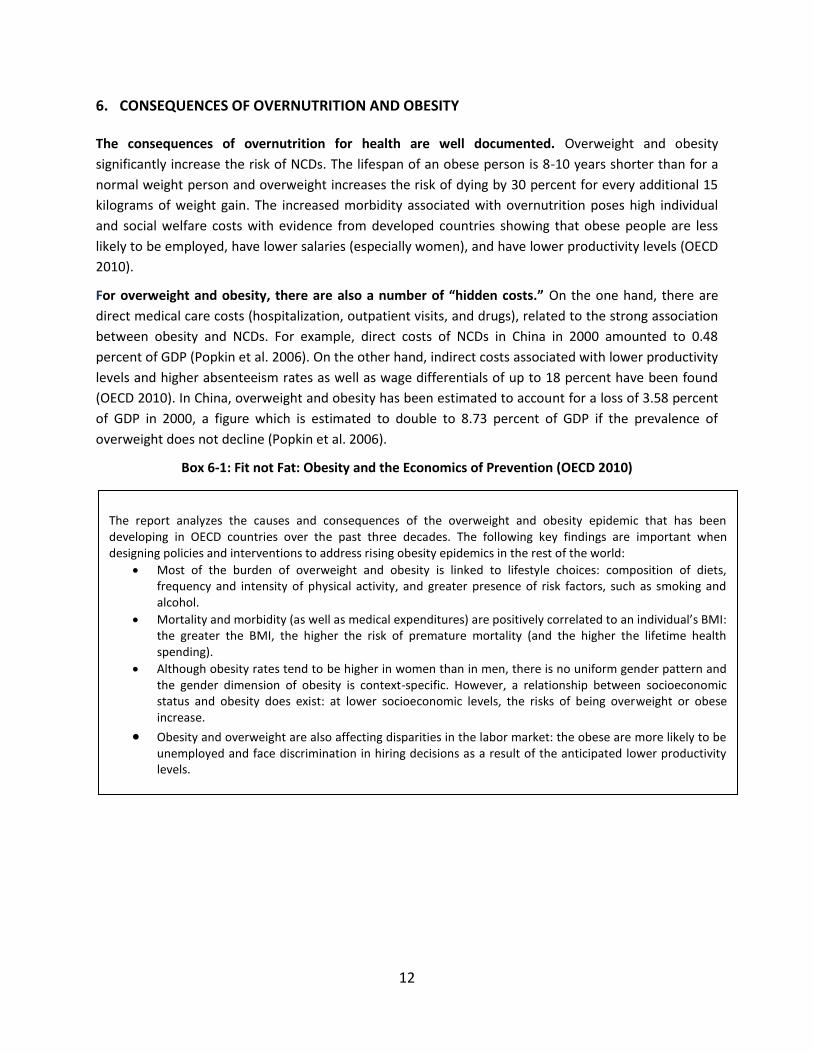
5. PREVALENCE AND TRENDS IN OVERWEIGHT AND OBESITY As the prevalence of overnutrition increases, overweight and obesity have been increasing over time
and many countries in EAP are well on their way to achieving levels similar to developed countries
(Figure 5-1). The Pacific Islands of Fiji, Samoa, and Tonga are already at very high levels with more than
half, and in the case of Tonga, 90 percent of the adult population suffering from overweight and obesity.
Although it is on track to reduce undernutrition, China is facing increasing numbers of both overweight
children and adults despite some successful interventions to raise awareness about the risks for later
health impacts. Mongolia and the Solomon Islands show clear signs of the double burden of
malnutrition, with both high stunting and high obesity levels.
Figure 5-1: Estimates of Overweight and Obesity (BMI >25) for Ages 15-100 in EAP
Source: WHO (2010d) (except Timor-Leste, data from 2010 DHS). Available at: https://apps.who.int/infobase/
Figure 5-2: Overweight Among Children Under 5 Years of Age
Source: WHO (2010b). Data are most recent available within the past five years.
0
20
40
60
80
100
Pe
rce
nta
ge (
% o
f to
tal
po
pu
lati
on
)
Overweight and obesity (BMI ≥ 25kg/m2) Obesity (BMI ≥ 30kg/m2)
0
2
4
6
8
10
12
1990 1995 2000 2005 2010
China
Indonesia
Philippines
Thailand
Vietnam
12
6. CONSEQUENCES OF OVERNUTRITION AND OBESITY The consequences of overnutrition for health are well documented. Overweight and obesity
significantly increase the risk of NCDs. The lifespan of an obese person is 8-10 years shorter than for a
normal weight person and overweight increases the risk of dying by 30 percent for every additional 15
kilograms of weight gain. The increased morbidity associated with overnutrition poses high individual
and social welfare costs with evidence from developed countries showing that obese people are less
likely to be employed, have lower salaries (especially women), and have lower productivity levels (OECD
2010).
For overweight and obesity, there are also a number of “hidden costs.” On the one hand, there are
direct medical care costs (hospitalization, outpatient visits, and drugs), related to the strong association
between obesity and NCDs. For example, direct costs of NCDs in China in 2000 amounted to 0.48
percent of GDP (Popkin et al. 2006). On the other hand, indirect costs associated with lower productivity
levels and higher absenteeism rates as well as wage differentials of up to 18 percent have been found
(OECD 2010). In China, overweight and obesity has been estimated to account for a loss of 3.58 percent
of GDP in 2000, a figure which is estimated to double to 8.73 percent of GDP if the prevalence of
overweight does not decline (Popkin et al. 2006).
Box 6-1: Fit not Fat: Obesity and the Economics of Prevention (OECD 2010)
The report analyzes the causes and consequences of the overweight and obesity epidemic that has been developing in OECD countries over the past three decades. The following key findings are important when designing policies and interventions to address rising obesity epidemics in the rest of the world:
Most of the burden of overweight and obesity is linked to lifestyle choices: composition of diets, frequency and intensity of physical activity, and greater presence of risk factors, such as smoking and alcohol.
Mortality and morbidity (as well as medical expenditures) are positively correlated to an individual’s BMI: the greater the BMI, the higher the risk of premature mortality (and the higher the lifetime health spending).
Although obesity rates tend to be higher in women than in men, there is no uniform gender pattern and the gender dimension of obesity is context-specific. However, a relationship between socioeconomic status and obesity does exist: at lower socioeconomic levels, the risks of being overweight or obese increase.
Obesity and overweight are also affecting disparities in the labor market: the obese are more likely to be unemployed and face discrimination in hiring decisions as a result of the anticipated lower productivity levels.
13
7. MATERNAL MALNUTRITION
Women’s nutritional status, prior to and during pregnancy, is an important determinant for children’s
birthweight and early life nutritional status. The high proportion of short, thin, and anemic women
coupled with heavy workloads and high fertility mean that women’s own health, quality of life, and work
capacity are impaired. As a result, they are at much greater risk of death and disability during pregnancy,
and they are likely to continue the cycle of malnutrition through the increased risk of low birthweight
and child undernutrition. If women are iodine- or folate-deficient at the time they become pregnant,
they are at greater risk of giving birth to mentally and physically impaired infants. Anemic women are
likely to give birth to infants with lower iron stores, thus hastening the onset of anemia in infancy (which
is already quite high in all of these countries). Detailed data on women’s nutritional status in the region
are scarce. Only Cambodia has had comprehensive DHS surveys; in 2005, 7.7 percent of women were
found to be short (less than 145 cm) and 20.3 percent were thin (BMI < 18.5) increasing the risk of
obstructed labor and low birthweight. Anemia affects at least 20 percent of pregnant women in all
countries (Table 7-1).
Table 7-1: Maternal Factors Related to Maternal/Child Malnutrition
Country % Anemia Amongst Pregnant Women
(Hb<110 g/L)
Total Fertility
Rate
Contraceptive Prevalence (%)
Maternal Mortality
Ratio (/100.000)
Maternal Obesity
(BMI>30)
Female Literacy*
Cambodia 57.1 3.2 40.0 540 1.2 79.0
China 28.9 1.7 85.0 45 3.4 93.0
Indonesia 44.3 2.2 61.0 420 3.6 93.0
Lao PDR 56.4 3.2 38.0 660 1.6 83.0
Malaysia 38.3 2.6 55.0 62 18.8 95.0
Mongolia 37.3 1.9 66.0 46 12.5 101.0
Myanmar 49.6 2.1 34.0 380 ----- 92.0
PNG 55.2 3.8 26.0 470 ----- 86.0
Philippines 43.9 3.3 51.0 230 5.7 101.0
Korea, Democratic Peoples’ Republic of
34.7 1.9 62.0 370 ----- -----
Singapore 23.8 1.3 62.0 14 7.3 94.0
Solomon Islands
51.1 3.9 7.0 220 14.5 -----
Thailand 22.3 1.8 77.0 110 9.0 97.0
Timor-Leste
22.9 6.6 20.0 380 ----- ----
Vietnam 32.2 2.2 76.0 150 0.6 93.0
Sources: WHO (2010c)(latest data available); Nutritional Status of Children under Five and Women in Percentage and Country Transition Status (latest available data); UNICEF (2009)(the remainder).
*Note: As proportion of male literacy (2000-2007).
14
8. MICRONUTRIENT DEFICIENCIES Anemia is not only prevalent amongst pregnant women in EAP, but is widespread among preschool
children and is a major cause of cognitive deficits in children experiencing it during the first two years
of life (Table 8-1). In Cambodia, it affects close to two-thirds of preschool children and 80 percent of
children under two years of age. Even in Thailand, anemia affects 25 percent of preschool children.
Vitamin A deficiency ranges from less than 5 percent in Thailand and Malaysia to 40 percent in the
Philippines and nearly 45 percent in Lao PDR. These levels of Vitamin A deficiency persist in spite of
reported coverage with high-dose Vitamin A supplements ranging from 50 percent of children in Timor-
Leste to 95 percent of children in DPR Korea. Iodine deficiency (measured in school children) ranges
from 16 percent in China and Indonesia to 75 percent in Papua New Guinea. Because iodine deficiency is
largely a geological issue (if there is no iodine in the local soils, foods grown on those soils will not
contain iodine), in the absence of mandatory iodization of salt, iodine deficiency becomes widespread.
Salt iodization ranges from 12 percent in Cambodia to 100 percent in Fiji.
Table 8-1: Micronutrient Indicators in Children
Country Prevalence of Anemia in Children <5 (%)
Vitamin A Deficiency in Preschool-age Children (serum retinol <0.70 μmol/L) (%)
Vitamin A Supplementation (full coverage rate) in Children < 5 (%)
Urinary Iodine Deficiency <100ug/L in School-age Children (%)
Households Consuming Iodized Salt (%)
Cambodia 61.9 22.3 76.0 ----- 73.0
China 20.0 9.3 ----- 15.7 94.0
Indonesia 45.0 ----- 87.0 16.3 73.0
Korea, Democratic People’s Republic of
31.7 ----- 95.0 20.4 40.0
Lao PDR 48.0 44.7 69.0 19.8 75.0
Malaysia 32.0 3.7 ----- ----- -----
Mongolia 21.4 19.3 94.0 52.8 83.0
Myanmar 63.0 ----- 93.0 22.3 60.0
PNG 60.0 10.3 7.0 74.7 N/A
Philippines 36.3 40.1 83.0 23.8 45.0
Solomon Islands
52.0 13.1 ----- ----- -----
Thailand 25.2 3.7 ----- 57.4 47.0
Timor-Leste 31.5 ----- 50.0 ----- 60.0
Vietnam 34.1 21.9 95.0 ----- 93.0
Sources: WHO (2010c); UNICEF (2009) for Vitamin A supplementation coverage rate and iodized salt household consumption; WHO/SEAPRO (2008) for Vitamin A deficiency and iodine deficiency.
15
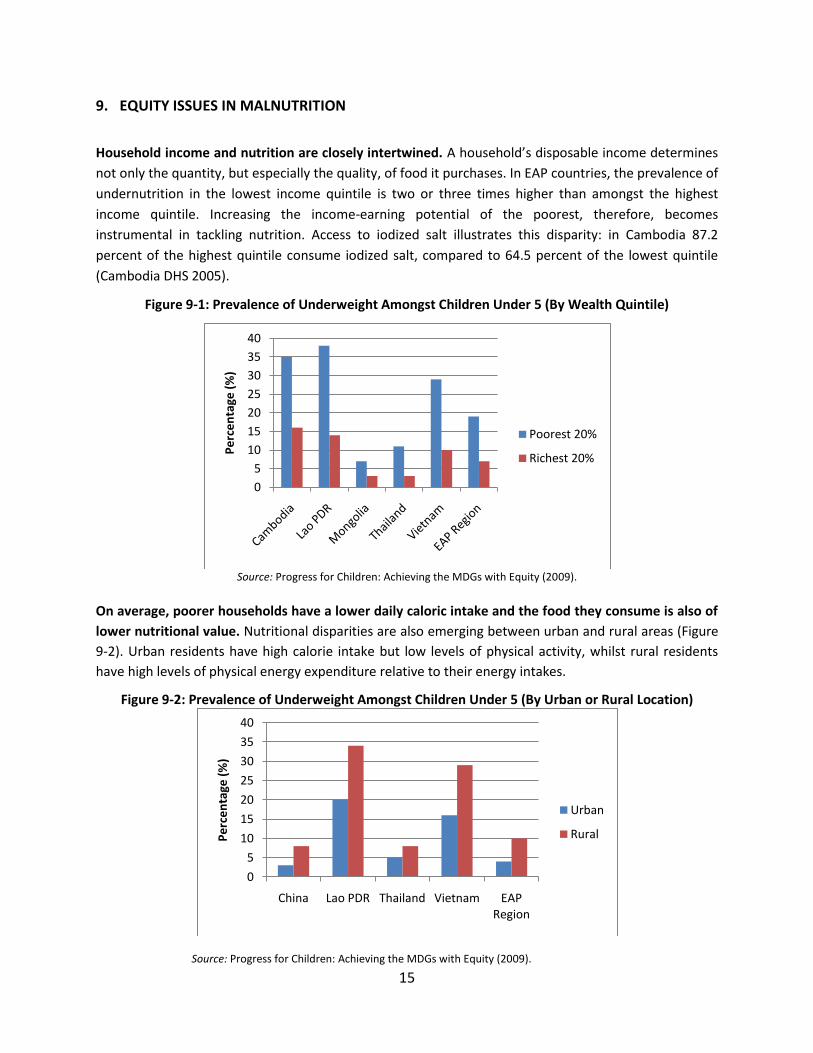
9. EQUITY ISSUES IN MALNUTRITION
Household income and nutrition are closely intertwined. A household’s disposable income determines
not only the quantity, but especially the quality, of food it purchases. In EAP countries, the prevalence of
undernutrition in the lowest income quintile is two or three times higher than amongst the highest
income quintile. Increasing the income-earning potential of the poorest, therefore, becomes
instrumental in tackling nutrition. Access to iodized salt illustrates this disparity: in Cambodia 87.2
percent of the highest quintile consume iodized salt, compared to 64.5 percent of the lowest quintile
(Cambodia DHS 2005).
Figure 9-1: Prevalence of Underweight Amongst Children Under 5 (By Wealth Quintile)
Source: Progress for Children: Achieving the MDGs with Equity (2009).
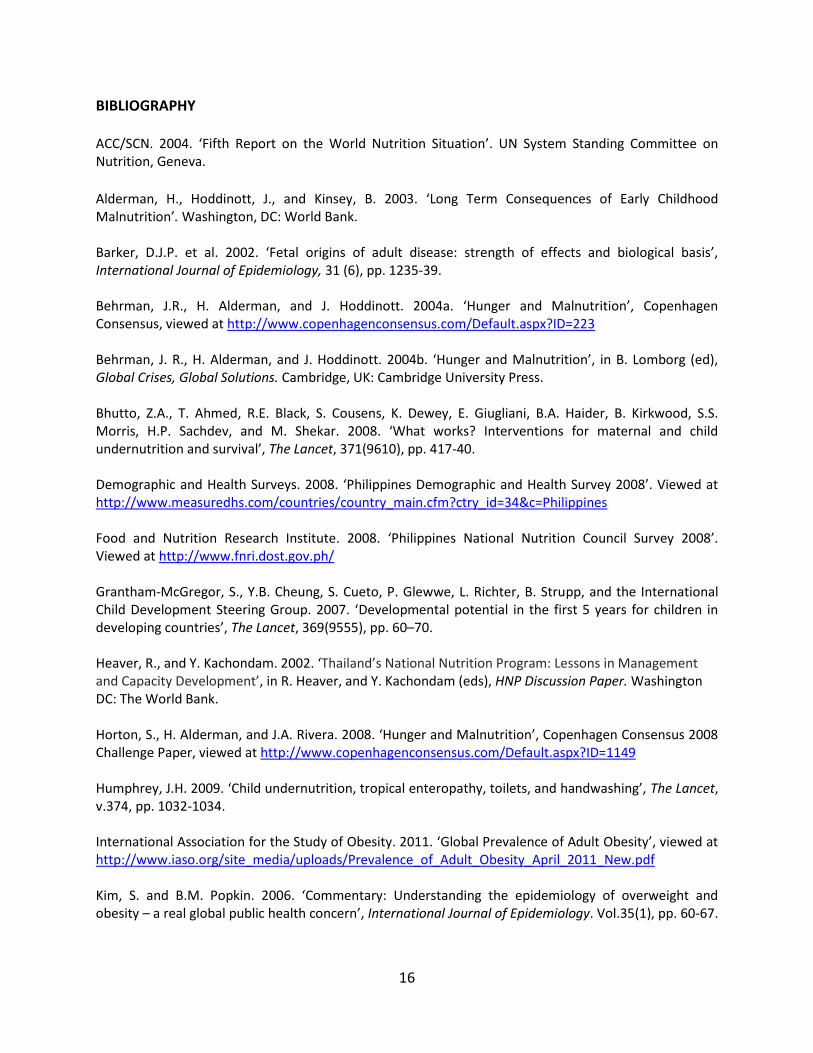
On average, poorer households have a lower daily caloric intake and the food they consume is also of
lower nutritional value. Nutritional disparities are also emerging between urban and rural areas (Figure
9-2). Urban residents have high calorie intake but low levels of physical activity, whilst rural residents
have high levels of physical energy expenditure relative to their energy intakes.
Figure 9-2: Prevalence of Underweight Amongst Children Under 5 (By Urban or Rural Location)
Source: Progress for Children: Achieving the MDGs with Equity (2009).
0
5
10
15
20
25
30
35
40
Pe
rce
nta
ge (
%)
Poorest 20%
Richest 20%
0
5
10
15
20
25
30
35
40
China Lao PDR Thailand Vietnam EAP Region
Pe
rce
nta
ge (
%)
Urban
Rural
16
BIBLIOGRAPHY ACC/SCN. 2004. ‘Fifth Report on the World Nutrition Situation’. UN System Standing Committee on Nutrition, Geneva.
Alderman, H., Hoddinott, J., and Kinsey, B. 2003. ‘Long Term Consequences of Early Childhood Malnutrition’. Washington, DC: World Bank. Barker, D.J.P. et al. 2002. ‘Fetal origins of adult disease: strength of effects and biological basis’, International Journal of Epidemiology, 31 (6), pp. 1235-39. Behrman, J.R., H. Alderman, and J. Hoddinott. 2004a. ‘Hunger and Malnutrition’, Copenhagen Consensus, viewed at http://www.copenhagenconsensus.com/Default.aspx?ID=223 Behrman, J. R., H. Alderman, and J. Hoddinott. 2004b. ‘Hunger and Malnutrition’, in B. Lomborg (ed), Global Crises, Global Solutions. Cambridge, UK: Cambridge University Press. Bhutto, Z.A., T. Ahmed, R.E. Black, S. Cousens, K. Dewey, E. Giugliani, B.A. Haider, B. Kirkwood, S.S. Morris, H.P. Sachdev, and M. Shekar. 2008. ‘What works? Interventions for maternal and child undernutrition and survival’, The Lancet, 371(9610), pp. 417-40. Demographic and Health Surveys. 2008. ‘Philippines Demographic and Health Survey 2008’. Viewed at http://www.measuredhs.com/countries/country_main.cfm?ctry_id=34&c=Philippines Food and Nutrition Research Institute. 2008. ‘Philippines National Nutrition Council Survey 2008’. Viewed at http://www.fnri.dost.gov.ph/ Grantham-McGregor, S., Y.B. Cheung, S. Cueto, P. Glewwe, L. Richter, B. Strupp, and the International Child Development Steering Group. 2007. ‘Developmental potential in the first 5 years for children in developing countries’, The Lancet, 369(9555), pp. 60–70. Heaver, R., and Y. Kachondam. 2002. ‘Thailand’s National Nutrition Program: Lessons in Management and Capacity Development’, in R. Heaver, and Y. Kachondam (eds), HNP Discussion Paper. Washington DC: The World Bank. Horton, S., H. Alderman, and J.A. Rivera. 2008. ‘Hunger and Malnutrition’, Copenhagen Consensus 2008 Challenge Paper, viewed at http://www.copenhagenconsensus.com/Default.aspx?ID=1149 Humphrey, J.H. 2009. ‘Child undernutrition, tropical enteropathy, toilets, and handwashing’, The Lancet, v.374, pp. 1032-1034. International Association for the Study of Obesity. 2011. ‘Global Prevalence of Adult Obesity’, viewed at http://www.iaso.org/site_media/uploads/Prevalence_of_Adult_Obesity_April_2011_New.pdf Kim, S. and B.M. Popkin. 2006. ‘Commentary: Understanding the epidemiology of overweight and obesity – a real global public health concern’, International Journal of Epidemiology. Vol.35(1), pp. 60-67.
17
McGuire, J. 2009. ‘Opportunities to Protect and Enhance Nutrition in the East Asia and Pacific Region’. Background Paper. Washington DC: The World Bank. Natalicchio, M., J. Garrett, M. Mulder-Sibanda, S. Ndegwa, and D. Voorbraak (eds). 2008. ‘Carrots and Sticks: The Political Economy of Nutrition Policy Reforms’, HNP Discussion Paper, Washington DC: The World Bank.
National Institute of Public Health and National Institute of Statistics Phnom Penh, Cambodia and ORC Macro Calverton, Maryland, USA. 2005. ‘Cambodia Demographic Health Survey’, viewed at http://www.measuredhs.com/pubs/pdf/FR185/FR185[April-27-2011].pdf
OECD. 2010. ‘Obesity and the Economics of Prevention: Fit not Fat’. Paris: OECD. The Lancet. 2008. ‘Maternal and Child Undernutrition’, Special Series. UNICEF. 2009. ‘The State of the World’s Children Report: Maternal and Newborn Health’. UNICEF: New York. UNICEF.2009. ‘Progress for Children: Achieving the MDGs with Equity’, viewed at http://www.unicef.org/publications/files/Progress_for_Children-No.9_EN_081710.pdf Waters, E., B. Swinburn, J. Seidell, and R. Uauy. Eds. 2010. ‘Preventing Childhood Obesity: Evidence, Policy and Practice’. Blackwell Publishing: United Kingdom. WHO/SEAPRO. 2008. ‘Reproductive health, child and adolescent health, nutrition, and health for older persons’, in Health in Asia and the Pacific. New Delhi: World Health Organization Regional Offices for South-East Asia and the Western Pacific. WHO. 2008. ‘2008-2013 Action Plan for the Global Strategy for the Prevention and Control of Noncommunicable Diseases’. Geneva: World Health Organization. WHO. 2010a. ‘Nutritional Status of Children under Five and Women in Percentage and Country Transition Status’, viewed at http://www.who.int/nutrition/nlis/en/index.html WHO. 2010b. ‘Global Database on Child Growth and Malnutrition’, viewed at http://www.who.int/nutgrowthdb/en/ WHO. 2010c. ‘WHO Global Database on Anemia’, viewed at http://www.who.int/vmnis/anaemia/en/ WHO. 2010d. ‘WHO Global InfoBase. Global NCDs Indicators’, viewed at https://apps.who.int/infobase/Index.aspx World Bank. 2006. ‘Repositioning Nutrition as Central to Development: A Strategy for Large-Scale Action’. Washington DC: The World Bank. World Bank. 2009. ‘World Development Indicators 2009’. Washington DC: The World Bank.

18
World Bank. 2010. ‘Scaling Up Nutrition: A Framework for Action’. Viewed at http://siteresources.worldbank.org/NUTRITION/Resources/281846-1131636806329/PolicyBriefNutrition.pdf