Embed Size (px)
Citation preview
t:o 00 ...-4
I
Q
Z t-
< en < Z
NASA TN D-1807
TECHNICAL NOTE
D-1807
WIND-TUNNEL MEASUREMENT OF PROPELLER WIDRL-FLUTTER
SPEEDS AND STATIC-STABILITY DERIVATIVES AND
COMPARISON WITH THEORY
By Samuel R. Bland and Robert M. Bennett
Langley Research Center Langley station, Hampton, Va.
NATIONAL AERONAUTICS AND SPACE ADMINISTRATION
WASHINGTON August 1963
https://ntrs.nasa.gov/search.jsp?R=19630009775 2018-06-17T03:59:28+00:00Z
NATIONAL AERONAUTICS AND SPACE ADMINISTRATION
TECHNICAL NOTE D-1807
WIND-TUNNEL MEASURESIENT OF PROPELLER WHIRL-FLUTTER
SPEEDS AND STATIC-STABILIT DEKIVATIVES AND
COMPARISON WITH THEORY
By Samuel R. Bland and Robert M. Bennett
SUMMARY
Results of an experimental invest igat ion of propel ler whirl f l u t t e r are presented f o r a model consisting of an isolated, r i g i d system of propel ler and simulated power plant mounted with f l e x i b i l i t y i n p i tch and yaw on a r i g i d s t ing . A range of propel ler blade angles, r e s t r a i n t s t i f fnesses , and r e s t r a i n t damping coeff ic ients w a s investigated f o r a system symmetrical i n p i t ch and yaw with a windmilling propel ler . Measurements of t h e s t a t i c - s t a b i l i t y der ivat ives were a l s o made by using a simple balance and were compared with two sets of t heo re t i ca l der ivat ives . Whirl-flutter calculations were made with the theo re t i ca l and m e a s - ured der ivat ives . Some l imited results were obtained f o r t h e whir l f l u t t e r of t h e model mounted on a cant i lever semispan wing.
The measured whi r l - f lu t te r speeds and frequencies of t he i so l a t ed model were i n very good agreement with those predicted by calculat ions i n which measured der ivat ives and viscous damping were used. This agreement w a s bet ter than t h a t obtained by using s t ruc tu ra l damping. Predicted whi r l - f lu t te r speeds f o r t h e i so la ted model were lower when theore t ica l s t a b i l i t y der ivat ives w e r e used than when measured der ivat ives were used. The theo re t i ca l and experimental s t a t i c - s t a b i l i t y der ivat ives exhibited the same trends, but i n cer ta in instances d i f - fered appreciably i n magnitude. t h e measured whi r l - f lu t te r boundary f o r the one configuration considered.
There w a s l i t t l e e f f ec t of t h e semispan wing on
INTRODUCTION
It i s w e l l known t h a t a combination of propel ler and power plant can develop a dynamic in s t ab i l i t y , generplly termed propel ler whirl f l u t t e r o r autoprecession, i n which t h e hub wobbles o r executes a whirling motion. invest igat ions (refs. 1 t o 4 ) t he f l u t t e r boundaries of an i so la ted nacel le have been invest igated by developing t h e equations of motion with calculated s t a b i l i t y der ivat ives f o r t he aerodynamics of t h e propeller, and by making parametric t rend s tudies from these equations. However, there have been no comparable experimental data avai lable f o r ve r i f i ca t ion of these ana ly t ica l s tudies .
In several ana ly t ica l
For example, i n
reference 2 a comparison of t h e theore t ica l r e su l t s with t h e f l u t t e r data f o r a four-engine model showed comparable t rends but poor quant i ta t ive agreement, perhaps as a result of t h e e f f ec t s of t he complete model on t h e wh i r l - f lu t t e r boundaries. Therefore, t h e present invest igat ion was undertaken with two objectives:
1. To obtain experimental whi r l - f lu t te r boundaries on a simple system t h a t i s readi ly amenable t o analysis, i n order t o evaluate exis t ing propeller-whirl theories .
2. To measure, on t h e same system, some of t he propel ler aerodynamic deriva- t i v e s required t o predict whir l f l u t t e r , i n order t o evaluate methods f o r cal- culating the s t a b i l i t y der ivat ives of t h e propel ler .
Also, t h e e f f ec t s of a wing on t h e f l u t t e r boundary are indicated by a com- parison with some l imited results obtained with t h e model mounted on a cant i lever semispan wing.
Measurements of t h e s t a t i c aerodynamic s t a b i l i t y der ivat ives of t h e wind- m i l l i n g propel ler were made by using a simple balance and w e r e compared w i t h the theory of reference 3 and t h e theory of reference 5 as applied i n reference 2. Whir l - f lut ter speeds and frequencies were measured f o r a combination of a wind- m i l l i n g propel ler and simulated power plant which w a s mounted on a s t ing by means of a spring-restrained gimbal. s t i f fnesses , and r e s t r a i n t damping coeff ic ients w a s invest igated f o r a system symmetrical i n p i t ch and yaw. theo re t i ca l der ivat ives ( theor ies of refs. 3 and 5 ) and measured der ivat ives were compared with experiment.
A range of propel ler blade angles, r e s t r a i n t
Whir l - f lut ter calculations m a d e with both sets of
SYMBOLS
A propeller-blade aspect r a t i o
b propeller-blade sect ion chord, f t
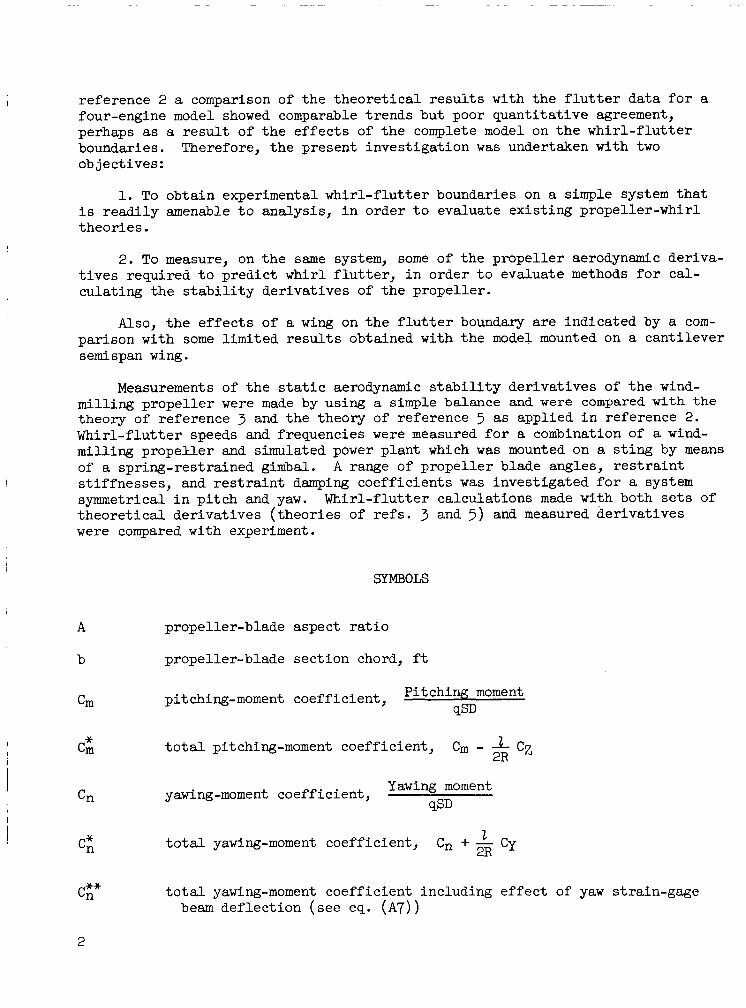
Cm Pitching moment pitching-moment coeff ic ient ,
qSD
I t o t a l pitching-moment coeff ic ient , Cm - - I cz Cm
* 2R
Cn yawing-moment coeff ic ient , Yawing moment
9SD
2 2R
t o t a l yawing-moment coefficient, Cn + - Cy
I Ctf" t o t a l yawing-moment coeff ic ient including e f f ec t of yaw strain-gage
bean def lect ion ( see eq. ( A 7 ) )
2
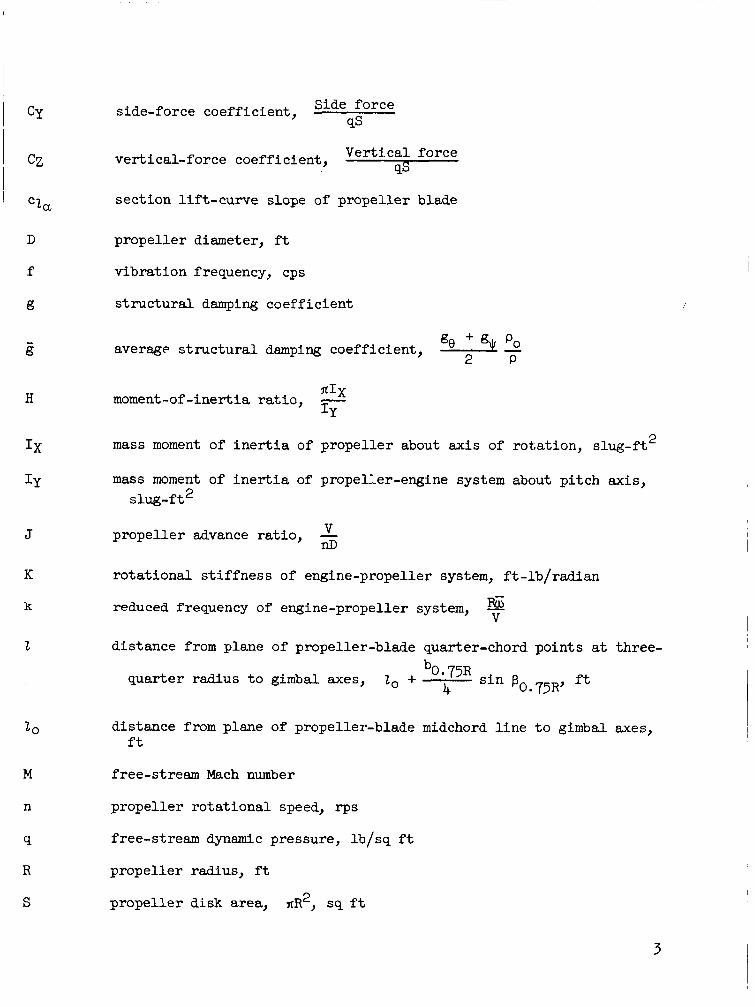
CY
CZ
cla
D
f
Q
- g
H
IX
IY
J
K
k
2
20
M
n
9
R
S
Side force qs
Verti.ca1 force ss
side-force coeff ic ient , -
ver t ica l - force coeff ic ient ,
sect ion l i f t -curve slope of propel ler blade
propel ler diameter, f t
v ibra t ion frequency, cps
s t ruc tu ra l damping coef f ic ien t
ge + % p o 2 P average s t r u c t u r a l damping coeff ic ient ,
f i I X *Y
moment-of - i n e r t i a ra t io , - 2 mass moment of i n e r t i a of propel le r about axis of rotat ion, s lug- f t
mass moment of i n e r t i a of propeller-engine system about p i tch axis, slug- f t 2
V propel ler advance r a t io , - nD
ro t a t iona l s t i f f n e s s of engine-propeller system, f t - lb / rad ian
reduced frequency of engine-propeller system, v dis tance from plane of propeller-blade quarter-chord. points at three-
0.75R’ f t 4 quarter radius t o gimbal axes, 2, +
distance from plane of propeller-blade midchord l i n e t o gimbal axes, f t
free-stream Mach number
propel ler ro t a t iona l speed, r p s
free-stream dynamic pressure, I l J / s q f t
propel ler radius, f t
propel le r disk area, zR2, sq f t
3
PO
6
5
0
K
I h
P
PO
7
, w
- w
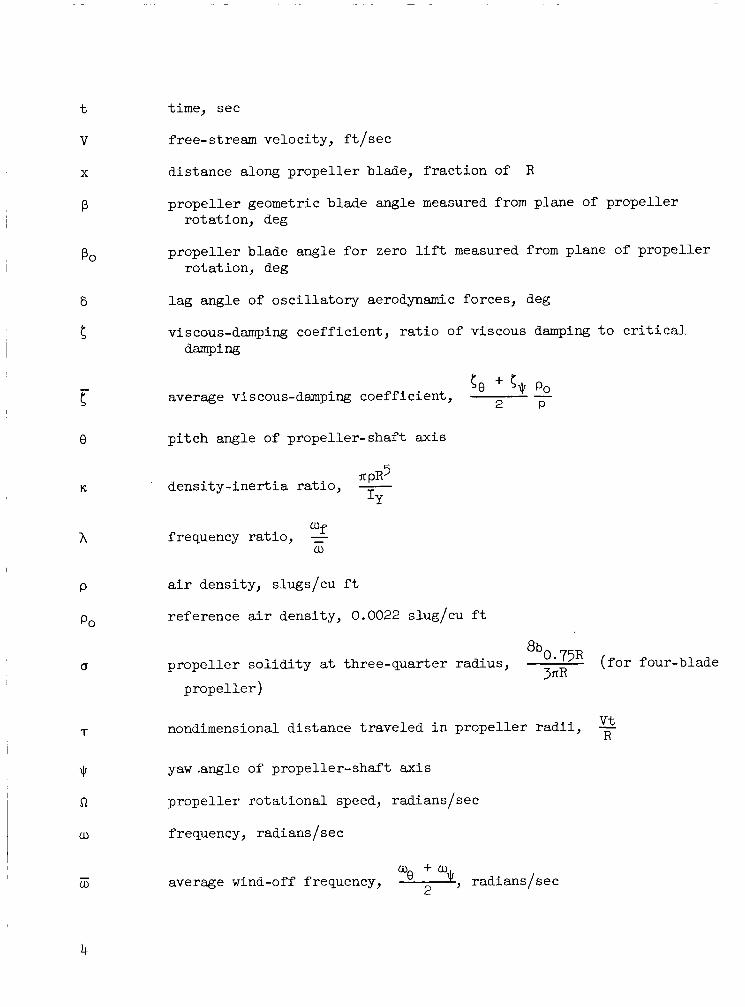
time, sec
free-stream velocity, f t / s e c
distance along propel ler blade, f rac t ion of R
propel ler geometric blade angle measured from plane of propel ler rotat ion, deg
propel ler blade angle f o r zero l i f t measured from plane of propel ler rotation, deg
l ag angle of osc i l la tory aerodynamic forces, deg
viscous-damping coeff ic ient , r a t i o of viscous damping t o c r i t i c a l damping
(0 + - Po 2 P
average viscous-damping coeff ic ient ,
p i t ch angle of propeller-shaft axis
II pR5 dens i ty- iner t ia r a t io , -
=Y
W f frequency ra t io , = w
a i r density, slugs/cu f t
reference a i r density, 0.0022 slug/cu f t
propel ler s o l i d i t y a t three-quarter radius, 8b0* 75R ( f o r f our-blade 3fiR
p rope l le r )
V t - R
nondimensional distance t raveled i n propel ler r ad i i ,
yaw .angle of propeller-shaft axis
propel ler ro ta t iona l speed, radians/sec
frequency, radians / s e c
average wind-off frequency, radians/sec
Subscript s :
0-75R three-quarter propel ler radius
f condition at whirl f l u t t e r
i = 1,2,3 wing vibrat ion modes
9 d i f fe ren t ia t ion with respect t o 8 '
r d i f fe ren t ia t ion with respect t o $ '
8 p i tch d i rec t ion
yaw di rec t ion
Primes denote d i f f e ren t i a t ion with respect t o T.
P a r t i a l der ivat ives are denoted by double subscripts; f o r example:
APPARATUS
Tunnel.
The Langley transonic dynamics tunnel is a slot ted- throat , variable- pressure, single-return wind tunnel having a tes t section 16 f e e t square (with cropped corners). It i s capable of operation at Mach numbers up t o 1 .2 and a t stagnation pressures from near vacuum t o s l i g h t l y above atmospheric. o r Freon-12 can be used as a tes t medium. unobstructed viewing of t h e model.
Ei ther a i r Large windows are provided f o r close,
Models
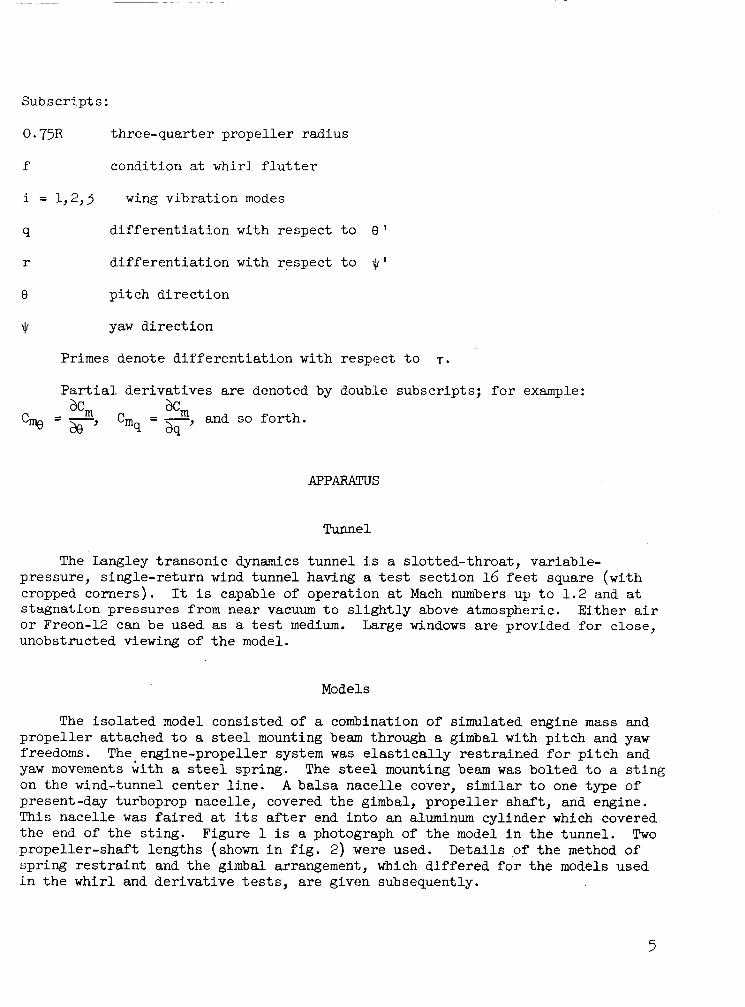
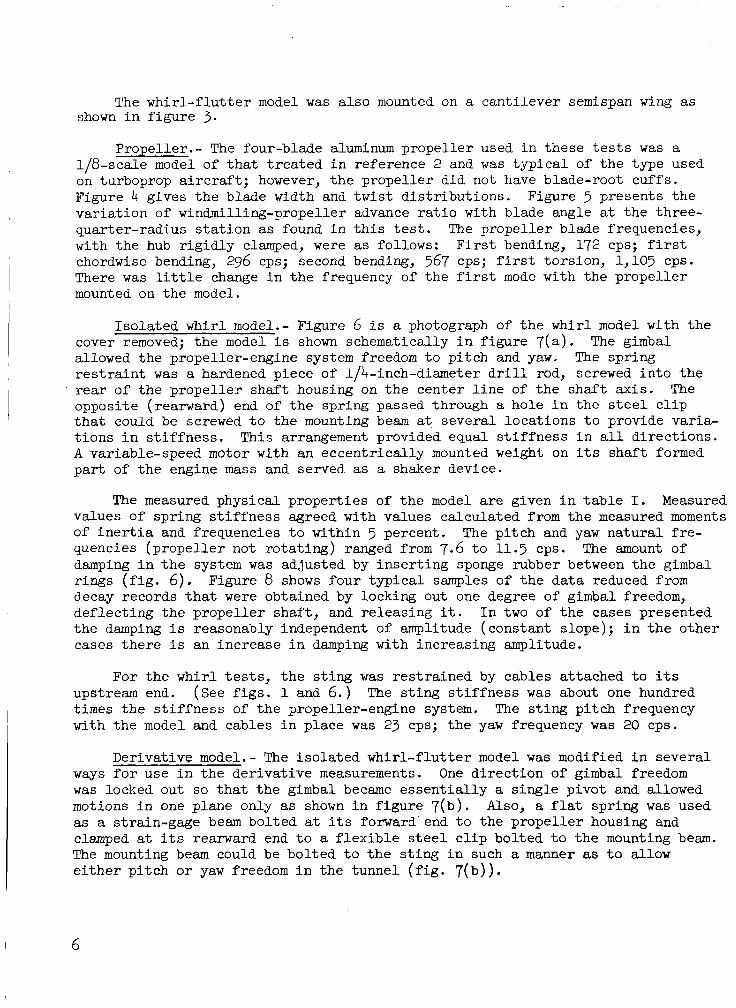
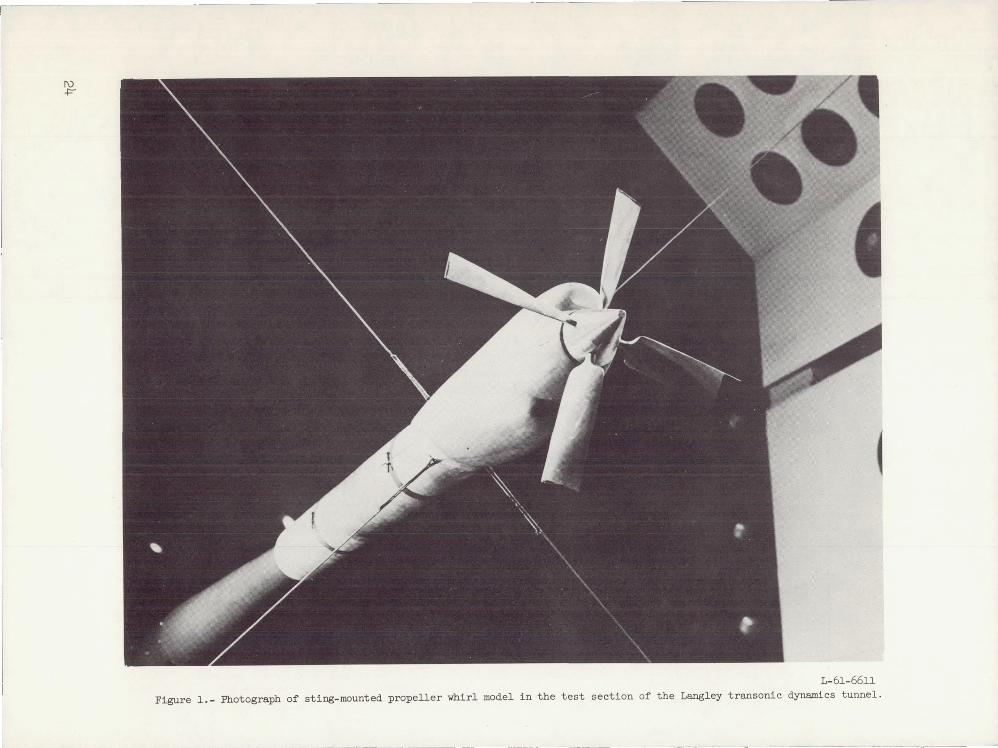
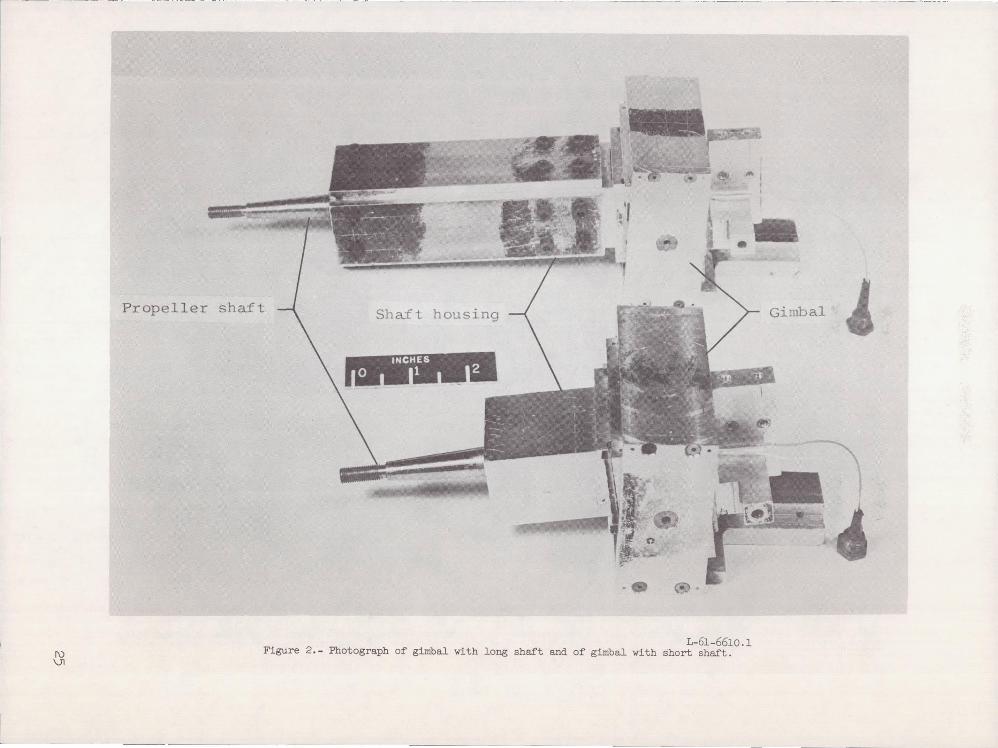
The i so la ted model consisted of a combination of simulated engine mass and propel ler attached t o a s t e e l mounting beam through a gimbal with p i tch and yaw freedoms. The engine-propeller system w a s e l a s t i c a l l y res t ra ined f o r p i tch and yaw movements k t h a s t e e l spring. on the wind-tunnel center l i n e . present -day turboprop nacelle, covered t h e gimbal, propel ler shaf t , and engine. This nacelle w a s f a i r ed at i t s after end i n t o an aluminum cylinder which covered the end of t he s t ing. Figure 1 i s a photograph of t h e model i n t h e tunnel. Two propeller-shaft lengths (shown i n f i g . 2) were used. spring r e s t r a i n t and the gimbal arrangement;, which d i f fe red f o r the models used i n t h e whir l and der ivat ive t e s t s , a re given subsequently.
The s t e e l mounting beam w a s bol ted t o a s t ing A balsa nacel le cover, similar t o one type of
Details of t he method of
5
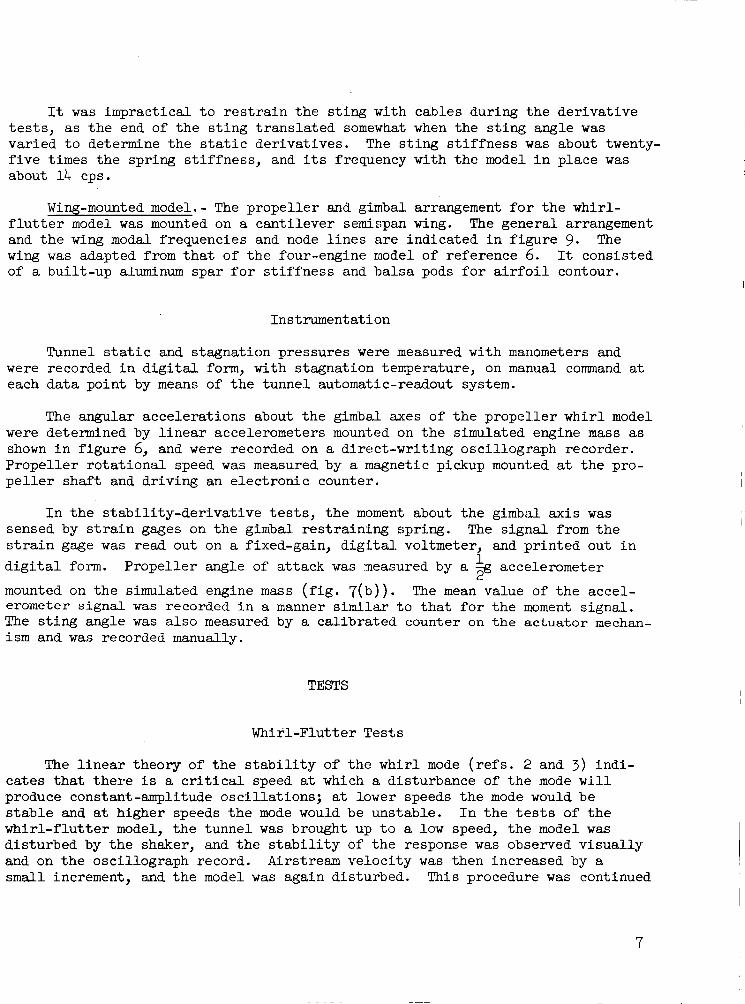
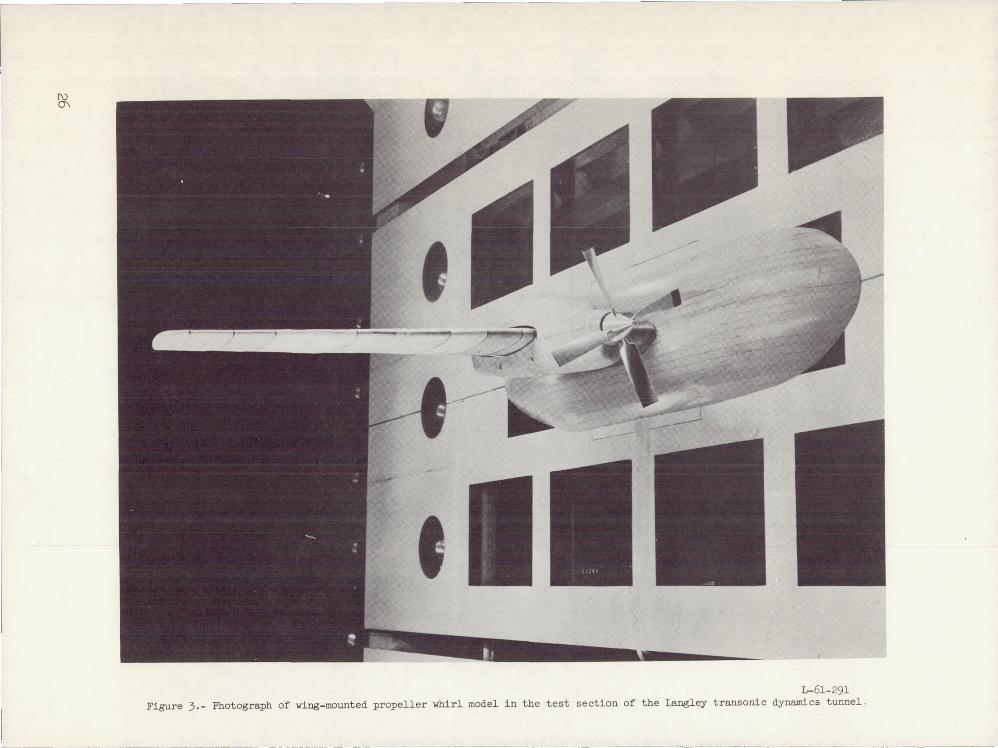
I The whir l - f lu t te r model w a s a l so mounted on a cant i lever semispan wing as
shown i n f igure 3 .
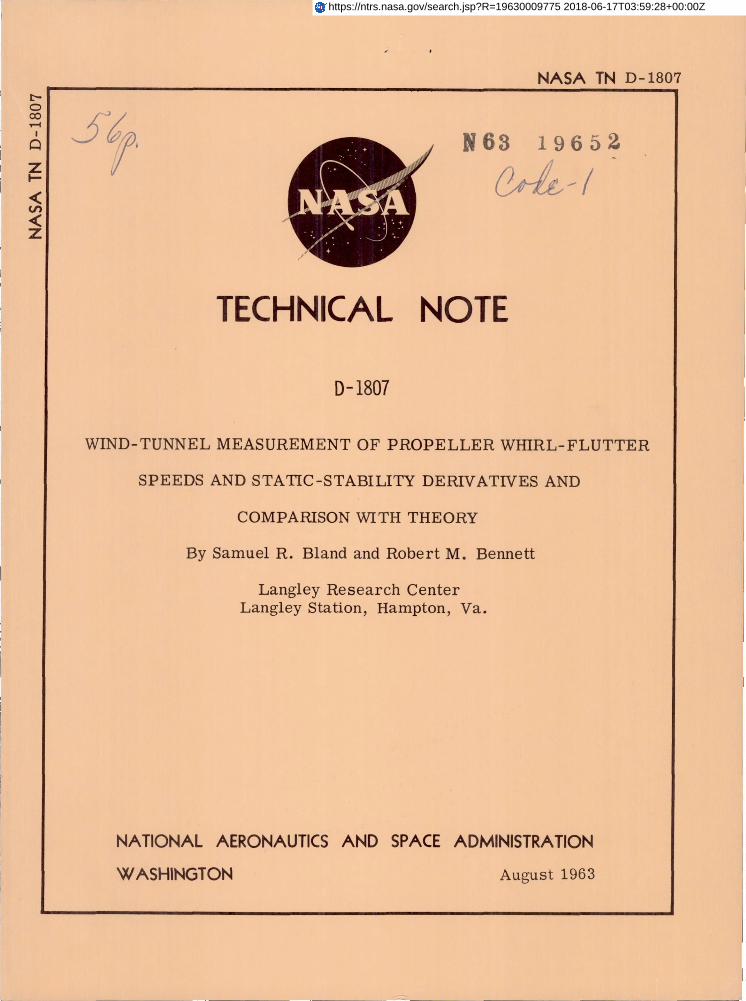
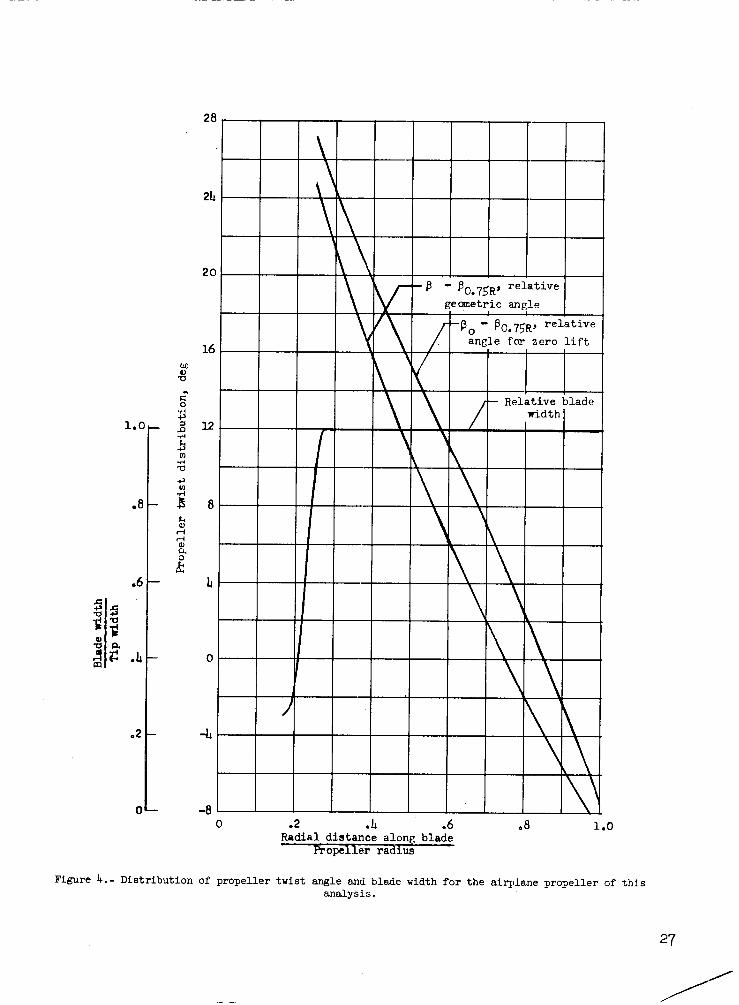
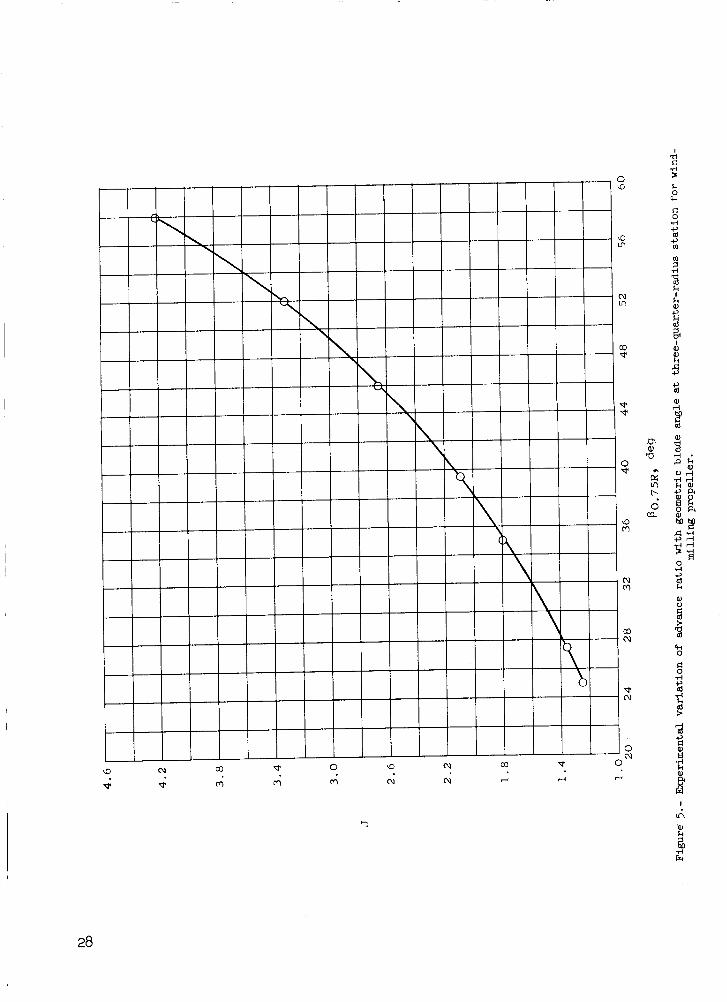
Propeller.- The four-blade aluminum propel ler used i n these t e s t s w a s a 1/8-scale model of t h a t t r ea t ed i n reference 2 and w a s typ ica l of t he type used on turboprop a i r c ra f t ; however, t h e propel ler did not have blade-root cuffs . Figure 4 gives t h e blade width and t w i s t d i s t r ibu t ions . var ia t ion of windmilling-propeller advance r a t i o with blade angle at the three- quarter-radius s t a t ion as found i n t h i s test. The propel ler blade frequencies, with the hub r ig id ly clamped, were as follows: F i r s t bending, 172 cps; first chordwise bending, 296 cps; second bending, 567 cps; first torsion, 1,105 cps. There w a s l i t t l e change i n t h e frequency of t he f irst mode with the propel ler mounted on the model.
Figure 5 presents t he
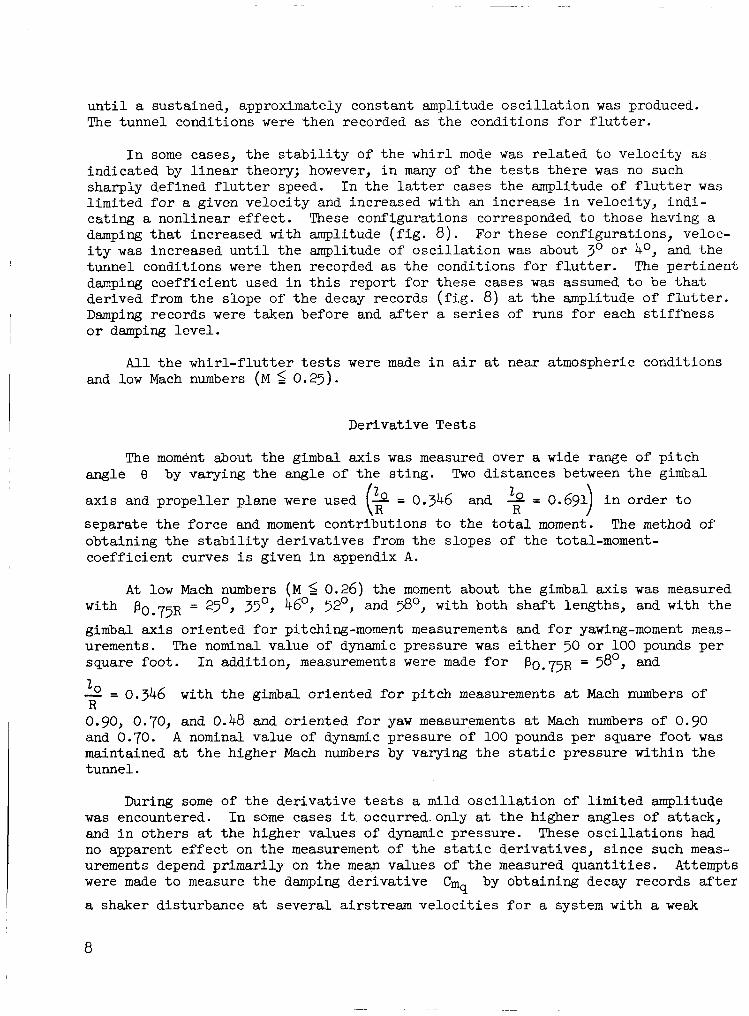
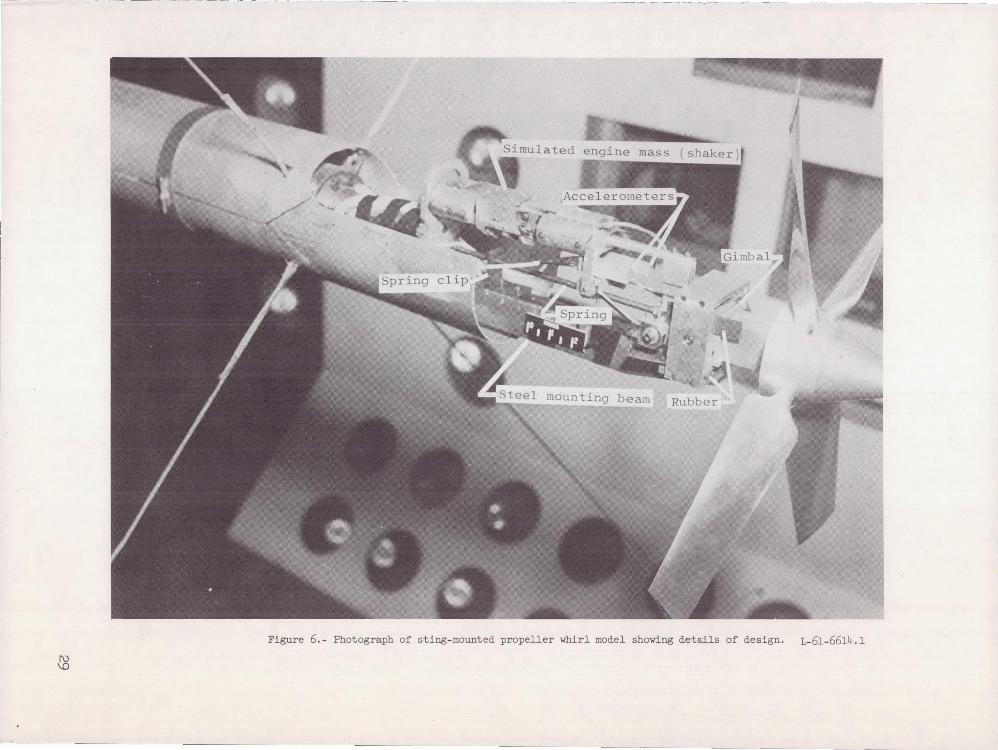
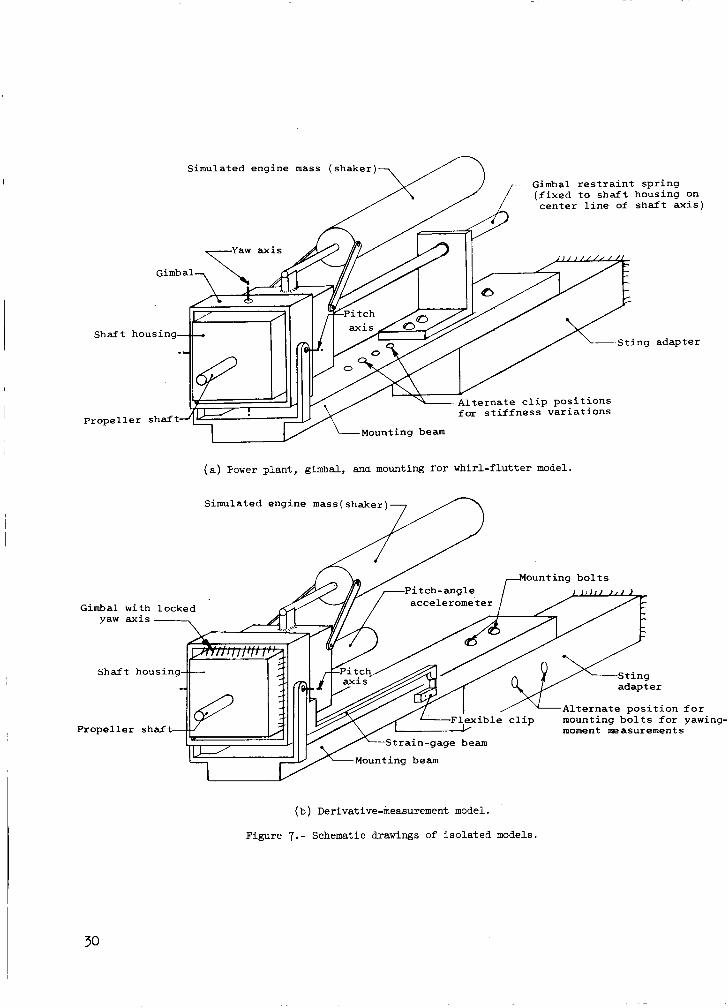
I so la ted whirl model.- Figure 6 i s a photograph of t h e whirl model with the cover removed; t h e model i s shown schematically i n f igure 7(a) . allowed the propeller-engine system freedom t o p i tch and yaw. The spring r e s t r a i n t w a s a hardened piece of l/k-inch-diameter d r i l l rod, screwed in to the rear of the propel ler shaf t housing on t h e center l i n e of t he shaf t axis. opposite (rearward) end of t h e spring passed through a hole i n t h e s t e e l c l i p that could be screwed t o the mounting beam at several locat ions t o provide varia- t i ons i n s t i f fnes s . This arrangement provided equal s t i f f n e s s i n a l l direct ions. A variable-speed motor with an eccentr ical ly mounted weight on i t s shaf t formed pa r t of t h e engine mass and served as a shaker device.
The gimbal
The
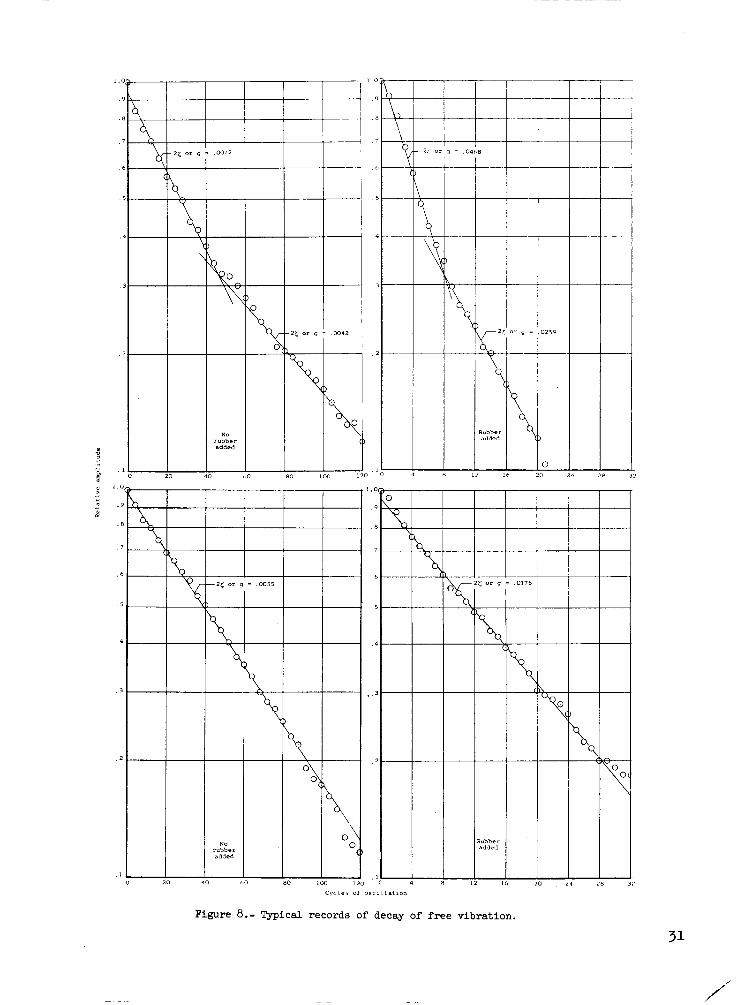
The measured physical propert ies of t h e model a re given i n table I. Measured values of spring s t i f f n e s s agreed with values calculated from t h e measured moments of i n e r t i a and frequencies t o within 5 percent. The p i t ch and yaw na tura l f r e - quencies (propel le r not ro ta t ing) ranged from 7.6 t o 11.3 cps. The amount of damping i n t h e system w a s adjusted by inser t ing sponge rubber between the gimbal rings ( f i g . 6). Figure 8 shows four typ ica l samples of t h e data reduced from decay records t h a t were obtained by locking out one degree of gimbal freedom, def lect ing the propel ler shaf t , and releasing it. I n two of t h e cases presented t h e damping i s reasonably independent of amplitude (constant slope); i n t h e other cases there is an increase i n damping with increasing amplitude.
For t h e whirl tests, t h e s t i ng w a s res t ra ined by cables attached t o i t s upstream end. (See f i g s . 1 and 6.) The s t ing s t i f f n e s s w a s about one hundred times t h e s t i f f n e s s of t h e propeller-engine system. The sting p i tch frequency with the model and cables i n place w a s 23 cps; t he yaw frequency w a s 20 cps.
Derivative model.- The i so la ted whi r l - f lu t te r model w a s modified i n several ways f o r use i n t h e der ivat ive measurements. w a s locked out so t h a t t he gimbal became es sen t i a l ly a single pivot and allowed motions i n one plane only as shown i n f igure 7(b) . Also, a f la t spring w a s used as a strain-gage beam bolted a t i t s forward'end t o the propel ler housing and clamped a t i ts rearward end t o a f l e x i b l e s t e e l c l i p bolted t o t h e mounting beam. The mounting beam could be bolted t o t h e sting i n such a manner as t o allow e i t h e r p i tch o r yaw freedom i n the tunnel ( f i g . 7 (b ) ) .
One d i rec t ion of gimbal freedom
I 6
It w a s impractical t o r e s t r a in the sting with cables during the der ivat ive t e s t s , as t h e end of t h e s t i ng t rans la ted somewhat when the s t i ng angle w a s varied t o determine the s t a t i c derivatives. The s t ing s t i f f n e s s w a s about twenty- f i v e t i m e s t he spring s t i f fness , and i t s frequency with the model i n place w a s about 14 cps .
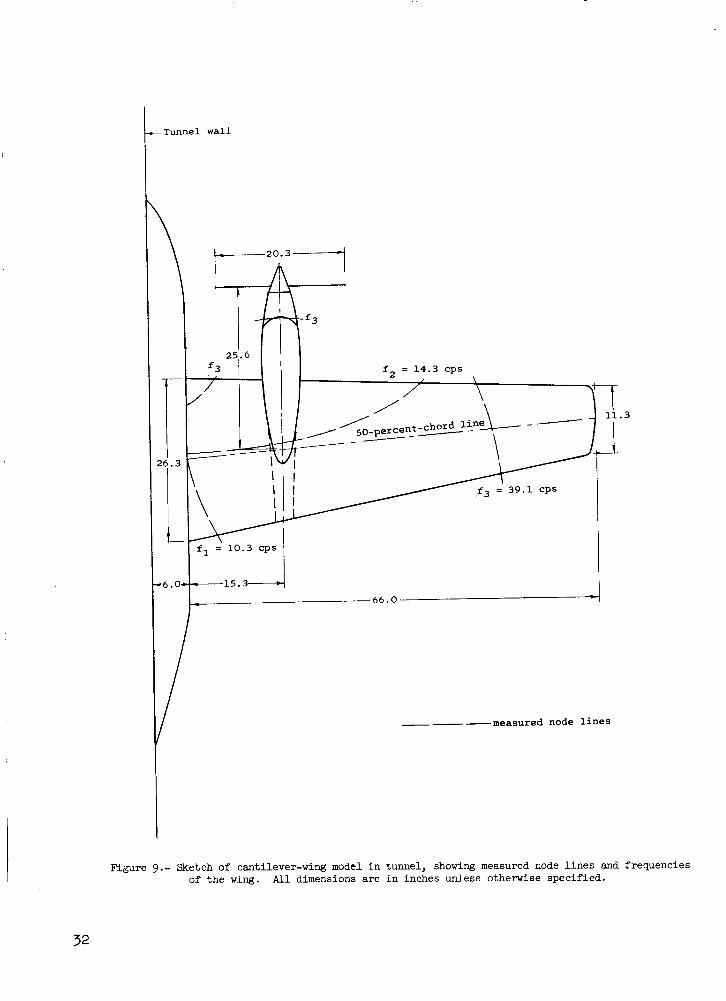
Wing-mounted model.- The propel ler and gimbal arrangement f o r t h e whirl- f l u t t e r model w a s mounted on a cant i lever semispan w i n g . The general arrangement and t h e wing modal frequencies and node l i n e s are indicated i n figure 9. The w i n g w a s adapted from t h a t of t h e four-engine model of reference 6. It consisted of a built-up aluminum spar f o r s t i f f n e s s and ba lsa pods f o r a i r f o i l contour.
Ins t m e n t a t i o n
Tunnel s t a t i c and stagnation pressures were measured with manometers and were recorded i n d i g i t a l form, with stagnation temperature, on manual command at each data point by means of t h e tunnel automatic-readout system.
The angular accelerations about t he gimbal axes of t h e propel ler whir l model w e r e determined by l i n e a r accelerometers mounted on t h e simulated engine mass as shown i n f igure 6, and were recorded on a direct-wri t ing oscil lograph recorder. Propel ler ro t a t iona l speed w a s measured by a magnetic pickup mounted at the pro- p e l l e r shaf t and driving an electronic counter.
I n t h e s tab i l i ty -der iva t ive t e s t s , t he moment about t he gimbal axis w a s sensed by s t r a i n gages on the gimbal res t ra ining spring. The s igna l from t h e s t r a i n gage w a s read out on a fixed-gain, d i g i t a l voltmeter, and pr inted out i n
1 d i g i t a l form. Propel ler angle of a t tack w a s measured by a + accelerometer 2
mounted on t h e simulated engine mass ( f i g . 7 ( b ) ) . The mean value of t h e accel- erometer s igna l w a s recorded i n a manner similar t o t h a t f o r t h e moment s ignal . The sting angle was a l so measured by a cal ibrated counter on the actuator mechan- i s m and w a s recorded manually.
Whirl-Flutter Tests
The l i n e a r theory of t h e s t a b i l i t y of t h e whir l mode (refs. 2 and 3) indi- cates t h a t there i s a c r i t i c a l speed at which a disturbance of t h e mode w i l l produce constant-amplitude osc i l la t ions ; a t lower speeds t h e mode would be stable and at higher speeds t h e mode would be unstable. I n t h e tests of t h e whi r l - f lu t te r model, t h e tunnel w a s brought up t o a low speed, t he model w a s disturbed by t h e shaker, and t h e s t a b i l i t y of t h e response w a s observed v isua l ly and on t h e oscil lograph record. s m a l l increment, and t h e model w a s again disturbed. This procedure w a s continued
Airstream veloci ty w a s then increased by a
7
u n t i l a sustained, approximately constant amplitude osc i l l a t ion w a s produced. The tunnel conditions were then recorded as the conditions f o r f l u t t e r .
I n some cases, t he s t a b i l i t y of t he w h i r l mode was re la ted t o veloci ty as indicated by l i n e a r theory; however, i n many of t he t e s t s there w a s no such sharply defined f l u t t e r speed. l imited f o r a given veloci ty and increased w i t h an increase i n velocity, ind i - cating a nonlinear e f fec t . These configurations corresponded t o those having a damping t h a t increased with amplitude ( f i g . 8) . i t y w a s increased u n t i l t he amplitude of o sc i l l a t ion w a s about 3 O or 4O, and the tunnel conditions were then recorded as t h e conditions f o r f l u t t e r . The per t inent damping coeff ic ient used i n t h i s report for these cases w a s assumed t o be t h a t derived from the slope of t h e decay records ( f i g . 8) a t the amplitude of f l u t t e r . Damping records were taken before and a f t e r a se r i e s of runs f o r each s t i f f n e s s o r damping leve l .
I n the l a t t e r cases the amplitude of f l u t t e r w a s
For these configurations, veloc-
A l l t h e whi r l - f lu t te r t e s t s were made i n a i r a t near atmospheric conditions and low Mach numbers ( M 6 0 .25) .
Derivative Tests
The moment about t he gimbal ax is w a s measured over a wide range of p i t ch angle 8 by varying the angle of t h e s t ing . Two distances between t h e gimbal
ax i s and propel ler plane were used (b = 0.346 and 2 = 0.691 i n order t o
separate t h e force and moment contributions t o the t o t a l moment. obtaining the s t a b i l i t y der ivat ives from the slopes of t he total-moment- coeff ic ient curves i s given i n appendix A.
) 2 R R
The method of
A t low Mach numbers ( M 5 0.26) the moment about t h e gimbal ax is w a s measured w i t h P0 .7y = 25', 35', 46O, ?Po, and 3 8 O , w i t h both shaf t lengths, and w i t h t he
gimbal axis oriented f o r pitching-moment measurements and f o r yawing-moment meas- urements. square foot . I n addition, measurements were made f o r
The nominal value of dynamic pressure w a s e i t h e r 50 o r 100 pounds per P 0 . 7 5 ~ = 5 8 O , and
= 0.346 with t h e gimbal or iented f o r p i tch measurements at Mach numbers of R 0.90, 0.70, and 0.48 and oriented f o r yaw measurements at Mach numbers of 0.90 and 0.70. A nominal value of dynamic pressure of 100 pounds per square foot was maintained at t h e higher Mach numbers by varying t h e s t a t i c pressure within t h e tunnel.
During some of the der ivat ive t e s t s a mild osc i l l a t ion of l imited amplitude I n some cases it occurred.only at t h e higher angles of attack,
These osc i l l a t ions had w a s encountered. and i n others at t h e higher values of dynamic pressure. no apparent e f f ec t on t h e measurement of the s t a t i c derivatives, since such meas- urements depend primarily on t h e mean values of t h e measured quant i t ies . were made t o measure the damping der ivat ive
a shaker disturbance a t several airstream ve loc i t i e s f o r a system w i t h a weak
Attempts by obtaining decay records after Cmq
8
p i t ch spring and no yaw freedom. However, again limited-amplitude osc i l l a t ions were obtained, and thus the equation f o r a s ingle degree of freedom. ( A method of estimating Cmq from whir l - f lu t te r speeds i s described subsequently.) ness f o r t h i s condition ( s t i n g t i ed down with cables) w a s approximately 1 t o 100, whereas f o r t h e s t a t i c der ivat ive t e s t s ( s t i ng not t i e d down with cables) t h e s t i f f n e s s r a t i o w a s approximately 1 t o 25. The l i n e a r two-degree-of-freedom analysis of reference 2 f o r a pivoting simple system does not predict an ins ta - b i l i t y a t t he speeds of t h e der ivat ive t e s t s f o r t h e s t i f fnes ses involved, and the explanation of these limited-amplitude osc i l l a t ions i s unknown at the present time.
Cmq could not be determined i n a simple manner by using
The r a t i o of p i tch t o yaw s t i f f -
RESULTS AND DISCTJSSION
Presentation of Results
The r e s u l t s a re presented and discussed i n three par t s . i c a l and experimental s t a b i l i t y der ivat ives a re considered ( f ig s . 10 t o 13) because they a re required as an input f o r t he whi r l - f lu t te r calculations. t h e measured and calculated whi r l - f lu t te r bou.ndaries and frequencies f o r t he i so l a t ed nacel le are considered ( f ig s . 14 t o 20 and table 11). Third, some wing e f f e c t s a r e discussed by comparing t h e measured f l u t t e r boundaries f o r t h e iso- l a t e d nacel le with l imited r e su l t s f o r t h e wing-mounted nacelle ( f i g . 21 and table 11).
F i r s t , t h e theoret-
Second,
Propel ler S t a b i l i t y Derivatives
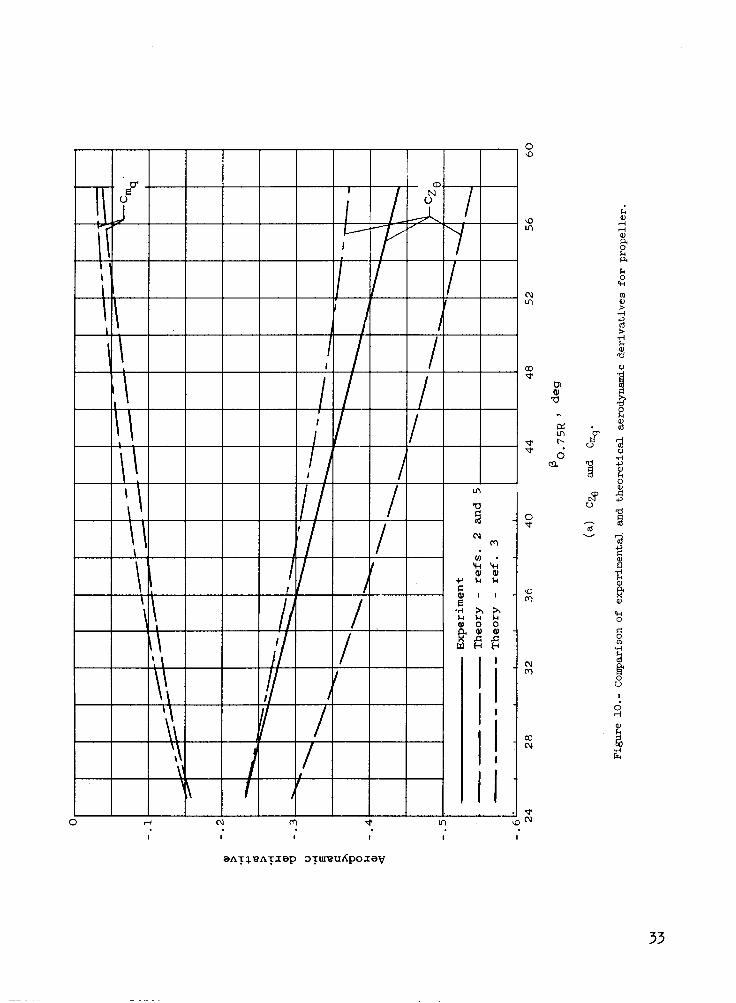
The experimentally determined s t a t i c - s t a b i l i t y der ivat ives ( M 5 0.26) a re compared i n f igure 10 with der ivat ives calculated by the method of reference 5 (incorporating the lag terms of r e f . e ) , and w i t h the strip theory of refer- ence 3. The der ivat ives of f igure 10 are derived from the faired curves of f ig - ure 11 by means of equations ( A 4 ) , (A5) , (AS) , and (AlO) of appendix A. The theo re t i ca l values of Cw ( f i g . 1O(c)) were computed from CmJ, t an 6, which
can be derived i n a manner similar t o t h e der ivat ion of i n reference 2..
A s previously discussed, no experimental values of Cmq were determined. C q ,
Application of theory.- I n t h e appl icat ion of t h e theory of' reference 5 t o t h e windmilling propeller, t h e e f fec t ive l o c a l he l ix angle w a s assumed t o be given by V/RRx. w e r e assumed t o be negligible. A sect ion l i f t -curve slope of ~ I I , fineness r a t i o of 6.0 f o r t h e spinner-nacelle combination, and a r a t i o of spinner radius t o propel ler radius of 0.181 were used i n evaluating t h e in tegra ls over t he portion of t h e blade having l i f t i n g sections (outer three-quarters of t h e radius) .
That is, momentum losses and interact ions between the blades
The der ivat ives calculated by t h e theory of reference 3 for windmilling propel lers are somewhat simpler t o evaluate than those of t he theory of
9
l I I L
reference 5. Since these derivatives are directly proportional to
aspect-ratio correction factor A (developed for wings) was used as sug-A + 2
gested in reference 3. Evaluating A over the outer t~ree-quarters of the radius yields a value of 3.47 for A and a correction factor o~ 0.635. The integrals of this method (eqs. (B9) of ref. 3) were also evaluated over the outer threequarters of the radius.
Comparison of theory and experiment.- In general} the retical derivatives correspond to the experimental trends} differ considerably in certain cases. The values of CZe
trends of the theobut the magnitudes (fig. 10(a)) predicted
by the method of reference 5 are about 25 percent larger than the experimental ones} while the values predicted by the method of reference 3 are in agreement at low blade angles but are smaller by 15 ~ercent at the higher blade angles. In references 5 and 7 the data cited were within ±10 percent of values of CZe
calculated by the method of reference 5. The difference in the present case might be attributed to experimental inaccuracy (estimated to be ±10 percent)} to the value 2rt used for section lift-curve slope (section data were not available for this propeller)} or to the peculiar geometry of the inboard portion of the propeller.
The values of Cmq (fig. 10(a)) computed from the two theories have the
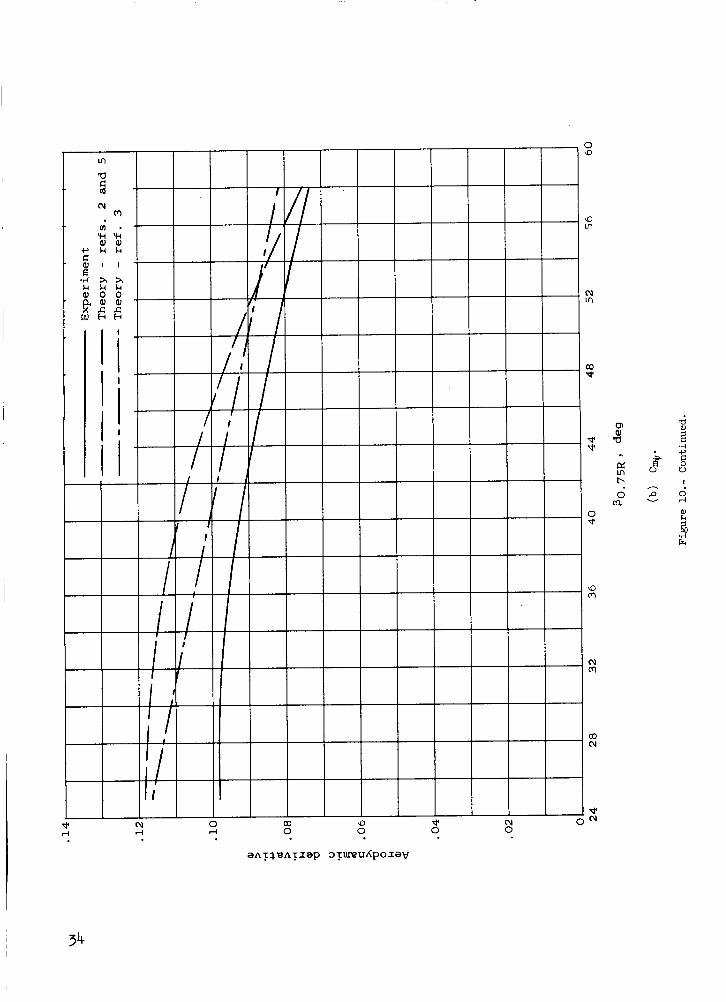
same trend} but the values predicted by the theory of reference 3 are somewhat smaller. Both theories give results for C~ that are in good-to-fair agree-
ment with experimental results over the blade-angle range (fig. lOeb))} but are 2 to 20 percent higher. The experimental accuracy of this derivative is estimated to be approximately ±10 percent also.
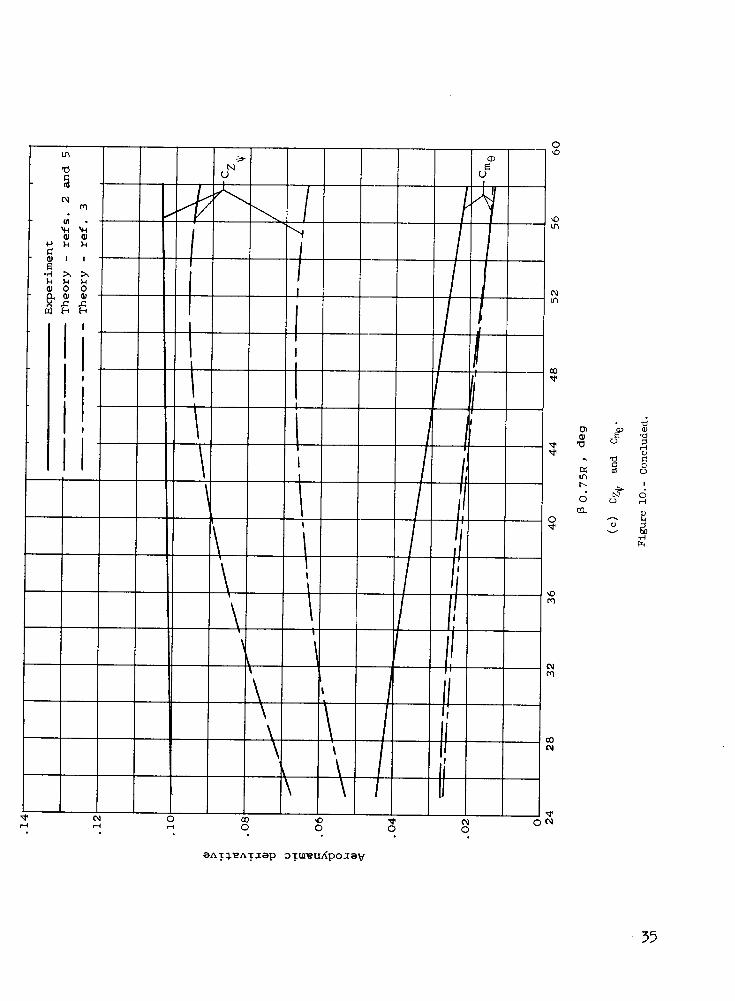
The theoretical values of Czw and Cms (fig. 10(c)) are lower than experiment and are in fair-to-poor agreement. The estimated experimental accuracy is about ±10 percent for Crne and ±25 percent for C~. The theoretical expres-
sions for Crne and C~ (Crne = C~ tan 0; C~ = -CZe tan c)} as applied in ref
erences 2 and 3} are approximations and would not be expected to yield accurate results.
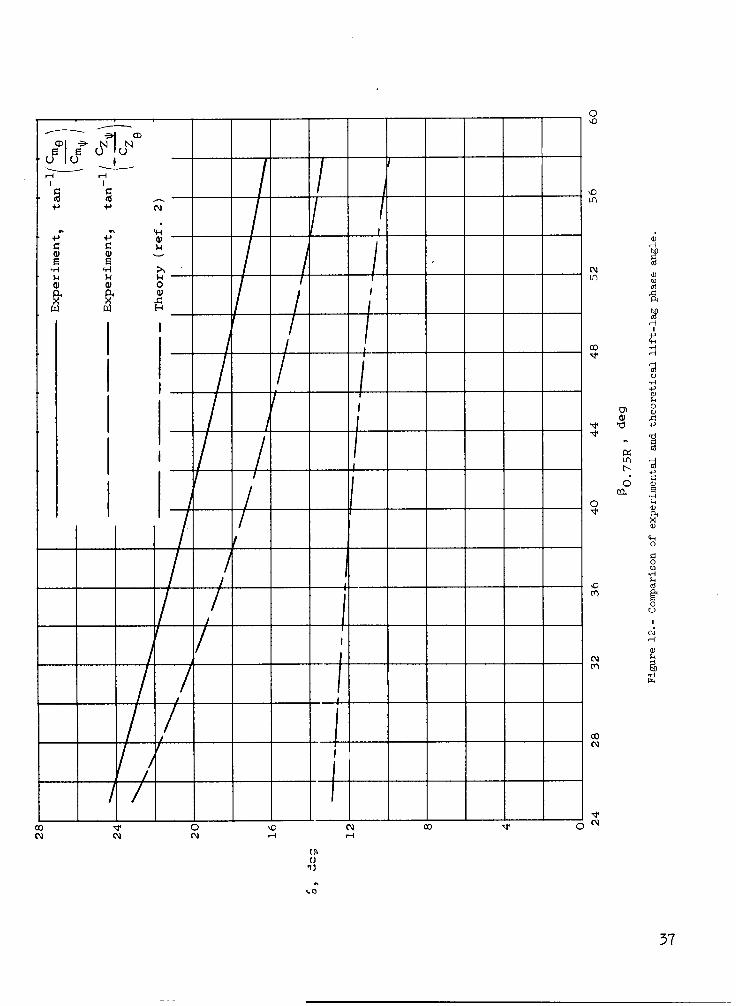
A further indication of the error in the unsteady-flow lift-lag phase angle o} as obtained in references 2 and 3} can be seen in figure 12 by comparing the phase angles derived from the experimental derivatives with those derived from the theory of reference 2. Although the phase angles derived from ' the experimental force and moment relations should agree} the difference between I the two experimental curves is within the estimated accuracies of the derivatives. I In view of the previously cited accuracy of CZw' ±25 ~ercent, the phase angles \
derived from the moment relations are considered more nearly accurate.
The flutter calculations of this report are based on the total moment
deri vati ves:
10
2 c& = C% - - 2R czQ
cmJr * = -c& = c9 - & c q
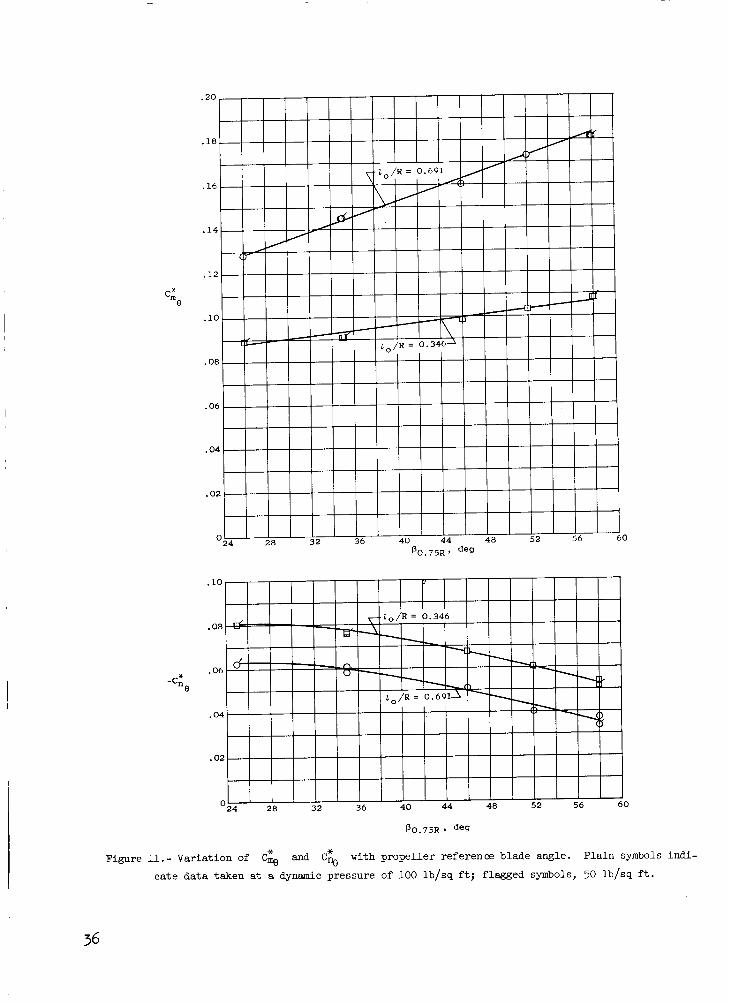
These experimental t o t a l moment coeff ic ients a r e shown i n f igure 11. The e s t i - mated accuracies f o r these quant i t ies are +5 percent f o r C&
f o r C*
and EL0 percent
"e'
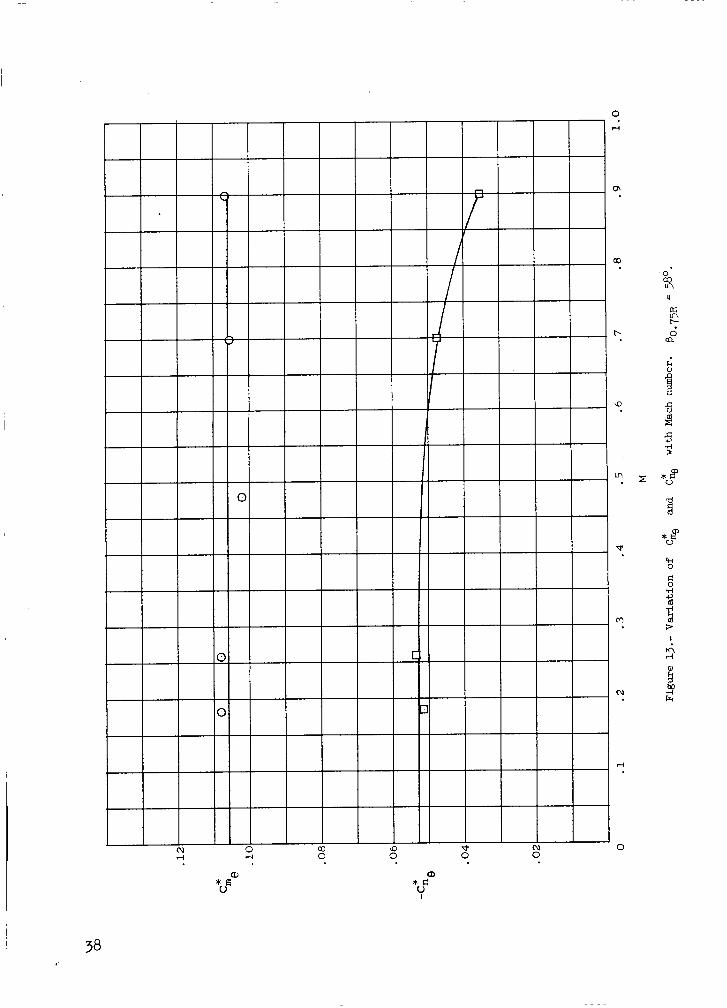
Mach number effects . - The e f f ec t of Mach number on t h e t o t a l moment coeffi- = 38' i s shown i n f igure 13. L i t t l e e f f ec t c ien ts C G and Cne f o r p
i s indicated f o r C&, but appears t o decrease with increasing Mach number.
I n contrast , theory would predict an increase i n , these der ivat ives given approxi-
mately by t h e Prandtl-Glauert correction f ac to r
numbers.
* 0 75R *
Cne
at the lower Mach d r - 2
Propel ler Whir.'l F l u t t e r
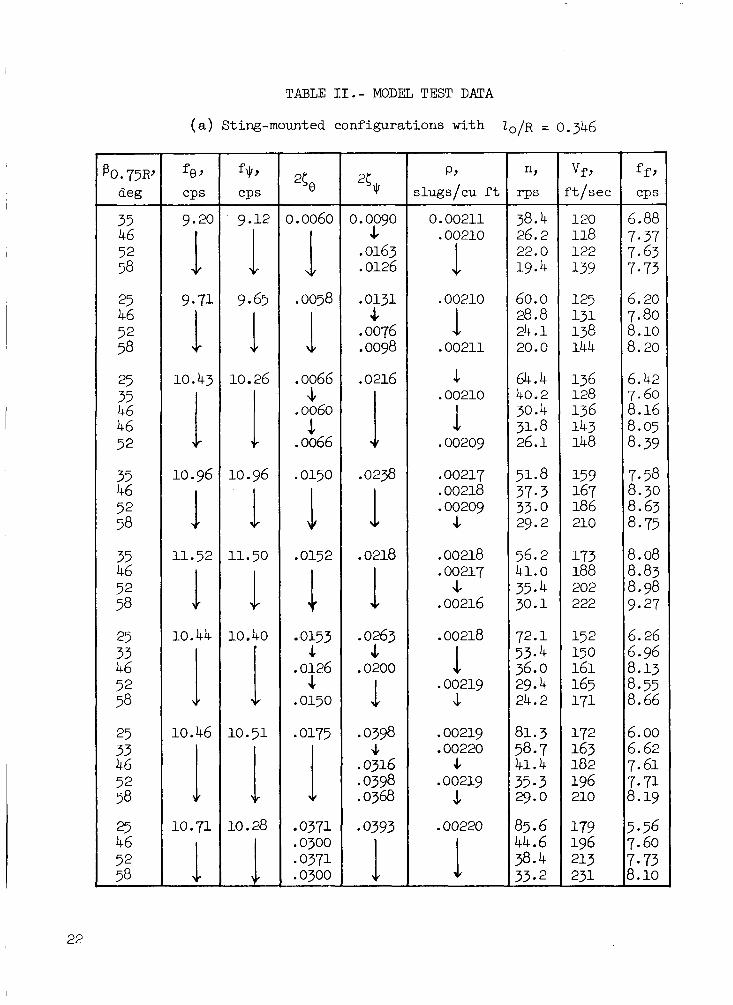
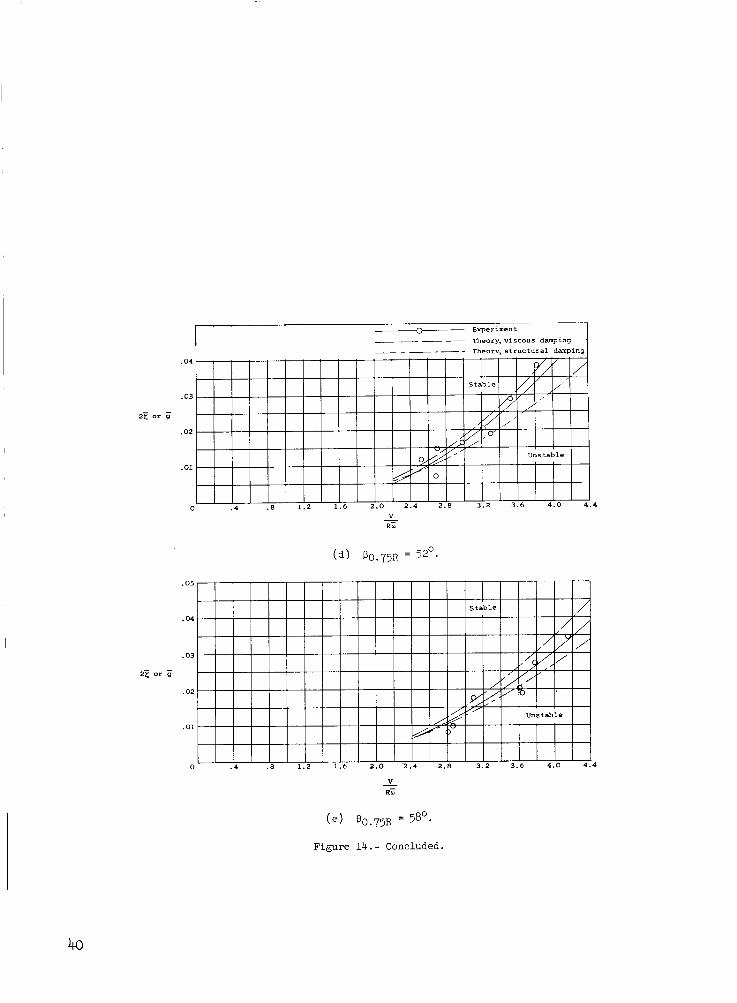
Whir l - f lut ter speeds.- I n f igure 1 4 t h e experimental wh i r l - f lu t t e r da ta f o r l 0 / R = 0.346 are compared with theore t ica l boundaries f o r f i v e blade angles. The data are presented i n t h e form of damping required f o r s t a b i l i t y a s a func- t i o n of reduced veloci ty t h e air density varied somewhat from one t e s t point t o another ( t a b l e 11), t h e s t a b i l i t y boundaries i n figure 14 have been adjusted t o represent a reference density value po of 0.0022 slug/cu ft . A s shown i n appendix B, t h e appropriate
density correction f ac to r i s po/p. Also, an average value of damping i n the p i tch and yaw direct ions i s taken t o be t h e representative damping, as refer- ence-2 indicates no e f f ec t of t h e r a t i o of p i t ch damping t o yaw damping f o r a symmetrical system. Thus, t h e damping parameter p lo t ted i s
VI=, t he stable region being above t h e boundary. Since
o r
A s considerable s c a t t e r ex i s t s i n the damping measurements, a f a i r e d curve w a s obtained by f i t t i n g all t h e data f o r sense t o determine t h e coeff ic ients of t h e following expression:
Zo/R = 0.346 i n t h e least-squares
This pa r t i cu la r form can be j u s t i f i e d as follows: The approximate whirl equa- t i o n (eq. (26) of ref. 2) indicates t h a t t he theore t ica l whirl boundary may be approximated very closely by a parabola i n V/F& A p lo t of t h e coeff ic ients of t h i s equation (eq. (26) of ref. 2) shows t h a t they vary i n a nearly l i n e a r man- ner with blade angle.
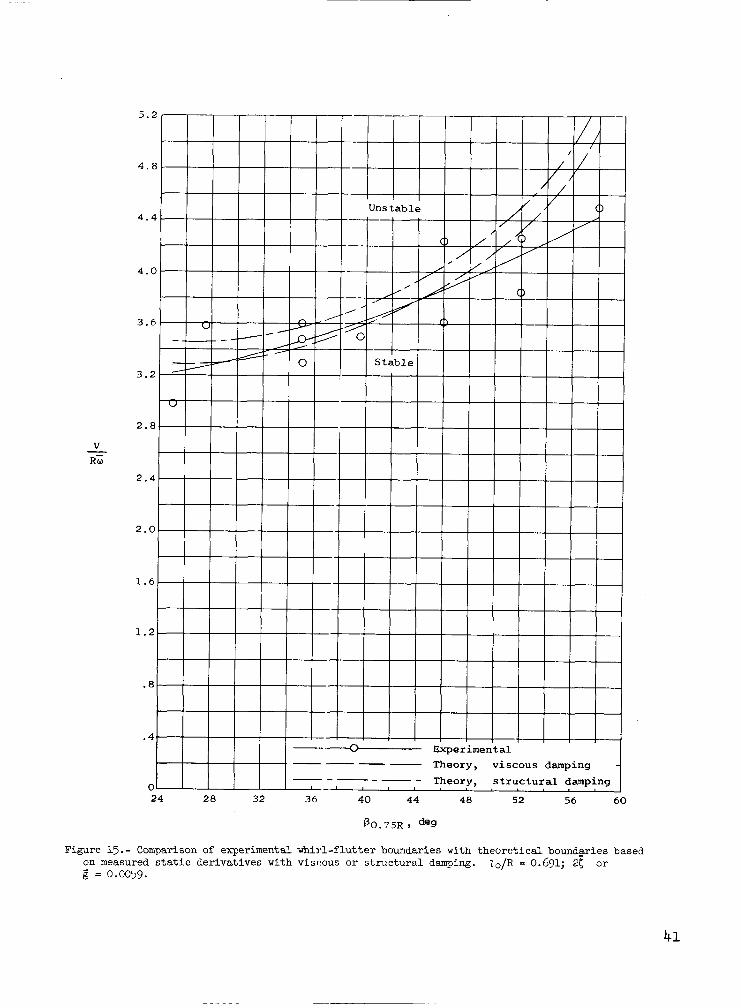
Figure 15 presents a comparison of t h e experimental and theore t ica l whirl- Zo/R = 0.691. f l u t t e r boundaries f o r
approximately t h e same value of damping, value and t h e data are presented i n t h e form of reduced f l u t t e r speed V/FG as a function of blade angle. The s tab le region i s below t h e curves. Observation of t h e da ta suggested t h e use of a parabola t o f i t t h e data. f a i r e d curve i n t h i s case w a s obtained by f i t t i n g t h e data i n the least-squares sense t o determine t h e coeff ic ients of t he paiabola:
Since a l l t he measurements were made a t
2f = 0.0059 i s taken as an average
Therefore, t h e
I
Theoretical f l u t t e r calculations would predict a curve of more complicated shape, I but t h i s approximation w a s considered sa t i s f ac to ry f o r t h e l imited amount of I data available.
Theoretical whirl boundaries were calculated by using equations (B6) and ( ~ 8 ) . Since the nature of t h e damping i n t h e system i s unknown, calculations were made with t h e assumption of e i t h e r viscous o r s t ruc tu ra l damping. calculations t h e measured s t a t i c - s t a b i l i t y der ivat ives and Cmq calculated by
t h e method of reference 5 were used. ( f i g . 14) and ( f i g . 15) t h e use of viscous damping gives b e t t e r agreement with experiment i n t h a t t h e errors are generally smaller and the shapes of t h e experimental and theo re t i ca l curves a re more nearly t h e same. The agree- ment between the theo re t i ca l and experimental curves with viscous damping i s excellent f o r 6 percent. The e r ro r i n speed f o r z0/R = 0.691 i s generally l e s s than 10 percent.
I n these
For t h i s system with Z0/R = 0.346 Z0/R = 0.691
ZO/R = 0.346, t h e l a rges t e r r o r i n reduced f l u t t e r speed being
Although t h e use of viscous damping i n the calculations provides b e t t e r agreement with measured whir l speeds i n t h i s case, such a r e s u l t may not be t rue i n general, pa r t i cu la r ly f o r a i r c r a f t s t ruc tures .
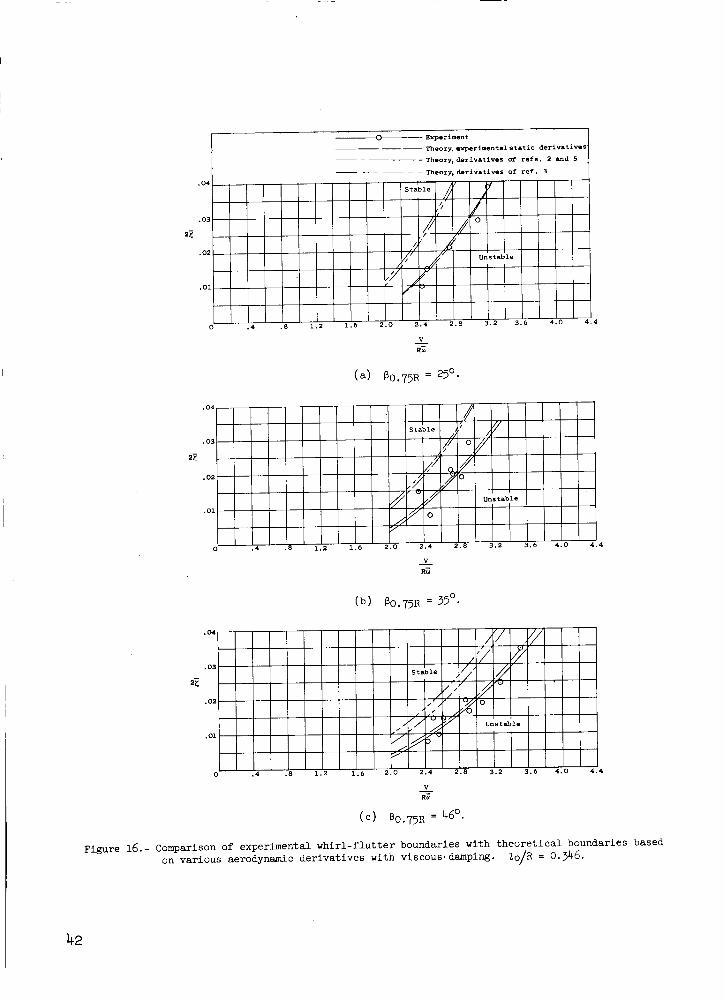
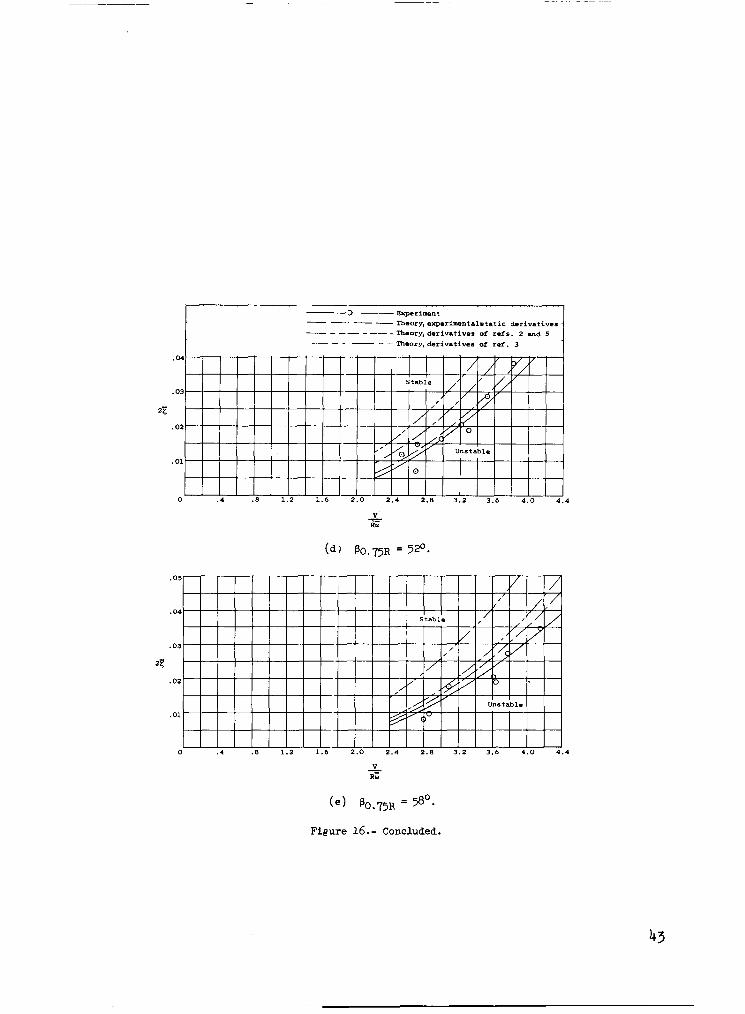
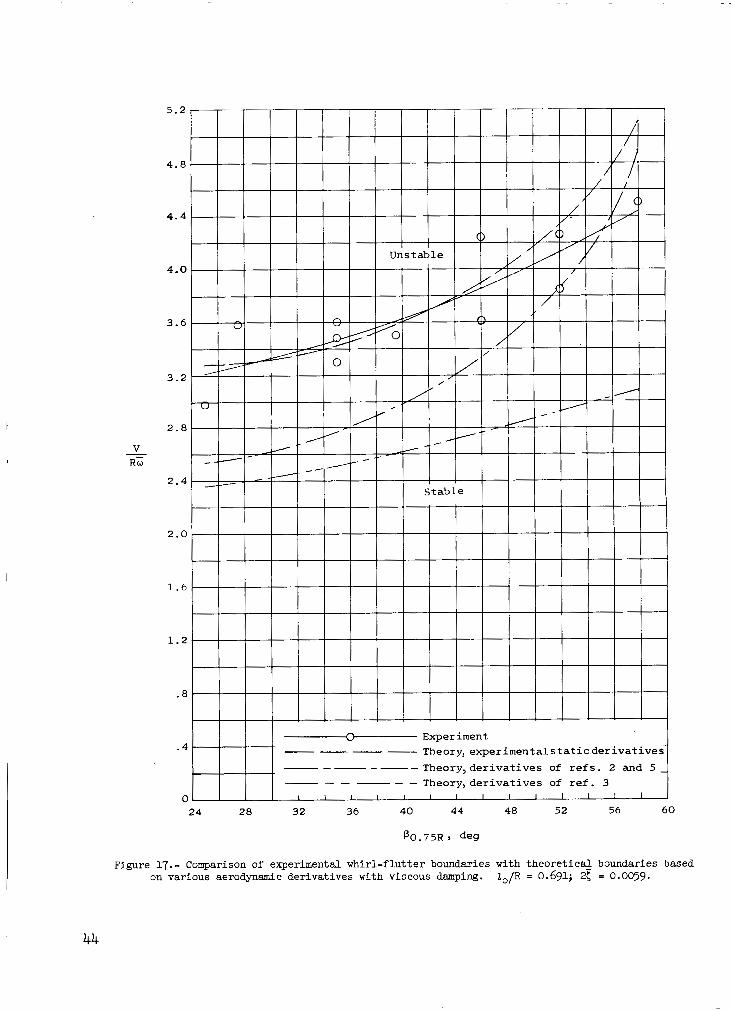
Figures 16 and 17 show a comparison of experimental and theo re t i ca l (eqs. (B6) and (a)) whirl boundaries f o r t h e measured s t a t i c - s t a b i l i t y deriva- t i v e s with t h e
t i v e s of reference 3. Viscous damping i s assumed. It i s seen t h a t t he use of measured der ivat ives provides t h e bes t agreement. The calculated der ivat ives of
Cmq of re f . 5 , t h e der ivat ives of reference 5, and t h e deriva- ( )
I 12
reference 5 provide b e t t e r agreement than those of reference 3 . t heo re t i ca l der ivat ives i s conservative i n t h a t lower whirl speeds are predicted than were measured.
The use of
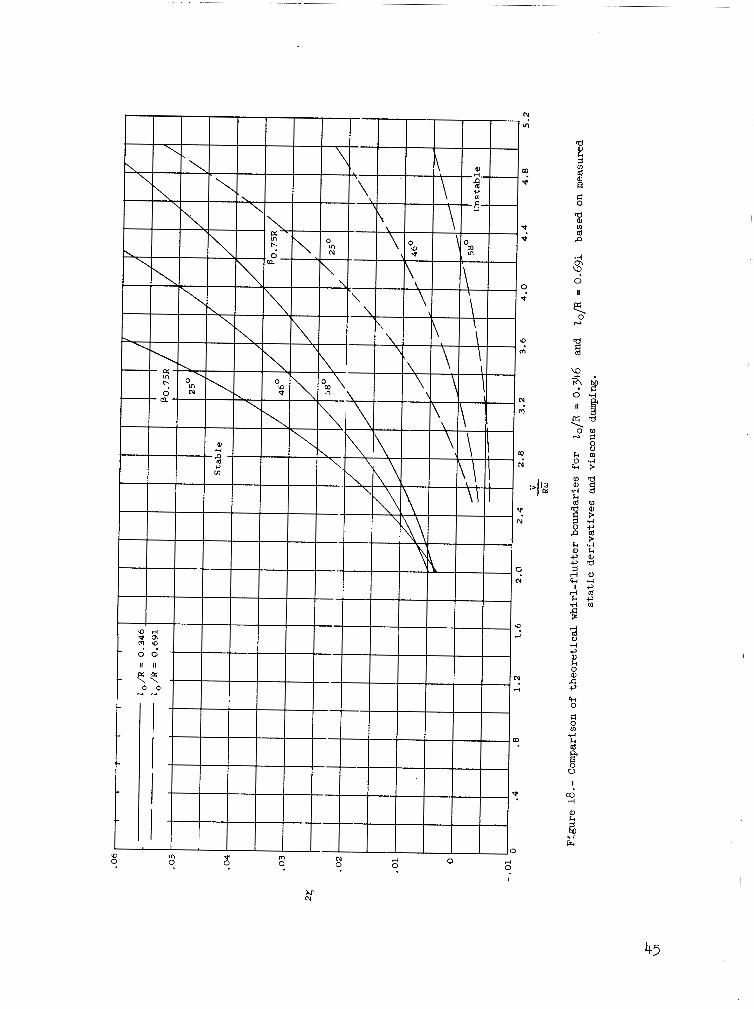
Figure 18 gives a comparison of t h e theo re t i ca l whirl speeds f o r 20/R = 0.346 and ZO/R = 0.691 f o r th ree blade angles. It i s seen t h a t increasing indicated by references 2 t o 4.
20/R leads t o a more s t ab le system (higher f l u t t e r speed), as w a s
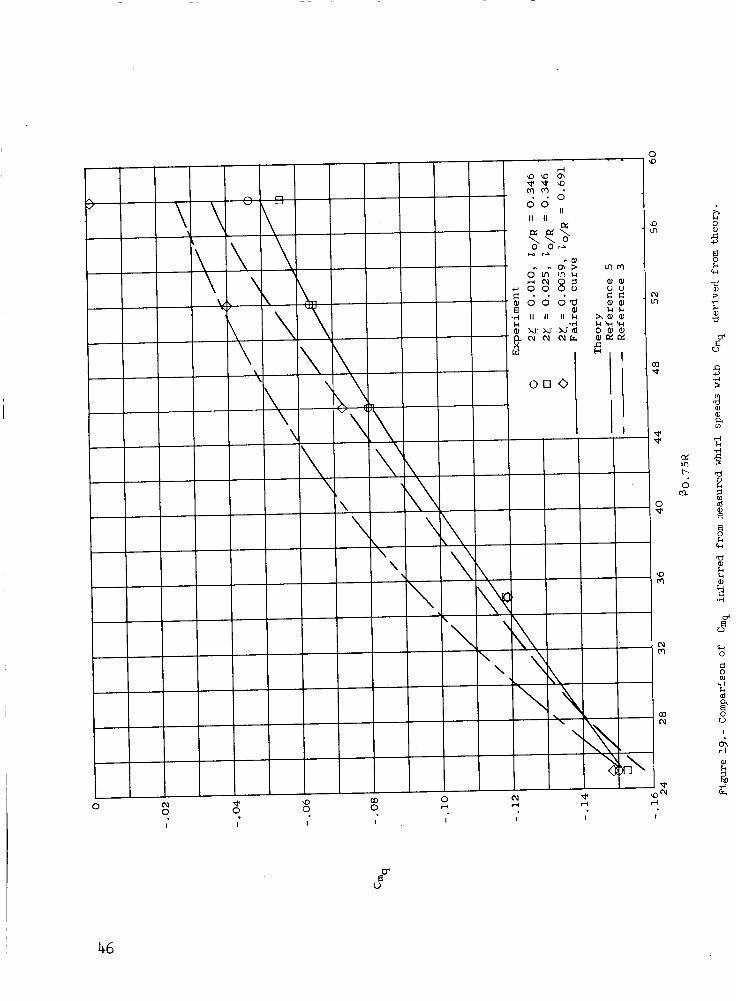
Cma required t o predict whi r l - f lu t te r speeds.- Since no experimental values
were available, it w a s of i n t e r e s t t o determine t h e Cmq required t o pred ic t
t h e measured whirl speeds. of i n e r t i a and viscous damping coeff ic ient with the measured whirl speeds and measured s t a t i c der ivat ives i n equations (B6) and (B8) t o solve f o r
Ideally, t h i s might a l so be considered the speeds, but such a procedure should be considered t o y ie ld only an estimate i n t h i s case. The values of Cm computed f o r two values of damping when
9 20/R = 0.346 and f o r t h e s ingle value of dmping when 20/R = 0.691 a re com- pared with theo re t i ca l values i n figure 19. The inferred values of Cas f o r t h e three cases considered a re i n good agreement; except f o r t h e da ta f o r a t t h e higher blade angles. uted t o t h e s e n s i t i v i t y of t h e whirl speeds t o r e s t r a i n t damping, as indicated by the small slope f o r t he higher blade angles at i n f igure 18. The infer red values of
values and are i n good agreement with t h e values of reference 5 over moat of t h e blade-angle range.
This w a s done by using t h e measured system propert ies
Cmq.
Cmq inferred from t h e whi r l - f lu t te r
20/R = 0.691 The deviation of these points can possibly be a t t r i b -
ZO/R = 0.691 Cmq ( f i g . 1 9 ) exhibi t t h e same t rends as t h e theore t ica l
Whirl frequencies.- Figure 20 gives a comparison of experimental and theoret- i c a l w h i r l frequency r a t i o s f o r ZO/R = 0.3'+6 and f o r 2 0 / R = 0.691. The theory i s shown t o three degrees of approximation: first, including f i r s t -o rde r aero- dynamic terms (eq. (B6)); second, neglecting aerodynamic terms (% = O i n eqs. (BT)); and th i rd , neglecting aerodynamic terms and assuming t h e angular-
Is2 momentum r a t i o << 1 (eq. (B10)). It i s seen t h a t t h e calculations i n .which
IYU ~
C& 8 percent.
i s retained provide the best overa l l agreement, t he l a rges t e r r o r being
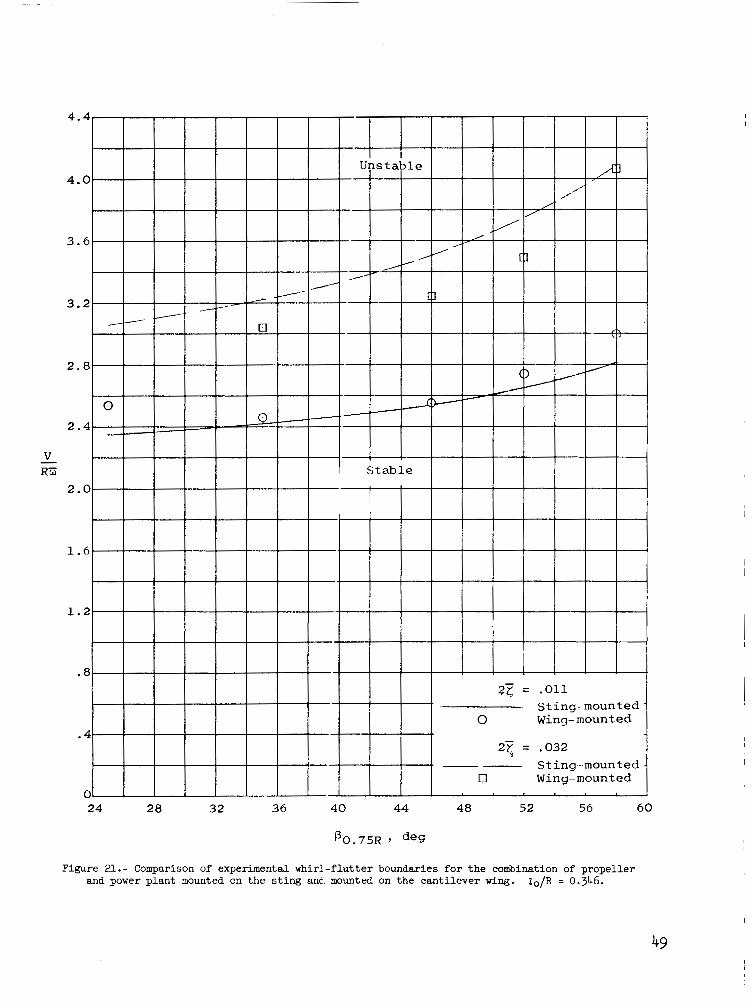
Wing ef fec ts . - Some tests were made i n which t h e nacelle-engine-propeller model t r ea t ed i n t h i s paper was mounted on a semispan wing cantilevered from the tunnel w a l l as previously discussed i n t h e sect ion e n t i t l e d "Models." f l u t t e r speeds f o r two leve ls of damping are presented i n f igure 21, and are compared with r e su l t s from t h e t e s t s of t h e i so l a t ed model. This comparison ind ica tes t h a t t he wing had l i t t l e e f f ec t on t h e whirl speeds. Whirl fre- quencies ranged from 5.7 cps t o 8.9 cps.
Whirl-
I The question of t h e e f f ec t s of t h e wing i s a broad problem, and therefore t h e s m a l l e f fec t i l l u s t r a t e d i n f igure 21 may not be typical of t h e r e s u l t s f o r other configurations. It should a l s o be noted t h a t i n the experimental r e su l t s presented i n reference 2 f o r a four-engine model, t he presence of a wing and complete model have la rge e f f ec t s (up t o 100 percent).
CONCLUSIONS
A wind-tunnel invest igat ion of propel ler whirl f l u t t e r w a s made with an i so la ted combination of a windmilling propel ler and simulated power plant over a range of propel ler blade angles, r e s t r a i n t s t i f fnesses , and r e s t r a i n t damping coeff ic ients f o r a system symmetrical i n p i tch and yaw. s t a t i c - s t a b i l i t y der ivat ives of t he windmilling propel ler were also m a d e with a simple balance. mounted on a cant i lever w i n g . The following conclusions are indicated:
Measurements of t h e
Limited whi r l - f lu t te r r e su l t s were obtained f o r t h e model
1. The measured whi r l - f lu t te r speeds and frequencies f o r t he i so la ted model were i n very good agreement with those predicted by calculations i n which meas- ured s t a t i c der ivat ives and viscous damping were used. b e t t e r than t h a t obtained using s t ruc tu ra l damping.
This agreement w a s
2. Predicted whi r l - f lu t te r speeds f o r t h e i so la ted model were lower when theo re t i ca l s t a b i l i t y der ivat ives were used than when measured s t a t i c der ivat ives were used.
3 . Theoretical s t a t i c - s t a b i l i t y der ivat ives obtained by two methods exhib- i t e d the same trends as experimental derivatives, but d i f fe red appreciably i n magnitude i n cer ta in instances. Limited measurements at one blade angle indi- cated t h a t Mach number had l i t t l e e f f ec t .
4. L i t t l e e f f ec t of t h e wing on t h e measured whir l - f lu t te r boundaries w a s indicated by t h e l imited data avai lable f o r t h e one configuration considered,
I although previous invest igat ions have shown l a rge r e f f ec t s of t he wing.
Langley Research Center, National Aeronautics and Space Administration,
Langley Station, Hampton, Va. , April 8, 1963.
14
APPENDIX A
DATA REDUCTION FOR STATIC-DERIVATIVE MEXSUREM3NTS
Determination of C q and CQ
The s t a t i c equation governing t h e p i tch def lect ion of t h e engine-propeller system may be obtained from equation (Bl). The r e su l t i s
For measurement Hence, f o r Jr =
of C$ 0, t h e pitching-moment coeff ic ient i s
t h e gimbal w a s arranged t o allow p i tch freedom only.
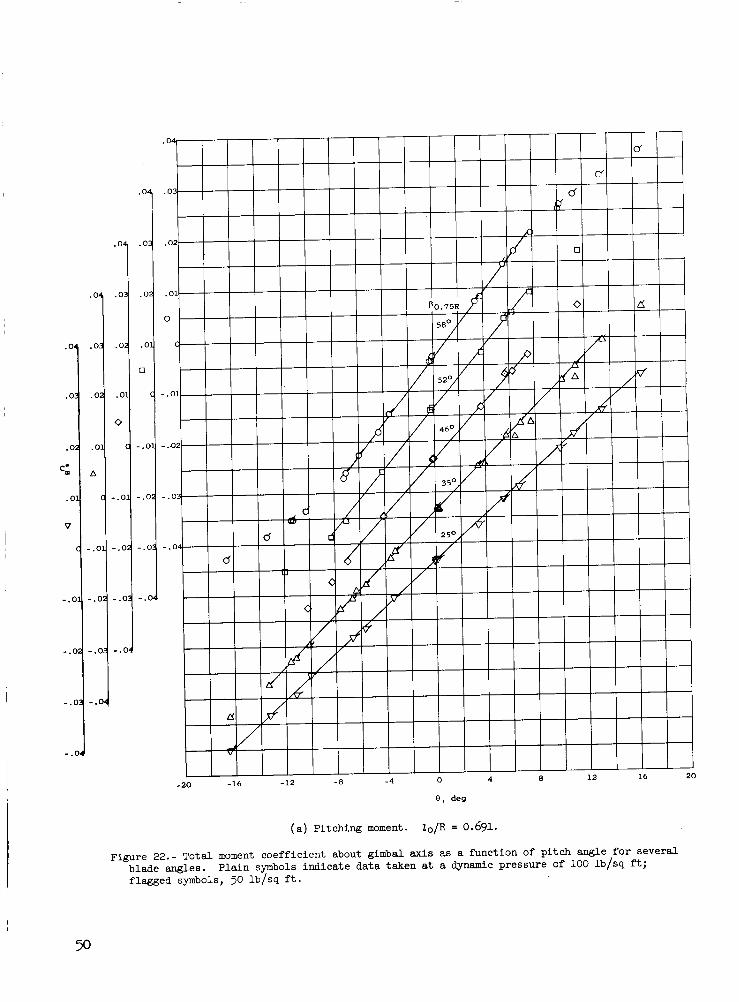
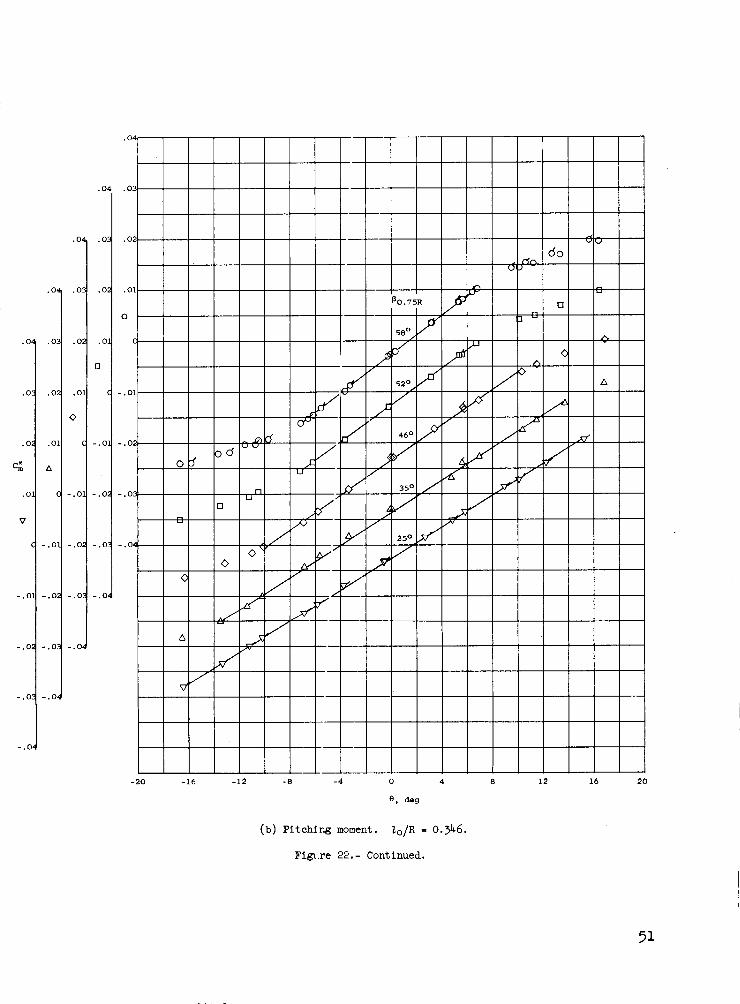
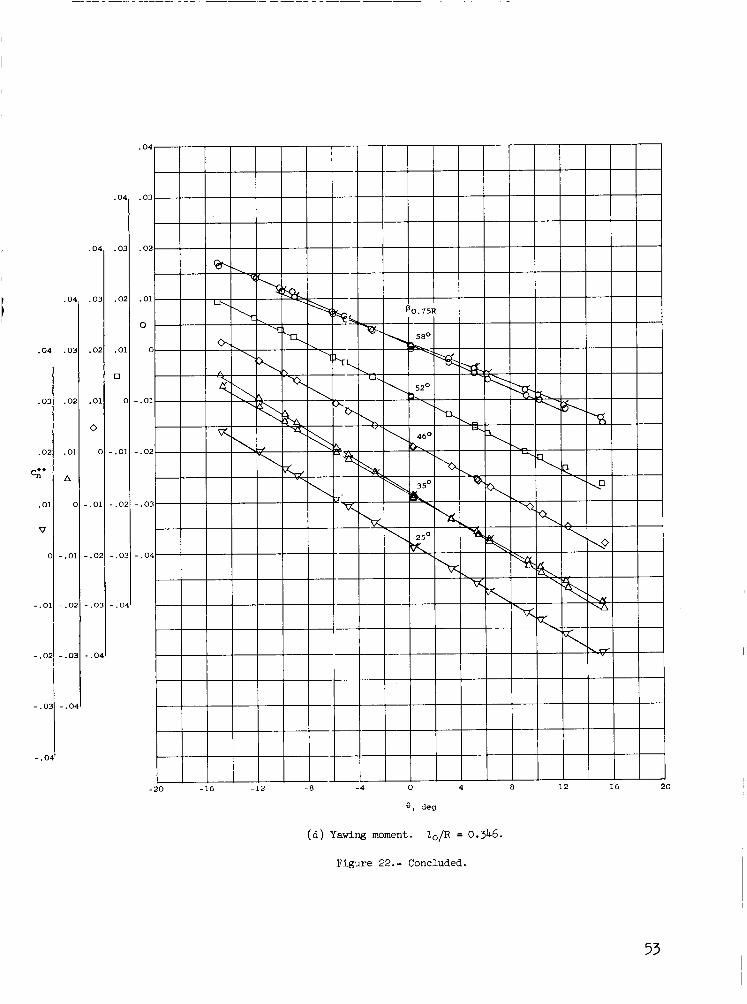
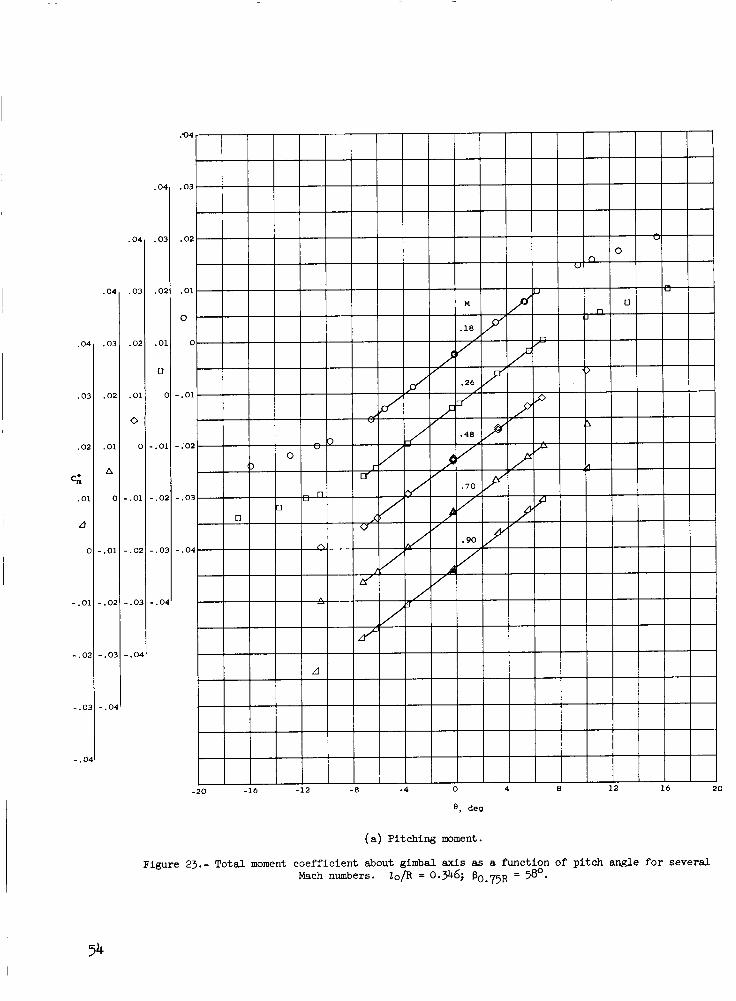
where i s t h e moment measured by t h e s t r a i n gage. The experimental data are presented i n figures 22 and 23, where the moment coeff ic ient i s p lo t ted against t h e measured p i tch angle 0 . The slope of these curves i s C& .
Two distances between the gimbal axis and propel ler plane were used i n order t o separate the force and moment contributions t o t h e t o t a l moment. The equations a re
where t h e subscr ipts 1 and 2 re fer t o data f o r Z o / R = 0.346 and Z o / R = 0.691, respectively. Equations ( A 3 ) are solved t o give
from which C and. (2% are derived are me and C* %,2
The quant i t ies
given i n f igure 11. Figure 10 shows t h e var ia t ion of Cq and C% with blade
angle.
3 Determination of GmJ, and C
The s t a t i c equation governing t h e yaw deflect ion of t he engine-propeller system may a lso be obtained from equation (Bl) by l e t t i n g C& = C& and
* = - C q . The resul t i s
For t h e determination of C* t h e
yawing-moment coeff ic ient i s found "e
C F =
gimbal w a s allowed
t o be
yaw freedom only. The
( A7
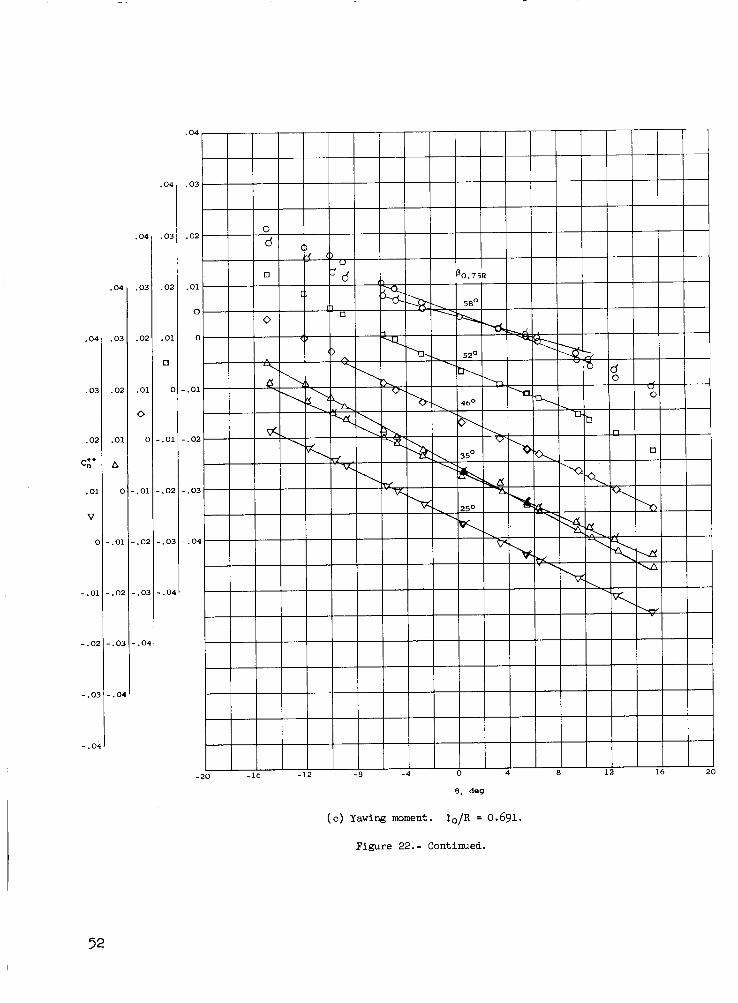
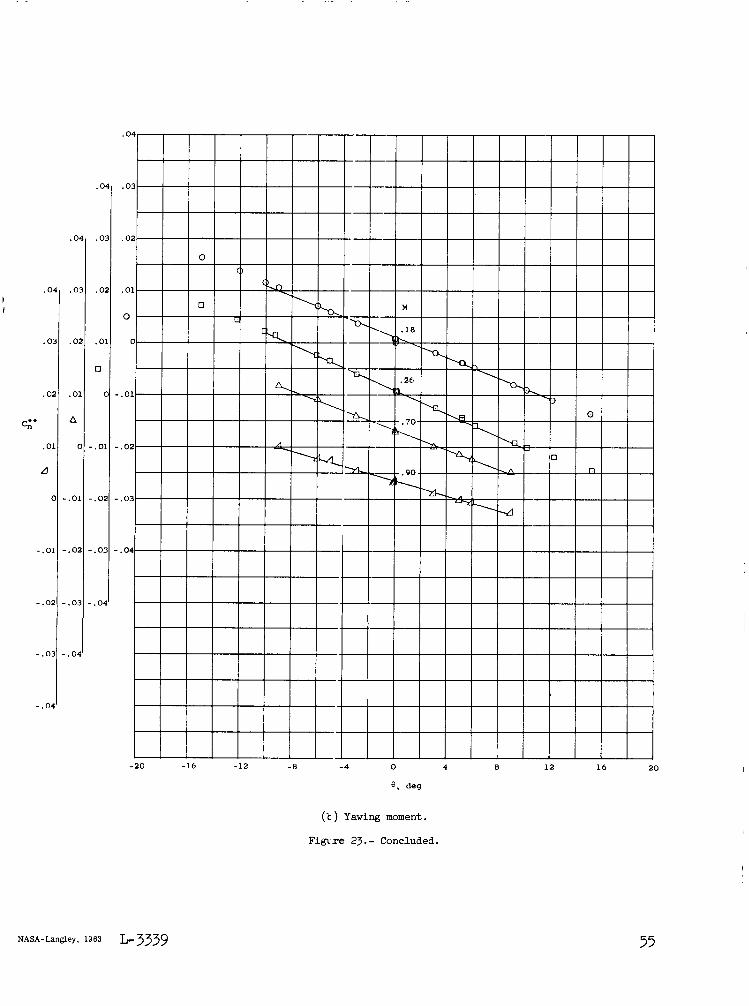
where KqJr i s t h e moment measured by t h e s t r a i n gage. The experimental da ta are presented i n f igures 22 and 23. The slopes of these curves ( C z ) are used
t o obtain C* by applying equation (A7); t h a t is, ne
The r a t i o Jr/0 i s a constant f o r a given b l d e angle and dynamic pressure, and w a s obtained by p lo t t i ng Jr (as determined from strain-gage output) against 0 (as determined from t h e s t i ng angle of a t tack) . Since $/0 depends on dynamic pressure, Cy does also, as shown i n f igures 22 and 23. The r e l a t ion ch = cme * *
9. w a s used t o obtain C
By using c; = -Cq, t h e resolut ion of i n t o i t s components i s Carrie * out i n t h e same manner as t h a t f o r C& (see eqs. ( A 3 ) ) . The results are
c9f - 1 - z 2 - I1 ( G e j 2 - I C * 2 "e,l )
16
from which C and Cq are derived are mJI and C*
Figure 10 shows t h e var ia t ion of CmJ, and Cq with blade
The quant i t ies C*
given i n f igure 11.
angle.
%l
APPENDIX B
EQUATIONS OF MOTION
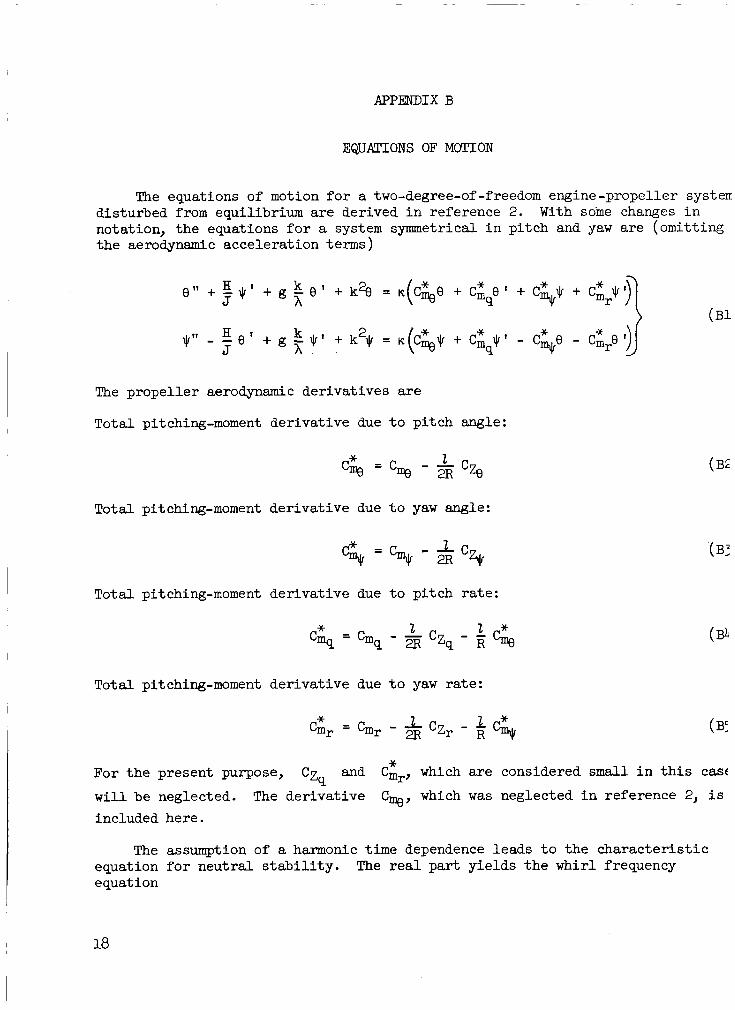
The equations of motion f o r a two-degree-of-freedom engine-propeller systen disturbed from equilibrium a re derived i n reference 2. notation, t h e equations f o r a system symmetrical i n pi tch and yaw are (omitting the aerodynamic acceleration terms)
With some changes i n
The propel ler aerodynamic der ivat ives are
Total pitching-moment
Total pitching-moment
Total pitching-moment
Total pitching-moment
der ivat ive due
c& =
% =
derivat ive due
der ivat ive due
* Cmq = Cmq
der ivat ive due
* Cmr = C m r
t o p i tch angle:
t o yaw angle:
t o p i t ch rate:
- - 2 - 4 c* 2R czq R I%
t o yaw rate:
(B2
36 and
The der ivat ive
Cm,, which a re considered small i n t h i s cas(
Cq, which w a s neglected i n reference 2, i s czq
For t h e present purpose,
w i l l be neglected. included here.
The assumption of a harmonic time dependence leads t o t h e cha rac t e r i s t i c equation f o r neutral s t a b i l i t y . equation
The real part y ie lds t h e whirl frequency
18
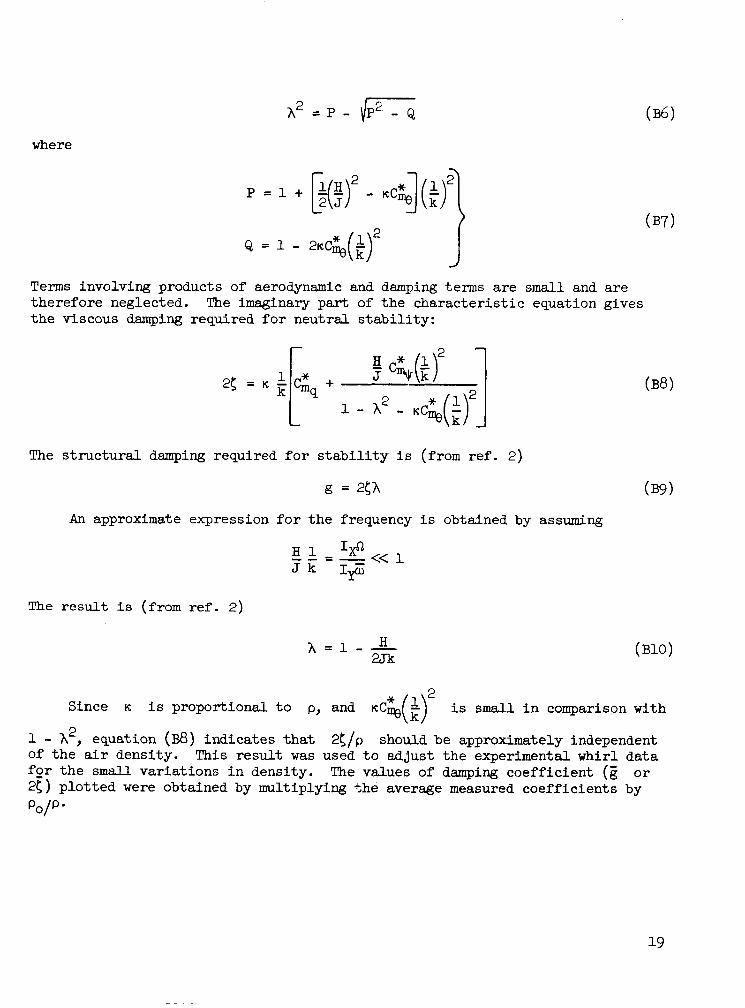
where
J Terms involving products of aerodynamic and damping terms are small and a re therefore neglected. The imaginary pa r t of t he cha rac t e r i s t i c equation gives t h e viscous damping required f o r neut ra l s t a b i l i t y :
The s t r u c t u r a l damping required f o r s t a b i l i t y i s (from r e f . 2)
g = 25h 039)
An approximate expression f o r t h e frequency i s obtained by assuming
The result i s (from re f . 2)
Since K i s proportional t o p, and K C ~ * (ir i s s m a l l i n comparison with
1 - h2, equation (B8) ind ica tes t h a t of t he air density. fo r t h e s m a l l var ia t ions i n density. 25) p lo t t ed were obtained by multiplying the average measured coef f ic ien ts by
2(/p should be approximately independent This r e su l t w a s used t o adjust the experimental whirl data
The values of damping coeff ic ient (E o r
p o p *
REFERENCES
1. Taylor, E. S., and Browne, K. A . : Vibration I so la t ion of Aircraf t Power Plants . Jour. Aero. Sci., vol. 6, no. 2, Dec. 1938, pp. 43-49.
2. Reed, Wilmer H. , 111, and Bland, Samuel R. : An Analytical Treatment of Air- c ra f t Propel ler Precession I n s t a b i l i t y . NASA TN 0-659, 1961.
3. Houbolt, John C., and Reed, Wilmer H., 111: Propeller-Nacelle Whirl F l u t t e r . Jour Aerospace Sci. , vol. 29, no. 3, Mar. 1962, pp. 333-346.
4. Sewall, John L.: An Analytical Trend Study of Propeller Whirl I n s t a b i l i t y . NASA TN D-996, 1962.
3. Ribner, Herbert S.: Propel lers i n Yaw. NACA Rep. 820, 1945. (Supersedes NACA ARR 3L09.)
6. Abbott, Frank T., Jr., Kelly, H. Neale, and Hampton, Kenneth D.: Investiga- t i o n of Propeller-Power-Plant Autoprecession Boundaries f o r a Dynamic- Aeroelastic Model of a Four-Engine Turboprop Transport Airplane. TN D-1806, 1963.
NASA
7. McLemore, H. Clyde, and Cannon, Michael D.: Aerodynamic Investigation of a Four-Blade Propel ler Operating Through an Angle-of-Attack Range From 0' t o 180~. NACA TIV 3228, 1954.
I 20
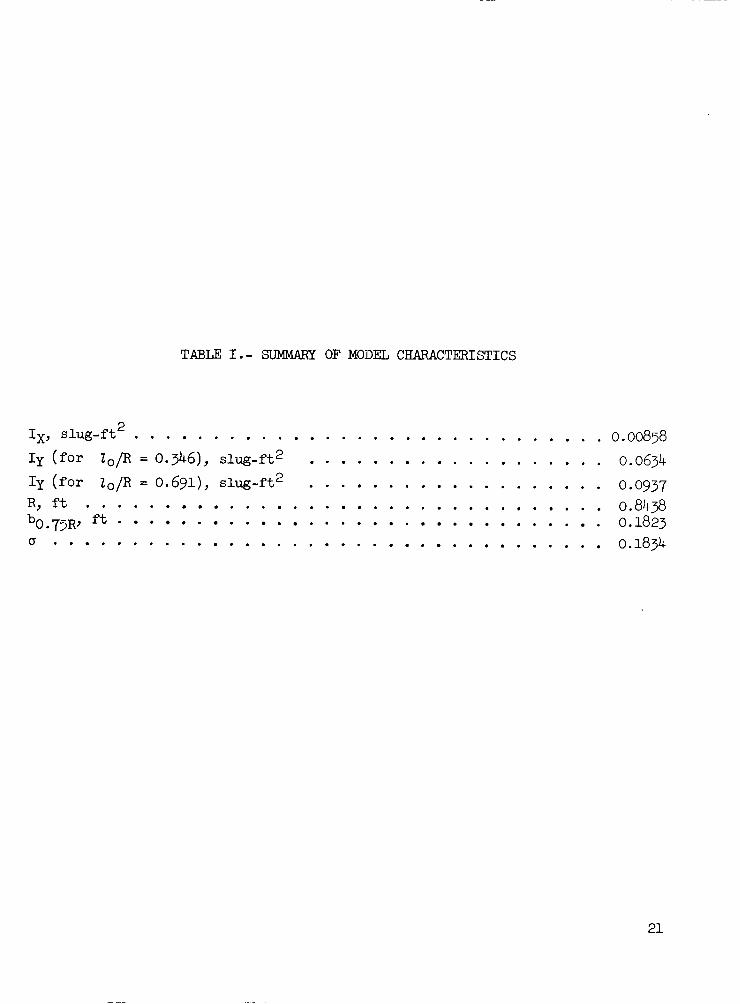
TABU I.- SUMMARY OF MODEL CHARACTERISTICS
2 I ~ . slug-ft . . . . . . . . . . . . . . . . . . . . . . . . . . . . . . 0.00858 Iy (for Z o / R = 0.346), slug-ft2 . . . . . . . . . . . . . . . . . . . 0.0634
. . . . . . . . . . . . . . . . . . . Iy (for 10/R = 0.691), slug-ft2 0 0937 R. ft . . . . . . . . . . . . . . . . . . . . . . . . . . . . . . . . . 0.8438 b0.75~, ft . . . . . . . . . . . 0.1823 c . . . . . . . . . . . . . . . . . . . . . . . . . . . . . . . . . . . 0.1834
21
~~
35 46 52 58
25 46 52 58
25 35 46 46 52
35 46 52 58
35 46 52 58
25 33 46 52 58
25 33 46 52 58
25 46 52 58
TABLE 11.- MODEL TEST DATA
(a) Sting-mounted configurations with 2o/R = 0.346
fe J
CPS
9.20
1 1 9-71
10.43
i 10.96
1 1
11.52
10.44
1 I
10.46
10.71
1
9.12
1 L
9.65
10.26
I 10.96
1 1
11.50
10.40
! I
10.51
10.28
0.0060
i 1 .0058
.0066 \1
.0060 1
.0066
.0150
1 1
.0152
0153 4
.0126 4
,0150
0175
i 0371 .0300 0371 .0300
0.0090 5. .0163 .0126
.0131 3. .0076 .0098
.0216
I .0238
I 1
.0218
.0263 L
.0200
I * 0398 4
,0316 0398
.0368
0393
I
P,
slugs/cu f t
0.00211 .00210
-1 I
1
.00210
.00211
5- .00210
.00209
.00217 ,00218 ,00209
.L
.00218
.00217 4.
.00216
.00218
.00219 3.
.00219
.00220 J.
.00219 3.
1
.00220
38.4 26.2 22.0 19.4
60.0 28.8 24.1 20.0
64.4 40.2 30.4 31.8 26.1
51.8 37.3 33.0 29.2
56.2
35.4 30.1
72.1 53.4 36.0
41.0
29.4 24.2
81.3 58.7 41.4 35.3 29.0
85.6 44.6 38.4 33.2
V f J Pt/sec
120 118 122 139
125 131 138 144
136 128 136 143 148
159 167 186 210
173 188 202 222
15 2 150 161 165 171
172 163 182 196 210
179 196 213 231
- f f CPS
6.88 7.37 7.63 7.73
6.20 7.80 8.10 8.20
6.42 7.60 8.16 8.05 8.39
7.58 8.30 8.63 8.75
8.08 8.83 8.98 9.27
6.26 6.96 8.13 8.55 8.66
6.00 6.62 7.61 7.71 8.19
5.56 7.60 7.73 8.10 -
22
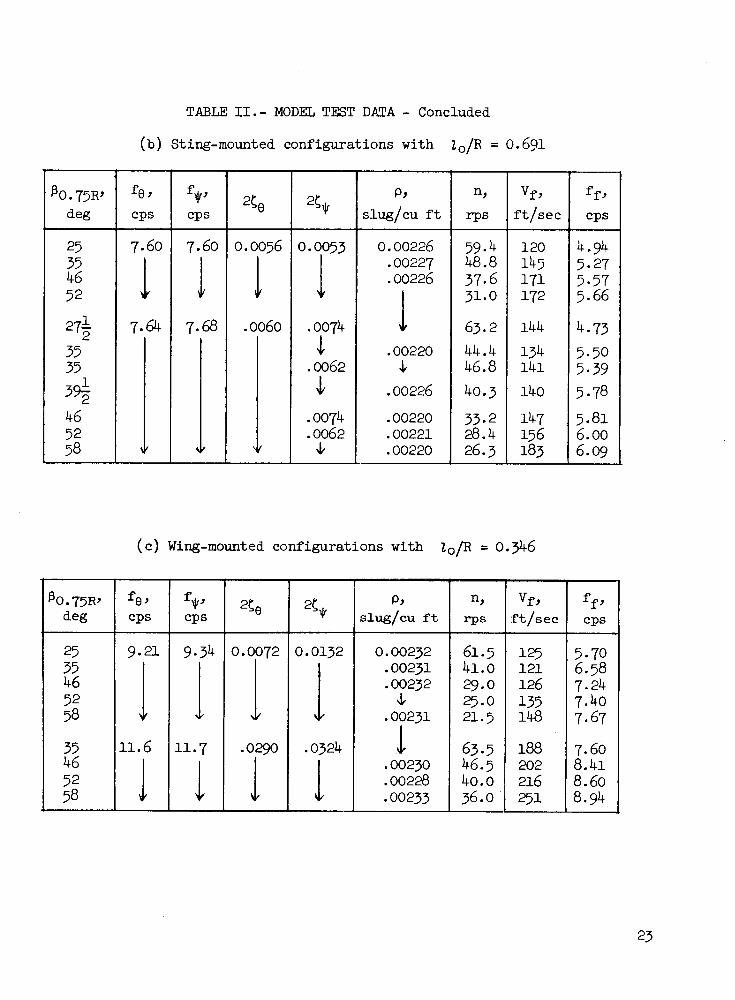
TABLE 11.- MODEL TEST DATA - Concluded (b) Sting-mounted configurations with ZO/R = 0.691
I
0.00232 .00231 .00232
\L .00231
.00230
.00228
\1 .00233
P,
slug/cu ft Vf, ft/sec
120 145 171 172
144
141 140
134
147 156 183
ff.,
4.94 3-27 5.57 5.66
4.73 5.50 5.39 5.78 5.81 6.00 6.09
CPS
25 35 46 52 275 1
3%
35 35
46 52 58
7.60
I 7.68 I
0.0053 I .0074
3. .1
.0062
.0074
.0062 \L
0.00226 .00227 .00226
I .00220
.00226
.00220 ,00221 .00220
.L
59.4 48.8 37.6 31.0
63.2 44.4 46.8 40.3
33.2 28.4 26.3
7.60
1 7- 64
1 0.0056
I .0060
(c) Wing-mounted configurations with Z0/R = 0.346
f J I J CPS
fe J
CPS Vf,
Pt/sec
125 121 126 135 148
188 202 216 251
25 35 46 52 58
35 46 52 58
9.34 0.0072 I 61.5 41.0 29.0 25.0 21.5
63.5
36.0
46.5 40.0
0.0132
I .0324
5-70 6.58 7.24 7.40 7.67
7.60
8.60 8.94
8.41
I ~ 1 . 6 11.7 .02gO I
f\) .j::"""
L- 61-6611 Figure 1 .- Photograph of sting-mounted propeller whirl model in the test section of the Langley transonic dynamics tunnel.
l
I\) \J1
Propeller sha£t
...
Sha£t housing ,...
.• ® .
L-6l-661O.l Figure 2.- Photograph of' gimbal with long shaft and of' gimbal with short shaft.
~~ -- --------
Gimbal
~-l
I
f\) 0\
-----
L-61-291 Figure 3.- Photograph of wing-mounted propeller whirl model in the test section of the Langley transonic dynamics tunnel .
--~----~
0 .2 e 4 .6 .8 1 .o Radial distance along blade
Propeller radius
Figure 4.- Dis t r ibu t ion of propel le r t w i s t angle and blade width for t h e a i rp lane propel le r of t h i s ana lys i s .
I
I
ln
28
f\) \0
--,----~- ----~.
Figure 6.- Photograph of sting-mounted propeller whirl model showing details of design. L-61-6614.1
S h a f t
propel1
Simulated engine m a s s ( s h a k e r ) Gimbal r e s t r a i n t s p r i n g ( f i x e d t o s h a f t housing on c e n t e r l i n e of s h a f t axis)
S t i n g a d a p t e r
r n a t e c l i p p o s i t i o n s s t i f f n e s s v a r i a t i o n s
Mounting beam
(a) Power plant, gimbal, and mountlng for whirl-flutter model.
7 A Simulated engine mass(shaker )
S h a f t housing-
P r o p e l l e r shaf '--Strain -g age beam
a d a p t e r
7~ I' X A I t e r n a t e p o s i t i o n f o r L F i e x i b l e c l i p mounting b b l t s f o r yawing- ' V U moment masurements
(b) Derivative-measurement model.
Figure 7.- Schematic drawings of isolated models.
1.0
.9
.8
.7
.6
5
. 4
.3
. 2
. 1
1 . c
5
E
7
<
4
..-
I
I
Figure 8.- Typical records of decay of free vibration.
/'
Tunnel wall
T I
11.3
6 6 . 0
6 .0 -c 15.3 8
Figure 9.- Sketch of cantilever-wing model i n tunnel, showing measured node l i n e s and frequencies of t h e w i n g . A l l dimensions are i n inches unless otherwise spec i f ied .
32
I I I 1 I I
33
34
35
e c;
-C; e
P0.75R 8 deg
* Figure 11.- Variat ion of Cme and C G with propel le r reference blade angle. P l a i n symbols ind i -
c a t e d a t a taken at a dynamic pressure of 100 lb/sq f t ; flagged symbols, 50 lb / sq f t .
37
38
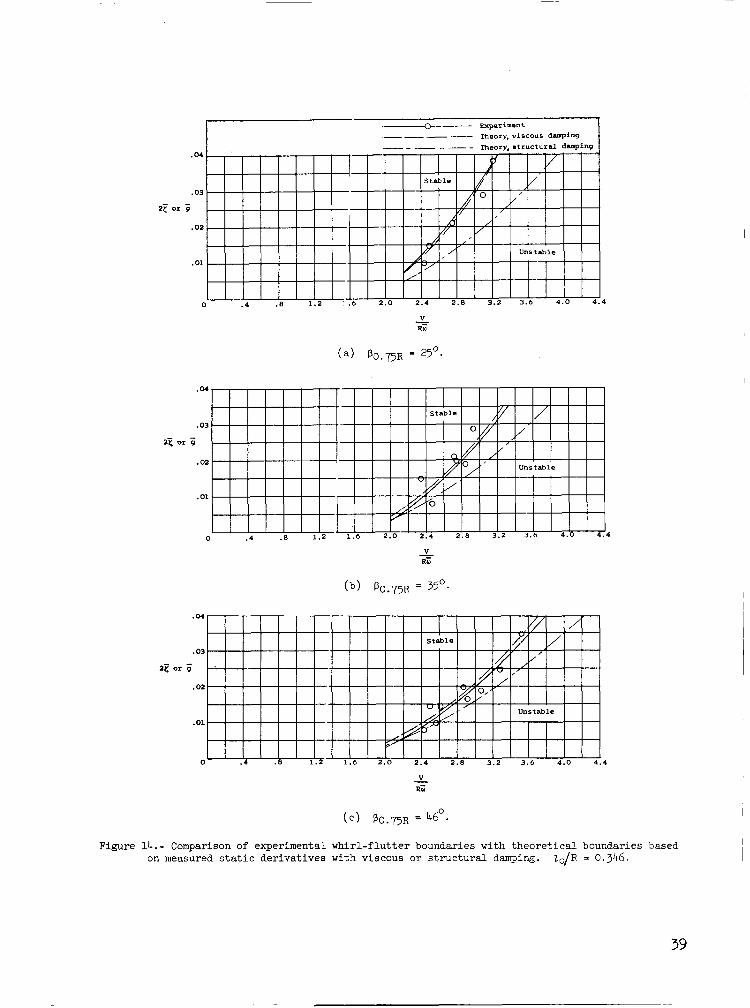
Figure 14.- Comparison of experimental on measured s t a t i c der iva t ives
w h i r l - f l u t t e r boundaries with t h e o r e t i c a l boundaries based with viscous o r s t r u c t u r a l damping. Z0/R = 0.346.
39
-c- Experiment
~ - __ ~ Theory, v i s c o u s damping
.04
.03
2e or S
.02
.01
0 4
V - R;
2e or ;j
.05
.04
.03
.02
. 01
1 I * ' I * 8 ~ ' ' " " ' ' 0 . 4 . 8 1.2 1.6 2.0 -2 .4 2.8 3.2 3.6 4.0 4.4
RE V -
Figure 14. - Concluded.
P0.75R Y * g
Figure 15.- Comparison of experimental w h i ~ l - f l u t t e r boundaries with t h e o r e t i c a l boundgries based on measured s t a t i c der iva t ives with visc:ous o r s t r u c t u r a l damping. 2 0 / R = 0.691; 25 or
= 0.0059.
41
1111
Figure 16.- Comparison of experimental w h i r l - f l u t t e r boundaries with t h e o r e t i c a l boundaries based on various aerodynamic der iva t ives with viscous. damping. 20/R = 0.346.
I 42
~- ._ - +- Experiment -- Theory, experimsntalstat ic derivatives - - -- ----Theory,derivatives of refs. 2 md 5
T h ~ r y , derivatives of re f . 3 ___.
.M
.03
2z
.02
. 01
0 .4 .8 1.2 1.6 2.0 2.4 2.8 3.2 3.6 4.0 a 4
.05
.M
.03
2 z
.02
.01
0 . 4 .8 1 . 2 1.6 2 . 0 2 . 4 2.8 3.2 3.6 4.0 4.4
V RE -
( e ) p0.75R = 580.
Figure 16. - Concluded.
43
i -C?- Experiment Theory, experimenta1static.derivatives
i Theory, derivatives of refs. 2 and 5 - - - - - - Theory, derivatives of ref. 3
0 I I I I I I I I I I I I I I I 40 44 48 52 56 60 24 28 32 36
P0.75R 9 deg
Figure 17.- Comparison of experimental wh i r l - f lu t t e r boundaries with t h e o r e t i c a l boundaries based on various aerodynamic der iva t ives with viscous damping. l 0 / R = 0.691; 25 = 0.0059.
44
45
II II U u u\ a a2
46
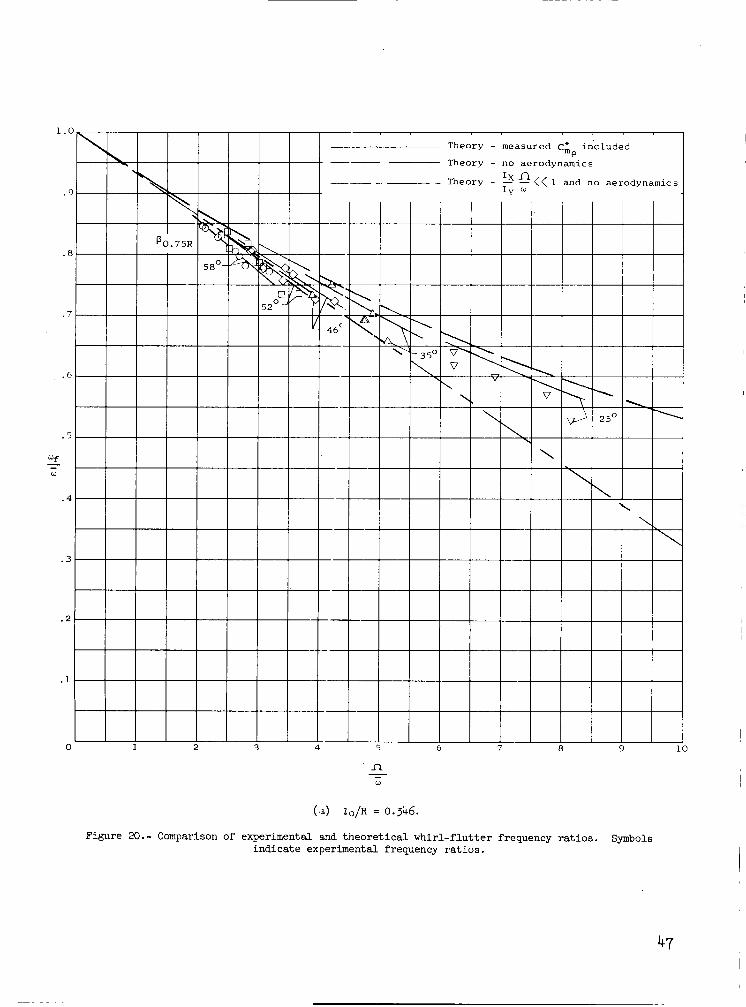
(t) Zo/R = 0.346.
Figure 20.- Comparison of experimental mnd t h e o r e t i c a l w h i r l - f l u t t e r frequency r a t i o s ind ica te experimental frequency r a t i o s .
Symbols
47
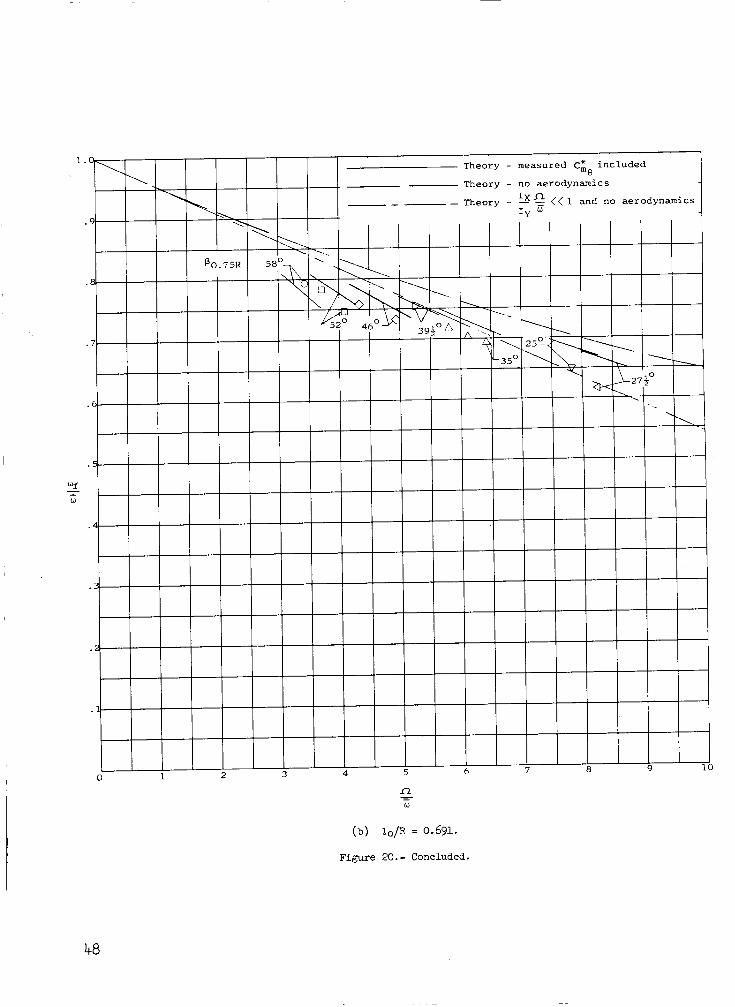
(b) Zo/R = 0.691.
Figure 20.- Concluded.
48
24 28 32 36 40 44 48 52 56 60
P 0 . 7 5 R 3 deg
Figure 21.- Comparison of experimental w h i r l - f l u t t e r boundaries fo r t h e combination of propel le r and power p lan t mounted on t h e sting ant mounted on t h e cant i lever w i n g . ZO/R = 0.346.
49
I . 0.
.08 .03
.03 .02
.02 .01
0
.01 c
0
c -.01
-.01 -.02
-.02 -.O?
-.03 - .04
- .04
0 , deg
( a ) Pi tching moment. 2 0 f R = 0.691.
Figure 22.- Total moment coef f ic ien t about gimbal axis as a funct ion of p i t c h angle f o r severa l blade angles. flagged symbols, 50 lb / sq f t .
P l a i n symbols ind ica te d a t a taken a t a dynamic pressure of 100 lb/sq f t ;
.o
.o
.o
G
.o
V
- .a
- .o
-.o
- . c
.04.
.03
.02
. 01
0
c
-.01
-.02
-.03
- .04
.(
.(
.(
.(
A
-.(
-.(
-.(
-.(
.(
. C
.(
0
-.(
-.(
-.(
-.(
-20 -16 -12 -8 -4 0 4 8 12 16 20
8 , deg I
(b) Pi tch ing moment. 10/R = 0.346.
Fig\.re 22.- Continued.
.04
.03
.02
cg*
.01
V
0
-.01
-.02
-.03
-.04
.04
.03
.02
.Ol
0
0
.01
.02
. 0 3
. . 04
.03
.02
.01
A
c
-.01
-.oi
-.01
-.Od
.04
.03
.02
.01
0
0
- .Ol
- .02
- .03
- . 0 4
8 , deg
( c ) Yawing moment. ZO/R = 0.691.
Figure 22.- Continued.
I .o
.o
.o
C p
.o
V
- .c
-.c
- .c
-.(
.o<
. 0:
. 0;
.O1
A
(
- . 0:
- . 0:
- . 0:
- . 0.
.o.
.o
.o
.o
0
-.o
- .o
- .o
-.c
-20 -16 -12 -8 -4 0 4 8 12 16
e , deg
(d) Y a w i n g moment. ZO/R = 0.346.
Figx-e 22.- Concluded.
53
. 0 4
. 03
.02
c: .01
A
c
- .Ol
- . 0:
- . 0:
-.o.
.04
.O?
.oi
.01
A
(
. .01
. . 0:
. . 0:
- . 0.
.04
. O?
. 0;
.O1
0
(
. .O1
. . 0:
. . 0:
- . 0.
.o.
.o
.o
.o
0
..o
-.o
- .o
- .o
e , deg
(a) Pitching moment.
Figure 23.- Tota l moment coef f ic ien t about gimbal a x i s as a funct ion of p i t c h angle for severa l Mach numbers. 20/R = 0.346; = 58'.
54
.04
.04 .03 t f
.03 .02
.02 .01
C;* a
.01 0
D
0 -.01
-.01 -.02
-.02 -.03
-.03 - .04
NASA-Langley, 1963 L-3339
.O:
.O:
.01
0
c
- .01
-.oi
-.O?
- . 0 4
(k ) Yawing moment.
FigL re 23. - Concluded.
55