Embed Size (px)
Citation preview
Biogeosciences, 12, 67–78, 2015
www.biogeosciences.net/12/67/2015/
doi:10.5194/bg-12-67-2015
© Author(s) 2015. CC Attribution 3.0 License.
Technical Note: Large overestimation of pCO2 calculated from pH
and alkalinity in acidic, organic-rich freshwaters
G. Abril1,2, S. Bouillon3, F. Darchambeau4, C. R. Teodoru3, T. R. Marwick3, F. Tamooh3, F. Ochieng Omengo3,
N. Geeraert3, L. Deirmendjian1, P. Polsenaere1, and A. V. Borges4
1Laboratoire EPOC, Environnements et Paléoenvironnements Océaniques et Continentaux, CNRS,
Université de Bordeaux, France2Programa de Geoquímica, Universidade Federal Fluminense, Niterói, Rio de Janeiro, Brazil3Katholieke Universiteit Leuven, Department of Earth & Environmental Sciences, Leuven, Belgium4Unité d’Océanographie Chimique, Université de Liège, Belgium
Correspondence to: G. Abril ([email protected])
Received: 23 June 2014 – Published in Biogeosciences Discuss.: 31 July 2014
Revised: 18 November 2014 – Accepted: 24 November 2014 – Published: 6 January 2015
Abstract. Inland waters have been recognized as a signifi-
cant source of carbon dioxide (CO2) to the atmosphere at the
global scale. Fluxes of CO2 between aquatic systems and the
atmosphere are calculated from the gas transfer velocity and
the water–air gradient of the partial pressure of CO2 (pCO2).
Currently, direct measurements of water pCO2 remain scarce
in freshwaters, and most published pCO2 data are calculated
from temperature, pH and total alkalinity (TA). Here, we
compare calculated (pH and TA) and measured (equilibra-
tor and headspace) water pCO2 in a large array of temperate
and tropical freshwaters. The 761 data points cover a wide
range of values for TA (0 to 14 200 µmol L−1), pH (3.94 to
9.17), measured pCO2 (36 to 23 000 ppmv), and dissolved
organic carbon (DOC) (29 to 3970 µmol L−1). Calculated
pCO2 were > 10 % higher than measured pCO2 in 60 %
of the samples (with a median overestimation of calculated
pCO2 compared to measured pCO2 of 2560 ppmv) and were
> 100 % higher in the 25 % most organic-rich and acidic
samples (with a median overestimation of 9080 ppmv). We
suggest these large overestimations of calculated pCO2 with
respect to measured pCO2 are due to the combination of two
cumulative effects: (1) a more significant contribution of or-
ganic acids anions to TA in waters with low carbonate alka-
linity and high DOC concentrations; (2) a lower buffering ca-
pacity of the carbonate system at low pH, which increases the
sensitivity of calculated pCO2 to TA in acidic and organic-
rich waters. No empirical relationship could be derived from
our data set in order to correct calculated pCO2 for this bias.
Owing to the widespread distribution of acidic, organic-rich
freshwaters, we conclude that regional and global estimates
of CO2 outgassing from freshwaters based on pH and TA
data only are most likely overestimated, although the magni-
tude of the overestimation needs further quantitative analysis.
Direct measurements of pCO2 are recommended in inland
waters in general, and in particular in acidic, poorly buffered
freshwaters.
1 Introduction
Inland waters (streams, rivers, lakes, reservoirs, wetlands) re-
ceive carbon from terrestrial landscapes, usually have a net
heterotrophic metabolism, and emit significant amounts of
CO2 to the atmosphere (Kempe 1984; Cole et al., 1994; Ray-
mond et al., 2013). This terrestrial–aquatic–atmosphere link
in the global carbon cycle is controlled by complex biogeo-
graphical drivers that generate strong spatial and temporal
variations in the chemical composition of freshwaters and
the intensity of CO2 outgassing at the water–air interface
(e.g. Tamooh et al., 2013; Dinsmore et al., 2013; Abril et
al., 2014; Borges et al., 2014). Hence, large data sets are nec-
essary in order to describe the environmental factors control-
ling these CO2 emissions and to quantify global CO2 fluxes
from inland waters (Sobek et al., 2005; Barros et al., 2011;
Raymond et al., 2013). Dissolved inorganic carbon (DIC)
concentration and speciation in freshwaters greatly depend
Published by Copernicus Publications on behalf of the European Geosciences Union.
68 G. Abril et al.: Overestimation of pCO2 calculated from pH and alkalinity in freshwaters
on the lithological nature of watersheds (Meybeck 1987).
For instance, rivers draining watersheds rich in carbonate
rocks have a high DIC concentration, generally well above
1000 µmol L−1. Bicarbonate ions contribute to most of the
total alkalinity (TA) in these waters, which have high con-
ductivities and high pH. In these hard waters, dissolved CO2
represents a minor fraction (5–15 %) of the DIC compared to
bicarbonates. In rivers draining organic-rich soils and non-
carbonate rocks, DIC concentrations are lower (typically a
few hundred µmol L−1) but dissolved organic carbon (DOC)
concentrations are higher, and commonly exceed the DIC
concentrations. Organic acid anions significantly contribute
to TA of these soft waters (Driscoll et al., 1989; Hemond
1990), which have low conductivities and low pH. Dissolved
CO2 represents a large, generally dominant, fraction of DIC
in these acidic, organic-rich waters.
Fluxes of CO2 between aquatic systems and the atmo-
sphere can be computed from the water–air gradient of the
concentration of CO2 and the gas transfer velocity (Liss and
Slater, 1974) at local (e.g. Raymond et al., 1997), regional
(e.g. Teodoru et al., 2009), and global scales (e.g. Cole et
al., 1994; Raymond et al., 2013). The partial pressure of
CO2 (pCO2) is relatively constant in the atmosphere com-
pared to surface freshwaters pCO2 that can vary by more
than 4 orders of magnitude spatially and temporally (Sobek
et al., 2005; Abril et al., 2014). Consequently, water pCO2
controls the intensity of the air–water flux, together with
the gas transfer velocity. At present, both measured and cal-
culated water pCO2 data are used to compute CO2 fluxes
from freshwater systems, although calculated pCO2 is over-
whelmingly more abundant than directly measured pCO2
(e.g. Cole et al., 1994; Raymond et al., 2013). pCO2 can be
calculated from the dissociation constants of carbonic acid
(which are a function of temperature) and any of the follow-
ing couples of measured variables: pH/TA, pH/DIC, DIC/TA
(Park, 1969). In a majority of cases, calculated pCO2 is
based on the measurements of pH/TA and water temperature.
These three parameters are routinely measured by many en-
vironmental agencies, and constitute a very large database
available for the scientific community. Calculation of pCO2
from pH and TA was initiated in world rivers in the 1970s
(Kempe, 1984) and relies on the dissociation constants of
carbonic acid, and the solubility of CO2, all of which are
temperature-dependent (Harned and Scholes, 1941; Harned
and Davis, 1943; Millero, 1979; Stumm and Morgan, 1996).
Measured pCO2 is based on water–air phase equilibration
either on discrete samples (headspace technique, e.g. Weiss,
1981) or continuously (equilibrator technique, e.g. Frankig-
noulle et al., 2001) using various systems and devices, fol-
lowed by direct, generally infrared (IR), detection of CO2
in the equilibrated gas. Commercial IR gas analysers are be-
coming cheaper and more accurate, stable and compact, and
provide a large range of linear response well adapted to vari-
ability of pCO2 found in freshwaters.
A limited number of studies have compared directly mea-
sured pCO2 to computed pCO2. Earlier examples provided
a comparison between pCO2 measured by headspace equili-
bration coupled to gas chromatography (GC) and pCO2 cal-
culated from pH and DIC (Kratz et al., 1997; Raymond et
al., 1997). Reports by these authors in Wisconsin lakes and
the Hudson River show that the pCO2 values were linearly
correlated but showed a variability of ±500 ppmv around
the 1 : 1 line, over a range of measured pCO2 from 300
to 4000 ppmv. Later, Frankignoulle and Borges (2001) re-
ported the first comparison of pCO2 calculated from pH
and TA and pCO2 measured by equilibration coupled to
an IR analyser in an estuary in Belgium. In this high TA
(2500–4800 µmol L−1) and high pH (> 7.4) system, they
found a good agreement between the two approaches, cal-
culated pCO2 being either overestimated or underestimated,
but always by less than 7 %. In 2003, concomitant measure-
ments of pH, TA and pCO2 were performed in acidic, humic-
rich (“black” type) waters of the Sinnamary River in French
Guiana (Abril et al., 2005, 2006). Calculation of pCO2
from pH (∼ 5) and TA (∼ 200 µmol L−1) gave unrealisti-
cally high values compared to those measured directly with a
headspace technique (typically 30000 ppmv vs. 5000 ppmv).
Direct measurements of CO2 and CH4 outgassing fluxes with
floating chambers and the computation of the respective gas
transfer velocities of these two gases (Guérin et al., 2007)
confirmed that pCO2 values calculated from pH and TA were
overestimated compared to direct measurements in the Sin-
namary River. More recently, Hunt et al. (2011) and Wang
et al. (2013) provided evidence that organic acid anions in
DOC may significantly contribute to TA in some rivers and
generate an overestimation of calculated pCO2. Butman and
Raymond (2011) reported higher calculated than measured
pCO2 in some US streams and rivers, but no information was
available on the potential role of organic acids in this over-
estimation. These authors concluded that the low number of
samples in their study reflected the need for more research
on this topic.
With the growing interest on pCO2 determination in fresh-
waters globally, and given the apparent simplicity and low
cost of pH and TA measurements, the number of publications
that report calculated pCO2 in freshwaters has increased dra-
matically in the past decade. Some of these publications re-
port extremely high and potentially biased pCO2 values in
low-alkalinity and high-DOC systems. It has thus become
necessary to pay attention to this issue and investigate the
occurrence of such potential bias and its magnitude in the
different types of freshwaters. Here, we present a large data
set of concomitant measurements of temperature, pH, TA,
pCO2, and DOC in freshwaters. This is the first compre-
hensive data set to investigate the magnitude of the bias be-
tween calculated and measured pCO2, as it covers the entire
range of variation of most parameters of the carbonate sys-
tem in freshwaters. The objective of this paper is to alert the
scientific community to the occurrence of a bias in pCO2
Biogeosciences, 12, 67–78, 2015 www.biogeosciences.net/12/67/2015/
G. Abril et al.: Overestimation of pCO2 calculated from pH and alkalinity in freshwaters 69
Table 1. Summary of the presented data set. Average, minimum, and maximum values of temperature, DOC, pH (measured on the NBS
scale), total alkalinity (TA), and measured partial pressure of CO2 (pCO2) in the different freshwater ecosystems.
Country Watersheds Temperature DOC pH TA Measured pCO2 N
(◦C) (µmol L−1) (NBS scale) (µmol L−1) (ppmv)
Av. Min. Max. Av. Min. Max. Av. Min. Max. Av. Min. Max. Av. Min. Max.
Brazil Amazon 30.3 27.4 34.3 352 118 633 6.60 4.53 7.60 385 30 1092 4204 36 18400 155
Kenya Athi-Galana-Sabaki 25.9 19.8 36.0 307 29 1133 7.69 6.49 8.57 2290 407 5042 2811 608 10 405 44
DRC Congo 26.3 22.6 28.2 1002 149 3968 6.01 3.94 7.22 212 0 576 6093 1582 15 571 97
DRC/Rwanda Lake Kivu 24.0 23.0 24.7 162 142 201 9.05 8.99 9.17 13 037 12 802 13 338 660 537 772 53
France Leyre 12.5 7.9 19.2 588 142 3625 6.20 4.40 7.41 280 38 1082 4429 901 23 047 92
France Loire 15.5 8.8 19.3 195 167 233 8.70 8.07 9.14 1768 1579 1886 284 65 717 18
Belgium Meuse 18.1 13.3 25.9 229 102 404 7.89 6.95 8.59 2769 360 7141 2292 176 10 033 50
Madagascar Rianila and Betsiboka 25.4 20.2 29.5 138 33 361 6.84 5.83 7.62 233 76 961 1701 508 3847 36
Kenya Shimba Hills 25.1 21.9 31.8 214 36 548 7.37 6.22 8.93 1989 227 14 244 2751 546 9497 9
French Guiana Sinnamary 27.1 24.1 28.7 419 213 596 5.50 5.08 6.30 143 66 290 7770 1358 15 622 49
Kenya Tana 26.6 25.0 27.9 321 193 651 7.65 7.32 8.02 1619 1338 2009 2700 845 6014 51
Zambia/Mozambique Zambezi 26.9 18.8 31.8 252 103 492 7.59 5.06 9.08 1245 52 3134 2695 151 14 004 107
Entire data set 24.6 7.9 36.0 408 29 3968 7.00 3.94 9.17 1731 0 14 244 3707 36 23 047 761
calculation from pH and TA in acidic, poorly buffered and
organic-rich freshwaters, to briefly discuss its origin in terms
of water chemistry, and to provide the range of pH, TA, and
DOC values where pCO2 calculation should be abandoned
and the range where it still gives relatively accurate results.
2 Material and methods
2.1 Sample collection
Our data set consists of 761 concomitant measurements of
temperature, pH, TA, water pCO2, and DOC in 12 contrast-
ing tropical and temperate systems in Europe, Amazonia, and
Africa (Fig. 1; Table 1). These samples were obtained in the
Central Amazon River and floodplains system in Brazil, the
Athi-Galana-Sabaki River in Kenya, the Tana River (Kenya),
small rivers draining the Shimba Hills in southeastern Kenya,
the Congo River and tributaries in the Democratic Repub-
lic of the Congo (DRC), Lake Kivu in Rwanda and DRC,
the Leyre River and tributaries in France, the Loire River in
France, the Meuse River in Belgium, the Rianila and Betsi-
boka rivers in Madagascar, the Sinnamary River downstream
of the Petit Saut Reservoir in French Guiana, and the Zam-
bezi River in Zambia and Mozambique (Fig. 1). Details on
some of the sampling sites can be found in Abril et al. (2005,
2014), Borges et al. (2012, 2014), Marwick et al. (2014a,
b), Polsenaere et al. (2013), Tamooh et al. (2013), Teodoru
et al. (2014). These watersheds span a range of climates
and are occupied by different types of land cover, which
include tropical rainforest (Amazon, Congo, Rianila), dry
savannah (Tana, Athi-Galana-Sabaki, Betsiboka, Zambezi),
temperate pine forest growing on podzols (Leyre), mixed
temperate forest, grassland, and cropland (Meuse), and crop-
land (Loire). Lithology is also extremely contrasted as it in-
cludes for instance carbonate-rocks-dominated watershed as
for the Meuse, sandstone-dominated silicates (Leyre), and
precambrian crystalline magmatic and metamorphic rocks
with a small proportion of carbonate and evaporite rocks for
the Congo river.
2.2 Field and laboratory measurements
Although pH measurements might seem almost trivial,
highly accurate and precise pH data are in fact not easy to ob-
tain, especially in low-ionic strength waters, where electrode
readings are generally less stable. Even though pH measure-
ments in the laboratory might be more accurate, it is cru-
cial to measure pH in situ or immediately after sampling, as
pH determination several hours or days after sampling will
be affected by CO2 degassing and/or microbial respiration
(Frankignoulle and Borges, 2001). In this work, water tem-
perature and pH were measured in the field with different
probes depending on the origin of the data set. However, all
the pH data were obtained with glass electrodes and rely on
daily calibration with two-point United States National Bu-
reau of Standards (NBS) standards (4 and 7). Measurements
were performed directly in the surface water, or in collected
water immediately after sampling.
Several techniques were used to measure water pCO2.
Water–gas equilibration was performed with a marbles-type
equilibrator (Frankignoulle et al., 2001) for the Amazon,
Loire, Leyre, Sinnamary, and Congo rivers (December 2013)
as well for Lake Kivu, or with a Liqui-Cel MiniModule mem-
brane contactor equilibrator (see Teodoru et al., 2009, 2014)
for the Zambezi and some sites within the Congo basin (De-
cember 2012): water was pumped either continuously from
a ship, or on an ad hoc basis from the bank of the rivers
after waiting ∼ 15 min for complete equilibration; air was
continuously pumped from the equilibrator to the gas anal-
yser (see e.g. Abril et al., 2014 for a more detailed descrip-
tion of the system). A syringe-headspace technique (Kratz
et al., 1997; Teodoru et al., 2009) was used in the field in
all African rivers and in the Meuse River: 30 mL volume
of atmospheric air was equilibrated with 30 mL volume of
river water by vigorously shaking during 5–10 min in four
www.biogeosciences.net/12/67/2015/ Biogeosciences, 12, 67–78, 2015
70 G. Abril et al.: Overestimation of pCO2 calculated from pH and alkalinity in freshwaters
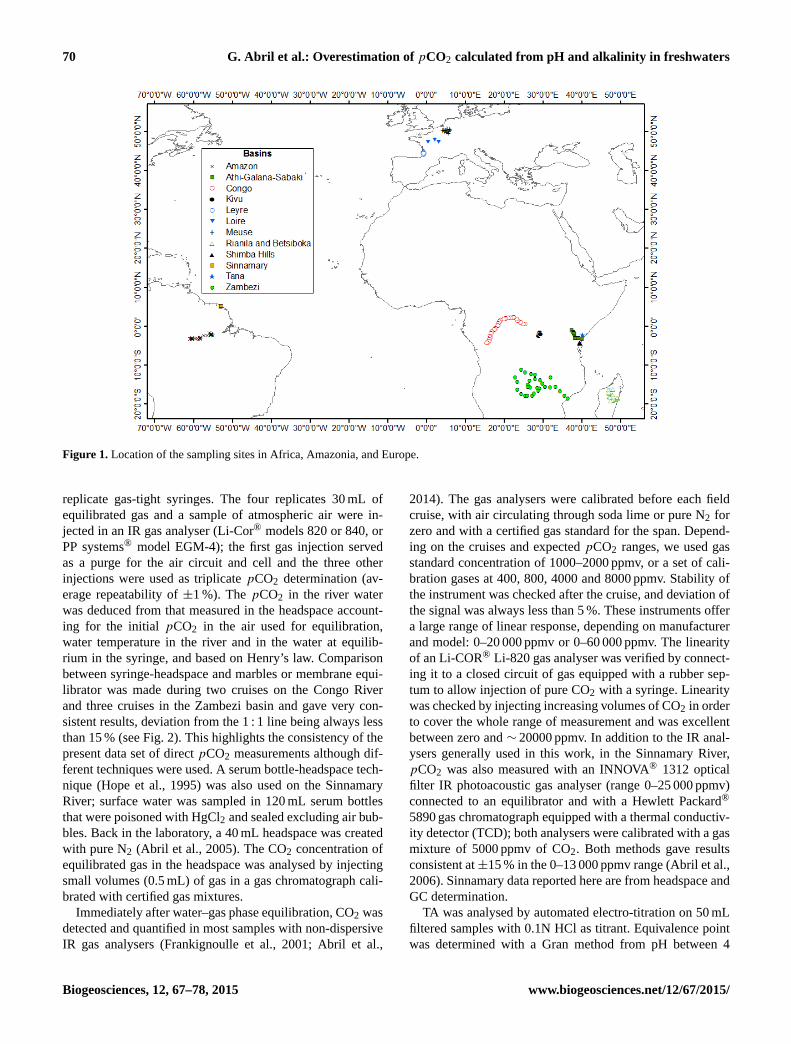
Figure 1. Location of the sampling sites in Africa, Amazonia, and Europe.
replicate gas-tight syringes. The four replicates 30 mL of
equilibrated gas and a sample of atmospheric air were in-
jected in an IR gas analyser (Li-Cor® models 820 or 840, or
PP systems® model EGM-4); the first gas injection served
as a purge for the air circuit and cell and the three other
injections were used as triplicate pCO2 determination (av-
erage repeatability of ±1 %). The pCO2 in the river water
was deduced from that measured in the headspace account-
ing for the initial pCO2 in the air used for equilibration,
water temperature in the river and in the water at equilib-
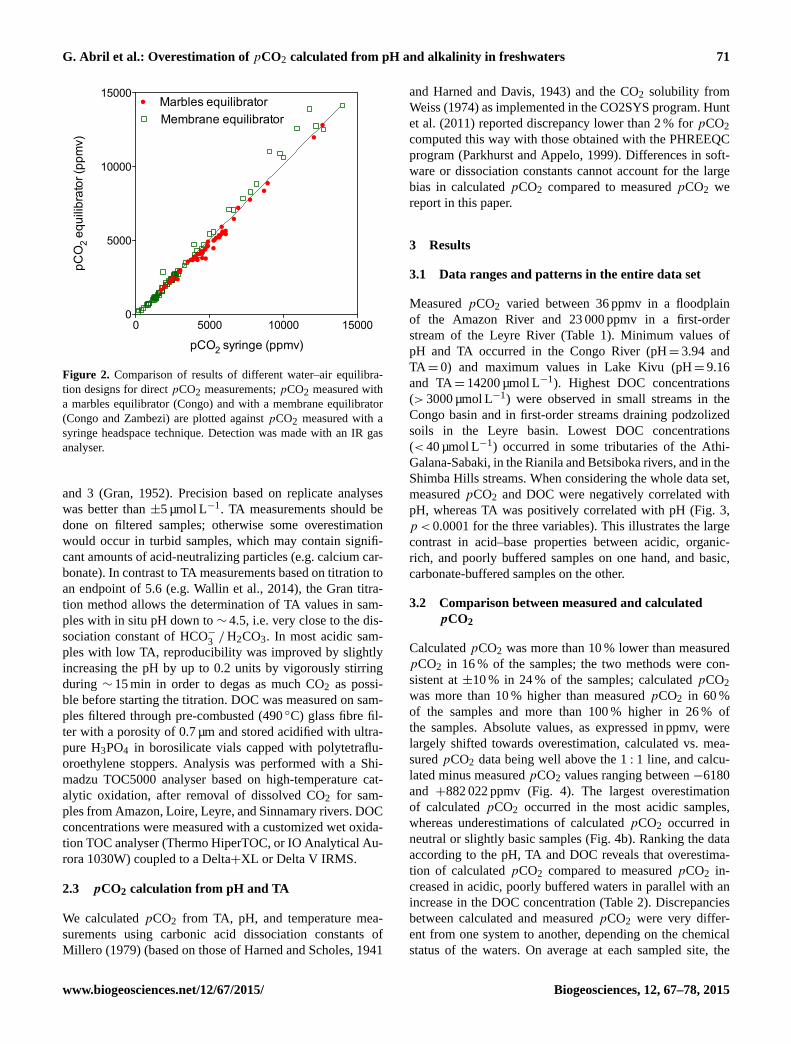
rium in the syringe, and based on Henry’s law. Comparison
between syringe-headspace and marbles or membrane equi-
librator was made during two cruises on the Congo River
and three cruises in the Zambezi basin and gave very con-
sistent results, deviation from the 1 : 1 line being always less
than 15 % (see Fig. 2). This highlights the consistency of the
present data set of direct pCO2 measurements although dif-
ferent techniques were used. A serum bottle-headspace tech-
nique (Hope et al., 1995) was also used on the Sinnamary
River; surface water was sampled in 120 mL serum bottles
that were poisoned with HgCl2 and sealed excluding air bub-
bles. Back in the laboratory, a 40 mL headspace was created
with pure N2 (Abril et al., 2005). The CO2 concentration of
equilibrated gas in the headspace was analysed by injecting
small volumes (0.5 mL) of gas in a gas chromatograph cali-
brated with certified gas mixtures.
Immediately after water–gas phase equilibration, CO2 was
detected and quantified in most samples with non-dispersive
IR gas analysers (Frankignoulle et al., 2001; Abril et al.,
2014). The gas analysers were calibrated before each field
cruise, with air circulating through soda lime or pure N2 for
zero and with a certified gas standard for the span. Depend-
ing on the cruises and expected pCO2 ranges, we used gas
standard concentration of 1000–2000 ppmv, or a set of cali-
bration gases at 400, 800, 4000 and 8000 ppmv. Stability of
the instrument was checked after the cruise, and deviation of
the signal was always less than 5 %. These instruments offer
a large range of linear response, depending on manufacturer
and model: 0–20 000 ppmv or 0–60 000 ppmv. The linearity
of an Li-COR® Li-820 gas analyser was verified by connect-
ing it to a closed circuit of gas equipped with a rubber sep-
tum to allow injection of pure CO2 with a syringe. Linearity
was checked by injecting increasing volumes of CO2 in order
to cover the whole range of measurement and was excellent
between zero and ∼ 20000 ppmv. In addition to the IR anal-
ysers generally used in this work, in the Sinnamary River,
pCO2 was also measured with an INNOVA® 1312 optical
filter IR photoacoustic gas analyser (range 0–25 000 ppmv)
connected to an equilibrator and with a Hewlett Packard®
5890 gas chromatograph equipped with a thermal conductiv-
ity detector (TCD); both analysers were calibrated with a gas
mixture of 5000 ppmv of CO2. Both methods gave results
consistent at±15 % in the 0–13 000 ppmv range (Abril et al.,
2006). Sinnamary data reported here are from headspace and
GC determination.
TA was analysed by automated electro-titration on 50 mL
filtered samples with 0.1N HCl as titrant. Equivalence point
was determined with a Gran method from pH between 4
Biogeosciences, 12, 67–78, 2015 www.biogeosciences.net/12/67/2015/
G. Abril et al.: Overestimation of pCO2 calculated from pH and alkalinity in freshwaters 71
0 5000 10000 150000
5000
10000
15000
pCO2 syringe (ppmv)
pCO
2 equ
ilibr
ator
(ppm
v)
Marbles equilibratorMembrane equilibrator
Figure 2. Comparison of results of different water–air equilibra-
tion designs for direct pCO2 measurements; pCO2 measured with
a marbles equilibrator (Congo) and with a membrane equilibrator
(Congo and Zambezi) are plotted against pCO2 measured with a
syringe headspace technique. Detection was made with an IR gas
analyser.
and 3 (Gran, 1952). Precision based on replicate analyses
was better than ±5 µmol L−1. TA measurements should be
done on filtered samples; otherwise some overestimation
would occur in turbid samples, which may contain signifi-
cant amounts of acid-neutralizing particles (e.g. calcium car-
bonate). In contrast to TA measurements based on titration to
an endpoint of 5.6 (e.g. Wallin et al., 2014), the Gran titra-
tion method allows the determination of TA values in sam-
ples with in situ pH down to ∼ 4.5, i.e. very close to the dis-
sociation constant of HCO−3 / H2CO3. In most acidic sam-
ples with low TA, reproducibility was improved by slightly
increasing the pH by up to 0.2 units by vigorously stirring
during ∼ 15 min in order to degas as much CO2 as possi-
ble before starting the titration. DOC was measured on sam-
ples filtered through pre-combusted (490 ◦C) glass fibre fil-
ter with a porosity of 0.7 µm and stored acidified with ultra-
pure H3PO4 in borosilicate vials capped with polytetraflu-
oroethylene stoppers. Analysis was performed with a Shi-
madzu TOC5000 analyser based on high-temperature cat-
alytic oxidation, after removal of dissolved CO2 for sam-
ples from Amazon, Loire, Leyre, and Sinnamary rivers. DOC
concentrations were measured with a customized wet oxida-
tion TOC analyser (Thermo HiperTOC, or IO Analytical Au-
rora 1030W) coupled to a Delta+XL or Delta V IRMS.
2.3 pCO2 calculation from pH and TA
We calculated pCO2 from TA, pH, and temperature mea-
surements using carbonic acid dissociation constants of
Millero (1979) (based on those of Harned and Scholes, 1941
and Harned and Davis, 1943) and the CO2 solubility from
Weiss (1974) as implemented in the CO2SYS program. Hunt
et al. (2011) reported discrepancy lower than 2 % for pCO2
computed this way with those obtained with the PHREEQC
program (Parkhurst and Appelo, 1999). Differences in soft-
ware or dissociation constants cannot account for the large
bias in calculated pCO2 compared to measured pCO2 we
report in this paper.
3 Results
3.1 Data ranges and patterns in the entire data set
Measured pCO2 varied between 36 ppmv in a floodplain
of the Amazon River and 23 000 ppmv in a first-order
stream of the Leyre River (Table 1). Minimum values of
pH and TA occurred in the Congo River (pH= 3.94 and
TA= 0) and maximum values in Lake Kivu (pH= 9.16
and TA= 14200 µmol L−1). Highest DOC concentrations
(> 3000 µmol L−1) were observed in small streams in the
Congo basin and in first-order streams draining podzolized
soils in the Leyre basin. Lowest DOC concentrations
(< 40 µmol L−1) occurred in some tributaries of the Athi-
Galana-Sabaki, in the Rianila and Betsiboka rivers, and in the
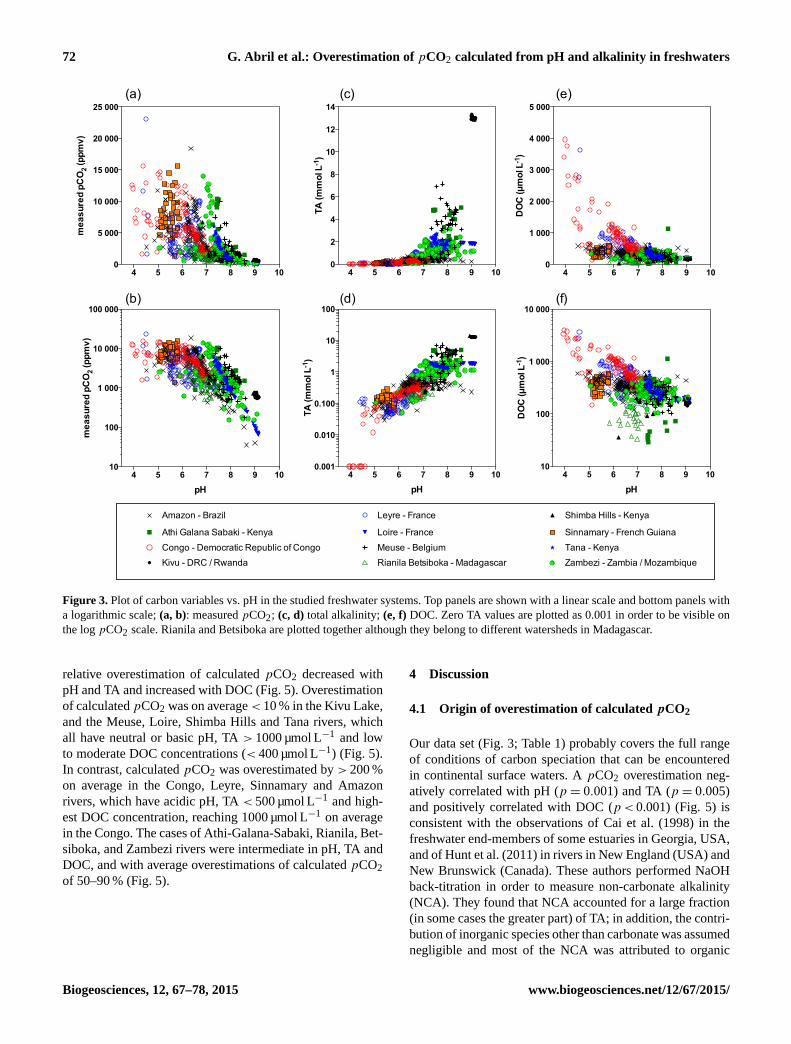
Shimba Hills streams. When considering the whole data set,
measured pCO2 and DOC were negatively correlated with
pH, whereas TA was positively correlated with pH (Fig. 3,
p < 0.0001 for the three variables). This illustrates the large
contrast in acid–base properties between acidic, organic-
rich, and poorly buffered samples on one hand, and basic,
carbonate-buffered samples on the other.
3.2 Comparison between measured and calculated
pCO2
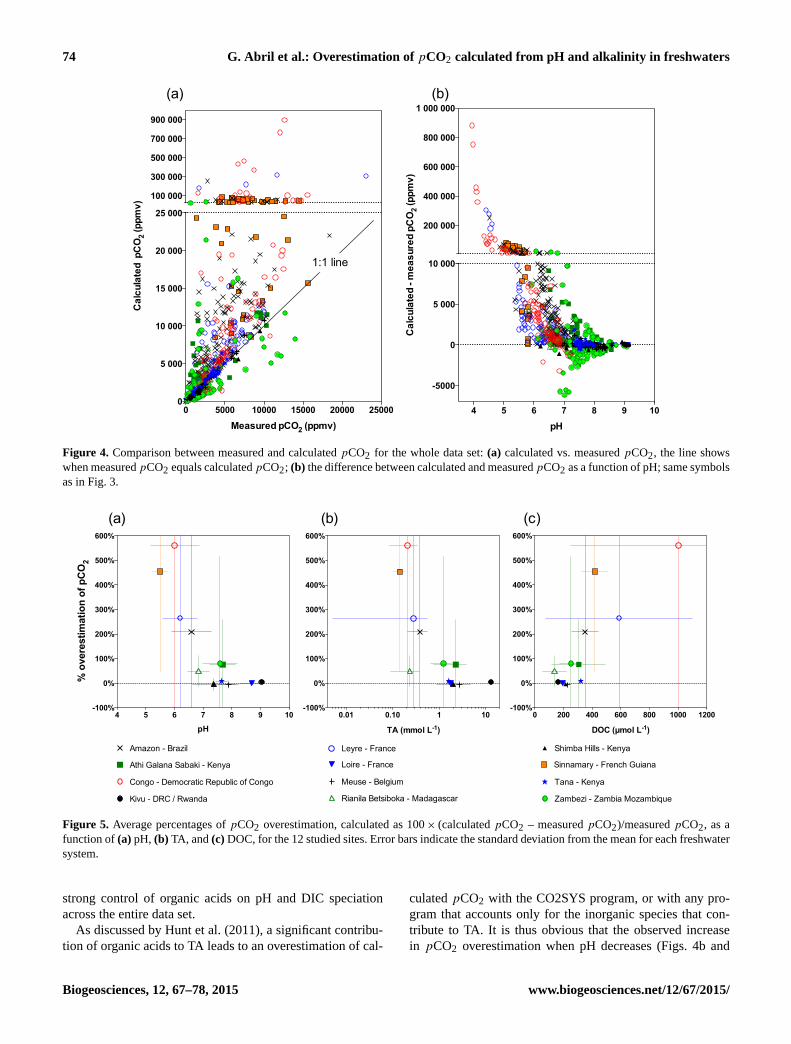
Calculated pCO2 was more than 10 % lower than measured
pCO2 in 16 % of the samples; the two methods were con-
sistent at ±10 % in 24 % of the samples; calculated pCO2
was more than 10 % higher than measured pCO2 in 60 %
of the samples and more than 100 % higher in 26 % of
the samples. Absolute values, as expressed in ppmv, were
largely shifted towards overestimation, calculated vs. mea-
sured pCO2 data being well above the 1 : 1 line, and calcu-
lated minus measured pCO2 values ranging between −6180
and +882 022 ppmv (Fig. 4). The largest overestimation
of calculated pCO2 occurred in the most acidic samples,
whereas underestimations of calculated pCO2 occurred in
neutral or slightly basic samples (Fig. 4b). Ranking the data
according to the pH, TA and DOC reveals that overestima-
tion of calculated pCO2 compared to measured pCO2 in-
creased in acidic, poorly buffered waters in parallel with an
increase in the DOC concentration (Table 2). Discrepancies
between calculated and measured pCO2 were very differ-
ent from one system to another, depending on the chemical
status of the waters. On average at each sampled site, the
www.biogeosciences.net/12/67/2015/ Biogeosciences, 12, 67–78, 2015
72 G. Abril et al.: Overestimation of pCO2 calculated from pH and alkalinity in freshwaters
4 5 6 7 8 9 1010
100
1 000
10 000
pH
DO
C (µ
mol
L-1
)Loire - France
Leyre - France
Athi Galana Sabaki - Kenya
Amazon - Brazil
Rianila Betsiboka - Madagascar Zambezi - Zambia / MozambiqueCongo - Democratic Republic of Congo Meuse - BelgiumKivu - DRC / Rwanda
Shimba Hills - Kenya
Tana - KenyaSinnamary - French Guiana
4 5 6 7 8 9 1010
100
1 000
10 000
100 000
pH
mea
sure
d pC
O2 (
ppm
v)
4 5 6 7 8 9 100
5 000
10 000
15 000
20 000
25 000
mea
sure
d pC
O2 (
ppm
v)
4 5 6 7 8 9 100.001
0.010
0.100
1
10
100
pH
TA (m
mol
L-1
)
4 5 6 7 8 9 100
2
4
6
8
10
12
14
TA (m
mol
L-1
)
4 5 6 7 8 9 100
1 000
2 000
3 000
4 000
5 000
DO
C (µ
mol
L-1
)
(a) (c) (e)
(b) (d) (f)
Figure 3. Plot of carbon variables vs. pH in the studied freshwater systems. Top panels are shown with a linear scale and bottom panels with
a logarithmic scale; (a, b): measured pCO2; (c, d) total alkalinity; (e, f) DOC. Zero TA values are plotted as 0.001 in order to be visible on
the log pCO2 scale. Rianila and Betsiboka are plotted together although they belong to different watersheds in Madagascar.
relative overestimation of calculated pCO2 decreased with
pH and TA and increased with DOC (Fig. 5). Overestimation
of calculated pCO2 was on average < 10 % in the Kivu Lake,
and the Meuse, Loire, Shimba Hills and Tana rivers, which
all have neutral or basic pH, TA > 1000 µmol L−1 and low
to moderate DOC concentrations (< 400 µmol L−1) (Fig. 5).
In contrast, calculated pCO2 was overestimated by > 200 %
on average in the Congo, Leyre, Sinnamary and Amazon
rivers, which have acidic pH, TA < 500 µmol L−1 and high-
est DOC concentration, reaching 1000 µmol L−1 on average
in the Congo. The cases of Athi-Galana-Sabaki, Rianila, Bet-
siboka, and Zambezi rivers were intermediate in pH, TA and
DOC, and with average overestimations of calculated pCO2
of 50–90 % (Fig. 5).
4 Discussion
4.1 Origin of overestimation of calculated pCO2
Our data set (Fig. 3; Table 1) probably covers the full range
of conditions of carbon speciation that can be encountered
in continental surface waters. A pCO2 overestimation neg-
atively correlated with pH (p = 0.001) and TA (p = 0.005)
and positively correlated with DOC (p < 0.001) (Fig. 5) is
consistent with the observations of Cai et al. (1998) in the
freshwater end-members of some estuaries in Georgia, USA,
and of Hunt et al. (2011) in rivers in New England (USA) and
New Brunswick (Canada). These authors performed NaOH
back-titration in order to measure non-carbonate alkalinity
(NCA). They found that NCA accounted for a large fraction
(in some cases the greater part) of TA; in addition, the contri-
bution of inorganic species other than carbonate was assumed
negligible and most of the NCA was attributed to organic
Biogeosciences, 12, 67–78, 2015 www.biogeosciences.net/12/67/2015/
G. Abril et al.: Overestimation of pCO2 calculated from pH and alkalinity in freshwaters 73
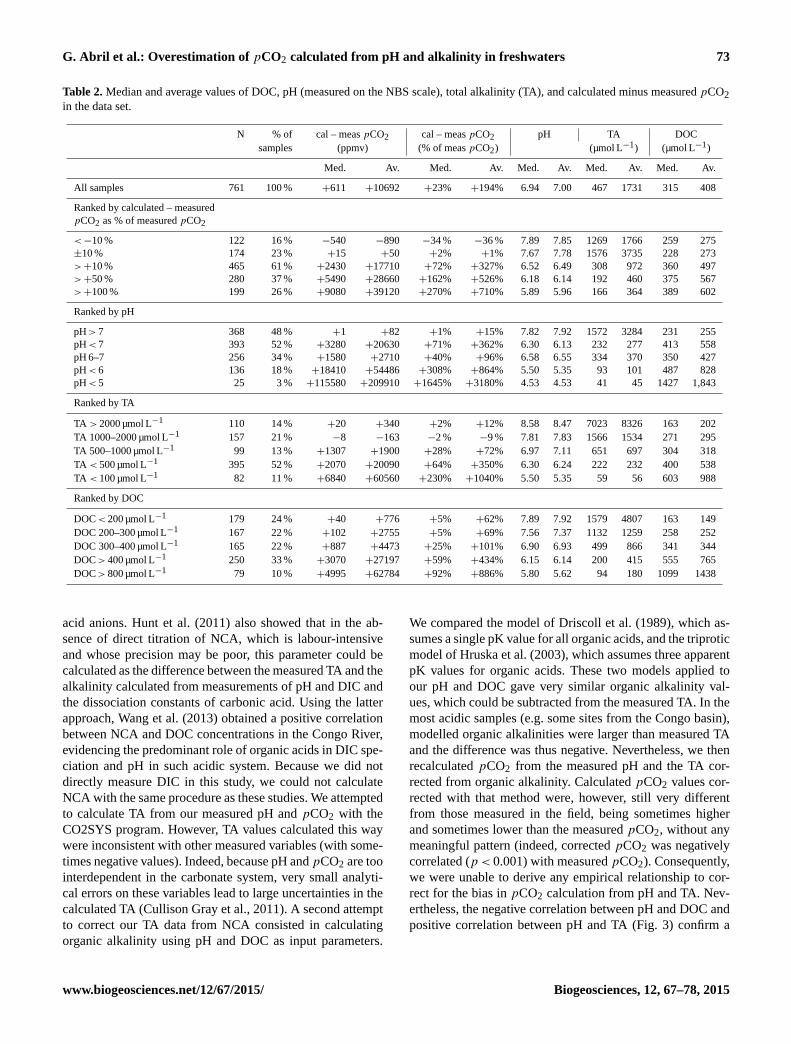
Table 2. Median and average values of DOC, pH (measured on the NBS scale), total alkalinity (TA), and calculated minus measured pCO2
in the data set.
N % of cal – meas pCO2 cal – meas pCO2 pH TA DOC
samples (ppmv) (% of meas pCO2) (µmol L−1) (µmol L−1)
Med. Av. Med. Av. Med. Av. Med. Av. Med. Av.
All samples 761 100 % +611 +10692 +23% +194% 6.94 7.00 467 1731 315 408
Ranked by calculated – measured
pCO2 as % of measured pCO2
<−10 % 122 16 % −540 −890 −34 % −36 % 7.89 7.85 1269 1766 259 275
±10 % 174 23 % +15 +50 +2% +1% 7.67 7.78 1576 3735 228 273
>+10 % 465 61 % +2430 +17710 +72% +327% 6.52 6.49 308 972 360 497
>+50 % 280 37 % +5490 +28660 +162% +526% 6.18 6.14 192 460 375 567
>+100 % 199 26 % +9080 +39120 +270% +710% 5.89 5.96 166 364 389 602
Ranked by pH
pH > 7 368 48 % +1 +82 +1% +15% 7.82 7.92 1572 3284 231 255
pH < 7 393 52 % +3280 +20630 +71% +362% 6.30 6.13 232 277 413 558
pH 6–7 256 34 % +1580 +2710 +40% +96% 6.58 6.55 334 370 350 427
pH < 6 136 18 % +18410 +54486 +308% +864% 5.50 5.35 93 101 487 828
pH < 5 25 3 % +115580 +209910 +1645% +3180% 4.53 4.53 41 45 1427 1,843
Ranked by TA
TA > 2000 µmol L−1 110 14 % +20 +340 +2% +12% 8.58 8.47 7023 8326 163 202
TA 1000–2000 µmol L−1 157 21 % −8 −163 −2 % −9 % 7.81 7.83 1566 1534 271 295
TA 500–1000 µmol L−1 99 13 % +1307 +1900 +28% +72% 6.97 7.11 651 697 304 318
TA < 500 µmol L−1 395 52 % +2070 +20090 +64% +350% 6.30 6.24 222 232 400 538
TA < 100 µmol L−1 82 11 % +6840 +60560 +230% +1040% 5.50 5.35 59 56 603 988
Ranked by DOC
DOC < 200 µmol L−1 179 24 % +40 +776 +5% +62% 7.89 7.92 1579 4807 163 149
DOC 200–300 µmol L−1 167 22 % +102 +2755 +5% +69% 7.56 7.37 1132 1259 258 252
DOC 300–400 µmol L−1 165 22 % +887 +4473 +25% +101% 6.90 6.93 499 866 341 344
DOC > 400 µmol L−1 250 33 % +3070 +27197 +59% +434% 6.15 6.14 200 415 555 765
DOC > 800 µmol L−1 79 10 % +4995 +62784 +92% +886% 5.80 5.62 94 180 1099 1438
acid anions. Hunt et al. (2011) also showed that in the ab-
sence of direct titration of NCA, which is labour-intensive
and whose precision may be poor, this parameter could be
calculated as the difference between the measured TA and the
alkalinity calculated from measurements of pH and DIC and
the dissociation constants of carbonic acid. Using the latter
approach, Wang et al. (2013) obtained a positive correlation
between NCA and DOC concentrations in the Congo River,
evidencing the predominant role of organic acids in DIC spe-
ciation and pH in such acidic system. Because we did not
directly measure DIC in this study, we could not calculate
NCA with the same procedure as these studies. We attempted
to calculate TA from our measured pH and pCO2 with the
CO2SYS program. However, TA values calculated this way
were inconsistent with other measured variables (with some-
times negative values). Indeed, because pH and pCO2 are too
interdependent in the carbonate system, very small analyti-
cal errors on these variables lead to large uncertainties in the
calculated TA (Cullison Gray et al., 2011). A second attempt
to correct our TA data from NCA consisted in calculating
organic alkalinity using pH and DOC as input parameters.
We compared the model of Driscoll et al. (1989), which as-
sumes a single pK value for all organic acids, and the triprotic
model of Hruska et al. (2003), which assumes three apparent
pK values for organic acids. These two models applied to
our pH and DOC gave very similar organic alkalinity val-
ues, which could be subtracted from the measured TA. In the
most acidic samples (e.g. some sites from the Congo basin),
modelled organic alkalinities were larger than measured TA
and the difference was thus negative. Nevertheless, we then
recalculated pCO2 from the measured pH and the TA cor-
rected from organic alkalinity. Calculated pCO2 values cor-
rected with that method were, however, still very different
from those measured in the field, being sometimes higher
and sometimes lower than the measured pCO2, without any
meaningful pattern (indeed, corrected pCO2 was negatively
correlated (p < 0.001) with measured pCO2). Consequently,
we were unable to derive any empirical relationship to cor-
rect for the bias in pCO2 calculation from pH and TA. Nev-
ertheless, the negative correlation between pH and DOC and
positive correlation between pH and TA (Fig. 3) confirm a
www.biogeosciences.net/12/67/2015/ Biogeosciences, 12, 67–78, 2015
74 G. Abril et al.: Overestimation of pCO2 calculated from pH and alkalinity in freshwaters
0 5000 10000 15000 20000 250000
5 000
10 000
15 000
20 000
25 000
100 000
300 000
500 000
700 000
900 000
Measured pCO2 (ppmv)
Cal
cula
ted
pC
O2 (
ppm
v)
1:1 line
4 5 6 7 8 9 10
-5000
0
5 000
10 000
200 000
400 000
600 000
800 000
1 000 000
pH
Cal
cula
ted
- mea
sure
d pC
O2 (
ppm
v)
(a) (b)
Figure 4. Comparison between measured and calculated pCO2 for the whole data set: (a) calculated vs. measured pCO2, the line shows
when measured pCO2 equals calculated pCO2; (b) the difference between calculated and measured pCO2 as a function of pH; same symbols
as in Fig. 3.
4 5 6 7 8 9 10-100%
0%
100%
200%
300%
400%
500%
600%
pH
% o
vere
stim
atio
n of
pC
O2
Amazon - Brazil
Athi Galana Sabaki - Kenya
Congo - Democratic Republic of Congo
Kivu - DRC / Rwanda
0.01 0.10 1 10-100%
0%
100%
200%
300%
400%
500%
600%
TA (mmol L-1)
Loire - France
Leyre - France
Rianila Betsiboka - Madagascar
Meuse - Belgium
0 200 400 600 800 1000 1200-100%
0%
100%
200%
300%
400%
500%
600%
DOC (µmol L-1)
Sinnamary - French Guiana
Shimba Hills - Kenya
Zambezi - Zambia Mozambique
Tana - Kenya
(a) (b) (c)
Figure 5. Average percentages of pCO2 overestimation, calculated as 100× (calculated pCO2 – measured pCO2)/measured pCO2, as a
function of (a) pH, (b) TA, and (c) DOC, for the 12 studied sites. Error bars indicate the standard deviation from the mean for each freshwater
system.
strong control of organic acids on pH and DIC speciation
across the entire data set.
As discussed by Hunt et al. (2011), a significant contribu-
tion of organic acids to TA leads to an overestimation of cal-
culated pCO2 with the CO2SYS program, or with any pro-
gram that accounts only for the inorganic species that con-
tribute to TA. It is thus obvious that the observed increase
in pCO2 overestimation when pH decreases (Figs. 4b and
Biogeosciences, 12, 67–78, 2015 www.biogeosciences.net/12/67/2015/
G. Abril et al.: Overestimation of pCO2 calculated from pH and alkalinity in freshwaters 75
dpCO2 / dTA
104
105
106
107
108
109
1010dp
CO
2/dTA
(ppm
v m
ol-1
)
4 5 6 7 8 9100
101
102
103
104
105
106
107
pH
Cal
cula
ted
- mea
sure
d pC
O2 (
ppm
v)
TA + 0.005 mmol L-1TA + 0.020 mmol L-1TA + 0.100 mmol L-1TA + 0.500 mmol L-1
(a)
(b)
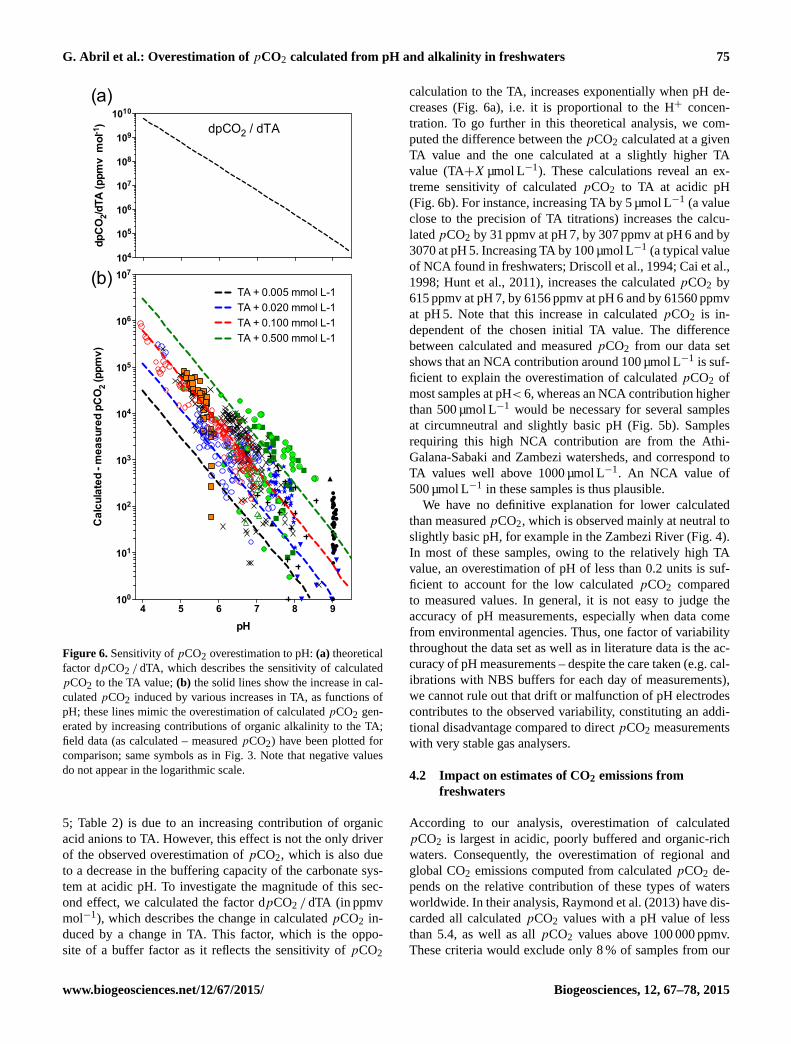
Figure 6. Sensitivity of pCO2 overestimation to pH: (a) theoretical
factor dpCO2 / dTA, which describes the sensitivity of calculated
pCO2 to the TA value; (b) the solid lines show the increase in cal-
culated pCO2 induced by various increases in TA, as functions of
pH; these lines mimic the overestimation of calculated pCO2 gen-
erated by increasing contributions of organic alkalinity to the TA;
field data (as calculated – measured pCO2) have been plotted for
comparison; same symbols as in Fig. 3. Note that negative values
do not appear in the logarithmic scale.
5; Table 2) is due to an increasing contribution of organic
acid anions to TA. However, this effect is not the only driver
of the observed overestimation of pCO2, which is also due
to a decrease in the buffering capacity of the carbonate sys-
tem at acidic pH. To investigate the magnitude of this sec-
ond effect, we calculated the factor dpCO2 / dTA (in ppmv
mol−1), which describes the change in calculated pCO2 in-
duced by a change in TA. This factor, which is the oppo-
site of a buffer factor as it reflects the sensitivity of pCO2
calculation to the TA, increases exponentially when pH de-
creases (Fig. 6a), i.e. it is proportional to the H+ concen-
tration. To go further in this theoretical analysis, we com-
puted the difference between the pCO2 calculated at a given
TA value and the one calculated at a slightly higher TA
value (TA+X µmol L−1). These calculations reveal an ex-
treme sensitivity of calculated pCO2 to TA at acidic pH
(Fig. 6b). For instance, increasing TA by 5 µmol L−1 (a value
close to the precision of TA titrations) increases the calcu-
lated pCO2 by 31 ppmv at pH 7, by 307 ppmv at pH 6 and by
3070 at pH 5. Increasing TA by 100 µmol L−1 (a typical value
of NCA found in freshwaters; Driscoll et al., 1994; Cai et al.,
1998; Hunt et al., 2011), increases the calculated pCO2 by
615 ppmv at pH 7, by 6156 ppmv at pH 6 and by 61560 ppmv
at pH 5. Note that this increase in calculated pCO2 is in-
dependent of the chosen initial TA value. The difference
between calculated and measured pCO2 from our data set
shows that an NCA contribution around 100 µmol L−1 is suf-
ficient to explain the overestimation of calculated pCO2 of
most samples at pH< 6, whereas an NCA contribution higher
than 500 µmol L−1 would be necessary for several samples
at circumneutral and slightly basic pH (Fig. 5b). Samples
requiring this high NCA contribution are from the Athi-
Galana-Sabaki and Zambezi watersheds, and correspond to
TA values well above 1000 µmol L−1. An NCA value of
500 µmol L−1 in these samples is thus plausible.
We have no definitive explanation for lower calculated
than measured pCO2, which is observed mainly at neutral to
slightly basic pH, for example in the Zambezi River (Fig. 4).
In most of these samples, owing to the relatively high TA
value, an overestimation of pH of less than 0.2 units is suf-
ficient to account for the low calculated pCO2 compared
to measured values. In general, it is not easy to judge the
accuracy of pH measurements, especially when data come
from environmental agencies. Thus, one factor of variability
throughout the data set as well as in literature data is the ac-
curacy of pH measurements – despite the care taken (e.g. cal-
ibrations with NBS buffers for each day of measurements),
we cannot rule out that drift or malfunction of pH electrodes
contributes to the observed variability, constituting an addi-
tional disadvantage compared to direct pCO2 measurements
with very stable gas analysers.
4.2 Impact on estimates of CO2 emissions from
freshwaters
According to our analysis, overestimation of calculated
pCO2 is largest in acidic, poorly buffered and organic-rich
waters. Consequently, the overestimation of regional and
global CO2 emissions computed from calculated pCO2 de-
pends on the relative contribution of these types of waters
worldwide. In their analysis, Raymond et al. (2013) have dis-
carded all calculated pCO2 values with a pH value of less
than 5.4, as well as all pCO2 values above 100 000 ppmv.
These criteria would exclude only 8 % of samples from our
www.biogeosciences.net/12/67/2015/ Biogeosciences, 12, 67–78, 2015
76 G. Abril et al.: Overestimation of pCO2 calculated from pH and alkalinity in freshwaters
data set. Indeed, from our analysis, it appears that overesti-
mation of calculated pCO2 occurs at pH much higher than
5.4 (Figs. 4, 5 and 6; Table 2). The two techniques were
consistent at ±10 % on average in only 5 of the 12 studied
systems, which combine a circumneutral to basic pH with
a TA concentration well above 1000 µmol L−1 (Fig. 5). Al-
though it would not be sufficient for the cases of the Zam-
bezi and Athi-Galana-Sabaki rivers, where overestimation is
still significant, a TA value above 1000 µmol L−1 appears
as a more robust criterion than a pH threshold to separate
calculated pCO2 values affected by bias from those consis-
tent with measured pCO2 (Table 2). In fact, pCO2 calcu-
lation from pH and TA in freshwaters historically relies on
theoretical background and validation data in high-alkalinity
waters (Neal et al., 1998), including karstic waters (Kempe,
1975). At the global scale, high TA typically occurs in rivers
draining watersheds with a significant proportion of carbon-
ate rocks, typically > 30 % of their surface area if the crite-
rion of TA > 1000 µmol L−1 is chosen and the normalized
weathering rates of Meybeck (1987) are applied. Accord-
ing to Meybeck (1987), the average and discharge-weighted
TA is around 900 µmol L−1 for world rivers and around
600 µmol L−1 for tropical rivers. Among the 25 largest rivers
in the world, 15 have a TA > 1000 µmol L−1 according to Cai
et al. (2008). The two largest rivers in the world in terms of
discharge, the Amazon and the Congo, are also well below
this limit of 1000 µmol L−1 and have large overestimation in
calculated pCO2 (on average 200 and 360 %, respectively).
Very low TA and pH and high DOC values have also been
reported in boreal streams and rivers (Humborg et al., 2010;
Dinsmore et al., 2012; Wallin et al., 2014).
In lakes, the highest pCO2 values in the literature come
from tropical black water lakes and were also calculated
rather than directly measured (Sobek et al., 2005). Calcu-
lated pCO2 was 65 250 ppmv in Lago Tupé in the Brazil-
ian Amazon, a Ria lake connected to the Rio Negro, where,
according to our own data set, pH is below 5 and TA is
around 70 µmol L−1. It was 18 950 ppmv in Kambanain Lake
in Papua New Guinea, corresponding to a pH value of 6.1 and
a TA value of 350 µmol L−1 (Vyverman, 1994). This sug-
gests a widespread overestimation of calculated pCO2 that
significantly impacts the estimation of global CO2 emissions
from inland waters. However, a precise analysis based on ex-
act quantitative information on the relative contribution of
acidic and high- and low-alkalinity waters to the total sur-
face area of inland waters is necessary in order to evaluate
the exact magnitude of the overestimation.
5 Conclusions
From our analysis, it appears that the validity of calculat-
ing pCO2 from pH, TA and temperature is most robust in
freshwaters with circumneutral to basic pH and with TA ex-
ceeding 1000 µmol L−1. At lower TA and pH, however, cal-
culated pCO2 (and hence, CO2 degassing rates) are over-
estimated by 50 to 300 % relative to direct, in situ pCO2
measurements. Since a large majority of freshwater systems
globally have characteristics outside the range of applica-
bility of pCO2 calculation, it appears reasonable to assume
that recent estimates of global CO2 emission from lakes and
rivers, which are based exclusively on calculated pCO2 data,
are too high. We propose that while TA and pH measure-
ments remain useful to describe the aquatic chemistry, data
on pCO2 should in the future rely on direct measurements of
pCO2. Even if some studies report relatively robust calcula-
tion of pCO2 from pH and DIC measurements (Raymond et
al., 1997; Kratz et al., 1997; Aberg and Wallin, 2014), direct
pCO2 values in the field are stable, precise and straightfor-
ward and do not depend on the quality of pH measurements,
which are often uncertain. Further, high-quality DIC mea-
surements are very time-consuming, fairly complicated to set
up and do not allow continuous measurements to be carried
out in a simple and straightforward fashion. Although there
are some practical limitations to their use in the field, sub-
merged IR sensors, which allow high temporal resolution, are
also promising (Johnson et al., 2010). Long-term instrument
stability and accuracy based on newly developed off-axis
integrated cavity output spectroscopy and cavity ring-down
spectroscopy technologies seem to improve in comparison to
traditional IR instruments, although the latter are more af-
fordable, more compact and have lower power requirements.
Joint international efforts are necessary to define the most ap-
propriate protocols for the measurement of DIC parameters
in freshwaters.
Acknowledgements. The data set used in this study was collected
in the framework of projects funded by the Cluster of Excel-
lence COTE at the Université de Bordeaux (ANR-10-LABX-45,
CNP-Leyre project), the European Research Council (ERC-StG
240002, AFRIVAL: African river basins: Catchment-scale carbon
fluxes and transformations, http://ees.kuleuven.be/project/afrival/),
the Fonds National de la Recherche Scientifique (FNRS,
CAKI, 2.4.598.07, TransCongo, 14711103), the French national
agency for research (ANR 08-BLAN-0221, CARBAMA project
http://carbama.epoc.u-bordeaux1.fr/), the Research Foundation
Flanders (FWO-Vlaanderen), the Belgian Federal Science Policy
(BELSPO-SSD projects COBAFISH and EAGLES), the Research
Council of the KU Leuven, and the Institut de Radioprotection et
Sureté Nucléaire, France (FLORE project). We thank the Hydreco
Laboratory in French Guiana, and Patrick Albéric (ISTO Orléans)
who analysed some of the data reported here, Aurore Beulen (ULg)
for collection of Meuse data set, Marc-Vincent Commarieu (ULg)
for analytical support, two anonymous reviewers and C. W. Hunt
(reviewer) for constructive comments on the previous version of
the paper. AVB is a senior research associate at the FNRS.
Edited by: J. Middelburg
Biogeosciences, 12, 67–78, 2015 www.biogeosciences.net/12/67/2015/
G. Abril et al.: Overestimation of pCO2 calculated from pH and alkalinity in freshwaters 77
References
Åberg, J. and Wallin M. B.: Evaluating a fast headspace method for
measuring DIC and subsequent calculation of pCO2 in freshwa-
ter systems, Inland Wat., 4, 157–166, 2014.
Abril, G., Guérin, F., Richard, S., Delmas, R., Galy-Lacaux, C.,
Gosse, P., Tremblay, A., Varfalvy, L., Dos Santos, M. A., and
Matvienko, B.: Carbon dioxide and methane emissions and
the carbon budget of a 10-year old tropical reservoir (Petit-
Saut. French Guiana), Global Biogeochem. Cy., 19, GB4007,
doi:10.1029/2005GB002457, 2005.
Abril, G., Richard, S., and Guérin, F.: In-Situ measurements of dis-
solved gases (CO2 and CH4) in a wide range of concentrations
in a tropical reservoir using an equilibrator, Sc. Total Envir., 354,
246–251, 2006.
Abril, G., Martinez, J.-M., Artigas, L. F., Moreira-Turcq, P.,
Benedetti, M. F., Vidal L., Meziane, T., Kim, J.-H., Bernardes,
M. C., Savoye, N., Deborde, J., Albéric, P., Souza, M. F. L.,
Souza, E. L., and Roland, F.: Amazon River Carbon Dioxide Out-
gassing fuelled by Wetlands, Nature, 505, 395–398, 2014.
Barros, N., Cole, J. J., Tranvik L. J., Prairie Y. T., Bastviken D.,
Huszar V. L. M., del Giorgio P., and Roland F.: Carbon emission
from hydroelectric reservoirs linked to reservoir age and latitude,
Nat. Geosci.,4, 593–596, doi:10.1038/NGEO1211, 2011.
Borges, A. V., Bouillon, S., Abril, G., Delille, B., Poirier, D., Com-
marieu, M.-V., Lepoint, G., Morana, C., Servais, P., Descy, J.-P.,
and Darchambeau, F.: Variability of carbon dioxide and methane
in the epilimnion of Lake Kivu, in: Lake Kivu: Limnology and
biogeochemistry of a tropical great lake, edited by: Descy, J.-P.,
Darchambeau, F., and Schmid, M., Aquatic Ecology Series 5,
Springer, 47–66, 2012.
Borges, A. V., Morana, C., Bouillon, S., Servais, P., Descy, J.-P., and
Darchambeau, F.: Carbon cycling of Lake Kivu (East Africa): net
autotrophy in the epilimnion and emission of CO2 to the atmo-
sphere sustained by geogenic inputs, PLoS ONE, 9, e109500,
doi:10.1371/journal.pone.0109500, 2014.
Butman, D. and Raymond, P.A.: Significant efflux of carbon dioxide
from streams and rivers in the United States, Nature Geosci., 4,
839–842, 2011.
Cai, W.-J., Wang, Y., and Hodson, R. E.: Acid-base properties of
dissolved organic matter in the estuarine waters of Georgia, USA,
Geochim. Cosmochim. Ac., 62, 473–483, 1998.
Cai, W.-J., Guo, X., Chen, C. T. A., Dai, M., Zhang, L., Zhai, W.,
Lohrenz, S. E., Yin, K., Harrison, P. J., and Wang, Y.: A com-
parative overview of weathering intensity and HCO−3
flux in the
world’s major rivers with emphasis on the Changjiang, Huanghe,
Zhujiang (Pearl) and Mississippi Rivers, Cont. Shelf Res., 28,
1538–1549, 2008.
Cole, J. J., Caraco, N., Kling, G. W., and Kratz, T. K.: Carbon diox-
ide supersaturation in the surface waters of lakes, Science, 265,
1568–1570, 1994.
Cullison Gray, S. E., DeGranpre, M. E., Moore, T. S., Martz, T.
R., Friedrich, G. E., and Johnson, K. S.: Applications of in situ
pH measurements for inorganic carbon calculations, Mar. Chem.,
125, 82–90, 2011.
Dinsmore, K. J., Wallin M. B., Johnson, M. S., Billett M. F.,
Bishop, K., Pumpanen, J., and Ojala, A.: Contrasting CO2 con-
centration discharge dynamics in headwater streams: A multi-
catchment comparison, J. Geophys. Res. Biogeosci., 118, 445–
461, doi:10.1002/jgrg.20047, 2012.
Driscoll, C. T., Fuller, R., D., and Schecher, W. D.: The role of or-
ganic acids in the acidification of surface waters in the eastern
US, Water Air Soil Pollut., 43, 21–40, 1989.
Frankignoulle, M. and Borges, A. V.: Direct and indirect pCO2
measurements in a wide range of pCO2 and salinity values,
Aquat. Geochem., 7, 267–273, 2001.
Frankignoulle, M., Borges, A. V., and Biondo, R.: A new design
of equilibrator to monitor carbon dioxide in highly dynamic and
turbid environments, Water Res., 35, 1344–1347, 2001.
Gran, G.: Determination of the equivalence point in potentiometric
titrations of seawater with hydrochloric acid, Oceanol. Acta, 5,
209–218, 1952.
Guérin, F., Abril, G., Serça, D., Delon, C., Richard, S., Delmas, R.,
Tremblay, A., and Varfalvy, L.: Gas transfer velocities of CO2
and CH4 in a tropical reservoir and its river downstream, J. Mar.
Syst., 66, 161–172, 2007.
Harned, H. S. and Scholes, S. R.: The ionization constant of HCO−3
from 0 to 50 ◦C, J. Am. Chem. Soc., 63, 1706–1709, 1941.
Harned, H. S. and Davis, R. D.: The ionization constant of carbonic
acid in water and the solubility of carbon dioxide in water and
aqueous salt solutions from 0 to 50 ◦C, J. Am. Chem. Soc., 65,
2030–2037, 1943.
Hemond, H. F.: Acid neutralizing capacity, alkalinity, and acid-base
status of natural waters containing organic acids, Environ. Sci.
Technol., 24, 1486–1489, 1990.
Hope, D., Dawson, J. J. C., Cresser, M. S., and Billett, M. F.: A
method for measuring free CO2 in upland streamwater using
headspace analysis, J. Hydrol., 166, 1–14, 1995.
Hruska, J., Köhler, S., Laudon, H., and Bishop, K.: Is a universal
model of organic acidity possible: Comparison of the acid/base
properties of dissolved organic carbon in the boreal and temper-
ate zones, Environ. Sci. Technol., 37, 1726–1730, 2003.
Humborg, C., Mörth, C. M., Sundbom, M., Borg, H., Blenckner,
T., Giesler, R., and Ittekkot, V.: CO2 supersaturation along the
aquatic conduit in Swedish watersheds as constrained by ter-
restrial respiration, aquatic respiration and weathering, Glob.
Change Biol., 16, 1966–1978, 2010.
Hunt, C. W., Salisbury, J. E., and Vandemark, D.: Contribution
of non-carbonate anions to total alkalinity and overestimation
of pCO2 in New England and New Brunswick rivers, Biogeo-
sciences, 8, 3069–3076, 2011,
http://www.biogeosciences.net/8/3069/2011/.
Johnson, M. J., Billett, M. F., Dinsmore, K. J., Wallin, M., Dyson,
K. E., and Jassal, R. S.: Direct and continuous measurement of
dissolved carbon dioxide in freshwater aquatic systems-method
and applications, Ecohydrol., 3, 68–78, 2010.
Kempe, S.: A computer program for hydrochemical problems in
karstic water. Annales de Spéléologie 30, 699–702, 1975.
Kempe, S.: Sinks of the anthropogenically enhanced carbon cycle
in surface freshwaters, J. Geophys. Res., 89, 4657–4676, 1984.
Kratz, T. K., Schindler, J., Hope, D., Riera, J. L., and Bowser, C.
J.: Average annual carbon dioxide concentrations in eight neigh-
boring lakes in northern Wisconsin, USA. Verh. Internat. Verein.
Limnol., 26, 335–338, 1997.
Liss, P. S. and Slater P. G,: Flux of gases across the air-sea interface.
Nature, 233, 327–329, 1974.
Marwick, T. R., Tamooh, F., Ogwoka, B., Teodoru, C., Borges, A.
V., Darchambeau, F., and Bouillon S.: Dynamic seasonal nitro-
gen cycling in response to anthropogenic N loading in a tropical
www.biogeosciences.net/12/67/2015/ Biogeosciences, 12, 67–78, 2015
78 G. Abril et al.: Overestimation of pCO2 calculated from pH and alkalinity in freshwaters
catchment, Athi–Galana–Sabaki River, Kenya, Biogeosciences,
11, 1–18, doi:10.5194/bg-11-1-2014, 2014a
Marwick, T. R., Borges A. V., Van Acker K., Darchambeau F.,
and Bouillon S.: Disproportionate contribution of riparian inputs
to organic carbon pools in freshwater systems, Ecosystems, 17,
974–989, 2014b.
Meybeck, M.: Global chemical weathering of surficial rocks es-
timated from river dissolved loads, American J. Science, 287,
401–428, 1987.
Millero, F. J.: The thermodynamics of the carbonic acid system in
seawater, Geochim. Cosmochim. Ac., 43, 1651–1661, 1979.
Neal, C., House, W. A., and Down, K.: An assessment of excess
carbon dioxide partial pressures in natural waters based on pH
and alkalinity measurements, Sc. Total Envir., 210/211, 173–185,
1998.
Park, P. K.: Oceanic CO2 system: An evaluation of ten methods of
investigation, Limnol. Oceanogr., 14, 179–186, 1969.
Parkhurst, D. L. and Appelo, C. A. J.: User’s guide to PHREEQC
(version 2) – A computer program for speciation, batch-reaction,
one-dimensional transport, and inverse geochemical calcula-
tions: US Geol. Surv. Water-Resour. Investigat. Report, 99–4259,
312 pp., 1999.
Polsenaere, P., Savoye, N., Etcheber, H., Canton, M., Poirier, D.,
Bouillon, S., and Abril ,G.: Export and degassing of terrestrial
carbon through watercourses draining a temperate podsolised
catchment, Aquatic Sciences, 75, 299–319, 2013.
Raymond, P. A., Caraco, N. F., and Cole J. J.: Carbon dioxide con-
centration and atmospheric flux in the Hudson River, Estuaries,
20, 381–390, 1997.
Raymond, P. A., Hartmann, J., Lauerwald R., Sobek, S., McDonald,
C., Hoover, M., Butman, D., Striegl R., Mayorga, E., Humborg,
C., Kortelainen, P., Dürr, H., Meybeck, M., Ciais, P., and Guth,
P.: Global carbon dioxide emissions from inland waters, Nature,
503, 355–359, 2013.
Sobek, S., Tranvik L. J., and Cole, J. J.: Temperature independence
of carbon dioxide supersaturation in global lakes, Global Bio-
geochem. Cy., 19, GB2003, doi:10.1029/2004GB002264, 2005.
Stumm, W. and Morgan, J. J.: Aquatic Chemistry, Wiley-
Interscience, New York, 1996.
Tamooh, F., Borges, A. V., Meysman, F. J. R., Van Den Meer-
sche, K., Dehairs, F., Merckx, R., and Bouillon, S.: Dynam-
ics of dissolved inorganic carbon and aquatic metabolism in
the Tana River basin, Kenya, Biogeosciences, 10, 6911–6928,
doi:10.5194/bg-10-6911-2013, 2013.
Teodoru, C. R., del Giorgio P. A., Prairie Y. T., and Camire
M., Patterns in pCO2 in boreal streams and rivers of north-
ern Quebec, Canada, Global Biogeochem. Cy., 23, GB2012,
doi:10.1029/2008GB003404, 2009.
Teodoru, C. R., Nyoni, F. C., Borges, A. V., Darchambeau, F.,
Nyambe, I., and Bouillon, S.: Spatial variability and temporal dy-
namics of greenhouse gas (CO2, CH4, N2O) concentrations and
fluxes along the Zambezi River mainstem and major tributaries,
Biogeosciences Discuss., 11, 16391–16445, doi:10.5194/bgd-
11-16391-2014, 2014.
Vyverman, W.: Limnological Features of Lakes on the Sepik-Ramu
Floodplain, Papua New Guinea Aust, J. Mar. Freshwater Res.,
45, 1209–1224, 1994.
Wallin, M. B., Löfgren, S., Erlandsson, M., and Bishop, K.: Repre-
sentative regional sampling of carbon dioxide and methane con-
centrations in hemiboreal headwater streams reveal underesti-
mates in less systematic approaches, Glob. Biogeochem. Cy., 28,
465–479, 2014.
Wang, Z. A., Bienvenu, D. J., Mann, P. J., Hoering, K. A., Poulsen,
J. R., Spencer, R. G. M., and Holmes, R. M. Inorganic carbon
speciation and fluxes in the Congo River. Geophys. Res. Lett.,
40, 511–516, 2013.
Weiss, R. F.: Carbon dioxide in water and seawater: the solubility
of a non-ideal gas, Mar. Chem., 2, 203–215, 1974.
Weiss, R. F.: Determinations of carbon dioxide and methane by dual
catalyst flame ionization chromatography and nitrous oxide by
electron capture chromatography, J. Chromatogr. Sci., 19, 611–
616, 1981.
Biogeosciences, 12, 67–78, 2015 www.biogeosciences.net/12/67/2015/