Embed Size (px)
Citation preview
This document is issued for the party which commissioned it and for specific purposes connected with the above-captioned project only.
It should not be relied upon by any other party or used for any other purpose.
We accept no responsibility for the consequences of this document being relied upon by any other party, or being used for any other
purpose, or containing any error or omission which is due to an error or omission in data supplied to us by other parties.
This document contains confidential information and proprietary intellectual property. It should not be shown to other parties without
consent from us and from the party which commissioned it. This R eport has been prepar ed sol el y for use by the party which commissi oned it (the 'Client') in connection wi th the capti oned pr oject. It shoul d not be used for any other purpose. N o person other than the Client or any party who has expr essl y agreed terms of reli ance with us (the 'Recipi ent(s)') may r el y on the content, infor mation or any views expr essed in the R eport . This R eport is confi denti al and contains pr opri etary intell ectual pr operty and we accept no duty of car e, r esponsibility or li ability to any other recipi ent of this R eport . N o repr esentati on, warranty or undertaki ng, express or i mplied, is made and no responsi bility or liability is accepted by us to any party other than the Client or any Reci pient(s), as to the accuracy or completeness of the i nfor mati on contai ned i n this R eport . For the avoi dance of doubt thi s Report does not i n any way pur port to i nclude any legal, insurance or fi nanci al advice or opi nion.
We disclai m all and any liability whether arising i n tort, contr act or other wise which we might otherwise have to any party o ther than the Cli ent or the Reci pient(s), in respect of this Report, or any infor mation contained in it. We accept no responsi bility for any error or omissi on in the Report which is due to an error or omissi on in data, i nfor mation or statements supplied to us by other parti es i ncludi ng the Cli ent (the 'Data'). We have not independentl y verified the D ata or other wise exami ned i t to deter mi ne the accuracy, comple teness, sufficiency for any purpose or feasi bility for any particular outcome incl uding fi nanci al. Forecasts presented i n this document were pr epared usi ng the Data and the Repor t is dependent or based on the D ata. Inevitabl y, some of the assumptions used to develop the for ecasts will not be realised and unantici pated events and circumstances may occur. C onsequentl y, we do not g uarantee or warrant the conclusions contained in the R eport as ther e are li kel y to be differences between the forecas ts and the actual results and those dif fer ences may be material. While we consi der that the infor mation and opini ons given in this R eport are sound all parti es must rel y on their own skill and judgement when making use of it .
Infor mation and opi nions ar e current onl y as of the date of the Report and we accept no responsi bility for updati ng such infor mation or opi nion. It shoul d, therefor e, not be assumed that any such infor mati on or opi nion conti nues to be accurate subsequent to the date of the Report. U nder no circumstances may this Report or any extrac t or summar y thereof be used i n connecti on with any public or pri vate securities offeri ng incl udi ng any related memor andum or pr ospec tus for any securiti es offering or stock exchange listi ng or announcement. By acceptance of this Repor t you agree to be bound by this disclai mer. This disclai mer and any issues, disputes or cl ai ms arising out of or in connection wi th it ( whether contractual or non-contractual i n natur e such as cl ai ms i n tort, from br each of statute or regul ati on or otherwise) shall be governed by, and constr ued i n accordance wi th, the laws of Engl and and Wales to the exclusion of all conflict of l aws principles and r ules . All disputes or clai ms arising out of or r elati ng to this discl ai mer shall be subjec t to the excl usi ve jurisdicti on of the English and Welsh courts to which the parties irrevocabl y submit.
Project: Port Salford
Our reference: 392905_TN_Geo_002 Your reference:
Prepared by: Chak Yu Li Date: 10/04/18
Approved by: A.S. O’Brien Checked by: N. Haynes
Subject: Pile Capacity & Settlement Analysis for Bridging Slabs
1 Introduction
This Technical Note (TN) provides an assessment of pile and pile group behaviour within the vicinity of the
proposed development area where a build-over agreement will require a future piled transfer deck over the
tunnel. Ground conditions are summarised for the development site within Technical Note 392905-nh-002.
Pile design and constructability have been determined accounting for the following factors:
i. Relative phasing of piling works to tunnel works – at this stage it is unknown whether piling will
precede tunnelling or vice versa, hence both cases have been analysed. In the instance of piles
being in place in advance of tunnelling, sufficient lateral clearance from the proposed outer TBM
diameter will be required. In this case pile design must be capable of tolerating any lateral or
vertical displacements induced by the tunnel drive. In the alternative case of tunnel construction
in advance of piling, pile design will require sufficient lateral clearance from the completed tunnel
inner diameter. For this case, pile design must minimise vertical and lateral displacements such
that the tunnel lining is not impacted.
ii. Variation in ground conditions – rockhead deepens significantly over the eastern 2/3rds of the
development site meaning that whilst piles over the western development area will found within
Sherwood Sandstone, piles within the eastern development area will require to found within the
Glacial Till.
Loads required to be carried by transfer decks have been taken from the MM Technical Note: Foundation
Design for Build Over. This TN then summarises assessed individual pile capacities to determine the likely
size of piles and the number required for pile groups. Pile group analyses have been undertaken to allow an
assessment of pile group settlement under a column load for all design and load cases. Finally, for the
design case where tunnelling precedes piling, this TN assesses the impact pile group settlement may have
on the tunnel, derived from published research and empirical correlations.
For the design case where piling precedes tunnelling, a separate technical note assessing lateral
displacement induced by tunnelling and hence bending moments and shear forces required to be
accommodated by the piles, is provided within Technical Note: 392905_TN_Geo_003.
Technical Note
Mott MacDonald 2
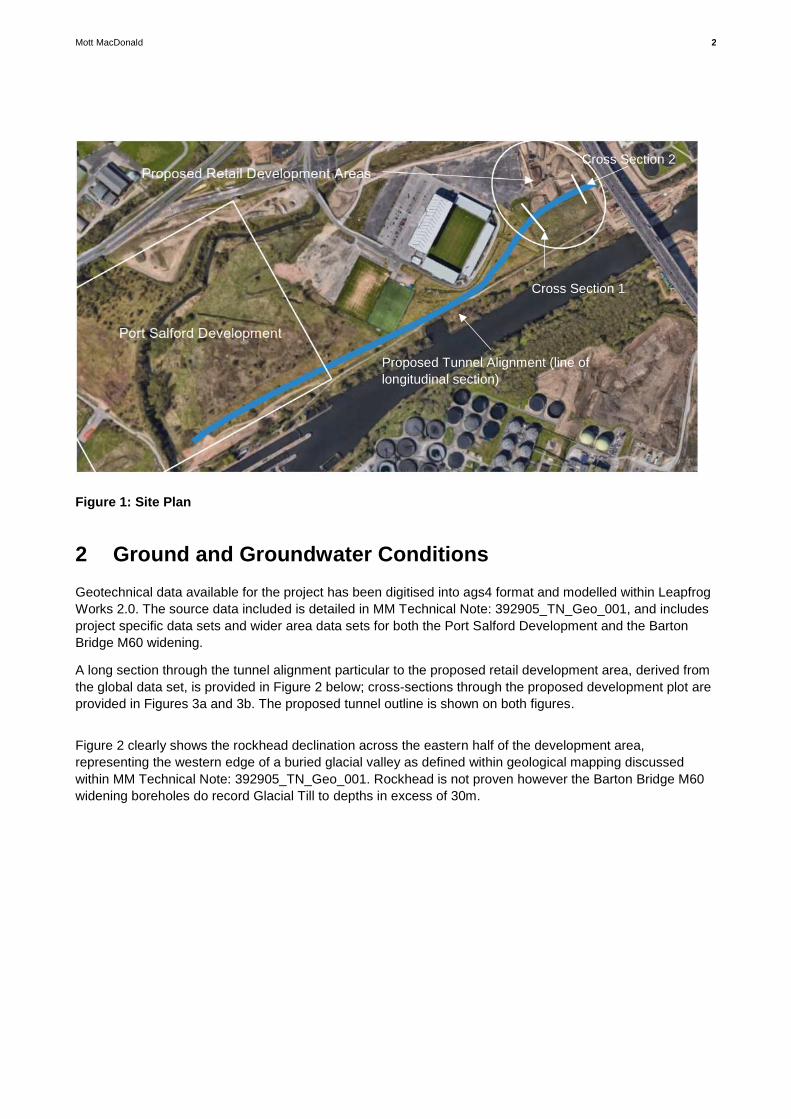
Figure 1: Site Plan
2 Ground and Groundwater Conditions
Geotechnical data available for the project has been digitised into ags4 format and modelled within Leapfrog
Works 2.0. The source data included is detailed in MM Technical Note: 392905_TN_Geo_001, and includes
project specific data sets and wider area data sets for both the Port Salford Development and the Barton
Bridge M60 widening.
A long section through the tunnel alignment particular to the proposed retail development area, derived from
the global data set, is provided in Figure 2 below; cross-sections through the proposed development plot are
provided in Figures 3a and 3b. The proposed tunnel outline is shown on both figures.
Figure 2 clearly shows the rockhead declination across the eastern half of the development area,
representing the western edge of a buried glacial valley as defined within geological mapping discussed
within MM Technical Note: 392905_TN_Geo_001. Rockhead is not proven however the Barton Bridge M60
widening boreholes do record Glacial Till to depths in excess of 30m.
Cross Section 1
Proposed Tunnel Alignment (line of
longitudinal section)
Cross Section 2

Mott MacDonald 3
Figure 2: Geological long section
Figure 3a: Geological cross section 1
Mott MacDonald 4
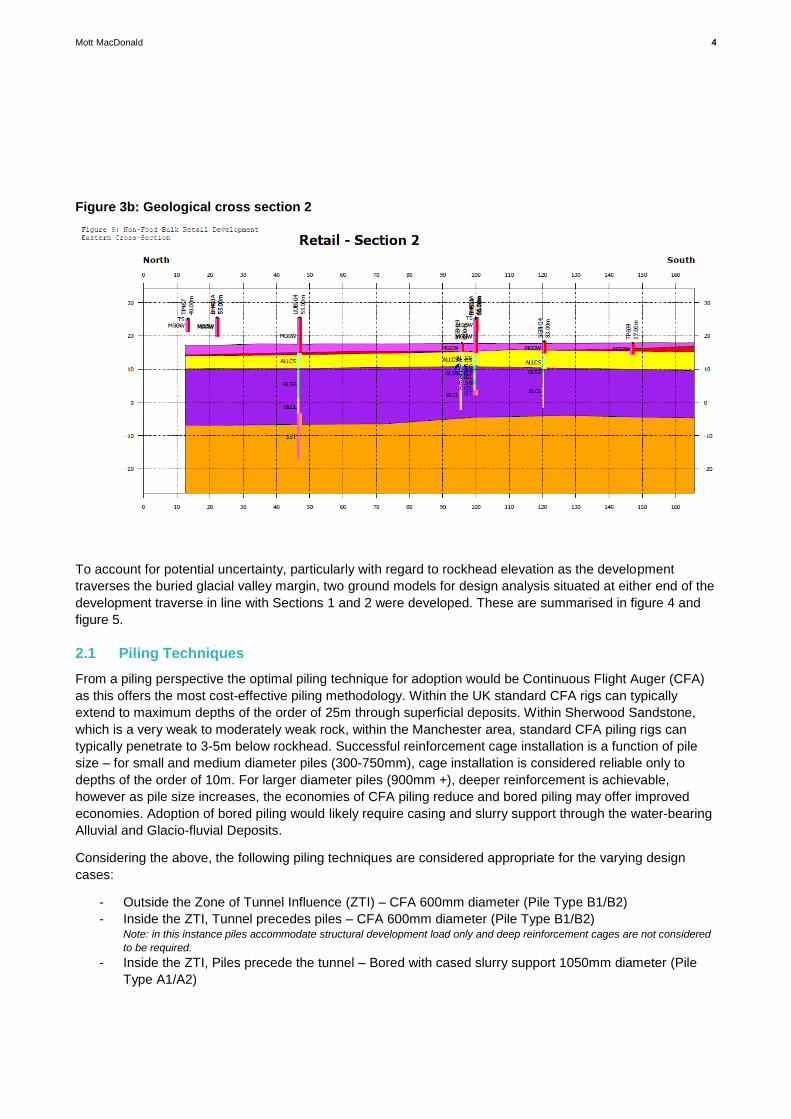
Figure 3b: Geological cross section 2
To account for potential uncertainty, particularly with regard to rockhead elevation as the development
traverses the buried glacial valley margin, two ground models for design analysis situated at either end of the
development traverse in line with Sections 1 and 2 were developed. These are summarised in figure 4 and
figure 5.
2.1 Piling Techniques
From a piling perspective the optimal piling technique for adoption would be Continuous Flight Auger (CFA)
as this offers the most cost-effective piling methodology. Within the UK standard CFA rigs can typically
extend to maximum depths of the order of 25m through superficial deposits. Within Sherwood Sandstone,
which is a very weak to moderately weak rock, within the Manchester area, standard CFA piling rigs can
typically penetrate to 3-5m below rockhead. Successful reinforcement cage installation is a function of pile
size – for small and medium diameter piles (300-750mm), cage installation is considered reliable only to
depths of the order of 10m. For larger diameter piles (900mm +), deeper reinforcement is achievable,
however as pile size increases, the economies of CFA piling reduce and bored piling may offer improved
economies. Adoption of bored piling would likely require casing and slurry support through the water-bearing
Alluvial and Glacio-fluvial Deposits.
Considering the above, the following piling techniques are considered appropriate for the varying design
cases:
- Outside the Zone of Tunnel Influence (ZTI) – CFA 600mm diameter (Pile Type B1/B2)
- Inside the ZTI, Tunnel precedes piles – CFA 600mm diameter (Pile Type B1/B2) Note: in this instance piles accommodate structural development load only and deep reinforcement cages are not considered
to be required.
- Inside the ZTI, Piles precede the tunnel – Bored with cased slurry support 1050mm diameter (Pile
Type A1/A2)

Mott MacDonald 5
Note: in this instance piles accommodate structural development load plus lateral deformation imposed by the tunnel, hence
deep reinforcement cage required to approximately 15m depth.
Table 1 identifies the different pile types proposed. Variants of pile types B and A exist to account for the
differing founding conditions which are anticipated across the development and specifically the tunnel
alignment due to the buried glacial valley. Design ground models are provided within Figures 4 and 5.
In order to minimise vertical settlements, piles have been designed as friction piles only. Skin friction has
been assumed through the Glaciofluvial Deposits (drained) and Sandstone socket only; negative skin friction
through the Made Ground and Alluvial Deposits has been discounted given the safety factor allowance
provided.

Mott MacDonald 6
Non-food Bulk Retail Development – Design Ground Model (Pile founded in Sherwood Sandstone)
Relevant exploratory holes: BH20, BH21, BH603, BH601A and BH 601
Note: Groundwater level is taken as 16.5mAOD
Figure 4: Design Ground Model (Pile founded in Sandstone layer)
.

Mott MacDonald 7
Non-food Bulk Retail Development – Design Ground Model (Pile founded in Glacial Till layer)
Figure 5: Design Ground Model (Pile founded in Glacial Till layer)
Mott MacDonald 8
2.2 Geotechnical Parameters
Geotechnical parameters adopted for preliminary pile capacity assessments are as detailed in Technical
Note 392905-TN-Geo-001 Table 4, save for two amendments, as outlined below:
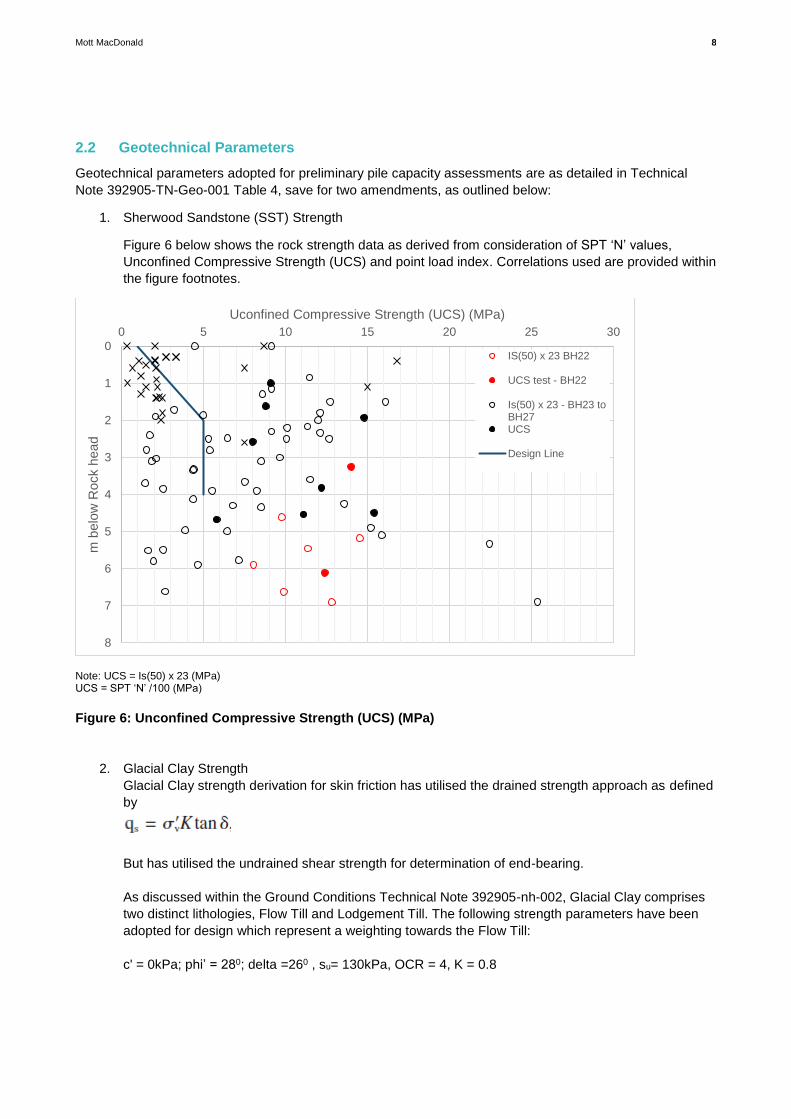
1. Sherwood Sandstone (SST) Strength
Figure 6 below shows the rock strength data as derived from consideration of SPT ‘N’ values,
Unconfined Compressive Strength (UCS) and point load index. Correlations used are provided within
the figure footnotes.
Note: UCS = Is(50) x 23 (MPa) UCS = SPT ‘N’ /100 (MPa)
Figure 6: Unconfined Compressive Strength (UCS) (MPa)
2. Glacial Clay Strength
Glacial Clay strength derivation for skin friction has utilised the drained strength approach as defined
by
But has utilised the undrained shear strength for determination of end-bearing.
As discussed within the Ground Conditions Technical Note 392905-nh-002, Glacial Clay comprises
two distinct lithologies, Flow Till and Lodgement Till. The following strength parameters have been
adopted for design which represent a weighting towards the Flow Till:
c' = 0kPa; phi’ = 280; delta =260 , su= 130kPa, OCR = 4, K = 0.8
0
1
2
3
4
5
6
7
8
0 5 10 15 20 25 30
m b
elo
w R
ock h
ead
Uconfined Compressive Strength (UCS) (MPa)
IS(50) x 23 BH22
UCS test - BH22
Is(50) x 23 - BH23 toBH27UCS
Design Line
Mott MacDonald 9
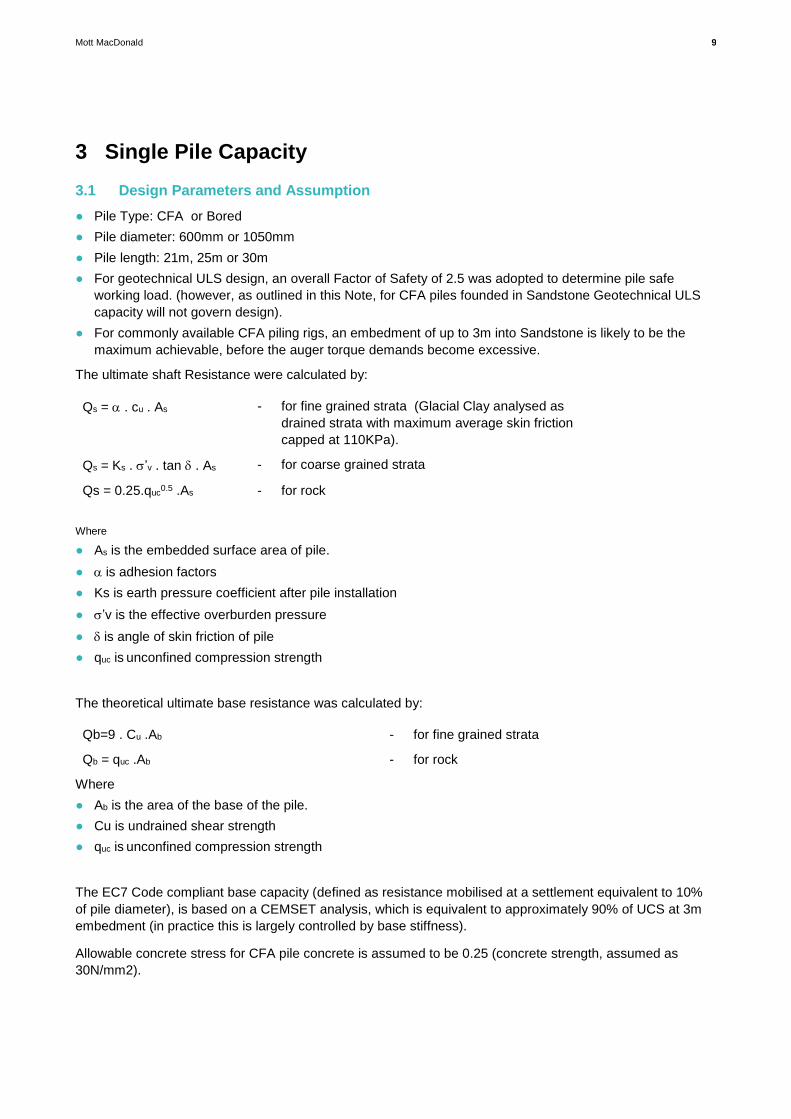
3 Single Pile Capacity
3.1 Design Parameters and Assumption
● Pile Type: CFA or Bored
● Pile diameter: 600mm or 1050mm
● Pile length: 21m, 25m or 30m
● For geotechnical ULS design, an overall Factor of Safety of 2.5 was adopted to determine pile safe
working load. (however, as outlined in this Note, for CFA piles founded in Sandstone Geotechnical ULS
capacity will not govern design).
● For commonly available CFA piling rigs, an embedment of up to 3m into Sandstone is likely to be the
maximum achievable, before the auger torque demands become excessive.
The ultimate shaft Resistance were calculated by:
Qs = . cu . As - for fine grained strata (Glacial Clay analysed as
drained strata with maximum average skin friction
capped at 110KPa).
Qs = Ks . ’v . tan . As - for coarse grained strata
Qs = 0.25.quc0.5 .As - for rock
Where
● As is the embedded surface area of pile.
● is adhesion factors
● Ks is earth pressure coefficient after pile installation
● ’v is the effective overburden pressure
● is angle of skin friction of pile
● quc is unconfined compression strength
The theoretical ultimate base resistance was calculated by:
Qb=9 . Cu .Ab - for fine grained strata
Qb = quc .Ab - for rock
Where
● Ab is the area of the base of the pile.
● Cu is undrained shear strength
● quc is unconfined compression strength
The EC7 Code compliant base capacity (defined as resistance mobilised at a settlement equivalent to 10%
of pile diameter), is based on a CEMSET analysis, which is equivalent to approximately 90% of UCS at 3m
embedment (in practice this is largely controlled by base stiffness).
Allowable concrete stress for CFA pile concrete is assumed to be 0.25 (concrete strength, assumed as
30N/mm2).

Mott MacDonald 10
The pile axial capacity details are summarised in Table 1.
Table 1: Pile Details
Pile Type B1 B2 A1 A2
Pile diameter 600mm 600mm 1050mm 1050mm
Pile Type CFA CFA Bored Bored
Pile length 25m 21m 30m 21m
Founding Stratum Glacial Till Sandstone Glacial Till Sandstone
Skin friction 2427 3476 6114 6084
Base resistance 254 1414 779 4330
Ultimate pile capacity (kN)
2681 4890 6893 6500 (structural capacity)
Safe pile capacity with F.O.S of 2.5 (kN)
1072 1956 2757 4165
F.O.S on Shaft capacity
- 1.85 >1.3 - Min 1.46 >1.3
Mott MacDonald 11
4 Single Pile and Pile Group Settlement
4.1 Single Pile Settlement
The CEMSET pile analysis was used to determine the single pile settlement. The details and assumptions
are summarised below.
Concrete
● Concrete Strength =30N/mm2
● Ec=30 x 106 kN/m2
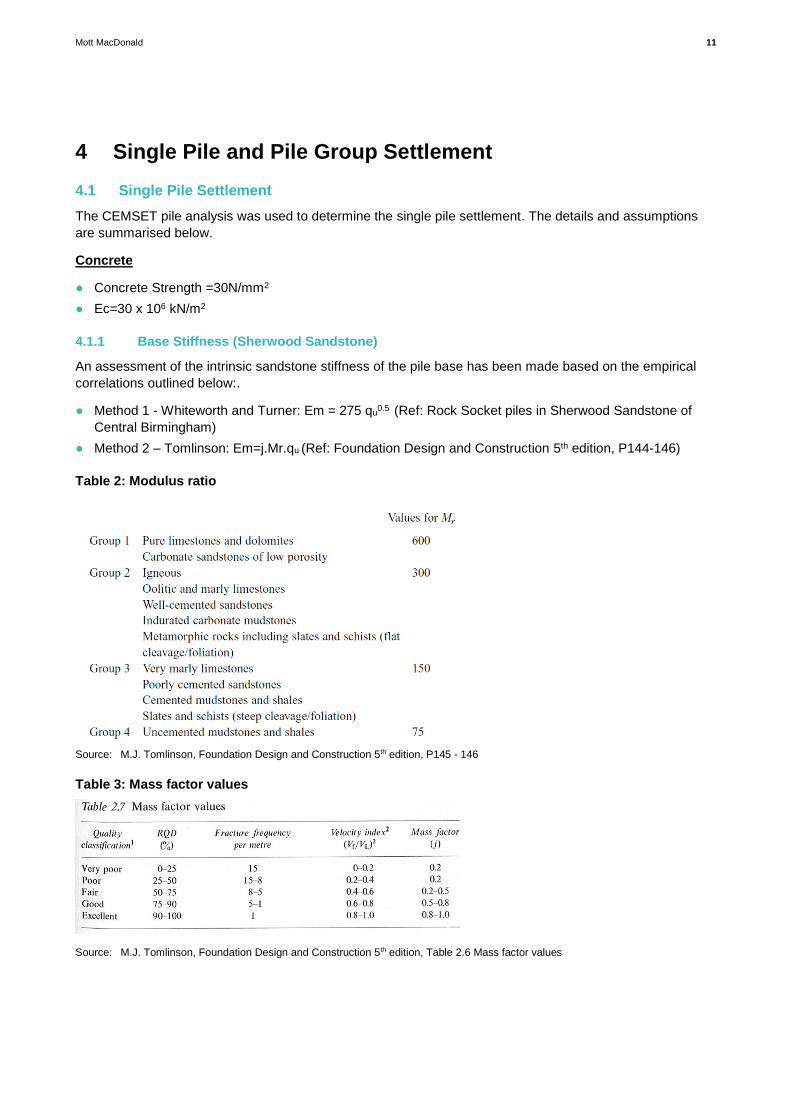
4.1.1 Base Stiffness (Sherwood Sandstone)
An assessment of the intrinsic sandstone stiffness of the pile base has been made based on the empirical
correlations outlined below:.
● Method 1 - Whiteworth and Turner: Em = 275 qu0.5 (Ref: Rock Socket piles in Sherwood Sandstone of
Central Birmingham)
● Method 2 – Tomlinson: Em=j.Mr.qu (Ref: Foundation Design and Construction 5th edition, P144-146)
Table 2: Modulus ratio
Source: M.J. Tomlinson, Foundation Design and Construction 5th edition, P145 - 146
Table 3: Mass factor values
Source: M.J. Tomlinson, Foundation Design and Construction 5th edition, Table 2.6 Mass factor values

Mott MacDonald 12
● Method 3 – Rowe and Armitage 1984: Em = 215 qu0.5 (Ref: Wei Dong Guo, Theory and practice of pile
design)
The CEMSET analytical method for single pile settlement has been developed from back analysis of several
thousand pile tests in a wide range of ground conditions. The mobilised base stiffness for use in CEMSET is
a function of both the intrinsic ground stiffness and the condition of the pile base (which is mainly a function
of piling method and technique). Experience indicates that the mobilised base stiffness, in Sandstone, is of
the order of between 150 and 250 MN /m2. The selected design line for base stiffness for use in CEMSET is
shown in Figure 6.
Figure 7: Base stiffness plot
To ensure single pile settlement is small (< 1% of pile diameter) the pile working load should be kept to
about three-quarters of the shaft capacity (ie a partial factor of 1.3 applied on shaft capacity, ICE Manual of
Geotechnical Engineering, Chapter 56, Figure 56.18). For a 600mm CFA pile embedded 3m into sandstone
the factored shaft resistance is estimated to be about 2600 kN. Note -the proposed working load of 1860 kN
(refer to Table 5) represents only about 70 % of this resistance, hence single pile settlement of less than
6mm should be anticipated.
0
1
2
3
4
5
6
7
8
0 200 400 600 800 1000 1200 1400 1600 1800 2000
m b
elo
w R
ock H
ead
Base Stiffness (MPa)
Method 1 - Whitworthand Turner (1989)
Method 2 - Tomlinson
Method 3 - Rowe andAmitage 1984
Design Line
Mott MacDonald 13
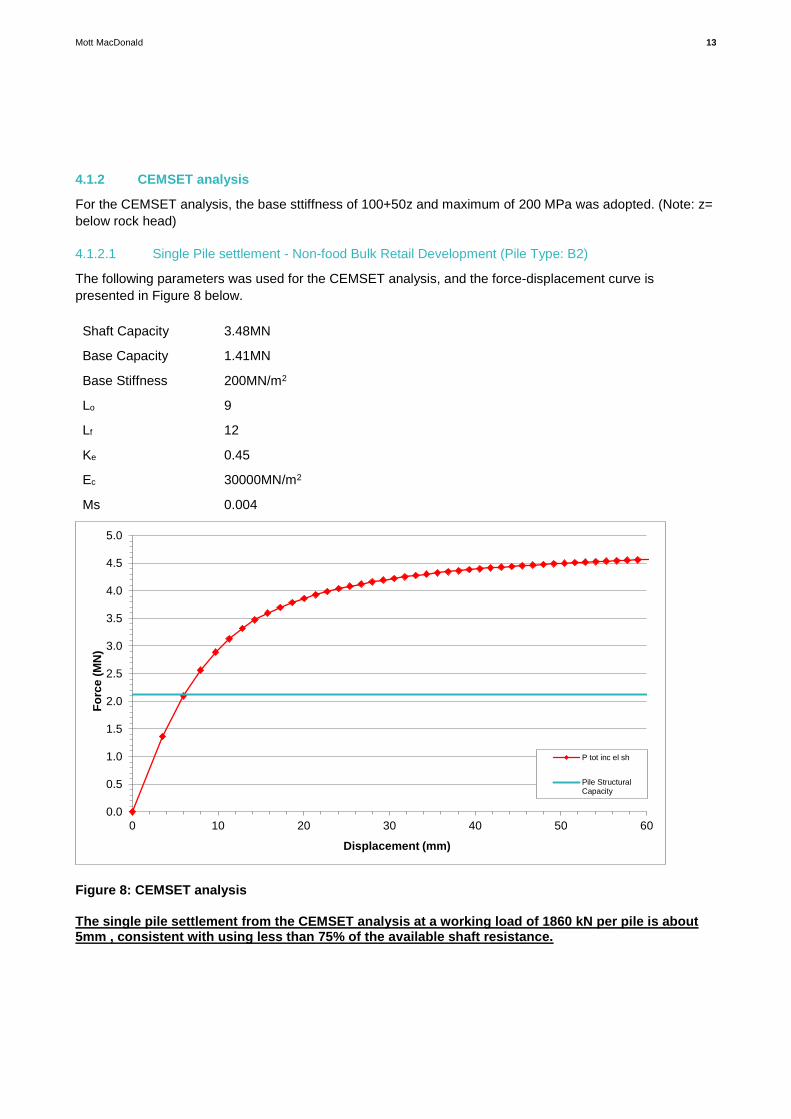
4.1.2 CEMSET analysis
For the CEMSET analysis, the base sttiffness of 100+50z and maximum of 200 MPa was adopted. (Note: z=
below rock head)
4.1.2.1 Single Pile settlement - Non-food Bulk Retail Development (Pile Type: B2)
The following parameters was used for the CEMSET analysis, and the force-displacement curve is
presented in Figure 8 below.
Shaft Capacity 3.48MN
Base Capacity 1.41MN
Base Stiffness 200MN/m2
Lo 9
Lf 12
Ke 0.45
Ec 30000MN/m2
Ms 0.004
Figure 8: CEMSET analysis
The single pile settlement from the CEMSET analysis at a working load of 1860 kN per pile is about 5mm , consistent with using less than 75% of the available shaft resistance.
0.0
0.5
1.0
1.5
2.0
2.5
3.0
3.5
4.0
4.5
5.0
0 10 20 30 40 50 60
Fo
rce
(M
N)
Displacement (mm)
P tot inc el sh
Pile StructuralCapacity

Mott MacDonald 14
4.1.2.2 Single Pile settlement - Non-food Bulk Retail Development (Pile Type: B1)
The following parameters was used for the CEMSET analysis, and the force-displacement curve is
presented in Figure 9 below.
Shaft Capacity 2.43MN
Base Capacity 0.254MN
Base Stiffness 15MN/m2
Lo 6.5
Lf 18.5
Ke 0.45
Ec 30000MN/m2
Ms 0.002
Figure 9: CEMSET analysis
0.0
0.5
1.0
1.5
2.0
2.5
3.0
0 10 20 30 40 50 60
Fo
rce
(M
N)
Displacement (mm)
P tot inc el sh
Pile Structural Capacity

Mott MacDonald 15
4.1.2.3 Single Pile settlement - Non-food Bulk Retail Development (Pile Type: A1)
The following parameters was used for the CEMSET analysis, and the force-displacement curve is
presented in Figure 10 below.
Shaft Capacity 6.11MN
Base Capacity 0.779MN
Base Stiffness 40MN/m2
Lo 6.5
Lf 23.5
Ke 0.45
Ec 30000MN/m2
Ms 0.002
Figure 10: CEMSET analysis
0.0
1.0
2.0
3.0
4.0
5.0
6.0
7.0
0 10 20 30 40 50 60
Fo
rce
(M
N)
Displacement (mm)
P tot inc el sh
Pile Structural Capacity

Mott MacDonald 16
4.1.2.4 Single Pile settlement - Non-food Bulk Retail Development (Pile Type: A2)
The following parameters was used for the CEMSET analysis, and the force-displacement curve is
presented in Figure 11 below.
Shaft Capacity 6.084MN
Base Capacity 4.33MN
Base Stiffness 200MN/m2
Lo 9
Lf 12
Ke 0.45
Ec 30000MN/m2
Ms 0.004
Figure 11: CEMSET analysis
0.0
1.0
2.0
3.0
4.0
5.0
6.0
7.0
8.0
9.0
10.0
0 10 20 30 40 50 60
Fo
rce
(M
N)
Displacement (mm)
P tot inc el sh
Pile Structural Capacity
Mott MacDonald 17
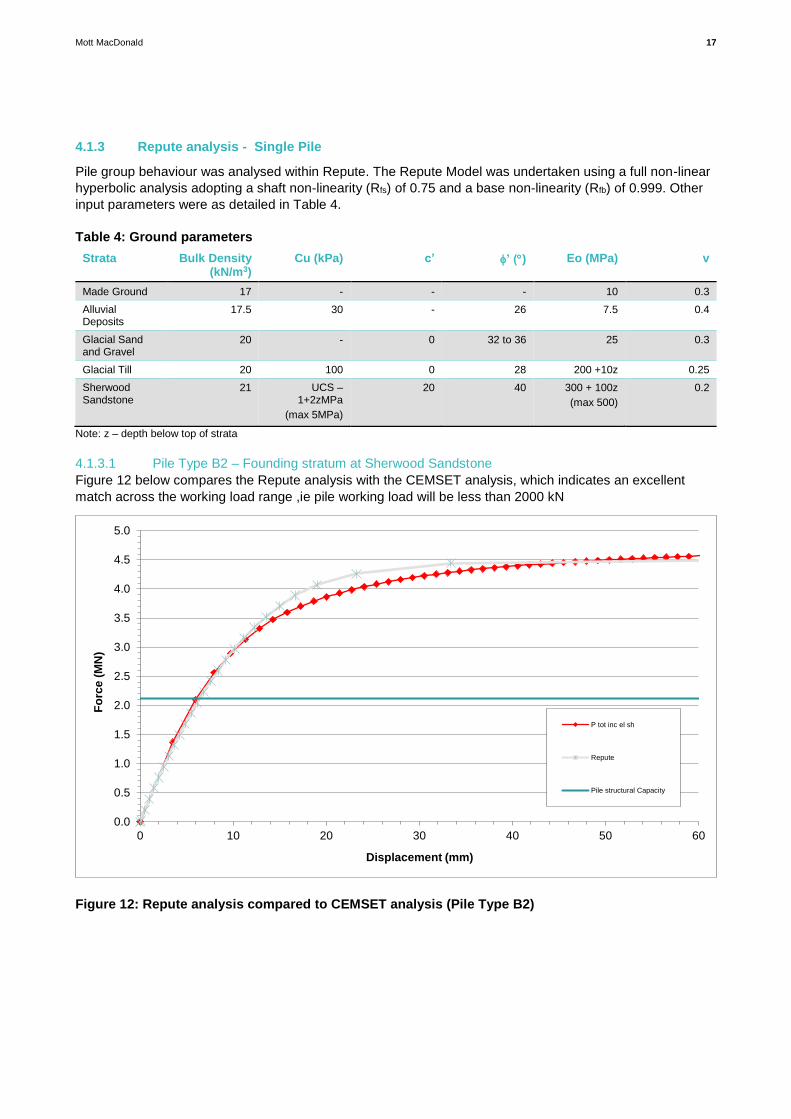
4.1.3 Repute analysis - Single Pile
Pile group behaviour was analysed within Repute. The Repute Model was undertaken using a full non-linear
hyperbolic analysis adopting a shaft non-linearity (Rfs) of 0.75 and a base non-linearity (Rfb) of 0.999. Other
input parameters were as detailed in Table 4.
Table 4: Ground parameters
Strata Bulk Density (kN/m3)
Cu (kPa) c’ ’ () Eo (MPa) v
Made Ground 17 - - - 10 0.3
Alluvial Deposits
17.5 30 - 26 7.5 0.4
Glacial Sand and Gravel
20 - 0 32 to 36 25 0.3
Glacial Till 20 100 0 28 200 +10z 0.25
Sherwood Sandstone
21 UCS – 1+2zMPa
(max 5MPa)
20 40 300 + 100z
(max 500)
0.2
Note: z – depth below top of strata
4.1.3.1 Pile Type B2 – Founding stratum at Sherwood Sandstone
Figure 12 below compares the Repute analysis with the CEMSET analysis, which indicates an excellent
match across the working load range ,ie pile working load will be less than 2000 kN
Figure 12: Repute analysis compared to CEMSET analysis (Pile Type B2)
0.0
0.5
1.0
1.5
2.0
2.5
3.0
3.5
4.0
4.5
5.0
0 10 20 30 40 50 60
Fo
rce
(M
N)
Displacement (mm)
P tot inc el sh
Repute
Pile structural Capacity

Mott MacDonald 18
4.1.3.2 Pile Type A2 – Founding stratum at Sherwood Sandstone
Figure 13 below compares the Repute analysis with the CEMSET analysis, which indicates an excellent
match across the working load range ,ie pile working load will be less than 4200 kN
Figure 13: Repute analysis compared to CEMSET analysis (Pile Type A2)
0.0
1.0
2.0
3.0
4.0
5.0
6.0
7.0
8.0
9.0
10.0
0 10 20 30 40 50 60
Fo
rce
(M
N)
Displacement (mm)
P tot inc el sh
Repute
Pile structural Capacity

Mott MacDonald 19
4.1.3.3 Pile Type A1 – Founding stratum at Glacial Till
Figure 14 below compares the Repute analysis with the CEMSET analysis, which indicates an excellent
match across the working load range ,ie pile working load will be less than 2800 kN
Figure 14: Repute analysis compared to CEMSET analysis – Pile Type A1 (1050mm dia. Bored pile)
0.0
1.0
2.0
3.0
4.0
5.0
6.0
7.0
0 10 20 30 40 50 60
Fo
rce
(M
N)
Displacement (mm)
P tot inc el sh
Pile Structural Capacity
Repute

Mott MacDonald 20
4.1.3.4 Pile Type B1 – Founding stratum at Glacial Till
Figure 15 below compares the Repute analysis with the CEMSET analysis, which indicates an excellent
match across the working load range ,ie pile working load will be less than 1100 kN
Figure 15: Repute analysis compared to CEMSET analysis – Pile Type B1 (600mm dia. CFA pile)
0.0
0.5
1.0
1.5
2.0
2.5
3.0
0 10 20 30 40 50 60
Fo
rce
(M
N)
Displacement (mm)
P tot inc el sh
Pile Structural Capacity
Repute

Mott MacDonald 21
4.2 Pile Group Settlement
The proposed pile layout and details are listed below.
Pile Type: B1
● Pile diameter: 600mm
● Pile length: 25m
● Pile Type: CFA
● Pile Spacing: 3D (1.8m)
● Allowable Concrete Stress = 1072/(0.32.) = 3791kPa < 0.25fcu (-0.25 x 30000)=7500kPa
● Maximum capacity based on allowable concrete stress = 7500 x 0.3 x 0.3 = 2120kN
Figure 16: Pile Cap Type B1 - 1 Figure 17: Pile Cap Type B1 - 2
Figure 18: Pile Cap Type B1 - 3 Figure 19: Pile Cap Type B1 - 4
Table 5: Pile Group details
Pile Cap Type Max. Column load No. of Pile Nominal Pile Load within Group
Pile Cap Type B1 - 1 2144kN 2 1072kN
Pile Cap Type B1 - 2 3216kN 3 1072kN
Pile Cap Type B1 - 3 5360kN 5 1072kN
Pile Cap Type B1 – 4 6432kN 6 1072kN

Mott MacDonald 22
Pile Type: B2
● Pile diameter: 600mm
● Pile length: 21m
● Pile Type: CFA
● Pile Spacing: 3D (1.8m)
● Allowable Concrete Stress = 1875/(0.32.) = 6631kPa < 0.25fcu (-0.25 x 30000)=7500kPa
● Maximum capacity based on allowable concrete stress = 7500 x 0.3 x 0.3 = 2120kN
Table 5 provides vertical column loads as advised within MM Technical Note: 392905-sdp-001; apportioned
pile numbers and resultant nominal pile load within the group. Figures 9-12 display typical pile cap
configurations adopting a minimum 3D pile spacing.
Table 6: Pile Group details
Pile Cap Type Max. Column load No. of Pile Nominal Pile Load within Group
Pile Cap Type B2 -1 3912kN 2 1956kN
Pile Cap Type B2 -2 5868kN 3 1956kN
Pile Cap Type B2 -3 7824kN 4 1956kN
Figure 20: Pile Cap Type B2 - 1 Figure 21: Pile Cap Type B2- 2
Figure 22: Pile Cap Type B2 - 3
Mott MacDonald 23
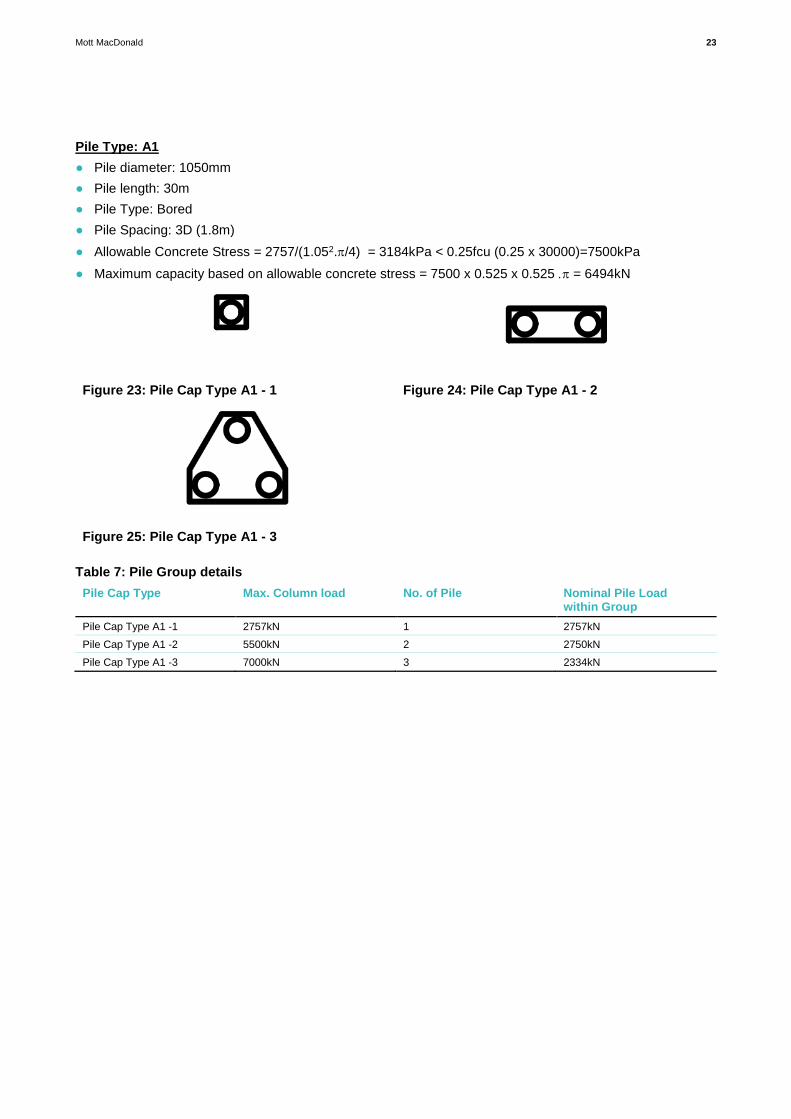
Pile Type: A1
● Pile diameter: 1050mm
● Pile length: 30m
● Pile Type: Bored
● Pile Spacing: 3D (1.8m)
● Allowable Concrete Stress = 2757/(1.052./4) = 3184kPa < 0.25fcu (0.25 x 30000)=7500kPa
● Maximum capacity based on allowable concrete stress = 7500 x 0.525 x 0.525 = 6494kN
Figure 23: Pile Cap Type A1 - 1 Figure 24: Pile Cap Type A1 - 2
Figure 25: Pile Cap Type A1 - 3
Table 7: Pile Group details
Pile Cap Type Max. Column load No. of Pile Nominal Pile Load within Group
Pile Cap Type A1 -1 2757kN 1 2757kN
Pile Cap Type A1 -2 5500kN 2 2750kN
Pile Cap Type A1 -3 7000kN 3 2334kN

Mott MacDonald 24
Pile Type: A2
● Pile diameter: 1050mm
● Pile length: 21m
● Pile Type: Bored
● Pile Spacing: 3D (3.15m)
● Allowable Concrete Stress = 4165/(1.052./4) = 4810kPa < 0.25fcu (0.25 x 30000)=7500kPa
● Maximum capacity based on allowable concrete stress = 7500 x 0.525 x 0.525 = 6494kN
Figure 26: Pile Cap Type A2 - 1 Figure 27: Pile Cap Type A2 - 2
Table 8: Pile Group details
Pile Cap Type Max. Column load No. of Pile Nominal Pile Load within Group
Pile Cap Type A2 -1 4165kN 1 4165kN
Pile Cap Type A2 -2 7000kN 2 3500kN

Mott MacDonald 25
4.2.1 Empirical method
To check the Repute analysis, an empirical method, as outlined below, was used to determine the pile group
settlement.
Pile-group settlement, W=Rse.Ws (Ref: ICE Manual Of Geotechnical Engineering (2012) Equation 55.10)
Where
– Ws – Single pile settlement
○ Pile Type B2 - approx. 5.5mm at nominal load of 1956kN
○ Pile Type B1 – approx. 2.8mm at nominal load of 1072kN
○ Pile Type A1 – approx. 2.6mm at nominal load of 2757kN
○ Pile Type A2 – approx.. 6.5mm at nominal load of 4165kN
– n is the number of piles in the group,
– The pile group aspect ratio R=(ns/L)0.5 (Ref: ICE Manual Of Geotechnical Engineering (2012) Section
55.5.2)
– Lower bound 𝑅𝑠𝑒 =0.17
𝑅1.35(𝑛) (Ref: ICE Manual Of Geotechnical Engineering (2012) Equation 55.12)

Mott MacDonald 26
Table 9: Empirical Method calculation
Pile Type Pile Cap Type Pile Group aspect ratio R=(ns/L)^0.5
Lower bound Rse
Rse=0.17 n /R1.35
Pile Group Settlement (mm)
600mm diameter CFA pile , Founding Stratum: Glacial Till, , Pile length: 25m
B1 Pile Cap Type B1 -1
2 piles
- - -
B1 Pile Cap Type B1 - 2
3 piles
0.47 1.44 4.01
B1 Pile Cap Type B1 - 3
5 piles
0.60 1.70 4.74
B1 Pile Cap Type B1 - 4
6 piles
0.66 1.80 5.03
600mm diameter CFA pile , Founding Stratum: Sandstone, Pile length: 21m
B2 Pile Cap Type B2 - 1
2 piles
- - -
B2 Pile Cap Type B2 - 2
3 piles
0.51 1.28 7.01
B2 Pile Cap Type B2 - 3
4 piles
0.59 1.40 7.70
1050mm diameter Bored pile , Founding Stratum: Glacial Till, Pile length: 30m
A1 Pile Cap Type A1 - 1
2 piles
- - -
A1 Pile Cap Type A1- 2
3 piles
0.56 1.11 2.89
1050mm diameter Bored pile , Founding Stratum: Sandstone, Pile length: 25m
A2 Pile Cap Type A2 - 1
1 pile
- - -
A2 Pile Cap Type A2 - 2
2 piles
- - -

Mott MacDonald 27
4.2.2 Repute
The software ‘Repute’ was used to determine the pile group settlement. The results are shown in Figure 27
and 28 below.
Figure 28: Repute Pile Group Settlement (Pile Type A1 and A2, 1050mm dia. Pile)
0
1000
2000
3000
4000
5000
6000
7000
8000
0 1 2 3 4 5 6 7
Forc
e (k
N)
Displacment (mm)
Pile Cap Type A1 - 1 (1050mm dia)
Pile Cap Type A1 - 2 (1050mm dia)
Pile Cap Type A2 - 2 (1050mm dia)

Mott MacDonald 28
Figure 29: Repute Pile Group Settlement (Pile Type B1 and B2, 600mm dia. Pile)
0
1000
2000
3000
4000
5000
6000
7000
8000
9000
0 2 4 6 8 10
Forc
e (k
N)
Displacment (mm)
Pile Cap Type B1 - 1 (600mm dia)
Pile Cap Type B1 - 2 (600mm dia)
Pile Cap Type B1 - 3 (600mm dia)
Pile Cap Type B1 – 4 (600mm dia)
Pile Cap Type B2 - 1 (600mm dia)
Pile Cap Type B2 - 2 (600mm dia)
Pile Cap Type B2 - 3 (600mmdia)

Mott MacDonald 29
The results are summarised in Table 10.
Table 10: Results – Pile Group settlement
Pile Type
Pile Cap Type Pile Group settlement
(Empirical method)
Pile Group Settlement
(Repute)
600mm diameter CFA pile , Founding Stratum: Glacial Till, , Pile length: 25m
B1 Pile Cap Type B1 -1
2 piles
- 3.78mm
B1 Pile Cap Type B1 - 2
3 piles
4.01mm 4.48mm
B1 Pile Cap Type B1 - 3
5 piles
4.74mm 5.48mm
B1 Pile Cap Type B1 - 4
6 piles
5.03mm 6.01mm
600mm diameter CFA pile , Founding Stratum: Sandstone, Pile length: 21m
B2 Pile Cap Type B2 - 1
2 piles
- 6.16mm
B2 Pile Cap Type B2 - 2
3 piles
7.01mm 6.87mm
B2 Pile Cap Type B2 - 3
4 piles
7.70mm 7.35mm
1050mm diameter Bored pile , Founding Stratum: Glacial Till, Pile length: 30m
A1 Pile Cap Type A1 - 1
2 piles
- 4.0mm
A1 Pile Cap Type A1- 2
3 piles
2.89mm 4.3mm
1050mm diameter Bored pile , Founding Stratum: Sandstone, Pile length: 21m
A2 Pile Cap Type A2 - 1
1 pile
6.5mm (Single Pile) -
A2 Pile Cap Type A2 - 2
2 piles
(Max column =7000kN)
- 6.32mm
Note: The above predicted settlements are for comparison purposes. They should be rounded and are indicative of an order of
magnitude of settlement (i.e. <10mm)
Based upon Table 11, both the empirical method and REPUTE give consistent predictions of pile group
settlements.

Mott MacDonald 30
5 Pile / Tunnel interaction
5.1 Displacements due to piling post tunnel Construction
The empirical methods (Ref: ICE Manual Of Geotechnical Engineering (2012) (MOGE) Figure 55.12 and
Figure 56.28, reproduced here as Figure 14) was used to determine the ground movement due to the pile
settlement. Details are summarised below within Table 8. Based on the Section 4 results, the pile group
settlement under the maximum column load is likely to be of the order of 10mm.
Parameters
● Pile diameter: 600mm or 1050mm
● Pile radius (r0) = 300mm or 525mm
● Soil Type: non-linear soil
● Offset distance between pile and tunnel = r (see table below)
● Assume pile group settlement of 10mm.
Figure 30: Influence of soil nonlinearity on pile-to-pile interaction
Source: ICE Manual Of Geotechnical Engineering (2012) Figure 55.12
Mott MacDonald 31
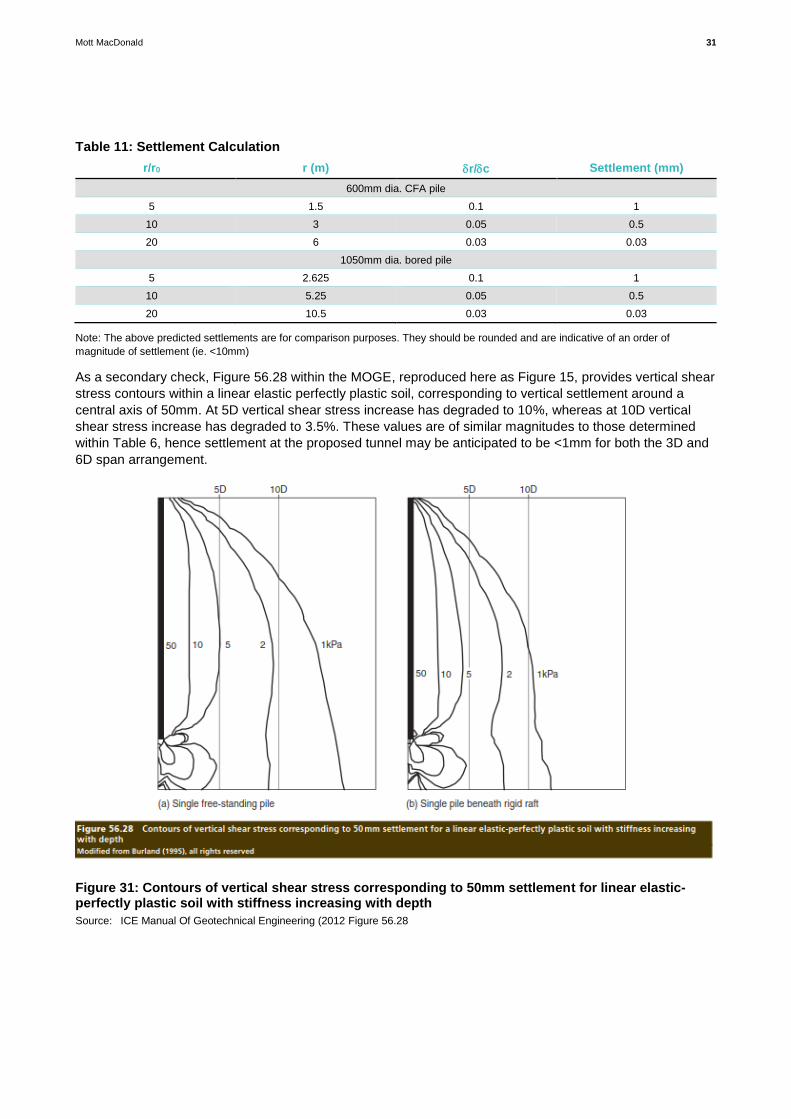
Table 11: Settlement Calculation
r/r0 r (m) r/c Settlement (mm)
600mm dia. CFA pile
5 1.5 0.1 1
10 3 0.05 0.5
20 6 0.03 0.03
1050mm dia. bored pile
5 2.625 0.1 1
10 5.25 0.05 0.5
20 10.5 0.03 0.03
Note: The above predicted settlements are for comparison purposes. They should be rounded and are indicative of an order of
magnitude of settlement (ie. <10mm)
As a secondary check, Figure 56.28 within the MOGE, reproduced here as Figure 15, provides vertical shear
stress contours within a linear elastic perfectly plastic soil, corresponding to vertical settlement around a
central axis of 50mm. At 5D vertical shear stress increase has degraded to 10%, whereas at 10D vertical
shear stress increase has degraded to 3.5%. These values are of similar magnitudes to those determined
within Table 6, hence settlement at the proposed tunnel may be anticipated to be <1mm for both the 3D and
6D span arrangement.
Figure 31: Contours of vertical shear stress corresponding to 50mm settlement for linear elastic-perfectly plastic soil with stiffness increasing with depth
Source: ICE Manual Of Geotechnical Engineering (2012 Figure 56.28


![Module 2 - Pile Group Effect [Compatibility Mode]](https://img.pdfslide.us/doc/110x75/55cf905b550346703ba524d2/module-2-pile-group-effect-compatibility-mode.jpg)