Embed Size (px)
Citation preview
High-speed Agilent 1100 Series diode-arraydetector SL for optimization of resolution,sensitivity, spectral sensitivity and linearity
Abstract
Standard UV detectors with a maximum of 10 Hz (10 data points per
second) are not fast enough to ensure the collection of enough data
points (at least 20 data points per peak) to provide reliable results for
peaks with a peak width at half height as small as 0.3 s. This Technical
Note describes the new Agilent 1100 Series diode-array detector SL
(DAD SL), which addresses the need for fast and ultra-fast LC. Besides
80 Hz data acquisition for highest resolution in ultra-fast LC the Agilent
1100 Series DAD SL provides high precision, linearity and sensitivity.
In addition, a built-in data recovery card ensures “data never lost
insurance“. RFID tags for cells and UV lamps ensure unambiguous data
traceability. Electronic temperature control provides highest baseline
stability and practical sensitivity under fluctuating temperature and
humidity conditions. The new standard flow cell increases practical
sensitivity with minimized dispersion and RI influence.
Technical Note
This application hasbeen verified using anAgilent 1200 SeriesLC system, and
showed comparable oreven better performance.
Application AreaFast screening in drug development,food and environmental applications.
results in ultra-fast HPLC. TheAgilent 1100 Series diode-arraydetector SL addresses the needfor fast and ultra-fast LC by offer-ing the following new features andbenefits:• 80 Hz data acquisition of up to
8 signals - for more ultra-fast, high-reso-
lution quantitative LC• 80 Hz full spectral data acquisi-
tion- for ultra-fast peak purity
analysis and spectral confirmation
• Built-in data recovery card - for a “data never lost insur-ance“
• RFID tags for all flow cells andUV lamps - for unambiguous data
traceability• Improved diode-array front-end
electronics- for minimized noise
(typical < ± 6 µAU ASTM)• LAN on board
- eliminates the need for additional LAN interface
• Built-in web-server, USB, PCM-CIA (WLAN, Bluetooth) - for a future-proof design
• Electronic temperature control – ETC- for maximum baseline stability
and practical sensitivity under fluctuating ambient temperature and humidity conditions
• New standard flow cell- for minimized dispersion
and RI-influence• Micromechanical slit
- for automated slit width changes during method
• Dual lamp design - for optimal light intensity and
thus maximum sensitivityIn the following examples we willdescribe the influence and bene-
2
fits of the new features on fastand ultra-fast applications. Hintsand tips are provided for settingdetector parameters according tothe specific needs of ultra-fastapplications. Detector perfor-mance regarding fast data acquisi-tion, noise, linearity, spectral dataacquisition and peak purity data attrace levels are evaluated.
Experimental
The instrument used was an Agi-lent 1100 Series high-throughput(HT) LC system, equipped with anAgilent 1100 Series well-plate sam-pler with cooling option, an Agi-lent 1100 Series binary pump withoptional degasser, an Agilent 1100Series column compartment andthe Agilent 1100 Series diode-arraydetector SL. The columns usedwere short ZORBAX SB C-18,packed with 1.8-µm particles. TheAgilent 1100 Series high-through-put LC system is modified versusthe standard system for the short-est flow connection and the stan-dard mixer is replaced by a mixerwith 80-µL (frit) volume. When the Agilent 1100 Series DAD isswitched on for the first time orwhen selecting the defaultmethod, default values for allmodules are set automatically.These default values are a goodstarting point for standard applica-tions with a run time > 5 minutes. Iffast (<5 minutes) and ultra-fastruns (<2 minutes) have to be per-formed the Agilent 1100 Series DADparameters have to be modified toprovide the best performance forhigh-speed applications with opti-mal resolution, optimum signalsensitivity, best spectral sensitivityor best spectral resolution.
Introduction
The demands of high samplethroughput in condensed timeframes have given rise to high effi-ciency, fast LC. From the process-ing of hundreds of samples inovernight runs, to efficient andtimely screening of metabolicstudies, to rapid method develop-ment, and to reducing solvent dis-posal costs, fast chromatographyhas become a necessity in thechromatography lab. Using thisnew methodology, results can bereported in a few hours, ratherthan a day or even later. Completevalidated results in such a shorttime mean that manufactueredgoods can be released the sameday that they are produced. Theend result is greater productivityfor customers and greater costefficiency. This Technical Noteillustrates the accurate quantita-tion and spectral confirmation ofimpurities at trace level underultra-fast HPLC conditions withthe 1100 Series HPLC system.
To provide a simple structure fordiscussion, we have categorizedfast LC into the following areas:• Conventional LC means cycle
times > 5 minutes• Fast LC means cycle times
< 5 minutes• Ultra fast LC means cycle times
<2 minutes
The later results in a gradient timeof 0.2 – 1.5 minutes, cycle times of0.5 – 2.5 minutes and 50 % peakwidth of 0.1 – 1.0 seconds. Stan-dard UV detectors with a maxi-mum of 10 Hz (10 data points persecond) are not fast enough toensure the collection of enoughdata points (at least 20 data pointsper peak) to provide reliable
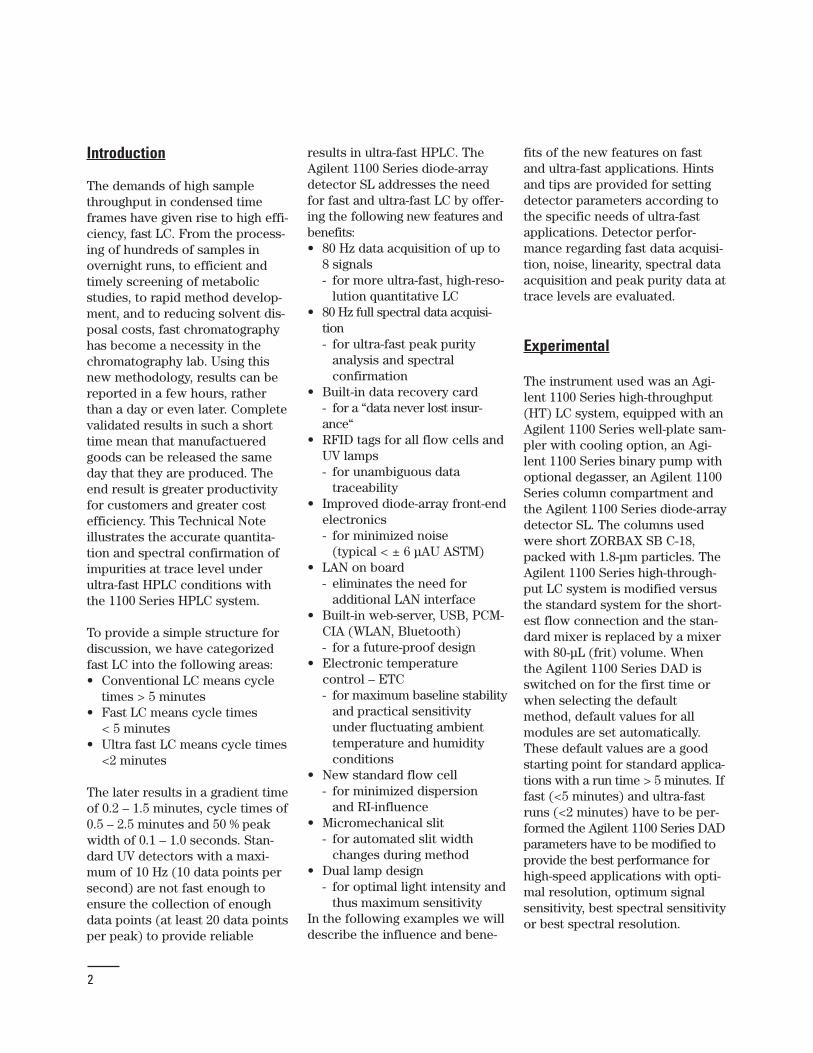
Optimization of data rate for highestresolution in high-speed applicationsFor LC/UV analysis with cycletimes around 1 minute the datarate of the detector can become alimiting factor resulting in peakbroadening and reduced peak resolution. In figure 1 an exampleis given how significantly the datarate influences the peak perfor-mance and consequently the quality of results.
This example demonstrates that a UV detector with only 5, 10 or 20 Hz data rate is not suitable for a demanding application. At 10 and 20 Hz the peak width isincreased 40 %, respectively 120 %compared to the peak widthobtained for a data rate setting of80 Hz. Peak width directly influ-ences resolution and peak capaci-ty (table 1). At a data rate of 80 Hzthe peak width is about 0.3 s athalf height. This means anincrease in peak capacity of 40 %versus a data rate of 20 Hz. Theresolution is improved by 30 %,which results in an improvementin the column efficiency of 70 %.Compared to a data rate of 10 Hzthe improvement is even more
apparent. Peak capacity isincreased by 120 %, resolution by90 % and the column efficiency by 260 %. These results clearlydemonstrate that data rates above
20 Hz are needed to take fulladvantage of fast and ultra-fastLC.
min0.1 0.2 0.3 0.4 0.5
mAU
050
100150
min0.1 0.2 0.3 0.4 0.5
mAU
050
100150
min0.1 0.2 0.3 0.4 0.5
mAU
050
100150
min0.1 0.2 0.3 0.4 0.5
mAU
050
100150
min0.1 0.2 0.3 0.4 0.5
mAU
050
100150
Resolution peak 5 = 2.25 at 80Hz
Resolution 2.05 at 40Hz
Resolution 1.71 at 20Hz
Resolution 0.67 at 5Hz
Resolution 1.17 at 10Hz
Set of 9 compounds, 100 ng/μL each, dissolved in ACN 1. Acetanilide 2. Acetophenone 3. Propiophenone 4. Butyrophenone 5. Benzophenone 6. Valerophenone 7. Hexanophenone 8. Heptanophenone 9. Octanophenone
Figure 1Influence of data rate on resolution.
3
Chromatographic conditions: Column: 30 x 4.6 mm ZORBAX SB C18,
1.8 µmInstrument optimized for lowest delay volume:80-µL (frit volume) mixer, short flow capillariesMobile phases: water (A) and acetonitrile (B)Flow rate: 5 mL/minGradient: at 0 min 50 %B, at 0.3 min 100 %B,
at 0.5 min 100 %B, at 0.6 min 50 %BColumn temp.: 50 °CInjection vol.: 3 µLDetector: Sample wavelength 245/10 nm,
reference wavelength 360/80 nm,data rate from 5 to 80 Hz, 5-µL volume detector cell with 6-mm path length, optical slit width 4 nm
Data rate Peak width Resolution Peak capacity
80 Hz 0.300 2.25 6140 Hz 0.329 2.05 5620 Hz 0.416 1.71 5510 Hz 0.666 1.17 285 Hz 1.236 0.67 16
Table 1Influence of data rate on peak width, resolution and peak capacity.
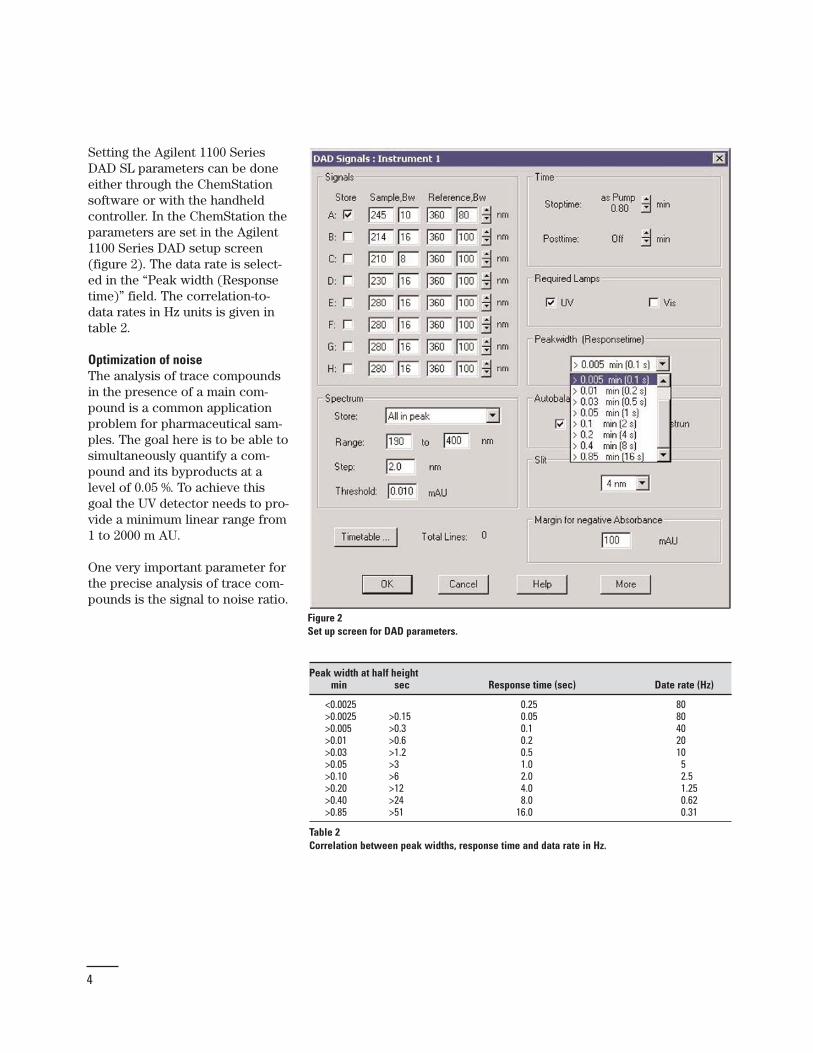
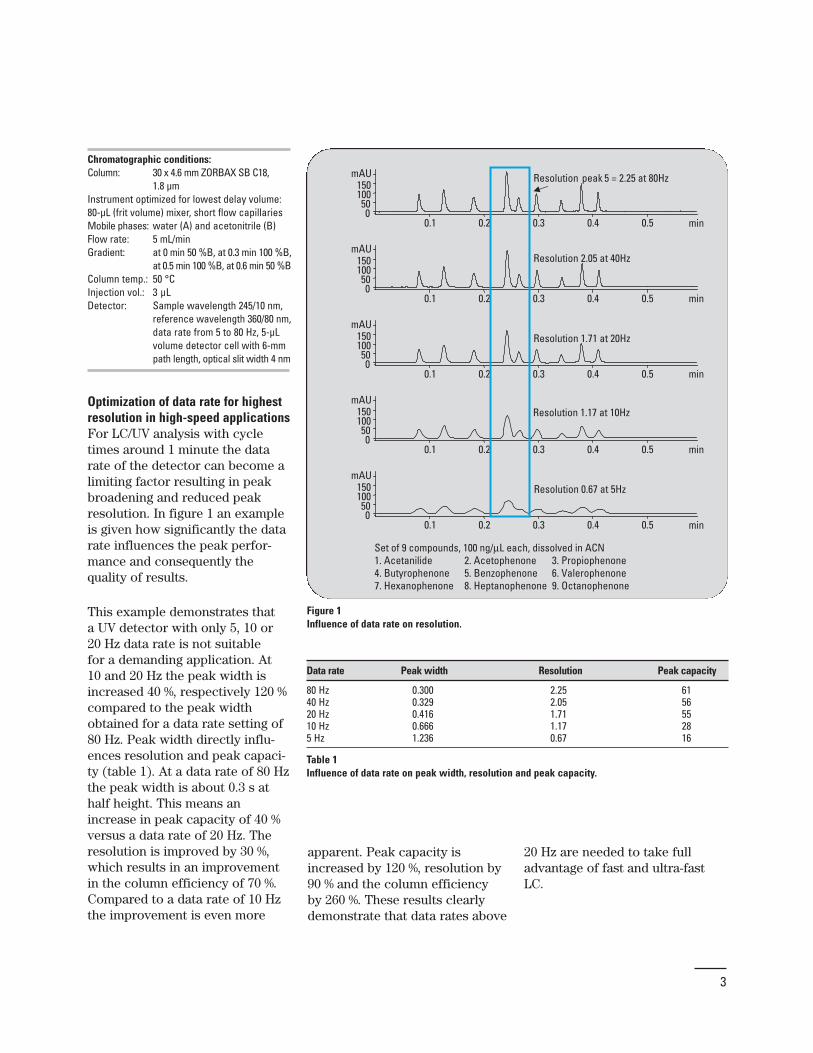
Setting the Agilent 1100 SeriesDAD SL parameters can be doneeither through the ChemStationsoftware or with the handheldcontroller. In the ChemStation theparameters are set in the Agilent1100 Series DAD setup screen(figure 2). The data rate is select-ed in the “Peak width (Responsetime)” field. The correlation-to-data rates in Hz units is given intable 2.
Optimization of noise The analysis of trace compoundsin the presence of a main com-pound is a common applicationproblem for pharmaceutical sam-ples. The goal here is to be able tosimultaneously quantify a com-pound and its byproducts at alevel of 0.05 %. To achieve thisgoal the UV detector needs to pro-vide a minimum linear range from1 to 2000 m AU.
One very important parameter forthe precise analysis of trace com-pounds is the signal to noise ratio.
Figure 2Set up screen for DAD parameters.
4
Peak width at half heightmin sec Response time (sec) Date rate (Hz)
<0.0025 0.25 80>0.0025 >0.15 0.05 80>0.005 >0.3 0.1 40>0.01 >0.6 0.2 20>0.03 >1.2 0.5 10>0.05 >3 1.0 5>0.10 >6 2.0 2.5>0.20 >12 4.0 1.25>0.40 >24 8.0 0.62>0.85 >51 16.0 0.31
Table 2Correlation between peak widths, response time and data rate in Hz.
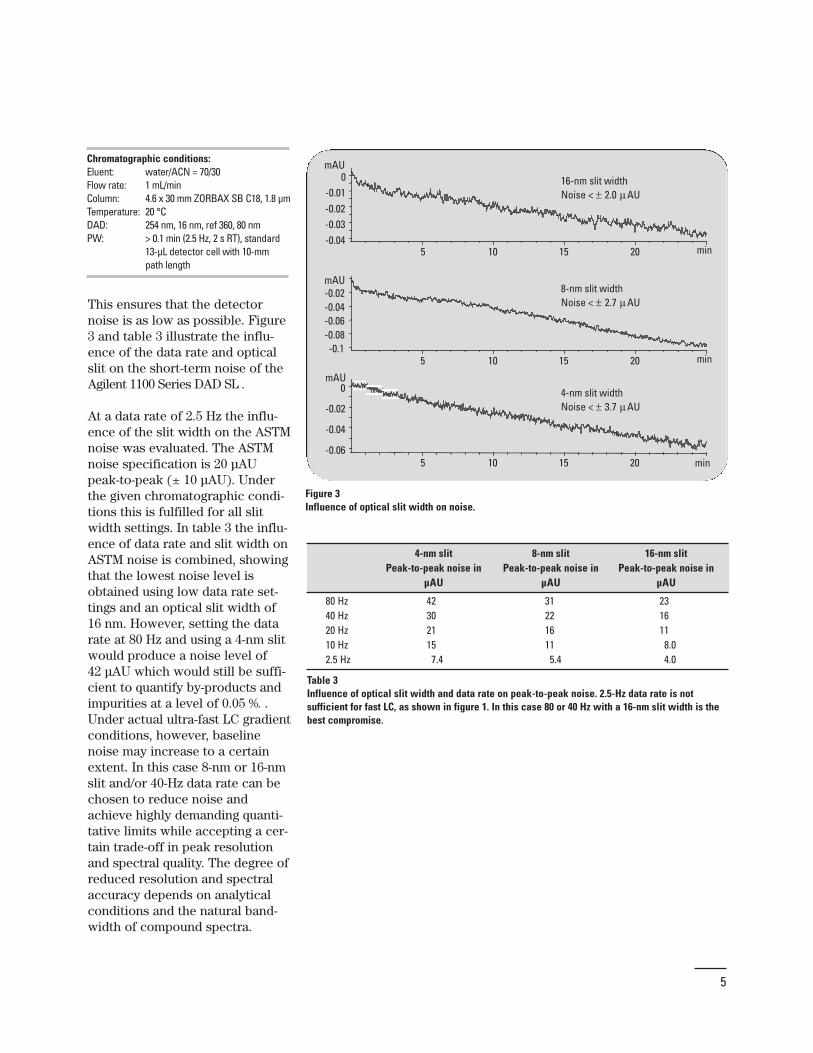
This ensures that the detectornoise is as low as possible. Figure3 and table 3 illustrate the influ-ence of the data rate and opticalslit on the short-term noise of theAgilent 1100 Series DAD SL .
At a data rate of 2.5 Hz the influ-ence of the slit width on the ASTMnoise was evaluated. The ASTMnoise specification is 20 µAUpeak-to-peak (± 10 µAU). Underthe given chromatographic condi-tions this is fulfilled for all slitwidth settings. In table 3 the influ-ence of data rate and slit width onASTM noise is combined, showingthat the lowest noise level isobtained using low data rate set-tings and an optical slit width of16 nm. However, setting the datarate at 80 Hz and using a 4-nm slitwould produce a noise level of 42 µAU which would still be suffi-cient to quantify by-products andimpurities at a level of 0.05 %. .Under actual ultra-fast LC gradientconditions, however, baselinenoise may increase to a certainextent. In this case 8-nm or 16-nmslit and/or 40-Hz data rate can bechosen to reduce noise andachieve highly demanding quanti-tative limits while accepting a cer-tain trade-off in peak resolutionand spectral quality. The degree ofreduced resolution and spectralaccuracy depends on analyticalconditions and the natural band-width of compound spectra.
5
min5 10 15 20
mAU
-0.04-0.03-0.02-0.01
0
min5 10 15 20
mAU
-0.1-0.08-0.06-0.04-0.02
min5 10 15 20
mAU
-0.06
-0.04
-0.02
0 4-nm slit widthNoise < ± 3.7 μAU
8-nm slit widthNoise < ± 2.7 μAU
16-nm slit widthNoise < ± 2.0 μAU
Figure 3Influence of optical slit width on noise.
Chromatographic conditions: Eluent: water/ACN = 70/30Flow rate: 1 mL/minColumn: 4.6 x 30 mm ZORBAX SB C18, 1.8 µmTemperature: 20 °CDAD: 254 nm, 16 nm, ref 360, 80 nm PW: > 0.1 min (2.5 Hz, 2 s RT), standard
13-µL detector cell with 10-mm path length
4-nm slit 8-nm slit 16-nm slitPeak-to-peak noise in Peak-to-peak noise in Peak-to-peak noise in
µAU µAU µAU
80 Hz 42 31 2340 Hz 30 22 1620 Hz 21 16 1110 Hz 15 11 8.02.5 Hz 7.4 5.4 4.0
Table 3Influence of optical slit width and data rate on peak-to-peak noise. 2.5-Hz data rate is not sufficient for fast LC, as shown in figure 1. In this case 80 or 40 Hz with a 16-nm slit width is thebest compromise.
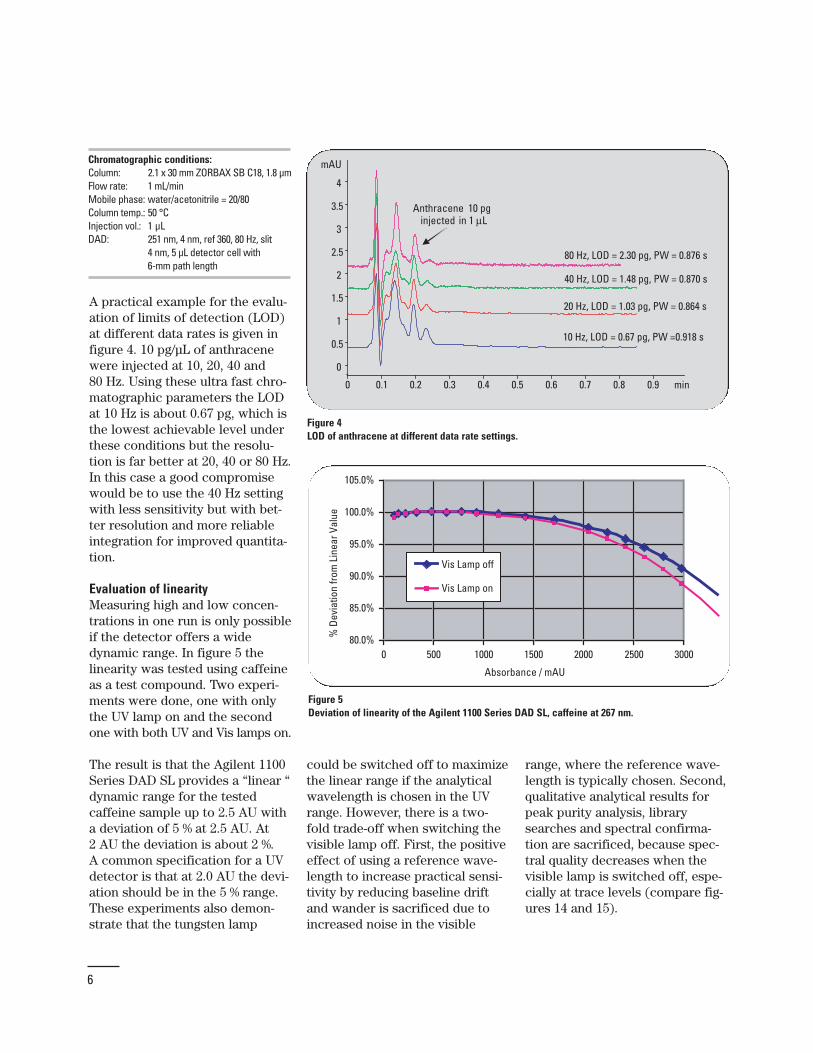
range, where the reference wave-length is typically chosen. Second,qualitative analytical results forpeak purity analysis, librarysearches and spectral confirma-tion are sacrificed, because spec-tral quality decreases when thevisible lamp is switched off, espe-cially at trace levels (compare fig-ures 14 and 15).
could be switched off to maximizethe linear range if the analyticalwavelength is chosen in the UVrange. However, there is a two-fold trade-off when switching thevisible lamp off. First, the positiveeffect of using a reference wave-length to increase practical sensi-tivity by reducing baseline driftand wander is sacrificed due toincreased noise in the visible
min0 0.1 0.2 0.3 0.4 0.5 0.6 0.7 0.8 0.9
mAU
0
0.5
1
1.5
2
2.5
3
3.5
4
40 Hz, LOD = 1.48 pg, PW = 0.870 s
20 Hz, LOD = 1.03 pg, PW = 0.864 s
10 Hz, LOD = 0.67 pg, PW =0.918 s
80 Hz, LOD = 2.30 pg, PW = 0.876 s
Anthracene 10 pginjected in 1 μL
Figure 4LOD of anthracene at different data rate settings.
80.0%
85.0%
90.0%
95.0%
100.0%
105.0%
0 500 1000 1500 2000 2500 3000
Absorbance / mAU
% D
evia
tion
from
Lin
ear V
alue
Vis Lamp off
Vis Lamp on
Figure 5Deviation of linearity of the Agilent 1100 Series DAD SL, caffeine at 267 nm.
Chromatographic conditions: Column: 2.1 x 30 mm ZORBAX SB C18, 1.8 µmFlow rate: 1 mL/minMobile phase: water/acetonitrile = 20/80Column temp.: 50 °CInjection vol.: 1 µLDAD: 251 nm, 4 nm, ref 360, 80 Hz, slit
4 nm, 5 µL detector cell with 6-mm path length
A practical example for the evalu-ation of limits of detection (LOD)at different data rates is given infigure 4. 10 pg/µL of anthracenewere injected at 10, 20, 40 and 80 Hz. Using these ultra fast chro-matographic parameters the LODat 10 Hz is about 0.67 pg, which isthe lowest achievable level underthese conditions but the resolu-tion is far better at 20, 40 or 80 Hz.In this case a good compromisewould be to use the 40 Hz settingwith less sensitivity but with bet-ter resolution and more reliableintegration for improved quantita-tion.
Evaluation of linearityMeasuring high and low concen-trations in one run is only possibleif the detector offers a widedynamic range. In figure 5 the linearity was tested using caffeineas a test compound. Two experi-ments were done, one with onlythe UV lamp on and the secondone with both UV and Vis lamps on.
The result is that the Agilent 1100Series DAD SL provides a “linear “dynamic range for the tested caffeine sample up to 2.5 AU witha deviation of 5 % at 2.5 AU. At 2 AU the deviation is about 2 %. A common specification for a UVdetector is that at 2.0 AU the devi-ation should be in the 5 % range.These experiments also demon-strate that the tungsten lamp
6
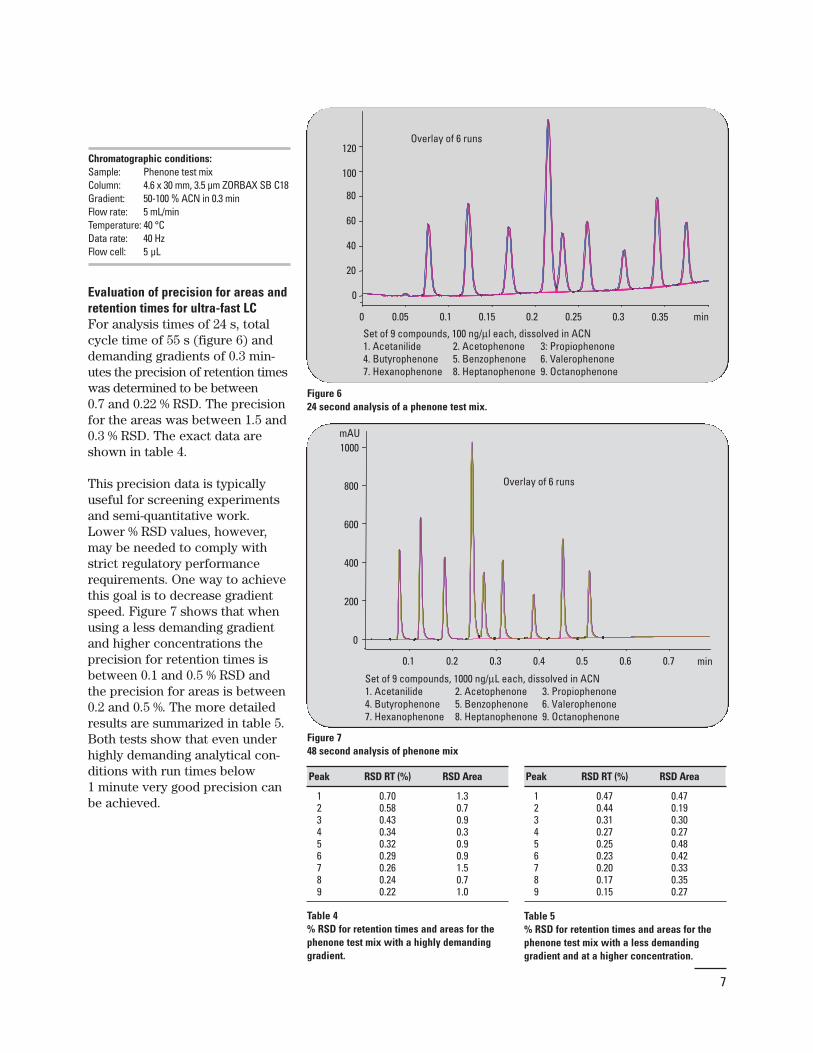
Evaluation of precision for areas andretention times for ultra-fast LCFor analysis times of 24 s, totalcycle time of 55 s (figure 6) anddemanding gradients of 0.3 min-utes the precision of retention timeswas determined to be between0.7 and 0.22 % RSD. The precisionfor the areas was between 1.5 and0.3 % RSD. The exact data areshown in table 4.
This precision data is typicallyuseful for screening experimentsand semi-quantitative work.Lower % RSD values, however,may be needed to comply withstrict regulatory performancerequirements. One way to achievethis goal is to decrease gradientspeed. Figure 7 shows that whenusing a less demanding gradientand higher concentrations theprecision for retention times isbetween 0.1 and 0.5 % RSD andthe precision for areas is between0.2 and 0.5 %. The more detailedresults are summarized in table 5.Both tests show that even underhighly demanding analytical con-ditions with run times below 1 minute very good precision canbe achieved.
min0 0.05 0.1 0.15 0.2 0.25 0.3 0.35
0
20
40
60
80
100
120Overlay of 6 runs
Set of 9 compounds, 100 ng/μl each, dissolved in ACN 1. Acetanilide 2. Acetophenone 3: Propiophenone 4. Butyrophenone 5. Benzophenone 6. Valerophenone 7. Hexanophenone 8. Heptanophenone 9. Octanophenone
Figure 624 second analysis of a phenone test mix.
min0.1 0.2 0.3 0.4 0.5 0.6 0.7
mAU
0
200
400
600
800
1000
Overlay of 6 runs
Set of 9 compounds, 1000 ng/μL each, dissolved in ACN 1. Acetanilide 2. Acetophenone 3. Propiophenone 4. Butyrophenone 5. Benzophenone 6. Valerophenone7. Hexanophenone 8. Heptanophenone 9. Octanophenone
Figure 748 second analysis of phenone mix
Chromatographic conditions: Sample: Phenone test mixColumn: 4.6 x 30 mm, 3.5 µm ZORBAX SB C18Gradient: 50-100 % ACN in 0.3 minFlow rate: 5 mL/minTemperature: 40 °CData rate: 40 HzFlow cell: 5 µL
Peak RSD RT (%) RSD Area
1 0.70 1.32 0.58 0.73 0.43 0.94 0.34 0.35 0.32 0.96 0.29 0.97 0.26 1.58 0.24 0.79 0.22 1.0
Table 4% RSD for retention times and areas for the phenone test mix with a highly demanding gradient.
Peak RSD RT (%) RSD Area
1 0.47 0.472 0.44 0.193 0.31 0.304 0.27 0.275 0.25 0.486 0.23 0.427 0.20 0.338 0.17 0.359 0.15 0.27
Table 5% RSD for retention times and areas for the phenone test mix with a less demanding gradient and at a higher concentration.
7
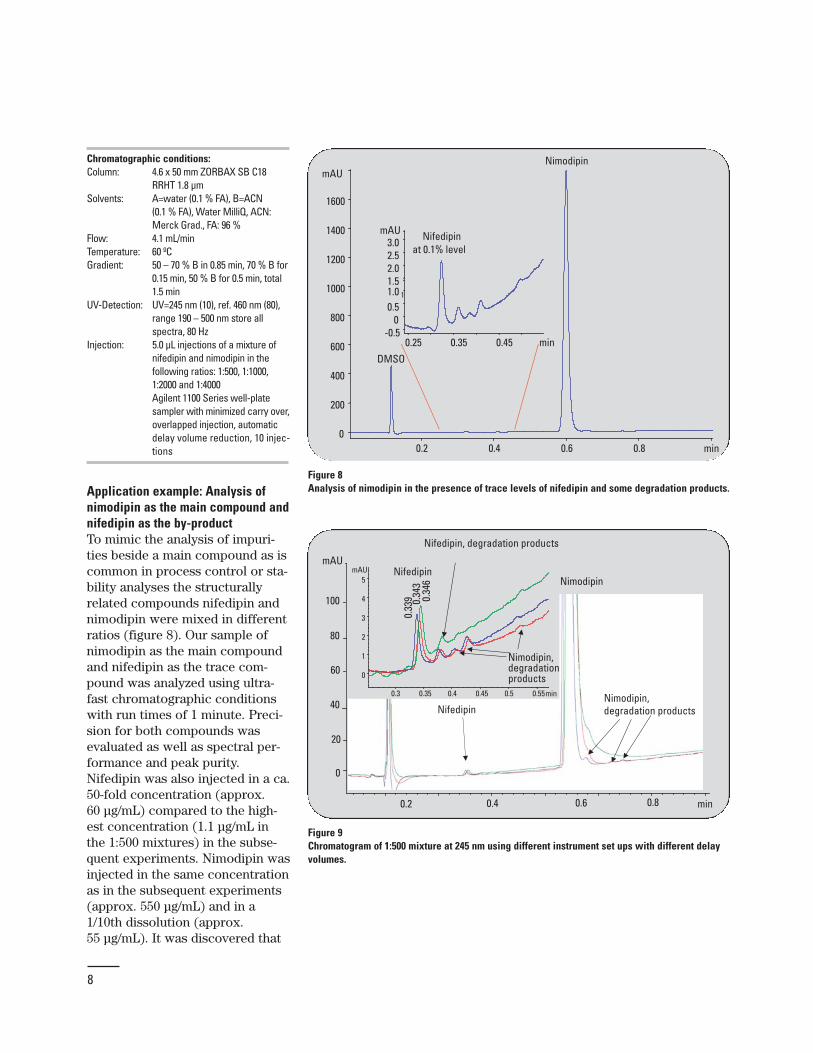
Application example: Analysis ofnimodipin as the main compound andnifedipin as the by-productTo mimic the analysis of impuri-ties beside a main compound as iscommon in process control or sta-bility analyses the structurallyrelated compounds nifedipin andnimodipin were mixed in differentratios (figure 8). Our sample ofnimodipin as the main compoundand nifedipin as the trace com-pound was analyzed using ultra-fast chromatographic conditionswith run times of 1 minute. Preci-sion for both compounds wasevaluated as well as spectral per-formance and peak purity.Nifedipin was also injected in a ca.50-fold concentration (approx. 60 µg/mL) compared to the high-est concentration (1.1 µg/mL inthe 1:500 mixtures) in the subse-quent experiments. Nimodipin wasinjected in the same concentrationas in the subsequent experiments(approx. 550 µg/mL) and in a1/10th dissolution (approx. 55 µg/mL). It was discovered that
8
Chromatographic conditions: Column: 4.6 x 50 mm ZORBAX SB C18
RRHT 1.8 µmSolvents: A=water (0.1 % FA), B=ACN
(0.1 % FA), Water MilliQ, ACN: Merck Grad., FA: 96 %
Flow: 4.1 mL/min Temperature: 60 ºCGradient: 50 – 70 % B in 0.85 min, 70 % B for
0.15 min, 50 % B for 0.5 min, total 1.5 min
UV-Detection: UV=245 nm (10), ref. 460 nm (80), range 190 – 500 nm store all spectra, 80 Hz
Injection: 5.0 µL injections of a mixture of nifedipin and nimodipin in the following ratios: 1:500, 1:1000, 1:2000 and 1:4000 Agilent 1100 Series well-plate sampler with minimized carry over, overlapped injection, automatic delay volume reduction, 10 injec-tions
min0.25 0.35 0.45
mAU
-0.50
0.51
1.52.02.53.0
1.0
Nifedipinat 0.1% level
min0.2 0.4 0.6 0.8
mAU
0
200
400
600
800
1000
1200
1400
1600
DMSO
Nimodipin
Figure 8Analysis of nimodipin in the presence of trace levels of nifedipin and some degradation products.
Nimodipin
Nifedipin
min0.2 0.4 0.6 0.8
mAU
0
20
40
60
80
100
min0.3 0.35 0.4 0.45 0.5 0.55
mAU
0
1
2
3
4
5Nifedipin
Nimodipin,degradation products
Nifedipin, degradation products
Nimodipin,degradation products
0.33
9 0.34
30.
346
Figure 9Chromatogram of 1:500 mixture at 245 nm using different instrument set ups with different delay volumes.
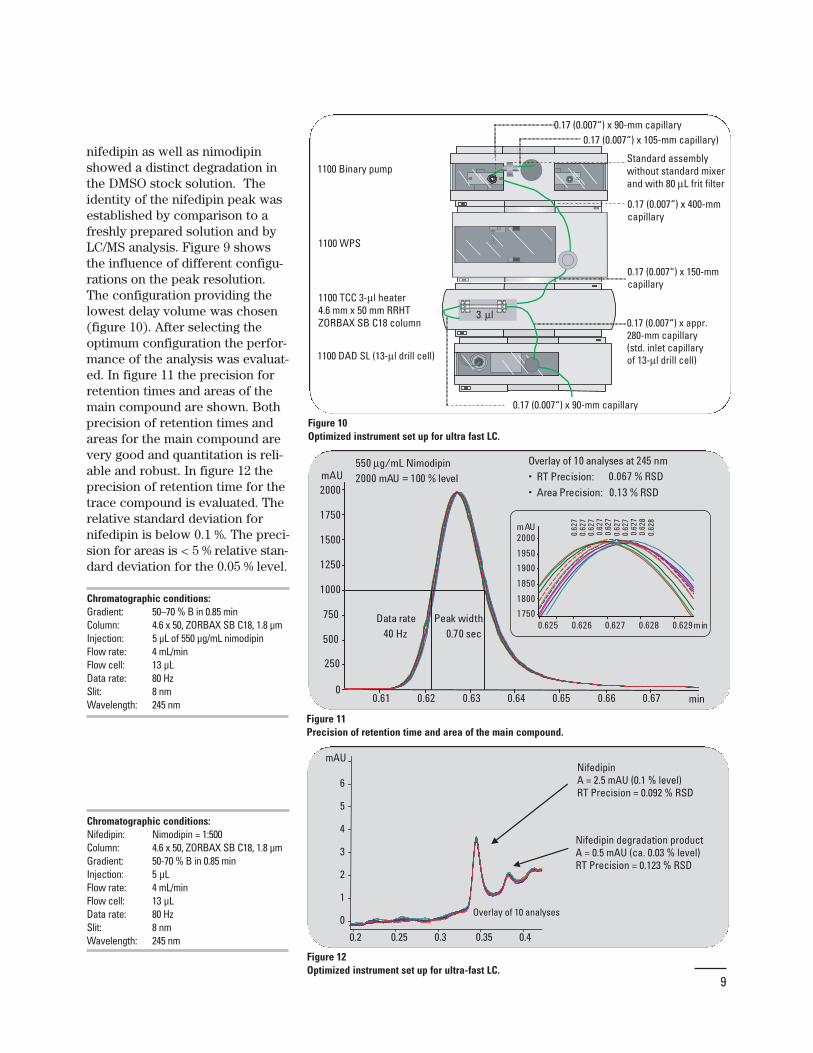
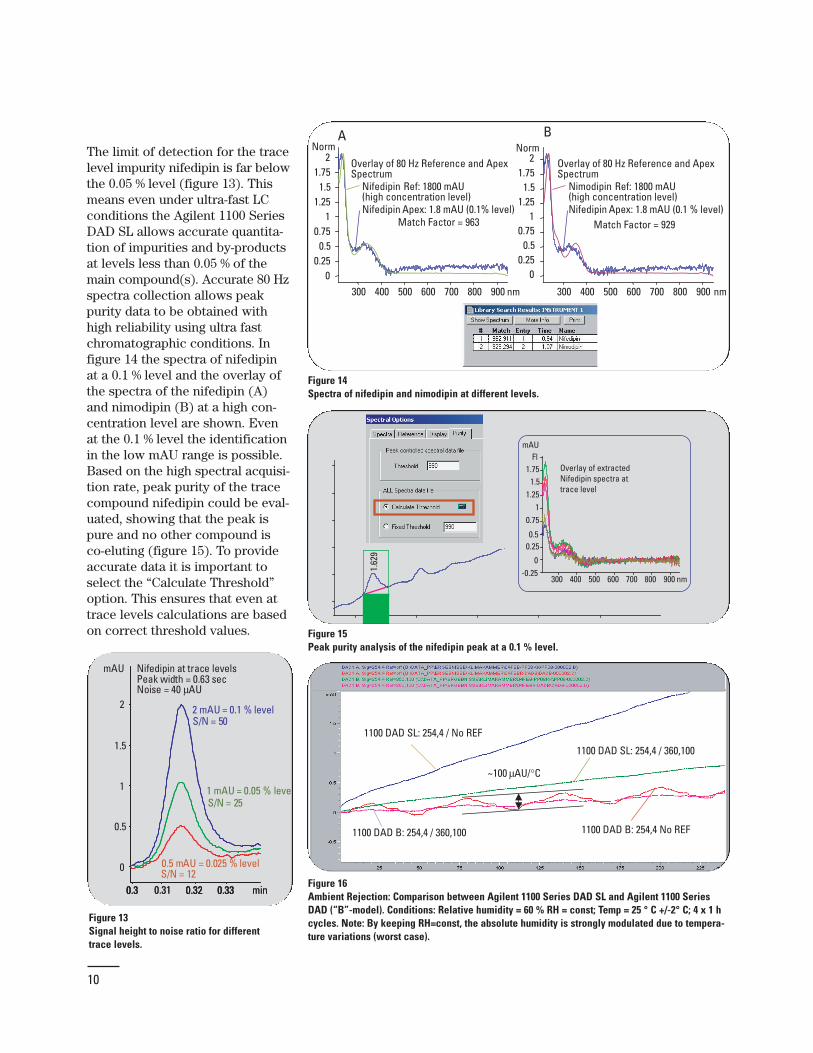
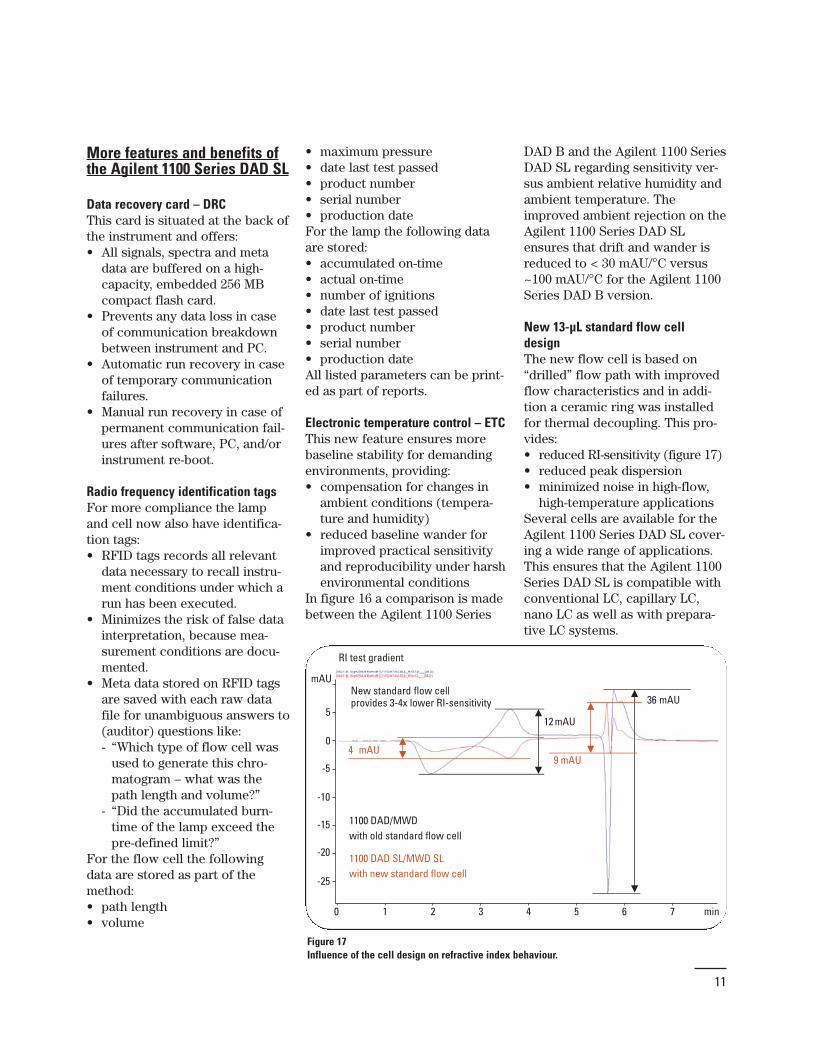
nifedipin as well as nimodipinshowed a distinct degradation inthe DMSO stock solution. Theidentity of the nifedipin peak wasestablished by comparison to afreshly prepared solution and byLC/MS analysis. Figure 9 showsthe influence of different configu-rations on the peak resolution.The configuration providing thelowest delay volume was chosen(figure 10). After selecting theoptimum configuration the perfor-mance of the analysis was evaluat-ed. In figure 11 the precision forretention times and areas of themain compound are shown. Bothprecision of retention times andareas for the main compound arevery good and quantitation is reli-able and robust. In figure 12 theprecision of retention time for thetrace compound is evaluated. Therelative standard deviation fornifedipin is below 0.1 %. The preci-sion for areas is < 5 % relative stan-dard deviation for the 0.05 % level.
0.17 (0.007“) x appr. 280-mm capillary (std. inlet capillary of 13-μl drill cell)
Standard assembly without standard mixer and with 80 μL frit filter
0.17 (0.007“) x 400-mm capillary
0.17 (0.007“) x 150-mm capillary
0.17 (0.007“) x 90-mm capillary
3 μl
1100 Binary pump
1100 DAD SL (13-μl drill cell)
0.17 (0.007“) x 105-mm capillary)
0.17 (0.007“) x 90-mm capillary
1100 WPS
1100 TCC 3-μl heater4.6 mm x 50 mm RRHT ZORBAX SB C18 column
Figure 10Optimized instrument set up for ultra fast LC.
min0.61 0.62 0.63 0.64 0.65 0.66 0.67
mAU
0
250
500
750
1000
1250
1500
1750
2000
550 μg/mL Nimodipin
2000 mAU = 100 % level
mAU
1800
1850
1900
1950
2000
0.62
8
0.62
70.
627
0.62
7
0.62
7
0.62
7
0.62
7
0.62
8
0.62
7
0.62
7
min0.625 0.626 0.627 0.628 0.6291750Peak width
0.70 sec
Overlay of 10 analyses at 245 nm
• RT Precision: 0.067 % RSD
• Area Precision: 0.13 % RSD
Data rate
40 Hz
Figure 11Precision of retention time and area of the main compound.
Chromatographic conditions: Gradient: 50–70 % B in 0.85 minColumn: 4.6 x 50, ZORBAX SB C18, 1.8 µmInjection: 5 µL of 550 µg/mL nimodipinFlow rate: 4 mL/minFlow cell: 13 µLData rate: 80 HzSlit: 8 nmWavelength: 245 nm
min0.2 0.25 0.3 0.35 0.4 0.45 0.5 0.55
mAU
0
1
2
3
4
5
6
Overlay of 10 analyses
Nifedipin A = 2.5 mAU (0.1 % level)RT Precision = 0.092 % RSD
Nifedipin degradation product A = 0.5 mAU (ca. 0.03 % level)RT Precision = 0.123 % RSD
Figure 12Optimized instrument set up for ultra-fast LC.
9
Chromatographic conditions: Nifedipin: Nimodipin = 1:500Column: 4.6 x 50, ZORBAX SB C18, 1.8 µmGradient: 50-70 % B in 0.85 minInjection: 5 µLFlow rate: 4 mL/minFlow cell: 13 µLData rate: 80 HzSlit: 8 nmWavelength: 245 nm
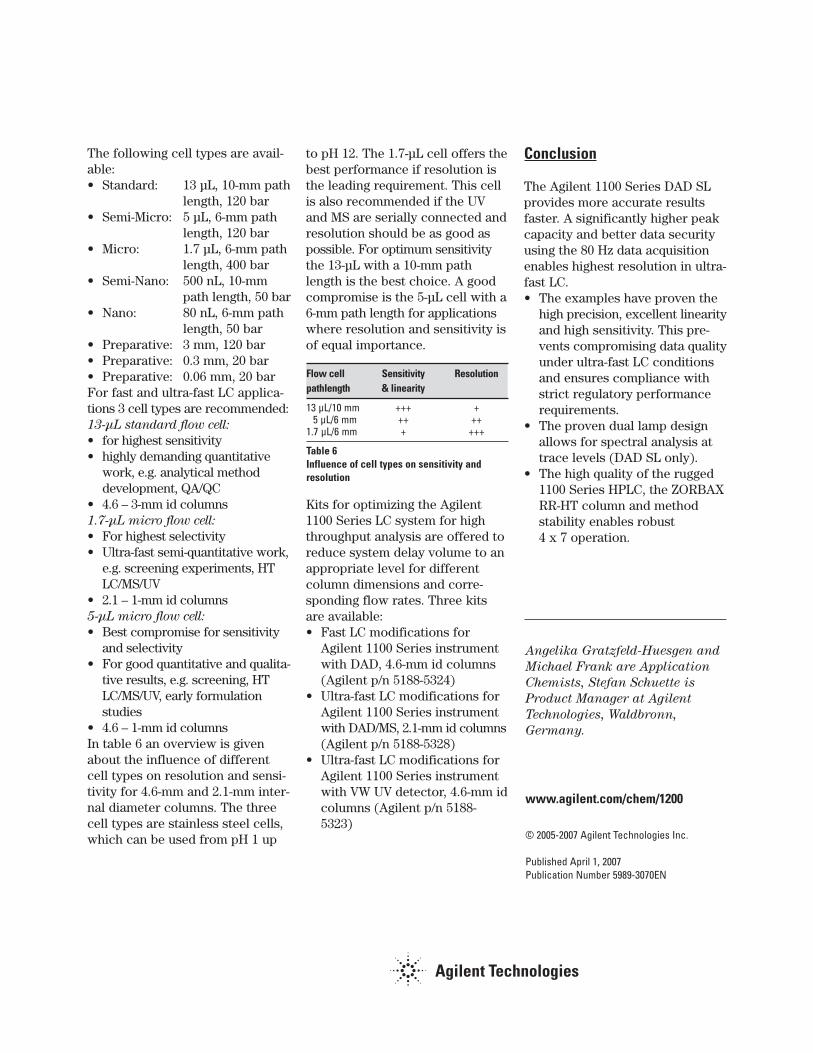
The limit of detection for the tracelevel impurity nifedipin is far belowthe 0.05 % level (figure 13). Thismeans even under ultra-fast LCconditions the Agilent 1100 SeriesDAD SL allows accurate quantita-tion of impurities and by-productsat levels less than 0.05 % of themain compound(s). Accurate 80 Hzspectra collection allows peakpurity data to be obtained withhigh reliability using ultra fastchromatographic conditions. Infigure 14 the spectra of nifedipinat a 0.1 % level and the overlay ofthe spectra of the nifedipin (A)and nimodipin (B) at a high con-centration level are shown. Evenat the 0.1 % level the identificationin the low mAU range is possible.Based on the high spectral acquisi-tion rate, peak purity of the tracecompound nifedipin could be eval-uated, showing that the peak ispure and no other compound isco-eluting (figure 15). To provideaccurate data it is important toselect the “Calculate Threshold”option. This ensures that even attrace levels calculations are basedon correct threshold values.
Nifedipin at trace levelsPeak width = 0.63 secNoise = 40 μAU
min0.3 0.31 0.32 0.33
mAU
0
0.5
1
1.5
2
min0.3 0.31 0.32 0.330.3 0.32 0.33
2 mAU = 0.1 % levelS/N = 50
1 mAU = 0.05 % levelS/N = 25
0.5 mAU = 0.025 % level S/N = 12
Figure 13Signal height to noise ratio for different trace levels.
nm300 400 500 600 700 800 900
Norm
00.25
0.50.75
11.25
1.51.75
2
nm300 400 500 600 700 800 900
Norm
00.25
0.50.75
11.25
1.51.75
2Overlay of 80 Hz Reference and ApexSpectrum
Nifedipin Ref: 1800 mAU (high concentration level)Nifedipin Apex: 1.8 mAU (0.1% level)
Overlay of 80 Hz Reference and ApexSpectrum
Nimodipin Ref: 1800 mAU (high concentration level) Nifedipin Apex: 1.8 mAU (0.1 % level)
Match Factor = 929
A B
Match Factor = 963
Figure 14Spectra of nifedipin and nimodipin at different levels.
1.6 1.8
6
8
10
12
14
1.629
nm300 400 500 600 700 800 900
Fl
-0.250
0.250.5
0.751
1.251.5
1.75
mAU
Overlay of extracted Nifedipin spectra at trace level
1.62
9
Figure 15Peak purity analysis of the nifedipin peak at a 0.1 % level.
10
1100 DAD SL: 254,4 / No REF
1100 DAD B: 254,4 No REF
~100 μAU/°C
1100 DAD SL: 254,4 / 360,100
1100 DAD B: 254,4 / 360,100
Figure 16Ambient Rejection: Comparison between Agilent 1100 Series DAD SL and Agilent 1100 SeriesDAD (“B”-model). Conditions: Relative humidity = 60 % RH = const; Temp = 25 ° C +/-2° C; 4 x 1 hcycles. Note: By keeping RH=const, the absolute humidity is strongly modulated due to tempera-ture variations (worst case).
More features and benefits ofthe Agilent 1100 Series DAD SL
Data recovery card – DRCThis card is situated at the back ofthe instrument and offers:• All signals, spectra and meta
data are buffered on a high-capacity, embedded 256 MBcompact flash card.
• Prevents any data loss in caseof communication breakdownbetween instrument and PC.
• Automatic run recovery in caseof temporary communicationfailures.
• Manual run recovery in case ofpermanent communication fail-ures after software, PC, and/orinstrument re-boot.
Radio frequency identification tagsFor more compliance the lampand cell now also have identifica-tion tags: • RFID tags records all relevant
data necessary to recall instru-ment conditions under which arun has been executed.
• Minimizes the risk of false datainterpretation, because mea-surement conditions are docu-mented.
• Meta data stored on RFID tagsare saved with each raw datafile for unambiguous answers to(auditor) questions like:- “Which type of flow cell was
used to generate this chro-matogram – what was the path length and volume?”
- “Did the accumulated burn-time of the lamp exceed the pre-defined limit?”
For the flow cell the followingdata are stored as part of themethod:• path length• volume
• maximum pressure• date last test passed• product number• serial number• production dateFor the lamp the following dataare stored:• accumulated on-time• actual on-time• number of ignitions• date last test passed• product number• serial number• production dateAll listed parameters can be print-ed as part of reports.
Electronic temperature control – ETCThis new feature ensures morebaseline stability for demandingenvironments, providing:• compensation for changes in
ambient conditions (tempera-ture and humidity)
• reduced baseline wander forimproved practical sensitivityand reproducibility under harshenvironmental conditions
In figure 16 a comparison is madebetween the Agilent 1100 Series
DAD B and the Agilent 1100 SeriesDAD SL regarding sensitivity ver-sus ambient relative humidity andambient temperature. Theimproved ambient rejection on theAgilent 1100 Series DAD SLensures that drift and wander isreduced to < 30 mAU/°C versus~100 mAU/°C for the Agilent 1100Series DAD B version.
New 13-µL standard flow celldesignThe new flow cell is based on“drilled” flow path with improvedflow characteristics and in addi-tion a ceramic ring was installedfor thermal decoupling. This pro-vides:• reduced RI-sensitivity (figure 17)• reduced peak dispersion• minimized noise in high-flow,
high-temperature applicationsSeveral cells are available for theAgilent 1100 Series DAD SL cover-ing a wide range of applications.This ensures that the Agilent 1100Series DAD SL is compatible withconventional LC, capillary LC,nano LC as well as with prepara-tive LC systems.
provides 3-4x lower RI-sensitivity
12 mAU
36 mAU
9 mAU
New standard flow cell
1100 DAD/MWDwith old standard flow cell
1100 DAD SL/MWD SLwith new standard flow cell
4 mAU
RI test gradient
mAU
5
0
-5
-10
-15
-20
-25
0 1 2 3 4 5 6 7 min
Figure 17Influence of the cell design on refractive index behaviour.
11
© 2005-2007 Agilent Technologies Inc.
Published April 1, 2007Publication Number 5989-3070EN
www.agilent.com/chem/1200
Angelika Gratzfeld-Huesgen and
Michael Frank are Application
Chemists, Stefan Schuette is
Product Manager at Agilent
Technologies, Waldbronn,
Germany.
The following cell types are avail-able:• Standard: 13 µL, 10-mm path
length, 120 bar• Semi-Micro: 5 µL, 6-mm path
length, 120 bar• Micro: 1.7 µL, 6-mm path
length, 400 bar• Semi-Nano: 500 nL, 10-mm
path length, 50 bar • Nano: 80 nL, 6-mm path
length, 50 bar• Preparative: 3 mm, 120 bar• Preparative: 0.3 mm, 20 bar• Preparative: 0.06 mm, 20 barFor fast and ultra-fast LC applica-tions 3 cell types are recommended:13-µL standard flow cell:
• for highest sensitivity• highly demanding quantitative
work, e.g. analytical methoddevelopment, QA/QC
• 4.6 – 3-mm id columns1.7-µL micro flow cell:
• For highest selectivity• Ultra-fast semi-quantitative work,
e.g. screening experiments, HTLC/MS/UV
• 2.1 – 1-mm id columns5-µL micro flow cell:
• Best compromise for sensitivityand selectivity
• For good quantitative and qualita-tive results, e.g. screening, HTLC/MS/UV, early formulationstudies
• 4.6 – 1-mm id columnsIn table 6 an overview is givenabout the influence of differentcell types on resolution and sensi-tivity for 4.6-mm and 2.1-mm inter-nal diameter columns. The threecell types are stainless steel cells,which can be used from pH 1 up
to pH 12. The 1.7-µL cell offers thebest performance if resolution isthe leading requirement. This cellis also recommended if the UVand MS are serially connected andresolution should be as good aspossible. For optimum sensitivitythe 13-µL with a 10-mm pathlength is the best choice. A goodcompromise is the 5-µL cell with a6-mm path length for applicationswhere resolution and sensitivity isof equal importance.
Kits for optimizing the Agilent1100 Series LC system for highthroughput analysis are offered toreduce system delay volume to anappropriate level for different column dimensions and corre-sponding flow rates. Three kitsare available:• Fast LC modifications for
Agilent 1100 Series instrumentwith DAD, 4.6-mm id columns(Agilent p/n 5188-5324)
• Ultra-fast LC modifications forAgilent 1100 Series instrumentwith DAD/MS, 2.1-mm id columns(Agilent p/n 5188-5328)
• Ultra-fast LC modifications forAgilent 1100 Series instrumentwith VW UV detector, 4.6-mm idcolumns (Agilent p/n 5188-5323)
Flow cell Sensitivity Resolutionpathlength & linearity
13 µL/10 mm +++ +5 µL/6 mm ++ ++
1.7 µL/6 mm + +++
Table 6Influence of cell types on sensitivity and resolution
Conclusion
The Agilent 1100 Series DAD SLprovides more accurate resultsfaster. A significantly higher peakcapacity and better data securityusing the 80 Hz data acquisitionenables highest resolution in ultra-fast LC. • The examples have proven the
high precision, excellent linearityand high sensitivity. This pre-vents compromising data qualityunder ultra-fast LC conditionsand ensures compliance withstrict regulatory performancerequirements.
• The proven dual lamp designallows for spectral analysis attrace levels (DAD SL only).
• The high quality of the rugged1100 Series HPLC, the ZORBAXRR-HT column and method stability enables robust 4 x 7 operation.