Embed Size (px)
Citation preview

EISCAT
TECHNICAL
NOTE
EISC T VHF TE TESTSby
Per- linan Kildal
KIRUNASweden
80/21


EISCAT Technica1 Not~ MO/21
EISCAT VHF ANTENNA TESTS
by
Per-Simon Ki1da1
EISCAT Tec!lnica1 Note 80/2.lEISCAT SClentific AssociationPrinted in SwedenKiruna, September 1980ISSN 0349-2710

ELAB
Abstract
- l -
EISCAT VHF ANTENNA TESTS
by
Per-Simon Kildal
The report contains the main results of the measurements on the
EISCAT VHF antenna during the RF acceptance tests in December 1979
and March 1980.
The VHF antenna satisfies all specifications with adequate margins
at broads ide and for phase steering angles up to 21.3°. However,
phase steering angles larger than 21.3° cannat be reached because
the impedance mismatch of the vertical (i.e. transverse) dipoles
increases severely.
ELABPreface
- 2 -
The cantract for the EISCAT VHF parabolic cylinder antenna was
given to a consortium of the German companies MAN, KRUPP and MBB
(Messerschmidt-Bplkow-Blohm) in February 1978.
The electrical design of the antenna was done in cooporation with
EISCAT. Final review of both the mechanical and electrical design
taak place in January 1979.
The erection of the antenna was completed during the summer and
autumn 1979. Some minor adjustments and painting work was left
until May 1980.
A brief breakdown of the total price of the antenna is shown
in Table l. Different ordered options are included in the prices,
except spare parts.
This report contains the main results of the RF tests, both the
acceptance tests proposed by MBB, and the additional tests
proposed by Kildal. The tests were performed from l Dec. to
15 Dec. 1979, and from 26 Febr. to 20 March 1980, by Mr. Schroer
and Mr. Killesreiter from MBB, Svein Olav Simonsen and Jan Henriksen
from EI~CAT, and Per-Simon Kildal from ELAB. The rhase steerinQ
of the an tenna was done ~, EI$CAT staff under direction of Per-Sirron Kildal.
Four 30m x 40m antenna elements with
back skin (and incremental encoders)
RF distribution system, phasing cables
and optirnized dipole design
Switch yard
Foundations
Total price (inel. DM 181.450,00 diseount)
Table l. Breakdown of priees of VHF antenna.
DM 8 427 300.00
DM 3 115 100.00
228 700.00
DM l 280 000.00
DM 12 640 950.00

ELAB - 3 -
Only a few drift seans of Cas A åreinc!uded in this report.
More seans are faund in the measurement journal [la].
A discription of the measurement setup and detailed measurement
results of the active reflection loss of the dipoles are faund in
the measurement journals [11] and [12].
ELABCONTENTS
- 4 -
ABSTRACT • • • . . . • . . . . . . . . • • • . . • . • • • • . . • . . . • • . • • • • • • . • . . . . . • • . .. l
PREFACE . • . • . . • • • . . • . • . . . • • . • . • • • . • . • • • • • . • . • . • • • • . • • • . • . . . . .• 2
LIST OF TABLE S . . . . . • . . • • . . • • • • • • • • • • • • • • • • • . • • • • • • • • . • . • . • • • • 5
LIST OF FIGURES . . . . . . . . . . . . . . . . . . . . . . . . . . . . . . . . . . . . . . . . . . . . .. 5
I. SUMMARY OF RESULTS...................................... 6
1.1. Line Feed Measurements........................... 6
I. 2. Switch yard...................................... 7
I. 3 . VSWR. • . . • • • • . • • • • • • • . . . • • • • . . . . . . . • . . . . . . • . . . . . . . 8
1.4. Manual Phase Steering 11
l.5. Dipole Impedance 12
1.6. Pdclio Source Measurements 15
II. MEASUREMENTS OF REFLECTIONS AT DIPOLE INPUTS 18
11.1. Broadside 20
11.2. Phase Steered 0.0 •••••••••••• 0.0 •••••••••• 21
III. RADIO SQURCE MEASUREMENTS.••....•.............••••.....• 24
111.1. Available Radio Sources 24
111.2. Flux Density of CAS A.o 0_0 •••••••• _ ••• 0.0 ••• 0.0 •• 26
111.3. Measurement method o o o .. o 28
111.4. Calibrationo o o o 30
111.5. Resu1ts o o 33
REFERENCES .........•.•.•••........••........•................ 39
DIAf";RAMS 1-7 o. o o o 41
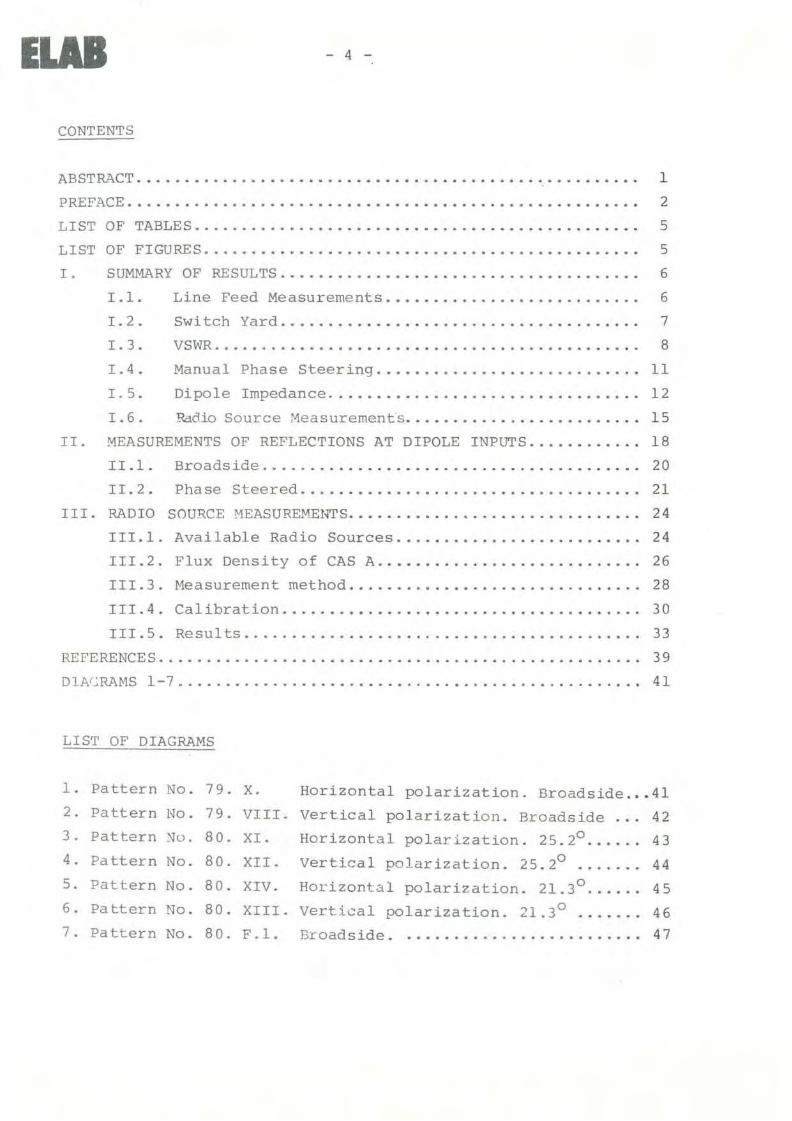
LIST OF DIAGRAMS
1. Pa ttern No. 79. X. Horizonta1 po1arization. Broadside ., .412. Pattern No. 79. VIII. Vertica1 po1arization o Broadside ... 423. Pattern ~u. 8 O. XI. Horizontal polar ization. 25. 20
• ••••• 434. Pa ttern No. 80. XII. Vertical polarization. 25.20
o •••••• 445. Pattern No. 80. XIV. Horizontal polarization. o 4521. 3 .•.•..6. Pa ttern No. 80. XIII . vertical polar iza tion. 21.3 0
• •• o •• o 467 . Pa ttern No. 80. F .1. Broadside . . ........................ 47
ELIB - 5 -
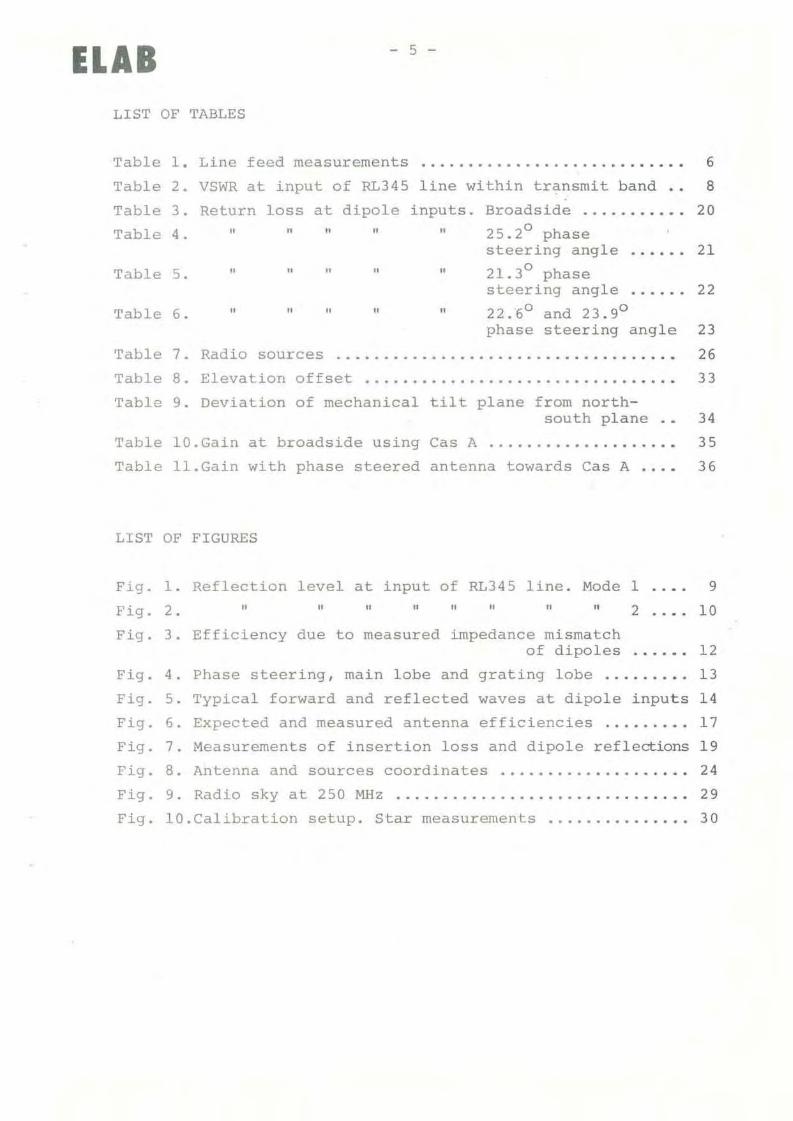
LIST OF TABLES
Table l. Line feed measurements
34
35
36
22
23
26
33
6
8
20
21
Radio SQurces
VSWR at input of RL345 line within transmit band ..Return loss at dipole inputs. Broadside ...........
" ., " " " 25.2° phasesteering angle ......
" " " " " 21. 3° phasesteering angle ......
" " " " " 22.6° and 23.9°phase steering angle
Elevatian of f set .
Deviation of mechanical tilt plane from northsouth plane .•
Table lO.Gain at broadside using Cas A ...................•
Table 11.Gain with phase steered antenna towards Cas A ...•
Table 2.
Table 3 .
Table 4 •
Table 5.
Table 6.
Table 7 .
Table 8.
Table 9.
LIST OF FIGURES
Fig. l. Reflection level at input of RL345 line. Mode l 9
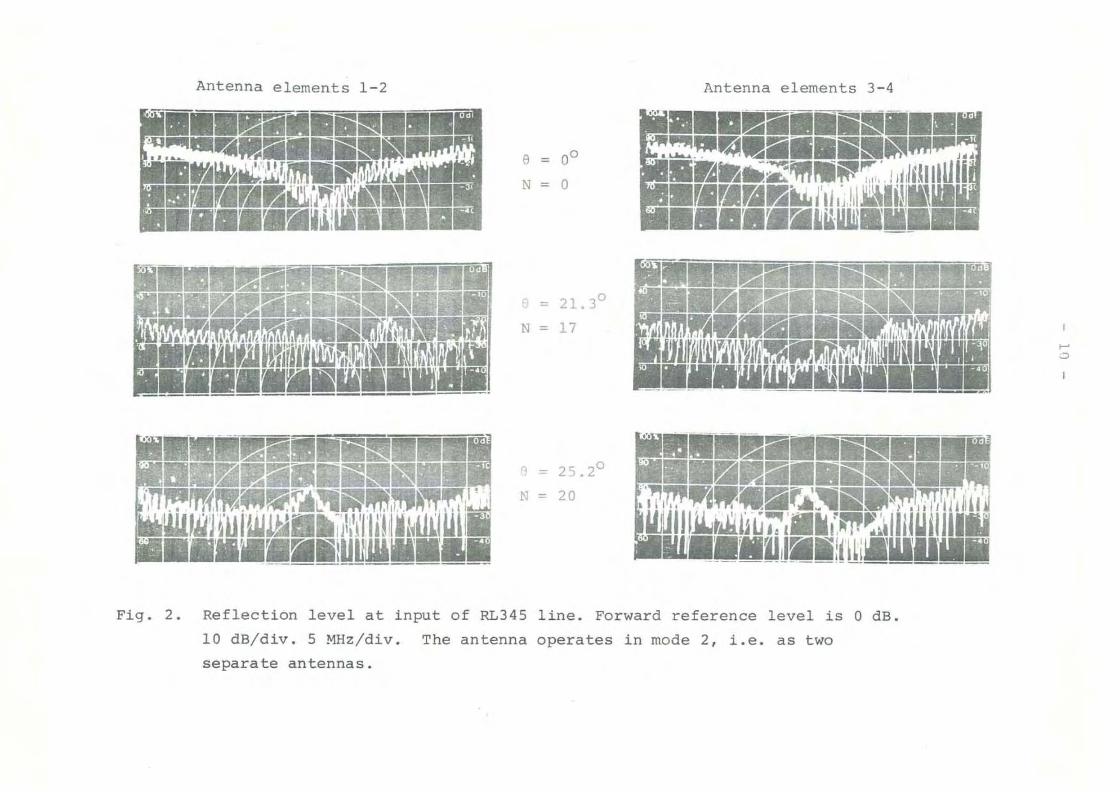
Fig. 2. " Il ,. " "" " "2 10
Fig. 3. Efficiency due to measured impedance mismatchof dipoles 12
Fig. 4. Phase steering, main 10be and grating 10be .......•. 13
Fig. 5. Typica1 forward and reflected waves at dipole inputs 14
Fig. 6. Expected and measured antenna efficiencies ..••...•. 17
Fig. 7. Measurements of insertion loss and dipole reflections 19
Fig. 8. Antenna and sources coordinates 24
Fig. 9. Radio skyat 250 MHz ..............................• 29
Fig. 10.Calibration setup. Star measurements ........•...... 30
ELABl. SUMMARY OF RESULTS
- 6 -
This section contains a summary of the measurement results
presented in [10], [11], [12]and Seco II anc Seco III of this
report.
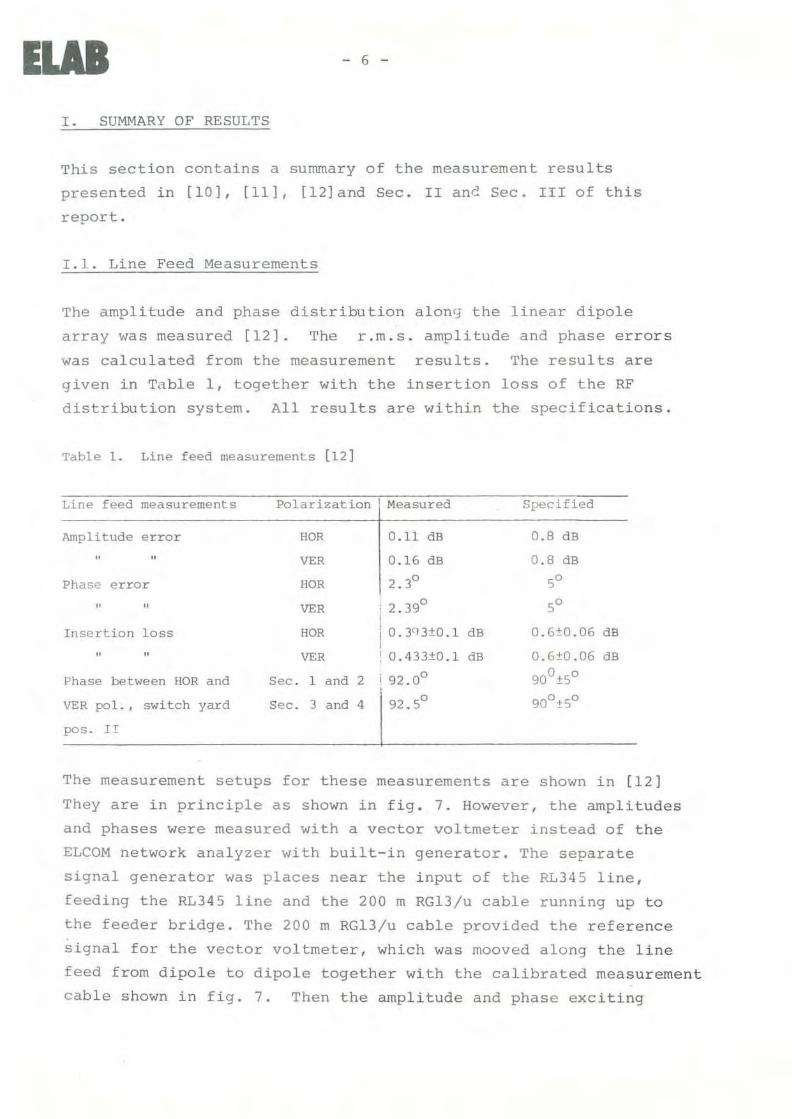
1.1. Line Feed Measurements
The amplitude and phase distribution along the linear dipole
array was measured [12). The r.m.s. amplitude and phase errors
was ca!culated from the measurement results. The results are
given in Table 1, together with the insertion loss of the RF
distribution system. All results are within the specifications.
Table l. Line feed measurements [12]
Line feed measurements Polarization Measured Specified
Amplitude error HOR 0.11 dB 0.8 dB
" " VER 0.16 dB 0.8 dB
Phase error HOR 2.30 5°
" " VER ; 2.39° 5°
Insertion loss HOR 10.30 3±0., dB O.G±D.OG dB
" " VER ! O.433±O.1 dB O.6±O.O6 dH
Phase between HOR and Seco l and 2 i 92.0° 900 ±So
VER pol. • switch yard Seco 3 aod 4 92.So 900 ±So
pos. l!
The measurement setups for these measurements are shown in (12]
They are in princip1e as shown in fig. 7. However, the amp1itudes
and phases were measured with a vector voltmeter instead of the
ELCOM network ana1yzer with built-in generator. The separate
signal generator was places near the input of the RL345 line,
feeding the RL345 line and the 200 m RG13/u cable running up to
the feeder bridge. The 200 m RG13/u cable provided the reference
signal for the vector voltmeter, which was mooved along the line
feed from dipole to dipole together with the calibrated measurement
cab1e shown in fig. 7. Then the amplitude and phase exciting

ELAB - 7 -
each dipole could be measured on the forward port of
the directional coupler which was part of the calibrated measure
ment cable. In this way the phase stabil ity was assured because
the test signal through the line feed and the reference signal
got nearly the same time delay.
1.2. Switch Yard
The switch yard has two positions, mode l and 2. Antenna mode
lmeans that the antenna opera tes as one antenna, one RL 345
line feeding one polarization, and the other the orthogonal
polarization. Antenna mode 2 means that one RL 345 line feeds
the tWQ western sections (1-2) of the antenna, and the other
the two eastern sections (3-4), so that it opera tes as two
antennas, each with circular polarization.
When the antenna is in mode 2,both halves transMit with right hand
circular polarization. The back-scattered signal will have
left circular polarization, and will be received on a port on
a 3 dB hybrid inside the switch yard. The coupling C of the
input pj,345 lines to the receiver ports in the switch yard was
measured. The results are (worst case at 224 MHz) [llJ
C <- 25 dB
C <- 28 dB
C <- 16 dB
a t broadside
for e = 21.3°
for e = 25.2°

ELAB"I",-=3",_-,,-VSW R
- B -
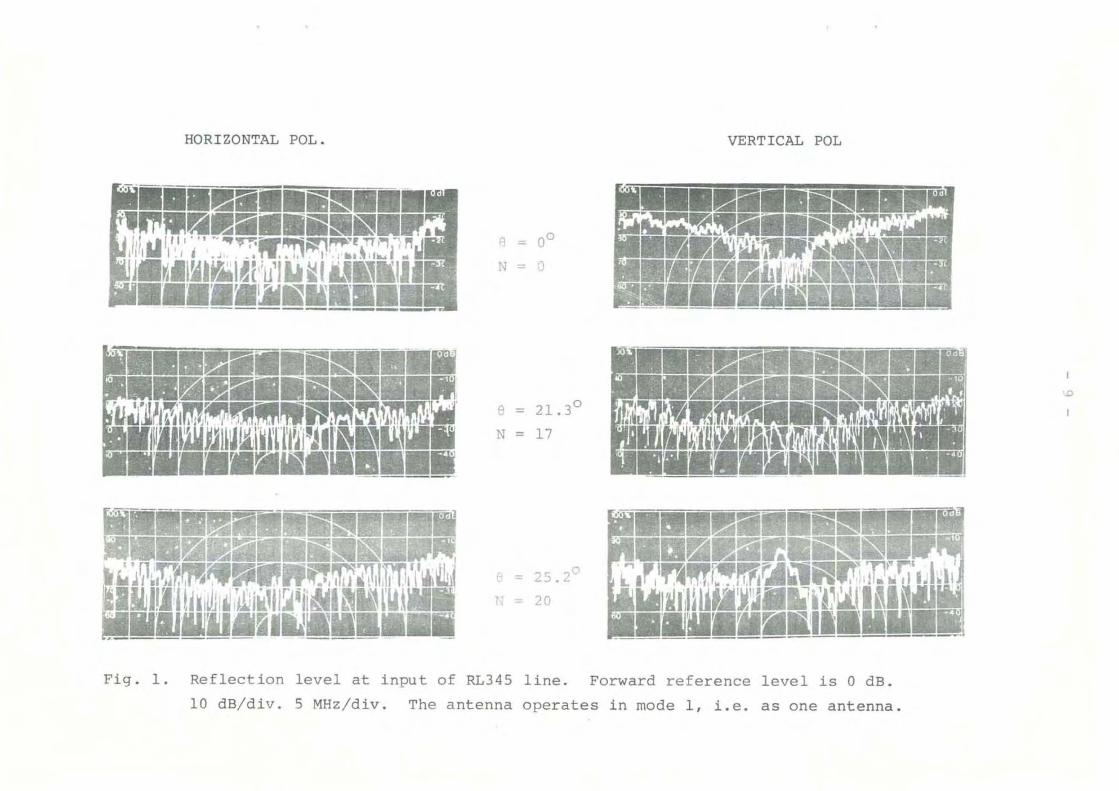
The VSWR at the input of the RL345 line was found by measuring the
return loss at the input. See Fig. l and 2. The speci-
fication within the ±1.25 MHz transmit band is
VS~vR < 1. 4
This is satisfied at broads ide and for a phase steering angle
e = 21.3° with large margins. The specification is alsa satis
tied for e = 25.2°. See Table 2.
Table 2. VSWR at input CJf RL345 line within transmit band. (224 ::1.25 MHz)
MODE l MODE 2Hor. pol I Ver .pol Sec.1-2 I Seco 3-4 '
, Return 10:;s 24 dB 26 dB 26 dB 26 dBBroadside 8 0
0
VSWR 1.13 1.11 1.11 1.11
8 21. 3°Return loss 26 dB 30 dB 27 dB 3S dB
VSWR 1.11 l.07 l. 09 1.04
8 25.2° Return loss 26 dB 16 dB 19 dB 21 da
VSWR 1.11 1. 38 1.25 1.20
HORIZONTAL POL.
..;,-- .·'~.,.•••Ii••iI••••~r.
Iii I"' .. , " "''I'T-''M'i~''''''''f TT~ -; ".11i'1&I I I I ,. _. .:i.' " .,~" l .. ~'''J.~IIW••I~(I;U'I~~I 111··wg··•••~••iI•••_
1IJ!:fii 1I.--r;j-_••••••II" 1'11.1J1f':wI"IIi--II-m~~'li..UIJtlJ1irl ~r~ II,1:l:!,""P'1,~;m1~t1:J.l k .1 ,'j:iIl:r,l~ •.-.IIIII~1W1JII~~lmlWj~II'I.~r"__ r.
.- .
= 00
N - ')
Il = 21.3 0
N = 17
~ 25.2°
2C
VERTICAL POL
.o
Fig. l. Reflection level at input of RL345 line. Forward reference level is O dB.
la dB/div. 5 MHz/div. The antenna operates in mode l, i.e. as one antenna.
Antenna elements 1-2
e = 00
N = o
= 21.3 0
N = 17
A = 25.20
N = 20
Antenna elements 3-4
,'.'.•••••••••
···..~.E.1!!::iii••iiO:!!II._.....:...... . ~ ~iiI IiiIl1'! ~...... J ..."-••••.-="",.ii\'':: IIimilIUll'._ I'II,~!JI~I'~j.· ·e.
...- ••••••iilWl•••
I-'..::>
Fig, 2. Reflection level at input of RL345 line. Forward reference level is O dB.
10 dBjdiv. 5 MHzjdiv. The antenna opera tes in mode 2, i.e. as two
separate antennas.
ELJUI -11 -
1.4. Manual Phase Steering
The VHF antenna can be phase steered manual ly by connecting
precut 7/8" Flexwell cables to the dipoles. There are 4 groups
of 67 phase cables with different length. It is gossible to phase
steer the antenna to 20 directions between broadside and 25.2° on
either side of broads ide l:::y rearrangina the sequence of phase cables
that are connected to each array element [4}. The possible phase
steering angles measured from broadside are given by
N(0.7.67
f~)f
N = 1,2,---,20
where f o = 224 MHz and f is the actual measurement frequency (4).
A computer program have been made in order to find the correct
cables to be cannected to the dipoles for a given N.
During the tests in March 1980 the complete antenna was phaseo osteered to e17 = 21.3 and e20 = 25.2 at 224 ~1Hz. Part of the
antenna was phase steered to same anales between.
It takes 4 persons about 4 hours to phase steer the complete
antenna from one angle to another. That is faster than expected.
The phase steering is simplified because all phase cables are
mounted on the wall inside the feeder bridge.
MBB once offered EISCAT 256 coaxial line stretchers instead of
the phase cables, :fOr an additional price of
a) Manually activated
b) Motor driven
c) Motor driven with controI position
416 610.- DM
593 280.- DM
648 650.- DM
The cheapest of these options amounts to more than 1.1 million N.kr.
For that price it is possible to phase steer the antenna manually
625 times if the 4 "phase shifters" have an hourly pay of 100 N.kr.
ILAS - 12 -
EISCAT requires
10 times a year.
therefore, to be
only the beam to be phase steered between 5 and
The choice of manual phase steering seems,
highly eest effective.
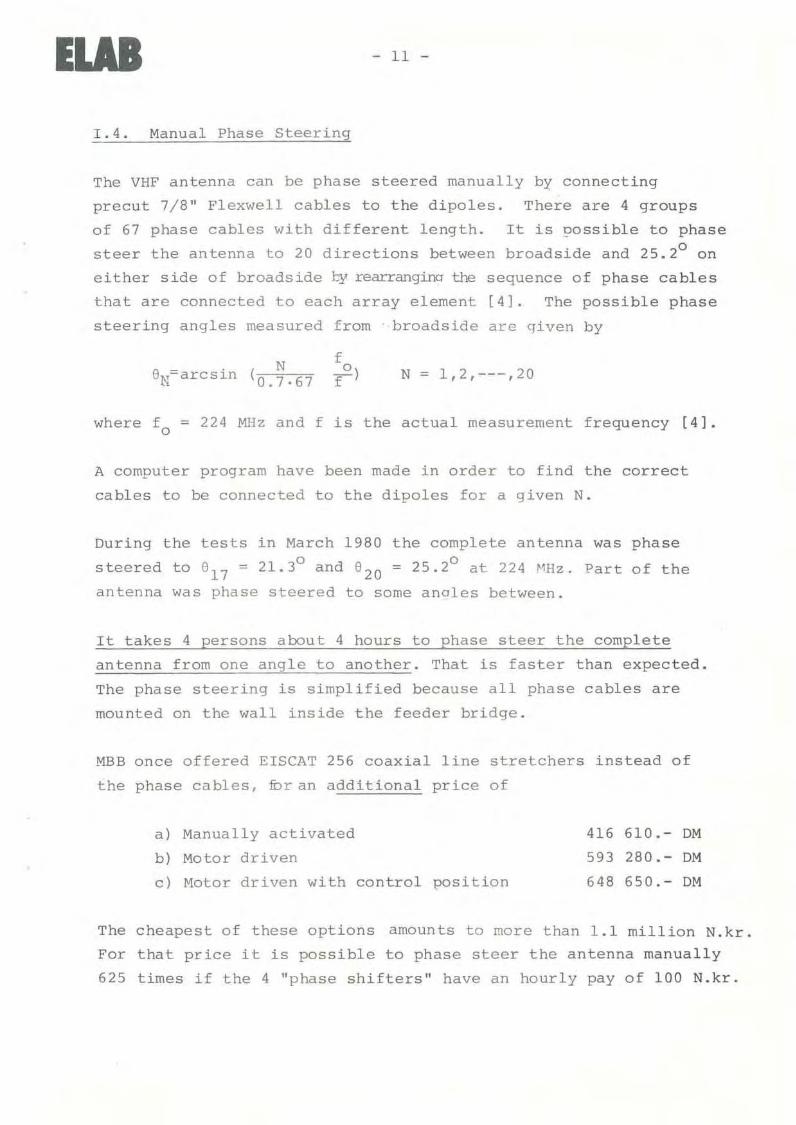
1.5. Dipole Impedance
The return loss at the dipole inputs with all dipoles excited
with correct amplitude and phase, was measured at broadside and
to
summarized inThe results aresee Seco II.phase steered,
3, which shows the mean transmission coefficient n. duel.mp
impedance mismatch at dipole inputs. The curves showa severe
mismatch for vertical polarization for e = 25°. Almost half
the incident power is reflected by the dipole. In fact the
return loss on the measured dipoles varied between 0.7 dB and
when
Fig.
6.5 dB for this position.
~PHASE STEERING ANGLE e25·20·s·
~:: -.. -......\\
~• Hor pol I
I
• Ver pol III
III
~ 080
o·D. 1,00•
F
'"'j 090o"o
'"'"wo~ 070L
'"z..~ 060
2 4 6 B 10 12 14 16 16 20 22
PHASE STEERING ANGLE No. N
Fiq.3. Efficiency due to measured impedance mismatch of di~les.
N = 20 corresponds to 25.2° and N = 17 to 21.3° phase
steering angle.
ILAS - 13 -
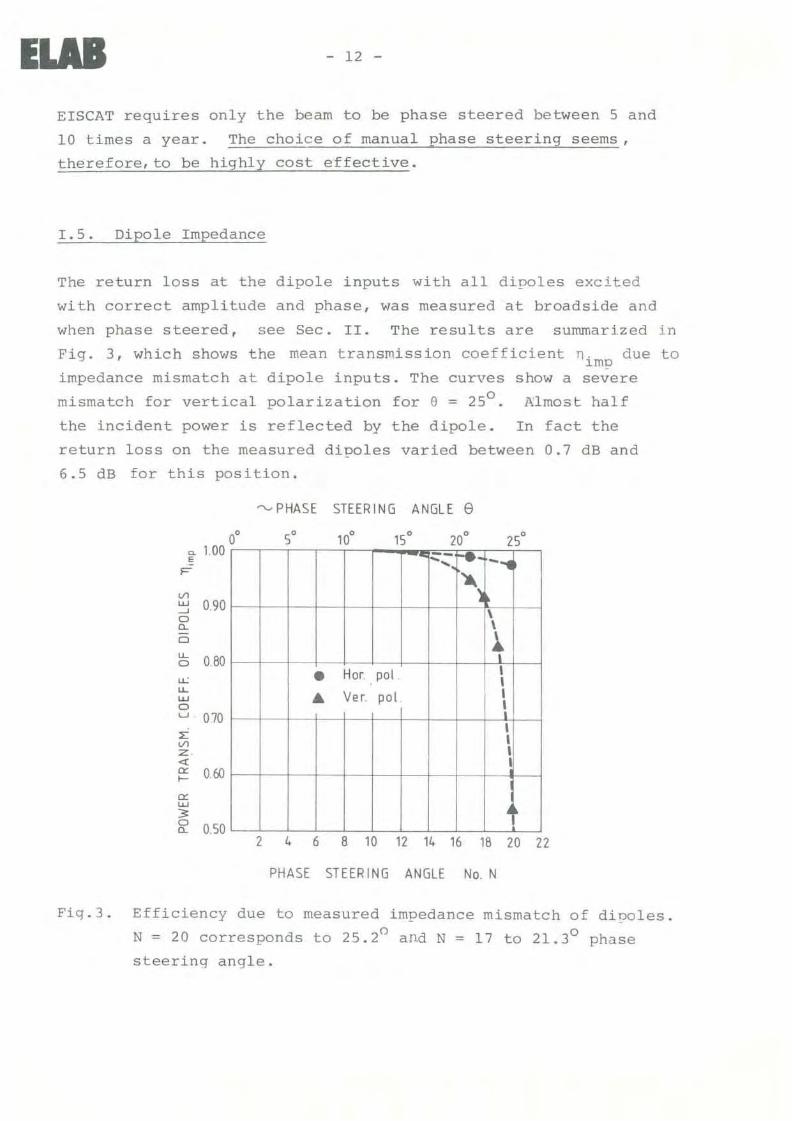
The effect, which was not foreseen by .either EISCAT or MBB,
was explained by Mr. Liesenkötter, leader of the antenna
Deparment at MBB. When the feed is phase steered to 25.2°
(N=20), the phase difference between tw:J neighbouring dipoles is
Gratlng lobe
o·
..............
Fig.4. Phase steering, main lobe and grating lobe.
20=6'7
The spacing between the dipoles is O.7A at 224 MHZ, which equals
2520 . Thus, agrating lobe occurs for 8=-90° because l07o+252o~360oI
but it does not radiate because theclement pattern of a dipole
above ground plane is zero for 8=90°. Therefore, no problems
0Unht to occur. The spacing 0.7 A was in fact chosen so tha t no
radiating grating lobes should occur for phase steering angles
up to 25°. However, the dipoles which are normal to the
arrayaxis (referred to as transverse or vertical polarization)
can excite asurface wave propagating in the direction of the
grating lobe. (The surface wave is evanescent in the di:rection
normal to the surface). It is reflected at the end of the
line feed. It does not radiate significantly in the endfire
direction. But the surface wave propagatinq back and forth along the
array makes the line feed similar to a resonator. The resonance
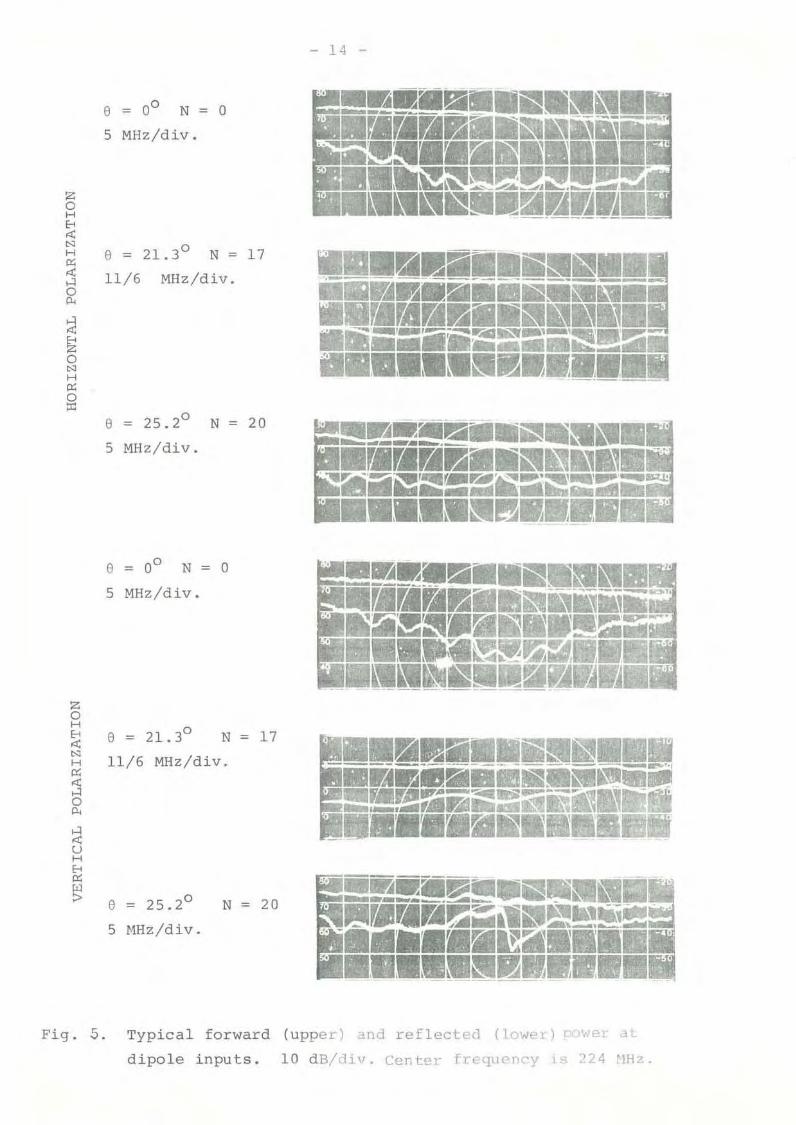
effect can be seen in the return loss curves in Fig. 5. The surface
wave is only present in very long arrays. It was not seen on
the 7 elements scale model measured by Kildal [9].
- 14 -
e = 0° N = o5 MHz/div.
zoH
"'"~ e = 21.3° N = 17'"j 11/6 MHz/div.2:i!!<o"H'"lE
e = 25.2° N = 20
5 MHz/div.lII!.Iii ~ ~'a
. ·. a I'J' ~ ~.: ~ ... · ...
III.": . . ·.. . ,. ·~ •
~ . l ~ •
e = 0° N = o5 MHz/div.
. I.'" iii! '1.1·, .1"'1:, ·
rJ a rJ··, ·
I'J' 11II..~
, ......: •
.. · .!: f • - .
~. ~... . ...a.l:J'•
ilj' t..~.•• .' ,-
., . . . Ej ~.11Il':, I IIW.:,
,-;. 1101· 'I' '.'.':.. roi PI.-:; o;:;, IQIl.~ . El
"Iii'l~ .... •liiiI ••
"",
,.;: ',!
r,'· . '.liiI ,'1l1 :I~ I~.,.,·· ..
· •••11•••1111••••------------ --------"1.......IiI ... ...rJl.....- ....IIil---- l - .__....,.&l.._.."••~.1••••••••••••••
zoH
" e = 21.3° N = 17'""H 11/6 MHz/div.
'"j2
"''"UHf;;g: °e = 25.2 N = 20
5 MHz/div.
Fig. 5. Typical forward (upper) ':lnd reflected (l ower) 1,.'''' ::\
dipole inputs. la dB/div. Center frequency :;; 224 "1Hz.

lLAI - 15 -
The effect on the antenna performance is that the dipole impe
dance ch::mges severly, :see Fig. 3. The phase steering angle must
be reduced to 21.3': Then the averaqe reflection is only 5%. The
600 Watt dummy loads in the line feed can tolerate 10%
reflection which corresponds to '=22.6°. However, the reflections
from the di poles vary much along the array for 6=22.6°, so that
the dissipation in some loads may be larger than 600 Watt. The
reason ror the variation in return 1055 alonq the array is the
coupling via T-junctions in the transmission line system.
1.6. qadio Source '~easurement.
The efficiency of the antenna wa measured by means of the radio
star Cassiopeia A. See Seco III. The results are shown in
Fig. 6. At br.oodside the antenna efficiencies are
n = 0.69
n = 0.60
for horizontal pol.
for vertical pol.
(3300 m2 )
(2900 m2 )
which gives
Q = 0.64 for circular pol., i.e. 3100 m2
This is higher than the efficiency of 0.60 which was quaranteed
by MBB. The expected efficiency was 0.66 [9}. The measurement
accuracy is about ±O.23 dB.
There is a gain discrepancy at 0.6 dB between horizontal and
vertical polarization. 0.3 dB can be explained from aperture
efficiency, blockage by diagonal struts and difference in
insertion loss of transmission line system. See Seco III.
For a phase steering angle of 21.3° the efficiency is clQ~e
to the expected efficiency. The expected efficiency reduction is
calculated in Sec. III as a function of sean angle. It isredueed
beeause of increased spillover. For larger phase steering angles
the ·~ffieiency is strongly reduced for ver:tical polarization due
to the impedanee mismatch in Fig. 3. See Fi<l. ~.
ELAB - 16 -
The maximum possible phase steering angle is 21.3 0 for yertical p:>larization
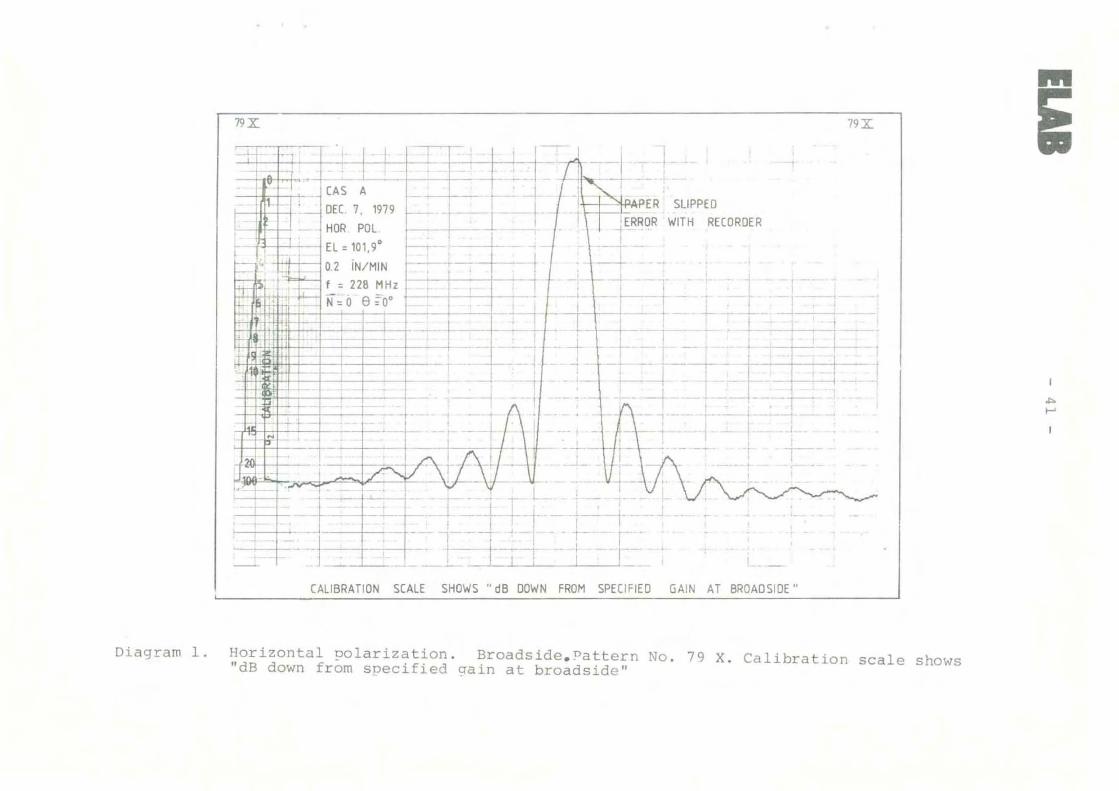
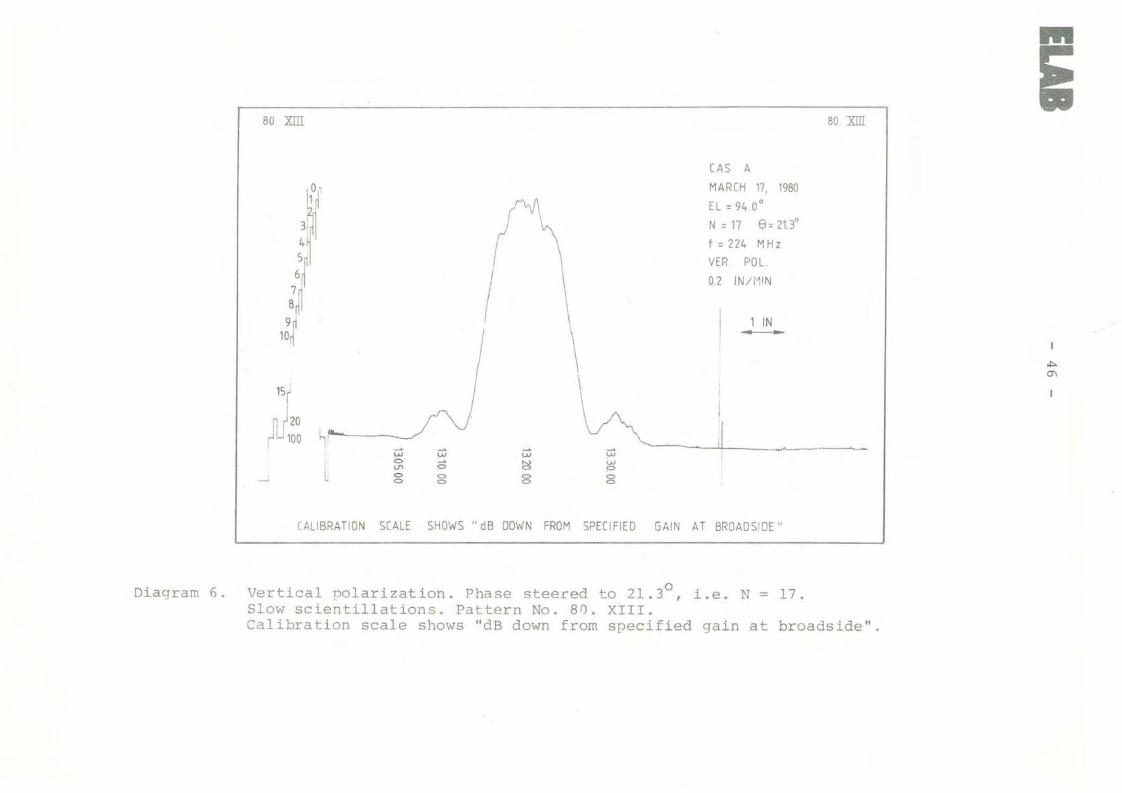
7 measured drift seans of Cas A are shown in Diagram 1-7. At
broadside the sidelobe levels are higher than ~rh:!n the beam is
phase steered. The reason is that at broadside the star drift
through the beam in the east-west plane t.nere the sidelobes are
high, due to the uniform excitation of the line feed. For e.othe drift plane makes an angle with the east-west nIane. The
angle increases as a funetion of The sidelobes are lower in
any other plane through the antenna beam, and lowest in the
north-sQuth plane due to the tapered illumination of the
reflector surface.
Truls Hansen (EISCAT) has made a computer program which detenrnnes the
position of the antenna when a g1ven radio source p3sses the bea.m, as
a function of the phase steering angle eN' the elevation offset,
and the meehanical sean plane offset. The program was used and
worked satisfactorily.
An elevation offset of the antenna of 0.920 ±0.07°
and a mechanieal sean plane offset from the north-south plane of
0.550 +0.050 west of north
The calibration seale on the drift seans of Cas A is approximately
"c:B down from an an tenna ef ficiency of 0.6 ()". See See. III. 4 .

PHASE STEERING ANGLE e
.... /[irc. pol.
---- - -.:~::----....
Hor pol ...... " ....Expected eff. Ver pol.
\\
_ ---- Expected incl. measured mismotch \
.,.Ver. pol }
\meosured toword s
f- • Hor pol. [as A
I I I I I I I ,
0°O.BO
0'70
>- 0.60wzUJ
wu- 0.50u-UJ
<{ 0.40zzUJf- 0.30z<{
0.20
0.10O 2
5°
4 6
10°
B 10
15°
12 14
20°
16 1B
25°3840
N
E3360
<{UJ2880 el::<{
2400
I-'
<{
-J
ZZUJ1920 f-z<{
1440UJ
>f-
960 wUJu-Ll..UJ
48020
PHASE STEERING ANGLE No N
Fig. 6. Exnected and measured efficiencies.
ILAB - 18 -
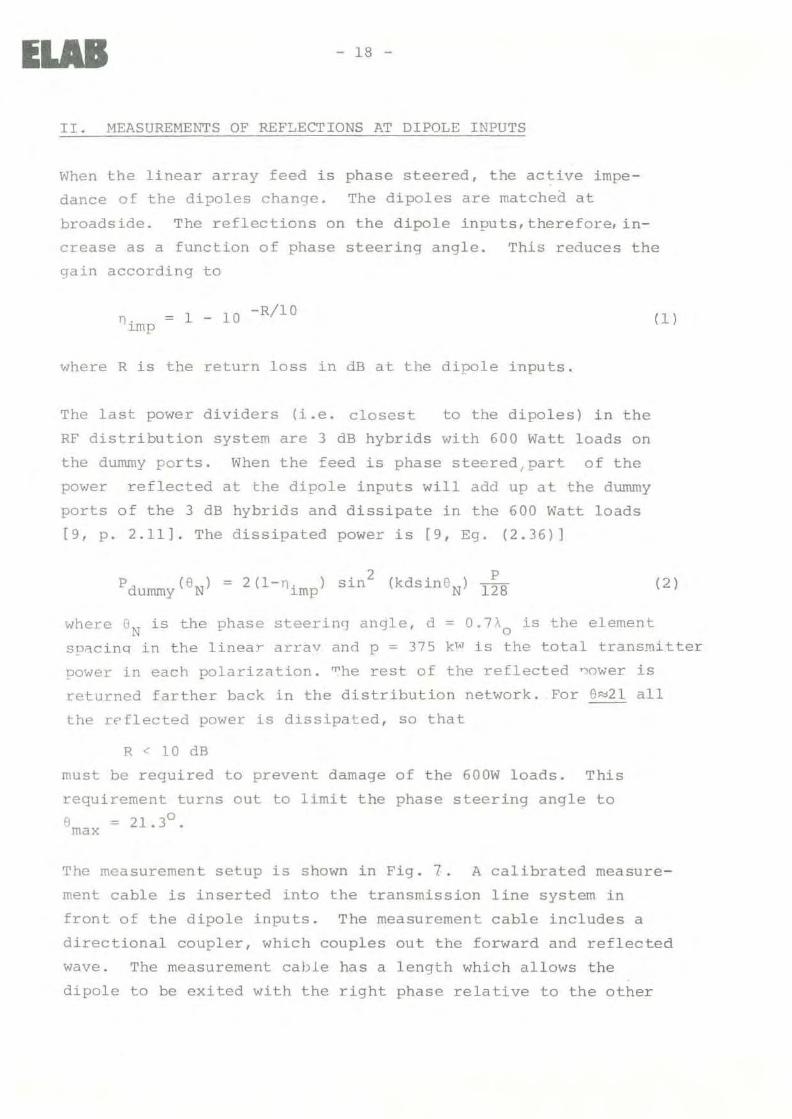
II. MEASUREMENTS OF REF~ECTIONS AT DIPOLE INPUTS
When the linear array feed is phase steered, the active impe
dance of the dipoles change. The dipoles are matched at
broadside. The reflections on the dipole inputs.therefore, in
crease as a function of phase steering angle. This reduces the
gain according to
= l _ 10 -R/lOT)imp
where R is the return loss in dB at the dipole inputs.
The last power dividers (i.e. closest to the dipoles) in the
RF distribution system are 3 dB hybrids with 600 Watt loads on
the dummy ports. When the feed is phase steered,part of the
power reflected at the dipole inputs will actd up at the dummy
ports of the 3 dB hybrids and dissipate in the 600 Watt loads
[9, p. 2.11J. The dissipated power is [9, Eg. (2.36) J
(l )
p (8 ) = 2 (l-n )dummy N imp
p
128(2 )
where eN is the phase steerin~ angle, d = 0.7AO is the element
s!Ji'\cinq in the linear arravand p = 375 kl.1 is the total transmitter
power in each polarizötion. ~he rest of the reflected ryower is
returned farther back in the distribution network. For a~2l all
the ref1ected power is dissipated, so that
R < 10 dB
must be required to prevent damage of the 600W loads. This
requirement turns out to limit the phase steering angle too
f)max = 21.3 .
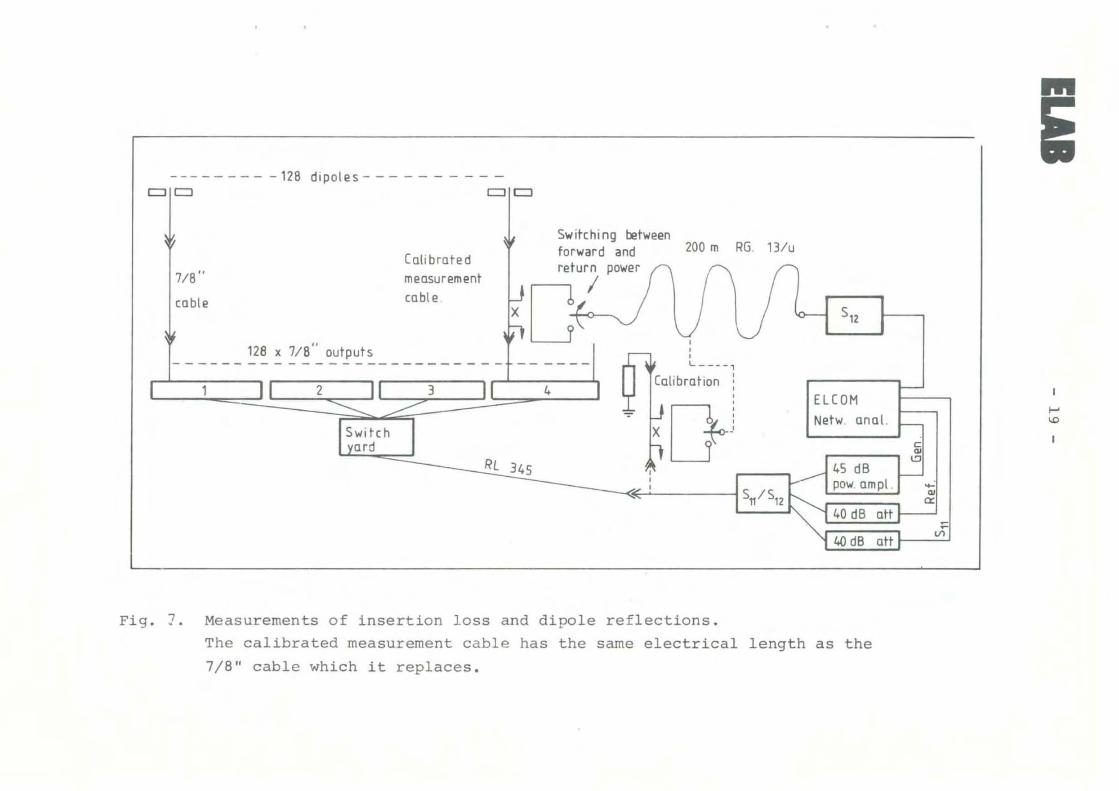
The measurement setup is shown in Fig. 7. A calibrated measure
ment cable is inserted into the transmission line system in
front of the dipole inputs. The measurement cable includes a
directiona1 coupier, which coup1es out the forward and reflected
wave. The measurement cable has a length which allows the
dipole to be exited with the right phase relative to the other
i---------128 dipoles----------
CJICJ CJICJ
200 m RG 13/u
/ "--)512
, L-,,L ____ ,
Calibrahon,,,,
~ "[}i IELCOMNetw anal. t-----l I I I--'
'"c
I i~4S dB
S /5 ~ I pow ampl.l ...:11 12
OJ, a:
40 dB att
40 dB att i.Jl
4
RL 345
3
Callbratedmeasurementcable
2
Switchard
128 x 7/8" outputs
7/8"
cable
Fig. 7. Measurernents of insertion loss and dipole reflections.
The calibrated measurement cable has the same electrical length as the
7/8" cable which it replaces.
ELAB - 20 -
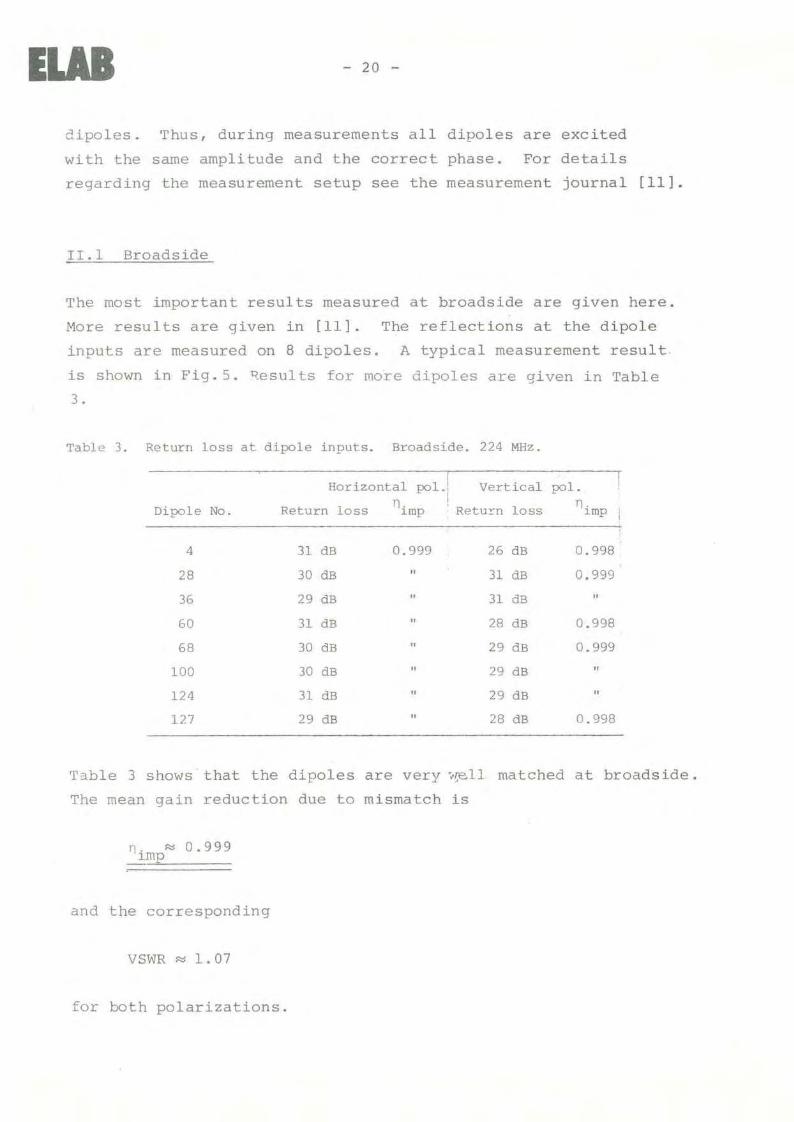
cipoles. Thus, during measurements all dipoles are excited
with the same amplitude and the correct phase. For details
regarding the measurement setup see the measurement journal [11].
11.1 Broadside
The most important results measured at broads ide are given here.
More results are given in [11]. The reflections at the dipole
inputs are measured on 8 dipoles. A typical measurement result
is shown in Fig.5. qesults for more dipoles are given in Table
3.
Table 3. Return loss at dipole inputs. Broadside. 224 MHz.
26 dB 0.998
31 dB 0.999
31 dB "
28 dB 0.998
29 dB 0.999
29 dB "29 dB "
28 dB 0.99B
Vertical
"
"
"
"
"
"
0.99931 dB
30 dB
29 dB
31 dB
30 dB
30 dB
31 dB
29 dB
Horizontal POl.!n I
Return loss imp Retu~n lossDipole No.
4
28
36
60
68
100
124
127
Table 3 shows that the dipoles are very '/!;ell matched at broads ide .
The mean gain reduction due to mismatch is
nimp~ 0.999
and the corresponding
VSWR ~ 1.07
for both polarizations.
ELAB - 21 -
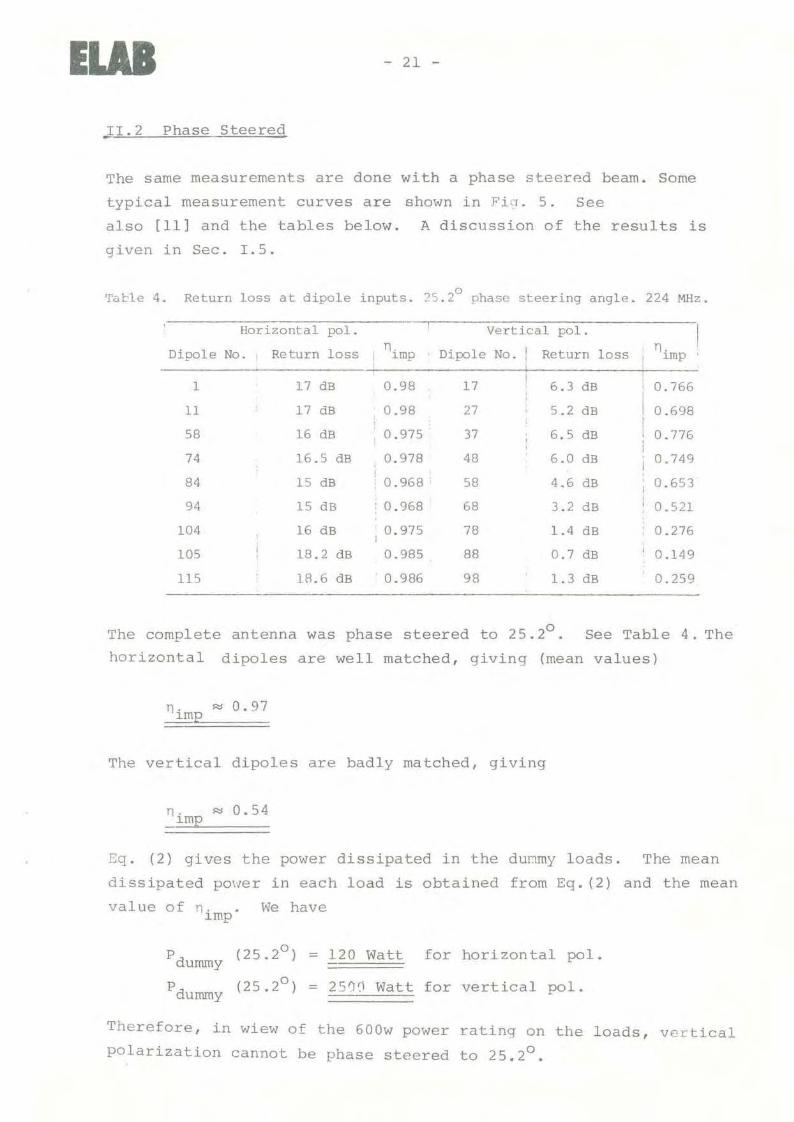
JI.2 Phase Steered
The same measurements are done with a phase steerp.d beam. Same
typical measurement curves are shown in FLI. 5. See
alsa [11] and the tables below. A discussion of the results is
given in See. 1.5.
Tarle 4. Return loss at dipole inputs. ?5.2° phasc steering angle. 224 MHz.
Horizontal pol. Vertical pol.
DifX:lle No. Return loss nimp Dipole No. I Return loss n.,rop
l 17 dB 0.98 17 6.3 dB 0.766
11 17 dB 0.9B 27 5.2 dB 0.698
58 16 dB 0.975 37 6.5 dB 0.776
7' 16.5 dB 0.978 '8 6.0 dB 0.749
8' 15 dB 0.968 58 '.6 dB 0.653
9' 15 dB 0.968 68 3.2 dB i 0.521
lO' 16 dB 0.975 78 l.' dB 0.276
105 18.2 dB 0.985 88 0.7 dB 0.149
115 18.6 dB 0.986 98 1.3 dB 0.259
The complete antenna was phase steered to 25.2°. See Table 4. The
horizontal dipoles are weIL matched, glvtng (mean values)
nimp S'I:l 0.97
The vertical dipoles are badly matched, glving
n. S'I:l 0.54l.mp
Cq. (2) g1 ves the power dissipated in the dunmy loads. The mean
dissipated po\"ler in each load is obtained from Eg. (2) and the mean
va1ue of nimp ' We have
P (25.2°) = 120 Watt for horizonta1 pol.durruny
p (25.2°) = 251)~\ Watt for vertical pol.durruny
Therefore, in wiew of the 600w power
p01arizatian cannat be phase steered
ratinq onoto 25.2 .
the 10ads, vertica1

ELAB - 22 -
Table 5. Return loss at dipole inputs. 21.3° phase steering angle. 224 MHz.
Horizontal pol. Vertical pol.
Dipole No. Return loss n imp 'Return loss nimp
l 14.8 dB 0.967 16.0 dB 0.975
17 25.8 dB 0.997 12.2 dB 0.940
36 24.6 dB 0.997 14.1 dB 0.961
51 25.0 dB 0.997 13.4 dB 0.954
70 23.4 dB 0.995 14.4 dB 0.964
93 24.6 dB 0.997 12.5 dB 0.944
107 26.2 dB 0.99B 12.4 dB 0.943
119 21.4 dB 0.993 12.8 dB 0.948
com~lete ?hase steered O Table 5 givesThe antenna was to 21. 3 .
as befare the following mean values
and
nimp ~ 0.99
nimp ~ 0.95
for horizontal pol.
for vertical pol.
Pdummy
(21.3°) ~ fiO Watt for horizontal pol.
Pdummy (21.3°) ~ 300 Watt for vertical pol.
Thus, the antenna shou!d work satisfactorily at 224 MHz with 21.3°
phase steering angle.
ELAB - 23 -
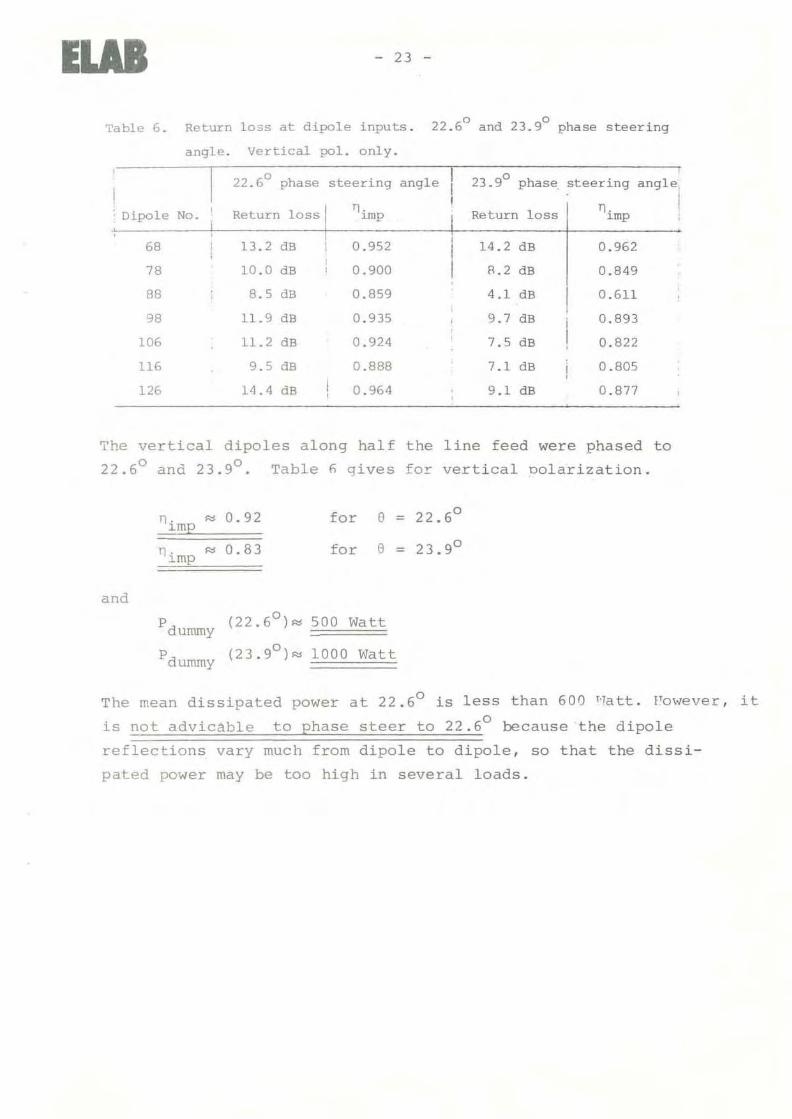
o o'l'able 6. Return loss at dipole inputs. 22.6 and 23.9 phase steering
angle. Vertical pol. only.
o angle o22.6 phase steering 23.9 phase steering angle
Dipole No. Return loss nimp Return loss nimpI
68 13.2 dB 0.952 14.2 dB 0.962
78 10.0 dB 0.900 R.2 dB 0.849
88 8.5 d8 0.859 4.1 dB 0.611
98 11.9 d8 0.935 9.7 dB 0.893
106 11.2 dB 0.924 7.5 dB 0.822
116 9.5 dB 0.888 7.1 dB 0.805
126 14.4 dB 0.964 9.1 dB 0.877
?he vertical dipoles along half the line fe ed were phased to
22.6° and 23.9°. Table n gives for vertical oolarization.
nimp ~ 0.92 for 8 = 22.6°
nimp ~ 0.83 for e = 23.9°
and
Pdummy(22.6o)~ 500 Watt
Pdumrny(23. 90)~ 1000 Watt
The mean dissipated power at 22.6° is less than 600 T·latt. I'mvever, it
1s not advicable to phase steer to 22.6° because the dipole
reflections vary much from dipole to dipole, so that the diss i-
pated power may be too high in several loads.
ELAB - 24 -
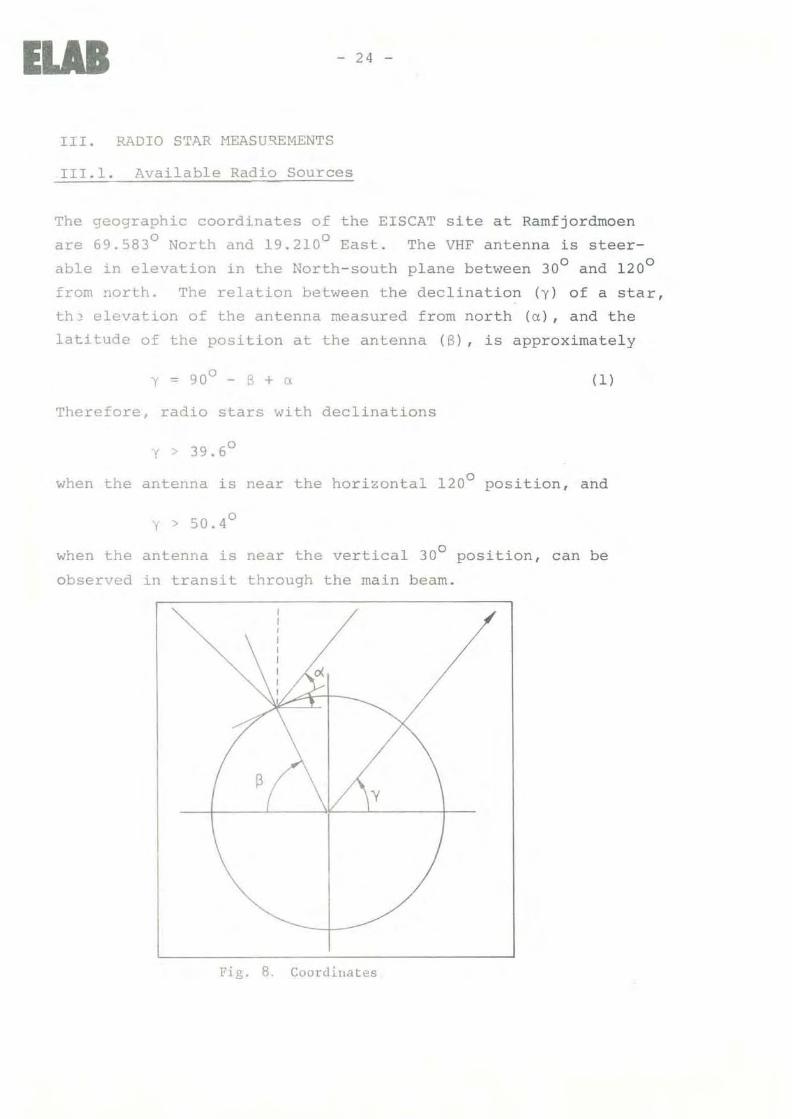
III. RADIO STAR MEASU~EMENTS
111.1. Available Radio Sources
The geographic coordinates of the EISCAT site at Ramfjordmoen
are 69.583° Narth and 19.210° East. The VHF antenna is steer
able in elevation in the North-south plane between 300 and 120 0
from north. The relation between the declination (y) of a star,
th~ elevation of the antenna measured from north (a), and the
latitude of the position at the antenna (B), is approximately
Therefore, radio stars with declinations
(1)
{
when the antenna is near the horizontal 1200 position, and
o( > 50.4
when the antenna is near the vertical 30° position, can be
observed in transit through the main beam.
Fi g. 8. CoordLllates
EUB - 25 -
If the beam is phase steered in the east-west plane the rela
tions are more complicated. If the sean angle is Sn measured
from broadside, it is possible to show that the declination (y)
in the direction of the main beam becomes
( 2 )sin y = eos en eos (a-B)
e = 25.2° the lowest declinationn
iswhich is possible to reach
For the maximum sean angle
y = 35.2°
Y = 44.2°
for et = 1200
for et = 30°
Thus, only sources vJith a declination y > 35.2° can be observed
with the VHF antenna. Only sources with y > 44.2° can be observed
twice a day.
Phil Williams [5] has seleeted 31 sources from the Revised 3e
catalogue which satisfy y > 34.6°, have a flux density larger
than 20 Jy, have a "straight tl spectrum (except Cyg A) I and have
an angular structure less than 0.13°. The strongest of these
sources are listed in Table ~7:. together with the most important
characteristies.
The transit speed at equator is 4 minjo. For a'source with deeli
nation y it beeomes
t = 4
eos y(3 )

ELAB - 215 -
(4 )
I SOURCE
Equivalent Elevation'Transit Flux noise temp. measured Appr. ioeal timespeed density for ~eff=3200 m' from north Early Dec .1979
I eAS A 7.7 min/o 8730 Jy 10122 K 38.30 06.16
CAS A " " " " 100.90 18.18
eYG A 5.3 min/o 7600 Jy 8820 K 118. gO 14.56
I 3e 10 9.1 min/o 127.5 Jy 148 K 84.4° 19.20
I 3e 10 " " " " 43.7° 07.20,I 3e 390.3 22.5 IDin/o 39.8 Jy 46 K 79.8° 13.35I
I3e 390.3 " " " " 59.30 01.40
Table 7 .. Radio SQurces. Reference of the fluxdensities is [3]. For Cas A see See. 1II.2
111.2. Flux Density of CAS A
The calibration of the gain depends on the accuracy by which the
flux density of the available sources is known. The strongest and
therefore most convenient source for gain calibrations is Cas A.
The spectrum of Cas A has been studied by rna ny au thors
recently, and is, therefore, quite accurately known. The flux
density of Cas A n years after the flux density was FO' as a
function of the frequency f, is
F = Fo(-fo)k [l + B(f)]n
where k is called the spectral index, and B(f) is the decay rate.-26 _2 _I
From [SJ we have (Jy = Jansky = la Wm Hz lat epxh to = 1965.0
FO = 318'1 ! 25 LTy, at f o = 1 GHz
k = -0.792 ± 0.006
B(f)= -0.0097± 0.0005 + (0.00126 ± 0.00023)ln(f)
where f is the frequency in G,:z ~
ELAB - 27 -
The accuracy at 224 MHz in January 1980 becomes about.l!... from
the above uncertainties in Fa , k and B(f).
Thus, at 224 MHz in January 1980 we have
F = 8730 + 260 Jy (Le. ± 0.13 dB)
This is quite different from for instance f31 which claims a
different spectral index k = -0.765, giving F = 8180 Jy at
224 MHz. They differ by nearly 0.3 dB. However, [8] is a
more recent publication and should therefore be more correct.
ESA (the European Space Agency) alsa uses [B] as a reference
for their gain calibrations [6]
The correction of the flux density for angular extension
and atmospheric attenuation is negligible.
ELAB
111.3. --teasurement method
- 28 -
The efficiency of the antenna is found by measuring the receiver
power when the sources is passing the beam. Here is referred to
the received neise power P as an equivalent neise temperature T
defined by
p = kTBG (l)
where k is Bolzmann's constant, B is the bandwidth, and G is the
gain of the receiver system. In this way T is referred to the
input of the preamplifier.
When the antenna is painting towards the background sky, the
different neise contributions are
where Dt
is the efficiency of the transmission line system.
For 0.5 dB loss we have nt
= 0.9. nsp is the spillover effi
ciency, nsp
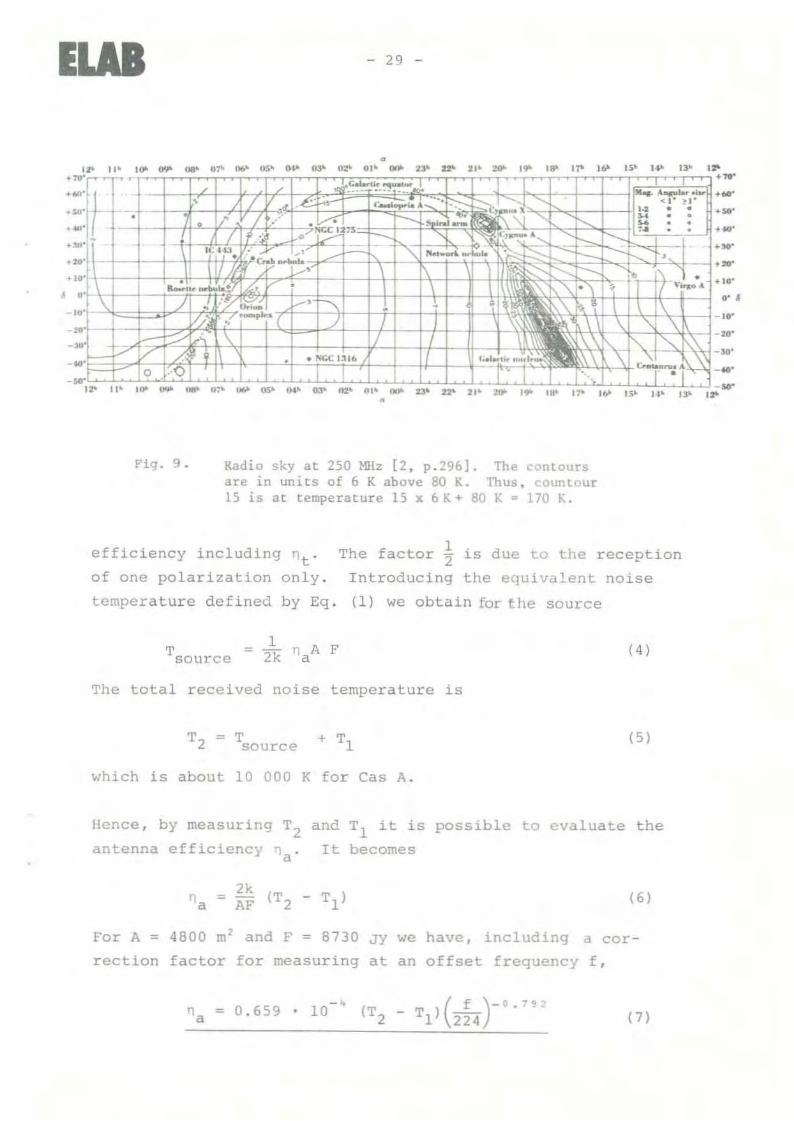
~ 0.92. Tsky
is the neise temperature of the back
ground sky, given approximately from Fig. 9. Including a
spectral index of approximately -0.5 [2J, we obtain 190 ± 10 K.
Ta is the ambient temperature (Ta R:: 270 K)" and T is therecnoise temperature of the receiver. (Trec ~ 160K). Thus. the
expected value of T1 is
When the antenna is painting towards the source, the received
noise increases by
p (3)
where A is the aperture area of the antenn~ and n a is the antenn a
ELAB
Fig. 9.
- 29 -
•Ol~ or'"
•
Radio skyat 250 ~~z [2, p.296]. The contaursare in units of 6 K above 80 K. Thus, countour15 is at temperature 15 x 6 K+ 80 K • 170 K.
". ................+ lO'.. ,-10'
efficiency including nt
"
of one polarization only.
temperature defined by Eq.
The factar ~ is due to the reception
Introducing the equivalent noise
(1) we obtain for the source
Tsource ( 4 )
The total received noise temperature is
(5 )
which is about la 000 K for Cas A.
Hence. by measuring T2
antenna efficiency na "
and T1 it is p05sible to evaluate the
It becomes
(6)
For A = 4800 m2 and F = 8730 JY we have, including a cor
reetian factar for measuring at an offset frequency f,
(7)

ELAB
111.4. Calibration
- 30 -
The accuracy by which the antenna efficiency can be calculated
depends on the accuracy of the flux density, which for Cas A was
± Q.13 dB, and the accuracy by which T2
and T1
can be measured.
The calibration setup used in the measurements is shown in
Fig. 10. A logaritmic receiver was used.
lontenna IS connected hete l
(l----®- (obI es Transistor Spectrum , - t
0-100dB ond l- preamp - Analyser - recorderconnectors recel .... er Log rt!CfIWl
Nolse PrecisiondlOde ottenuator, dB
excess noise
Fig.lO. Ca libration setup
The total noise temperature measured in the system in :r:'ig. 10
as a functior. of the attenuation a [dD] of the precision
attenuator is
TcalCa) = 10
x-a-O.410
TO + (l-la (8)
where TO = 290 K, and Ta = 270 K for outdoor environments in
winter. x{dB) is the excess noise of the noise diade used.
The number 0.4 is the insertian loss of the attenuator.

lUSThe measurement of T2alan the attenuator.
- 31 -
and Tl corresponds
We have
to tWQ readings a 2 and
[
X-0.4
= 10 10 TO (9 )
Usina a calibrated noise diade with x = 15.6 dB excess noise, theresult is
The antenna efficiency in dB becomes therefore from Eg. (7)
10 log "a ~ [-2.11 - a 2- 7.92 lao (~)] dB (10)
Eq(lO) is only valid if a Z-a 1 »20. In the measurements on Cas A
a reading al corresponding to the background
noise level Tl cannat be made because
In See. 11.3 is
Eg. (8) Tca1
(=)
is only valid if
found that Tl= T + T =a rec
~ 200 K
270 K ++ T rec
'I rec'
near Cas A and from
In this case Eg. (la)
which gives
The guaranteed performance (guaranteed by manufacturer) of the
antenna is Äeff = 2900 m2 , corresponding to a Z = 0.08 dB. Thus,
any reading of the received noige of Cas A wnICn satisf1es
a 2 < 0.08 dB ~ O dB is satisfactory.
ELAB - 32 -
Therefore, for drift patterns obtained by Cas A, the ca libration
scale (a) is directly giving the beam pattern in
dB down from specified gain when a < 20 dB.
The expected performance is Aeff = 3250 m2 , corresponding to
a 2 = -0.42 dB, for circular polarization [9].
The frequency correction on the flux desity of Cas A when the
measurements are done on another frequency than 224 MHz is very
small. See Eg. (lO). When the measurements are made at 230 MHz,
the correction is -0.09 dB.
The disadvantage with this setup is that calibrations must be
dane befare the transit of the star, so that the calibrations
are very sensitive to gain instabilities in the receiver. That
was a problem with the logaritmic receiver in the spectrum
analyzer which had a periodic (12 minutesJ variation of ±0.4 dB
for the measurements done in December 1979. In February and March
1980 it was possible to iocrease the long time stability to ±O.l dB.
Thus, the total measurement accuracy was (instability + accuracy
of flux density of Cas AJ
in Dec. 1979
in Febr./March 1980
, 0.53 dB
± 0.23 dB
The accuracy is also reduced by scintillations of received
noise signal.

lURIII.5.Resu!t
- 33 -
18 drift seans of radio sources were measured in Dec. 1979, and
20 in February /March 1980. They are all found in the meaSllrement
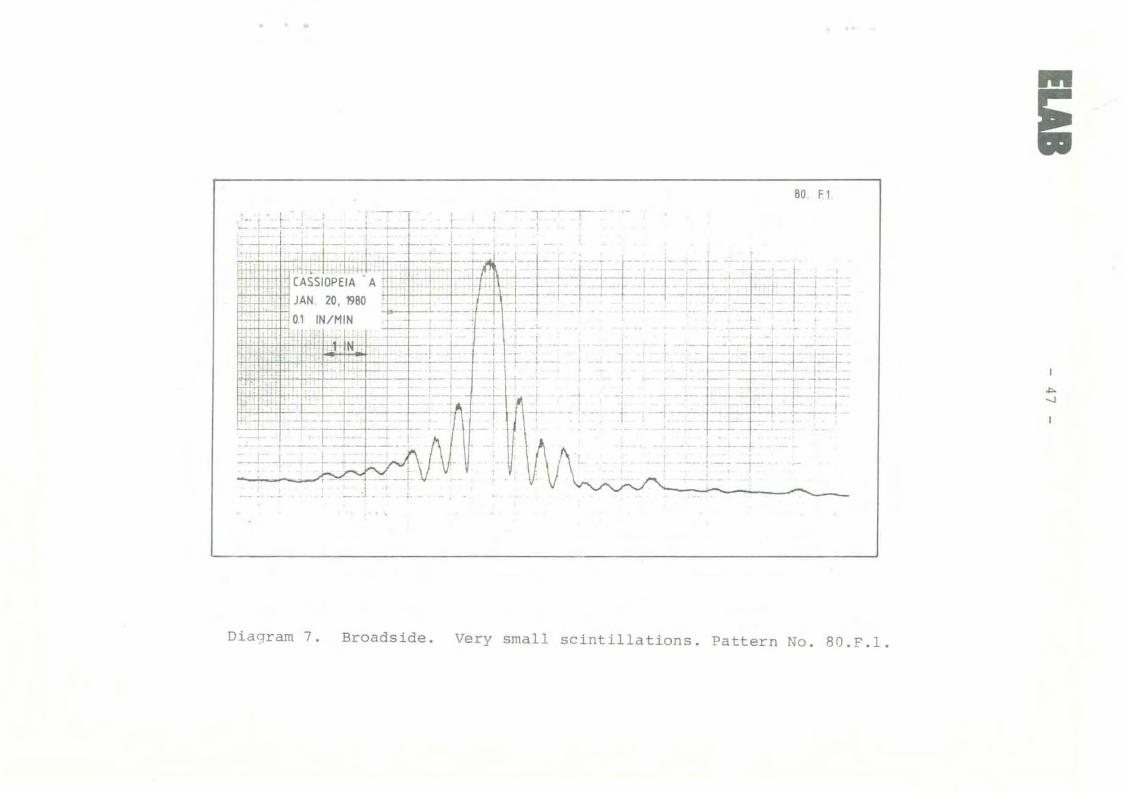
journal [10]. Six of them are included in this report. Diagram
No.? w.as measured by Kristen Folkestad and Truls Hansen in
January 1980. It is· included because the scintillations are
small. The scintillations tur ned out to be a problem in most of
the drift seans. They varied from day to day, causing the
received noise level from Cas A to oscillate with up to ± 3 dB
with periodes less the1 l secand (rapid scintillations) and up
to 20 secands (slow scintillations) .
Broadside measurements:
The elevation offset of the antenna was found by moving the
antenna up and down when the star drifted through the beam. The
result is shown in Table 8.
Table 8. Elevation offset
Patt"No. Date Star Sec.or El.of Ant.pos Elev. offset:starpol. for star max.
79. II 3.Dec. Cas A 3-4 38.3° 39.30 ±O.lo l.Oo± 0.1°
79_III 3_Dec_ Cas A 1-2 100.9° 101.8° 0.90
79.IX 7.Dec_ Cyg A 1-2 118.9° 119.75° 0.85°
79.VI S_Dec Cas A too much scintillation
80.VIII 5. March Cas A too much scintillation
Concl'..lsion: elevation offset ..... 0.920 ± 0.07 0
The time of trans i t 'C.real turned ou t to be .di f ferent
from the computed time of transit t comp The difference was due
to a deviation of the mechanical tilt plane of the antenna fro~ the
north-south plane. However, the line of intersect ian of the hm
planes seems to caineide with the zenit direction. 'rhe deviation
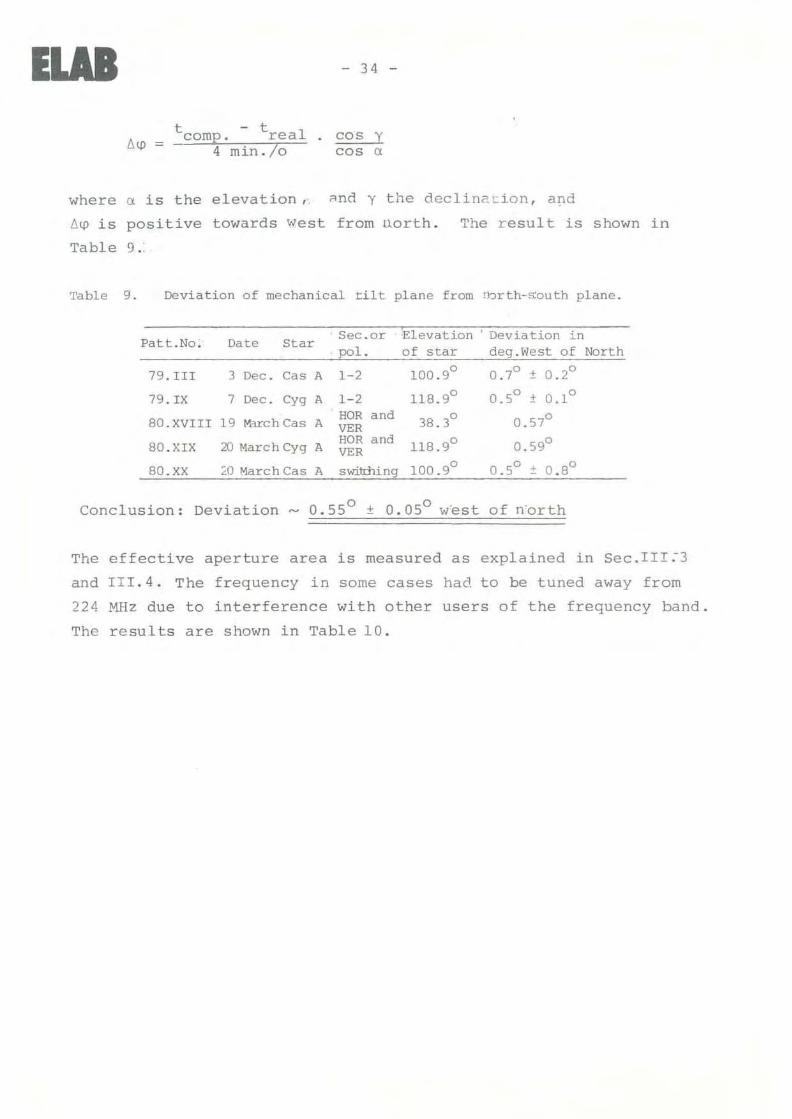
6~ is calculated as
lUR - 34 -
t - tcomp. real4 min.lo
eos yeos ex
where ex is the elevation, ~nd y the declin2cion, and
6~ is positive towards west from uorth.
Table 9 ..
The result is shown in
Table 9. Deviation of mechanical tilt plane from Ibrth-~outh plane.
See.or 'Elevation Deviation inPatt.No. Date Star
pol. of deg.west of Northstar
79.III 3 Dec. Cas A 1-2 100.9° 0.70 ± 0.20
79. IX 7 Dec. Cyg A 1-2 118.9° 0.50 ± 0.10
BO.XVIII 19 Much Cas AHOR and 38.3° 0.57°VER
BO,XIX 20 March Cyg AHOR and 118. gO 0.59°VER
BO.xx ~O March Cas A switI::hing 100.9° 0.50
± 0.80
Conclusion: Deviation - 0.55 0 + 0.05° w'est of ,rorth
The effective aperture area is measured as explained in Sec.III.-3
and III. 4. The frequency in some cases hac1. to be tuned away from
224 MHz due to interference with other users of the frequency band.
The resul ts are shown in Table la.
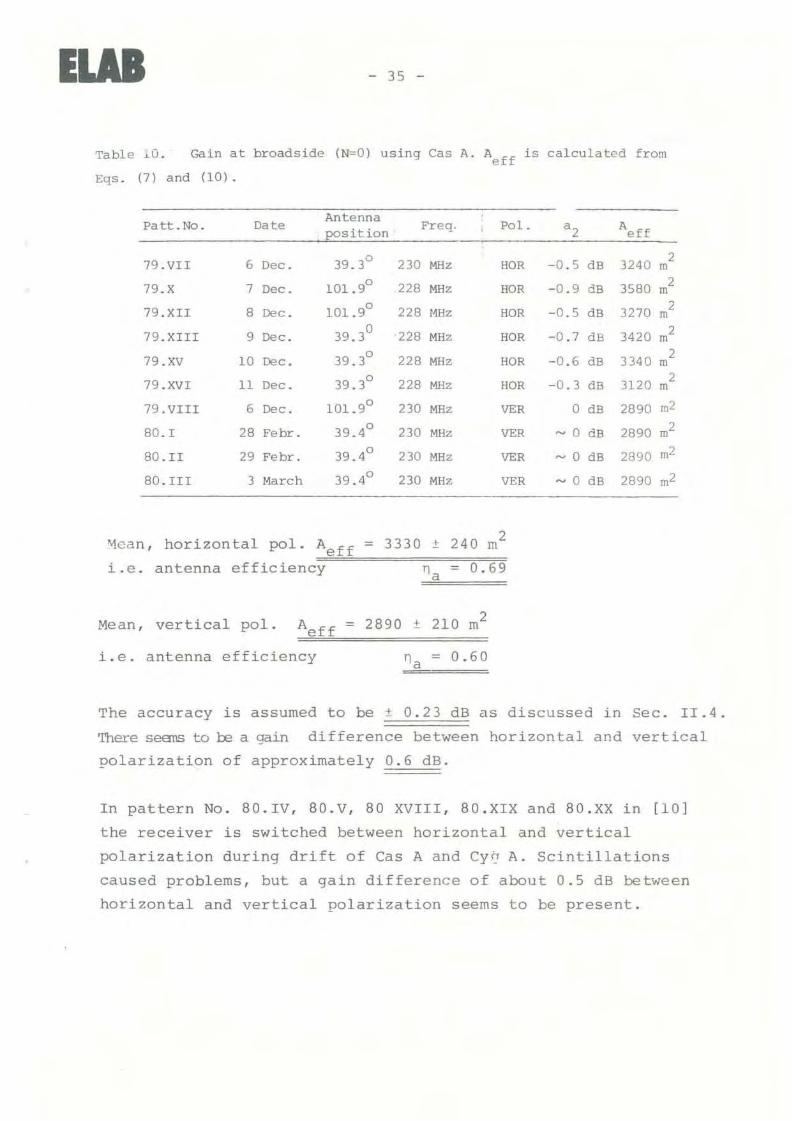
lUS - 35 -
Table LO. Gain at broadside (N=Q) using Cas A. Aeff is calculated from
Eqs. (7 ) and (lQ) .
DateAntenna
Pol.Patt.No.position
Freq. a 2 Aeff
79.VII 6 Dec. 39.3° 23Q MHz HOR -Q.5 dB 32402
m
79.x 7 Dec. 101.9° 228 MHz HOR -0.9 dB 358Q 2m
79.XII 8 Dec. 101.9° 228 J.1Hz HOR -0.5 dB 3270 2m
79.XIII 9 Dec. 39.30228 MHz HOR -0.7 dB 3420 m2
79.xv lQ Dec. 39.3° 228 MHz HOR -Q.6 dB 33402
m
79. XVI 11 Dec. 39.3° 228 MHz HOR -0.3 dB 3120 2m
79.VIII 6 Dec. 101.9° 23Q MRz VER Q dB 2890 m2
aD.! 28 Febr. 39.4° 23Q MHz VER - Q dB 2890 m2
80. II 29 Febr. 39.4° 23Q MRz VER -Q dB 2890 m2
80. III 3 March 39.4 0 23Q MHz VER - Q dB 2890 m2
~can, horizontal pol. Aeff = 3330 ! 240 m2
i . e. an tenna ef f ic ienc.Öy~"'~-~~=n=a=C:_:=':oiF."6"9
Mean, vertical pol. Aeff = 2890 ± 210 m2
i.e. antenna efficiency " = 0.60"a
The accuracy is assumed to be ± 0.23 dB as discussed in Seco 11.4.
'I'here seans to re a gam difference between horizontal and vertical
polarization of approximately 0.6 dB.
In pattern No. aD. IV, BO.V, BO XVIII, BO.XIX and BO.xx in [10]
the receiver is switched between horizontal and vertical
polarization during drift of Cas A and Cy~ A. Scintillations
caused problems, but a gain difference of about 0.5 dB between
horizontal and vertical polarization seems to be present.
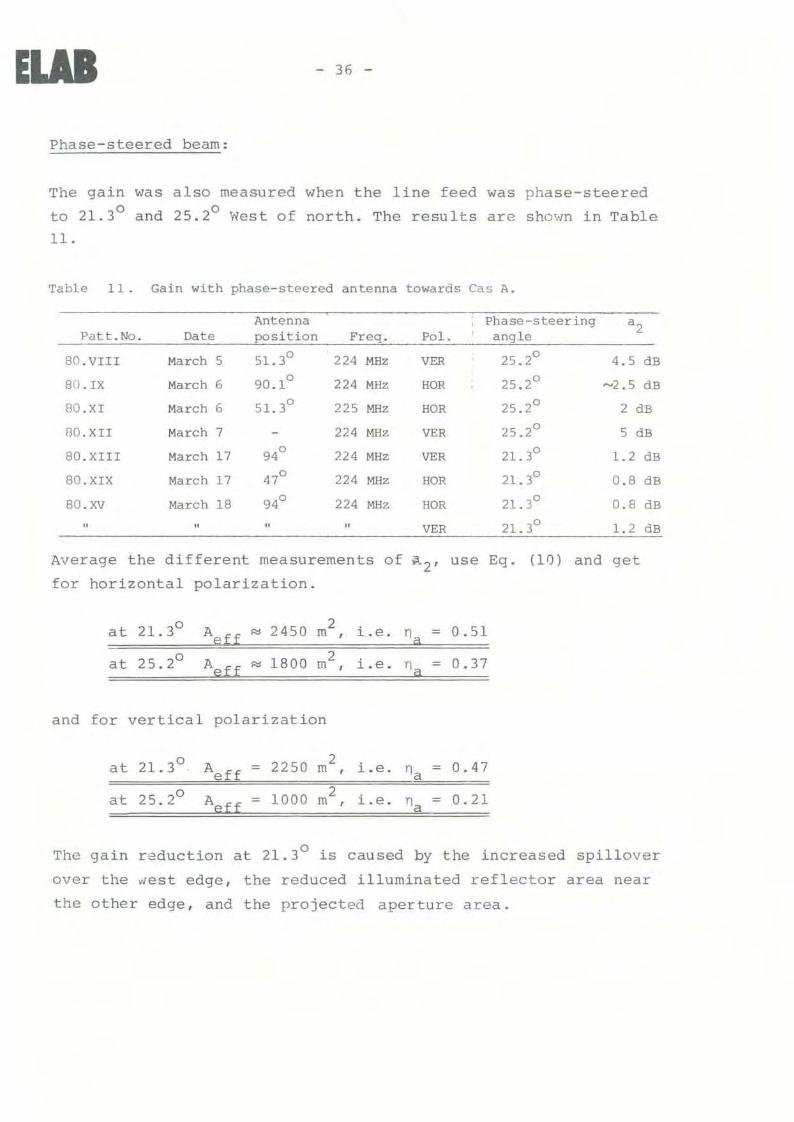
ELABPhase-steered beam:
- 36 -
The gain was alsa measured when the line feed was phase-steered
to 21.3° and 25.2° West of north. The results are shown in Table
11.
Table 11 . Gain with phase-steered an tenna towards Cas A.
Antenna Phase-steering "2Patt. No. Date position Freq. Pol. angle
BO. VIII March 5 51.30 224 MHz VER 25.2° 4.5 dB
BO.IX March 6 90.10 224 MHz HOR 25.2° ""2.5 dB
aO.XI March 6 51. 30 225 MHz HOR 25.2° 2 dB
aO.XII March 7 224 MHz VER 25.2° 5 dB
80. XIII March 17 94° 224 MHz VER 21.3° 1.2 dB
BO. XIX March 17 47° 224 MHz HOR 21.30 O.B dB
80. XV March lB 94° 224 MHz HOR 21.3° O.B dB,. " .. VER 21.3° 1.2 dB
Average the different measurements of ~'2' use Eg. (10) and get
for horizontal polarization.
at 21. 30 A 2450 2 Le. 0.51eff '" ffi , na =
at 25.20 Aeff 1800 2 Le. 0.37'" ffi , na =
and for vertical polarization
at 21.3 0A 2250
2 Le. 0.47= ffi , na =eff
at 25.20A 1000 2 Le. 0.21= ffi , na =eft
The gain reduction at 21.3° is caused by the increased spillover
over the west edge, the reduced illuminated reflector area near
the other edge, and the projected aperture area.
ELAB - 37 -
The reason for the ga10 difference may be explained as follows.
The aperture efficiency (5pillover included) for horizonta! nolari
zation is 0.1 dB higher than for vertical polari7.ation [9, p. 6.22].
The insertion loss of the transmission line system is 0.04 dB
larger for vertical pol. [12]. And theblockage by the diagonal
struts in the aperture is larger for vertical polarization. The
width of the struts is 30 cm or 0.22 A. The total blockage area
of 8 struts over half the aperture width is then
Ab = 8 x 0.30 x 202
m
For a strut width of 0.22 A the induced field ra tia is for
vertical polarization, i.e. the polarization paraliei with the
struts, equal to about 2.3, whereas it for horizontal polarization
is on1y 0.8 [13]. The blockage efficiency becomes
for horisontal pol. nb = ( l 48·0.8)2= 0.98, Le. -0.07 d84800
for vertical pol. nb = (l 48.2.5)2= o. QS, Le. -0.22 dB4800
Thus a difference of 0.15 dB
The sum of all three teoretical contributions give 0.3 dB gain
difference. The measured difference is about 0.6 dB. This
discrepancy may be due to the measurement accuracy or to the
accuracy of the computations of the aperture efficiency.
ELAB - 38 -
The spillover efficiency becarnes
n sp= l - tana
where L = 120 ffi is the length of the line feed, and Fm = 30 ro
is the mean distance from the line feed to the reflector
surface. The illuminated reflector area is reduced by the
SaQ€ amount, so that
The projected aperture area cause a reduction in efficiency
= cose
Thus,
for e = 25.2°
If we multiply the measured aperture efficiencies at broadside
with 0.76 we get quite exactly the corresponding apertureoefficiencies at 21.3. Thus, the gain reduction is as expected
oat 21.3 .
At 25.2° the reduction in antenna efficiency is mueh larger than
0.70. That is due to mismatch of the dipole impedances.
See Seco 1.5 and 11.2.
ELAB
References
- 39 -
[l] A.J. Freiby. P.D. Batelaan, and D.A. Ba".h'.er,
"Radio SQurce gain standards for large 'per:'ure antenna
calibrations", Paper at IEEE 1978 An.::E' mas and Propagation
International Symposium, Proceedir.ss
(2] J.D. Kraus, Radio Astronomy, new York: McGraw-Hill.
(3J K. I. Kellermann and I. I. K Pauliny-Toth, "The
radio sources in the revised 3e catalogue",
physical Journal, vol. 157, July 1969.
spectra of
The Astro-
(4] Per-Simon Kildal, "Discrete phase steering by permuting
precut phase cables", EISCAT Technical Nate 78/6, October
1978.
r5 J Phil ~'lilliams, "Observations of standard radio sources at
224 MHz using the VHF telescope at Troms<;6", Private
communications to Tor Hagfors.
[6] "G/T measurements of INTELSAT standard earth stations",
ESA Document, October 1979.
[7] R.M. Price, "Radiometer Fundamentals", in Astrophysics
Radio telescopes, M.L.Meeks, Ed. New York: Academic, 1976.
[8] W.A.Dent, H.D.Aller and E.T.OIsen, "The evolution of the
radio spectrum of Cassiopeia A", The Astrophysical Journal,
Vol. 188, Febr. 1974, Lll - L13.
[9] Per-Simon Kildal, "Feeder elements for the EISCAT VHF parabolic
cylinder antenna" , EISCAT Technical Note 78/8, Detober 1978.
ELAB - 40 -
[la] Per-Simon Kildal , "Gain measurements using radio stars ~I
Measurement journal, EISCAT, Troms~, Norway.
[11] Per-Simon Kildal , "Additionai RF-tests: Reflection measurements",
Measurement journal, EISCAT, Troms~, Norway.
[12] G.Schroer, "RF-acceptance tests" Test journal, EISCAT,
Trorns~, Norway.
[13] W.V.T. Rusch, "Forward scattering from cylinders of
triangular cross section", IEEE Trans. Ant. Propagat.,
Vol AP-26, No.6, Nov. 1978, pp. 849-850.
79X
t:.t~, ~ t1 l --.- '
CAS A' - 1DEC 7, 1979 ~,-
HOR POL ~
;S" EL =101,9' I..'. 02 iN/MIN _r
II H:I " '--=228 MHz r ...", N=o e = t _.-=0' -.. ..
+
\ I !,,,PER SLlPPEDERRDR WITH RECORDER
..I
---t t
79X i
,'15 INI ~-l-
I')OO-"'I~
l -1- ...rI~j ,~-
T 7 t -
.1....-L
J:>f-'
Diagram l.
CALlBRATlON SCALE SHOWS" dB DOWN FROM SPECIFlED GAIN AT BROADSIDE "
Horizontal oolarization. Broadside.Dattern No. 79 X. Calibration scale shows"dB down fröm specified crain at broadside"

..,.IV
i79 1lIIi
t
CA, A
DEC 6. 1979
EL = 10190
VER POL
f = 230 MHz
o2 IN/MINN=O 6=0 0
,
l IN,- -I
,.
\
t
~
+
->
t
'1/\-1 r\Jr t Vv ~
~o : ~. l .;°1
! n° ;0 ~o jo- -: . r+- -t- -r-o ~ i~ - -, i
..-l.- . ....L__ ,
o
~
L
~
79 'lIII
L -,
'< =t' ~ I
->20
1'00
CALlBRATlON SCALE SHOWS" dB DOWN FROM SPECIFlED GAIN AT BROADSIDE ..
Diagram 2. Vertical polarization. Broadside. Pattern No. 79 VIII. Calibration scale shows"dB down from specified gain".
BO XI
IIII
CAS A
MARCH 6, 1980
EL=S13°
HOR POL
O2 IN/MIN
N = 20 8= 2S 2°
1 IN~
;O~
'"'"224 MHz -It----- 22SMHz---
O
1 !2 ,
3 •
4 r
~ r
~ r9 j
10 •
lS·
20
I.~
~
oJ>W....'"'"
80 XI i
...w
CALlBRATlON SCALE SHOWS" dB DOWN FROM SPECIFlED GAIN AT BROADSIDE "
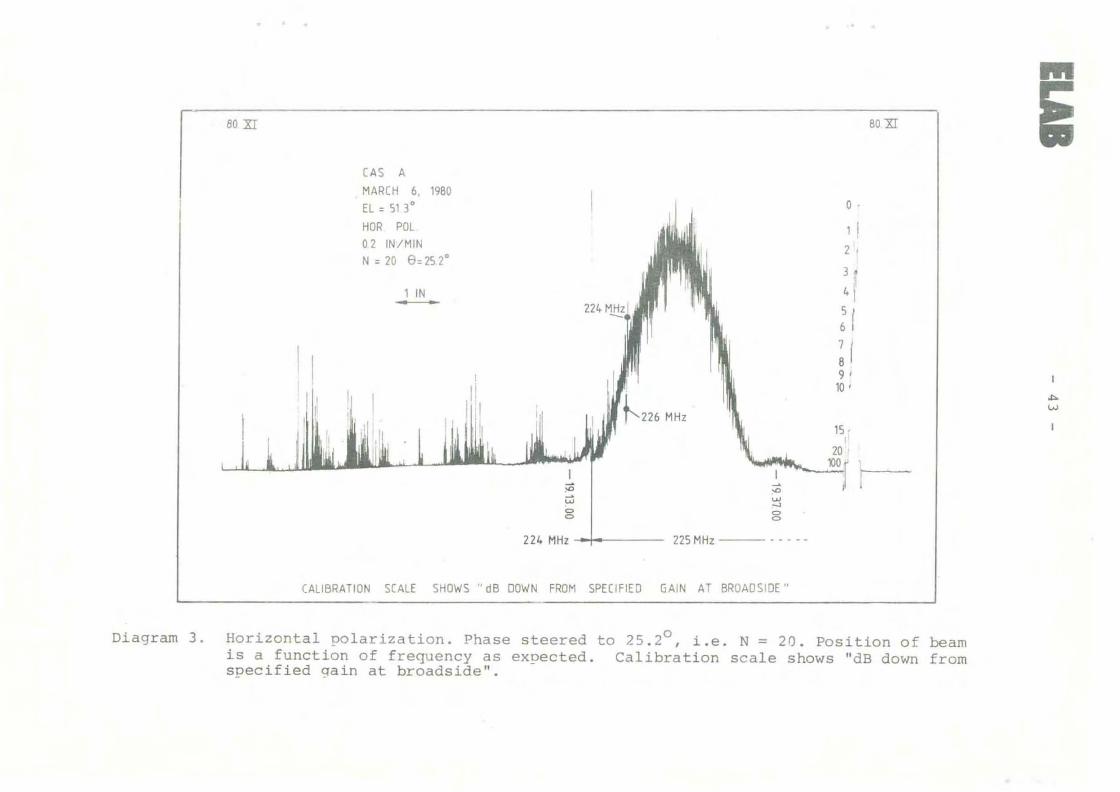
Diagram 3. Horizontal polarization. Phase steered to 25.2°, i.e. N = 20. Position of beamis a function of frequency as expected. Calibration scale shows "dB down fromspecified gain at broadside".
80 XlI
•r;
i" 11
~
'"..,<:><:>
CAS A
VER POL
MARCH 7, 1980
02 IN/MIN
INTERFERENCE FROMMI LITA RY RADAR
N =20 e =2S 2°
1 IN
80 XII E
""""
CALlBRATlON SCALE SHOWS" dB DOWN FROM SPECIFlED GAl N AT BROADSIDE "
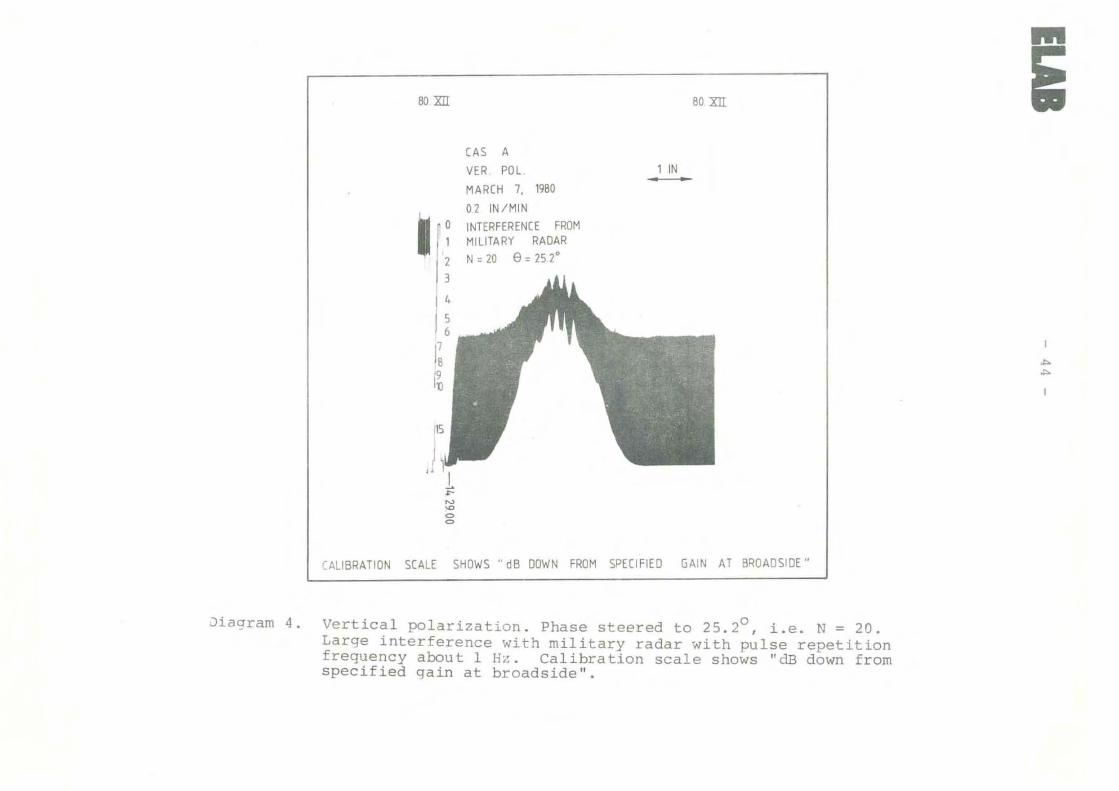
Jiagram 4. Vertical polarization. Phase steered to 25.2°, i.e. N = 20.Large interference with military radar with pulse repetitionfrequency about 1Hz. Calibration scale shows "dB dOll/n fromspecified qain at broadside".
80 XDl
or1 ~
32,1
4n11
1
~1
10}
CAS A
MARCH 17, 1il30
HOR POL
EL =47°
02 IN/MIN
f = 224 MHzN =17 e =213°1 IN~
80 XIll
0-
i
. ~
15,
, 20
-100
L
;ilc:: 5.... 8
;;;~
c:: '".... 8
;z;c::l!i.... g
;;;c:: S.... 8
100r.-
..,.Ul
.AlIBRATiON SCALE SHOWS dB DOWN FROM SPECIFlED GAIN AT BROADSIDE ..
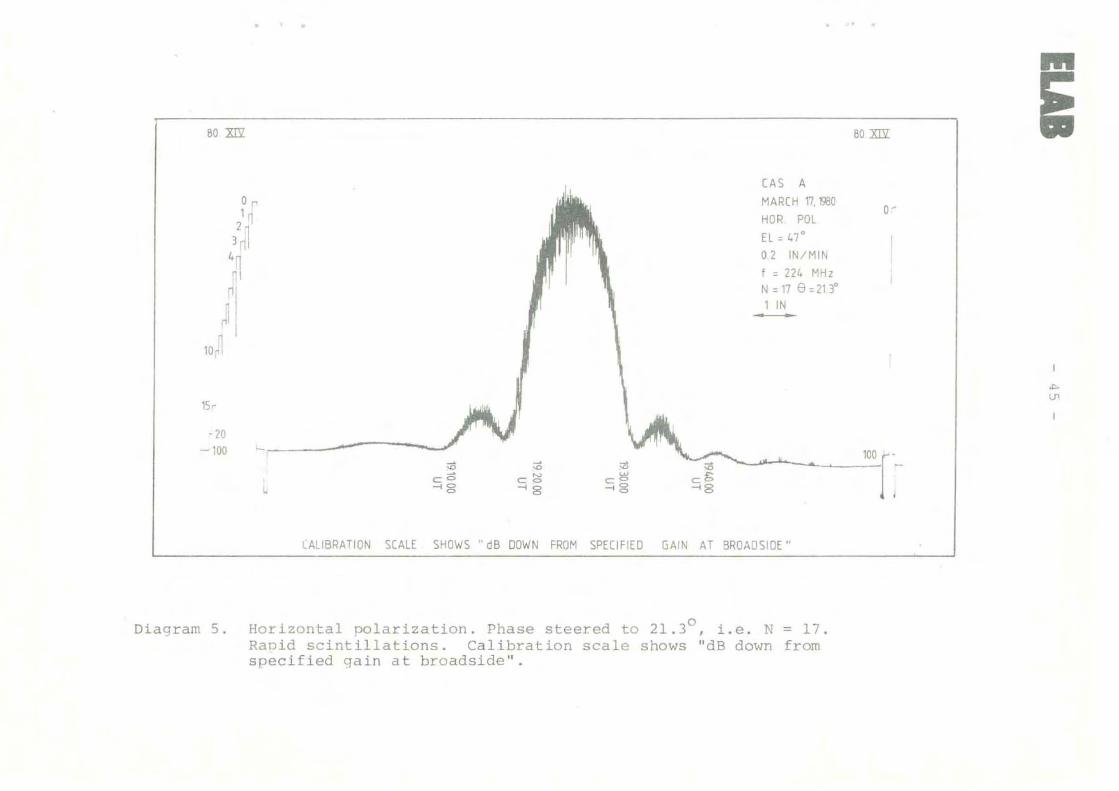
Diagram 5. Horizontal polarization. Phase steered to 21.3°, i.e. N = 17.Rapid scintillations. Calibration scale shows "dB down fromspecified gain at broadside"~.
80 xm 80 XIIIii
CAS A
10" MARCH 17, 1980
;~EL = 94 O·
N = 17 8= 213·
f = 224 MHz
;iVER POL
O2 IN/i~IN
15t\ I 1 IN
J
\II ~
CTI
15, II
n )20 1r------/ \JI
ji~ 100w w .., w<> o; ~ '"L '" <><> <> 8 <><> <> <>
CALlBRATlON SCALE SHOWS" dB DOWN FROM SPECIFlED GAIN AT BROADSIDE "
Diagram 6. Vertical polarization. Phase steered to 21.3°, i.e. N = 17.Slow scienti11ations. Pattern No. 80. XIII.Calibration scale shows "dB down from specified gain at broadside".
EBO Fl
...-..J"T~ jO
_.':--.-
.' f-
~L-
-,- ---
••
I
1"
~
i---l
_ , L. .I _' __ ! :.J.' I_+ J ~.J___~ _
l· - - - :ASSIOPEIA - A - .~ Ir.'-~~-t., +-f--~-+~ol:--~- i. -+. o j. l ----r---j-+ 1JAN 20, 19BO ~ -r-- .J ~.. ,; ',.'01 IN/MIN , , -
I 'I I
Diagram 7. Broadside. Very small scintillations. Pattern No. 80.F.l.
EISCAT publications
F. du Castel, O. Holt, B. Hultqvist, H. Kohl and M. Tiuri:
A European Incoherent Scatter Faci1ity in the Auroral Zone (EISCAT).
A Feasibility Study ("The Green Report tl) June 1971. (Out of print).
o. Bratteng and A. Haug:
Model Ionosphere at High Latitude, EISCAT Feasibi1ity Study, Report
No. 9.
The AuroraiObservatory, Tromsö Ju1y 1971. (Out of print).
A European Incoherent Scatter Facility in the Auroral Zone, UHF
System and Organization ("The Ye110w Report") I June 1974.
EISCAT Annual Report 1976. {Out of print).
P.S. Kildal and T. Hagfors:
Balance between investment in reflector and feed in the VHF cylindri
ca1 antenna.
EISCAT Technical Notes No. 77/1, 1977.
T. Hagfors:
Least mean square fitting of data to physieal modeis.
"EISCAT Technieal Nates No. 78/2,' 1978.
T. Hagfors :
The effect of iee on an antenna reflector.
EISCAT Technical Notes No. 78/3, 1978.
T. Hagfors:
The bandwidth of a linear phased array with stepped delay corrections.
EISCAT Technica1 Notes No. 78/4, 1978.
Data Group meeting in Kiruna, Sweden, 18-20 Jan. 1978
EISCAT Meetings No. 78/1, 1978
EISCAT Annual Report 1977
H-J. Alkcr.
Measurement princip1es in the EISCAT system·
EISCAT Technica1 Notes No. 78/5# 1978
EISCAT Data Group meeting in Tromsö l Norway 30-31 Uay# 1978
EJ3CAT Meetings No. 78/2# 1978.
P-S. Kilda1:
Discrete phase steering by permuting precut phase cables.
EISCAT Technical Nates No. 78/6, 1978
EISCAT UHF antenna acceptance test.
EISCAT Technical Nates No. 78/7# 1978.
P-s. Rildal:
Feeder elements for the EISCAT VHF parabo1ic cylinder antenna.
EISCAT Technical Notes No. 78/8, 1978.
H-J. Alker:
Program CORRSIM: System for program development and software
simulation of EISCAT digital corre1ator, User's Manual.
EISCAT Technica1 Nates No. 79/9, 1979.
H-J. Alker:
Instruction manual for EISCAT digital correlator.
EISCAT Technical Nates No. 79/10, 1979
H-J. Alker:
A prograrnmable correlator module for the EI5CAT radar system.
EISCAT Technical Nates No. 79/11# 1979.
T. Ho and H-J. Alker:
Scientific programming of the EISCAT digital carrelator.
EISCAT Technical Notes No. 79/12, 1979.