Embed Size (px)
Citation preview
MULTI-COUNTY GOODS MOVEMENT ACTION PLAN
CHAPTER 3 – EXISTING CONDITIONS AND CONSTRAINTS
A31418
Wilbur Smith Associates
Page 3-1
Chapter 3 – Existing Conditions and Constraints Chapter 3 summarizes the work done under Task 3 to build the Action Plan, that is further described in Tech Memo 3. This chapter identifies the key factors that influence goods movement decisions, describes how freight is moved, provides an inventory of the components of the regional goods movement system, and identifies issues, constraints and other deficiencies in the system and supply chain. This chapter also identifies community and environmental impacts that are further described in Chapter 5.
Key Goods Movement Factors � Projections- Freight cargo volumes that are expected to triple by 2030, will place an additional heavy
burden on the environment, local communities and the region’s aging transportation infrastructure. � Quality of Life- According to the California Air Resources Board (CARB) and others emissions from
goods movement sources, particularly ozone and diesel particulate matter, has a direct and negative impact on public health and the environment.
� Trade Relations- A national policy that promotes reduced barriers to trade, combined with the export of U.S. industrial jobs, particularly to Asia, has increased the nation’s reliance on imports thereby increasing the flow of goods through the region’s system.
� Demand- Due to its strategic location, Southern California has become an important trade gateway for the rest of the nation, carrying a disproportionate share of international trade. Moreover, much of the goods moved within the region support one of the largest metropolitan populations in the country and the third largest manufacturing center in the nation.1
� Economics- The goods movement system is vital to the local economy and provides many jobs within the study area, particularly in the logistics sector. Southern California’s burgeoning population requires a logistics sector that matches its size and growth.
� Funding- Nonconformance of regional air quality goals may result in a cessation of federal transportation improvement funds for the region. Moreover, transportation funding for goods movement has not kept pace with needed improvements and mitigation measures; traditional fund sources are steadily shrinking.
Understanding Freight Flows Freight moves through ports in one of three ways: � Inland-point Intermodal Service - The ocean carrier arranges transfer of marine container from vessel
to rail and rail line haul movement, � Transportation to the Port Gate with a Container Mounted on a Chassis - The customer arranges
for a marine container to be transported from port gate to a destination (or distribution center) via long-haul truck or dray.
� Transportation to Inland Warehouses - Dray from port gate to warehouse may be arranged by the shipping line or by customer. The customer contracts with a Third Party Logistics (3PL) firm, sometimes a subsidiary of the ocean carrier or Non-Vessel Owning Common Carriers, to provide deconsolidation and transloading into domestic trailers or containers.
MULTI-COUNTY GOODS MOVEMENT ACTION PLAN
CHAPTER 3 – EXISTING CONDITIONS AND CONSTRAINTS
A31418
Wilbur Smith Associates
Page 3-2
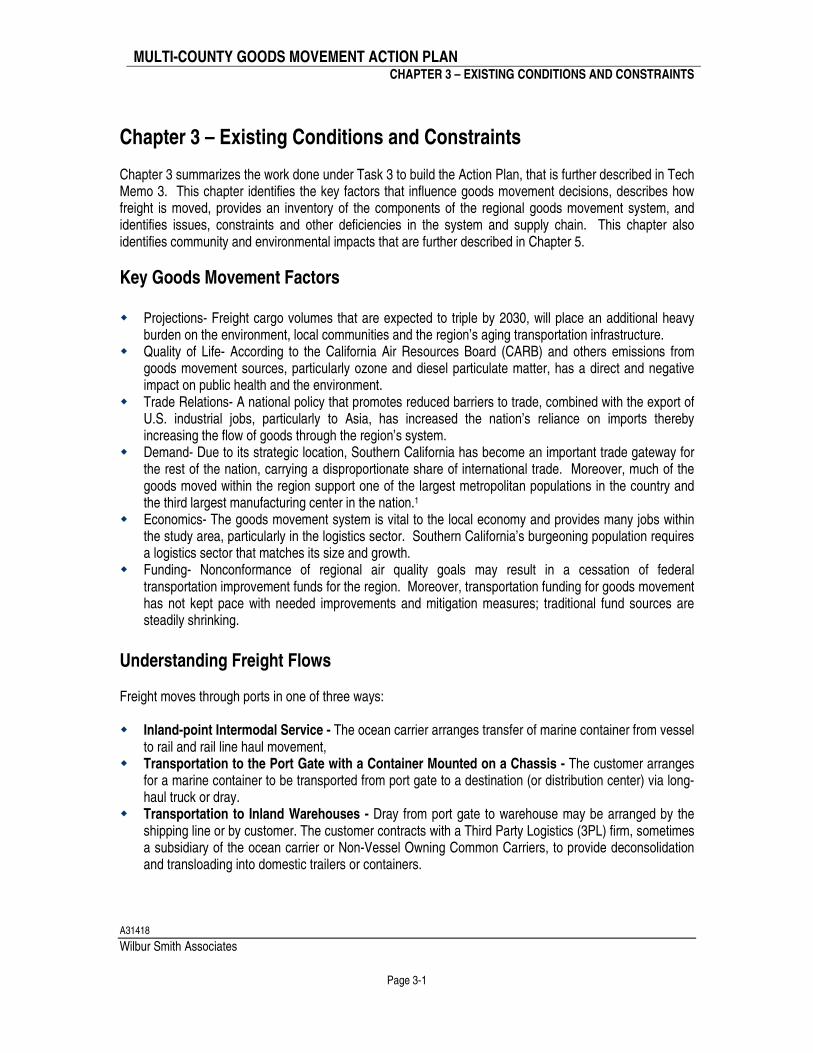
Figures 3 through 8 graphically depict the various ways goods are moved in the region through the supply chain to the ultimate destination- the consumer.
Figure 3
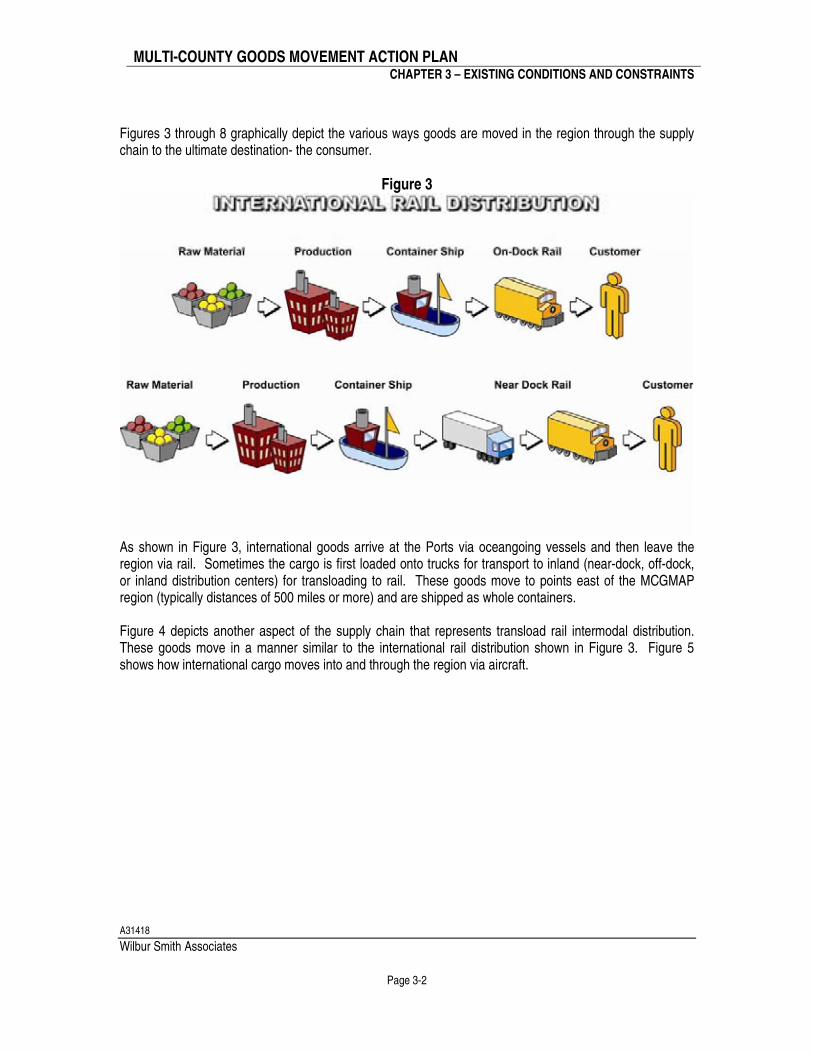
As shown in Figure 3, international goods arrive at the Ports via oceangoing vessels and then leave the region via rail. Sometimes the cargo is first loaded onto trucks for transport to inland (near-dock, off-dock, or inland distribution centers) for transloading to rail. These goods move to points east of the MCGMAP region (typically distances of 500 miles or more) and are shipped as whole containers. Figure 4 depicts another aspect of the supply chain that represents transload rail intermodal distribution. These goods move in a manner similar to the international rail distribution shown in Figure 3. Figure 5 shows how international cargo moves into and through the region via aircraft.
MULTI-COUNTY GOODS MOVEMENT ACTION PLAN
CHAPTER 3 – EXISTING CONDITIONS AND CONSTRAINTS
A31418
Wilbur Smith Associates
Page 3-3
Figure 4
Figure 5
Figure 6
MULTI-COUNTY GOODS MOVEMENT ACTION PLAN
CHAPTER 3 – EXISTING CONDITIONS AND CONSTRAINTS
A31418
Wilbur Smith Associates
Page 3-4
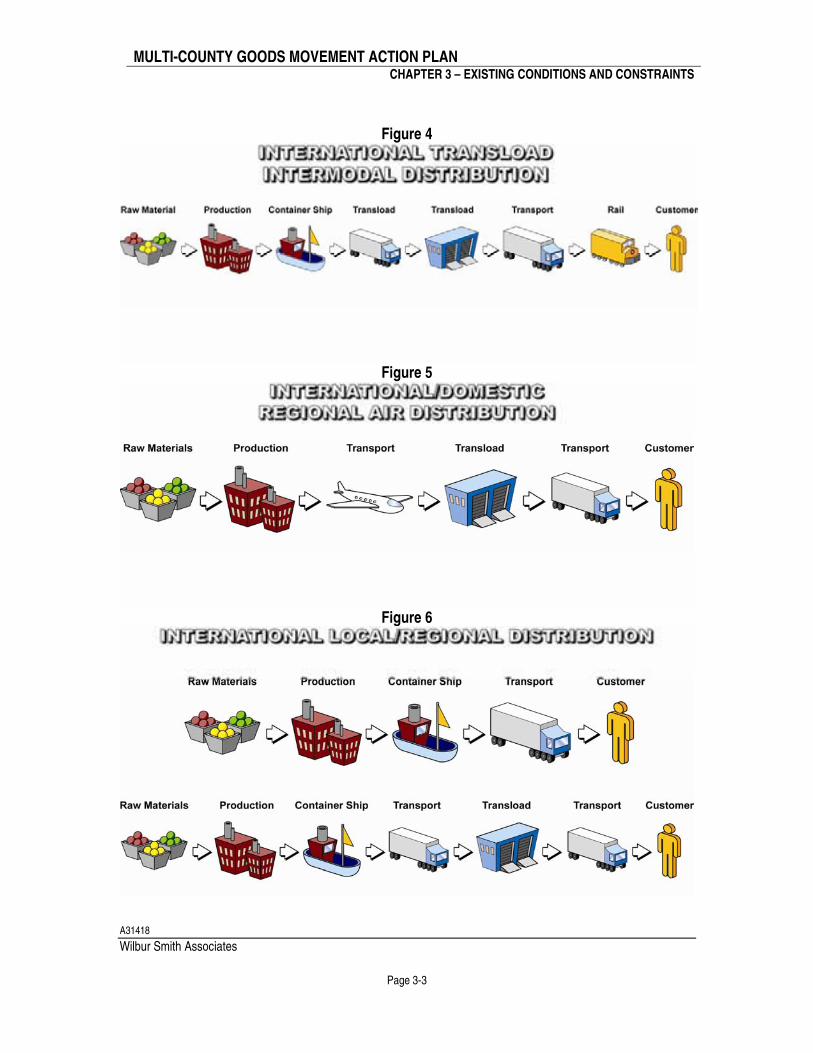
As shown in Figure 6, international goods that arrive at the Ports (via ocean going vessels) can also leave the region by truck. This includes goods that are transloaded at inland distribution centers. These containers are broken down for distribution to various markets east of the study region, to locations such as Phoenix, Salt Lake City, or Las Vegas, and north to northern California, Oregon, and Washington.
Figure 7
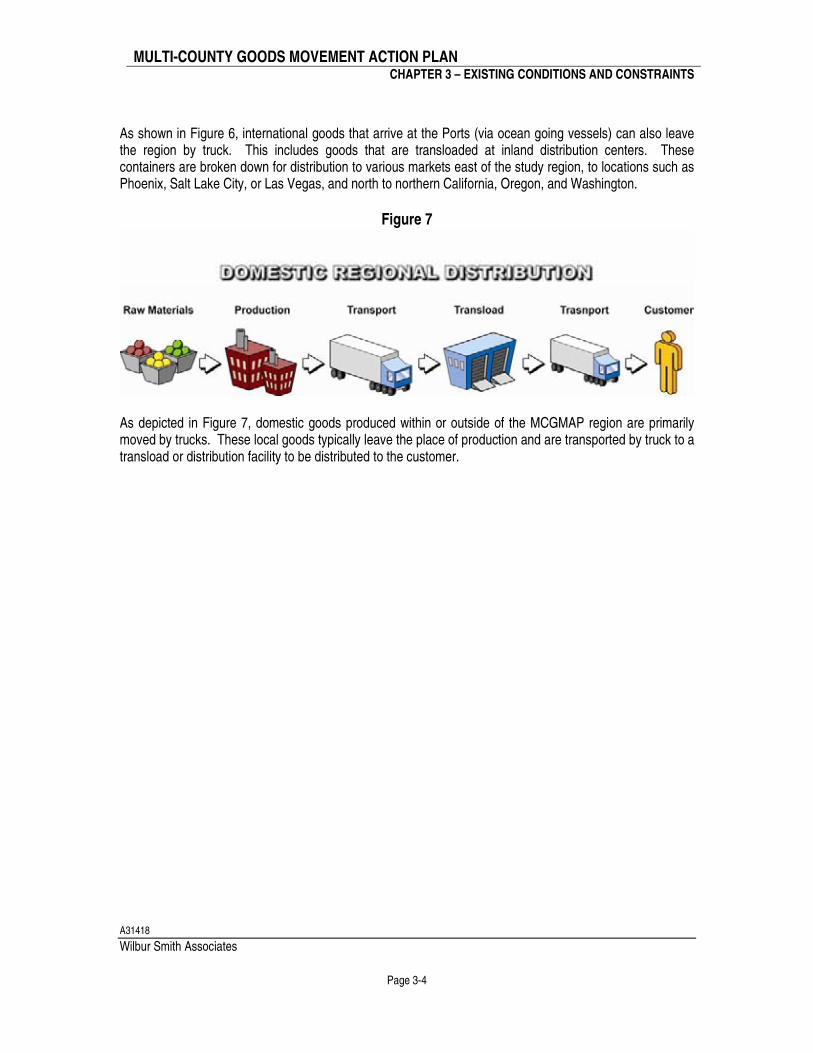
As depicted in Figure 7, domestic goods produced within or outside of the MCGMAP region are primarily moved by trucks. These local goods typically leave the place of production and are transported by truck to a transload or distribution facility to be distributed to the customer.
MULTI-COUNTY GOODS MOVEMENT ACTION PLAN
CHAPTER 3 – EXISTING CONDITIONS AND CONSTRAINTS
A31418
Wilbur Smith Associates
Page 3-5
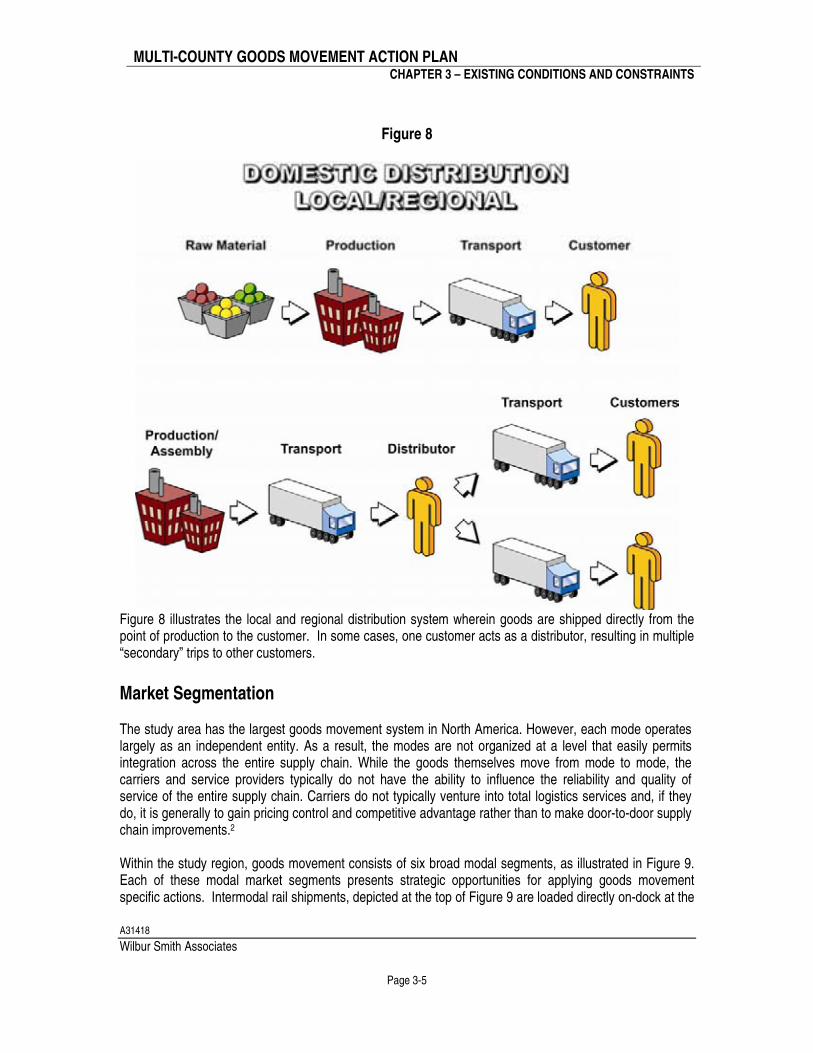
Figure 8
Figure 8 illustrates the local and regional distribution system wherein goods are shipped directly from the point of production to the customer. In some cases, one customer acts as a distributor, resulting in multiple “secondary” trips to other customers.
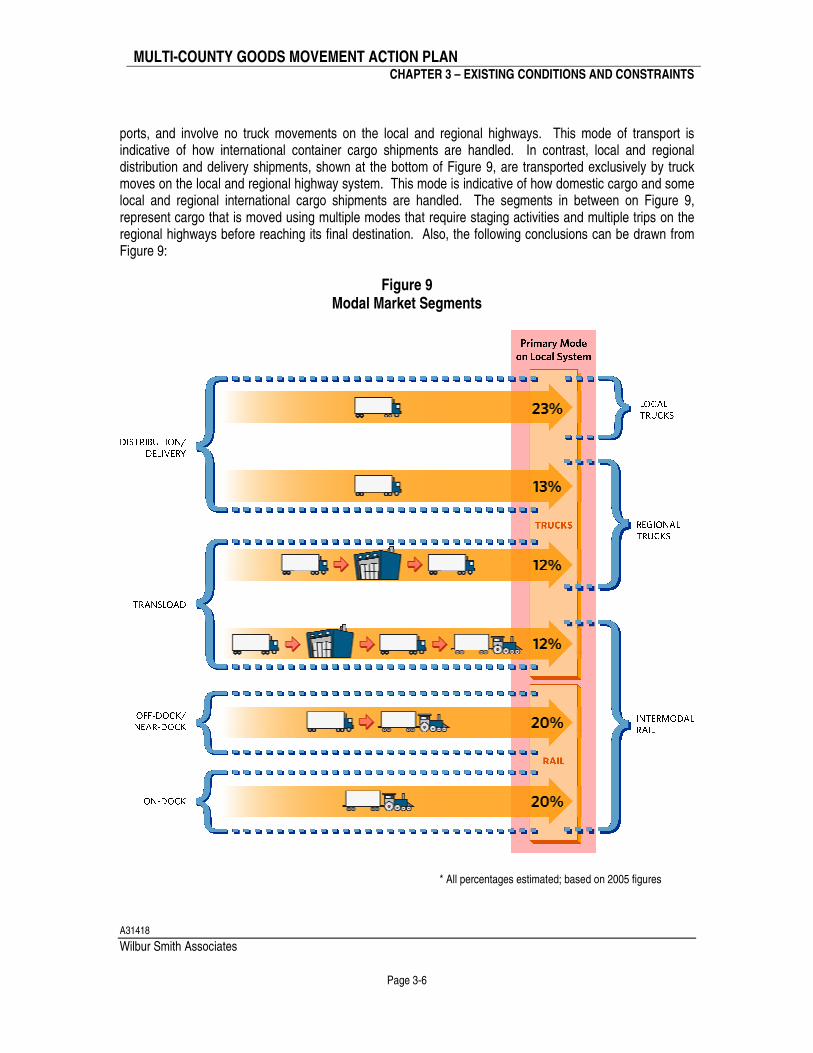
Market Segmentation The study area has the largest goods movement system in North America. However, each mode operates largely as an independent entity. As a result, the modes are not organized at a level that easily permits integration across the entire supply chain. While the goods themselves move from mode to mode, the carriers and service providers typically do not have the ability to influence the reliability and quality of service of the entire supply chain. Carriers do not typically venture into total logistics services and, if they do, it is generally to gain pricing control and competitive advantage rather than to make door-to-door supply chain improvements.2 Within the study region, goods movement consists of six broad modal segments, as illustrated in Figure 9. Each of these modal market segments presents strategic opportunities for applying goods movement specific actions. Intermodal rail shipments, depicted at the top of Figure 9 are loaded directly on-dock at the
MULTI-COUNTY GOODS MOVEMENT ACTION PLAN
CHAPTER 3 – EXISTING CONDITIONS AND CONSTRAINTS
A31418
Wilbur Smith Associates
Page 3-6
ports, and involve no truck movements on the local and regional highways. This mode of transport is indicative of how international container cargo shipments are handled. In contrast, local and regional distribution and delivery shipments, shown at the bottom of Figure 9, are transported exclusively by truck moves on the local and regional highway system. This mode is indicative of how domestic cargo and some local and regional international cargo shipments are handled. The segments in between on Figure 9, represent cargo that is moved using multiple modes that require staging activities and multiple trips on the regional highways before reaching its final destination. Also, the following conclusions can be drawn from Figure 9:
Figure 9 Modal Market Segments
* All percentages estimated; based on 2005 figures
MULTI-COUNTY GOODS MOVEMENT ACTION PLAN
CHAPTER 3 – EXISTING CONDITIONS AND CONSTRAINTS
A31418
Wilbur Smith Associates
Page 3-7
Regional Intermodal Rail Market Segment – Approximately half of the entire international container market utilizes the region’s intermodal rail system. Between 50 and 55% of all containers moving through the region’s ports are either loaded/unloaded (1) directly on/off an intermodal train on the docks (e.g., on-dock intermodal rail), (2) directly on/off an intermodal train at an intermodal rail yard near or distant from the docks (e.g., near- or off-dock intermodal rail), or (3) indirectly after the contents of an international container are transloaded into larger domestic containers at off-dock warehouses before being trucked to an off-dock intermodal yard (e.g., transloaded intermodal rail). While the on-dock market segment (approximately 20%) requires no truck movements on the local and regional roadway system, the remaining intermodal market movements require at least one truck-trip to an off-dock intermodal facility plus an additional return trip (often with an empty container). Also, the Union Pacific (UP) and Burlington Northern Santa Fe (BNSF) move an estimated 40 percent of all international containers through the study area (many of these are empty westbound containers) as part of their intermodal service.3 The Alameda Corridor Transportation Authority (ACTA) conducted a study in 2004 that estimated the railroads also transport another 12 percent of what had been international containerized cargo in domestic containers.4 This is cargo that had been warehoused or transloaded in the study area before being transported eastbound in domestic containers.. Regional Truck Market Segment – Trucks serve another significant segment of the international container market that includes Phoenix, Salt Lake City, San Francisco, Seattle, and other regional urban markets. These regional trucks haul either directly loaded containers or larger domestically configured tractor-trailer combinations with international shipments transloaded from ocean containers. These trucks rely on the region’s local transportation roadway system and a concentrated set of regional freeways for the line-haul portion of their trips. These trips are typically up to 500 miles in length; however, some trips exceed that distance. Local Truck Market Segment –Local goods movement (e.g. domestic cargo, local distribution) represents the least opportunity for strategically directing specific solutions and funding options, but it cannot be overlooked. Local trucks traverse a broad system of local roadways to serve a large number of consumers that are spread throughout the region. While the region is a major gateway for international container movements, the local and domestic component is more dominant because the study area represents the third largest manufacturing center in the United States and is home to almost 20 million residents. These factors alone generate a significant demand for local goods within the study area.
Components of the Region’s Goods Movement System
SEA PORTS The San Pedro Bay Ports of Long Beach and Los Angeles are the largest container ports nationally, and the fifth largest in the world (Table 1). These ports handled 15.7 million Twenty-Foot Equivalent Units (TEUs) of containers in 2006. Three quarters of the trade through the San Pedro Bay Ports of Long Beach and Los Angeles is produced or consumed elsewhere.5 Only one quarter is for local consumption. In 2005, the value of containerized trade moving through the San Pedro Bay Ports of Long Beach and Los Angeles totaled $256 billion, which is a 246% increase over the 1994 level of $74 billion and a 31% increase over the 2000 level of $196 billion.6 In terms of tonnage, the Port of Los Angeles handled cargo 169 million metric
MULTI-COUNTY GOODS MOVEMENT ACTION PLAN
CHAPTER 3 – EXISTING CONDITIONS AND CONSTRAINTS
A31418
Wilbur Smith Associates
Page 3-8
revenue tons (MRT) in CY 2005, while the Port of Long Beach handled over 159 million metric revenue tons in CY 2005. The MCGMAP study area is also home to two other ports: the Port of Hueneme and the Port of San Diego. The Port of Hueneme is 60 miles north of the City of Los Angeles in Ventura County. Port Hueneme handled one million MRT of cargo in 2003. The port’s principal commodities include automobiles, bananas, wood pulp, fresh fruit, general cargo, offshore oil support, and fish. The Port of San Diego handled close to three million MRT of cargo in CY 2005.
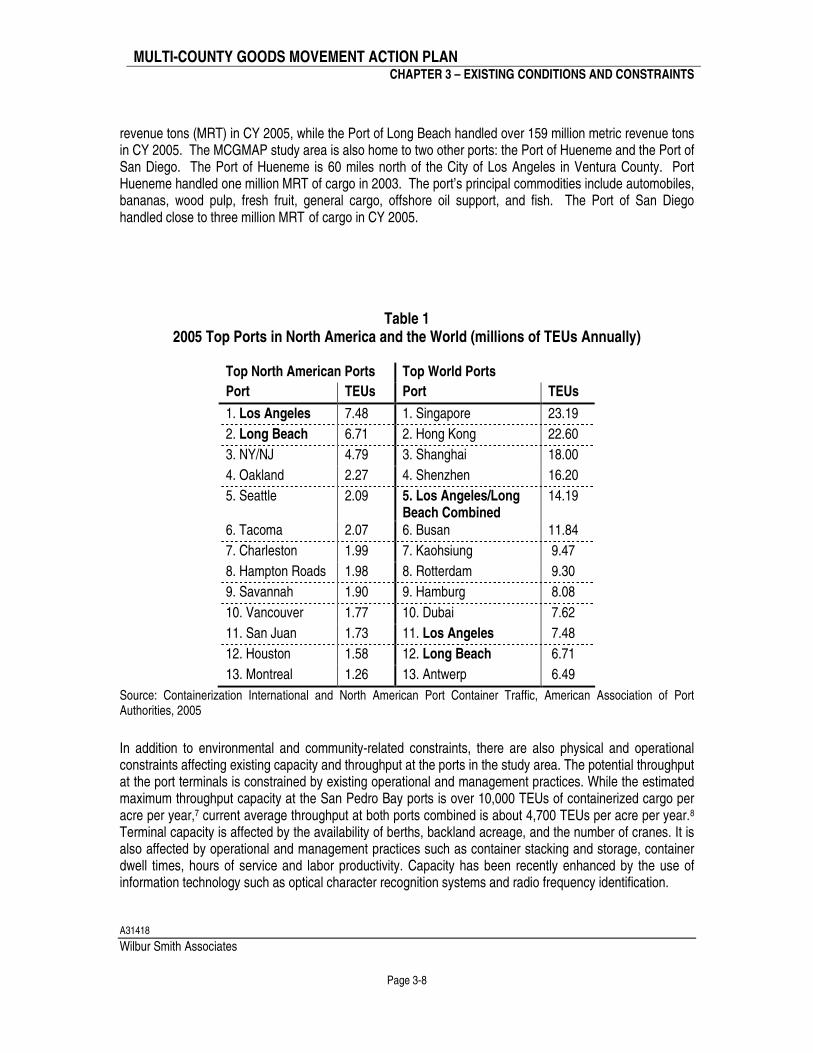
Table 1 2005 Top Ports in North America and the World (millions of TEUs Annually)
Top North American Ports Top World Ports
Port TEUs Port TEUs
1. Los Angeles 7.48 1. Singapore 23.19
2. Long Beach 6.71 2. Hong Kong 22.60
3. NY/NJ 4.79 3. Shanghai 18.00
4. Oakland 2.27 4. Shenzhen 16.20
5. Seattle 2.09 5. Los Angeles/Long Beach Combined
14.19
6. Tacoma 2.07 6. Busan 11.84
7. Charleston 1.99 7. Kaohsiung 9.47
8. Hampton Roads 1.98 8. Rotterdam 9.30
9. Savannah 1.90 9. Hamburg 8.08
10. Vancouver 1.77 10. Dubai 7.62
11. San Juan 1.73 11. Los Angeles 7.48
12. Houston 1.58 12. Long Beach 6.71
13. Montreal 1.26 13. Antwerp 6.49
Source: Containerization International and North American Port Container Traffic, American Association of Port Authorities, 2005 In addition to environmental and community-related constraints, there are also physical and operational constraints affecting existing capacity and throughput at the ports in the study area. The potential throughput at the port terminals is constrained by existing operational and management practices. While the estimated maximum throughput capacity at the San Pedro Bay ports is over 10,000 TEUs of containerized cargo per acre per year,7 current average throughput at both ports combined is about 4,700 TEUs per acre per year.8 Terminal capacity is affected by the availability of berths, backland acreage, and the number of cranes. It is also affected by operational and management practices such as container stacking and storage, container dwell times, hours of service and labor productivity. Capacity has been recently enhanced by the use of information technology such as optical character recognition systems and radio frequency identification.
MULTI-COUNTY GOODS MOVEMENT ACTION PLAN
CHAPTER 3 – EXISTING CONDITIONS AND CONSTRAINTS
A31418
Wilbur Smith Associates
Page 3-9
PierPass was introduced in July 2005 to help shift traffic from the traditional work day hours to off peak travel times. These off peak travel times are defined as 6:00 pm – 3:00 am Monday through Thursday, and 8:00 am – 6:00 pm on Saturdays. This program provides an incentive for importers to move containers during off peak times. In 2006, the PierPass official website estimates that on average 60,000 truck trips per week have been shifted to off peak hours, or roughly 30-35% of the port cargo now moves off peak. The PierPass official website estimates that next year as many as 2.8-3 million truck trips may be shifted to off peak travel times. While container traffic has received most of the attention in recent years, the terminal capacity for commodities such as petroleum liquid bulk has become a growing concern at the ports. California is now an important net importer of refined fuels, while demand is outstripping petroleum storage capacity. The need to accommodate containerized cargo is crowding out the petroleum facilities, adding to the overall complexity surrounding the expansion of the terminals. While delay on the roadway system impacts goods movement, the most significant delays are at the goods movement facilities such as ports, intermodal facilities, and warehouse and distribution centers. The issue is most evident at the port container terminals, where almost half (44 percent) of the total roundtrip time is spent waiting for the container to be loaded and unloaded.9 The delay is not associated with the actual turnaround of the load, which on average takes about 35 minutes, but with the queuing time to be loaded.10 Regulatory measures, such as AB 2650, a state law passed to impose a fine on terminal operators if trucks idle outside the gate for a period longer than 30 minutes, have been effective in reducing queuing outside terminal gates. 11 However, some truckers complain that the queuing has simply moved inside the terminal gates. Terminals that maintain appointment systems or extend gate hours are able to avoid AB 2650-related fines. With PierPass in effect, all terminals have extended hours and are therefore exempt from these fines.
AIR CARGO In recent years, air cargo has become the fastest growing segment of the goods movement industry in the United States, placing increasing demands on airports and ground transportation to and from airports. The air freight industry is classified into five major types of carriers: 1-Integrated Air Cargo Carriers – Companies such as Federal Express (FedEx), UPS, DHL, Airborne, Emery, and BAX are known as integrated carriers because they provide door-to-door service by any combination of modes (air, truck, and rail intermodal). Integrated air cargo carriers control the reliability of service by owning some of the ground transport operations as well as the air lift capacity. These carriers also use information technology to exercise control. 2-Non-integrated (Cargo-only) Carriers – This sector does not provide an integrated door-to-door service, only line-haul service for the airport to airport portion, typically international. Shippers, freight forwarders, cargo handling companies, and other carriers buy lift capacity from non-integrated carriers. 3-Freight Forwarders - Freight forwarders do not operate as carriers. Freight forwarders handle and manage the shipment of air cargo on behalf of shippers, particularly international shipments, and buy air lift capacity from passenger belly space and cargo-only carriers.
MULTI-COUNTY GOODS MOVEMENT ACTION PLAN
CHAPTER 3 – EXISTING CONDITIONS AND CONSTRAINTS
A31418
Wilbur Smith Associates
Page 3-10
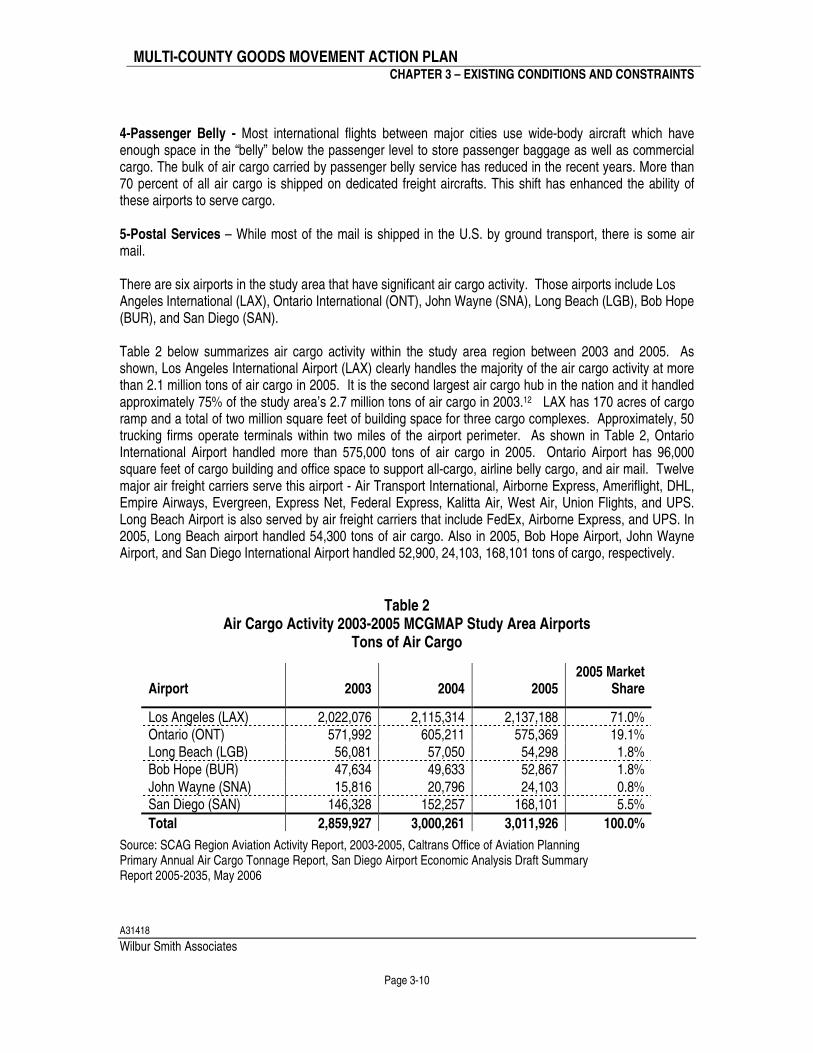
4-Passenger Belly - Most international flights between major cities use wide-body aircraft which have enough space in the “belly” below the passenger level to store passenger baggage as well as commercial cargo. The bulk of air cargo carried by passenger belly service has reduced in the recent years. More than 70 percent of all air cargo is shipped on dedicated freight aircrafts. This shift has enhanced the ability of these airports to serve cargo. 5-Postal Services – While most of the mail is shipped in the U.S. by ground transport, there is some air mail. There are six airports in the study area that have significant air cargo activity. Those airports include Los Angeles International (LAX), Ontario International (ONT), John Wayne (SNA), Long Beach (LGB), Bob Hope (BUR), and San Diego (SAN). Table 2 below summarizes air cargo activity within the study area region between 2003 and 2005. As shown, Los Angeles International Airport (LAX) clearly handles the majority of the air cargo activity at more than 2.1 million tons of air cargo in 2005. It is the second largest air cargo hub in the nation and it handled approximately 75% of the study area’s 2.7 million tons of air cargo in 2003.12 LAX has 170 acres of cargo ramp and a total of two million square feet of building space for three cargo complexes. Approximately, 50 trucking firms operate terminals within two miles of the airport perimeter. As shown in Table 2, Ontario International Airport handled more than 575,000 tons of air cargo in 2005. Ontario Airport has 96,000 square feet of cargo building and office space to support all-cargo, airline belly cargo, and air mail. Twelve major air freight carriers serve this airport - Air Transport International, Airborne Express, Ameriflight, DHL, Empire Airways, Evergreen, Express Net, Federal Express, Kalitta Air, West Air, Union Flights, and UPS. Long Beach Airport is also served by air freight carriers that include FedEx, Airborne Express, and UPS. In 2005, Long Beach airport handled 54,300 tons of air cargo. Also in 2005, Bob Hope Airport, John Wayne Airport, and San Diego International Airport handled 52,900, 24,103, 168,101 tons of cargo, respectively.
Table 2 Air Cargo Activity 2003-2005 MCGMAP Study Area Airports
Tons of Air Cargo
Source: SCAG Region Aviation Activity Report, 2003-2005, Caltrans Office of Aviation Planning Primary Annual Air Cargo Tonnage Report, San Diego Airport Economic Analysis Draft Summary Report 2005-2035, May 2006
Airport
2003
2004
2005
2005 Market Share
Los Angeles (LAX) 2,022,076 2,115,314 2,137,188 71.0% Ontario (ONT) 571,992 605,211 575,369 19.1% Long Beach (LGB) 56,081 57,050 54,298 1.8% Bob Hope (BUR) 47,634 49,633 52,867 1.8% John Wayne (SNA) 15,816 20,796 24,103 0.8% San Diego (SAN) 146,328 152,257 168,101 5.5%
Total 2,859,927 3,000,261 3,011,926 100.0%
MULTI-COUNTY GOODS MOVEMENT ACTION PLAN
CHAPTER 3 – EXISTING CONDITIONS AND CONSTRAINTS
A31418
Wilbur Smith Associates
Page 3-11
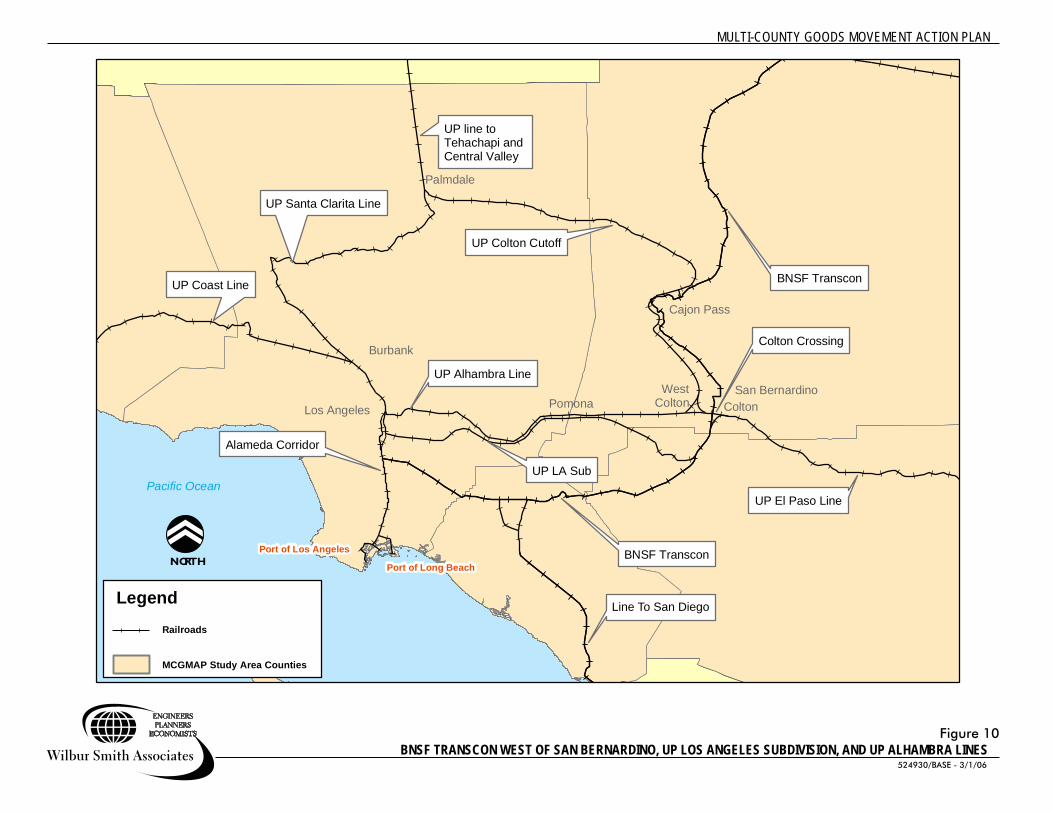
In addition to environmental and community-related constraints, there are also physical and operational constraints affecting existing capacity and throughput at the airports in the study area. Delays during peak periods continue to mount at airports, mainly because of on-airport warehouse space and peak-period lift capacity. Also, competition for space impacts the airports in the study area, particularly Los Angeles International Airport (LAX), where high demand exists for both passenger and cargo services. Runways, taxiways, aprons to park aircraft, maintenance facilities, and cargo-handling facilities are needed for air cargo services. One proposal to alleviate this competition at LAX is to attract cargo to outlying airports such as San Bernardino International, Ontario International, Palmdale, Victorville and March, where capacity exists. Some of these have been proposed as all-cargo airports. However, the potential for all-cargo airports is limited because a significant portion of air cargo moves in the bellies of large international passenger aircraft, due to the pricing advantage offered by the extra belly space, most of which fly out of LAX. In addition, since most air cargo is destined for use within the region, the location of LAX makes it the most convenient with respect to the cargo’s final destination. RAIL The study area is home to the nation’s busiest rail intermodal operations. It is a key mode of transport for goods through the MCGMAP region and it is preferred when there is a need to move large volumes of goods over long distances. Freight is often transferred to eastern carriers who deliver shipments to dense eastern markets such as Columbus, Detroit, Boston, New York/New Jersey, Philadelphia, Baltimore, Norfolk, Atlanta and Jacksonville. The total domestic and intermodal volume moving through the eight terminals operated by Burlington Northern Santa Fe Railway (BNSF) and the Union Pacific Railroad (UP) in the study area approaches five million containers annually, of which 64 percent are international and 36 percent are domestic containers13. BNSF and UP are linked to the Mexican and Canadian rail systems. On an average weekday, 80 freight trains run through the study area, hauling 52 percent14 of the ports’ international containerized goods to and from other parts of the country. There are two immediate issues facing the railroads serving Southern California which are (1) terminal capacity to load and stage freight and (2) mainline capacity east of Los Angeles over the mountains. As a result of historical growth in the intermodal container market, mostly due to growth in Asian imports, mainlines are reaching their capacity. Terminals are being stretched to their limits, recent reduction in free time at the terminals has provided some relief but the growing volumes are exceeding the capacity of the existing terminals. Some carriers have actively tried to relocate business segments to other terminals east of Los Angeles, with some success. The impact of mainline capacity constraints is a reduction in system velocity, which results in delay and increased backlog along the mainlines as well as at the rail yards. The average train trip is delayed by over 30 minutes east of Los Angeles.15 A backup in the system is far reaching, resulting in the delay in the delivery of time-sensitive shipments to customers nationwide. The following sections describe more about the existing freight rail system, rail intermodal facilities and commuter rail service within the study area. Freight Rail System- The freight rail system within the study area consists of mainline freight lines, short lines, and the Alameda Corridor. Three mainline freight lines within the LA basin transport more than 98 percent of all Los Angeles and Long Beach port intermodal traffic. These lines are (1) the BNSF Transcon west of San Bernardino, (2) the UP Los Angeles Subdivision, and (3) the UP Alhambra Line. The BNSF Transcon in the Basin runs from San Bernardino to downtown Los Angeles, then connects to the triple track
MULTI-COUNTY GOODS MOVEMENT ACTION PLAN
CHAPTER 3 – EXISTING CONDITIONS AND CONSTRAINTS
A31418
Wilbur Smith Associates
Page 3-12
Alameda Corridor and thus to the Ports of Los Angeles and Long Beach. In addition, Amtrak operates long distance Southwest Chief and the Amtrak Pacific Surfliners while Metrolink operates its 91 Line service, its Inland Empire Orange County Line service, and its Orange County Line service on the BNSF Transcon. UP’s Los Angeles Subdivision runs from West Riverside to downtown Los Angeles. The Alhambra Line runs from Colton to downtown Los Angeles. Both lines connect to the Alameda Corridor. These lines also connect to the north-south rail routes for UP, the Coast, and the Santa Clarita Lines as shown in Figure 10. Current freight and passenger train volumes for these lines are listed in Tables 3 and 4. There are four primary short line operators in the study area. All of the short lines are essentially switching carriers and performing work of high labor-intensity. They provide a specialty service to the large railroads by concentrating their resources on intra-city (and to a lesser degree intra-region) operating issues. None of the short lines have operating scopes beyond defined boundaries. The short lines have no regional influence on goods movement issues and should be viewed as outsourcing entities of UP and BNSF.
The Alameda Corridor is a publicly owned, grade separated track running from near downtown Los Angeles to the San Pedro Bay Port area. In 2005, this line handled approximately 54 trains per day.
Los Angeles
Pacific Ocean
Alameda Corridor
UP Coast Line
UP Santa Clarita Line
UP Alhambra Line
UP LA Sub
UP Colton Cutoff
BNSF Transcon
UP El Paso Line
BNSF TransconPort of Long Beach
Port of Los Angeles
Burbank
WestColton
San Bernardino
Cajon Pass
Palmdale
UP line toTehachapi andCentral Valley
Colton Crossing
ColtonPomona
MCGMAP Study Area Counties
Railroads
Legend
Figure 10
MULTI-COUNTY GOODS MOVEMENT ACTION PLAN
524930/BASE - 3/1/06
NORTH
Line To San Diego
BNSF TRANSCON WEST OF SAN BERNARDINO, UP LOS ANGELES SUBDIVISION, AND UP ALHAMBRA LINES
MULTI-COUNTY GOODS MOVEMENT ACTION PLAN
CHAPTER 3 – EXISTING CONDITIONS AND CONSTRAINTS
A31418
Wilbur Smith Associates
Page 3-14
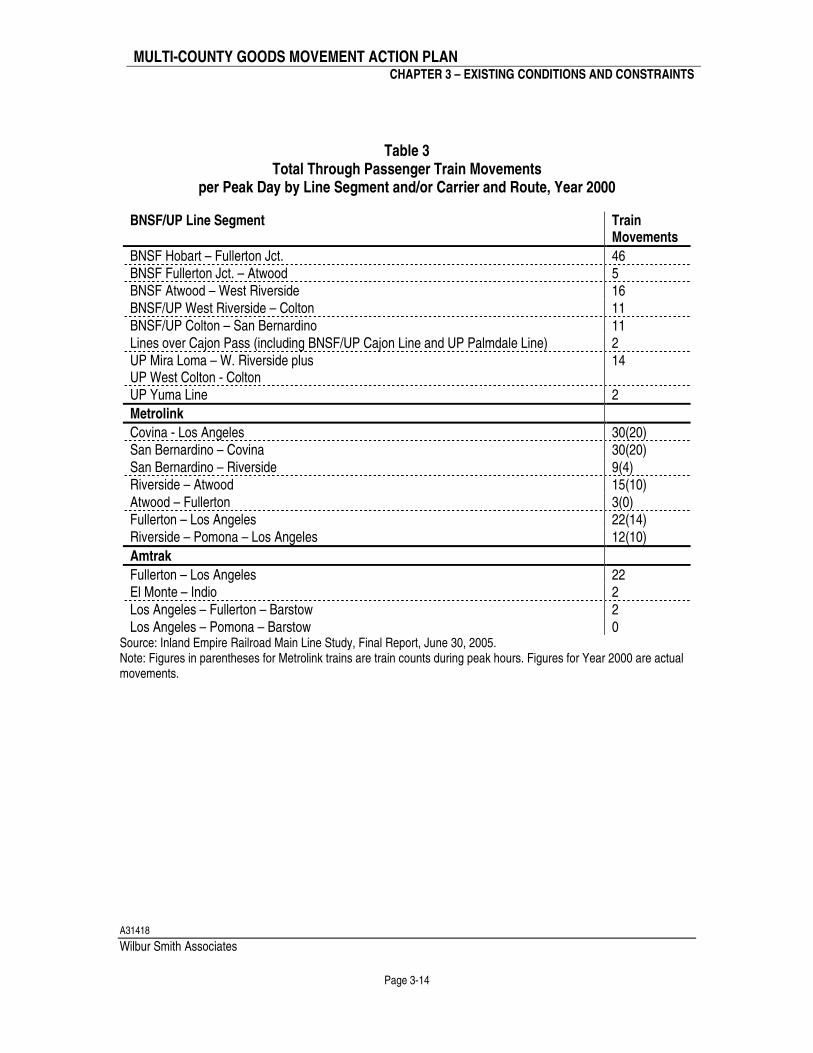
Table 3
Total Through Passenger Train Movements per Peak Day by Line Segment and/or Carrier and Route, Year 2000
BNSF/UP Line Segment Train Movements
BNSF Hobart – Fullerton Jct. 46 BNSF Fullerton Jct. – Atwood 5 BNSF Atwood – West Riverside 16 BNSF/UP West Riverside – Colton 11 BNSF/UP Colton – San Bernardino 11 Lines over Cajon Pass (including BNSF/UP Cajon Line and UP Palmdale Line) 2 UP Mira Loma – W. Riverside plus UP West Colton - Colton
14
UP Yuma Line 2
Metrolink
Covina - Los Angeles 30(20) San Bernardino – Covina 30(20) San Bernardino – Riverside 9(4) Riverside – Atwood 15(10) Atwood – Fullerton 3(0) Fullerton – Los Angeles 22(14) Riverside – Pomona – Los Angeles 12(10)
Amtrak
Fullerton – Los Angeles 22 El Monte – Indio 2 Los Angeles – Fullerton – Barstow 2 Los Angeles – Pomona – Barstow 0
Source: Inland Empire Railroad Main Line Study, Final Report, June 30, 2005. Note: Figures in parentheses for Metrolink trains are train counts during peak hours. Figures for Year 2000 are actual movements.
MULTI-COUNTY GOODS MOVEMENT ACTION PLAN
CHAPTER 3 – EXISTING CONDITIONS AND CONSTRAINTS
A31418
Wilbur Smith Associates
Page 3-15
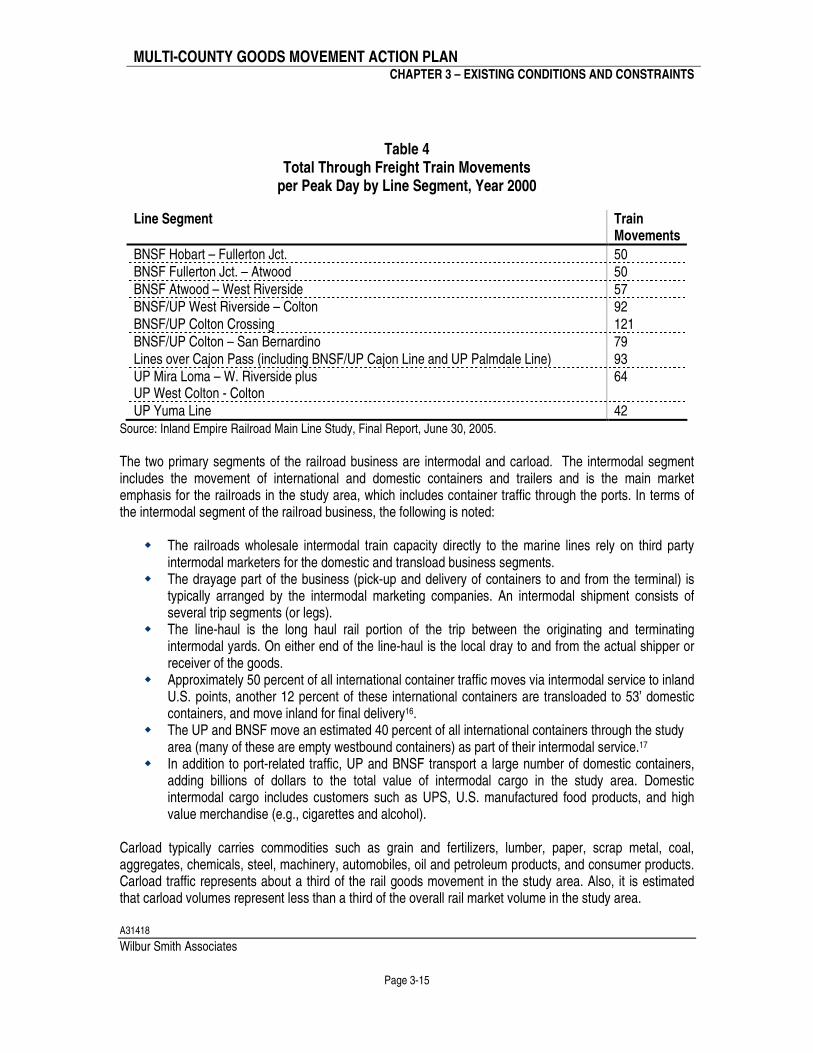
Table 4 Total Through Freight Train Movements
per Peak Day by Line Segment, Year 2000
Line Segment Train Movements
BNSF Hobart – Fullerton Jct. 50 BNSF Fullerton Jct. – Atwood 50 BNSF Atwood – West Riverside 57 BNSF/UP West Riverside – Colton 92 BNSF/UP Colton Crossing 121 BNSF/UP Colton – San Bernardino 79 Lines over Cajon Pass (including BNSF/UP Cajon Line and UP Palmdale Line) 93 UP Mira Loma – W. Riverside plus UP West Colton - Colton
64
UP Yuma Line 42 Source: Inland Empire Railroad Main Line Study, Final Report, June 30, 2005.
The two primary segments of the railroad business are intermodal and carload. The intermodal segment includes the movement of international and domestic containers and trailers and is the main market emphasis for the railroads in the study area, which includes container traffic through the ports. In terms of the intermodal segment of the railroad business, the following is noted:
� The railroads wholesale intermodal train capacity directly to the marine lines rely on third party intermodal marketers for the domestic and transload business segments.
� The drayage part of the business (pick-up and delivery of containers to and from the terminal) is typically arranged by the intermodal marketing companies. An intermodal shipment consists of several trip segments (or legs).
� The line-haul is the long haul rail portion of the trip between the originating and terminating intermodal yards. On either end of the line-haul is the local dray to and from the actual shipper or receiver of the goods.
� Approximately 50 percent of all international container traffic moves via intermodal service to inland U.S. points, another 12 percent of these international containers are transloaded to 53’ domestic containers, and move inland for final delivery16.
� The UP and BNSF move an estimated 40 percent of all international containers through the study area (many of these are empty westbound containers) as part of their intermodal service.17
� In addition to port-related traffic, UP and BNSF transport a large number of domestic containers, adding billions of dollars to the total value of intermodal cargo in the study area. Domestic intermodal cargo includes customers such as UPS, U.S. manufactured food products, and high value merchandise (e.g., cigarettes and alcohol).
Carload typically carries commodities such as grain and fertilizers, lumber, paper, scrap metal, coal, aggregates, chemicals, steel, machinery, automobiles, oil and petroleum products, and consumer products. Carload traffic represents about a third of the rail goods movement in the study area. Also, it is estimated that carload volumes represent less than a third of the overall rail market volume in the study area.
MULTI-COUNTY GOODS MOVEMENT ACTION PLAN
CHAPTER 3 – EXISTING CONDITIONS AND CONSTRAINTS
A31418
Wilbur Smith Associates
Page 3-16
Intermodal Facilities- Rail intermodal facilities allow for the transfer of containers from one mode to another, specifically the transfer of containers between rail and truck. The location of an intermodal yard, relative to the ports, has an impact on the amount of truck travel through the study area. There are two general types of intermodal terminals. On-dock rail terminals are typically single user facilities which are fed directly by an ocean vessel. While the inbound containers are significant, often time-sensitive cargo or containers destined to secondary markets will move to the common user intermodal facilities, off-dock. Off-dock terminals as noted earlier, create blocks of traffic, and the terminal operators build these blocks to match the markets the train will be serving. So all the Chicago freight is grouped together and separated from the Dallas or the Kansas City blocks of traffic. These two types of terminal facilities have some important safety and velocity differences. On-dock terminals have been very successful in reducing truck traffic in the study area. A truck carrying a port-generated container to an intermodal yard in or near a port (i.e., an on-dock or near-dock intermodal yard) will travel a shorter distance than one going to an inland facility (i.e., an off-dock intermodal yard). The efficiency of an intermodal yard has an impact on the overall productivity and velocity of the goods movement system. On-dock facilities typically are single-user facilities, and near-dock and off-dock facilities are typically common user facilities. Marine terminal on-dock rail yards have a different set of safety concerns than off-dock rail facilities. These safety issues are driven, in part, by the marine terminal workers. Even with this, the on-dock rail yards have made an enormous contribution to reduction of truck traffic on the highways. In 2005, over 1.6 million lifts (21% of the San Pedro Bay ports’ volume) were handled at the on-dock rail yards. Intermodal throughput capacity is also affected by the types of operations and practices utilized by the railroads operating the intermodal yards. For example, the UP uses a “wheeled operation” at its Intermodal Container Transfer Facility (ICTF), where almost every container is stored on a trailer chassis. While this lowers the cost of operations, it also limits the container throughput per acre. In comparison, the BNSF uses management techniques to increase throughput per acre at its Hobart facility, including stacking containers vertically, allocating containers (per carrier), and imposing fees on containers that stay longer than a day. The result is that throughput per acre per year is twice as high at Hobart18 as it is at ICTF.19 Commuter Rail Service - In addition to the freight trains, the network carriers 145 commuter trains
(Metrolink) on an average weekday. In addition, Metrolink commuter passenger rail services operate on the existing freight rail system. Metrolink is planning major increases in passenger trains using BNSF and UP mainlines in the study area; these increases will further strain capacity in the absence of any improvements. Metrolink trains are most frequent during the morning and afternoon weekday commute periods, and are oriented inbound to Los Angeles in the morning and outbound in the afternoon. About a third of Metrolink trains operate on BNSF and UP mainlines today. Amtrak long distance and Pacific Surfliner corridor trains also use BNSF and UP mainlines in the study area. Capacity is also a concern on publicly owned tracks. As noted, Metrolink dispatches about 100 freight rains on publicly owned tracks, and these trains share the track with the majority of Metrolink trains. As freight and passenger trains increase, capacity will increasingly become a concern for all users of these publicly owned tracks.
MULTI-COUNTY GOODS MOVEMENT ACTION PLAN
CHAPTER 3 – EXISTING CONDITIONS AND CONSTRAINTS
A31418
Wilbur Smith Associates
Page 3-17
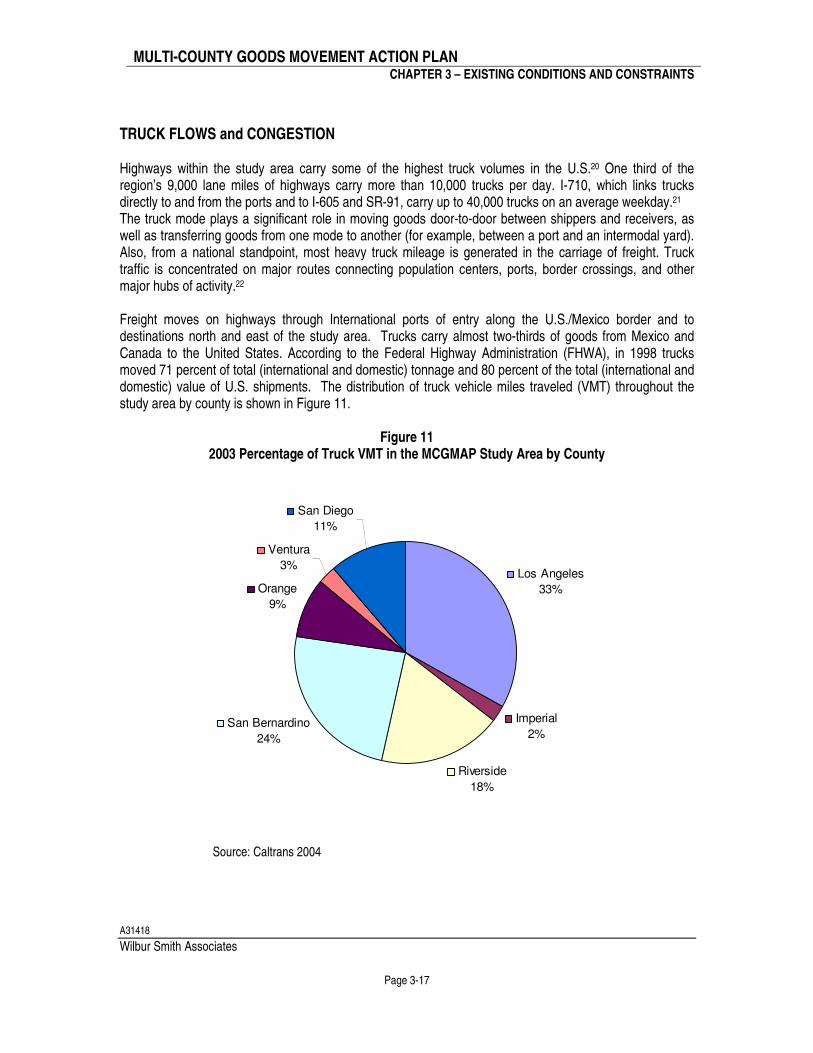
TRUCK FLOWS and CONGESTION Highways within the study area carry some of the highest truck volumes in the U.S.20 One third of the region’s 9,000 lane miles of highways carry more than 10,000 trucks per day. I-710, which links trucks directly to and from the ports and to I-605 and SR-91, carry up to 40,000 trucks on an average weekday.21 The truck mode plays a significant role in moving goods door-to-door between shippers and receivers, as well as transferring goods from one mode to another (for example, between a port and an intermodal yard). Also, from a national standpoint, most heavy truck mileage is generated in the carriage of freight. Truck traffic is concentrated on major routes connecting population centers, ports, border crossings, and other major hubs of activity.22 Freight moves on highways through International ports of entry along the U.S./Mexico border and to destinations north and east of the study area. Trucks carry almost two-thirds of goods from Mexico and Canada to the United States. According to the Federal Highway Administration (FHWA), in 1998 trucks moved 71 percent of total (international and domestic) tonnage and 80 percent of the total (international and domestic) value of U.S. shipments. The distribution of truck vehicle miles traveled (VMT) throughout the study area by county is shown in Figure 11.
Figure 11
2003 Percentage of Truck VMT in the MCGMAP Study Area by County
Los Angeles
33%
Imperial
2%
Riverside
18%
San Bernardino
24%
Orange
9%
Ventura
3%
San Diego
11%
Source: Caltrans 2004
MULTI-COUNTY GOODS MOVEMENT ACTION PLAN
CHAPTER 3 – EXISTING CONDITIONS AND CONSTRAINTS
A31418
Wilbur Smith Associates
Page 3-18
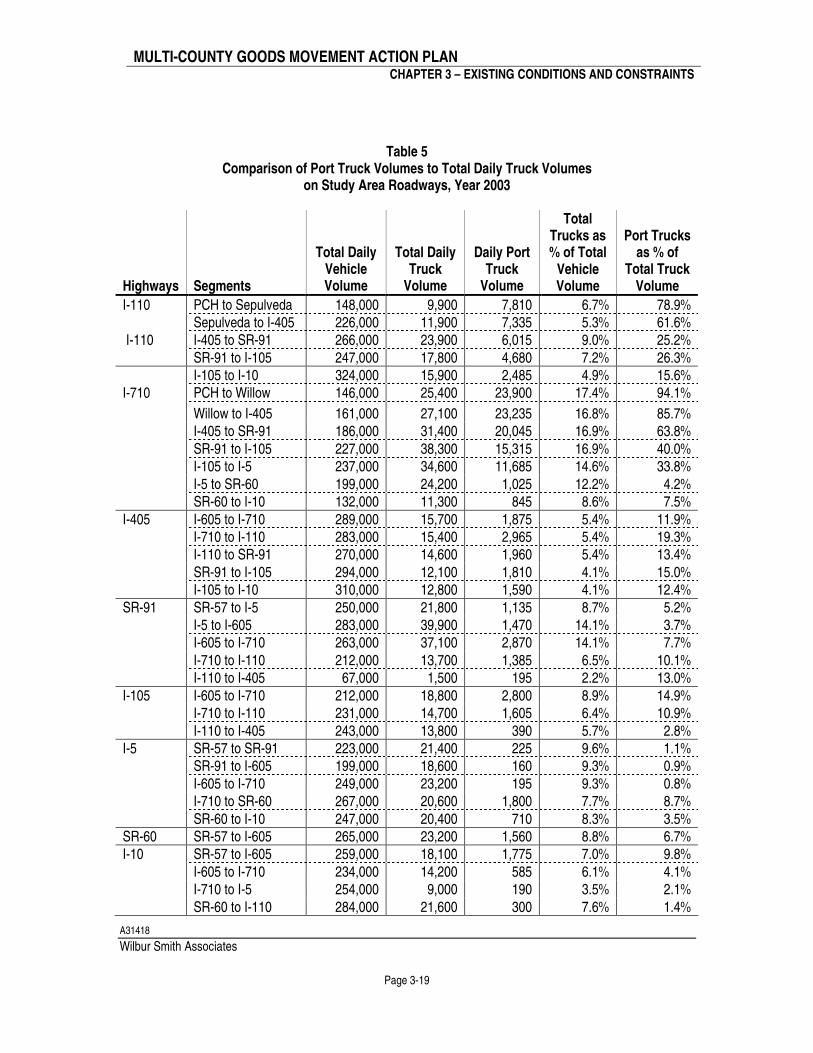
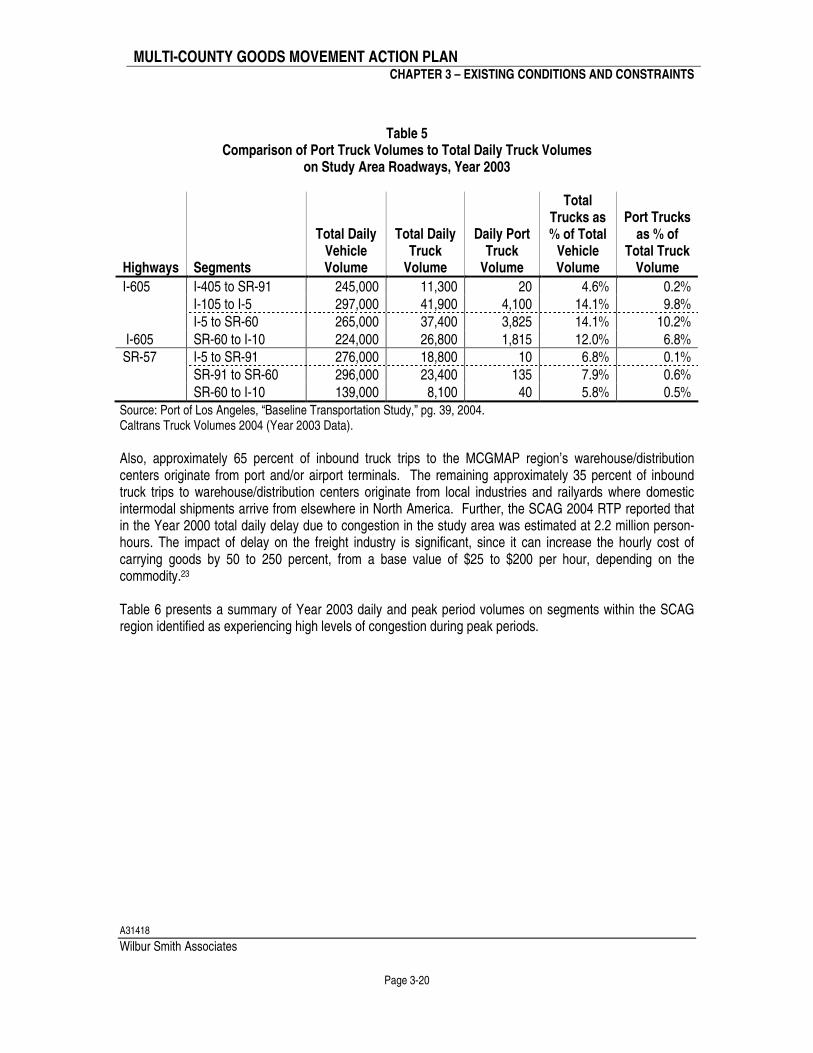
Table 5 shows the distribution of port-related (POLA and POLB) truck trips over the existing freeway system. As shown, I-710 is the primary and dominant corridor for port-specific traffic. There also appears to be an inverse relationship that exists between distance to the ports and port-related traffic. For example, the further north from the ports, the lower the amount of port-related traffic. While total truck traffic shows no significant trend in volumes or as a share of total vehicle traffic, the share of port-specific truck traffic declines sharply in terms of its share of total truck traffic further away from the ports. Chapter 6 contains a more detailed discussion of the role of secondary truck trips, including those truck trips not directly to or from the ports but also due to goods moving to or from the ports to inland warehouse and distribution centers. Lastly, data is not available to quantify secondary trips or to identify a relationship between number of port trips and number of secondary trips generated.
MULTI-COUNTY GOODS MOVEMENT ACTION PLAN
CHAPTER 3 – EXISTING CONDITIONS AND CONSTRAINTS
A31418
Wilbur Smith Associates
Page 3-19
Table 5
Comparison of Port Truck Volumes to Total Daily Truck Volumes on Study Area Roadways, Year 2003
Highways Segments
Total Daily Vehicle Volume
Total Daily Truck
Volume
Daily Port Truck
Volume
Total Trucks as % of Total
Vehicle Volume
Port Trucks as % of
Total Truck Volume
I-110 PCH to Sepulveda 148,000 9,900 7,810 6.7% 78.9% Sepulveda to I-405 226,000 11,900 7,335 5.3% 61.6% I-110 I-405 to SR-91 266,000 23,900 6,015 9.0% 25.2% SR-91 to I-105 247,000 17,800 4,680 7.2% 26.3% I-105 to I-10 324,000 15,900 2,485 4.9% 15.6% I-710 PCH to Willow 146,000 25,400 23,900 17.4% 94.1%
Willow to I-405 161,000 27,100 23,235 16.8% 85.7% I-405 to SR-91 186,000 31,400 20,045 16.9% 63.8% SR-91 to I-105 227,000 38,300 15,315 16.9% 40.0% I-105 to I-5 237,000 34,600 11,685 14.6% 33.8% I-5 to SR-60 199,000 24,200 1,025 12.2% 4.2% SR-60 to I-10 132,000 11,300 845 8.6% 7.5% I-405 I-605 to I-710 289,000 15,700 1,875 5.4% 11.9% I-710 to I-110 283,000 15,400 2,965 5.4% 19.3% I-110 to SR-91 270,000 14,600 1,960 5.4% 13.4% SR-91 to I-105 294,000 12,100 1,810 4.1% 15.0% I-105 to I-10 310,000 12,800 1,590 4.1% 12.4% SR-91 SR-57 to I-5 250,000 21,800 1,135 8.7% 5.2% I-5 to I-605 283,000 39,900 1,470 14.1% 3.7% I-605 to I-710 263,000 37,100 2,870 14.1% 7.7% I-710 to I-110 212,000 13,700 1,385 6.5% 10.1% I-110 to I-405 67,000 1,500 195 2.2% 13.0% I-105 I-605 to I-710 212,000 18,800 2,800 8.9% 14.9% I-710 to I-110 231,000 14,700 1,605 6.4% 10.9% I-110 to I-405 243,000 13,800 390 5.7% 2.8% I-5 SR-57 to SR-91 223,000 21,400 225 9.6% 1.1% SR-91 to I-605 199,000 18,600 160 9.3% 0.9% I-605 to I-710 249,000 23,200 195 9.3% 0.8% I-710 to SR-60 267,000 20,600 1,800 7.7% 8.7% SR-60 to I-10 247,000 20,400 710 8.3% 3.5% SR-60 SR-57 to I-605 265,000 23,200 1,560 8.8% 6.7% I-10 SR-57 to I-605 259,000 18,100 1,775 7.0% 9.8% I-605 to I-710 234,000 14,200 585 6.1% 4.1% I-710 to I-5 254,000 9,000 190 3.5% 2.1% SR-60 to I-110 284,000 21,600 300 7.6% 1.4%
MULTI-COUNTY GOODS MOVEMENT ACTION PLAN
CHAPTER 3 – EXISTING CONDITIONS AND CONSTRAINTS
A31418
Wilbur Smith Associates
Page 3-20
Table 5 Comparison of Port Truck Volumes to Total Daily Truck Volumes
on Study Area Roadways, Year 2003
Highways Segments
Total Daily Vehicle Volume
Total Daily Truck
Volume
Daily Port Truck
Volume
Total Trucks as % of Total
Vehicle Volume
Port Trucks as % of
Total Truck Volume
I-605 I-405 to SR-91 245,000 11,300 20 4.6% 0.2% I-105 to I-5 297,000 41,900 4,100 14.1% 9.8% I-5 to SR-60 265,000 37,400 3,825 14.1% 10.2% I-605 SR-60 to I-10 224,000 26,800 1,815 12.0% 6.8% SR-57 I-5 to SR-91 276,000 18,800 10 6.8% 0.1% SR-91 to SR-60 296,000 23,400 135 7.9% 0.6% SR-60 to I-10 139,000 8,100 40 5.8% 0.5%
Source: Port of Los Angeles, “Baseline Transportation Study,” pg. 39, 2004. Caltrans Truck Volumes 2004 (Year 2003 Data).
Also, approximately 65 percent of inbound truck trips to the MCGMAP region’s warehouse/distribution centers originate from port and/or airport terminals. The remaining approximately 35 percent of inbound truck trips to warehouse/distribution centers originate from local industries and railyards where domestic intermodal shipments arrive from elsewhere in North America. Further, the SCAG 2004 RTP reported that in the Year 2000 total daily delay due to congestion in the study area was estimated at 2.2 million person-hours. The impact of delay on the freight industry is significant, since it can increase the hourly cost of carrying goods by 50 to 250 percent, from a base value of $25 to $200 per hour, depending on the commodity.23
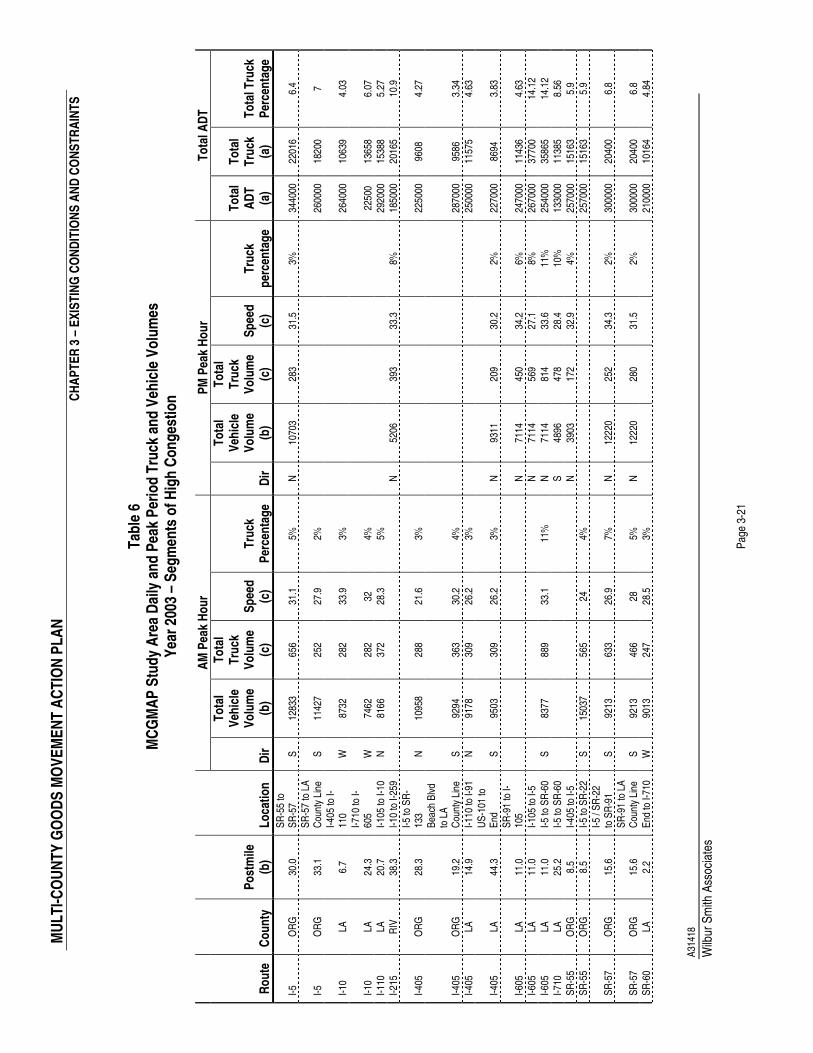
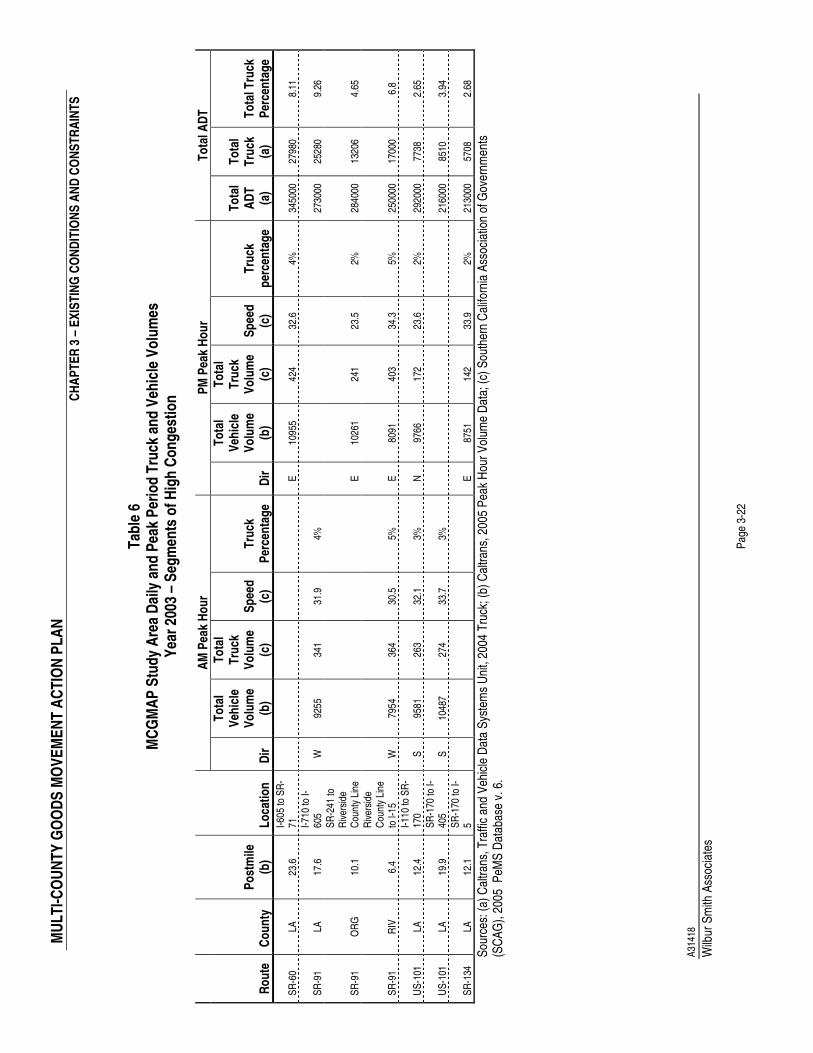
Table 6 presents a summary of Year 2003 daily and peak period volumes on segments within the SCAG region identified as experiencing high levels of congestion during peak periods.
MU
LT
I-C
OU
NT
Y G
OO
DS
MO
VE
ME
NT
AC
TIO
N P
LA
N
CH
AP
TE
R 3
– E
XIS
TIN
G C
ON
DIT
ION
S A
ND
CO
NS
TR
AIN
TS
A31
418
Wilb
ur S
mith
Ass
ocia
tes
Pag
e 3-
21
Ta b
le 6
M
CG
MA
P S
tud
y A
rea
Dai
ly a
nd
Pea
k P
erio
d T
ruck
an
d V
ehic
le V
olu
mes
Y
ear
2003
– S
egm
ents
of H
igh
Co
ng
esti
on
AM
Pea
k H
ou
r
PM
Pea
k H
ou
r T
ota
l AD
T
R
ou
te
Co
un
ty
P
ost
mile
(b
) L
oca
tio
n
Dir
To
tal
Veh
icle
V
olu
me
(b)
To
tal
Tru
ck
Vo
lum
e (c
) S
pee
d
(c)
Tru
ck
Per
cen
tag
e D
ir
To
tal
Veh
icle
V
olu
me
(b)
To
tal
Tru
ck
Vo
lum
e (c
) S
pee
d
(c)
Tru
ck
per
cen
tag
e
To
tal
AD
T
(a)
To
tal
Tru
ck
(a)
To
tal T
ruck
P
erce
nta
ge
I-5
OR
G
30.0
S
R-5
5 to
S
R-5
7 S
12
833
656
31.1
5%
N
10
703
283
31.5
3%
34
4000
22
016
6.4
I-5
OR
G
33.1
S
R-5
7 to
LA
C
ount
y Li
ne
S
1142
7 25
2 27
.9
2%
26
0000
18
200
7
I-10
LA
6.7
I-405
to I-
110
W
8732
28
2 33
.9
3%
26
4000
10
639
4.03
I-10
LA
24.3
I-7
10 to
I-60
5 W
74
62
282
32
4%
22
500
1365
8 6.
07
I-110
LA
20
.7
I-105
to I-
10
N
8166
37
2 28
.3
5%
29
2000
15
388
5.27
I-2
15
RIV
38
.3
I-10
to I-
259
N
52
06
393
33.3
8%
18
5000
20
165
10.9
I-405
O
RG
28
.3
I-5 to
SR
-13
3 N
10
958
288
21.6
3%
2250
00
9608
4.
27
I-405
O
RG
19
.2
Bea
ch B
lvd
to L
A
Cou
nty
Line
S
92
94
363
30.2
4%
2870
00
9586
3.
34
I-405
LA
14
.9
I-110
to I-
91
N
9178
30
9 26
.2
3%
25
0000
11
575
4.63
I-405
LA
44
.3
US
-101
to
End
S
95
03
309
26.2
3%
N
93
11
209
30.2
2%
22
7000
86
94
3.83
I-605
LA
11
.0
SR
-91
to I-
105
N
71
14
450
34.2
6%
24
7000
11
436
4.63
I-6
05
LA
11.0
I-1
05 to
I-5
N
71
14
569
27.1
8%
26
7000
37
700
14.1
2 I-6
05
LA
11.0
I-5
to S
R-6
0 S
83
77
889
33.1
11
%
N
7114
81
4 33
.6
11%
25
4000
35
865
14.1
2 I-7
10
LA
25.2
I-5
to S
R-6
0
S
4896
47
8 28
.4
10%
13
3000
11
385
8.56
S
R-5
5 O
RG
8.
5 I-4
05 to
I-5
N
39
03
172
32.9
4%
25
7000
15
163
5.9
SR
-55
OR
G
8.5
I-5 to
SR
-22
S
1503
7 56
5 24
4%
2570
00
1516
3 5.
9
SR
-57
OR
G
15.6
I-5
/ S
R-2
2 to
SR
-91
S
9213
63
3 26
.9
7%
N
1222
0 25
2 34
.3
2%
3000
00
2040
0 6.
8
SR
-57
OR
G
15.6
S
R-9
1 to
LA
C
ount
y Li
ne
S
9213
46
6 28
5%
N
12
220
280
31.5
2%
30
0000
20
400
6.8
SR
-60
LA
2.2
End
to I-
710
W
9013
24
7 28
.5
3%
21
0000
10
164
4.84
MU
LT
I-C
OU
NT
Y G
OO
DS
MO
VE
ME
NT
AC
TIO
N P
LA
N
CH
AP
TE
R 3
– E
XIS
TIN
G C
ON
DIT
ION
S A
ND
CO
NS
TR
AIN
TS
A31
418
Wilb
ur S
mith
Ass
ocia
tes
Pag
e 3-
22
Ta b
le 6
M
CG
MA
P S
tud
y A
rea
Dai
ly a
nd
Pea
k P
erio
d T
ruck
an
d V
ehic
le V
olu
mes
Y
ear
2003
– S
egm
ents
of H
igh
Co
ng
esti
on
AM
Pea
k H
ou
r
PM
Pea
k H
ou
r T
ota
l AD
T
R
ou
te
Co
un
ty
P
ost
mile
(b
) L
oca
tio
n
Dir
To
tal
Veh
icle
V
olu
me
(b)
To
tal
Tru
ck
Vo
lum
e (c
) S
pee
d
(c)
Tru
ck
Per
cen
tag
e D
ir
To
tal
Veh
icle
V
olu
me
(b)
To
tal
Tru
ck
Vo
lum
e (c
) S
pee
d
(c)
Tru
ck
per
cen
tag
e
To
tal
AD
T
(a)
To
tal
Tru
ck
(a)
To
tal T
ruck
P
erce
nta
ge
SR
-60
LA
23.6
I-6
05 to
SR
-71
E
1095
5 42
4 32
.6
4%
3450
00
2798
0 8.
11
SR
-91
LA
17.6
I-7
10 to
I-60
5 W
92
55
341
31.9
4%
2730
00
2528
0 9.
26
SR
-91
OR
G
10.1
SR
-241
to
Riv
ersi
de
Cou
nty
Line
E
1026
1 24
1 23
.5
2%
2840
00
1320
6 4.
65
SR
-91
RIV
6.
4
Riv
ersi
de
Cou
nty
Line
to
I-15
W
79
54
364
30.5
5%
E
80
91
403
34.3
5%
25
0000
17
000
6.8
US
-101
LA
12
.4
I-110
to S
R-
170
S
9581
26
3 32
.1
3%
N
9766
17
2 23
.6
2%
2920
00
7738
2.
65
US
-101
LA
19
.9
SR
-170
to I-
405
S
1048
7 27
4 33
.7
3%
21
6000
85
10
3.94
SR
-134
LA
12
.1
SR
-170
to I-
5
E
8751
14
2 33
.9
2%
2130
00
5708
2.
68
Sou
rces
: (a)
Cal
tran
s, T
raffi
c an
d V
ehic
le D
ata
Sys
tem
s U
nit,
2004
Tru
ck; (
b) C
altr
ans,
200
5 P
eak
Hou
r V
olum
e D
ata;
(c)
Sou
ther
n C
alifo
rnia
Ass
ocia
tion
of G
over
nmen
ts
(SC
AG
), 2
005
PeM
S D
atab
ase
v. 6
.
MULTI-COUNTY GOODS MOVEMENT ACTION PLAN
CHAPTER 3 – EXISTING CONDITIONS AND CONSTRAINTS
A31418
Wilbur Smith Associates
Page 3-23
Table 6 summarizes the following conditions during periods of high congestion: � Both I-710 and I-605 between I-5 and SR-60 in Los Angeles County carry more than 35,000 trucks,
representing 14 percent of total daily traffic on these segments. � I-605 between I-5 and SR-60 in Los Angeles County, with 11 percent truck traffic, represents the highest
truck percentage in both the AM and PM peak hour. � I-710 southbound between I-5 and SR-60 in Los Angeles County, with 10 percent truck traffic,
represents the second highest truck percentage in the PM peak hour. While congestion and delay affect the everyday lives of commuters in the study area, they also have a significant impact on goods movement. Eighteen percent of all truck volumes on the freeways within the study area experience delay due to congestion, which results in an increase in the cost of transporting goods by 50 to 250 percent.24 Goods rely substantially on trucking to connect warehouses, distribution facilities, intermodal facilities, and other businesses. For the most part, these facilities and businesses operate during daytime hours, although some operate during the night. Daytime operations cause conflicts between everyday commuter traffic and truck traffic. This conflict also creates a perception that goods movement is the sole contributor to congestion and delays, given that the bulk of truck traffic does not occur during the morning and early evening peak commute hours and that approximately two thirds of trucks traffic occurs during off-peak hours. Congestion and delays on the highway system cannot be fully addressed without including strategies to reduce commuter traffic congestion as well as truck traffic. Automobile drivers and passengers are often concerned about being involved in a traffic accident with a truck. These concerns may affect the implementation of goods movement and trade initiatives in the study area. Truck accidents result in a higher probability of damage to the other vehicle and injury to its occupants. Of all accidents involving large trucks, 84 percent of fatalities are passengers in vehicles other than the truck.25 In the same study of all large truck collision incidents, 50.7% of these events were caused by the driver of the passenger vehicle. Between 2000 and 2003, the number of fatalities in accidents involving a truck increased by 17 percent in the study area.26 Moreover, an accident involving a truck impacts system traffic flow more than an accident involving passenger vehicles. Also, the lack of truck inspection and enforcement facilities within the study area presents a further constraint to addressing truck safety. Caltrans operates 37 truck inspection facilities in California.27 Six of these facilities operate within the study area - Los Angeles County, Castaic (I-5); San Bernardino County, Cajon (I-15); Riverside County, Blythe (I-10); Riverside County, Desert Hills (I-10); Orange County, Peralta (SR-91); and Ventura County, Conejo (US-101). These facilities are located near the borders of the study area and inspect trucks entering or exiting the region. There are no inspection facilities within the study area that inspect the intra-regional truck travel. In addition, trucks contribute to pavement deterioration. While an 80,000 pound truck weighs as much as 20 automobiles, it has the same impact on pavement condition as 9,600 automobiles.28 Currently trucks pay truck weight fees that contribute toward a portion of growing road maintenance costs, these revenues do not contribute to congestion relief.
MULTI-COUNTY GOODS MOVEMENT ACTION PLAN
CHAPTER 3 – EXISTING CONDITIONS AND CONSTRAINTS
A31418
Wilbur Smith Associates
Page 3-24
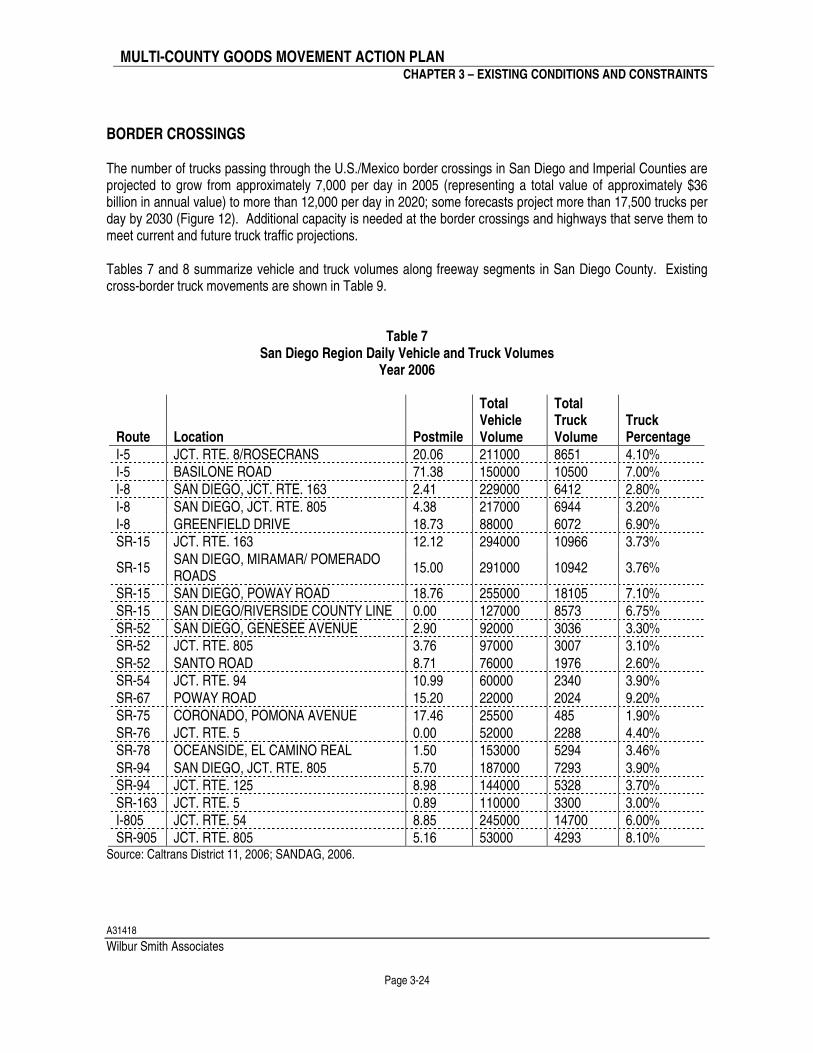
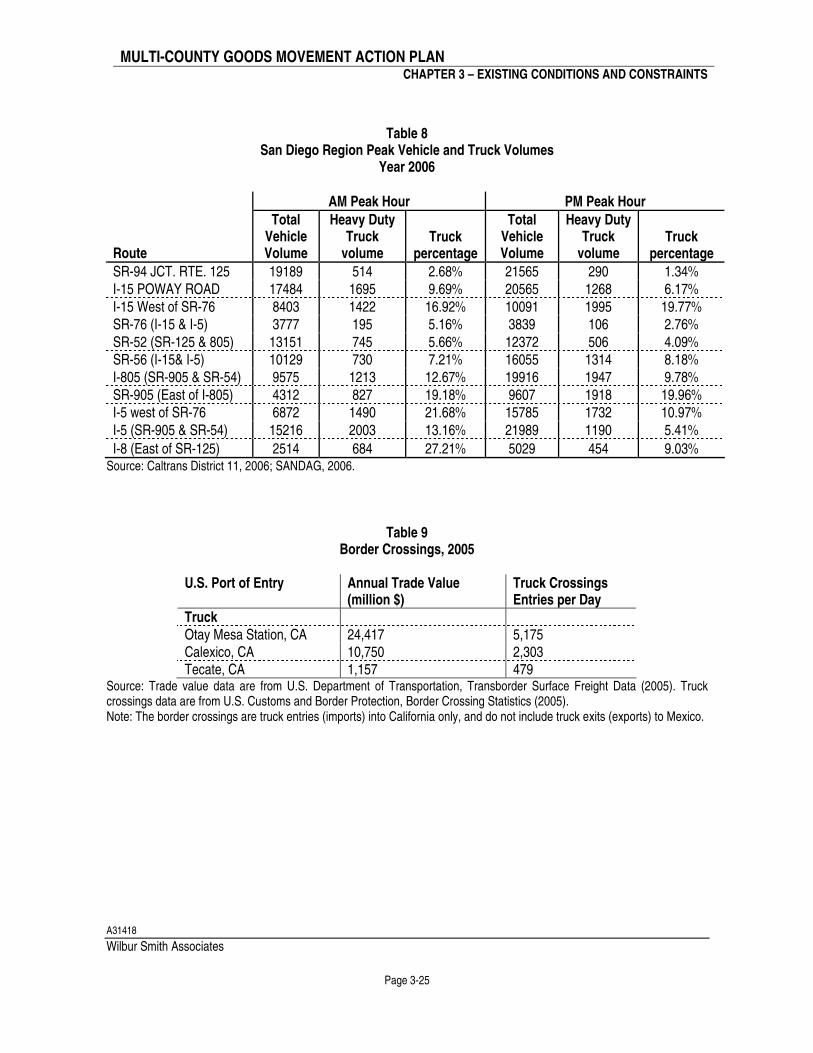
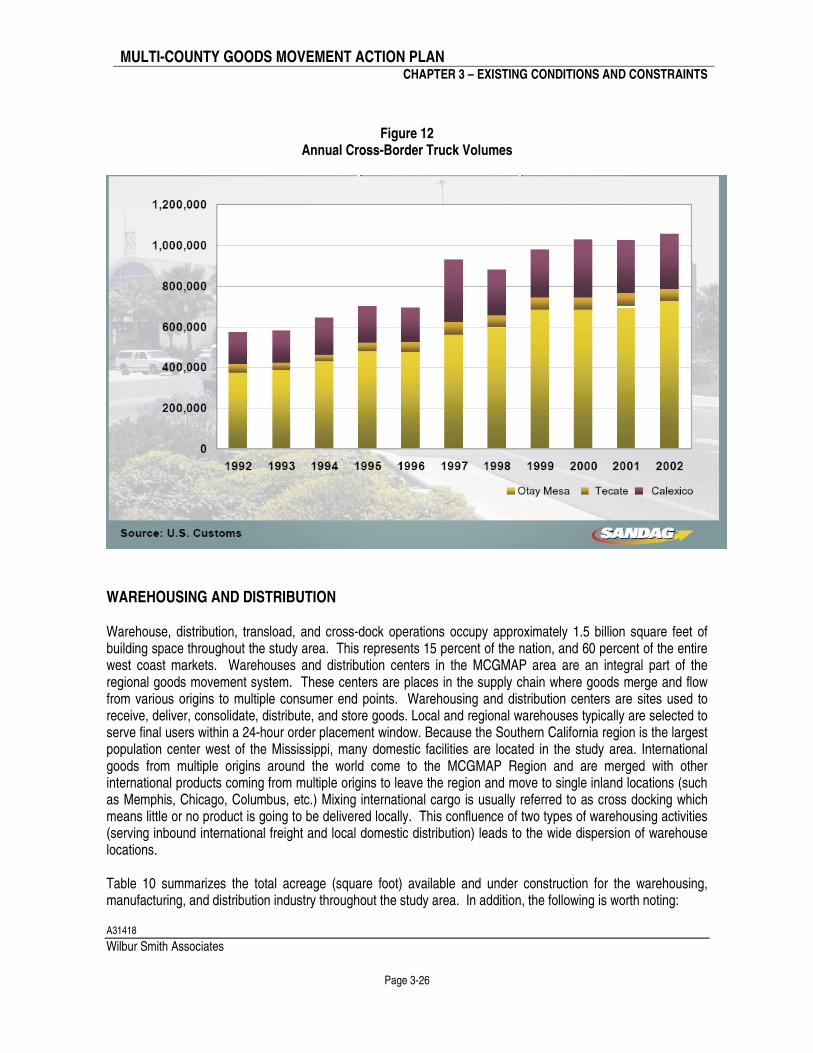
BORDER CROSSINGS The number of trucks passing through the U.S./Mexico border crossings in San Diego and Imperial Counties are projected to grow from approximately 7,000 per day in 2005 (representing a total value of approximately $36 billion in annual value) to more than 12,000 per day in 2020; some forecasts project more than 17,500 trucks per day by 2030 (Figure 12). Additional capacity is needed at the border crossings and highways that serve them to meet current and future truck traffic projections. Tables 7 and 8 summarize vehicle and truck volumes along freeway segments in San Diego County. Existing cross-border truck movements are shown in Table 9.
Table 7 San Diego Region Daily Vehicle and Truck Volumes
Year 2006
Route Location Postmile
Total Vehicle Volume
Total Truck Volume
Truck Percentage
I-5 JCT. RTE. 8/ROSECRANS 20.06 211000 8651 4.10% I-5 BASILONE ROAD 71.38 150000 10500 7.00% I-8 SAN DIEGO, JCT. RTE. 163 2.41 229000 6412 2.80% I-8 SAN DIEGO, JCT. RTE. 805 4.38 217000 6944 3.20% I-8 GREENFIELD DRIVE 18.73 88000 6072 6.90% SR-15 JCT. RTE. 163 12.12 294000 10966 3.73%
SR-15 SAN DIEGO, MIRAMAR/ POMERADO ROADS
15.00 291000 10942 3.76%
SR-15 SAN DIEGO, POWAY ROAD 18.76 255000 18105 7.10% SR-15 SAN DIEGO/RIVERSIDE COUNTY LINE 0.00 127000 8573 6.75% SR-52 SAN DIEGO, GENESEE AVENUE 2.90 92000 3036 3.30% SR-52 JCT. RTE. 805 3.76 97000 3007 3.10% SR-52 SANTO ROAD 8.71 76000 1976 2.60% SR-54 JCT. RTE. 94 10.99 60000 2340 3.90% SR-67 POWAY ROAD 15.20 22000 2024 9.20% SR-75 CORONADO, POMONA AVENUE 17.46 25500 485 1.90% SR-76 JCT. RTE. 5 0.00 52000 2288 4.40% SR-78 OCEANSIDE, EL CAMINO REAL 1.50 153000 5294 3.46% SR-94 SAN DIEGO, JCT. RTE. 805 5.70 187000 7293 3.90% SR-94 JCT. RTE. 125 8.98 144000 5328 3.70% SR-163 JCT. RTE. 5 0.89 110000 3300 3.00% I-805 JCT. RTE. 54 8.85 245000 14700 6.00% SR-905 JCT. RTE. 805 5.16 53000 4293 8.10%
Source: Caltrans District 11, 2006; SANDAG, 2006.
MULTI-COUNTY GOODS MOVEMENT ACTION PLAN
CHAPTER 3 – EXISTING CONDITIONS AND CONSTRAINTS
A31418
Wilbur Smith Associates
Page 3-25
Table 8 San Diego Region Peak Vehicle and Truck Volumes
Year 2006
AM Peak Hour PM Peak Hour
Route
Total Vehicle Volume
Heavy Duty Truck
volume Truck
percentage
Total Vehicle Volume
Heavy Duty Truck
volume Truck
percentage SR-94 JCT. RTE. 125 19189 514 2.68% 21565 290 1.34% I-15 POWAY ROAD 17484 1695 9.69% 20565 1268 6.17% I-15 West of SR-76 8403 1422 16.92% 10091 1995 19.77% SR-76 (I-15 & I-5) 3777 195 5.16% 3839 106 2.76% SR-52 (SR-125 & 805) 13151 745 5.66% 12372 506 4.09% SR-56 (I-15& I-5) 10129 730 7.21% 16055 1314 8.18% I-805 (SR-905 & SR-54) 9575 1213 12.67% 19916 1947 9.78% SR-905 (East of I-805) 4312 827 19.18% 9607 1918 19.96% I-5 west of SR-76 6872 1490 21.68% 15785 1732 10.97% I-5 (SR-905 & SR-54) 15216 2003 13.16% 21989 1190 5.41%
I-8 (East of SR-125) 2514 684 27.21% 5029 454 9.03% Source: Caltrans District 11, 2006; SANDAG, 2006.
Table 9 Border Crossings, 2005
U.S. Port of Entry Annual Trade Value
(million $) Truck Crossings Entries per Day
Truck Otay Mesa Station, CA 24,417 5,175 Calexico, CA 10,750 2,303 Tecate, CA 1,157 479
Source: Trade value data are from U.S. Department of Transportation, Transborder Surface Freight Data (2005). Truck crossings data are from U.S. Customs and Border Protection, Border Crossing Statistics (2005). Note: The border crossings are truck entries (imports) into California only, and do not include truck exits (exports) to Mexico.
MULTI-COUNTY GOODS MOVEMENT ACTION PLAN
CHAPTER 3 – EXISTING CONDITIONS AND CONSTRAINTS
A31418
Wilbur Smith Associates
Page 3-26
Figure 12 Annual Cross-Border Truck Volumes
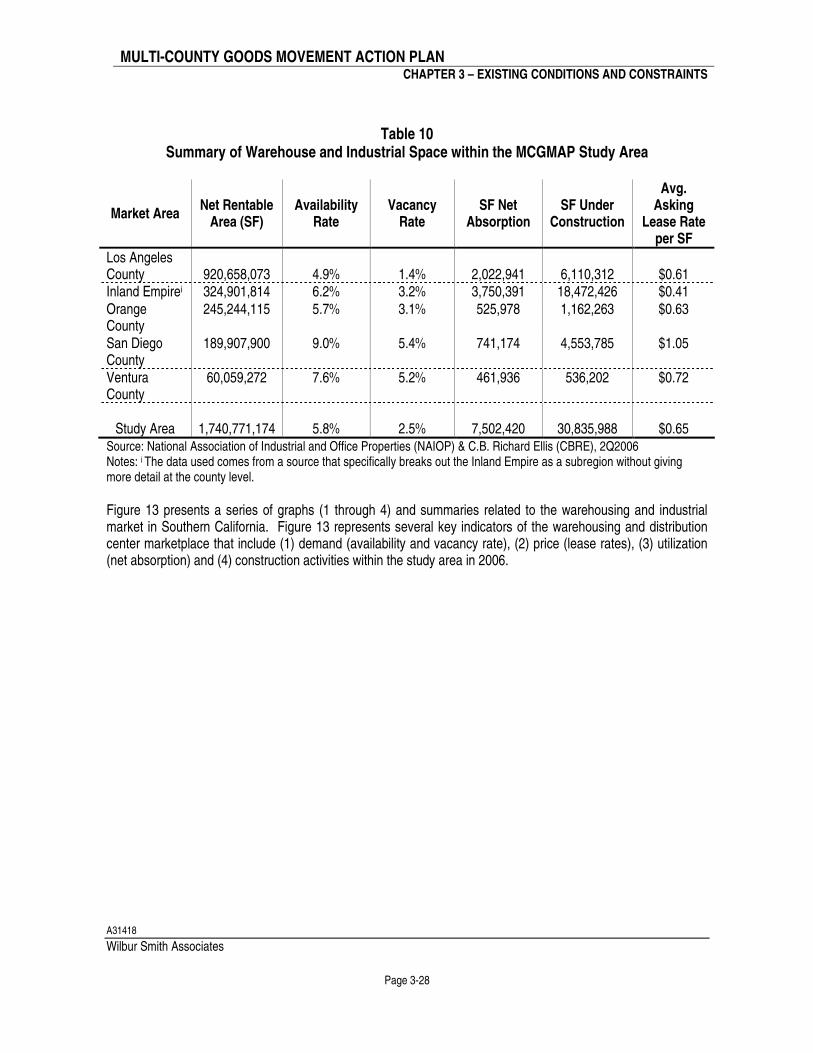
WAREHOUSING AND DISTRIBUTION Warehouse, distribution, transload, and cross-dock operations occupy approximately 1.5 billion square feet of building space throughout the study area. This represents 15 percent of the nation, and 60 percent of the entire west coast markets. Warehouses and distribution centers in the MCGMAP area are an integral part of the regional goods movement system. These centers are places in the supply chain where goods merge and flow from various origins to multiple consumer end points. Warehousing and distribution centers are sites used to receive, deliver, consolidate, distribute, and store goods. Local and regional warehouses typically are selected to serve final users within a 24-hour order placement window. Because the Southern California region is the largest population center west of the Mississippi, many domestic facilities are located in the study area. International goods from multiple origins around the world come to the MCGMAP Region and are merged with other international products coming from multiple origins to leave the region and move to single inland locations (such as Memphis, Chicago, Columbus, etc.) Mixing international cargo is usually referred to as cross docking which means little or no product is going to be delivered locally. This confluence of two types of warehousing activities (serving inbound international freight and local domestic distribution) leads to the wide dispersion of warehouse locations. Table 10 summarizes the total acreage (square foot) available and under construction for the warehousing, manufacturing, and distribution industry throughout the study area. In addition, the following is worth noting:
MULTI-COUNTY GOODS MOVEMENT ACTION PLAN
CHAPTER 3 – EXISTING CONDITIONS AND CONSTRAINTS
A31418
Wilbur Smith Associates
Page 3-27
� The greater Los Angeles County area is attractive to warehousing and distribution centers due to its
proximity to the ports and consumers, the large labor force available, and the existing transportation centers and hubs.
� In Orange County, industrial land is frequently redeveloped for retail activities. Older warehousing and distribution facilities are in the relatively more expensive northern parts of the county, due to proximity to the seaports and current consumers. New warehouse facilities are being built further to the south, where more land is available at relatively lower costs.
� In Ventura County there are very limited warehouse and distribution facilities, relative to the other counties in the study area. The key contributing factor is the focus on agricultural land uses in the county, as well as relatively high housing costs for workers. The Ventura market is relatively stable with slightly declining vacancy levels and moderate increases in available space. The development of new industrial space has regained momentum.
� The Inland Empire (essentially defined as San Bernardino and Riverside Counties) has an especially strong warehouse and industrial market. This subarea is attractive to warehousing and distribution centers because it has areas of land available for large (one million plus square feet) facilities -- something that is in short supply throughout other portions of the MCGMAP study area.
� Warehousing and industrial land uses in San Diego County are concentrated at the border region. These facilities range in sizes that are typically 50,000 square feet.
The five main reasons that firms have located their warehouses and distribution centers in the MCGMAP study area are:
� Access to the two largest ports in the nation that are within the study area which is a strategic advantage point for unloading goods arriving from Asia for distribution around the U.S.
� Access to other Western U.S. cities such as Las Vegas and Phoenix and multiple transportation modes and distribution facilities makes these areas a desirable logistics hub.
� Access to a substantial local market of an estimated 17 million people, making it arguably one of the largest consumer markets in the country.
� The study area represents the third largest manufacturing center in the nation.29 � Currently the warehousing, distribution, and manufacturing industry in the study area includes
approximately 1.7 billion square feet (SF) of space, with an additional 30 million SF under construction as of the second quarter of 2006.
MULTI-COUNTY GOODS MOVEMENT ACTION PLAN
CHAPTER 3 – EXISTING CONDITIONS AND CONSTRAINTS
A31418
Wilbur Smith Associates
Page 3-28
Table 10 Summary of Warehouse and Industrial Space within the MCGMAP Study Area
Market Area Net Rentable
Area (SF) Availability
Rate Vacancy
Rate SF Net
Absorption SF Under
Construction
Avg. Asking
Lease Rate per SF
Los Angeles County
920,658,073
4.9%
1.4%
2,022,941
6,110,312
$0.61
Inland Empirei 324,901,814 6.2% 3.2% 3,750,391 18,472,426 $0.41 Orange County
245,244,115 5.7% 3.1% 525,978 1,162,263 $0.63
San Diego County
189,907,900 9.0% 5.4% 741,174 4,553,785 $1.05
Ventura County
60,059,272 7.6% 5.2% 461,936 536,202 $0.72
Study Area
1,740,771,174
5.8%
2.5%
7,502,420
30,835,988
$0.65
Source: National Association of Industrial and Office Properties (NAIOP) & C.B. Richard Ellis (CBRE), 2Q2006 Notes: i The data used comes from a source that specifically breaks out the Inland Empire as a subregion without giving more detail at the county level.
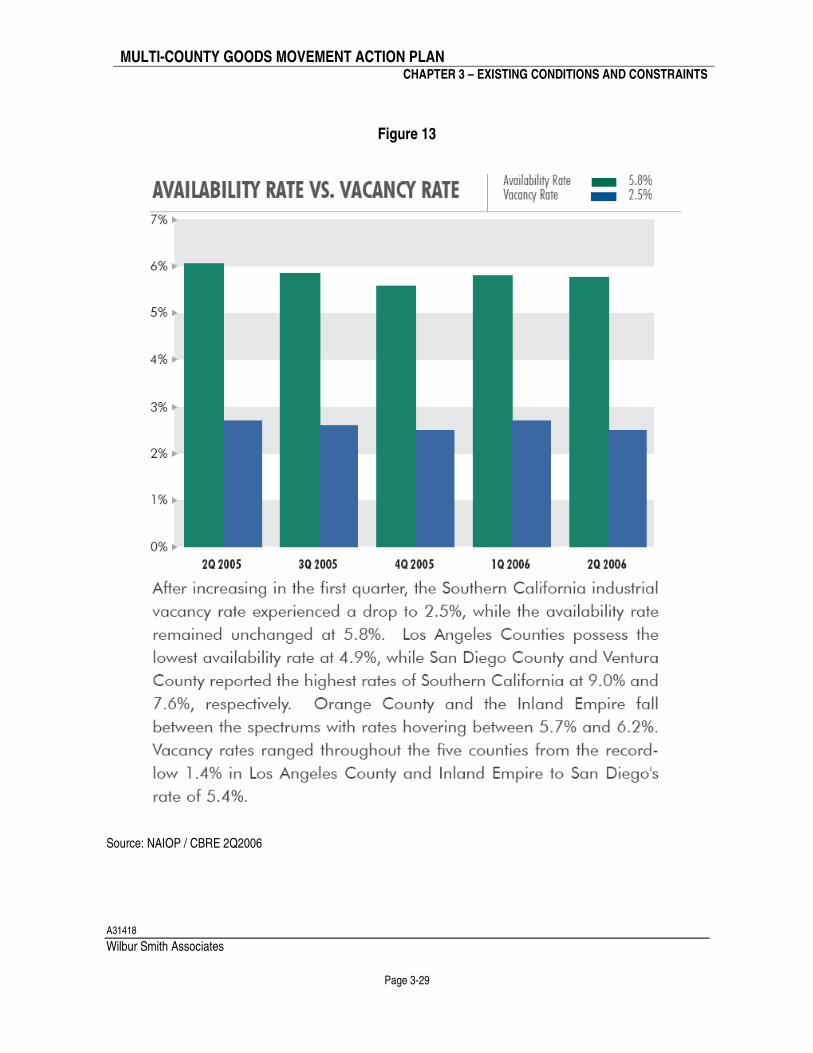
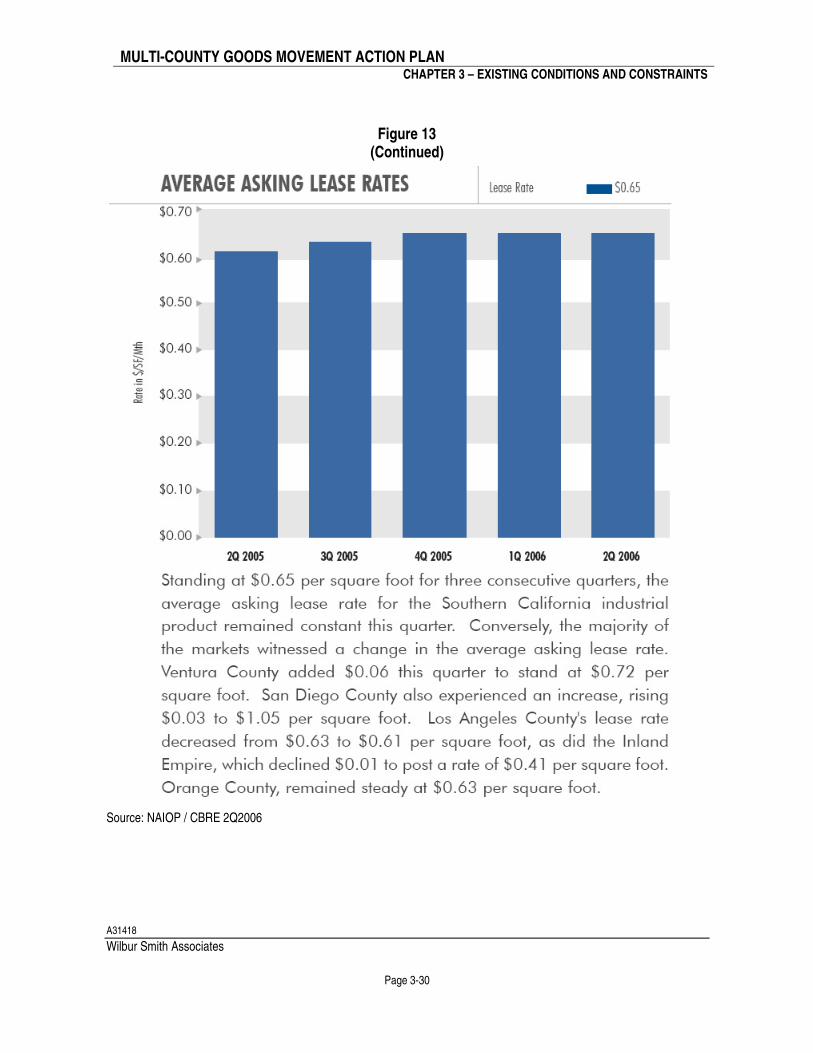
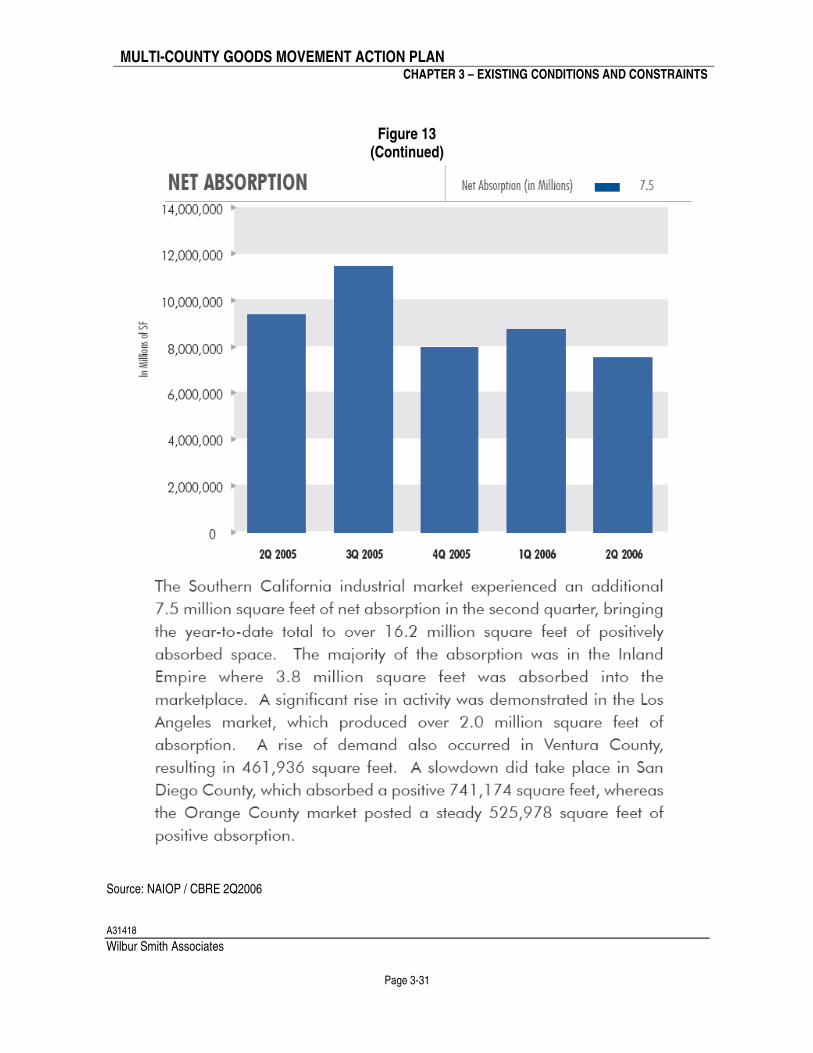
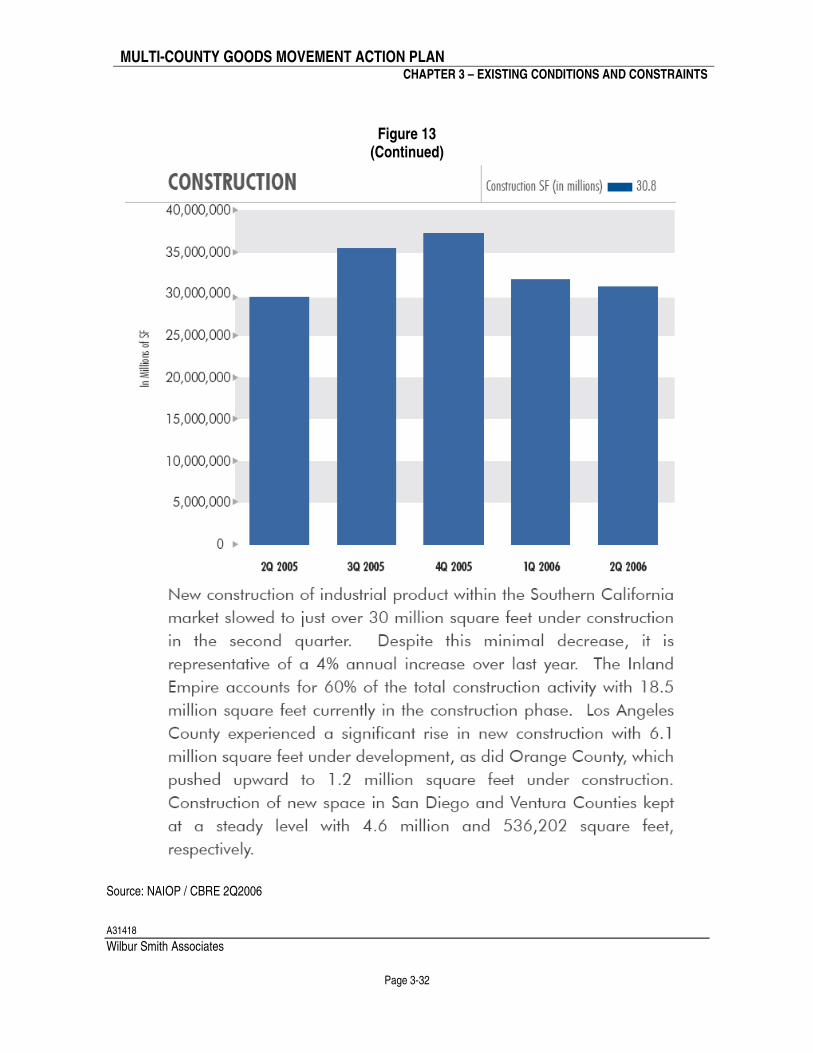
Figure 13 presents a series of graphs (1 through 4) and summaries related to the warehousing and industrial market in Southern California. Figure 13 represents several key indicators of the warehousing and distribution center marketplace that include (1) demand (availability and vacancy rate), (2) price (lease rates), (3) utilization (net absorption) and (4) construction activities within the study area in 2006.
MULTI-COUNTY GOODS MOVEMENT ACTION PLAN
CHAPTER 3 – EXISTING CONDITIONS AND CONSTRAINTS
A31418
Wilbur Smith Associates
Page 3-29
Figure 13
Source: NAIOP / CBRE 2Q2006
MULTI-COUNTY GOODS MOVEMENT ACTION PLAN
CHAPTER 3 – EXISTING CONDITIONS AND CONSTRAINTS
A31418
Wilbur Smith Associates
Page 3-30
Figure 13 (Continued)
Source: NAIOP / CBRE 2Q2006
MULTI-COUNTY GOODS MOVEMENT ACTION PLAN
CHAPTER 3 – EXISTING CONDITIONS AND CONSTRAINTS
A31418
Wilbur Smith Associates
Page 3-31
Figure 13 (Continued)
Source: NAIOP / CBRE 2Q2006
MULTI-COUNTY GOODS MOVEMENT ACTION PLAN
CHAPTER 3 – EXISTING CONDITIONS AND CONSTRAINTS
A31418
Wilbur Smith Associates
Page 3-32
Figure 13 (Continued)
Source: NAIOP / CBRE 2Q2006
MULTI-COUNTY GOODS MOVEMENT ACTION PLAN
CHAPTER 3 – EXISTING CONDITIONS AND CONSTRAINTS
A31418
Wilbur Smith Associates
Page 3-33
In addition, the warehouse sector is expected to remain strong, growing from 1.5 billion square feet of warehouse floor space in 2005 to over 4.5 billion square feet by 2030. This tripling of warehouse space needs is based on the assumption that international trade through the San Pedro Bay ports will triple from 2005 to 2030 to 42.5 million TEUs. The above trend is also based on the assumption that the demand is directly correlated to the number of TEUs through the ports. If the demand is directly correlated to the growth in population, the total warehouse space will increase to 1.87 billion sq ft. by 2030 due to population growth rate of 23%. Chapter 4 and Tech Memo 4a contain more information about warehousing growth and trends. Further, the locations chosen by private sector developers for land uses associated with goods movement, specifically warehouses and distribution centers are shifting away from the traditional locations close to the ports and intermodal rail yards. This practice is impacting communities located throughout the study area and, in particular, to the east of Los Angeles. Increased truck travel to reach these more distant locations causes increased emissions and congestion. Moreover, these new warehouse and distribution facilities are appearing in high growth real estate markets where residential and other commercial development demands are growing. The result is a conflict between residential and goods movement uses. Therefore, the same concerns raised by communities around existing goods movement-intensive land uses (increased truck traffic, intrusion on neighborhoods and schools, noise, congestion, emissions, and safety) are emerging in new areas.
REGIONAL ISSUES AND CONSTRAINTS
Community Concerns about Environmental Impacts The impacts of goods movement on the environment, quality of life and the resulting community concerns about these impacts is a major constraint to continued goods movement activities. Public health and other environmental impacts present a significant challenge to the future development of the goods movement system. Over time, the focus on types of air quality impacts has changed. For much of the 20th century, concerns were generally about the visual impacts. In recent years, as the visual nature of air pollution (smog) was reduced, concern shifted to the health impacts associated with various pollutants. Research conducted by the Keck School of Medicine at the University of Southern California (USC) indicates that the combination of gases and fine particles in transportation exhaust, especially diesel fuels, affects lung function and contributes to arterial thickening, birth defects, and low birth weights.30 Data also indicates that the closer one lives to pollution sources, such as the ports, intermodal yards, or major freeways, the higher the risk. For example, the increased incidences of cancer and of asthma in children are shown to be related by proximity to pollution sources. Furthermore, the study area is required to demonstrate attainment with National Ambient Air Quality Standards (NAAQS) established per federal mandate. The U.S. EPA routinely evaluates air quality nationwide and periodically updates or establishes new standards (NAAQS). On April 15, 2004, EPA implemented an 8-hour ozone NAAQS (supplanting a previous 1-hour ozone standard), for which the South Coast Air Basin is to demonstrate attainment by 2021. These obligations cannot be achieved without making significant investments in environmental mitigation as well as a more focused effort to reduce the level of emissions from goods movement activities and other sources. The widespread dissemination of this information has raised awareness and increased concern within affected neighborhoods. Environmental groups have forced a significant slowdown in port development in recent years. For example, the proposed Pier J expansion at the Port of Long Beach was halted due to concerns about the environmental document. Also, improvements to the China Shipping Terminal at the Port of Los Angeles were
MULTI-COUNTY GOODS MOVEMENT ACTION PLAN
CHAPTER 3 – EXISTING CONDITIONS AND CONSTRAINTS
A31418
Wilbur Smith Associates
Page 3-34
delayed because of a lawsuit by the Natural Resources Defense Council (NRDC). Community-based resistance has also affected plans to address the existing levels of highway congestion. There have also been some successful efforts working with local communities. For example, after nine months of deliberations by a broad-based group appointed by I-710 corridor communities and the I-710 Oversight Policy Committee (OPC) (collectively known as the Tier 2 Committee), a consensus emerged.31 This consensus also involved community-level committees (known as Tier 1 Committees) consisting of the most directly impacted communities in the corridor. The chairs of the Tier 1 Committees were also represented on the Tier 2 Committee, along with a representative named by each City Council in the remaining corridor cities.32 The committee recognized that something must be done to address the current congestion and design of the I-710 freeway, and that the hybrid design concept presented could accomplish maximum build-out in a manner that reflected the Tier 1 Committee’s concerns and recommendations for their communities.33 The experience and results of the I-710/Major Corridor Study show that consensus can be achieved when the community is involved at the local level. The consensus achieved on the I-710 hybrid alternative is a major success story and is proof that responsible agencies and communities can resolve differences and find a common agenda to move forward. The efforts of the I-710 / Major Corridor Study were led by Metro and the Gateway Cities Council of Governments. The MCGMAP will require similar success stories. Nevertheless, concerns over the negative health impacts of diesel emissions potentially threaten the viability of the I-710 improvements and other goods movement projects, including plans to expand rail intermodal capacity, airport capacity, and the development of warehouse and distribution facilities. Also, the impacts associated with at-grade crossings include noise, congestion, emissions, and safety are still a major concern for some communities. While communities and transportation agencies have worked hard to address at-grade crossing issues, in conjunction with efforts to encourage diversion from truck to rail, there is a significant shortfall in funding to fully implement existing plans. The Alameda Corridor project was successful in eliminating conflicts at 200 at-grade crossings between downtown Los Angeles and the ports. The project continues to reduce accidents, emissions, and congestion, as well as improve safety for the traveling public. There are existing efforts to eliminate at-grade crossings east of Los Angeles. However, the amount of federal funding provided accounts for only 23 percent of what was requested. Alameda-Corridor East related projects, including specific grade separations, received approximately $212 million of the estimated $900 million requested as part of the most recent national transportation reauthorization bill. This is arguably a national issue given that the freight traffic on the rail system is headed for destinations throughout the nation. The shortfall in funding for grade separation projects has implications for the safety of the communities along the rail freight corridors. Furthermore, Metrolink is embarking on a Sealed Corridor initiative. The purpose of the project is to enhance safety at crossings as well as to inhibit unauthorized vehicular access to rail rights-of-way owned by Metrolink. The current focus is on at least 57 crossings in the San Fernando Valley and Ventura County. This project gained increased attention following an incident within the railroad right-of-way in the San Fernando Valley.
MULTI-COUNTY GOODS MOVEMENT ACTION PLAN
CHAPTER 3 – EXISTING CONDITIONS AND CONSTRAINTS
A31418
Wilbur Smith Associates
Page 3-35
System-wide Goods Movement Data Limitations Good information and data are required to make informed decisions about the goods movement system and its impacts. Currently, the level of existing data and information is not sufficient to effectively support decisions concerning an ever-changing market-driven goods movement industry. There are two specific areas of concern regarding data limitations. The first is the data and information used to support travel demand modeling tools and techniques. The second is a lack of system-wide performance data for the goods movement system. While carriers and modal operators typically have data and information regarding the performance of their particular areas, there is no system-wide approach to monitoring and managing the performance of the system as a whole. Shippers and receivers have good data about their specific shipments, including location, volume, type, and other information they need to make decisions about the allocation of their inventory and stock. There is no current method to track data that would provide information about the operational aspects of the modal system, efficiencies, performance, bottlenecks and delays that occur, average speeds, the velocity of the system, and the allocation of assets (e.g., trucks, chassis, container slots) other than the areas within their respective sphere. Not having a means for measuring and determining performance across the system undermines the ability to identify opportunities for optimization throughout the system. System-wide measures will likely help identify opportunities for improving performance. Also, the lack of system-wide performance data undermines the effectiveness of policies and investments directed at specific issues. For example, existing port policies directed at shifting truck traffic to off-peak hours have been effective at reducing congestion on the highway system.34 However, these policies have had negative impacts for individual truck drivers who spend longer hours away from their families,35 as well as for communities near warehouses and distribution centers that now have to deal with more noise and traffic at night. Performance measures for all aspects of the goods movement system, including operations and throughput, congestion and delay, air quality and emissions, and others, are needed to improve the effectiveness of the system. Security The existing conditions of the goods movement system present significant safety concerns for the public, specifically safety concerns regarding at-grade crossings and truck accidents. In addition, the increased focus on the security of the system has placed a significant fiscal burden on the owners and operators of the goods movement system, particularly at the ports and airports. While there are existing federal programs to improve security, seaports, and airports, owners must fund many of the security projects using their own limited resources. Congress is currently evaluating the effectiveness of security procedures and programs for air cargo and maritime cargo. For example, one of the options for air cargo is to implement 100 percent screening, requiring large amounts of land near air cargo facilities, the consolidation of air cargo facilities, additional warehouse screening buildings, separate secure access roads for trucks, increased security personnel, and screening equipment and technology. Funding While the goods movement system is largely intermodal, the organizations and entities involved in movement of goods are structured to operate independently and often with competing interests. This leads to missed opportunities for the coordinated funding and deployment of system-wide solutions. A lack of funding affects all modes. It presents a significant obstacle to reaching a balanced emphasis on expenditures that improves the competitiveness of the goods movement system and minimizes the impact on the health and well being of the community. As such, funding for goods movement-related projects is falling behind. The most tangible example
MULTI-COUNTY GOODS MOVEMENT ACTION PLAN
CHAPTER 3 – EXISTING CONDITIONS AND CONSTRAINTS
A31418
Wilbur Smith Associates
Page 3-36
is the shortfall in funds requested by communities and agencies in the study area in conjunction with the most recent national transportation reauthorization legislation (SAFETEA-LU). Although its political leaders and transportation agencies jointly supported several key projects for funding, the study area received a minor share of the total amount requested. While there is a growing awareness of the existing capital needs required to accommodate goods movement as well as to mitigate the impact of goods movement, this awareness has not translated into funding. The MCGMAP will address the need for mechanisms that translate the value (created by improvements to the goods movement system) into revenue that can be earmarked for improving the infrastructure and meeting mitigation needs. Fragmented Goods Movement Systems and Processes The study area’s ports, airports, rail carriers, and intermodal terminals have existing capacity constraints that undermine the efficiency and productivity of the system as a whole. Today’s goods movement system optimizes each mode within the supply chain independently. Gaps occur at the points of interface where information and ownership of the goods are exchanged. This fragmentation makes it difficult to tackle the issues in a coordinated and strategic manner. Although the system operates well enough to allow goods to effectively move from mode to mode, the organizations involved in goods movement (private carriers, intermodal operators, warehouse and logistics operators, port owners and operators, and the public entities and transportation agencies) function independently. Many of the identified issues and constraints require a system-wide solution. Private sector entities operate in a competitive environment that make it difficult to create broad-based support for major solutions, since a solution that helps one mode may reduce the competitiveness of another. While individual operators within the system address operational and investment strategies within their respective sphere of influence, they neither have the means nor the information to address system-wide issues. Coordination among the modal components, where it does exist, is solely undertaken to increase their competitive edge. Wal-Mart is the leader in supply chain integration and it has often been said that Wal-Mart is a supply chain company that happens to have retail stores. Public agencies each have their own specific transportation planning and outreach processes that typically have differing priorities and time horizons for decision making and investments. A project viewed as a priority in one jurisdiction may be viewed as competition for finite resources by a neighboring jurisdiction. There are many communities affected by goods movement throughout the study area, and each represents potentially different ideals and priorities. One community’s view of economic growth and prosperity may translate to health and congestion concerns in another. The challenge is to develop an institutional approach that can garner the collective support of communities as well as the public and private sectors to tackle specific solutions that are broad and system-wide.