Embed Size (px)
Citation preview

1
F:\projects\0312\041-01\Wrk\Chapter 2 - Population and Demand\Mining Manufacturing Irrigation Livestock\Final Memo_irrigation.docx
TECHNICAL MEMORANDUM ALAN PLUMMER ASSOCIATES, INC. Region C Water Planning Group Irrigation Demand Projections
PROJECT: 0312-041-01 DATE: July 30, 2009 PREPARED FOR: Region C Water Planning Group PREPARED BY: Alan Plummer Associates, Inc. Background
Municipal water demand projections in the 2006 Region C Plan were based on per capita dry-
year water use and the adopted population projections. Projections of the irrigation demand
relied on the analysis of historical trends and Texas Water Development Board (TWDB) draft
projections. The TWDB Water Uses Section conducts the Annual Survey of Ground and Surface
Water Use to collect current, accurate information on quantities, sources, and related water use
data. To gather additional information regarding irrigation and livestock, questionnaires were
mailed to the 16 County Agricultural Extension Agents. Collected data was then used to develop
summary water use information for irrigation water use estimates.
The most recent irrigation water use estimates available from the TWDB are for the year 2006.
Attachment A provides a comparison of historical irrigation usage and projections by county in
Region C. Figure 1 provides a comparison of irrigation water usage and projections in Region C.
In 2006, the Region C irrigation water demand was approximately 31,000 acre-ft/yr. As noted in
Figure 1, historical irrigation water use is consistent with the adopted 2006 Region C projections.
For the purpose of the 2011 Regional Water Plan, no changes to the irrigation water use
projections are recommended at this time.
DRAFT
DRAFT

F:\projects\03
312\041-01\Wrk\CChapter 2 - Populat
Figure 1. 2
tion and Demand\M
006 Region
2
Mining Manufactu
C Plan Irri
uring Irrigation Liv
igation Proj
vestock\Final Mem
jections
mo_irrigation.docxx
DRAFT
DRAFT

3
F:\projects\0312\041-01\Wrk\Chapter 2 - Population and Demand\Mining Manufacturing Irrigation Livestock\Final Memo_irrigation.docx
Table 1. 2006 Region C Irrigation Water Consumption Projections
Year County 2000 2010 2020 2030 2040 2050 2060Collin County 2995 2,995 2,995 2,995 2,995 2,995 2,995Cooke County 0 444 444 444 444 444 444Dallas County 13087 13,087 13,087 13,087 13,087 13,087 13,087Denton County 2108 2108 2108 2108 2108 2108 2108Ellis County 583 583 583 583 583 583 583Fannin County 4608 4608 4608 4608 4608 4608 4608Freestone County 8 8 8 8 8 8 8Grayson County 3382 3,561 3,751 3,950 4,158 4,381 4,616Henderson County 0 0 0 0 0 0 0Jack County 0 0 0 0 0 0 0Kaufman County 2916 2916 2916 2916 2916 2916 2916Navarro County 0 0 0 0 0 0 0Parker County 422 422 422 422 422 422 422Rockwall County 1125 1125 1125 1125 1125 1125 1125Tarrant County 8417 8,417 8,417 8,417 8,417 8,417 8,417Wise County 502 502 502 502 502 502 502Region C Total 40,153 40,776 40,966 41,165 41,373 41,596 41,831
DRAFT
DRAFT

4
F:\projects\0312\041-01\Wrk\Chapter 2 - Population and Demand\Mining Manufacturing Irrigation Livestock\Final Memo_irrigation.docx
Attachment A
Irrigation Demand by County Including 2006 Projections
DRAFT
DRAFT

5
F:\projects\0312\041-01\Wrk\Chapter 2 - Population and Demand\Mining Manufacturing Irrigation Livestock\Final Memo_irrigation.docx
Figure 1. Collin County Irrigation Demands
0
500
1000
1500
2000
2500
3000
3500
1970 1980 1990 2000 2010 2020 2030 2040 2050 2060 2070
Dem
and (Ac‐Ft)
Year
Historic 2006 Region C Plan
DRAFT
DRAFT
6
F:\projects\0312\041-01\Wrk\Chapter 2 - Population and Demand\Mining Manufacturing Irrigation Livestock\Final Memo_irrigation.docx
Figure 2. Cooke County Irrigation Demands
0
200
400
600
800
1000
1200
1970 1980 1990 2000 2010 2020 2030 2040 2050 2060
Dem
and (Ac‐Ft)
Year
Historic 2006 Region C Plan
DRAFT
DRAFT

7
F:\projects\0312\041-01\Wrk\Chapter 2 - Population and Demand\Mining Manufacturing Irrigation Livestock\Final Memo_irrigation.docx
Figure 3. Dallas County Irrigation Demands
0
2000
4000
6000
8000
10000
12000
14000
16000
1970 1980 1990 2000 2010 2020 2030 2040 2050 2060 2070
Dem
and (Ac‐Ft)
Year
Historic 2006 Region C Plan
DRAFT
DRAFT

8
F:\projects\0312\041-01\Wrk\Chapter 2 - Population and Demand\Mining Manufacturing Irrigation Livestock\Final Memo_irrigation.docx
Figure 4. Denton County Irrigation Demands
0
500
1000
1500
2000
2500
3000
1970 1980 1990 2000 2010 2020 2030 2040 2050 2060 2070
Dem
and (Ac‐Ft)
Year
Historic 2006 Region C Plan
DRAFT
DRAFT
9
F:\projects\0312\041-01\Wrk\Chapter 2 - Population and Demand\Mining Manufacturing Irrigation Livestock\Final Memo_irrigation.docx
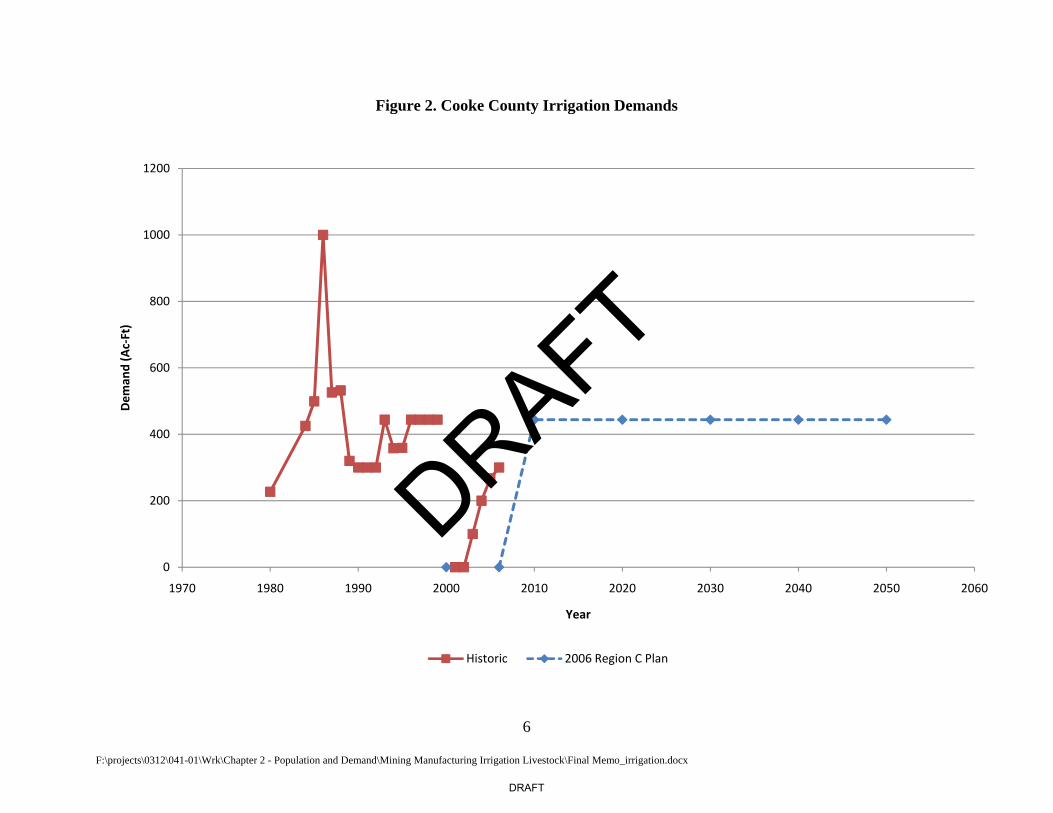
Figure 5. Ellis County Irrigation Demands
0
100
200
300
400
500
600
700
800
1970 1980 1990 2000 2010 2020 2030 2040 2050 2060 2070
Dem
and (Ac‐Ft)
Year
Historic 2006 Region C Plan
DRAFT
DRAFT

10
F:\projects\0312\041-01\Wrk\Chapter 2 - Population and Demand\Mining Manufacturing Irrigation Livestock\Final Memo_irrigation.docx
Figure 6. Fannin County Irrigation Demands
0
2000
4000
6000
8000
10000
12000
14000
16000
1970 1980 1990 2000 2010 2020 2030 2040 2050 2060 2070
Dem
and (Ac‐Ft)
Year
Historic 2006 Region C Plan
DRAFT
DRAFT
11
F:\projects\0312\041-01\Wrk\Chapter 2 - Population and Demand\Mining Manufacturing Irrigation Livestock\Final Memo_irrigation.docx
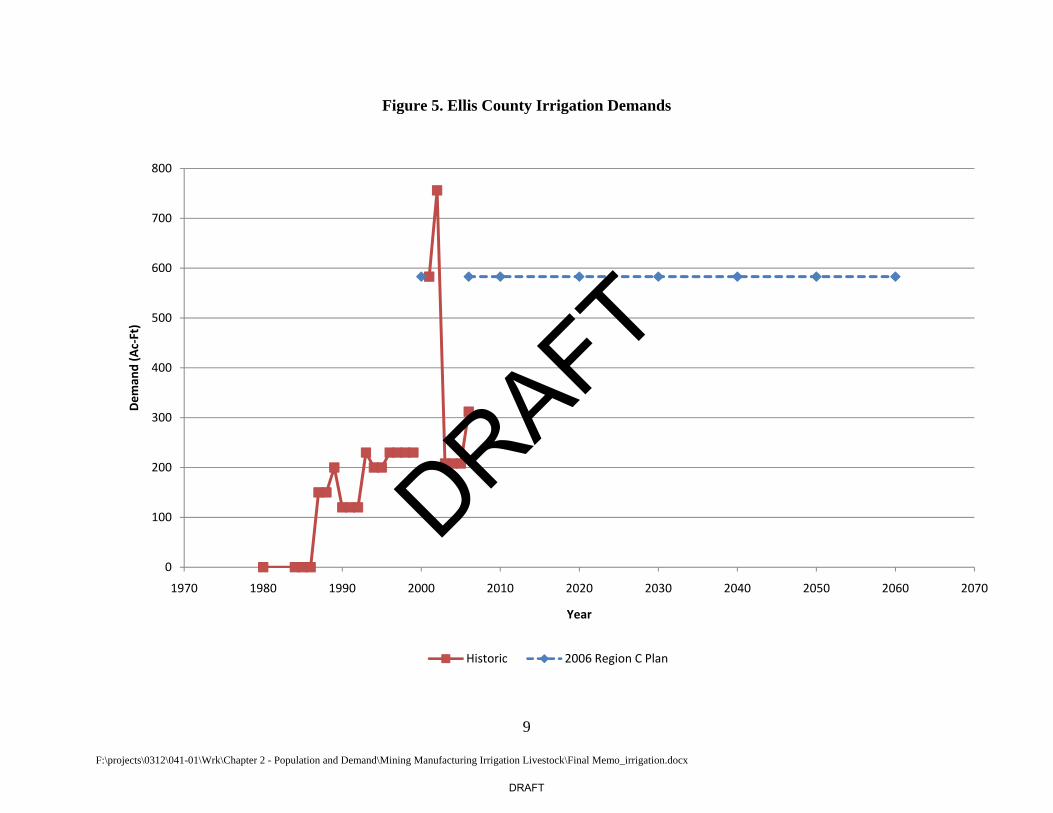
Figure 7. Freestone County Irrigation Demands
0
20
40
60
80
100
120
1970 1980 1990 2000 2010 2020 2030 2040 2050 2060 2070
Dem
and (Ac‐Ft)
Year
Historic 2006 Region C Plan
DRAFT
DRAFT
12
F:\projects\0312\041-01\Wrk\Chapter 2 - Population and Demand\Mining Manufacturing Irrigation Livestock\Final Memo_irrigation.docx
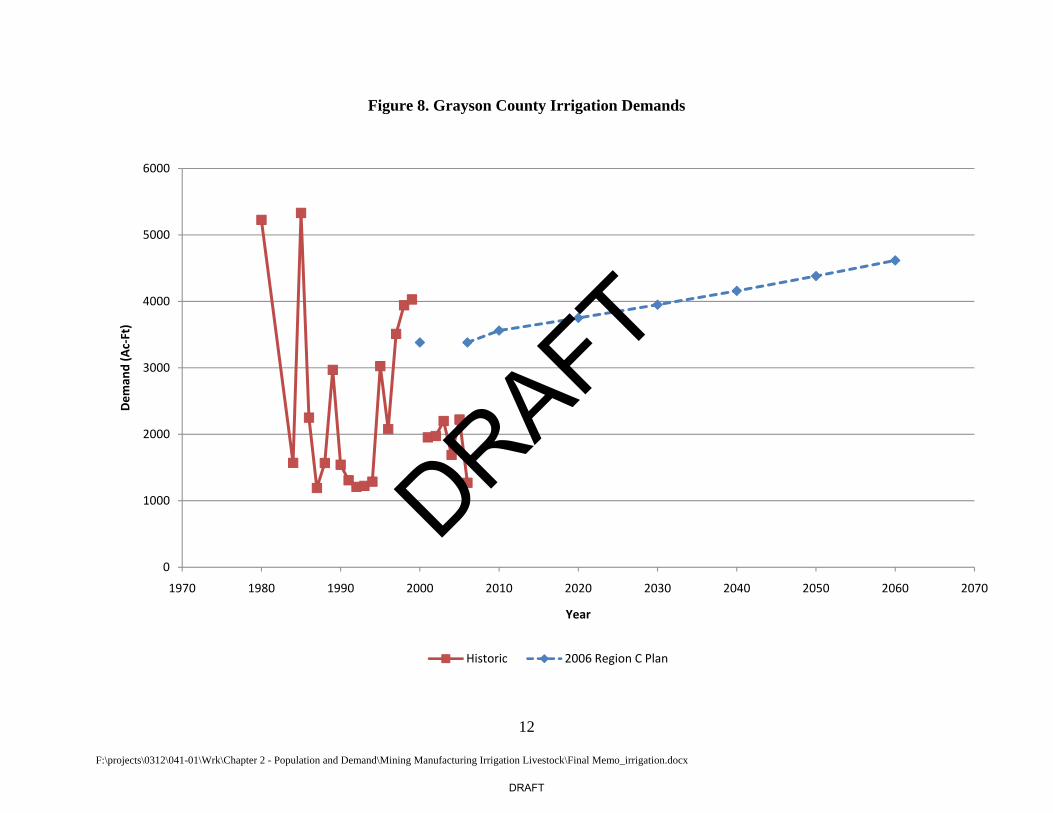
Figure 8. Grayson County Irrigation Demands
0
1000
2000
3000
4000
5000
6000
1970 1980 1990 2000 2010 2020 2030 2040 2050 2060 2070
Dem
and (Ac‐Ft)
Year
Historic 2006 Region C Plan
DRAFT
DRAFT
13
F:\projects\0312\041-01\Wrk\Chapter 2 - Population and Demand\Mining Manufacturing Irrigation Livestock\Final Memo_irrigation.docx
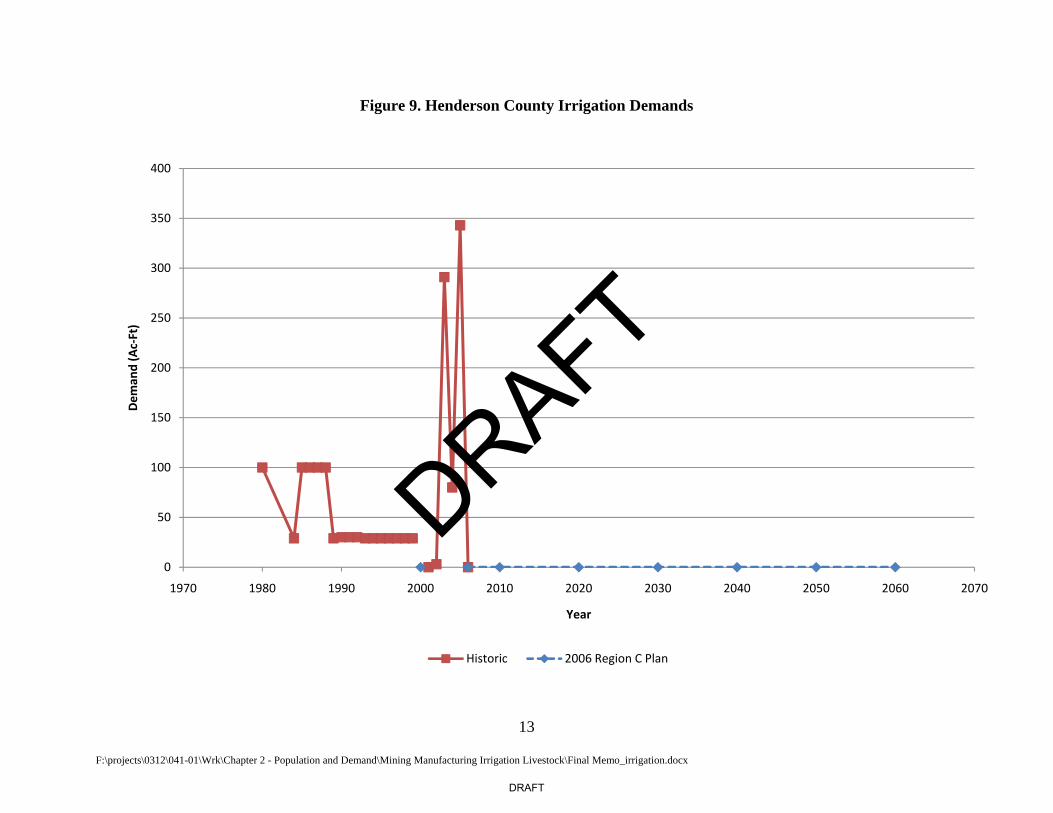
Figure 9. Henderson County Irrigation Demands
0
50
100
150
200
250
300
350
400
1970 1980 1990 2000 2010 2020 2030 2040 2050 2060 2070
Dem
and (Ac‐Ft)
Year
Historic 2006 Region C Plan
DRAFT
DRAFT

14
F:\projects\0312\041-01\Wrk\Chapter 2 - Population and Demand\Mining Manufacturing Irrigation Livestock\Final Memo_irrigation.docx
Figure 10. Jack County Irrigation Demands
0
20
40
60
80
100
120
140
160
180
200
1970 1980 1990 2000 2010 2020 2030 2040 2050 2060 2070
Dem
and (Ac‐Ft)
Year
Historic 2006 Region C Plan
DRAFT
DRAFT
15
F:\projects\0312\041-01\Wrk\Chapter 2 - Population and Demand\Mining Manufacturing Irrigation Livestock\Final Memo_irrigation.docx
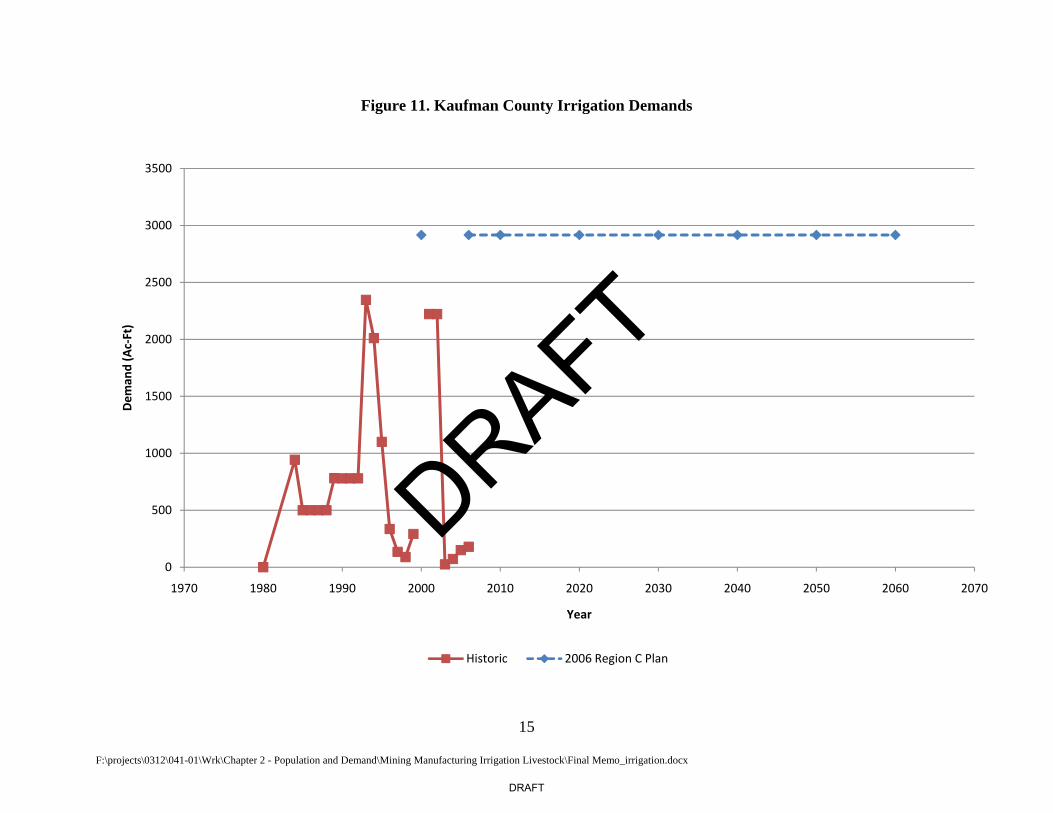
Figure 11. Kaufman County Irrigation Demands
0
500
1000
1500
2000
2500
3000
3500
1970 1980 1990 2000 2010 2020 2030 2040 2050 2060 2070
Dem
and (Ac‐Ft)
Year
Historic 2006 Region C Plan
DRAFT
DRAFT

16
F:\projects\0312\041-01\Wrk\Chapter 2 - Population and Demand\Mining Manufacturing Irrigation Livestock\Final Memo_irrigation.docx
Figure 12. Navarro County Irrigation Demands
0
20
40
60
80
100
120
140
160
1970 1980 1990 2000 2010 2020 2030 2040 2050 2060 2070
Dem
and (Ac‐Ft)
Year
Historic 2006 Region C Plan
DRAFT
DRAFT
17
F:\projects\0312\041-01\Wrk\Chapter 2 - Population and Demand\Mining Manufacturing Irrigation Livestock\Final Memo_irrigation.docx
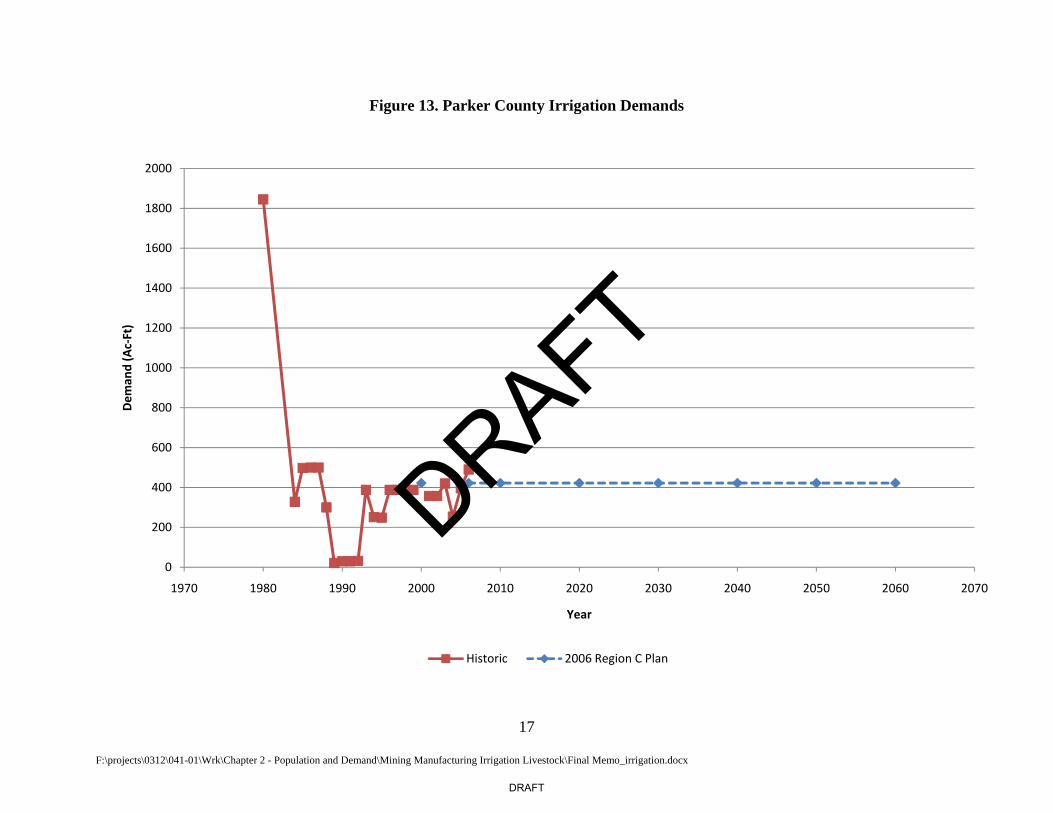
Figure 13. Parker County Irrigation Demands
0
200
400
600
800
1000
1200
1400
1600
1800
2000
1970 1980 1990 2000 2010 2020 2030 2040 2050 2060 2070
Dem
and (Ac‐Ft)
Year
Historic 2006 Region C Plan
DRAFT
DRAFT

18
F:\projects\0312\041-01\Wrk\Chapter 2 - Population and Demand\Mining Manufacturing Irrigation Livestock\Final Memo_irrigation.docx
Figure 14. Rockwall County Irrigation Demands
0
200
400
600
800
1000
1200
1970 1980 1990 2000 2010 2020 2030 2040 2050 2060 2070
Dem
and (Ac‐Ft)
Year
Historic 2006 Region C Plan
DRAFT
DRAFT
19
F:\projects\0312\041-01\Wrk\Chapter 2 - Population and Demand\Mining Manufacturing Irrigation Livestock\Final Memo_irrigation.docx
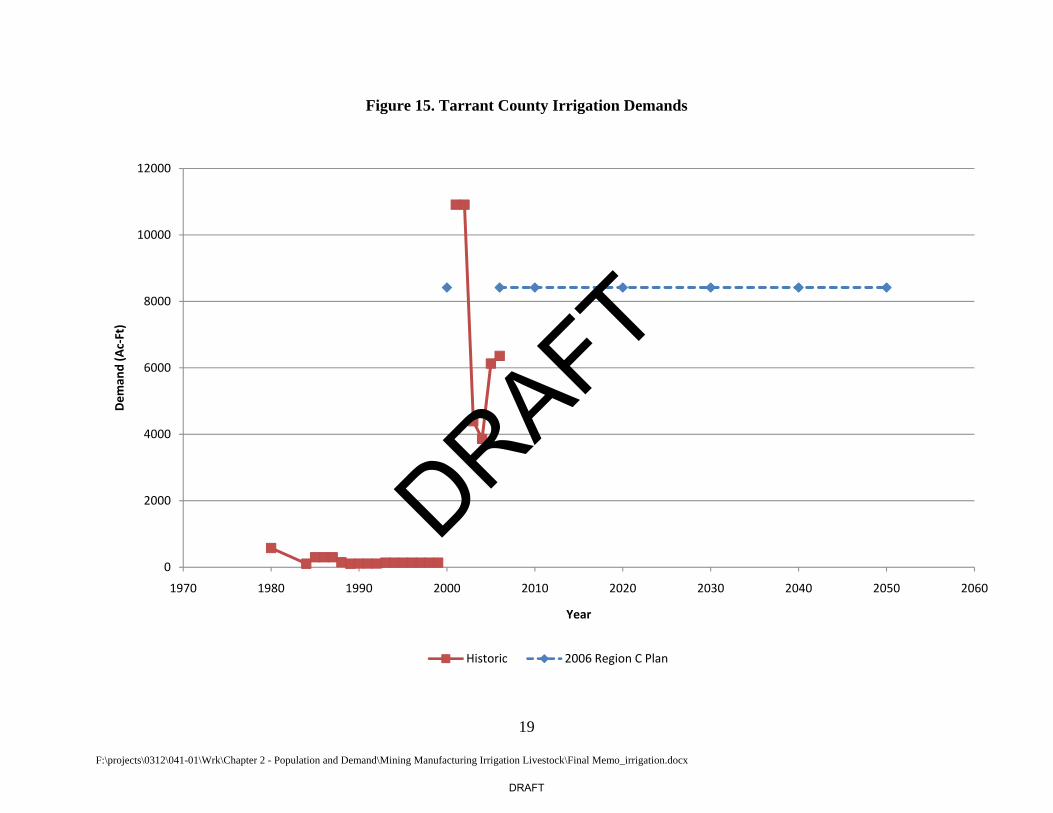
Figure 15. Tarrant County Irrigation Demands
0
2000
4000
6000
8000
10000
12000
1970 1980 1990 2000 2010 2020 2030 2040 2050 2060
Dem
and (Ac‐Ft)
Year
Historic 2006 Region C Plan
DRAFT
DRAFT
20
F:\projects\0312\041-01\Wrk\Chapter 2 - Population and Demand\Mining Manufacturing Irrigation Livestock\Final Memo_irrigation.docx
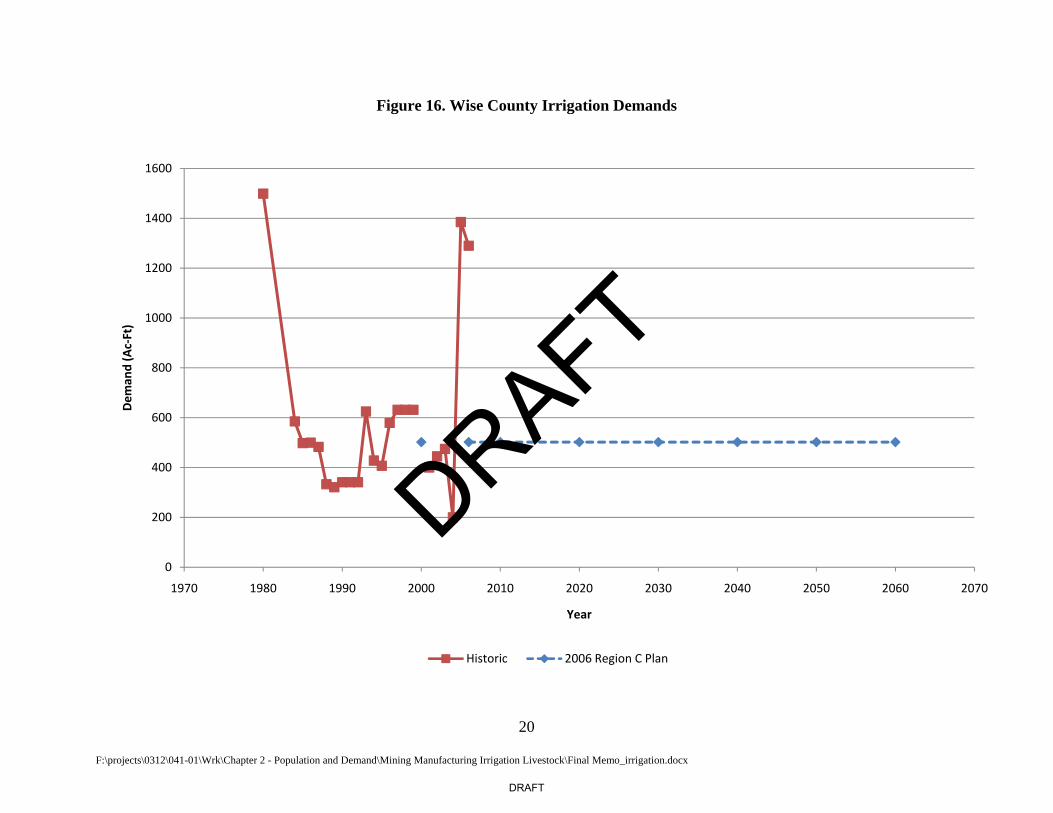
Figure 16. Wise County Irrigation Demands
0
200
400
600
800
1000
1200
1400
1600
1970 1980 1990 2000 2010 2020 2030 2040 2050 2060 2070
Dem
and (Ac‐Ft)
Year
Historic 2006 Region C Plan
DRAFT
DRAFT