Embed Size (px)
Citation preview
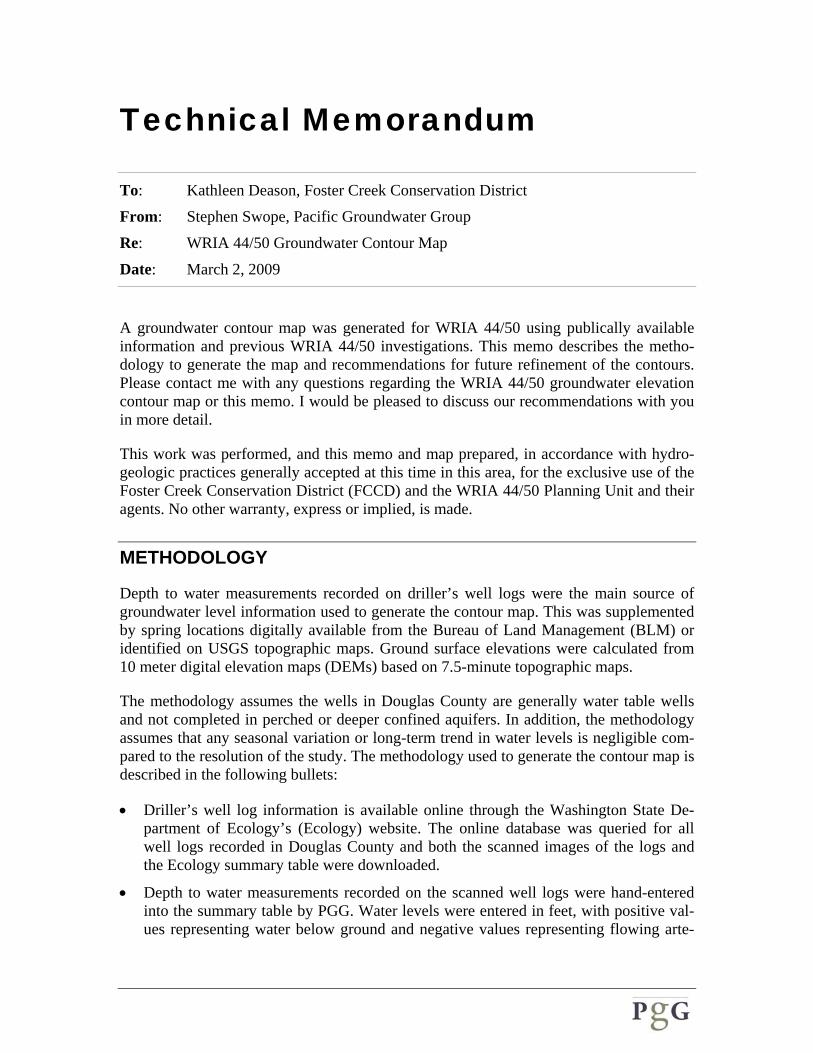
Technical Memorandum
To: Kathleen Deason, Foster Creek Conservation District
From: Stephen Swope, Pacific Groundwater Group
Re: WRIA 44/50 Groundwater Contour Map
Date: March 2, 2009
A groundwater contour map was generated for WRIA 44/50 using publically available information and previous WRIA 44/50 investigations. This memo describes the metho-dology to generate the map and recommendations for future refinement of the contours. Please contact me with any questions regarding the WRIA 44/50 groundwater elevation contour map or this memo. I would be pleased to discuss our recommendations with you in more detail.
This work was performed, and this memo and map prepared, in accordance with hydro-geologic practices generally accepted at this time in this area, for the exclusive use of the Foster Creek Conservation District (FCCD) and the WRIA 44/50 Planning Unit and their agents. No other warranty, express or implied, is made.
METHODOLOGY
Depth to water measurements recorded on driller’s well logs were the main source of groundwater level information used to generate the contour map. This was supplemented by spring locations digitally available from the Bureau of Land Management (BLM) or identified on USGS topographic maps. Ground surface elevations were calculated from 10 meter digital elevation maps (DEMs) based on 7.5-minute topographic maps.
The methodology assumes the wells in Douglas County are generally water table wells and not completed in perched or deeper confined aquifers. In addition, the methodology assumes that any seasonal variation or long-term trend in water levels is negligible com-pared to the resolution of the study. The methodology used to generate the contour map is described in the following bullets:
• Driller’s well log information is available online through the Washington State De-partment of Ecology’s (Ecology) website. The online database was queried for all well logs recorded in Douglas County and both the scanned images of the logs and the Ecology summary table were downloaded.
• Depth to water measurements recorded on the scanned well logs were hand-entered into the summary table by PGG. Water levels were entered in feet, with positive val-ues representing water below ground and negative values representing flowing arte-
sian conditions. Missing and illegible water levels were assigned a “999999” flag and documentation of a dry hole was assigned a “dry” flag. Where available, hydraulic test information was also hand-entered to the summary table.
• Ground surface elevations were estimated by calculating the mean ground surface elevation within an eighth of a mile from the DEM for the Public Land Survey Sys-tem (PLSS) location of each well log with a reported water level.
• Groundwater elevations were calculated for each well by subtracting the depth to wa-ter measurement for a given well from the mean ground surface elevation calculated for the PLSS location of that well.
• Spring locations from the BLM and USGS topography maps were added to the GIS coverage to expand the groundwater data set. Springs were assumed to represent the intersection of the water table and ground surface.
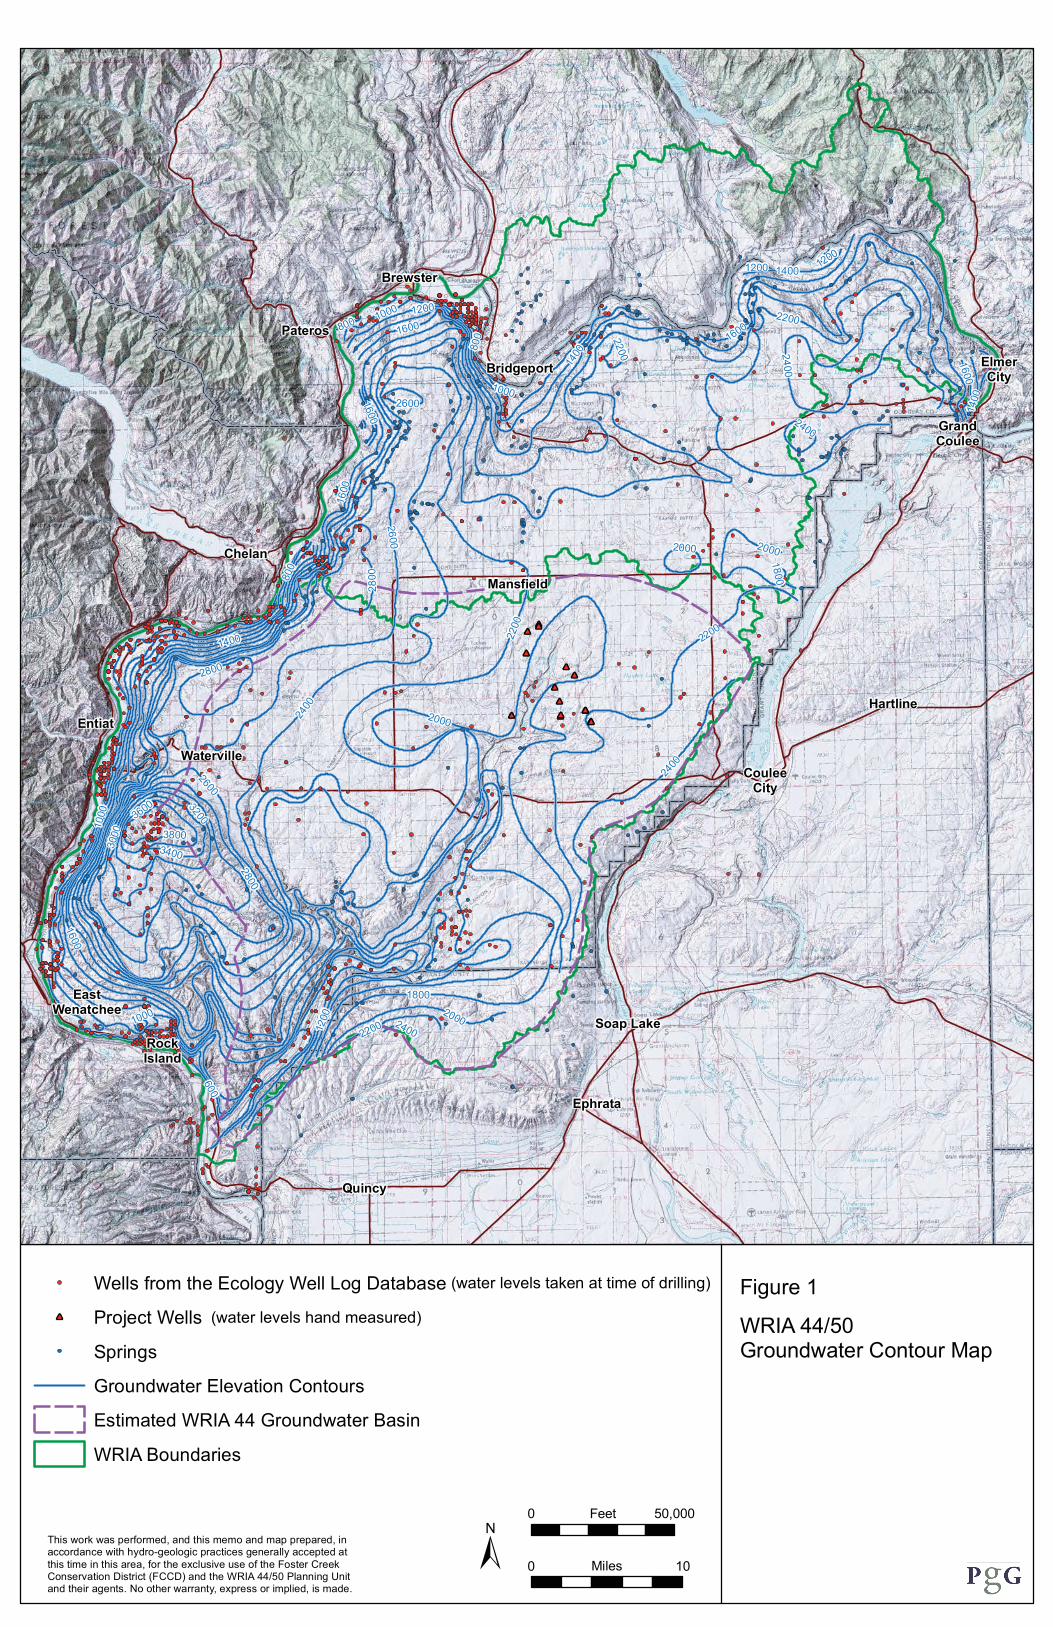
• Groundwater elevation contours were generated through GIS analysis using the Natu-ral Neighbors and Topo-to-Raster methods. A contour interval of 200 feet was se-lected so the wide variations in WRIA 44/50 water levels (from 300 to over 4000 feet above mean sea level) could be legibly contoured.
• Visually spurious contours were assessed by interrogating the associated well loca-tions. Well logs were revisited to look for street addresses of wells that were different from the PLSS locations. When street addresses were not available, Douglas County parcel information was used to correlate the well owner name to tax parcels. Well lo-cations were adjusted according to the results of this additional research and the data were re-contoured. Note this level of quality control was only performed on select wells that appeared to contribute to anomalous contours.
• Select wells in the Moses Coulee, Rimrock Meadows, and Jameson and Grimes Lakes regions were field inspected during previous water level surveys for FCCD (Pacific Groundwater Group, February 2006, Phase 1 Exempt Well Water Use Study). In the WRIA 44/50 contour map, the locations of these wells were moved from the PLSS locations to the field verified locations. Groundwater elevation con-tours previously generated for the Moses Coulee and Jameson and Grimes Lakes wa-ter level surveys have been added to the WRIA 44/50 contour map. Previously gener-ated contours in the Rimrock Meadows area were not included because they did not offer additional information.
• Review of the Town of Waterville and Town of Mansfield well logs indicated some of the municipal supply wells are completed in deeper aquifers. These wells were re-moved from the analysis.
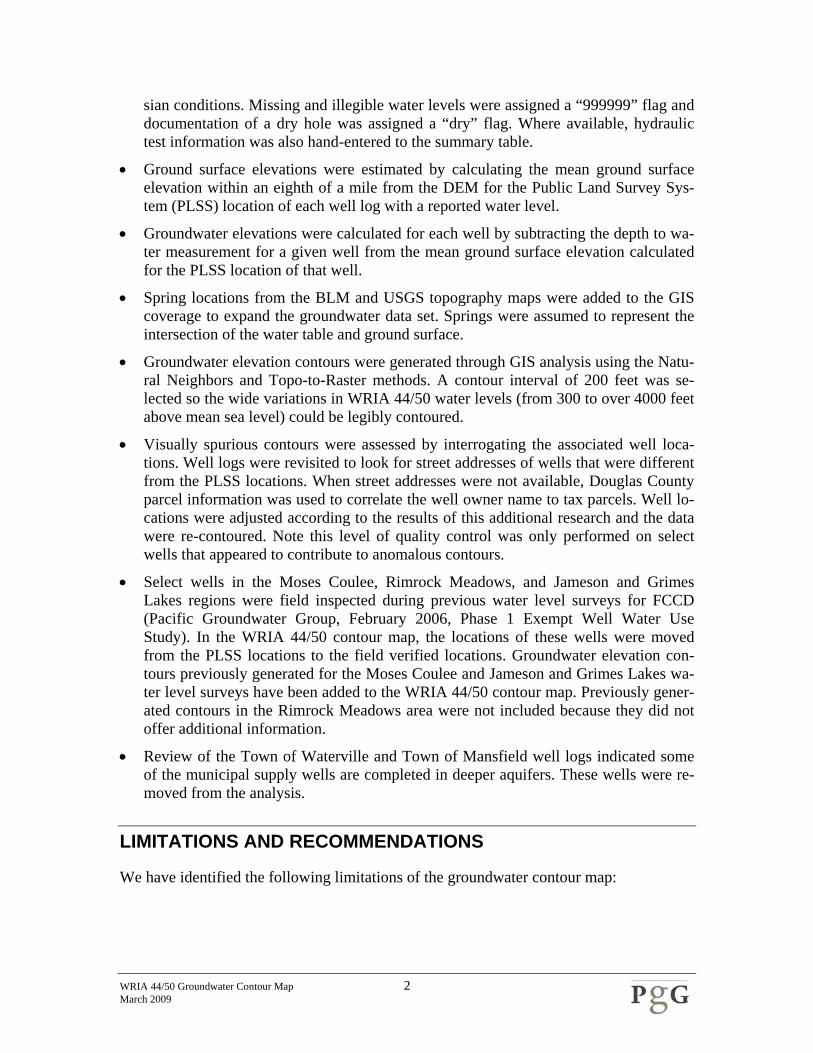
LIMITATIONS AND RECOMMENDATIONS
We have identified the following limitations of the groundwater contour map:
WRIA 44/50 Groundwater Contour Map 2 March 2009
WRIA 44/50 Groundwater Contour Map 3 March 2009
• The PLSS locations of many wells were found to be erroneous. Locations were only checked for areas where contours appears spurious It was not possible to quality control the locations of all wells under the scope and budget for this task
• Deep municipal wells were removed from the analysis but not all wells were checked for completion aquifer.
We have the following recommendations for future refinement of the map:
• Surface water features could be used to refine the contours in a similar manner to the way the springs were used in this phase.
• PGG could perform some additional research to more accurately locate wells in critical areas and review the well logs to filter out water levels that do not appear to reflect the water table.
• FCCD could elect to refine the contours throughout the WRIA or to refine them in critical areas only.
• Refine groundwater contours in the area north of Jameson and Grimes Lakes. The contour map reflects that there are few wells available from Ecology’s database with PLSS locations in the area. A quick search revealed there are a number of water rights associated with wells in this area. It is possible the logs are in the Ecology database but the PLSS locations are incorrect. The water rights could be used to further research groundwater levels in this area. This may help to define the apparent groundwater divide that defines the northern boundary of the McCar-teney Creek groundwater basin.
REFERENCES
Pacific Groundwater Group, February 2006. Phase 1 Exempt Well Water Use Study. Consultants Report to the Foster Creek Conservation District and WRIA 44/50 Planning Unit.
wria4450_gwcontourmemo.doc JS0901
Ephrata
Chelan
Quincy
Entiat
EastWenatchee
Soap Lake
Brewster
Bridgeport
GrandCoulee
Waterville
Pateros
RockIsland
CouleeCity
Hartline
Mansfield
ElmerCity
1800
800
2200
20002400
1000
1200
1400
1600
600
2600
2800
3000
32003400
3600
3800
1000
1600
2600
800
2200
2200
1400
1000
1400
800
2400
1400
2200
2000
2800
2600
1800
2400
1600
2400
2000
1600
1200
2000
1000
1200 1200
1600
2400
2200
1600
2800
Wells from the Ecology Well Log Database
Project Wells
Springs
Groundwater Elevation Contours
Estimated WRIA 44 Groundwater Basin
WRIA Boundaries
Figure 1
0 10Miles
0 50,000Feet
This work was performed, and this memo and map prepared, in accordance with hydro-geologic practices generally accepted at this time in this area, for the exclusive use of the Foster Creek Conservation District (FCCD) and the WRIA 44/50 Planning Unit and their agents. No other warranty, express or implied, is made.
WRIA 44/50 Groundwater Contour Map
(water levels hand measured)
(water levels taken at time of drilling)


![VALUE€¦ · Contour Drawing [Project One] Contour Drawing. Contour Line: In drawing, is an outline sketch of an object. [Project One]: Layered Contour Drawing The purpose of contour](https://img.pdfslide.us/doc/110x75/60363a1e4c7d150c4824002e/value-contour-drawing-project-one-contour-drawing-contour-line-in-drawing-is.jpg)