Embed Size (px)
Citation preview
Reference numberISO/TS 10004:2010(E)
© ISO 2010
TECHNICAL SPECIFICATION
ISO/TS10004
First edition2010-04-15
Quality management — Customer satisfaction — Guidelines for monitoring and measuring
Management de la qualité — Satisfaction du client — Lignes directrices relatives à la surveillance et au mesurage
Dit
do
cum
ent
mag
sle
chts
op
een
sta
nd
-alo
ne
PC
wo
rden
gei
nst
alle
erd
. Geb
ruik
op
een
net
wer
k is
alle
ento
eges
taan
als
een
aan
vulle
nd
e lic
enti
eove
reen
kom
st v
oo
r n
etw
erkg
ebru
ik m
et N
EN
is a
fges
lote
n.
Th
is d
ocu
men
t m
ay o
nly
be
use
d o
n a
sta
nd
-alo
ne
PC
. Use
in a
net
wo
rk is
on
ly p
erm
itte
d w
hen
asu
pp
lem
enta
ry li
cen
se a
gre
emen
t fo
r u
se in
a n
etw
ork
wit
h N
EN
has
bee
n c
on
clu
ded
.
Dit document is door NEN onder licentie verstrekt aan: / This document has been supplied under license by NEN to:NEN Alleen voor intern gebruik 17-5-2010 16:55:08
ISO/TS 10004:2010(E)
PDF disclaimer This PDF file may contain embedded typefaces. In accordance with Adobe's licensing policy, this file may be printed or viewed but shall not be edited unless the typefaces which are embedded are licensed to and installed on the computer performing the editing. In downloading this file, parties accept therein the responsibility of not infringing Adobe's licensing policy. The ISO Central Secretariat accepts no liability in this area.
Adobe is a trademark of Adobe Systems Incorporated.
Details of the software products used to create this PDF file can be found in the General Info relative to the file; the PDF-creation parameters were optimized for printing. Every care has been taken to ensure that the file is suitable for use by ISO member bodies. In the unlikely event that a problem relating to it is found, please inform the Central Secretariat at the address given below.
COPYRIGHT PROTECTED DOCUMENT © ISO 2010 All rights reserved. Unless otherwise specified, no part of this publication may be reproduced or utilized in any form or by any means, electronic or mechanical, including photocopying and microfilm, without permission in writing from either ISO at the address below or ISO's member body in the country of the requester.
ISO copyright office Case postale 56 • CH-1211 Geneva 20 Tel. + 41 22 749 01 11 Fax + 41 22 749 09 47 E-mail [email protected] Web www.iso.org
Published in Switzerland
ii © ISO 2010 – All rights reserved
Dit document is door NEN onder licentie verstrekt aan: / This document has been supplied under license by NEN to:NEN Alleen voor intern gebruik 17-5-2010 16:55:08
ISO/TS 10004:2010(E)
© ISO 2010 – All rights reserved iii
Contents Page
Foreword ............................................................................................................................................................iv Introduction.........................................................................................................................................................v 1 Scope ......................................................................................................................................................1 2 Normative references............................................................................................................................1 3 Terms and definitions ...........................................................................................................................1 4 Concept of customer satisfaction .......................................................................................................2 5 Framework for monitoring and measuring customer satisfaction...................................................2 6 Planning for monitoring and measuring customer satisfaction.......................................................3 6.1 Defining the purpose and objectives ..................................................................................................3 6.2 Determining the scope and frequency ................................................................................................3 6.3 Determining implementation methods and responsibilities.............................................................3 6.4 Allocating resources .............................................................................................................................3 7 Monitoring and measuring customer satisfaction activities ............................................................4 7.1 General ...................................................................................................................................................4 7.2 Identifying customer expectations ......................................................................................................4 7.3 Gathering customer satisfaction data.................................................................................................5 7.4 Analysing customer satisfaction data.................................................................................................8 7.5 Providing feedback for improvement..................................................................................................9 7.6 Monitoring customer satisfaction........................................................................................................9 8 Maintenance and improvement of monitoring and measurement processes ..............................10 Annex A (normative) Conceptual model of customer satisfaction..............................................................12 Annex B (normative) Identification of customer expectations ....................................................................14 Annex C (normative) Direct measurement of customer satisfaction ..........................................................17 Annex D (normative) Analysis of customer satisfaction data......................................................................22 Annex E (normative) Using customer satisfaction........................................................................................27 Bibliography......................................................................................................................................................29
Dit document is door NEN onder licentie verstrekt aan: / This document has been supplied under license by NEN to:NEN Alleen voor intern gebruik 17-5-2010 16:55:08
ISO/TS 10004:2010(E)
iv © ISO 2010 – All rights reserved
Foreword
ISO (the International Organization for Standardization) is a worldwide federation of national standards bodies (ISO member bodies). The work of preparing International Standards is normally carried out through ISO technical committees. Each member body interested in a subject for which a technical committee has been established has the right to be represented on that committee. International organizations, governmental and non-governmental, in liaison with ISO, also take part in the work. ISO collaborates closely with the International Electrotechnical Commission (IEC) on all matters of electrotechnical standardization.
International Standards are drafted in accordance with the rules given in the ISO/IEC Directives, Part 2.
The main task of technical committees is to prepare International Standards. Draft International Standards adopted by the technical committees are circulated to the member bodies for voting. Publication as an International Standard requires approval by at least 75 % of the member bodies casting a vote.
In other circumstances, particularly when there is an urgent market requirement for such documents, a technical committee may decide to publish other types of document:
⎯ an ISO Publicly Available Specification (ISO/PAS) represents an agreement between technical experts in an ISO working group and is accepted for publication if it is approved by more than 50 % of the members of the parent committee casting a vote;
⎯ an ISO Technical Specification (ISO/TS) represents an agreement between the members of a technical committee and is accepted for publication if it is approved by 2/3 of the members of the committee casting a vote.
An ISO/PAS or ISO/TS is reviewed after three years in order to decide whether it will be confirmed for a further three years, revised to become an International Standard, or withdrawn. If the ISO/PAS or ISO/TS is confirmed, it is reviewed again after a further three years, at which time it must either be transformed into an International Standard or be withdrawn.
Attention is drawn to the possibility that some of the elements of this document may be the subject of patent rights. ISO shall not be held responsible for identifying any or all such patent rights.
ISO/TS 10004 was prepared by Technical Committee ISO/TC 176, Quality management and quality assurance, Subcommittee SC 3, Supporting technologies.
Dit document is door NEN onder licentie verstrekt aan: / This document has been supplied under license by NEN to:NEN Alleen voor intern gebruik 17-5-2010 16:55:08
ISO/TS 10004:2010(E)
© ISO 2010 – All rights reserved v
Introduction
0.1 General
One of the key elements of organizational success is the customer's satisfaction with the organization and its products. Therefore, it is necessary to monitor and measure customer satisfaction.
The information obtained from monitoring and measuring customer satisfaction can help identify opportunities for improvement of the organization's strategies, products, processes and characteristics that are valued by customers, and serve the organization's objectives. Such improvements can strengthen customer confidence and result in commercial and other benefits.
This Technical Specification provides guidance to the organization on establishing effective processes for monitoring and measuring customer satisfaction.
0.2 Relationship with ISO 9001:2008
This Technical Specification is compatible with ISO 9001:2008, whose objectives it supports by providing guidance on monitoring and measuring customer satisfaction. This Technical Specification can help address specific clauses in ISO 9001:2008 related to customer satisfaction, namely those listed below.
a) ISO 9001:2008, 5.2, on customer focus: “Top management shall ensure that customer requirements are determined and are met with the aim of enhancing customer satisfaction.”
b) ISO 9001:2008, 6.1, b), on resource management: “'The organization shall determine and provide the resources needed (…) to enhance customer satisfaction by meeting customer requirements.”
c) ISO 9001:2008, 8.2.1, on customer satisfaction: “As one of the measurements of the performance of the quality management system, the organization shall monitor information relating to customer perception as to whether the organization has met customer requirements. The methods for obtaining and using this information shall be determined.”
d) ISO 9001:2008, 8.4, on analysis of data: “The organization shall determine, collect and analyse appropriate data to demonstrate the suitability and effectiveness of the quality management system and to evaluate where continual improvement of the effectiveness of the quality management system can be made. This shall include data generated as a result of monitoring and measurement and from other relevant sources. The analysis of data shall provide information relating to (...) customer satisfaction (…).”
This Technical Specification can also be used independently of ISO 9001.
0.3 Relationship with ISO 9004:2009
This Technical Specification is also compatible with ISO 9004:2009, which provides guidance on managing for the sustained success of an organization. This Technical Specification supplements the following guidance given in:
⎯ ISO 9004:2009, Clause B.2, on customer focus, and
⎯ ISO 9004:2009, 8.3.1 and 8.3.2, on determining needs, expectations and satisfaction of customers.
Dit document is door NEN onder licentie verstrekt aan: / This document has been supplied under license by NEN to:NEN Alleen voor intern gebruik 17-5-2010 16:55:08
ISO/TS 10004:2010(E)
vi © ISO 2010 – All rights reserved
0.4 Relationship with ISO 10001, ISO 10002, ISO 10003
ISO 10001 contains guidance on codes of conduct for organizations related to customer satisfaction. Such codes can decrease the likelihood of problems arising and can eliminate causes of complaints and disputes which can decrease customer satisfaction.
ISO 10002 contains guidance on the internal handling of product-related complaints. This guidance can help to preserve customer satisfaction and loyalty by resolving complaints effectively and efficiently.
ISO 10003 contains guidance on the resolution of disputes regarding product-related complaints that could not be satisfactorily resolved internally. ISO 10003 can help to minimize customer dissatisfaction stemming from unresolved complaints.
Collectively, ISO 10001, ISO 10002 and ISO 10003 provide guidance which can help to minimize customer dissatisfaction and enhance customer satisfaction.
This Technical Specification complements ISO 10001, ISO 10002 and ISO 10003 by providing guidance on the monitoring and measuring of customer satisfaction. The information gained can guide the organization to take actions which can help to sustain or enhance customer satisfaction.
Dit document is door NEN onder licentie verstrekt aan: / This document has been supplied under license by NEN to:NEN Alleen voor intern gebruik 17-5-2010 16:55:08
TECHNICAL SPECIFICATION ISO/TS 10004:2010(E)
© ISO 2010 – All rights reserved 1
Quality management — Customer satisfaction — Guidelines for monitoring and measuring
1 Scope
This Technical Specification provides guidance in defining and implementing processes to monitor and measure customer satisfaction.
This Technical Specification is intended for use by organizations regardless of type, size or product provided. The focus of this Technical Specification is on customers external to the organization.
This Technical Specification is not intended for certification or contractual purposes, nor is it intended to change any rights or obligations under applicable statutory or regulatory requirements.
2 Normative references
The following referenced documents are indispensable for the application of this document: For dated references, only the edition cited applies. For undated references, the latest edition of the referenced document (including any amendments) applies.
ISO 9000:2005, Quality management systems — Fundamentals and vocabulary
3 Terms and definitions
For the purposes of this document, the terms and definitions given in ISO 9000:2005 and the following apply.
3.1 product result of a process
NOTE 1 Product can be a service, software, hardware or processed material.
NOTE 2 Adapted from ISO 9000:2005, definition 3.4.2, whose original three notes have been condensed into Note 1.
3.2 customer organization or person that receives a product
EXAMPLE Consumer, client, end-user, retailer, beneficiary, purchaser.
NOTE 1 Customers might include other interested parties who might be affected by the products provided by the organization and who might influence the success of the organization.
NOTE 2 While a customer can be internal or external to the organization, the focus of this Technical Specification is on the external customer.
NOTE 3 Adapted from ISO 9000:2005, definition 3.3.5, whose original note has been expanded into Notes 1 and 2.
Dit document is door NEN onder licentie verstrekt aan: / This document has been supplied under license by NEN to:NEN Alleen voor intern gebruik 17-5-2010 16:55:08
ISO/TS 10004:2010(E)
2 © ISO 2010 – All rights reserved
3.3 customer satisfaction customer's perception of the degree to which the customer's requirements have been fulfilled
NOTE 1 Customer complaints are a common indicator of low customer satisfaction but their absence does not necessarily imply high customer satisfaction.
NOTE 2 Even when customer requirements have been agreed with the customer and fulfilled, this does not necessarily ensure high customer satisfaction.
[ISO 9000:2005, definition 3.1.4]
3.4 requirement need or expectation that is stated, generally implied or obligatory
NOTE Adapted from ISO 9000:2005, definition 3.1.2, whose original five notes have been removed.
4 Concept of customer satisfaction
Customer satisfaction is determined by the gap between the customer's expectations and the customer's perception of the product as delivered by the organization.
To achieve customer satisfaction, the organization should first understand the customer's expectations. These expectations might be explicit or implicit, or not fully articulated.
Customer expectations, as understood by the organization, form the primary basis of the product that is subsequently planned and delivered.
The extent to which the delivered product is perceived by the customer to meet or exceed expectations determines the degree of customer satisfaction.
It is important to make a distinction between the organization's view of the quality of the delivered product and the customer's perception of the delivered product, because it is the latter that governs the customer's satisfaction. The relationship between the organization's and the customer's views on quality is further described by the conceptual model of customer satisfaction, as presented in Annex A.
Since customer satisfaction is subject to change, organizations should establish processes to monitor and measure customer satisfaction on a regular basis.
5 Framework for monitoring and measuring customer satisfaction
The organization should establish a systematic approach to monitoring and measuring customer satisfaction. This approach should be supported by an organizational framework to enable the planning, operation, maintenance and improvement of processes for monitoring and measuring customer satisfaction.
Planning includes determination of the methods of implementation, and the allocation of necessary resources (see Clause 6).
Operation includes identifying customer expectations, gathering and analysing customer satisfaction data, providing feedback for improvement and monitoring of customer satisfaction (see Clause 7).
Maintenance and improvement includes the review, evaluation and continual improvement of processes for monitoring and measuring customer satisfaction (see Clause 8).
Dit document is door NEN onder licentie verstrekt aan: / This document has been supplied under license by NEN to:NEN Alleen voor intern gebruik 17-5-2010 16:55:08
ISO/TS 10004:2010(E)
© ISO 2010 – All rights reserved 3
6 Planning for monitoring and measuring customer satisfaction
6.1 Defining the purpose and objectives
As a first step, the organization should clearly define the purpose and objectives of monitoring and measuring customer satisfaction, which might, for example, include the following:
⎯ to evaluate customer response to existing, new or re-designed products;
⎯ to obtain information on specific aspects, such as supporting processes, personnel or organization behaviour;
⎯ to investigate reasons for customer complaints;
⎯ to investigate reasons for loss of market share;
⎯ to monitor trends in customer satisfaction;
⎯ to compare customer satisfaction in relation to other organisations.
The purpose and objectives influence what, when, how and from whom the data is gathered. They also influence how the data is analysed and how the information is ultimately to be used.
6.2 Determining the scope and frequency
Based on the purpose and objectives, the organization should determine the scope of the planned measurement, in terms of both the type of data that is sought, and from where it is to be obtained.
The type of information gathered can range from data regarding a specific characteristic, to assessment of overall satisfaction. Likewise, the scope of assessment depends on the type of segmentation:
⎯ by customer,
⎯ by market, or
⎯ by product.
The organization should also determine the frequency of data gathering, which can be on a regular basis, on an occasional basis, or both, as dictated by business needs or specific events (see 7.3).
6.3 Determining implementation methods and responsibilities
Some information regarding customer satisfaction might be obtained indirectly from the organization's internal processes (e.g. customer complaints handling) or from external sources (e.g. reports in the media). Usually, the organization needs to supplement such information with data obtained directly from customers.
The organization should determine how customer satisfaction information is to be obtained, and who is responsible for that activity. The organization should also determine to whom the information is to be directed for appropriate action.
The organization should plan to monitor the processes for obtaining and using customer satisfaction information, as well as the results and effectiveness of these processes.
6.4 Allocating resources
The organization should determine and provide the necessary competent human and other resources for planning, monitoring and measuring customer satisfaction.
Dit document is door NEN onder licentie verstrekt aan: / This document has been supplied under license by NEN to:NEN Alleen voor intern gebruik 17-5-2010 16:55:08
ISO/TS 10004:2010(E)
4 © ISO 2010 – All rights reserved
7 Monitoring and measuring customer satisfaction activities
7.1 General
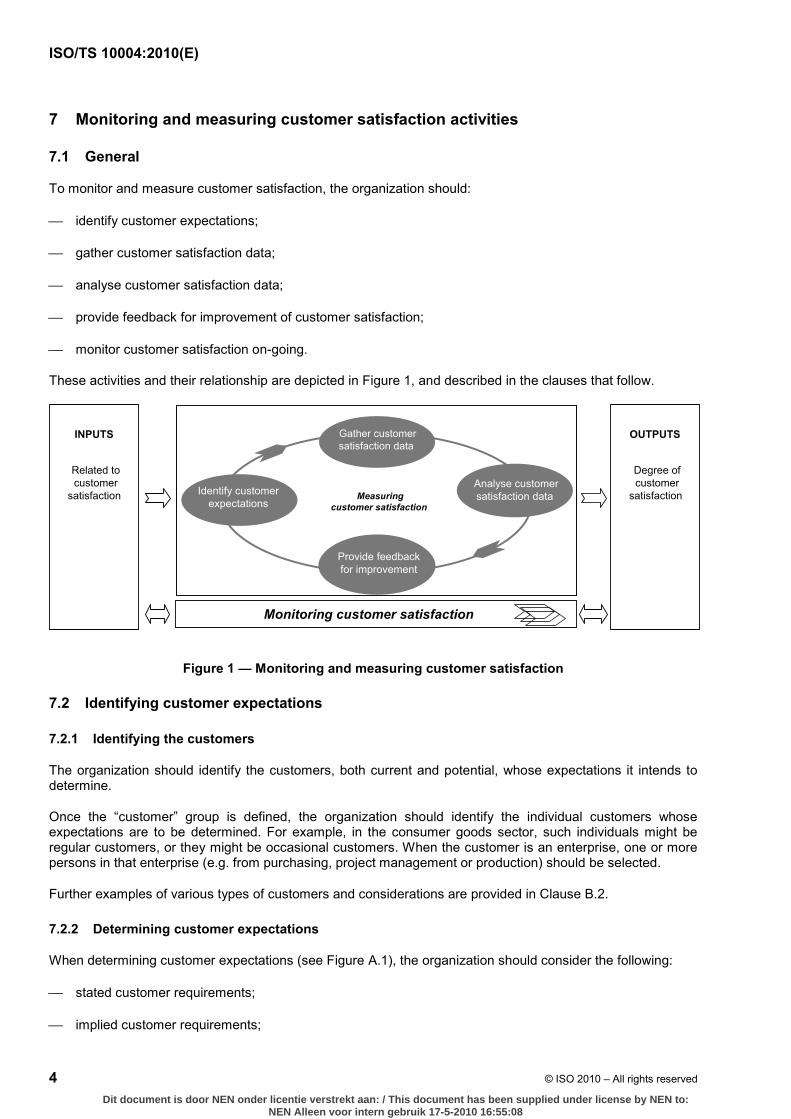
To monitor and measure customer satisfaction, the organization should:
⎯ identify customer expectations;
⎯ gather customer satisfaction data;
⎯ analyse customer satisfaction data;
⎯ provide feedback for improvement of customer satisfaction;
⎯ monitor customer satisfaction on-going.
These activities and their relationship are depicted in Figure 1, and described in the clauses that follow.
Gather customersatisfaction data
Analyse customersatisfaction data Identify customer
expectations
INPUTS
Related tocustomer
satisfaction
OUTPUTS
Degree ofcustomer
satisfaction Measuringcustomer satisfaction
Provide feedbackfor improvement
Monitoring customer satisfaction
Figure 1 — Monitoring and measuring customer satisfaction
7.2 Identifying customer expectations
7.2.1 Identifying the customers
The organization should identify the customers, both current and potential, whose expectations it intends to determine.
Once the “customer” group is defined, the organization should identify the individual customers whose expectations are to be determined. For example, in the consumer goods sector, such individuals might be regular customers, or they might be occasional customers. When the customer is an enterprise, one or more persons in that enterprise (e.g. from purchasing, project management or production) should be selected.
Further examples of various types of customers and considerations are provided in Clause B.2.
7.2.2 Determining customer expectations
When determining customer expectations (see Figure A.1), the organization should consider the following:
⎯ stated customer requirements;
⎯ implied customer requirements;
Dit document is door NEN onder licentie verstrekt aan: / This document has been supplied under license by NEN to:NEN Alleen voor intern gebruik 17-5-2010 16:55:08
ISO/TS 10004:2010(E)
© ISO 2010 – All rights reserved 5
⎯ statutory and regulatory requirements;
⎯ other customer desires (“wish list”).
It is important to recognize that a customer might not always explicitly specify all aspects of the product. Items that are presupposed might not be specified. Some aspects might be overlooked, or may not be known to the customer.
As outlined in the conceptual model (see Annex A), it is crucial that the customer's expectations are clearly and completely understood. How well these expectations are met will influence the customer's satisfaction. Examples of various aspects to consider in order to better understand customer expectations are provided in Clause B.3.
The relationship between customer expectations and customer satisfaction is further discussed in Clause B.4.
7.3 Gathering customer satisfaction data
7.3.1 Identifying and selecting characteristics related to customer satisfaction
The organization should identify the characteristics of the product, of its delivery and of the organization, which have a significant effect on customer satisfaction. For convenience, the characteristics can be grouped into categories such as:
a) product characteristics;
EXAMPLE Performance (quality, dependability), features, aesthetics, safety, support (maintenance, disposal, training), price, perceived value, warranty.
b) delivery characteristics;
EXAMPLE On-time delivery, completeness of order, response time, operating information, quality of delivery service.
c) organizational characteristics.
EXAMPLE Personnel characteristics (courtesy, competence, communication), billing process, complaints handling, security, organizational behaviour (business ethics, social responsibility), image in society, transparency.
The organization should rank the selected characteristics to reflect their relative importance, as perceived by the customer. If necessary, a survey should be carried out with a sub-set of customers to determine or verify their perception of relative importance of characteristics.
7.3.2 Indirect indicators of customer satisfaction
The organization should examine existing sources of information for data that reflect characteristics related to customer satisfaction, e.g.
⎯ frequency or trend in customer complaints, calls for assistance, or customer compliments;
⎯ frequency or trend in product returns, product repair or other indicators of product performance or customer acceptance, e.g. installation or field inspection reports;
⎯ data obtained through communication with customers, e.g. by marketing, sales or support personnel;
⎯ reports from supplier surveys conducted by customer organizations, which can reveal how the organization is perceived in relation to other organizations;
Dit document is door NEN onder licentie verstrekt aan: / This document has been supplied under license by NEN to:NEN Alleen voor intern gebruik 17-5-2010 16:55:08
ISO/TS 10004:2010(E)
6 © ISO 2010 – All rights reserved
⎯ reports from consumer groups that might reveal how the organization and its products are perceived by customers or users;
⎯ media reports which might reveal how the organization or its products are perceived, and which might themselves also influence customer perceptions;
⎯ sector/industry studies, e.g. involving a comparative assessment of characteristics of the organization's product;
⎯ regulatory agency reports or publications.
Such data can provide insight into the strengths and weaknesses of the product and related organization processes (e.g. product support, complaints handling and customer communication). The analysis of such data can help to shape indicators of customer satisfaction. It can also help to confirm or supplement customer satisfaction data gained directly from the customer.
7.3.3 Direct measures of customer satisfaction
7.3.3.1 General
While there might be indirect indicators of satisfaction (see 7.3.2), it is usually necessary to gather customer satisfaction data directly from customers. The method(s) used to gather customer satisfaction data depend on various factors, e.g.
⎯ the type, number and geographical or cultural distribution of customers,
⎯ the length and frequency of customer interaction,
⎯ the nature of the product provided by the organization, and
⎯ the purpose and cost of the assessment method.
The organization should consider the practical aspects described in 7.3.3.2 to 7.3.3.4 when planning the approach and methods to use for gathering customer satisfaction data.
7.3.3.2 Selecting the method for gathering customer satisfaction data
The organization should select a method for gathering data that is appropriate to the need and the type of data that is to be collected.
The method most commonly used for gathering such data is a survey, which can be either qualitative, or quantitative, or both.
Qualitative surveys are those that are typically designed to reveal characteristics of the product, delivery or the organization that are relevant to customer satisfaction. They are typically undertaken to understand or explore individual perceptions and reactions, and to uncover ideas and issues. They are relatively flexible in application, but can be subjective.
Quantitative surveys are those that are designed to measure the degree of customer satisfaction. They are typically conducted to collect aggregate data, using fixed questions or criteria. They are used for determining status, benchmarking, or tracking changes over time.
Brief descriptions of these types of survey methods and a comparison of their relative advantages and limitations are provided in C.2.4.
Dit document is door NEN onder licentie verstrekt aan: / This document has been supplied under license by NEN to:NEN Alleen voor intern gebruik 17-5-2010 16:55:08
ISO/TS 10004:2010(E)
© ISO 2010 – All rights reserved 7
7.3.3.3 Selecting sample size and method of sampling
The organization should determine the number of customers to be surveyed (i.e. the sample size) and the method of sampling, in order to measure customer satisfaction. The goal is to obtain reliable data at minimum cost. The accuracy of the data gathered is governed by the size of the sample and the way the sample is selected, i.e. the method of sampling.
The sample size can be determined statistically to ensure the precision and confidence levels required in the findings. In addition, the method of sampling used should ensure that the resulting sample represents the population well. Both aspects are further discussed in Clause C.3.
7.3.3.4 Developing the customer satisfaction questions
The product and the characteristics to be surveyed should be clearly defined. In addition, other characteristics can also be surveyed [see 7.3.1, c)]. When developing the questions to be posed, the organization should first determine the broad areas of interest, and then the sub-set of questions within those areas, with sufficient details to provide information about customer perception.
The scale of measurement, which depends upon how questions are worded, should also be clearly defined. Further guidance on defining the questions and consolidating them into a questionnaire is provided in Clause C.4.
7.3.4 Collecting customer satisfaction data
The collection of data should be systematic, detailed and documented. The organization should specify how the data is to be collected. When selecting the method(s) and tool(s) for collecting data, certain aspects should be considered, e.g.
a) customer type and accessibility,
b) timelines for data collection,
c) available technology,
d) available resources (skills and budget), and
e) privacy and confidentiality.
When determining the frequency, period or trigger for collecting customer satisfaction data, the organization should consider aspects such as the following:
⎯ the development or launch of a new product;
⎯ the completion of significant project milestones;
⎯ when some relevant change is made in the product or related processes, or operating environment;
⎯ when there is decrease in customer satisfaction, or variability in product sales (by region, or season);
⎯ the monitoring and sustaining of on-going customer relationships;
⎯ customer tolerance to frequency of surveys.
The data collection might be done by the organization itself. This can be economical and, given the organization's knowledge of the product or the customer, it might yield better information. This can also result in a stronger relationship with the customer and a better understanding of customer issues. However, there is a risk that the data might be biased by the relationships of individuals involved in the survey. This risk can be avoided if the data collection is conducted by an independent third party.
Dit document is door NEN onder licentie verstrekt aan: / This document has been supplied under license by NEN to:NEN Alleen voor intern gebruik 17-5-2010 16:55:08
ISO/TS 10004:2010(E)
8 © ISO 2010 – All rights reserved
7.4 Analysing customer satisfaction data
7.4.1 General
Once the data related to customer satisfaction has been collected, it should be analysed to provide information, which typically includes the following:
⎯ the degree of customer satisfaction and its trend;
⎯ aspects of the organization's product or processes that might have significant impact on satisfaction;
⎯ relevant information on competitor's products and processes;
⎯ strengths and primary areas for improvement.
When analysing customer satisfaction data, the organization should consider the activities described in 7.4.2 to 7.4.6. Further guidance on each of these activities is provided in Annex D.
7.4.2 Preparing the data for analysis
The data should be checked for errors, completeness and accuracy, and it should be grouped into defined categories, if necessary.
7.4.3 Determining the method of analysis
The method(s) of analysis should be selected depending on the type of data collected and the objective of the analysis. The various methods for analysing data can be classified as either
a) direct analysis, involving analysis of the customer's responses to specific questions, or
b) indirect analysis, involving the use of various analytical methods to identify potentially influential factors from a body of data.
Typically, both categories of analysis can be used to extract useful information from customer satisfaction data.
7.4.4 Conducting the analysis
The data should be analysed to gain information such as:
⎯ customer satisfaction (overall or by customer category) and trends;
⎯ differences in the degree of satisfaction by customer categories;
⎯ possible causes and their relative effect on customer satisfaction;
⎯ customer loyalty, which is an indicator that the customer is likely to continue to demand the same or other products from the organization.
7.4.5 Validating the analysis
The analysis and its conclusions should be validated, which can be done by various means, e.g.
⎯ segmenting the data to determine possible sources of variability;
⎯ determining the relevance of product characteristics: the characteristics identified as potentially relevant to the customer and their relative importance to the customer (including possible changes in
Dit document is door NEN onder licentie verstrekt aan: / This document has been supplied under license by NEN to:NEN Alleen voor intern gebruik 17-5-2010 16:55:08
ISO/TS 10004:2010(E)
© ISO 2010 – All rights reserved 9
characteristics and the relative importance of the characteristics over time) greatly influence the results of the analysis performed;
⎯ assessing the consistency of the results, by comparison with other indicators or trends in areas that also reflect customer satisfaction, e.g. product sales and customer complaints.
7.4.6 Reporting results and recommendations
The results of the analysis conducted should be documented and reported, together with possible recommendations to assist the organization in identifying areas for improvement, in order ultimately to enhance customer satisfaction.
The report should provide a clear and comprehensive indicator of customer satisfaction. In addition to the data collected directly from customers, there might be other characteristics or measures that reflect customer satisfaction, e.g. those cited in 7.3.2.
Key measures of relevant characteristics can be combined into a consolidated value termed “customer satisfaction index” (CSI). The CSI might, for example, be a weighted average of customer satisfaction survey results and the number of complaints received. The CSI can be a convenient and useful way of measuring and monitoring customer satisfaction over time or space.
The report should also identify the relevant characteristics and components of customer satisfaction, as well as the potential causes of and contributors to customer dissatisfaction.
7.5 Providing feedback for improvement
The information gained from the measurement and analysis of customer satisfaction data should be directed to the appropriate functions in the organization, so that steps might be taken to improve the products, processes or strategies, in order to serve the objectives of the organization.
In order to help achieve this, the organization can
⎯ identify or establish the forums and processes to review customer satisfaction information;
⎯ determine what information should be communicated to whom (including customers);
⎯ formulate action plans for improvement;
⎯ review implementation of action plans and outcomes in appropriate forums, e.g. management reviews.
The on-going implementation of such actions can enhance the effectiveness and efficiency of the organization's quality management system.
Customer satisfaction information (both positive and negative) can help guide the organization to address issues related to meeting stated customer requirements. It can also help the organization to understand and address the customer's expectations, or issues related to the customer's perception of the delivered product or the organization, and thereby enhance customer satisfaction.
Generic guidance on some of the ways in which the information might be used is provided in Annex E.
7.6 Monitoring customer satisfaction
7.6.1 General
Guidance on monitoring customer satisfaction, the actions taken to improve customer satisfaction and the effectiveness of those actions is provided in 7.6.2 to 7.6.5.
Dit document is door NEN onder licentie verstrekt aan: / This document has been supplied under license by NEN to:NEN Alleen voor intern gebruik 17-5-2010 16:55:08
ISO/TS 10004:2010(E)
10 © ISO 2010 – All rights reserved
7.6.2 Examining the customers selected and the data gathered
The organization should verify that the customer(s) or customer group selected are aligned to the purpose of data gathering, and that they are complete and correct. The organization should examine the sources of customer satisfaction data, both direct and indirect, for validity and relevance.
7.6.3 Examining customer satisfaction information
Customer satisfaction information should be monitored by the organization at defined intervals, and by the appropriate level of management. The nature and scope of information monitored is unique to the organization's needs and goals, and might include, for example:
⎯ trends in customer satisfaction data (overall and, for example, by product, region, type of customer);
⎯ comparative or competitor information;
⎯ weaknesses and strengths of the organization's product, processes, practices or personnel;
⎯ challenges or potential opportunities.
7.6.4 Monitoring actions taken to improve customer satisfaction
The organization should monitor the process(es) by which relevant customer satisfaction information is provided to appropriate functions, in order to take actions intended to increase customer satisfaction.
The organization should also monitor the implementation of actions undertaken, as well as the effect of such actions on customer response related to specific characteristics, or on the overall measure of satisfaction.
For example, if customer feedback is related to “poor delivery”, the organization should verify that actions are taken to improve delivery, and that this is reflected in improvement of customer satisfaction in subsequent customer feedback.
7.6.5 Assessing the effectiveness of actions taken
In order to assess the effectiveness of actions taken, the organization should verify that the customer satisfaction information gained is consistent with, or is validated by, other relevant business performance indicators.
For example, if the organization's customer satisfaction measurements show a positive trend, it should typically also be reflected in related business indicators such as increased demand, increased market share, increased repeat customers and increased new customers. If the customer satisfaction measurement trend is not reflected in other business performance indicators, it might point to a limitation or flaw in the customer satisfaction measurement and feedback processes.
Alternatively, it might indicate that the measurement of customer satisfaction failed to consider other factors that influence the customer's decision.
8 Maintenance and improvement of monitoring and measurement processes
The organization should periodically review its processes for monitoring and measuring customer satisfaction, in order to ensure that they are effective and efficient and that they yield information that is current, relevant and useful. Typical actions to consider include the following:
⎯ ensuring that there is a plan, schedule and defined process for monitoring and measuring customer satisfaction;
⎯ reviewing the process of selecting customers and characteristics to ensure they are aligned with business goals and priorities;
Dit document is door NEN onder licentie verstrekt aan: / This document has been supplied under license by NEN to:NEN Alleen voor intern gebruik 17-5-2010 16:55:08
ISO/TS 10004:2010(E)
© ISO 2010 – All rights reserved 11
⎯ ensuring that the process for capturing customer expectations (implicit and explicit) is current and comprehensive in scope and that it includes verification (where possible) with the customer;
⎯ reviewing the indirect indicators of customer satisfaction to ensure the sources are current, comprehensive and relevant;
⎯ ensuring that methods and processes for direct measurement of satisfaction reflect changing customer conditions and business goals;
⎯ verifying that the various components and their relative weights reflect current business priorities, if the customer satisfaction data is consolidated into an indicator such as CSI;
⎯ periodically reviewing the process for validating customer satisfaction information against internal data or other business indicators;
⎯ verifying that the forum and process for on-going review of customer satisfaction information is appropriate and adequate;
⎯ verifying that the process for feedback of customer satisfaction information to relevant functions is operational and effective, e.g. determining if the recipients find the information useful or if the information is utilized;
⎯ identifying impediments and aids to communicating customer satisfaction information in order to promote improvement.
Dit document is door NEN onder licentie verstrekt aan: / This document has been supplied under license by NEN to:NEN Alleen voor intern gebruik 17-5-2010 16:55:08
ISO/TS 10004:2010(E)
12 © ISO 2010 – All rights reserved
Annex A (normative)
Conceptual model of customer satisfaction
A.1 General
This annex provides further information on the conceptual model of customer satisfaction (introduced in Clause 4). It serves as the basis for the guidance provided in this Technical Specification.
A.2 Conceptual model of customer satisfaction
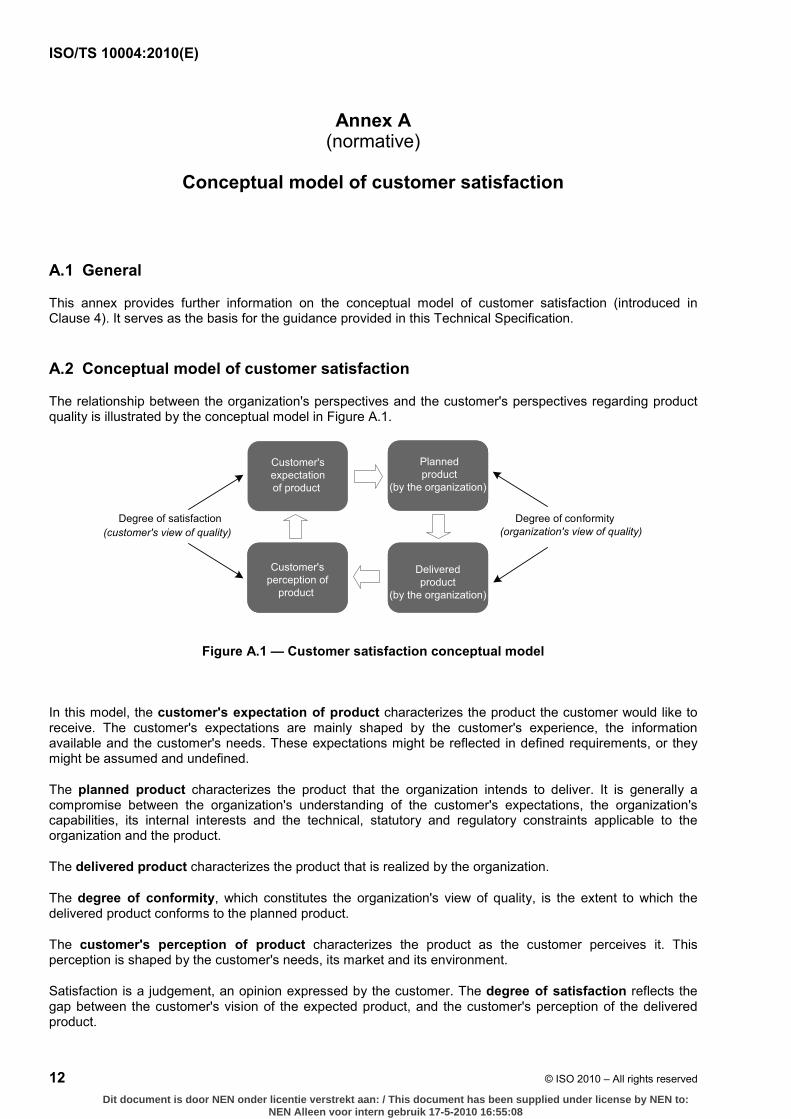
The relationship between the organization's perspectives and the customer's perspectives regarding product quality is illustrated by the conceptual model in Figure A.1.
Plannedproduct
(by the organization)
Deliveredproduct
(by the organization)
Customer'sexpectationof product
Customer'sperception of
product
Degree of satisfaction(customer's view of quality)
Degree of conformity(organization's view of quality)
Figure A.1 — Customer satisfaction conceptual model
In this model, the customer's expectation of product characterizes the product the customer would like to receive. The customer's expectations are mainly shaped by the customer's experience, the information available and the customer's needs. These expectations might be reflected in defined requirements, or they might be assumed and undefined.
The planned product characterizes the product that the organization intends to deliver. It is generally a compromise between the organization's understanding of the customer's expectations, the organization's capabilities, its internal interests and the technical, statutory and regulatory constraints applicable to the organization and the product.
The delivered product characterizes the product that is realized by the organization.
The degree of conformity, which constitutes the organization's view of quality, is the extent to which the delivered product conforms to the planned product.
The customer's perception of product characterizes the product as the customer perceives it. This perception is shaped by the customer's needs, its market and its environment.
Satisfaction is a judgement, an opinion expressed by the customer. The degree of satisfaction reflects the gap between the customer's vision of the expected product, and the customer's perception of the delivered product.
Dit document is door NEN onder licentie verstrekt aan: / This document has been supplied under license by NEN to:NEN Alleen voor intern gebruik 17-5-2010 16:55:08
ISO/TS 10004:2010(E)
© ISO 2010 – All rights reserved 13
Therefore, attention should be paid to both dimensions:
a) the internal measures of quality in the realization processes; and
b) the external measures of the customer's view of how well the organization has met the customer's expectations.
As illustrated in the conceptual model, in order to improve customer satisfaction, the organization needs to close the gap between quality expected by the customer and the customer's perception of delivered quality. In order to do so, the organization should address each of the stages in the conceptual model cycle, i.e.
⎯ thoroughly understand the customer's expectations when defining the planned product and ensure that the customer is fully informed about the product's features and limitations (this is the area of requirements capture, communication and product design),
⎯ deliver product in conformity with the planned product (this is the area of operational management and process control), and
⎯ understand the customer's perception of the delivered product and enhance customer satisfaction through improvements to the product and improved information about the product and its constraints (this is the area of communication, marketing and customer relations).
The organization should consider that customer satisfaction is related not only to product and delivery characteristics, but also to organizational behaviour characteristics.
Dit document is door NEN onder licentie verstrekt aan: / This document has been supplied under license by NEN to:NEN Alleen voor intern gebruik 17-5-2010 16:55:08
ISO/TS 10004:2010(E)
14 © ISO 2010 – All rights reserved
Annex B (normative)
Identification of customer expectations
B.1 General
This annex provides further information and guidance on identifying customer expectations, as outlined in 7.2.
B.2 Identifying the customers
The different types of customers to be surveyed (for determination of customer expectations or customer satisfaction) are listed below, illustrated by examples of customers in different sectors.
a) Current customers are those who have bought the organization's products recently. These might be:
1) regular customers who buy the organization's products or services;
EXAMPLE Customers of a bakery.
2) occasional customers who periodically buy the organization's products.
EXAMPLE Customers of computer shops or a pharmacy.
b) Direct customers are those who buy products directly from the organization. Such customers usually specify their expectations directly to the organization.
EXAMPLE Customers of welding equipment.
c) Indirect customers are those who buy the organization's products through a dealer or another organization. In such cases, it is important for the organization to understand the expectations of the dealer, as well as the expectations of the target customer.
EXAMPLE Customers of portable hand-drilling machines.
d) Potential customers are those who might be interested in the organization's products, but have not yet bought the product. The expectations of such customers might be influenced by the image of the organization, because they have no experience in dealing with the organization.
e) Lost customers are those who have previously bought the organization's product, but have ceased to make further purchases. In such cases, the organization should seek to understand the reasons for the change in the customer's preference.
B.3 Aids to understanding customer expectations
The organization can gain a deeper understanding of customer expectations by considering such aspects as the following:
⎯ the role played by the customer in designing and delivering the product;
⎯ ensuring that customer feedback is designed to reveal information on the customer's expectations and perceived value of the delivered product;
Dit document is door NEN onder licentie verstrekt aan: / This document has been supplied under license by NEN to:NEN Alleen voor intern gebruik 17-5-2010 16:55:08
ISO/TS 10004:2010(E)
© ISO 2010 – All rights reserved 15
⎯ the role of other parties (e.g. a third-party deliverer, or a partner, or both) which might affect the satisfaction of customers;
⎯ how the customer intends to use or deploy the product.
It is the organization's responsibility to understand the customer's expectations and to translate them into requirements.
B.4 Customer expectations and customer satisfaction
Customer satisfaction contains the following two separate segments:
a) satisfaction with specific elements or aspects of the delivered product;
b) overall satisfaction of the customer, which is not the sum (or average) of the individual elements and should therefore be evaluated separately.
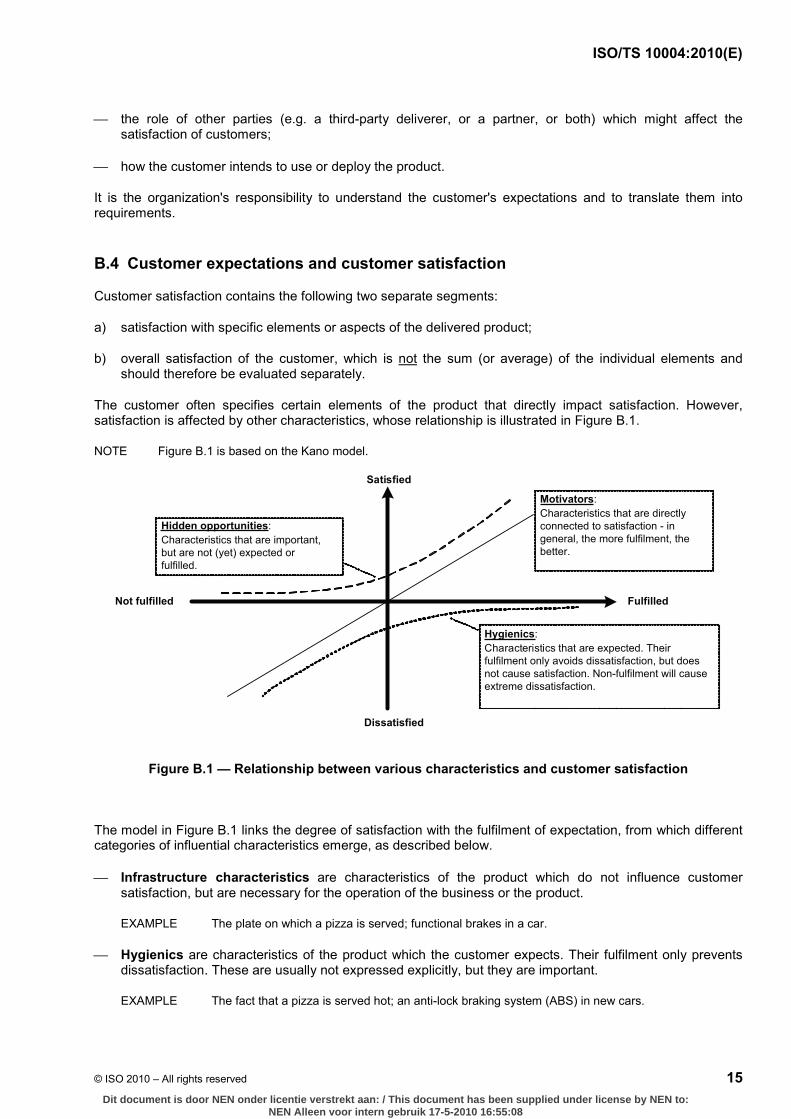
The customer often specifies certain elements of the product that directly impact satisfaction. However, satisfaction is affected by other characteristics, whose relationship is illustrated in Figure B.1.
NOTE Figure B.1 is based on the Kano model.
Not fulfilled Fulfilled
Satisfied
Dissatisfied
Hygienics:Characteristics that are expected. Theirfulfilment only avoids dissatisfaction, but doesnot cause satisfaction. Non-fulfilment will causeextreme dissatisfaction.
Motivators: Characteristics that are directlyconnected to satisfaction - in general, the more fulfilment, thebetter.
Hidden opportunities:Characteristics that are important,but are not (yet) expected orfulfilled.
Figure B.1 — Relationship between various characteristics and customer satisfaction
The model in Figure B.1 links the degree of satisfaction with the fulfilment of expectation, from which different categories of influential characteristics emerge, as described below.
⎯ Infrastructure characteristics are characteristics of the product which do not influence customer satisfaction, but are necessary for the operation of the business or the product.
EXAMPLE The plate on which a pizza is served; functional brakes in a car.
⎯ Hygienics are characteristics of the product which the customer expects. Their fulfilment only prevents dissatisfaction. These are usually not expressed explicitly, but they are important.
EXAMPLE The fact that a pizza is served hot; an anti-lock braking system (ABS) in new cars.
Dit document is door NEN onder licentie verstrekt aan: / This document has been supplied under license by NEN to:NEN Alleen voor intern gebruik 17-5-2010 16:55:08
ISO/TS 10004:2010(E)
16 © ISO 2010 – All rights reserved
⎯ Motivators are characteristics of the product which directly affect the satisfaction or dissatisfaction of the customer, i.e. the better these are fulfilled, the higher the customer's satisfaction. The customer explicitly looks for these characteristics and attaches a high value to them.
EXAMPLE The load volume of a passenger car; gasoline consumption; the size of a pizza.
⎯ Hidden opportunities are characteristics of the product which are potentially very important to customers, but which are not currently articulated or anticipated. These offer future development opportunities and competitive advantage. If such opportunities are not fulfilled, they do not cause dissatisfaction since they were not expected or anticipated, but their fulfilment can have very positive effect on satisfaction. However, it is important to note that such characteristics are subject to change and might rapidly become “expected” factors.
EXAMPLE Serving moist towels to customers in a restaurant; service updates for software; additional product training support.
The characteristics considered above should be regularly monitored because customer expectations continually change. For example, air conditioning in automobiles was a motivation factor when it was first introduced, but is now considered a standard feature, i.e. it is now a hygiene factor.
The organization should consider these characteristics when defining the product. By going beyond the customer's stated expectations, the organization can enhance customer satisfaction.
The categories described above can help the organization to prioritize potential actions for improvement that might result from the analysis of customer data, as described in D.4.3.
Dit document is door NEN onder licentie verstrekt aan: / This document has been supplied under license by NEN to:NEN Alleen voor intern gebruik 17-5-2010 16:55:08
ISO/TS 10004:2010(E)
© ISO 2010 – All rights reserved 17
Annex C (normative)
Direct measurement of customer satisfaction
C.1 General
This annex provides further information and guidance on the steps and activities associated with direct measurement of customer satisfaction, as outlined in 7.3.3.
C.2 Customer satisfaction survey methods
C.2.1 General
Survey methods measuring customer satisfaction can be broadly categorized as qualitative or quantitative. The organization should select survey methods that are appropriate to the objectives and to the type of data to be collected.
C.2.2 Qualitative surveys
C.2.2.1 General
The primary methods used for conducting qualitative surveys are in-depth personal interviews and discussion groups.
C.2.2.2 In-depth personal interviews
In-depth personal interviews can provide a wealth of information about factors that influence satisfaction and their relative importance, as well as an insight into customer expectations and perceptions. They can be conducted face-to-face or via telephone.
Face-to-face interviews allow a deeper understanding of customer expectations. Their duration can range from 45 min to 60 min, or longer. The interview might be partially structured, i.e. based on an outline which helps to address certain basic themes. It is important to allow the respondent to answer freely, and to record responses literally.
Telephone interviews are less costly and can provide results faster.
C.2.2.3 Discussion groups
Discussion groups are typically composed of five to ten participants. They provide less information at the individual level, but the confrontation and exchange of opinions in the group can reveal common opinions and perceptions regarding the principal strengths and weaknesses of the organization's product, as well as the relative importance of the factors of satisfaction. Discussion groups are often a fertile source of information and ideas for improvement.
The two approaches cited above might be combined. For example, in-depth interviews might be followed up with discussion groups. The number of interviews or groups depends on the specific purpose of the survey and on the degree of similarity in the types of customers.
Dit document is door NEN onder licentie verstrekt aan: / This document has been supplied under license by NEN to:NEN Alleen voor intern gebruik 17-5-2010 16:55:08
ISO/TS 10004:2010(E)
18 © ISO 2010 – All rights reserved
C.2.3 Quantitative surveys
The principal methods of obtaining data through quantitative surveys are the following:
⎯ face-to-face interviews or telephone interviews;
⎯ self-completion questionnaires, which might be sent by post, or distributed along with the product, or provided on-line (via the Internet).
Personal face-to-face interviews are less popular because of the cost and the difficulty in obtaining interviews with industrial customers. The more frequently used methods are questionnaires administered by telephone and self-completion questionnaires by mail.
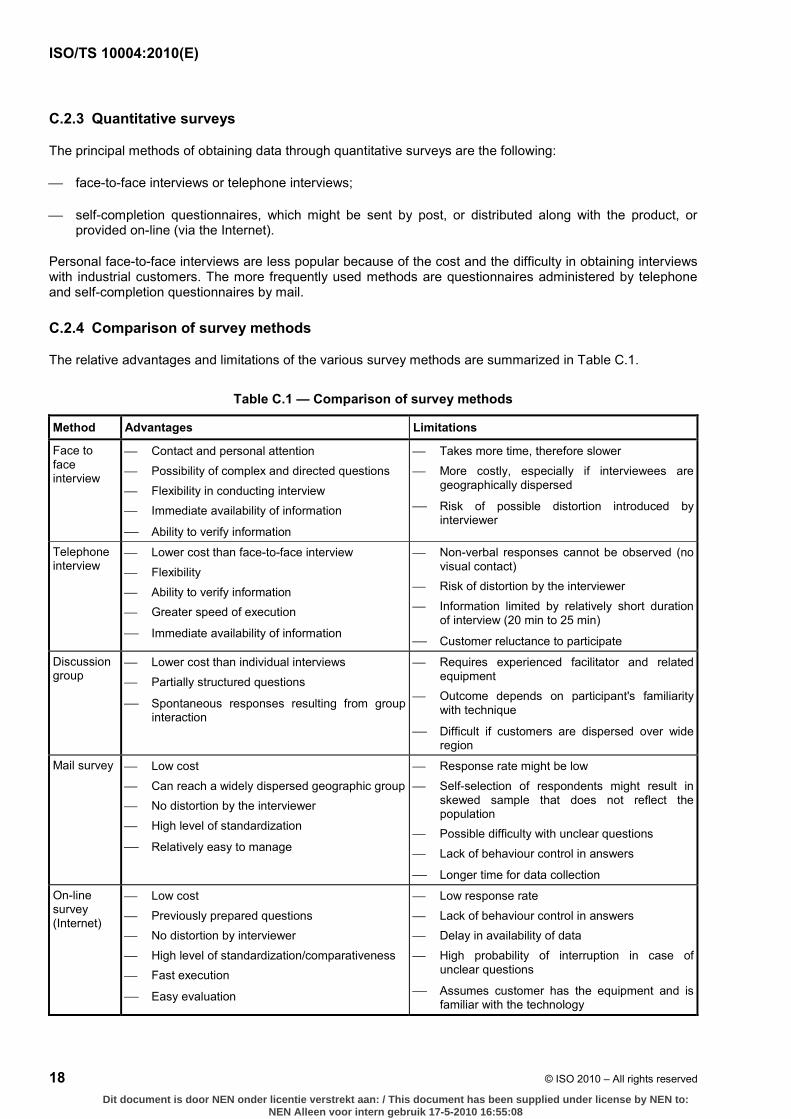
C.2.4 Comparison of survey methods
The relative advantages and limitations of the various survey methods are summarized in Table C.1.
Table C.1 — Comparison of survey methods
Method Advantages Limitations
Face to face interview
⎯ Contact and personal attention
⎯ Possibility of complex and directed questions
⎯ Flexibility in conducting interview ⎯ Immediate availability of information
⎯ Ability to verify information
⎯ Takes more time, therefore slower
⎯ More costly, especially if interviewees are geographically dispersed
⎯ Risk of possible distortion introduced by interviewer
Telephone interview
⎯ Lower cost than face-to-face interview
⎯ Flexibility
⎯ Ability to verify information ⎯ Greater speed of execution
⎯ Immediate availability of information
⎯ Non-verbal responses cannot be observed (no visual contact)
⎯ Risk of distortion by the interviewer
⎯ Information limited by relatively short duration of interview (20 min to 25 min)
⎯ Customer reluctance to participate Discussion group
⎯ Lower cost than individual interviews
⎯ Partially structured questions
⎯ Spontaneous responses resulting from group interaction
⎯ Requires experienced facilitator and related equipment
⎯ Outcome depends on participant's familiarity with technique
⎯ Difficult if customers are dispersed over wide region
Mail survey ⎯ Low cost
⎯ Can reach a widely dispersed geographic group⎯ No distortion by the interviewer
⎯ High level of standardization
⎯ Relatively easy to manage
⎯ Response rate might be low
⎯ Self-selection of respondents might result in skewed sample that does not reflect the population
⎯ Possible difficulty with unclear questions
⎯ Lack of behaviour control in answers
⎯ Longer time for data collection On-line survey (Internet)
⎯ Low cost
⎯ Previously prepared questions ⎯ No distortion by interviewer
⎯ High level of standardization/comparativeness ⎯ Fast execution
⎯ Easy evaluation
⎯ Low response rate
⎯ Lack of behaviour control in answers ⎯ Delay in availability of data
⎯ High probability of interruption in case of unclear questions
⎯ Assumes customer has the equipment and is familiar with the technology
Dit document is door NEN onder licentie verstrekt aan: / This document has been supplied under license by NEN to:NEN Alleen voor intern gebruik 17-5-2010 16:55:08
ISO/TS 10004:2010(E)
© ISO 2010 – All rights reserved 19
The advantages and limitations noted in the table assume that data-gathering is done by the organization. If the survey activity is sub-contracted, some of the comments might not apply.
If the survey response rate is low, the organization should consider other ways of supplementing or verifying the information obtained.
C.3 Sample size and method of sampling
C.3.1 Sample size
The sample size should be statistically determined to assure a specific level of confidence in the results, within a defined margin of error.
EXAMPLE If the organization has no prior information and wishes to estimate the percentage of customers who approve a product feature, at a confidence level of 90 % and an error margin of 2 %, the sample size required is 1 702 (assuming the population is at least five times larger).
The statistically computed sample size might be larger than the size that the organization can support. In practice, the sample size selected is generally a compromise between the desired accuracy and confidence level and the cost or difficulty of sampling.
In the case of qualitative surveys, the sample size is typically small and is usually based on business judgment.
If the number of customers is relatively small, as in a business-to-business context, the entire population might be surveyed. In such cases, several people from each business might be selected.
C.3.2 Method of sampling
The organization also needs to determine how the sample is to be selected, so that the findings are representative of the customer population.
One approach is to select customers through a “random sample”, i.e. where the chance of selecting any customer in the population is the same. This might be used when the population is relatively homogenous, or when there is little or no information about the composition of the population.
Another approach is to use “stratified sampling”, in which the customers are grouped into various categories (or “strata”) in accordance with some criteria, e.g. location, product knowledge or usage, size, attitude (tolerant/complaining), gender/age of customers and potential value to the organization. Proportional samples are then drawn from each strata of the population in order to obtain information from each strata.
C.4 Developing the customer satisfaction questionnaire
C.4.1 Defining the questions
C.4.1.1 General
The design and content of the questions depend on the context and goal in each case, but the steps and considerations outlined below are generally applicable.
C.4.1.2 Determining the information needed
The organization should ensure that the information being sought fully addresses all components of the issue being studied. In addition to the traditional characteristics of quality, delivery and price, there might be other characteristics important to the customer, e.g. communication, or the organization's behaviour, or the
Dit document is door NEN onder licentie verstrekt aan: / This document has been supplied under license by NEN to:NEN Alleen voor intern gebruik 17-5-2010 16:55:08
ISO/TS 10004:2010(E)
20 © ISO 2010 – All rights reserved
organization's stance on public issues. Demographics and other relevant characteristics of the target population should also be considered.
C.4.1.3 Selecting the method for gathering information
The method selected by the organization for gathering information is influenced by logistical considerations in reaching the target population and by the type of information being sought. In turn, the method influences how the desired information is to be obtained.
C.4.1.4 Defining the content of individual questions
The organization should formulate the individual questions to solicit the information required, and ensure the questions are clear to the respondent.
It is also good practice to invite customer comments and suggestions when formulating the questions, in order to avoid ambiguous or confusing customer responses.
C.4.1.5 Considering the respondent
The manner of questioning should consider how articulate, how well informed, or how familiar the respondent is with the product. The organization should minimize the effort required of the respondent, and ensure the search for information is seen to be appropriate and legitimate.
C.4.1.6 Choosing the question wording
The organization should
⎯ define clearly the issue in terms of who, what, when, where, why and how;
⎯ use ordinary language, i.e. words that match the vocabulary of the respondents;
⎯ avoid ambiguous words (e.g. “occasional” or “professional”);
⎯ avoid language that might provide cues to the respondent or bias the respondent by indicating the organization's expectations.
C.4.2 Design of questionnaire
C.4.2.1 General
The questionnaire should begin with clear instructions for use. If appropriate, it should provide guidance on how to address quantitative and/or qualitative questions.
When designing the questionnaire, the following considerations can facilitate the gathering of desired information.
C.4.2.2 Choosing the question structure
The organization should organize the questions in logical sequence where possible, and use more than one question to make it easier for the respondent, if the response involves numerous alternatives.
The questions should be asked in logical order, starting with general questions, followed by more specific queries. Likewise, the priority should be on obtaining basic information first, whilst the relatively difficult, sensitive or complex questions should follow later.
Dit document is door NEN onder licentie verstrekt aan: / This document has been supplied under license by NEN to:NEN Alleen voor intern gebruik 17-5-2010 16:55:08
ISO/TS 10004:2010(E)
© ISO 2010 – All rights reserved 21
C.4.2.3 Determining form and layout
The questionnaire should be easy for the respondent to follow, e.g. containing logically arranged and numbered questions in each section, with clear directions or instructions. Likewise, the layout should be designed to facilitate the analysis of the data gathered, e.g. using vertically aligned columns for responses.
C.4.2.4 Establishing the measurement scale
The measurement scale depends on the type of information being sought and should be clearly defined. When assessing attitudes, a 5-point scale for categories across a continuum is often used.
EXAMPLE 1 “Strongly agree”; “Agree”; “Neutral”; “Disagree”; “Strongly disagree”.
Where greater discrimination is required, a wider scale, e.g. 10-point, might be used.
If the need is to compel the respondent to take a position and avoid a neutral response, the questionnaire can make use of an even number of scale points (e.g. 4 or 6).
EXAMPLE 2 “Very satisfied”; “Satisfied”; “Dissatisfied”; “Very dissatisfied”.
C.4.2.5 Validating by conducting a “pre-test”
A “pre-test” is a preliminary survey conducted with a small, but representative, set of respondents, in order to assess the strengths and weaknesses of the questionnaire. It is a strongly recommended practice, even though it might not be feasible if the number of respondents is limited.
Where possible, all key aspects of the questionnaire should be tested, using the same methods (e.g. by mail or telephone) as in the actual survey. This should be repeated with each significant revision of the questionnaire.
The pre-test results should be analysed to evaluate the method of survey, its scope and clarity, as well as the reaction of respondents, and the survey should be amended as appropriate. For example, if the questionnaire is found to be too long, it might be divided into shorter questionnaires that take less time.
Dit document is door NEN onder licentie verstrekt aan: / This document has been supplied under license by NEN to:NEN Alleen voor intern gebruik 17-5-2010 16:55:08
ISO/TS 10004:2010(E)
22 © ISO 2010 – All rights reserved
Annex D (normative)
Analysis of customer satisfaction data
D.1 General
This annex provides further information and guidance on the analysis of customer satisfaction data, as outlined in 7.4.
D.2 Preparation of data for analysis
D.2.1 Data verification
The organization can verify the collected data, e.g. by checking the following aspects:
⎯ errors or mistakes in the data: these might need to be corrected or removed in order to avoid misleading conclusions;
⎯ completeness of data: it is important to check whether the data obtained from the customer is complete, and to decide on how incomplete responses are to be treated;
⎯ accuracy of data: if sampling techniques are used, it is advisable to confirm that the sample size and method are consistent with the confidence level and margin of error that might have been specified.
D.2.2 Data categorization
Where applicable, the data collected should be prepared for analysis by
⎯ coding open-ended responses into categories, and
⎯ coding responses into groups or segments of respondents.
D.3 Determination of methods for analysis
D.3.1 General
The organization can select the methods of analysis to be used, depending on the data collected and the objectives. Guidance on the use of some of the statistical techniques cited below can be found in ISO/TR 10017:2003 and ISO/TR 13425:2006.
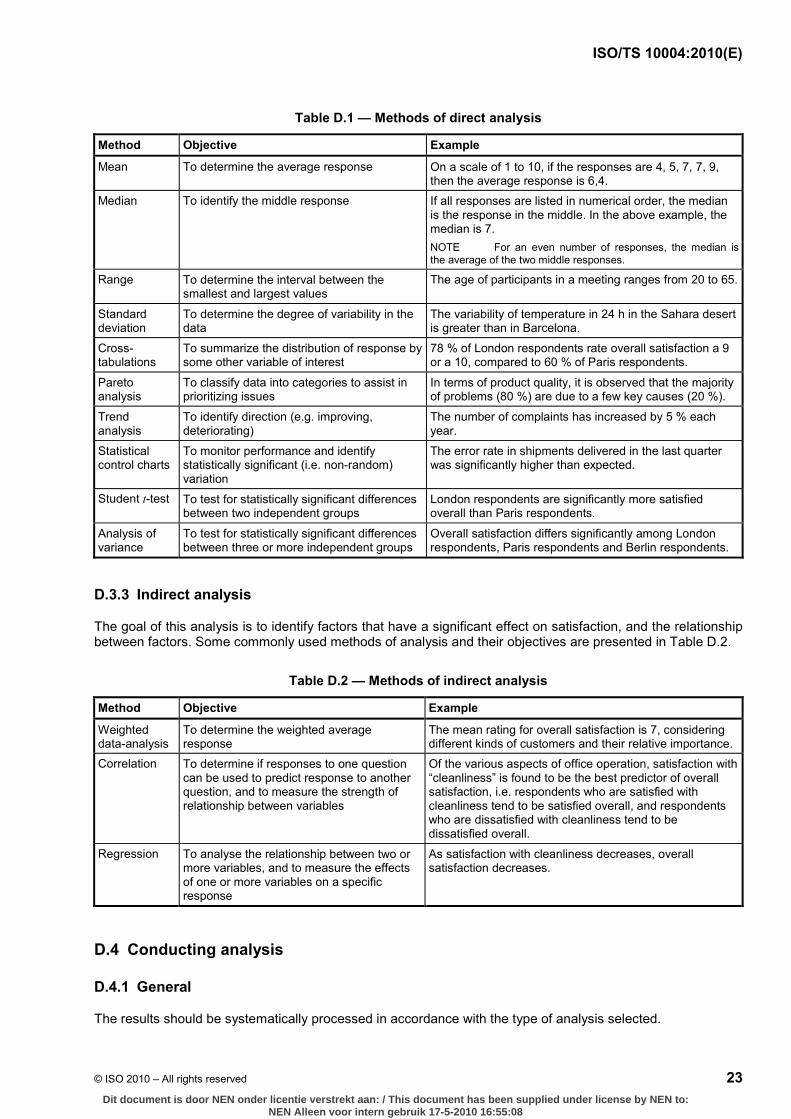
D.3.2 Direct analysis
The goal of this analysis is to describe or evaluate the answers of respondents to specific questions. Some commonly used methods of analysis and their objectives are presented in Table D.1.
Dit document is door NEN onder licentie verstrekt aan: / This document has been supplied under license by NEN to:NEN Alleen voor intern gebruik 17-5-2010 16:55:08
ISO/TS 10004:2010(E)
© ISO 2010 – All rights reserved 23
Table D.1 — Methods of direct analysis
Method Objective Example
Mean To determine the average response On a scale of 1 to 10, if the responses are 4, 5, 7, 7, 9, then the average response is 6,4.
Median To identify the middle response If all responses are listed in numerical order, the median is the response in the middle. In the above example, the median is 7. NOTE For an even number of responses, the median is the average of the two middle responses.
Range To determine the interval between the smallest and largest values
The age of participants in a meeting ranges from 20 to 65.
Standard deviation
To determine the degree of variability in the data
The variability of temperature in 24 h in the Sahara desert is greater than in Barcelona.
Cross-tabulations
To summarize the distribution of response by some other variable of interest
78 % of London respondents rate overall satisfaction a 9 or a 10, compared to 60 % of Paris respondents.
Pareto analysis
To classify data into categories to assist in prioritizing issues
In terms of product quality, it is observed that the majority of problems (80 %) are due to a few key causes (20 %).
Trend analysis
To identify direction (e.g. improving, deteriorating)
The number of complaints has increased by 5 % each year.
Statistical control charts
To monitor performance and identify statistically significant (i.e. non-random) variation
The error rate in shipments delivered in the last quarter was significantly higher than expected.
Student t-test To test for statistically significant differences between two independent groups
London respondents are significantly more satisfied overall than Paris respondents.
Analysis of variance
To test for statistically significant differences between three or more independent groups
Overall satisfaction differs significantly among London respondents, Paris respondents and Berlin respondents.
D.3.3 Indirect analysis
The goal of this analysis is to identify factors that have a significant effect on satisfaction, and the relationship between factors. Some commonly used methods of analysis and their objectives are presented in Table D.2.
Table D.2 — Methods of indirect analysis
Method Objective Example
Weighted data-analysis
To determine the weighted average response
The mean rating for overall satisfaction is 7, considering different kinds of customers and their relative importance.
Correlation To determine if responses to one question can be used to predict response to another question, and to measure the strength of relationship between variables
Of the various aspects of office operation, satisfaction with “cleanliness” is found to be the best predictor of overall satisfaction, i.e. respondents who are satisfied with cleanliness tend to be satisfied overall, and respondents who are dissatisfied with cleanliness tend to be dissatisfied overall.
Regression To analyse the relationship between two or more variables, and to measure the effects of one or more variables on a specific response
As satisfaction with cleanliness decreases, overall satisfaction decreases.
D.4 Conducting analysis
D.4.1 General
The results should be systematically processed in accordance with the type of analysis selected.
Dit document is door NEN onder licentie verstrekt aan: / This document has been supplied under license by NEN to:NEN Alleen voor intern gebruik 17-5-2010 16:55:08
ISO/TS 10004:2010(E)
24 © ISO 2010 – All rights reserved
D.4.2 Data stratification
Data can be classified into defined strata or categories before conducting the analysis. This can reveal useful information, such as differences in the degree of customer satisfaction, e.g. by analysing repeat customers versus one-time buyers, the gender of the buyer, the age of the buyer, the customer location, or by product characteristics such as price and features.
D.4.3 Prioritization
The organization can determine and focus on those characteristics of the product whose improvement would have the more significant effect on satisfaction. Therefore, it is necessary to know the importance the customer attaches to specific characteristics and the effect of those characteristics on overall satisfaction (see Clause B.4).
⎯ Infrastructure characteristics are accorded a low level of importance by the customer; if they were improved, they would have little impact on overall satisfaction. The organization can consider eliminating or reducing investment in them, to reduce costs or provide greater value to the customer.
⎯ Hygienics are characteristics that are important to the customer but which, once a certain threshold has been achieved, have relatively little effect on satisfaction. As with infrastructure characteristics, the organization can consider reducing or eliminating investment in hygienics. However, the performance of hygienics should not fall below acceptable level, as that might have a negative impact on overall satisfaction.
⎯ Motivators are characteristics that are important to customers and which have a significant effect on overall satisfaction. These are obvious areas of focus. The level of performance in motivators should be maintained, or further improved, if this is found to be cost-effective.
⎯ Hidden opportunities are characteristics that are currently not recognized or deemed important by the customer but which, if improved, could significantly increase overall satisfaction. Such characteristics offer the highest potential for improvement of satisfaction.
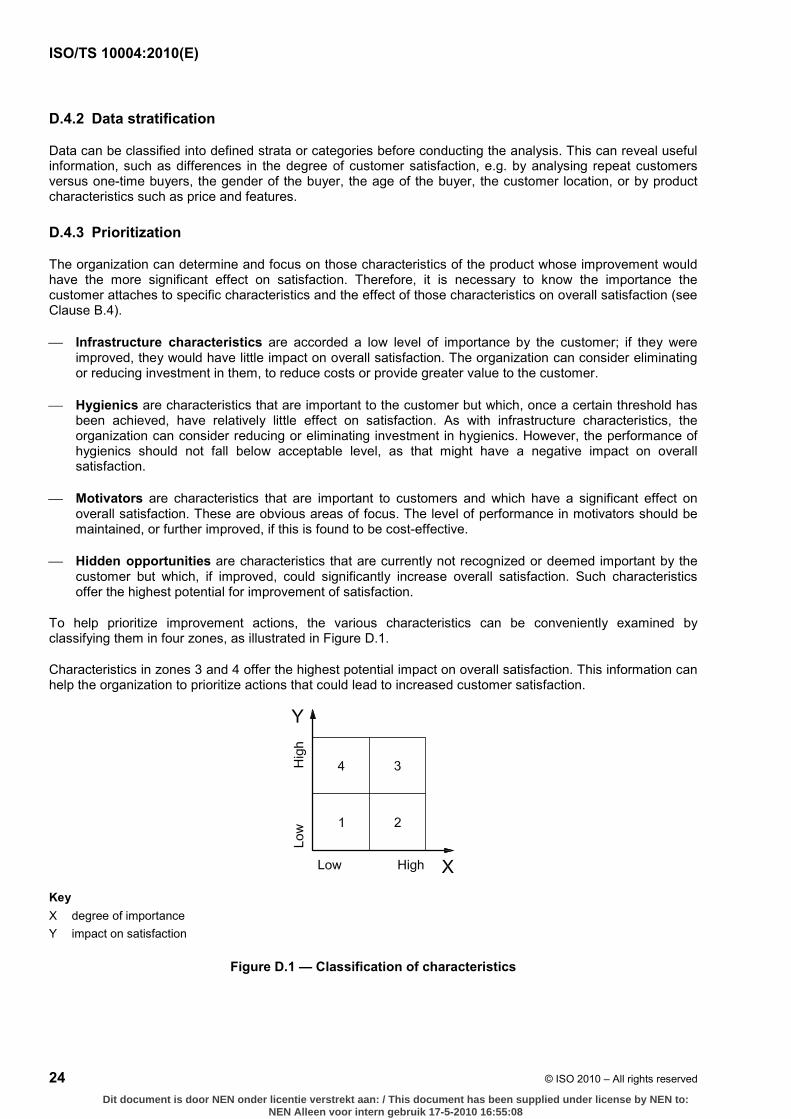
To help prioritize improvement actions, the various characteristics can be conveniently examined by classifying them in four zones, as illustrated in Figure D.1.
Characteristics in zones 3 and 4 offer the highest potential impact on overall satisfaction. This information can help the organization to prioritize actions that could lead to increased customer satisfaction.
Key X degree of importance Y impact on satisfaction
Figure D.1 — Classification of characteristics
Dit document is door NEN onder licentie verstrekt aan: / This document has been supplied under license by NEN to:NEN Alleen voor intern gebruik 17-5-2010 16:55:08
ISO/TS 10004:2010(E)
© ISO 2010 – All rights reserved 25
D.5 Validation of analysis
The soundness of conclusions reached through the customer satisfaction analysis process can be validated by checking, amongst other aspects, those listed below.
a) Segmentation If there is a high degree of variability in the responses, it might be due to variability in the quality of the products delivered. However, if other measurements indicate that product quality is stable, the variability in response might point to poor customer segmentation.
b) Relevance of the characteristics One of the goals of analysis is to identify characteristics which can have a significant influence on customer satisfaction, as well as their importance, which would allow the organization to focus its improvement efforts on key characteristics. If the analysis suggests that characteristics with high influence on customer satisfaction might have been overlooked, they might be identified through appropriate research (e.g. focus groups or open questions). The effect of such characteristics on customer satisfaction should be assessed in the next measurement cycle. The individual characteristics that make up overall satisfaction, and their relative importance, can change over time.
c) Consistency of the results The trend in customer satisfaction measurements should be consistent with other indicators that reflect satisfaction, e.g. repeat purchases or market share. If a positive trend in satisfaction is contradicted by negative trend, for example in sales, it could be for several reasons, e.g.
⎯ the views of the people surveyed are not shared by those who make the decision to purchase;
⎯ there has been an increase in the customer's satisfaction with a competitor's product;
⎯ the price differential outweighs the improvements in other characteristics.
D.6 Reporting of the analysis
D.6.1 General
In addition to reporting the overall customer satisfaction and its trend, the organization can report the relevant characteristics and causes, as well as the components and contributors of customer satisfaction or dissatisfaction.
D.6.2 Presentation of results
The organization can present the results of the analyses tailored to the needs of the audience. It is good practice to avoid identifying specific customers. When identification is intended, prior approval by the customer interviewed is necessary. It should also be in accordance with applicable requirements, regulations and the organization's privacy policy.
Graphic representations are an effective way of displaying information and can be considered when presenting findings, with supporting data gathered in annexes.
A customer satisfaction index (CSI) can be an effective tool for monitoring, reporting and tracking the performance of the organization or its specific aspects, with regard to customer satisfaction. It can be an element of the organization's performance “dashboard”, and also a component of the organization's reward system.
D.6.3 Formulation of conclusions and recommendations
The results of the analysis of customer satisfaction data can help the organization to identify the primary areas for improvement, as well as the potential impact of such improvement.
Dit document is door NEN onder licentie verstrekt aan: / This document has been supplied under license by NEN to:NEN Alleen voor intern gebruik 17-5-2010 16:55:08
ISO/TS 10004:2010(E)
26 © ISO 2010 – All rights reserved
When identifying areas for improvement or recommending specific actions, the organization should give priority to addressing the causes for customer dissatisfaction.
The organization should also seek to understand the reasons for the difference between the product quality expected by the customer and the quality of the delivered product as perceived by the customer (as shown in the conceptual model in Figure A.1), and should take steps to reduce that gap.
Dit document is door NEN onder licentie verstrekt aan: / This document has been supplied under license by NEN to:NEN Alleen voor intern gebruik 17-5-2010 16:55:08
ISO/TS 10004:2010(E)
© ISO 2010 – All rights reserved 27
Annex E (normative)
Using customer satisfaction
E.1 General
This annex provides guidance by means of examples on how customer satisfaction information might be used to guide improvement in the organization's product or processes, as outlined in 7.5.
E.2 Communicating customer satisfaction information to appropriate functions
The analysis of customer satisfaction data can provide insight into factors that influence satisfaction. Such information should be reviewed by executive management and directed to pertinent functions in the organization for action to be taken that leads to improvement.
The function to which the information should be directed depends on the nature of the information, as illustrated by the examples below.
EXAMPLE 1 The information might be directed to the product design or marketing function, if the data indicates customer dissatisfaction with product features, or if the features provided are not valued by the customer.
EXAMPLE 2 The information might be directed to the procurement or engineering function, if the analysis indicates that customer dissatisfaction is associated with the quality or functionality of purchased components.
EXAMPLE 3 The information might be directed to production, if the data indicates customer dissatisfaction with the quality of delivered product.
EXAMPLE 4 The information might be directed to the product packaging function, if dissatisfaction is attributed to packaging issues.
EXAMPLE 5 The information might be directed to production scheduling, if the data indicates dissatisfaction with the timeliness of deliveries.
EXAMPLE 6 The information might be directed to sales and other relevant functions, if the data indicates dissatisfaction with the performance or attitude of staff in direct or indirect contact with customers, indicating the need for better training.
EXAMPLE 7 The information might be directed to the information technology (IT) function, if the customer expresses dissatisfaction with information presented, e.g. via an internet site.
EXAMPLE 8 The information might be directed to the product support function, if the data indicates dissatisfaction with the speed or quality of response to customer requests for help.
EXAMPLE 9 The information might be directed to the customer interface function, if the data warrants response to negative customer feedback.
EXAMPLE 10 The information might be directed to executive management, if price and perceived value are found to be a significant customer issue.
EXAMPLE 11 The information might be directed to executive management, if data reveals potential opportunities for entering new markets or for adapting an existing product to a new customer base.
EXAMPLE 12 The information might be directed to those responsible for planning or measuring customer satisfaction, in order to ensure that the information gained is useful and valid, and to amend relevant processes as appropriate.
Dit document is door NEN onder licentie verstrekt aan: / This document has been supplied under license by NEN to:NEN Alleen voor intern gebruik 17-5-2010 16:55:08
ISO/TS 10004:2010(E)
28 © ISO 2010 – All rights reserved
In the examples above, the information provided to appropriate functions can guide the organization in taking improvement actions and can lead to increased customer satisfaction.
The organization should also consider sharing relevant customer satisfaction information and resulting improvement actions with customers. This can demonstrate the organization's responsiveness to customer issues and encourage customer participation in future measurement of satisfaction.
E.3 Using customer satisfaction information
It can be useful to refer to the conceptual model of customer satisfaction (see Clause 4 and Annex A) in order to ensure that the information gained is fully and effectively utilized.
Customer satisfaction information might point to gaps in understanding customer expectations. In this case, the organization should take steps to ensure that the customer's expectations are well understood and that those expectations are realistic (e.g. that they reflect limitations of technology).
Likewise, customer satisfaction information might point to gaps in the customer's perception of how well its expectations were met. The organization should seek to understand the reasons for the gaps and take steps to address them. This might involve improving the organization's products or processes to meet customer expectations more closely. This might also involve improving the customer's perception of the delivered product by informing the customers about the features and capabilities of the delivered product, e.g. by benchmarking against industry data or against products of competitors. Such analysis and actions are elements of customer relationship management.
Dit document is door NEN onder licentie verstrekt aan: / This document has been supplied under license by NEN to:NEN Alleen voor intern gebruik 17-5-2010 16:55:08
ISO/TS 10004:2010(E)
© ISO 2010 – All rights reserved 29
Bibliography
[1] ISO 9001:2008, Quality management systems — Requirements
[2] ISO 9004:2009, Managing for the sustained success of an organization — A quality management approach
[3] ISO 10001, Quality management — Customer satisfaction — Guidelines for codes of conduct for organizations
[4] ISO 10002, Quality management — Customer satisfaction — Guidelines for complaints handling in organizations
[5] ISO 10003, Quality management — Customer satisfaction — Guidelines for dispute resolution external to organizations
[6] ISO/TR 10017:2003, Guidance on statistical techniques for ISO 9001:2000
[7] ISO/TR 13425:2006, Guidelines for the selection of statistical methods in standardization and specification
Dit document is door NEN onder licentie verstrekt aan: / This document has been supplied under license by NEN to:NEN Alleen voor intern gebruik 17-5-2010 16:55:08

ISO/TS 10004:2010(E)
ICS 03.120.10 Price based on 29 pages
© ISO 2010 – All rights reserved
Dit document is door NEN onder licentie verstrekt aan: / This document has been supplied under license by NEN to:NEN Alleen voor intern gebruik 17-5-2010 16:55:08


![3GPP TS 24 - ARIB · [14] 3GPP TS 22.519: "Technical Specification Group Services and System Aspects; Business communication requirements". [15] 3GPP TS 24.229: "Technical Specification](https://img.pdfslide.us/doc/110x75/5f5546b443ab807dce400081/3gpp-ts-24-14-3gpp-ts-22519-technical-specification-group-services-and.jpg)