Embed Size (px)
Citation preview

Technical Guidelines for CBA Maps:
Guidelines for developing a map of Critical Biodiversity Areas & Ecological Support Areas
using systematic biodiversity planning
First EditionBeta VersionJune 2017
This document has been developed by SANBI at the request of South Africa’s biodiversity planning community. It repre-sents the collective knowledge of members of this commu-nity, based on the experience of more than a decade of de-veloping and implementing biodiversity plans. It also draws on discussions held at the Biodiversity Planning Forum, which has been convened annually by SANBI since 2004.
The document was written by Amanda Driver, Stephen Holness and Fahiema Daniels, drawing on notes from the
Provincial & Metro Biodiversity Planning Work Sessions of 2012 and 2013, and detailed discussion on drafts of the document at the Provincial & Metro Biodiversity Planning Work Sessions in November 2014 and October 2016.
Thanks go to participants of Provincial & Metro Biodiversi-ty Planning Working Group (see Appendix 1), participants of the Biodiversity Planning Forum, and others who have contributed directly or indirectly to the development of these guidelines.
ACKNOWLEDGEMENTS
Notes on the Beta VersionThis version of the Technical Guidelines for CBA Maps is intended for testing and feedback from biodiversity planning practitioners. Comments or suggestions are encouraged, and should be sent to Fahiema Daniels ([email protected]). A final First Edition will be published following feedback on the Beta Version, with subsequent editions anticipated as our practice develops and further lessons and recommended are distilled.
CitationSANBI. 2017. Technical guidelines for CBA Maps: Guidelines for developing a map of Critical Biodiversity Areas & Ecologi-cal Support Areas using systematic biodiversity planning. First Edition (Beta Version), June 2017. Compiled by Driver, A., Holness, S. & Daniels, F. South African National Biodiversity Institute, Pretoria.
Related resources y Lexicon of Biodiversity Planning in South Africa (SANBI, 2016) y Mapping biodiversity priorities: A practical, science-based approach to national biodiversity assessment and prioritisation
to inform strategy and action planning (SANBI & UNEP-WCMC, 2016) y SANBI’s Biodiversity Advisor website: http://biodiversityadvisor.sanbi.org y SANBI’s Biodiversity GIS website: http://bgis.sanbi.org
Design and layout: SANBI Graphics & Editing, 2017.
Technical Guidelines for CBA Maps – Beta Version, June 2017 iii
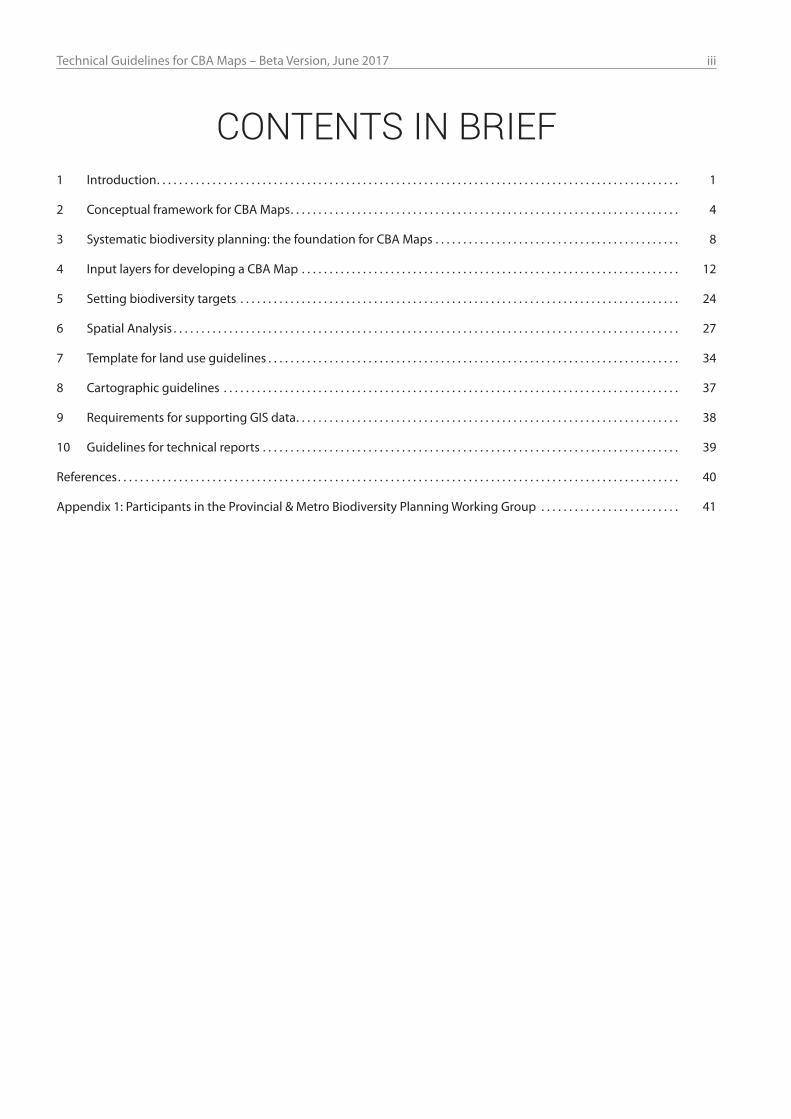
CONTENTS IN BRIEF1 Introduction. . . . . . . . . . . . . . . . . . . . . . . . . . . . . . . . . . . . . . . . . . . . . . . . . . . . . . . . . . . . . . . . . . . . . . . . . . . . . . . . . . . . . . . . . . . . . . 1
2 Conceptual framework for CBA Maps. . . . . . . . . . . . . . . . . . . . . . . . . . . . . . . . . . . . . . . . . . . . . . . . . . . . . . . . . . . . . . . . . . . . . . 4
3 Systematic biodiversity planning: the foundation for CBA Maps . . . . . . . . . . . . . . . . . . . . . . . . . . . . . . . . . . . . . . . . . . . . 8
4 Input layers for developing a CBA Map . . . . . . . . . . . . . . . . . . . . . . . . . . . . . . . . . . . . . . . . . . . . . . . . . . . . . . . . . . . . . . . . . . . . 12
5 Setting biodiversity targets . . . . . . . . . . . . . . . . . . . . . . . . . . . . . . . . . . . . . . . . . . . . . . . . . . . . . . . . . . . . . . . . . . . . . . . . . . . . . . . 24
6 Spatial Analysis . . . . . . . . . . . . . . . . . . . . . . . . . . . . . . . . . . . . . . . . . . . . . . . . . . . . . . . . . . . . . . . . . . . . . . . . . . . . . . . . . . . . . . . . . . . 27
7 Template for land use guidelines . . . . . . . . . . . . . . . . . . . . . . . . . . . . . . . . . . . . . . . . . . . . . . . . . . . . . . . . . . . . . . . . . . . . . . . . . . 34
8 Cartographic guidelines . . . . . . . . . . . . . . . . . . . . . . . . . . . . . . . . . . . . . . . . . . . . . . . . . . . . . . . . . . . . . . . . . . . . . . . . . . . . . . . . . . 37
9 Requirements for supporting GIS data. . . . . . . . . . . . . . . . . . . . . . . . . . . . . . . . . . . . . . . . . . . . . . . . . . . . . . . . . . . . . . . . . . . . . 38
10 Guidelines for technical reports . . . . . . . . . . . . . . . . . . . . . . . . . . . . . . . . . . . . . . . . . . . . . . . . . . . . . . . . . . . . . . . . . . . . . . . . . . . 39
References. . . . . . . . . . . . . . . . . . . . . . . . . . . . . . . . . . . . . . . . . . . . . . . . . . . . . . . . . . . . . . . . . . . . . . . . . . . . . . . . . . . . . . . . . . . . . . . . . . . . . 40
Appendix 1: Participants in the Provincial & Metro Biodiversity Planning Working Group . . . . . . . . . . . . . . . . . . . . . . . . . 41
iv Technical Guidelines for CBA Maps – Beta Version, June 2017
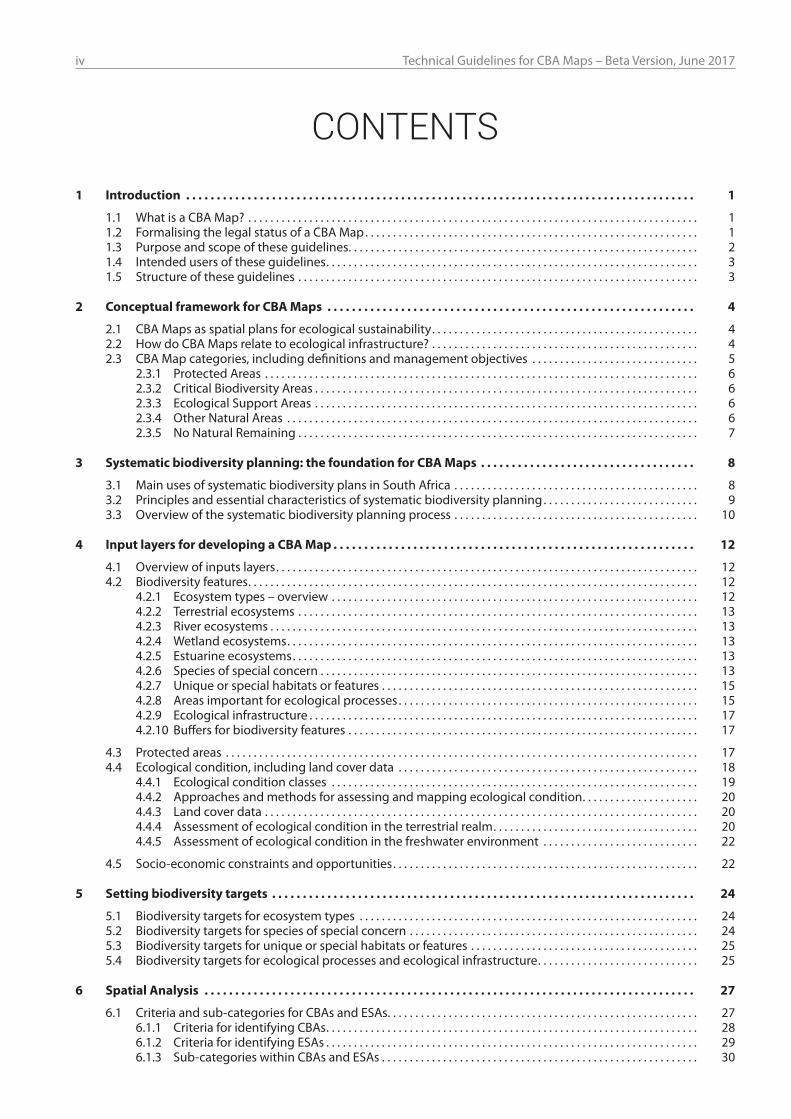
CONTENTS1 Introduction . . . . . . . . . . . . . . . . . . . . . . . . . . . . . . . . . . . . . . . . . . . . . . . . . . . . . . . . . . . . . . . . . . . . . . . . . . . . . . . . . . . 1
1.1 What is a CBA Map? . . . . . . . . . . . . . . . . . . . . . . . . . . . . . . . . . . . . . . . . . . . . . . . . . . . . . . . . . . . . . . . . . . . . . . . . . . . . . . . . . 11.2 Formalising the legal status of a CBA Map . . . . . . . . . . . . . . . . . . . . . . . . . . . . . . . . . . . . . . . . . . . . . . . . . . . . . . . . . . . . 11.3 Purpose and scope of these guidelines. . . . . . . . . . . . . . . . . . . . . . . . . . . . . . . . . . . . . . . . . . . . . . . . . . . . . . . . . . . . . . . 21.4 Intended users of these guidelines. . . . . . . . . . . . . . . . . . . . . . . . . . . . . . . . . . . . . . . . . . . . . . . . . . . . . . . . . . . . . . . . . . . 31.5 Structure of these guidelines . . . . . . . . . . . . . . . . . . . . . . . . . . . . . . . . . . . . . . . . . . . . . . . . . . . . . . . . . . . . . . . . . . . . . . . . 3
2 Conceptual framework for CBA Maps . . . . . . . . . . . . . . . . . . . . . . . . . . . . . . . . . . . . . . . . . . . . . . . . . . . . . . . . . . . . 4
2.1 CBA Maps as spatial plans for ecological sustainability . . . . . . . . . . . . . . . . . . . . . . . . . . . . . . . . . . . . . . . . . . . . . . . . 42.2 How do CBA Maps relate to ecological infrastructure? . . . . . . . . . . . . . . . . . . . . . . . . . . . . . . . . . . . . . . . . . . . . . . . . 42.3 CBA Map categories, including definitions and management objectives . . . . . . . . . . . . . . . . . . . . . . . . . . . . . . 5
2.3.1 Protected Areas . . . . . . . . . . . . . . . . . . . . . . . . . . . . . . . . . . . . . . . . . . . . . . . . . . . . . . . . . . . . . . . . . . . . . . . . . . . . . . 62.3.2 Critical Biodiversity Areas . . . . . . . . . . . . . . . . . . . . . . . . . . . . . . . . . . . . . . . . . . . . . . . . . . . . . . . . . . . . . . . . . . . . . 62.3.3 Ecological Support Areas . . . . . . . . . . . . . . . . . . . . . . . . . . . . . . . . . . . . . . . . . . . . . . . . . . . . . . . . . . . . . . . . . . . . . 62.3.4 Other Natural Areas . . . . . . . . . . . . . . . . . . . . . . . . . . . . . . . . . . . . . . . . . . . . . . . . . . . . . . . . . . . . . . . . . . . . . . . . . . 62.3.5 No Natural Remaining . . . . . . . . . . . . . . . . . . . . . . . . . . . . . . . . . . . . . . . . . . . . . . . . . . . . . . . . . . . . . . . . . . . . . . . . 7
3 Systematic biodiversity planning: the foundation for CBA Maps . . . . . . . . . . . . . . . . . . . . . . . . . . . . . . . . . . . 8
3.1 Main uses of systematic biodiversity plans in South Africa . . . . . . . . . . . . . . . . . . . . . . . . . . . . . . . . . . . . . . . . . . . . 83.2 Principles and essential characteristics of systematic biodiversity planning . . . . . . . . . . . . . . . . . . . . . . . . . . . . 93.3 Overview of the systematic biodiversity planning process . . . . . . . . . . . . . . . . . . . . . . . . . . . . . . . . . . . . . . . . . . . . 10
4 Input layers for developing a CBA Map . . . . . . . . . . . . . . . . . . . . . . . . . . . . . . . . . . . . . . . . . . . . . . . . . . . . . . . . . . . 12
4.1 Overview of inputs layers . . . . . . . . . . . . . . . . . . . . . . . . . . . . . . . . . . . . . . . . . . . . . . . . . . . . . . . . . . . . . . . . . . . . . . . . . . . . 124.2 Biodiversity features. . . . . . . . . . . . . . . . . . . . . . . . . . . . . . . . . . . . . . . . . . . . . . . . . . . . . . . . . . . . . . . . . . . . . . . . . . . . . . . . . 12
4.2.1 Ecosystem types – overview . . . . . . . . . . . . . . . . . . . . . . . . . . . . . . . . . . . . . . . . . . . . . . . . . . . . . . . . . . . . . . . . . . 124.2.2 Terrestrial ecosystems . . . . . . . . . . . . . . . . . . . . . . . . . . . . . . . . . . . . . . . . . . . . . . . . . . . . . . . . . . . . . . . . . . . . . . . . 134.2.3 River ecosystems . . . . . . . . . . . . . . . . . . . . . . . . . . . . . . . . . . . . . . . . . . . . . . . . . . . . . . . . . . . . . . . . . . . . . . . . . . . . . 134.2.4 Wetland ecosystems. . . . . . . . . . . . . . . . . . . . . . . . . . . . . . . . . . . . . . . . . . . . . . . . . . . . . . . . . . . . . . . . . . . . . . . . . . 134.2.5 Estuarine ecosystems. . . . . . . . . . . . . . . . . . . . . . . . . . . . . . . . . . . . . . . . . . . . . . . . . . . . . . . . . . . . . . . . . . . . . . . . . 134.2.6 Species of special concern . . . . . . . . . . . . . . . . . . . . . . . . . . . . . . . . . . . . . . . . . . . . . . . . . . . . . . . . . . . . . . . . . . . . 134.2.7 Unique or special habitats or features . . . . . . . . . . . . . . . . . . . . . . . . . . . . . . . . . . . . . . . . . . . . . . . . . . . . . . . . . 154.2.8 Areas important for ecological processes. . . . . . . . . . . . . . . . . . . . . . . . . . . . . . . . . . . . . . . . . . . . . . . . . . . . . . 154.2.9 Ecological infrastructure . . . . . . . . . . . . . . . . . . . . . . . . . . . . . . . . . . . . . . . . . . . . . . . . . . . . . . . . . . . . . . . . . . . . . . 174.2.10 Buffers for biodiversity features . . . . . . . . . . . . . . . . . . . . . . . . . . . . . . . . . . . . . . . . . . . . . . . . . . . . . . . . . . . . . . . 17
4.3 Protected areas . . . . . . . . . . . . . . . . . . . . . . . . . . . . . . . . . . . . . . . . . . . . . . . . . . . . . . . . . . . . . . . . . . . . . . . . . . . . . . . . . . . . . 174.4 Ecological condition, including land cover data . . . . . . . . . . . . . . . . . . . . . . . . . . . . . . . . . . . . . . . . . . . . . . . . . . . . . . 18
4.4.1 Ecological condition classes . . . . . . . . . . . . . . . . . . . . . . . . . . . . . . . . . . . . . . . . . . . . . . . . . . . . . . . . . . . . . . . . . . 194.4.2 Approaches and methods for assessing and mapping ecological condition. . . . . . . . . . . . . . . . . . . . . 204.4.3 Land cover data . . . . . . . . . . . . . . . . . . . . . . . . . . . . . . . . . . . . . . . . . . . . . . . . . . . . . . . . . . . . . . . . . . . . . . . . . . . . . . 204.4.4 Assessment of ecological condition in the terrestrial realm. . . . . . . . . . . . . . . . . . . . . . . . . . . . . . . . . . . . . 204.4.5 Assessment of ecological condition in the freshwater environment . . . . . . . . . . . . . . . . . . . . . . . . . . . . 22
4.5 Socio-economic constraints and opportunities. . . . . . . . . . . . . . . . . . . . . . . . . . . . . . . . . . . . . . . . . . . . . . . . . . . . . . . 22
5 Setting biodiversity targets . . . . . . . . . . . . . . . . . . . . . . . . . . . . . . . . . . . . . . . . . . . . . . . . . . . . . . . . . . . . . . . . . . . . . 24
5.1 Biodiversity targets for ecosystem types . . . . . . . . . . . . . . . . . . . . . . . . . . . . . . . . . . . . . . . . . . . . . . . . . . . . . . . . . . . . . 245.2 Biodiversity targets for species of special concern . . . . . . . . . . . . . . . . . . . . . . . . . . . . . . . . . . . . . . . . . . . . . . . . . . . . 245.3 Biodiversity targets for unique or special habitats or features . . . . . . . . . . . . . . . . . . . . . . . . . . . . . . . . . . . . . . . . . 255.4 Biodiversity targets for ecological processes and ecological infrastructure. . . . . . . . . . . . . . . . . . . . . . . . . . . . . 25
6 Spatial Analysis . . . . . . . . . . . . . . . . . . . . . . . . . . . . . . . . . . . . . . . . . . . . . . . . . . . . . . . . . . . . . . . . . . . . . . . . . . . . . . . . 27
6.1 Criteria and sub-categories for CBAs and ESAs. . . . . . . . . . . . . . . . . . . . . . . . . . . . . . . . . . . . . . . . . . . . . . . . . . . . . . . . 276.1.1 Criteria for identifying CBAs. . . . . . . . . . . . . . . . . . . . . . . . . . . . . . . . . . . . . . . . . . . . . . . . . . . . . . . . . . . . . . . . . . . 286.1.2 Criteria for identifying ESAs . . . . . . . . . . . . . . . . . . . . . . . . . . . . . . . . . . . . . . . . . . . . . . . . . . . . . . . . . . . . . . . . . . . 296.1.3 Sub-categories within CBAs and ESAs . . . . . . . . . . . . . . . . . . . . . . . . . . . . . . . . . . . . . . . . . . . . . . . . . . . . . . . . . 30
Technical Guidelines for CBA Maps – Beta Version, June 2017 v
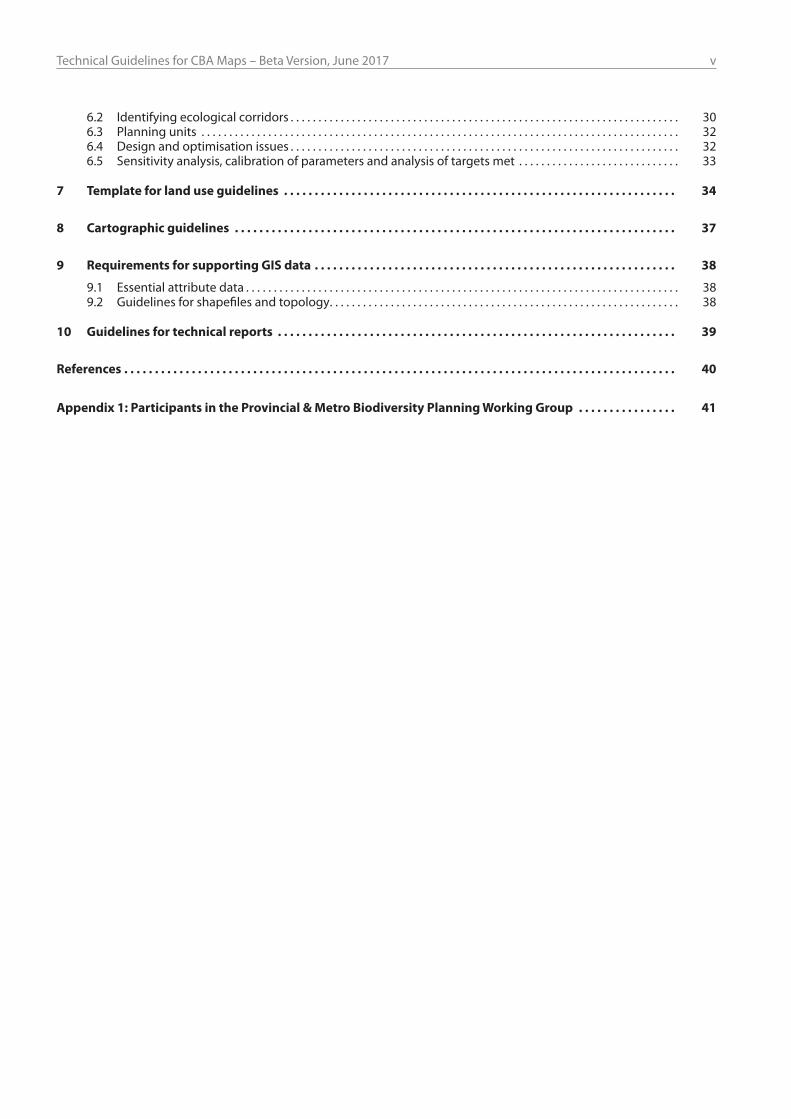
6.2 Identifying ecological corridors . . . . . . . . . . . . . . . . . . . . . . . . . . . . . . . . . . . . . . . . . . . . . . . . . . . . . . . . . . . . . . . . . . . . . . 306.3 Planning units . . . . . . . . . . . . . . . . . . . . . . . . . . . . . . . . . . . . . . . . . . . . . . . . . . . . . . . . . . . . . . . . . . . . . . . . . . . . . . . . . . . . . . 326.4 Design and optimisation issues . . . . . . . . . . . . . . . . . . . . . . . . . . . . . . . . . . . . . . . . . . . . . . . . . . . . . . . . . . . . . . . . . . . . . . 326.5 Sensitivity analysis, calibration of parameters and analysis of targets met . . . . . . . . . . . . . . . . . . . . . . . . . . . . . 33
7 Template for land use guidelines . . . . . . . . . . . . . . . . . . . . . . . . . . . . . . . . . . . . . . . . . . . . . . . . . . . . . . . . . . . . . . . . 34
8 Cartographic guidelines . . . . . . . . . . . . . . . . . . . . . . . . . . . . . . . . . . . . . . . . . . . . . . . . . . . . . . . . . . . . . . . . . . . . . . . . 37
9 Requirements for supporting GIS data . . . . . . . . . . . . . . . . . . . . . . . . . . . . . . . . . . . . . . . . . . . . . . . . . . . . . . . . . . . 38
9.1 Essential attribute data . . . . . . . . . . . . . . . . . . . . . . . . . . . . . . . . . . . . . . . . . . . . . . . . . . . . . . . . . . . . . . . . . . . . . . . . . . . . . . 389.2 Guidelines for shapefiles and topology. . . . . . . . . . . . . . . . . . . . . . . . . . . . . . . . . . . . . . . . . . . . . . . . . . . . . . . . . . . . . . . 38
10 Guidelines for technical reports . . . . . . . . . . . . . . . . . . . . . . . . . . . . . . . . . . . . . . . . . . . . . . . . . . . . . . . . . . . . . . . . . 39
References . . . . . . . . . . . . . . . . . . . . . . . . . . . . . . . . . . . . . . . . . . . . . . . . . . . . . . . . . . . . . . . . . . . . . . . . . . . . . . . . . . . . . . . . . . 40
Appendix 1: Participants in the Provincial & Metro Biodiversity Planning Working Group . . . . . . . . . . . . . . . . 41
vi Technical Guidelines for CBA Maps – Beta Version, June 2017
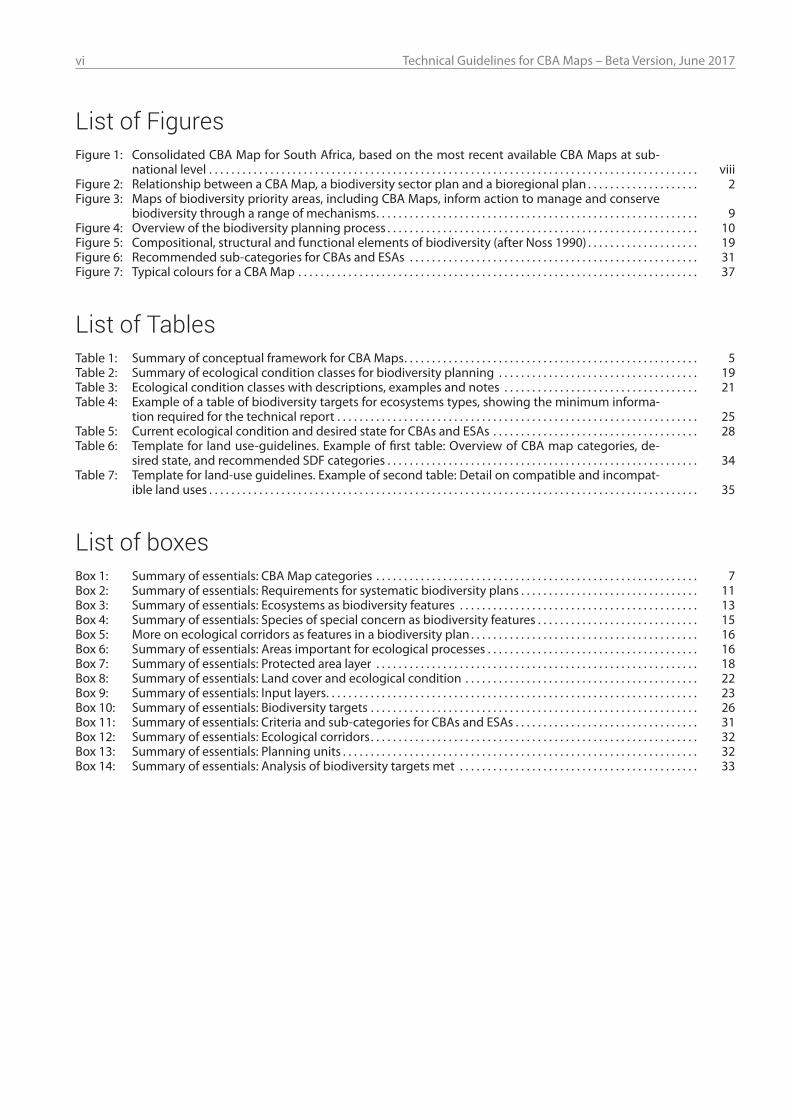
List of FiguresFigure 1: Consolidated CBA Map for South Africa, based on the most recent available CBA Maps at sub-
national level . . . . . . . . . . . . . . . . . . . . . . . . . . . . . . . . . . . . . . . . . . . . . . . . . . . . . . . . . . . . . . . . . . . . . . . . . . . . . . . . . . . . . . . . viiiFigure 2: Relationship between a CBA Map, a biodiversity sector plan and a bioregional plan . . . . . . . . . . . . . . . . . . . . 2Figure 3: Maps of biodiversity priority areas, including CBA Maps, inform action to manage and conserve
biodiversity through a range of mechanisms. . . . . . . . . . . . . . . . . . . . . . . . . . . . . . . . . . . . . . . . . . . . . . . . . . . . . . . . . . 9Figure 4: Overview of the biodiversity planning process . . . . . . . . . . . . . . . . . . . . . . . . . . . . . . . . . . . . . . . . . . . . . . . . . . . . . . . . 10Figure 5: Compositional, structural and functional elements of biodiversity (after Noss 1990) . . . . . . . . . . . . . . . . . . . . 19Figure 6: Recommended sub-categories for CBAs and ESAs . . . . . . . . . . . . . . . . . . . . . . . . . . . . . . . . . . . . . . . . . . . . . . . . . . . . 31Figure 7: Typical colours for a CBA Map . . . . . . . . . . . . . . . . . . . . . . . . . . . . . . . . . . . . . . . . . . . . . . . . . . . . . . . . . . . . . . . . . . . . . . . . 37
List of TablesTable 1: Summary of conceptual framework for CBA Maps. . . . . . . . . . . . . . . . . . . . . . . . . . . . . . . . . . . . . . . . . . . . . . . . . . . . . 5Table 2: Summary of ecological condition classes for biodiversity planning . . . . . . . . . . . . . . . . . . . . . . . . . . . . . . . . . . . . 19Table 3: Ecological condition classes with descriptions, examples and notes . . . . . . . . . . . . . . . . . . . . . . . . . . . . . . . . . . . 21Table 4: Example of a table of biodiversity targets for ecosystems types, showing the minimum informa-
tion required for the technical report . . . . . . . . . . . . . . . . . . . . . . . . . . . . . . . . . . . . . . . . . . . . . . . . . . . . . . . . . . . . . . . . . 25Table 5: Current ecological condition and desired state for CBAs and ESAs . . . . . . . . . . . . . . . . . . . . . . . . . . . . . . . . . . . . . 28Table 6: Template for land use-guidelines. Example of first table: Overview of CBA map categories, de-
sired state, and recommended SDF categories . . . . . . . . . . . . . . . . . . . . . . . . . . . . . . . . . . . . . . . . . . . . . . . . . . . . . . . . 34Table 7: Template for land-use guidelines. Example of second table: Detail on compatible and incompat-
ible land uses . . . . . . . . . . . . . . . . . . . . . . . . . . . . . . . . . . . . . . . . . . . . . . . . . . . . . . . . . . . . . . . . . . . . . . . . . . . . . . . . . . . . . . . . 35
List of boxesBox 1: Summary of essentials: CBA Map categories . . . . . . . . . . . . . . . . . . . . . . . . . . . . . . . . . . . . . . . . . . . . . . . . . . . . . . . . . . 7Box 2: Summary of essentials: Requirements for systematic biodiversity plans . . . . . . . . . . . . . . . . . . . . . . . . . . . . . . . . 11Box 3: Summary of essentials: Ecosystems as biodiversity features . . . . . . . . . . . . . . . . . . . . . . . . . . . . . . . . . . . . . . . . . . . 13Box 4: Summary of essentials: Species of special concern as biodiversity features . . . . . . . . . . . . . . . . . . . . . . . . . . . . . 15Box 5: More on ecological corridors as features in a biodiversity plan . . . . . . . . . . . . . . . . . . . . . . . . . . . . . . . . . . . . . . . . . 16Box 6: Summary of essentials: Areas important for ecological processes . . . . . . . . . . . . . . . . . . . . . . . . . . . . . . . . . . . . . . 16Box 7: Summary of essentials: Protected area layer . . . . . . . . . . . . . . . . . . . . . . . . . . . . . . . . . . . . . . . . . . . . . . . . . . . . . . . . . . 18Box 8: Summary of essentials: Land cover and ecological condition . . . . . . . . . . . . . . . . . . . . . . . . . . . . . . . . . . . . . . . . . . 22Box 9: Summary of essentials: Input layers. . . . . . . . . . . . . . . . . . . . . . . . . . . . . . . . . . . . . . . . . . . . . . . . . . . . . . . . . . . . . . . . . . . 23Box 10: Summary of essentials: Biodiversity targets . . . . . . . . . . . . . . . . . . . . . . . . . . . . . . . . . . . . . . . . . . . . . . . . . . . . . . . . . . . 26Box 11: Summary of essentials: Criteria and sub-categories for CBAs and ESAs . . . . . . . . . . . . . . . . . . . . . . . . . . . . . . . . . 31Box 12: Summary of essentials: Ecological corridors. . . . . . . . . . . . . . . . . . . . . . . . . . . . . . . . . . . . . . . . . . . . . . . . . . . . . . . . . . . 32Box 13: Summary of essentials: Planning units . . . . . . . . . . . . . . . . . . . . . . . . . . . . . . . . . . . . . . . . . . . . . . . . . . . . . . . . . . . . . . . . 32Box 14: Summary of essentials: Analysis of biodiversity targets met . . . . . . . . . . . . . . . . . . . . . . . . . . . . . . . . . . . . . . . . . . . 33
Technical Guidelines for CBA Maps – Beta Version, June 2017 vii
ACRONYMSBGIS Biodiversity GIS
BMP-S Biodiversity Management Plan for Species
CBA Critical Biodiversity Area
CR Critically Endangered
DAFF Department of Agriculture, Forestry and Fisheries
DEA Department of Environmental Affairs
EIA Environmental Impact Assessment
EMF Environmental Management Framework
EN Endangered
ESA Ecological Support Area
FEPA Freshwater Ecosystem Priority Area
GIS Geographic Information System
IDP Integrated Development Plan
IUCN International Union for the Conservation of Nature
NBA National Biodiversity Assessment
NEBP National Estuary Biodiversity Plan
NEMA National Environmental Management Act
NFEPA National Freshwater Ecosystem Priority Areas project
NPAES National Protected Area Expansion Strategy
ONA Other Natural Area
PES Present Ecological State
SANBI South African National Biodiversity Institute
SAPAD South African Protected Area Database
SDF Spatial Development Framework
SEA Strategic Environmental Assessment
SPLUMA Spatial Planning Land-use Management Act
SWSA Strategic Water Source Area
TOPS Threatened or Protected Species
VU Vulnerable
viii Technical Guidelines for CBA Maps – Beta Version, June 2017
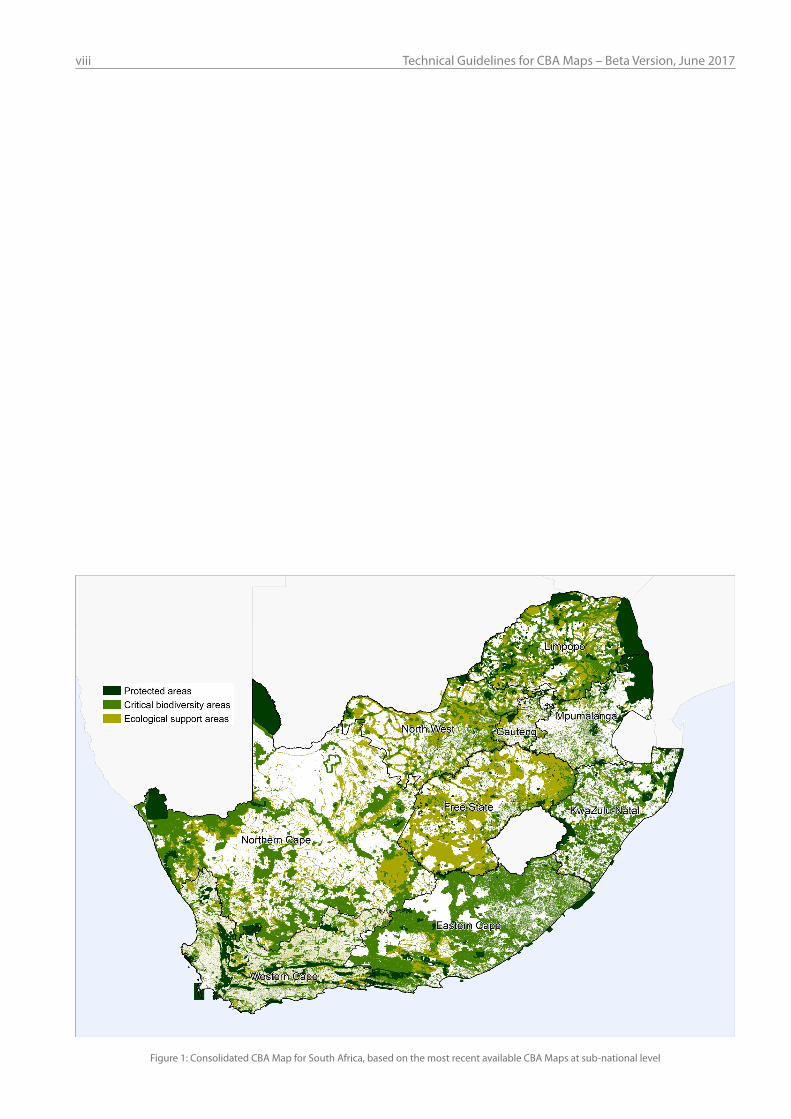
Figure 1: Consolidated CBA Map for South Africa, based on the most recent available CBA Maps at sub-national level
Technical Guidelines for CBA Maps – Beta Version, June 2017 1
This document provides guidelines for biodiversity plan-ning practitioners in South Africa on how to develop and present a map of Critical Biodiversity Areas (CBAs) and Ecological Support Areas (ESAs), or “CBA Map”, based on a systematic biodiversity plan. These guidelines set out the rationale for CBA Maps, and provide minimum technical requirements as well as recommended good practice for developing these maps, based on the collective experi-ence of the biodiversity planning community in South Africa over more than a decade.
This introductory section explains: y What a CBA Map is, y Formalising the legal status of a CBA Map, y The purpose and scope of these guidelines, y The intended users of these guidelines, y How these guidelines are structured.
1.1 What is a CBA Map?A CBA Map is a spatial plan for ecological sustainability. It identifies a set of biodiversity priority areas, called Critical Biodiversity Areas (CBAs) and Ecological Support Areas (ESAs), which, together with protected areas, are impor-tant for the persistence of a viable representative sample of all ecosystem types and species as well as the long-term ecological functioning of the landscape as a whole.
As discussed further in Section 2.1, CBA Maps are a form of strategic planning for the natural environment, pro-viding a coherent and systematically identified set of geographic priorities to inform planning, action and decision-making in support of sustainable development. They should be used by a range of sectors, for example to inform land-use planning, environmental authorisations, agricultural authorisations, mining authorisations, water use licencing, and other decisions that impact on the use and management of natural resources. CBA Maps are also important tools for prioritising conservation action by the biodiversity sector, such as expansion of the protected area network or restoration of critical ecosystems.
CBA Maps are typically developed at the provincial, dis-trict or metropolitan scale, and must be based on a sys-tematic biodiversity plan (see Section 3). At the time of writing, CBA Maps existed for all areas of the country, with varying timeframes for updates. Figure 1 shows a consoli-dated CBA Map for the country, based on the most recent CBA Maps at sub-national level.
1.2 Formalising the legal status of a CBA Map
CBA Maps can be given formal legal status through the National Environmental Management: Biodiversity Act (Act 10 of 2004), hereafter referred to as the Biodiversity Act, which introduced several new legislative tools to assist with the conservation and management of South Africa’s biodiversity. One of these is the declaration of “bioregions” and the publication of bioregional plans. Guidelines for the development of bioregional plans were developed by SANBI at DEA’s request and were published in the Government Gazette in 2009 as the “Guideline re-garding the determination of bioregions and the prepara-tion and publication of bioregional plans”, referred to for short as the Guideline for Bioregional Plans (DEAT, 2009).
According to the Guideline for Bioregional Plans, the pur-pose of a bioregional plan is to provide a map of CBAs and ESAs with accompanying land-use guidelines, to in-form land-use planning, environmental assessment and authorisations, and natural resource management by a range of sectors whose policies and decisions impact on biodiversity. A CBA Map is thus the core component of a bi-oregional plan. Bioregional plans are intended to feed into multi-sectoral planning and assessment processes such as Integrated Development Plans (IDPs), Spatial Develop-ment Frameworks (SDFs), Environmental Management Frameworks (EMFs), Strategic Environmental Assessments (SEAs) and Environmental Impact Assessments (EIAs). The focus of a bioregional plan is on biodiversity priorities; it is not in itself a multi-sectoral planning or assessment tool.
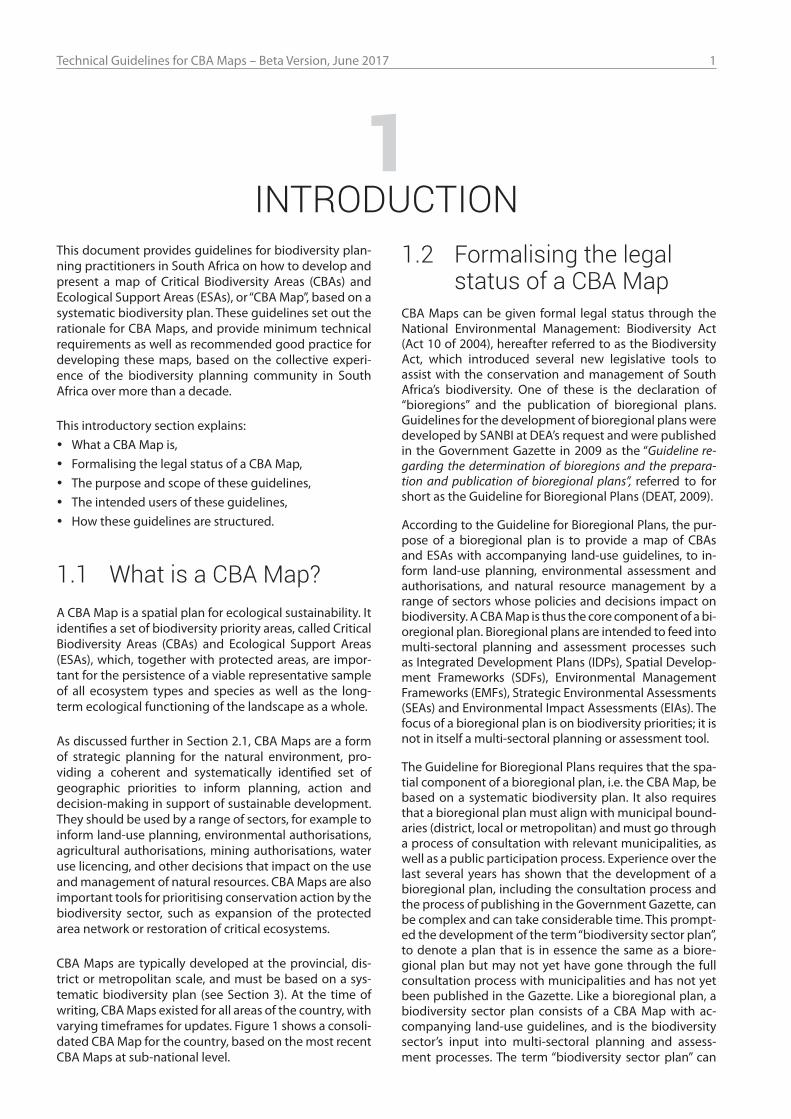
The Guideline for Bioregional Plans requires that the spa-tial component of a bioregional plan, i.e. the CBA Map, be based on a systematic biodiversity plan. It also requires that a bioregional plan must align with municipal bound-aries (district, local or metropolitan) and must go through a process of consultation with relevant municipalities, as well as a public participation process. Experience over the last several years has shown that the development of a bioregional plan, including the consultation process and the process of publishing in the Government Gazette, can be complex and can take considerable time. This prompt-ed the development of the term “biodiversity sector plan”, to denote a plan that is in essence the same as a biore-gional plan but may not yet have gone through the full consultation process with municipalities and has not yet been published in the Gazette. Like a bioregional plan, a biodiversity sector plan consists of a CBA Map with ac-companying land-use guidelines, and is the biodiversity sector’s input into multi-sectoral planning and assess-ment processes. The term “biodiversity sector plan” can
1 INTRODUCTION
2 Technical Guidelines for CBA Maps – Beta Version, June 2017
also be used in cases where a province or municipality may wish to develop and use such a plan without intend-ing to take the step of publishing it as a bioregional plan in terms of the Biodiversity Act.
The relationship between a CBA Map, a biodiversity sec-tor plan and a bioregional plan is shown in Figure 2.
Once a bioregional plan has been published, the Biodi-versity Act requires the municipalities to which it applies to align their IDPs and SDFs with the bioregional plan (see Section 48 of the Act). This helps to ensure that the biore-gional plan has force in land-use planning and authorisa-tions of land-use change.
CBA Maps are also given legal force through the EIA Regu-lations published in terms of the National Environmental Management Act (Act 107 of 1998) (NEMA). Listing Notice 3 of the EIA Regulations specifies geographic areas that trig-ger environmental authorisation processes, including CBAs identified in a bioregional plan or in a spatial biodiversity plan that has been adopted by the relevant authority. This helps to ensure that CBA Maps have force in environmen-tal authorisations for a range of land-use activities. In addi-tion, CBA Maps are often a key informant for Environmental Management Frameworks, which are spatial tools devel-oped in terms of NEMA to proactively identify areas that require varying levels of environmental authorisation.
1.3 Purpose and scope of these guidelines
The purpose of these guidelines includes: y Ensuring an appropriate degree of consistency be-
tween CBA Maps in different parts of South Africa, in order to support their uptake and use in planning and decision-making in a range of sectors, with particular attention paid to:
◦ Consistent definitions and interpretations of CBAs and ESAs,
◦ Consistency in setting biodiversity targets; y Ensuring that CBA Maps are based on best available
science and suitable data; y Ensuring that draft bioregional plans submitted to the
Review Panel for Bioregional Plans1 meet the mini-mum technical requirements in the Guideline for Bi-oregional Plans.
All three of these aspects are important for the integrity of biodiversity plans, and for ensuring that stakeholders and decision-makers can have confidence in these plans for informing land-use planning and decision-making.
At the end of certain sections is a shaded box that summarises essential requirements for the devel-opment of CBA Maps. These are the “take-home mes-sages” of these guidelines, and will be considered es-sential in the review of draft bioregional plans by the Review Panel for Bioregional Plans.
The primary focus of these guidelines is on the land-based environment, including terrestrial, river, wetland, estuarine and coastal ecosystems and areas. Many of the principles and some of the specific requirements and recommen-dations are also likely to be useful in the marine realm2. The terms “landscape”, “land-use planning” and “land-use guidelines” are used frequently in this document. These terms relate not only to the terrestrial realm but also to the aquatic realm, which is an integral part of the landscape and is often influenced directly or indirectly by land use.
These guidelines are not intended to be an introduction to biodiversity planning, to review biodiversity planning products in South Africa, or to provide a manual for bio-diversity planning. For an introduction to spatial biodi-versity assessment and prioritisation using the systematic biodiversity planning approach, see Mapping Biodiversity Priorities (SANBI & UNEP-WCMC, 2016). For a broader dis-cussion on biodiversity planning and biodiversity prior-ity areas in South Africa see Biodiversity for Development (Cadman et al, 2010), and Chapter 12 of the NBA 2011 Synthesis Report (Driver et al, 2012).
These guidelines deal primarily with the technical aspects of developing a CBA Map. They do not cover aspects such as institutional arrangements and stakeholder engage-ment, which are central to the process and are dealt with in the Guideline for Bioregional Plans.
These guidelines focus on spatial biodiversity planning rath-er than spatial biodiversity assessment, and do not include guidance on methods for assessing threat status or protec-tion level of ecosystem types or species. Such assessments are dealt with as part of the National Biodiversity Assess-
Figure 2: Relationship between a CBA Map, a biodiversity sector plan and a bioregional plan
1 The Review Panel for Bioregional Plans is convened by SANBI to review draft bioregional plans before they are published by the Minister or MEC for Environmental Affairs for public comment. This review function is a requirement of the Guideline for Bioregional Plans.
Technical Guidelines for CBA Maps – Beta Version, June 2017 3
ment and in Red List assessments, and the results are taken into account in identifying CBAs and ESAs (see Section 6.1).
1.4 Intended users of these guidelines
These guidelines are designed to be used by biodiversity planning practitioners in South Africa, including govern-ment officials who are tasked with developing provincial biodiversity plans, biodiversity sector plans or bioregional plans, and consultants who are appointed as service pro-viders to assist in these processes. The guidelines are also likely to be useful for users of biodiversity plans who want a better understanding of the concepts and methods used. They may also be useful to academics and research-ers in South Africa and elsewhere, and to systematic bio-diversity planners in other countries.
1.5 Structure of these guidelines
This document is structured as follows: y Section 1 introduces CBA Maps and explains the na-
ture of these guidelines. y Section 2 provides a conceptual framework for CBA
Maps, including the five main categories that appear on a CBA Map and the definition of each one.
y Section 3 provides background on systematic biodi-versity planning, including principles and essential characteristics, and how systematic biodiversity plans are typically used in South Africa.
y Section 4 deals with the various input layers that go into producing a CBA Map, giving minimum require-ments and recommendations for each set of layers. It covers biodiversity features, protected areas, land cover and ecological condition, and socio-economic constraints and opportunities.
y Section 5 deals with setting biodiversity targets for biodiversity features.
y Section 6 deals with the spatial analysis that is re-quired to take the input layers and biodiversity targets and use them to identify a portfolio of CBAs and ESAs.
y Section 7 provides a template for the land-use guide-lines that must accompany a CBA Map.
y Section 8 provides cartographic guidelines for CBA Maps.
y Section 9 provides guidelines on the GIS data prod-ucts that should be made available together with the map product.
y Section 10 provides guidelines on the technical re-port that must be produced and made available to-gether with the map product and GIS data products.
2 At the time of writing a draft Marine Spatial Planning Bill had been published (March 2016) as well as a draft Marine Spatial Planning Frame-work (August 2016). These provide the legal framework and spatial plan-ning tools into which marine biodiversity planning will feed.
4 Technical Guidelines for CBA Maps – Beta Version, June 2017
As mentioned in Section 1.1, a CBA Map is a spatial plan for ecological sustainability. It identifies a set of biodiver-sity priority areas that are important for the persistence of a viable representative sample of all ecosystem types and species as well as the long-term ecological functioning of the landscape as a whole.
This section explains the rationale for CBA Maps in more detail, and then briefly explains the five major catego-ries that appear on the legend of a CBA Map, providing a framework for understanding the more technical sections that follow.
2.1 CBA Maps as spatial plans for ecological sustainability
CBA Maps are a form of strategic planning for the natural environment, identifying a coherent set of geographic ar-eas that provide a spatial plan for ecological sustainability. In order to support the objective of ecological sustainabil-ity in the long term, protected areas and CBAs must stay in natural or near-natural ecological condition and ESAs must retain at least basic ecological processes. Protected areas, CBAs and ESAs can co-exist in a matrix of multiple land uses that range from intensive uses that irreversibly modify the landscape to less intensive or lower impact land uses. A CBA Map provides the most spatially efficient configuration of CBAs and ESAs, minimising conflict with other land uses such as urban development, intensive ag-riculture, forestry and mining. The network of protected areas, CBAs and ESAs is designed to maximise connectiv-ity of natural areas and to avoid further fragmentation of the landscape, which supports landscape-level ecological functioning as well as the ability of ecosystems and spe-cies to adapt to climate change.
In an ideal world, a CBA Map would be developed before any irreversible loss of natural areas took place in the landscape, to proactively identify the optimally config-ured set of areas that should remain natural or semi-nat-ural. Planning for other forms of development could then take those areas fully into account. In practice, CBA Maps are developed for landscapes with varying degrees of hu-man modification, so the CBAs and ESAs identified need to be the best available ones given those constraints. It is often possible to select CBAs and ESAs in a configuration that avoids most conflict or potential conflict with activi-
ties in the landscape that are not compatible with main-taining natural or semi-natural ecological condition. The more heavily and extensively modified the landscape, the fewer options for identifying CBAs and ESAs are likely to remain, and the more trade-offs there may be with other activities and land uses. In landscapes where there is in-tense development pressure, the need to identify CBAs and ESAs is particularly urgent, to ensure that these areas can be proactively considered in further development planning and implementation processes.
The amount of natural habitat that should be retained as CBAs or ESAs is determined through quantitative thresh-olds that are based on the characteristics of the species, ecosystems and ecological processes in the landscape for which the CBA Map is being developed. These quantitative thresholds are known as biodiversity targets, and they help to ensure that CBA Maps have a sound basis in science.
CBA Maps should be used by a range of sectors, for exam-ple to inform land-use planning, environmental authorisa-tions, agricultural authorisations, mining authorisations, water use licencing, and other decisions that impact on the use and management of natural resources. CBA Maps are also important tools for prioritising conservation ac-tion by the biodiversity sector, helping to ensure that the limited resources available for managing and conserving biodiversity (for example, through expansion of the pro-tected area network or restoration of critical ecosystems) are strategically used.
2.2 How do CBA Maps relate to ecological infrastructure?
The concept of ecological infrastructure has gained trac-tion rapidly in South Africa over the past five years or so. Ecological infrastructure refers to naturally functioning ecosystems that generate or deliver valuable services to people, with a single piece of ecological infrastructure often providing several services (for example, wetlands provide flood regulation and water purification services) (SANBI, 2013b). Mapping ecological infrastructure is an emerging area of work within the biodiversity planning community in South Africa, raising the question of how maps of ecological infrastructure relate to CBA Maps.
Many CBA Maps already include elements of ecological infrastructure as part of the CBA and ESA categories. At
2 CONCEPTUAL FRAMEWORK
FOR CBA MAPS
Technical Guidelines for CBA Maps – Beta Version, June 2017 5
the time of writing, biodiversity planners and others were working on identifying and mapping spatial features that represent ecological infrastructure features more com-prehensively. Examples include water source areas, wet-lands, riparian zones, coastal dunes, spawning grounds, and natural forage for pollinators. A further task, also be-ing explored, is to use spatial information on socio-eco-nomic factors to identify those ecological infrastructure features that are most critical or have the highest level of dependence by people. These we can think of as “Critical Ecological Infrastructure”.
Critical Ecological Infrastructure is likely to overlap sig-nificantly with CBAs and ESAs, and ideally the aim should be to include all Critical Ecological Infrastructure on CBA Maps. As progress is made in comprehensively identifying and mapping Critical Ecological Infrastructure, this will become possible. For now it is important to understand that CBA Maps can and often do include many ecological infrastructure features. This is discussed further in Section 4 on input layers for developing a CBA Map.
2.3 CBA Map categories, including definitions and management objectives
There are five main categories that must appear on a CBA Map:
y Protected Areas, y Critical Biodiversity Areas (CBAs), y Ecological Support Areas (ESAs), y Other Natural Areas (ONAs), y Areas with No Natural Habitat Remaining (NNR).
Each category has a broad purpose in relation to the land-scape as a whole, and a broad management objective or
desired state in support of that purpose, summarised in Table 1. Protected areas provide for secure legal protec-tion in the long term and, together with CBAs, allow for viable representative examples of all ecosystem types and species to persist. Historically, protected areas tend-ed to be declared where there were no other competing land uses; going forward, there is increasing emphasis on focusing expansion of the protected area network on areas of highest biodiversity importance (such as CBAs). CBAs are those areas that, together with protected areas, should stay in natural or near-natural condition to allow for viable representative examples of all ecosystem types and species to persist. ESAs are those areas that should at least retain their ecological processes to support the on-going ecological functioning of the landscape as a whole. Other Natural Areas are areas outside the protected area network that are currently natural or semi-natural but have not been identified as CBAs
Provided that protected areas and CBAs remain largely natural, and ecological processes are maintained in ESAs, intensive land uses can be expanded into Other Natural Areas without undue impacts on biodiversity conserva-tion or the ecological sustainability of the landscape as a whole. A range of planning and socio-economic factors will determine the most suitable uses and management objectives for of Other Natural Areas, which should be considered in multi-sectoral spatial planning tools such as Spatial Development Frameworks and Environmental Management Frameworks.
Areas with No Natural Habitat Remaining are areas in which natural habitat has already been severely or irre-versibly modified as a result of intensive human activities, and which generally have low biodiversity importance. As with Other Natural Areas, management objectives for these areas are best determined through multi-sectoral planning processes.
More detailed technical definitions of Protected Areas, CBAs and ESAs are provided below. These technical defi-
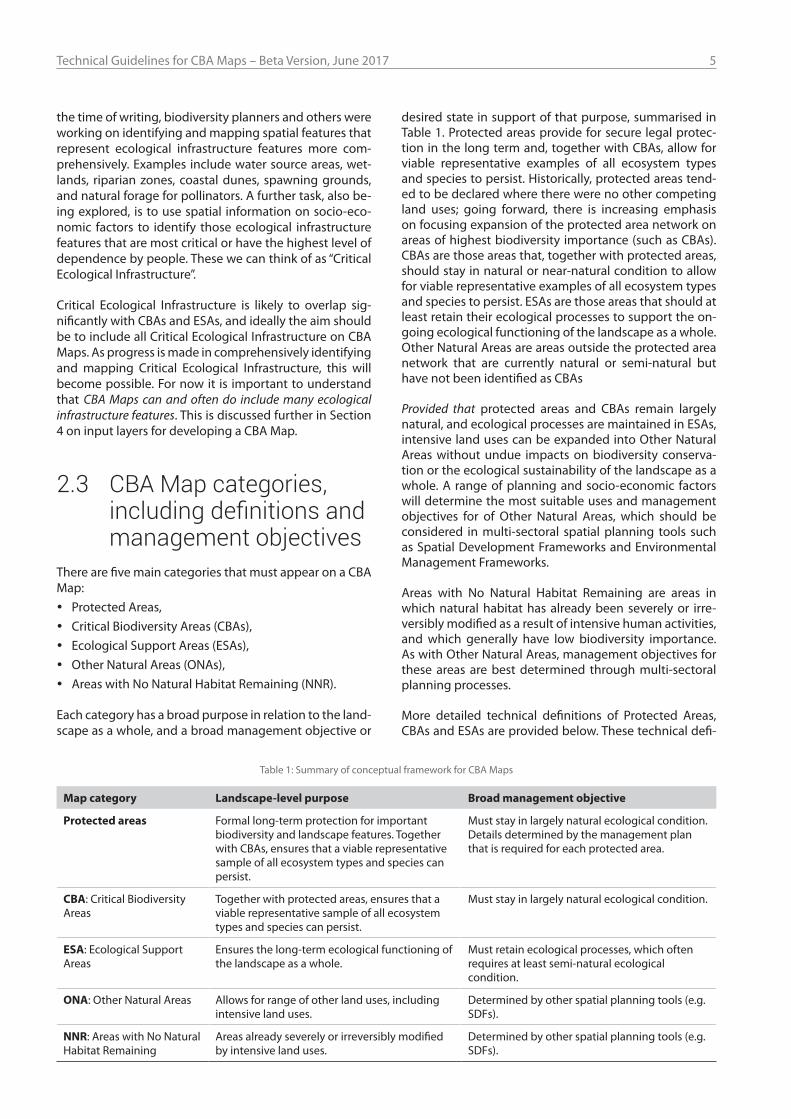
Table 1: Summary of conceptual framework for CBA Maps
Map category Landscape-level purpose Broad management objective
Protected areas Formal long-term protection for important biodiversity and landscape features. Together with CBAs, ensures that a viable representative sample of all ecosystem types and species can persist.
Must stay in largely natural ecological condition. Details determined by the management plan that is required for each protected area.
CBA: Critical Biodiversity Areas
Together with protected areas, ensures that a viable representative sample of all ecosystem types and species can persist.
Must stay in largely natural ecological condition.
ESA: Ecological Support Areas
Ensures the long-term ecological functioning of the landscape as a whole.
Must retain ecological processes, which often requires at least semi-natural ecological condition.
ONA: Other Natural Areas Allows for range of other land uses, including intensive land uses.
Determined by other spatial planning tools (e.g. SDFs).
NNR: Areas with No Natural Habitat Remaining
Areas already severely or irreversibly modified by intensive land uses.
Determined by other spatial planning tools (e.g. SDFs).
6 Technical Guidelines for CBA Maps – Beta Version, June 2017
nitions include a number terms (such as biodiversity fea-tures, biodiversity targets, ecological condition) that are explained in much more detail in Sections 4 to 6.
As noted earlier, these guidelines deal with CBA Maps for the land-based environment, including its aquatic ele-ments. This set of five map categories has not yet been thoroughly applied or tested in the marine environment, which has a different legislative framework for spatial planning. However, the broad conceptual framework for CBA Maps and aspects of the definitions and methods may prove useful in the marine environment.
2.3.1 Protected AreasProtected areas are areas declared or recognised in terms of the National Environmental Management: Protected Areas Act (Act 57 of 2003) (hereafter referred to as the Protected Areas Act). Because they have been secured through legal means and are managed mainly for biodi-versity conservation, protected areas contribute to meet-ing biodiversity targets for those biodiversity features that fall within their boundaries. The remaining portion of the biodiversity targets for all biodiversity features, i.e. that portion not already included in one or more protect-ed areas, must be met in the portfolio of CBAs and ESAs.
Guidelines for the management of protected areas are provided for each protected area by its protected area management plan, which is required in terms of the Pro-tected Areas Act. A biodiversity sector plan or bioregional plan must not provide guidelines for the management of protected areas, but should refer users to the relevant protected area management plan.
2.3.2 Critical Biodiversity AreasA CBA is an area that must remain in good ecological con-dition in order to meet biodiversity targets for ecosystem types, species of special concern or ecological process-es. CBAs can meet biodiversity targets for terrestrial or aquatic features, or both. Together with protected areas, the portfolio of CBAs identified in a biodiversity plan must collectively meet biodiversity targets for representation of ecosystem types and species of special concern3, and may also meet biodiversity targets for some ecological processes.
In most circumstances, a site will be selected as a CBA only if it is currently in good ecological condition. In some circum-stances it may be necessary to select a site in fair ecological condition as a CBA. Only in exceptional circumstances will a site that is severely modified be selected as a CBA4.
The desired state/management objective for a CBA is to maintain it in good ecological condition (or, for those CBAs not in good ecological condition, to restore them to good condition). A biodiversity sector plan or bioregional plan must provide land-use guidelines for CBAs, includ-ing guidelines on which activities are compatible and which are incompatible with the management objective for CBAs.
A distinction is often made between CBA1 and CBA2, or CBA Irreplaceable and CBA Optimal. This is discussed in Section 6.1.
2.3.3 Ecological Support AreasAn ESA is an area that must retain its ecological processes in order to: meet biodiversity targets for ecological pro-cesses that have not been met in CBAs or protected areas; meet biodiversity targets for representation of ecosystem types or species of special concern when it is not possible to meet them in CBAs; support ecological functioning of a protected area or CBA (e.g. protected area buffers); or a combination of these. All ecological processes important for the long-term persistence of ecosystems and species should be adequately included in the portfolio of protect-ed areas, CBAs and ESAs.
Sites selected to form part of ESAs could include sites in good, fair or even severely modified ecological condition, as long as the current ecological condition is compatible with fulfilling the purpose for which the ESA has been se-lected.
The desired state/management objective for most ESAs is to maintain them in at least fair ecological condition. For ESAs that are severely modified, the management objective is no further deterioration in the current ecological condi-tion. A biodiversity sector plan or bioregional plan must provide land-use guidelines for ESAs, including guidelines on which activities are compatible and which are incom-patible with the management objective for ESAs.
A distinction is often made between ESA1 and ESA2. This is discussed in Section 6.1.
2.3.4 Other Natural AreasOther Natural Areas (ONAs) consist of all those areas in good or fair ecological condition that fall outside the pro-tected area network and have not been identified as CBAs or ESAs. A biodiversity sector plan or bioregional plan must not specify the desired state/management objec-tives for ONAs or provide land-use guidelines for ONAs.
3 With the exception of those ecosystem types or species of special concern for which the biodiversity target cannot be achieved in areas in good eco-logical condition and which may require a combination of ESAs and CBAs to meet the target.
4 These circumstances may include severely modified sites that are essential for meeting biodiversity targets for representation of Critically Endangered ecosystem types or threatened species, where the desired state/management objective of the CBA is to restore it to good ecological condition. If the desired state/management objective is to maintain the site in its current severely modified ecological condition (for instance, to provide suitable habi-tat for a threatened species), the site should be selected as an ESA rather than a CBA.
Technical Guidelines for CBA Maps – Beta Version, June 2017 7
2.3.5 No Natural Remaining
Areas with No Natural Habitat Remaining (NNR) are areas in poor ecological condition that have not been identified as CBAs or ESAs. They include all irreversibly modified are-
as (such as urban or industrial areas and mines), and most severely modified areas (such as cultivated fields and for-estry plantations). A biodiversity sector plan or bioregion-al plan must not specify the desired state/management objective or provide land-use guidelines for NNR areas.
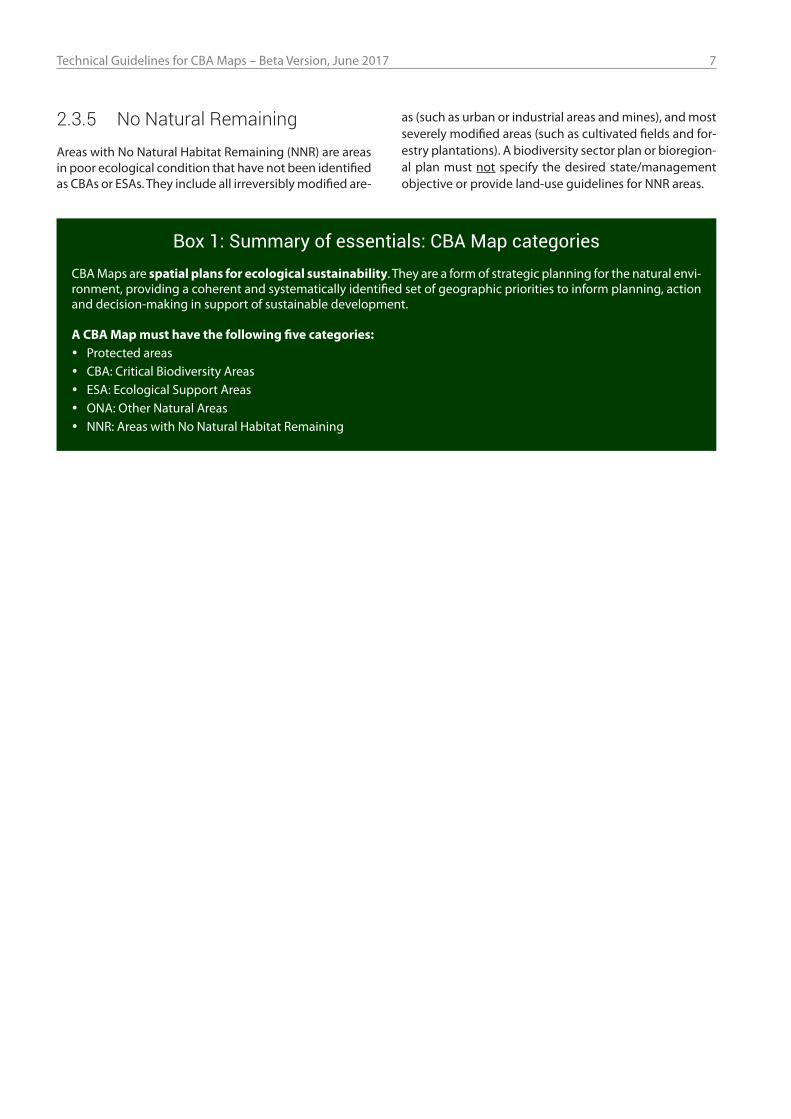
Box 1: Summary of essentials: CBA Map categoriesCBA Maps are spatial plans for ecological sustainability. They are a form of strategic planning for the natural envi-ronment, providing a coherent and systematically identified set of geographic priorities to inform planning, action and decision-making in support of sustainable development.
A CBA Map must have the following five categories: y Protected areas y CBA: Critical Biodiversity Areas y ESA: Ecological Support Areas y ONA: Other Natural Areas y NNR: Areas with No Natural Habitat Remaining
8 Technical Guidelines for CBA Maps – Beta Version, June 2017
Biodiversity planning refers to the process of identifying spatial or geographic biodiversity priority areas. Various approaches to spatial biodiversity prioritisation are pos-sible, including scoring, criteria-based approaches, mul-ti-criteria approaches, and expert or stakeholder driven prioritisation. The approach that has been used in South Africa since the late 1990s, and that has become firmly embedded in the policy and practice of the biodiversity sector, is systematic biodiversity planning, explained be-low. 5 It is the approach required for developing a CBA Map for a bioregional plan.
This section discusses: y Uses of systematic biodiversity plans in South Africa, y Principles and essential characteristics of systematic
biodiversity planning, y An overview of the systematic biodiversity planning
process and products.
The section ends with a summary of the minimum re-quirements for a systematic biodiversity plan used to pro-duce a CBA Map in South Africa.
3.1 Main uses of systematic biodiversity plans in South Africa
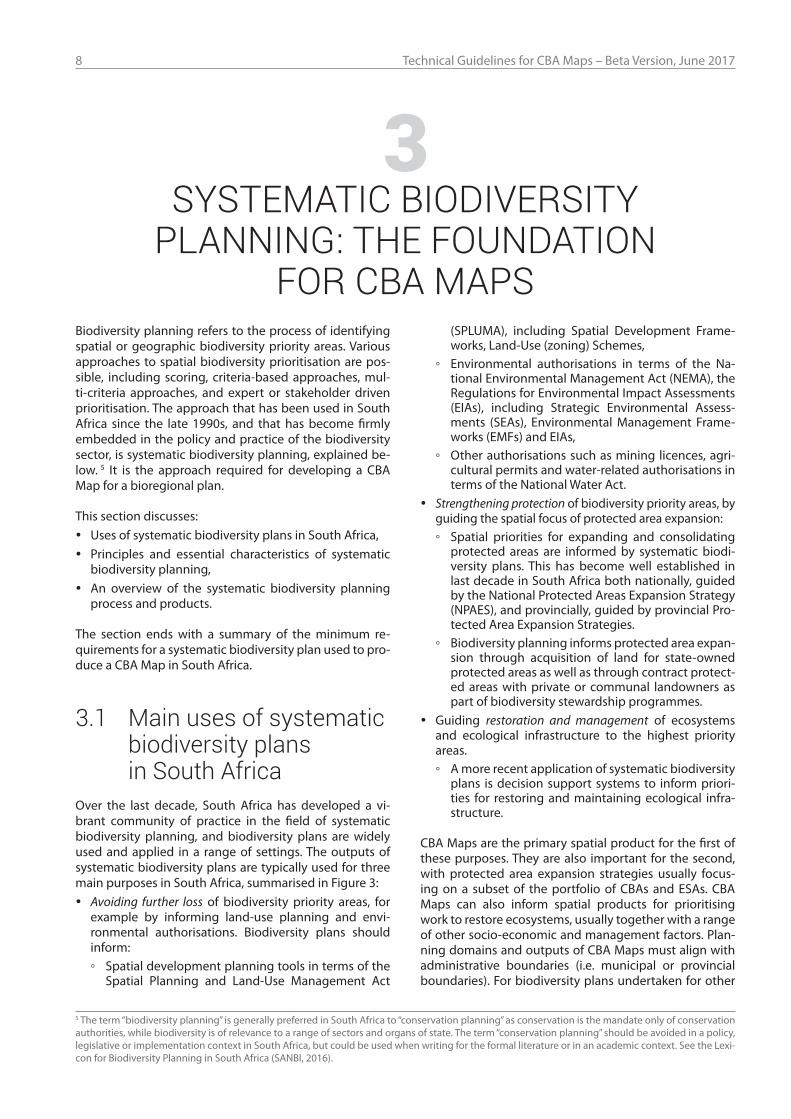
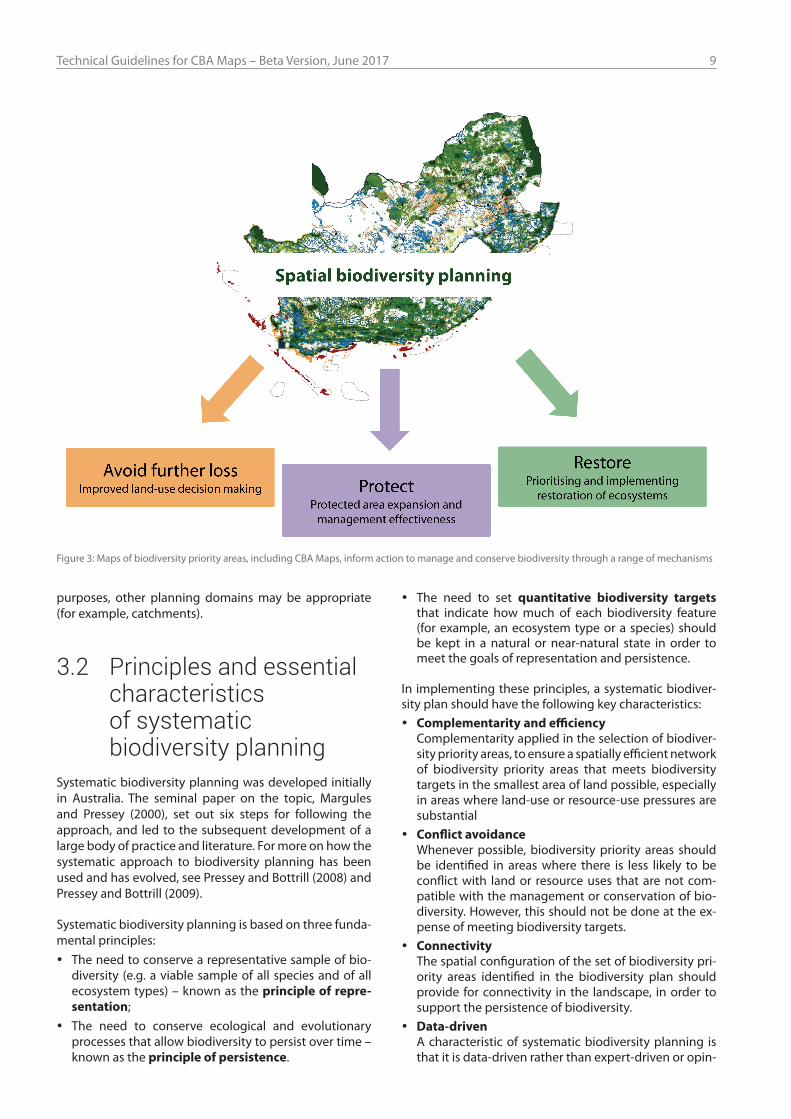
Over the last decade, South Africa has developed a vi-brant community of practice in the field of systematic biodiversity planning, and biodiversity plans are widely used and applied in a range of settings. The outputs of systematic biodiversity plans are typically used for three main purposes in South Africa, summarised in Figure 3:
y Avoiding further loss of biodiversity priority areas, for example by informing land-use planning and envi-ronmental authorisations. Biodiversity plans should inform: ◦ Spatial development planning tools in terms of the
Spatial Planning and Land-Use Management Act
(SPLUMA), including Spatial Development Frame-works, Land-Use (zoning) Schemes,
◦ Environmental authorisations in terms of the Na-tional Environmental Management Act (NEMA), the Regulations for Environmental Impact Assessments (EIAs), including Strategic Environmental Assess-ments (SEAs), Environmental Management Frame-works (EMFs) and EIAs,
◦ Other authorisations such as mining licences, agri-cultural permits and water-related authorisations in terms of the National Water Act.
y Strengthening protection of biodiversity priority areas, by guiding the spatial focus of protected area expansion: ◦ Spatial priorities for expanding and consolidating
protected areas are informed by systematic biodi-versity plans. This has become well established in last decade in South Africa both nationally, guided by the National Protected Areas Expansion Strategy (NPAES), and provincially, guided by provincial Pro-tected Area Expansion Strategies.
◦ Biodiversity planning informs protected area expan-sion through acquisition of land for state-owned protected areas as well as through contract protect-ed areas with private or communal landowners as part of biodiversity stewardship programmes.
y Guiding restoration and management of ecosystems and ecological infrastructure to the highest priority areas. ◦ A more recent application of systematic biodiversity
plans is decision support systems to inform priori-ties for restoring and maintaining ecological infra-structure.
CBA Maps are the primary spatial product for the first of these purposes. They are also important for the second, with protected area expansion strategies usually focus-ing on a subset of the portfolio of CBAs and ESAs. CBA Maps can also inform spatial products for prioritising work to restore ecosystems, usually together with a range of other socio-economic and management factors. Plan-ning domains and outputs of CBA Maps must align with administrative boundaries (i.e. municipal or provincial boundaries). For biodiversity plans undertaken for other
3 SYSTEMATIC BIODIVERSITY
PLANNING: THE FOUNDATION FOR CBA MAPS
5 The term “biodiversity planning” is generally preferred in South Africa to “conservation planning” as conservation is the mandate only of conservation authorities, while biodiversity is of relevance to a range of sectors and organs of state. The term “conservation planning” should be avoided in a policy, legislative or implementation context in South Africa, but could be used when writing for the formal literature or in an academic context. See the Lexi-con for Biodiversity Planning in South Africa (SANBI, 2016).
Technical Guidelines for CBA Maps – Beta Version, June 2017 9
purposes, other planning domains may be appropriate (for example, catchments).
3.2 Principles and essential characteristics of systematic biodiversity planning
Systematic biodiversity planning was developed initially in Australia. The seminal paper on the topic, Margules and Pressey (2000), set out six steps for following the approach, and led to the subsequent development of a large body of practice and literature. For more on how the systematic approach to biodiversity planning has been used and has evolved, see Pressey and Bottrill (2008) and Pressey and Bottrill (2009).
Systematic biodiversity planning is based on three funda-mental principles:
y The need to conserve a representative sample of bio-diversity (e.g. a viable sample of all species and of all ecosystem types) – known as the principle of repre-sentation;
y The need to conserve ecological and evolutionary processes that allow biodiversity to persist over time – known as the principle of persistence.
y The need to set quantitative biodiversity targets that indicate how much of each biodiversity feature (for example, an ecosystem type or a species) should be kept in a natural or near-natural state in order to meet the goals of representation and persistence.
In implementing these principles, a systematic biodiver-sity plan should have the following key characteristics:
y Complementarity and efficiencyComplementarity applied in the selection of biodiver-sity priority areas, to ensure a spatially efficient network of biodiversity priority areas that meets biodiversity targets in the smallest area of land possible, especially in areas where land-use or resource-use pressures are substantial
y Conflict avoidance Whenever possible, biodiversity priority areas should be identified in areas where there is less likely to be conflict with land or resource uses that are not com-patible with the management or conservation of bio-diversity. However, this should not be done at the ex-pense of meeting biodiversity targets.
y ConnectivityThe spatial configuration of the set of biodiversity pri-ority areas identified in the biodiversity plan should provide for connectivity in the landscape, in order to support the persistence of biodiversity.
y Data-drivenA characteristic of systematic biodiversity planning is that it is data-driven rather than expert-driven or opin-
Figure 3: Maps of biodiversity priority areas, including CBA Maps, inform action to manage and conserve biodiversity through a range of mechanisms
10 Technical Guidelines for CBA Maps – Beta Version, June 2017
ion-driven. Expert data, expert input and expert map-ping can and often do play a vital role at various stages in the development of a systematic biodiversity plan, but within the context of an objective, data-driven framework.
y Explicit and repeatableAll data input layers and steps taken in the analysis should be documented. In particular, expert input should always be carefully documented to ensure that the process is explicit and repeatable.
3.3 Overview of the systematic biodiversity planning process
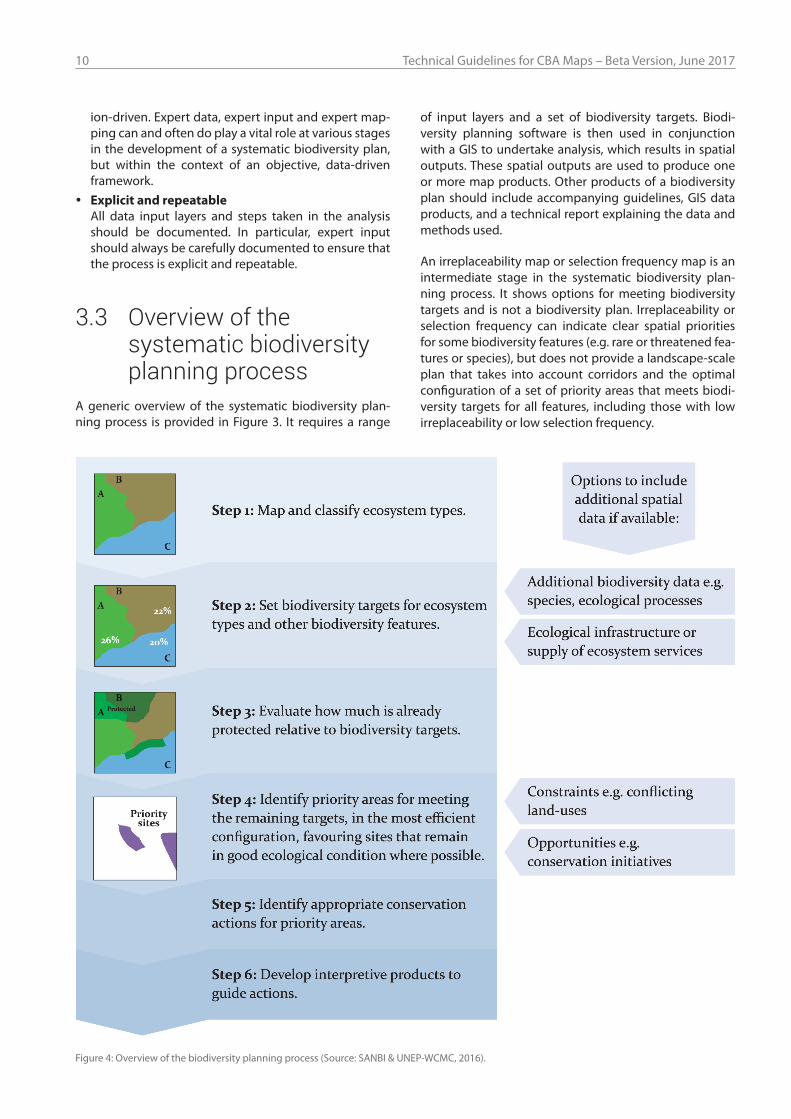
A generic overview of the systematic biodiversity plan-ning process is provided in Figure 3. It requires a range
of input layers and a set of biodiversity targets. Biodi-versity planning software is then used in conjunction with a GIS to undertake analysis, which results in spatial outputs. These spatial outputs are used to produce one or more map products. Other products of a biodiversity plan should include accompanying guidelines, GIS data products, and a technical report explaining the data and methods used.
An irreplaceability map or selection frequency map is an intermediate stage in the systematic biodiversity plan-ning process. It shows options for meeting biodiversity targets and is not a biodiversity plan. Irreplaceability or selection frequency can indicate clear spatial priorities for some biodiversity features (e.g. rare or threatened fea-tures or species), but does not provide a landscape-scale plan that takes into account corridors and the optimal configuration of a set of priority areas that meets biodi-versity targets for all features, including those with low irreplaceability or low selection frequency.
Figure 4: Overview of the biodiversity planning process (Source: SANBI & UNEP-WCMC, 2016).
Technical Guidelines for CBA Maps – Beta Version, June 2017 11
In the early years of systematic biodiversity planning in South Africa, irreplaceability maps were served to end-users in their raw form, and proved not particularly use-ful for informing land-use planning and environmen-tal authorisations. Through working with end users in municipalities and provinces, the biodiversity planning community realised that it was essential for biodiversity
planners to identify a portfolio of priority sites that col-lectively meet all biodiversity targets, in other words to provide a map of priority areas rather than simply a map of options. This led to the development of CBA Maps as the key spatial product of a systematic biodiversity plan, intended specifically to inform land-use planning, land-use decisions and environmental authorisations.
Box 2: Summary of essentials: Requirements for systematic biodiversity plans
Minimum requirements for a biodiversity plan in South Africa include: y Adhering to the principles of representation and persistence y Setting quantitative biodiversity targets for biodiversity features y Applying complementarity in the selection of biodiversity priority areas, to ensure a spatially efficient network
of biodiversity priority areas, especially in areas where land-use or resource-use pressures are substantial y Ensuring that the spatial configuration of the set of biodiversity priority areas provides for connectivity in the
landscape, in order to support the persistence of biodiversity. y Where possible, avoiding conflict with priority areas identified by other sectors (recognising that data by which
to assess this is not always available and that conflict avoidance is not possible for irreplaceable sites) y Ensuring that inputs and decisions in the biodiversity planning process (including expert input) are explicitly
documented so that the process is repeatable
12 Technical Guidelines for CBA Maps – Beta Version, June 2017
The development of a CBA Map requires several spatial data layers that are used as inputs into the spatial analysis process. With just a few essential layers at an appropriate scale, it is possible to produce an adequate CBA Map for informing land-use planning and decision-making at the site scale. Many more input layers can be added, but this is not essential.
This section discusses minimum requirements and rec-ommended practice for the major input layers required to produce a CBA Map. The input layers discussed below are not exhaustive, but should form the foundation for most CBA Maps. An overview of the different input layers is provided, followed by more detailed discussion of each layer or category of layers.
4.1 Overview of inputs layersKey data input layers for a systematic biodiversity plan to produce a CBA Map can be divided into four categories:6
y Biodiversity features, including: ◦ Ecosystems (classified and mapped) ◦ Species of special concern ◦ Unique or special habitats or features ◦ Areas important for ecological processes ◦ Ecological infrastructure
y Protected areas y Ecological condition, including land cover y Socio-economic constraints and opportunities in the
landscape (often built into a cost surface – see Section 6.4)
4.2 Biodiversity featuresData layers on biodiversity features form the foundation of a systematic biodiversity plan. Biodiversity features are divided broadly into two groups:
y Features representing biodiversity pattern – the com-positional and structural aspects of biodiversity, at the species or ecosystem level,
y Features representing ecological processes – the func-tions and processes that operate to maintain and gen-erate biodiversity.
Biodiversity features that are essential for producing a CBA Map are:
y Maps of ecosystems showing different ecosystem types, which provide the most basic set of biodiversity pattern features,
y Landscape-scale ecological corridors, which provide the most basic set of ecological process features.
Additional biodiversity features that may be included are: y Species of special concern, y Unique or special habitats or features, y Other areas important for ecological processes, y Ecological infrastructure.
Each of these sets of biodiversity features is discussed in more detail below.
4.2.1 Ecosystem types – overview Maps of ecosystem types are generally the most funda-mental input layers for producing a CBA Map. An ecosys-tem type is an ecosystem unit or set of ecosystem units that has been identified and delineated (mapped) as part of a hierarchical classification system, based on bi-otic and/or abiotic factors. Ecosystems of the same type are likely to share broadly similar ecological characteris-tics. Ecosystem types provide a coarse-filter surrogate for other components of biodiversity pattern (species and genetic), and give a continuous coverage that avoids the sampling bias usually associated with species data.
South Africa is fortunate to have good national maps of ecosystem types in terrestrial and aquatic realms. For most parts of the country, national maps of ecosystem types are at a fine enough spatial scale to be used in pro-vincial biodiversity plans. A finer scale map is preferable if available, ideally nested within national ecosystem types or at least cross-walked to national ecosystem types to allow for appropriate setting of biodiversity targets (see Section 5.1)
Mapping and classification of ecosystem types has his-torically been better developed in the terrestrial realm than in the freshwater and marine realms. The National Ecosystem Classification System is in the process of being
4 INPUT LAYERS FOR
DEVELOPING A CBA MAP
6 The focus here is specifically on biodiversity plans undertaken to pro-duce CBA Maps. Biodiversity plans undertaken for other purposes do not necessarily need to use all these biodiversity features and other in-put layers as a matter of course.
Technical Guidelines for CBA Maps – Beta Version, June 2017 13
formalised by SANBI in collaboration with partners (SAN-BI, 2013a). It includes terrestrial, river, wetland, estuarine, inshore and offshore marine ecosystem types.7 SANBI’s Bi-odiversity GIS (BGIS) website provides access to the most recent datasets for national ecosystem types.
Below we discuss spatial layers for terrestrial, freshwater and estuarine ecosystems, as these are the ones generally most important for CBA Maps.
4.2.2 Terrestrial ecosystemsTerrestrial ecosystems are generally represented by veg-etation types in the form of a vegetation map. Vegetation types are mapped according to their historical extent, prior to major human modification of the landscape. This means that in areas where the landscape has been severely or irre-versibly modified, the vegetation map represents potential vegetation and does not reflect current land cover.
The Vegetation Map of South Africa8 provides the start-ing point for mapping and classifying terrestrial ecosys-tem types. Ideally, it is better for a province or municipal-ity undertaking a biodiversity plan to have a finer scale vegetation map that is nested within or can be related to national vegetation types, but where finer scale vegeta-tion maps are not available it is generally acceptable to use the national vegetation map. Linking fine-scale veg-etation types to national vegetation types helps to set appropriate biodiversity targets and to understand the broader context of each ecosystem type.
The Department of Agriculture, Forestry and Fisher-ies (DAFF) has mapped and classified indigenous forest types in detail, and these have been integrated into the Vegetation Map of South Africa.9
4.2.3 River ecosystemsNational river ecosystem types were identified and mapped for the National Freshwater Ecosystem Priority Areas project (NFEPA), and used as the basis for identify-ing Freshwater Ecosystem Priority Areas (FEPAs) for rivers. Both the national river ecosystem types and the FEPAs were published in the Atlas of Freshwater Ecosystem Priority Areas (Nel et al, 2011). National river ecosystem types and/or the identified FEPAs can be used, or, if avail-able, finer scale maps of river ecosystem types or provin-cial aquatic priorities can be used.
4.2.4 Wetland ecosystemsThe best available spatial data on wetlands should be used in developing a CBA Map. At the time of writing, significant work was underway to improve the compre-hensiveness and accuracy of the National Wetland Map. In some provinces or areas of the country, better spatial data on wetland data is available than that in the National Wetland Map, and can be used instead of or in addition to the national data. If national data is used, it should be ground-truthed or refined if possible. The National Wet-land Classification System (SANBI, 2009) can be applied to classify wetlands types.
4.2.5 Estuarine ecosystemsA national map of the estuarine functional zone for South Africa’s 291 estuaries was developed for the NBA 2011. The estuarine functional zone includes the open water and floodplain of an estuary, using the 5m contour as the de-fault for delineating the floodplain. Some provinces have refined the national map of the estuarine functional zone, and identified and mapped additional smaller estuaries. The most recent version of mapped estuaries should be used when including estuary data in a biodiversity plan to produce a CBA Map. It is best to use a fine-scale map if one exists; if one is not available then the most recent national layer can be used.
National estuary ecosystem types were also identified for the NBA 2011, and for some estuaries detailed estuarine habitat types have been mapped within the estuarine functional zone. It may be useful to use this information if available.
Box 3: Summary of essentials: Ecosystems as
biodiversity features y Ecosystem types in the terrestrial and freshwater
realms are essential foundational layers for a biodiversity plan, representing a course-filter sur-rogate for biodiversity pattern.
y In general, the finest scale available map of ecosystem types should be used, with the pro-viso that it should preferably be nested within or cross-walked to national ecosystem types.
y In all cases, national maps of ecosystem types should be used if finer scale maps are not available.
4.2.6 Species of special concernWhere good data on species of special concern are availa-ble, they should be included in a biodiversity plan for pro-ducing a CBA Map. Spatial data on species supplement data on ecosystem types, especially for species that may not be sufficiently represented through meeting biodi-versity targets for ecosystem types.
7 The coast includes ecosystem types from the terrestrial, freshwater, es-tuarine and inshore marine realms, and is dealt with as an area in which several realms are in geographic proximity and often linked through ecological processes.
8 Originally published in Mucina & Rutherford (2006). A more recent ver-sion (2012) is available on BGIS.
9 The DAFF forest types have been captured in the 2012 version of the national vegetation map, but they should be checked carefully as there may be discrepancies. This issue was in the process of being resolved at the time of writing, but the DAFF map of forest types takes precedence where there are discrepancies.
14 Technical Guidelines for CBA Maps – Beta Version, June 2017
Two main issues need to be considered: y Which species to include, y What data to use to represent those species as spatial
features.
4.2.6.1 Rationale for choosing species to include as biodiversity features
The rationale for the inclusion of particular species as bio-diversity features should be clear and explicit. Generally speaking, species included as features in a biodiversity plan would be among the broad category species of spe-cial concern. These are species that have particular eco-logical, economic, social or cultural significance, such as:
y Threatened species (Critically Endangered, Endangered or Vulnerable, based on IUCN Red List categories),10
y Other species of conservation concern (based on IUCN Red List categories),
y Harvested or traded species.
Not all species of special concern need be included as features in a biodiversity plan, and species should not be included simply because spatial data for the species ex-ists and is available. The inclusion of common and wide-spread species is generally unnecessary, as these will be represented by ecosystem types. Species that should be included are especially those that would otherwise be likely to “fall through the cracks”, in other words species for which viable populations are unlikely to be secured through representation of ecosystem types because they are rare, localised, or have distributions linked to other (non-ecosystem) variables.
It is important to bear in mind that the primary use of a CBA Map is to inform land-use planning and decision-making, so it is largely only relevant for species that are threatened by loss of natural habitat. Some species of special concern, especially those that are not threatened primarily by habitat loss, may be better served by other tools, such as listing of Threatened or Protected Species (TOPS) or publication of Biodiversity Management Plans for Species (BMP-S) in terms of the Biodiversity Act. In par-ticular, species which use or even favour heavily impact-ed habitats may not be appropriately dealt with through CBA Maps.
Recommendations on which species should be included as biodiversity features are as follows:
y In general, include threatened species: ◦ It is almost always preferable to include Critically En-
dangered and Endangered species (with the provi-so related to widespread threatened species below),
◦ If possible Vulnerable species should also be included, ◦ Threatened species that are also range-restricted
are particularly important to include. y In addition, consider including:
◦ Additional range-restricted species,
◦ Other species of conservation concern, if there is a clear ecological rationale,
◦ Other species of special concern (e.g. culturally or socio-economically important species, such as me-dicinal plants).
y Inclusion of common and widespread species is gener-ally unnecessary, as these will be represented via bio-diversity targets set for ecosystem types.
y Threatened species that are widespread may not be appropriate to include. This is especially the case for threatened but widespread and mobile species that extensively use severely or irreversibly modified habi-tat. These species are usually better dealt with through management plans rather than influencing which ar-eas of the landscape are kept intact.
y Where Biodiversity Management Plans exist for spe-cies, these species could be considered. For example, habitat requirements highlighted in the BMP-S could be used as a biodiversity feature.
Inclusion of any species should be subject to the avail-ability of suitable spatial data (see discussion below on possible forms of species data). Notwithstanding the rec-ommendations above, species should not be included if:
y The data is extremely biased in terms of areas sampled, y There is only low-confidence modelled information on
distribution that may not reflect actual distribution.
4.2.6.2 Types of species data that can be used
Types of data that can be used to represent species spa-tially in a biodiversity plan include:
y Occurrence data (including point locality data or data on known occupied habitat)
y Modelled species distributions y Species population data y Specific sites or habitats known to be important for
the management or conservation of species of special concern
How information about species can be used in the spatial analysis depends to a great extent on the type and quality of data available on the species.
Species occurrence data can take the form of point lo-calities or polygon data for occupied habitat. Care needs to be taken that the data are of sufficient quality to avoid negatively impacting the accuracy of the selection of CBAs and ESAs and thus reducing confidence in the CBA Map. Key considerations for occurrence data are:
y Ensuring that the sampling bias is not too great. The data should reasonably reflect the actual current distri-bution of the species, and not simply places that hap-pen to have been sampled (such as close to roads or in protected areas).
y Ensuring that the data points are sufficiently accurate. Many datasets, especially older ones, often include in-accurate records.10 See www.iucnredlist.org or http://redlist.sanbi.org.
Technical Guidelines for CBA Maps – Beta Version, June 2017 15
y Ensuring that the data points are accurate in terms of current land cover. In particular, records for data points in severely or irreversibly modified sites should be cross-checked to ensure that they are at least plausible.
Modelled species distributions should be used with caution, as use of this data comes with a high risk of mak-ing the CBA Map inaccurate and spatially inefficient. Key considerations include:
y Models should strive to reflect the actual habitat occu-pied as tightly as possible. They should always exclude non-occupied areas that are unlikely to be used by the species concerned (such as irreversibly modified sites).
y Modelled distributions should generally be used only where there is high confidence in the product, in oth-er words where the distribution has been evaluated as “real” based on ecological knowledge of the area and is likely to result in an improved CBA Map. Modelled distri-butions with low or even moderate confidence should not be used, or should only be used with very low tar-gets. Some biodiversity planners feel that it is preferable not to used modelled species distribution data at all.
y If modelled distribution data is used it is important to set low targets for it, even if confidence in the distribu-tion is high – see discussion on biodiversity targets for species (Section 5.2).
In cases where it is available, species population data may be valuable for biodiversity planning processes.
Lastly, point locality data for specific sites or habitats required for the persistence or management of species can be used. Possible examples include nesting sites, breeding sites, critical habitats for species of special con-cern, key sites for species management that have been identified in a BMP-S, and species-related priority areas or features from existing systematic biodiversity plans (such as fish sanctuaries from NFEPA).
4.2.7 Unique or special habitats or features
In some cases, unique or special habitats or features exist at a finer scale than ecosystem types and are not deline-ated in maps of ecosystem types or as areas important for ecological processes (see Section 4.2.9). These can be included in a biodiversity plan as biodiversity features in their own right. They may be important for biodiver-sity pattern or ecological processes or a combination. In some cases these features may be identified and mapped based on expert knowledge of the area concerned, rather than on existing biophysical data layers.
Examples of such features could include: y Micro-habitats that support high concentrations of
endemic species, e.g. quartz patches, caves, small do-lomite areas,
y Free-flowing rivers identified by NFEPA, y Sites that have special international status, e.g. Ramsar
sites
4.2.8 Areas important for ecological processes
Ecological processes operate at a range of spatial scales from the local to the landscape scale, sometimes over very large areas. Examples of ecological processes include breeding, nesting, hunting, foraging, pollination, distur-bances (fire, disease etc), speciation, and migration.
In order to include ecological processes explicitly in a bio-diversity plan, spatial areas that represent those ecologi-cal processes need to be identified and mapped. Some ecological processes are relatively fixed in space and thus
Box 4: Summary of essentials: Species of special concern as biodiversity features
Consideration must be given to which species to include as biodiversity features: y It is important to have a clear and explicit rationale for which species to include, and not simply to include all
species for which spatial data is available. y If possible, include threatened species (CR, EN, VU) for which data is available (subject to cautions about accuracy
of data). y Additional species of special concern could include species of conservation concern (over and above threatened
species), range-restricted species, and species of particular socio-economic or cultural significance. y A CBA Map may not be the most effective tool for management and conservation of all species, especially those
that are not threatened primarily by habitat loss.
Various types of species data can be used, with point locality data and modelled species distributions being the most regularly used:
y Include point locality data for those species selected if available, subject to cautions about reasonable coverage, accuracy and confidence in the data.
y In general, be very cautious about using modelled species distributions as a feature.
16 Technical Guidelines for CBA Maps – Beta Version, June 2017
relatively easy to delineate spatially (such as nesting sites or a riverine corridor), while others are spatially variable or flexible and thus more difficult to delineate spatially (such as the operation of disturbances at the landscape scale).
Ecological corridors are corridors of intact habitat (i.e. in good or at least fair ecological condition) that allow for a range of ecological processes to occur over time and space. They promote connectivity and linkages in the landscape, for example between core areas important for biodiversity conservation and management, such as protected areas and CBAs. In most contexts, it is useful for a biodiversity plan to identify ecological corridors that should be kept intact in order to allow for the ongo-ing functioning of ecological processes across the land-scape.
Areas important for ecological processes often play an important role in climate change adaptation, either by acting as climate change refugia at the local scale or by providing landscape-scale gradients for the movement of species in response to climate change.
Including ecological processes in a biodiversity plan can be approached in a complex way or can be relatively sim-ple. Spatial components of ecological processes can be mapped or modelled. They can be included in a biodiver-sity plan either through setting explicit biodiversity tar-gets for them (target-based approaches) or by including them in the analysis in various other ways (e.g. through boundary length modifiers, cost surfaces, design princi-ples – see Section 6.4).
Some local-scale ecological processes are likely to be adequately represented via biodiversity targets set for ecosystem types, and some landscape-scale ecological processes are likely to be catered for as long as sufficient large and well-connected areas of natural habitat are kept
intact. Areas important for these ecological processes need not be explicitly included in a biodiversity plan.
Areas important for ecological processes that should al-ways be included explicitly in a biodiversity plan are:
y Ecological corridors, either mapped a priori or de-signed as part of the analysis process (see Box 5 for more on requirements for ecological corridors as a fea-ture in a biodiversity plan).
Areas important for ecological processes that may be in-cluded as features in a biodiversity plan are: 11
y Areas supporting hydrological processes, such as ri-parian corridors, wetlands and groundwater recharge areas,
y Climate change refugia, such as south-facing slopes, kloofs and certain higher altitude areas
y Priority intact patches of habitat (e.g. identifying the largest and most intact patches of a threatened forest ecosystem),
y Local topographic and soil interfaces,
y Important sites for migration or dispersal of species of special concern,
y Important sites for supporting species of special con-cern, such as key breeding or feeding areas.
11 Some of these could be included as unique or special habitats or fea-tures (Section 4.2.7).
Box 5: More on ecological corridors as features in a biodiversity plan
Factors that should be considered in delineating or designing ecological corridors include: y Incorporating a mix of spatial scales, i.e. larger landscape-scale corridors and smaller local-scale corridors, y Including gradients, such as altitude (upland-lowland), rainfall and temperature gradients, y Alignment with riparian corridors, y Including structural features or elements in the landscape, such as sand movement corridors and ridgelines, y Meeting the requirements of particular species of special concern, such as large mobile predators.
The appropriate width of ecological corridors depends on the landscape and ecological context, and should take edge effects into account.
Also see further discussion in Section 6.3 on identifying ecological corridors as part of the spatial analysis for a bio-diversity plan.
Box 6: Summary of essentials: Areas important
for ecological processes y Landscape-scale ecological corridors must al-
ways be included, either mapped a priori or de-signed as part of the analysis process.
y A range of other areas important for ecological processes may be included, at the landscape or local scale.
Technical Guidelines for CBA Maps – Beta Version, June 2017 17
4.2.9 Ecological infrastructureThe concept of ecological infrastructure, defined as natu-rally functioning ecosystems12 that deliver valuable ser-vices to people (SANBI, 2013b), has gained significant traction in South Africa. Ecological infrastructure has a range of socio-economic benefits, including contributing to water security, food security and disaster risk reduc-tion. In many cases ecological infrastructure also plays an important role in ecosystem-based adaptation to climate change, in which ecosystems provide cost-effective op-tions that support people in dealing with the impacts of increased climate variability and extreme weather events.
It is possible to map ecological infrastructure at a scale useful for biodiversity planning, but identifying spatial features that represent ecological infrastructure and map-ping them is still at a relatively early and exploratory stage. Where ecological infrastructure features have been reli-ably identified and delineated, they can be included in biodiversity plans. At the time of writing, the most estab-lished national ecological infrastructure layer was Strate-gic Water Source Areas (SWSAs), which are areas of dispro-portionate importance for generating South Africa’s water supply. National ecological infrastructure layers may need to be refined before they are included in provincial plans.
Additional features which play an ecological infrastruc-ture role and which could be included as inputs in a bio-diversity plan are:
y Wetlands, y Coastal foredunes, y Riparian corridors and floodplains, y Mangroves.
Considerations for identifying and mapping ecological infrastructure features include the following:
y It is important for an ecological infrastructure feature to be clearly linked to the provision of one or more ser-vices or benefits to people.
y The specific service or benefit must be known (i.e. fea-tures based on a theoretical possibility that they may play an ecological infrastructure role should not be in-cluded).
y Maps of ecological infrastructure should not include areas that are important simply for “supporting servic-es” (as opposed to provisioning, regulating or cultural services)13 – these could be mapped as areas impor-tant for ecological processes, if applicable.
y Various socio-economic filters can be used to identify those ecological infrastructure features that have the highest level of dependence by people, which could be termed Critical Ecological Infrastructure. It may be more appropriate for Critical Ecological Infrastructure features to be included in a biodiversity plan rather than all ecological infrastructure features.
4.2.10 Buffers for biodiversity featuresSome biodiversity features require buffers of natural habitat to ensure their persistence. Examples of these features can include rivers, wetlands, forest patches, estuaries, protected areas, and potentially others depending on the landscape.
Generally, there are two categories of buffers that may be considered in biodiversity planning:
y Ecological buffers, which are buffers of natural habitat directly linked to maintaining ecological functioning of a feature or set of features (for example, intact veg-etation around wetlands and in riparian zones, grass-land buffers around forest patches);
y Policy-related or legislative buffers, which reflect formal guidelines or legislative requirements (for example, the EIA regulations specify buffers of 32m for water courses, 10km for National Parks and 5km for Nature Reserves, and the Department of Water and Sanitation has developed guidelines on wetland buffers).
The determination of buffers for features in a biodiversity plan should take into account a range of factors related to the ecological and institutional context, and to date buffers have not been standardised. The KwaZulu-Natal provincial biodiversity plan produced by Ezemvelo KZN Wildlife provides an example of how buffers have been determined: priority rivers are buffered by 100m, other rivers by 30m, priority wetland clusters by 500m, and oth-er priority wetlands by 100m.
4.3 Protected areasA spatial layer of existing protected areas is an essential input layer for a biodiversity plan. Protected areas are areas that have been formally declared or recognised in terms of the Protected Areas Act, including National Parks, Nature Reserves, Protected Environments and World Her-itage Sites. They include state-owned protected areas as well as contract protected areas declared as part of biodi-versity stewardship programmes.14
Protected areas contribute towards meeting biodiversity targets for intact biodiversity features that fall within their boundaries. In other words, biodiversity features or parts of them that fall within protected areas (except within severely or irreversibly modified portions – see principles below) are considered protected.
12 “Naturally functioning ecosystems” are ecosystems that have at least some of their natural ecological processes intact. They could be in good or fair ecological condition, and in some cases even in poor ecological condition. Human-made ecosystems that are designed to mimic natural ecosystems are excluded from this definition.
13 The Millennium Ecosystem Assessment (2005) identified four catego-ries of ecosystem services: provisioning, regulating, cultural, and sup-porting. However, the more recent Common International Classification of Ecosystem Services (CICES V4.3, 2013) recognises only three catego-ries: provisioning, regulation and maintenance, and cultural services. See https://cices.eu/. “Supporting services” are considered to be eco-logical processes rather than ecosystem services.
14 See the Lexicon of Biodiversity Planning in South Africa (SANBI, 2016) for a comprehensive set of terms and definitions related to protected areas.
18 Technical Guidelines for CBA Maps – Beta Version, June 2017
Principles for using protected area data in a biodiversity plan are as follows:
y The best available spatial layer of protected areas should be used. Ideally the layer should be compre-hensive, including all declared protected areas in the South African Protected Area Database (SAPAD).15
y De facto protected areas should be included as con-tributing towards targets. These are protected areas that do not appear in SAPAD, but that are known to be owned and actively managed as a protected area by SANParks or a provincial conservation agency.
y Severely or irreversibly modified portions of protected areas are not considered to contribute towards meet-ing biodiversity targets and should preferably be ex-cluded from the analysis. This includes large dams, roads, lodges, etc. For many protected areas, severely or irreversibly modified portions are relatively small, but for some types of protected areas, such as Protect-ed Environments, the areas involved can be large and can substantially influence the spatial analysis.
y So-called “old ordinance” protected areas, declared in terms of legislation pre-dating the Protected Areas Act, should be included unless land cover data indicates that they are clearly used for other land uses and are not in fact protected areas.
y All protected areas should be retained in the database for the biodiversity plan and must be shown on the CBA Map (see Section 8).
Conservation areas are areas that are not formally pro-tected in terms of the Protected Areas Act but are infor-mally protected by the current owners and users and managed at least partly for biodiversity conservation. Be-cause there is no long-term security associated with con-servation areas, and because they are not legally required to have a management plan, they are not considered to contribute towards meeting biodiversity targets. A spatial layer of existing conservation area may be included in a biodiversity plan, for example as a cost or design factor in the spatial analysis. They may also be shown on the map product as an overlay or information layer.
4.4 Ecological condition, including land cover data
Ecological condition refers to the extent to which an area or biodiversity feature has been modified from a refer-ence condition of “natural”. Spatial data on ecological condition is essential for spatial biodiversity planning, as it helps to determine the amount and location of natural habitat that remains available for achieving biodiversity targets.16 Together with spatial data on biodiversity fea-tures, this is fundamental for guiding the selection of sites as CBAs or ESAs.
Maps of ecological condition combine information on the impacts of different drivers of ecosystem change (such as land cover change, alteration of freshwater flows, over-harvesting or resources, invasive alien species) into a sin-gle map. Mapping of ecological condition is thus a way of summarising the many pressures acting on ecosystems. Similar to the use of ecosystem types as a surrogate for biodiversity pattern, ecological condition is a surrogate for a range of human pressures on biodiversity (SANBI & UNEP-WCMC, 2016).
It is useful to distinguish between reference condition, current condition and desired condition. Using a refer-ence condition of “natural” does not imply that all areas or ecosystems should remain in natural condition or be restored to natural condition. The purpose of a CBA Map includes identifying which ecosystems or sites should re-main in good or fair condition, in other words for which ecosystems or sites the desired state is natural or semi-natural. In general, only sites that are currently in good ecological condition will be selected as CBAs, and only sites currently in at least fair ecological condition will be selected as ESAs. The rationale for this is that CBAs must be representative of biodiversity pattern, and ESAs must allow for persistence of ecological processes.
In this section, we set out the ecological condition classes that have been agreed on by the biodiversity planning community in South Africa, and briefly discuss approaches to assessing and mapping ecological condition in different realms. How the data on ecological condition is used in pro-ducing a CBA Map is discussed in more detail in Section 6.
In South Africa, methods for assessing ecological con-dition have historically been more fully developed for freshwater and estuarine ecosystems than for terrestrial and marine ecosystems, and widely differing approaches have been used in different realms. From a biodiversity planning perspective, it is important to standardise con-cepts and terminology related to ecological condition, while allowing for flexibility in approaches and methods across realms. The intention of these guidelines includes encouraging and facilitating progress in this regard. The NBA 2018 will also take this work forward substantially.
15 There are cases in which the information in SAPAD is incorrect. These should be dealt with on a case-by-case basis depending on what the error is.
Box 7: Summary of essentials: Protected area layer
y A spatial layer of existing protected areas is an es-sential input layer for a biodiversity plan. Protect-ed areas contribute towards meeting biodiversity targets, except for those portions that have been irreversibly modified.
y A spatial layer of existing conservation areas may be included in a biodiversity plan but is not es-sential. Conservation areas do not contribute to-wards meeting biodiversity targets.
16 Spatial data on ecological condition is also essential for spatial bio-diversity assessment and for ecosystem accounting, among other uses.
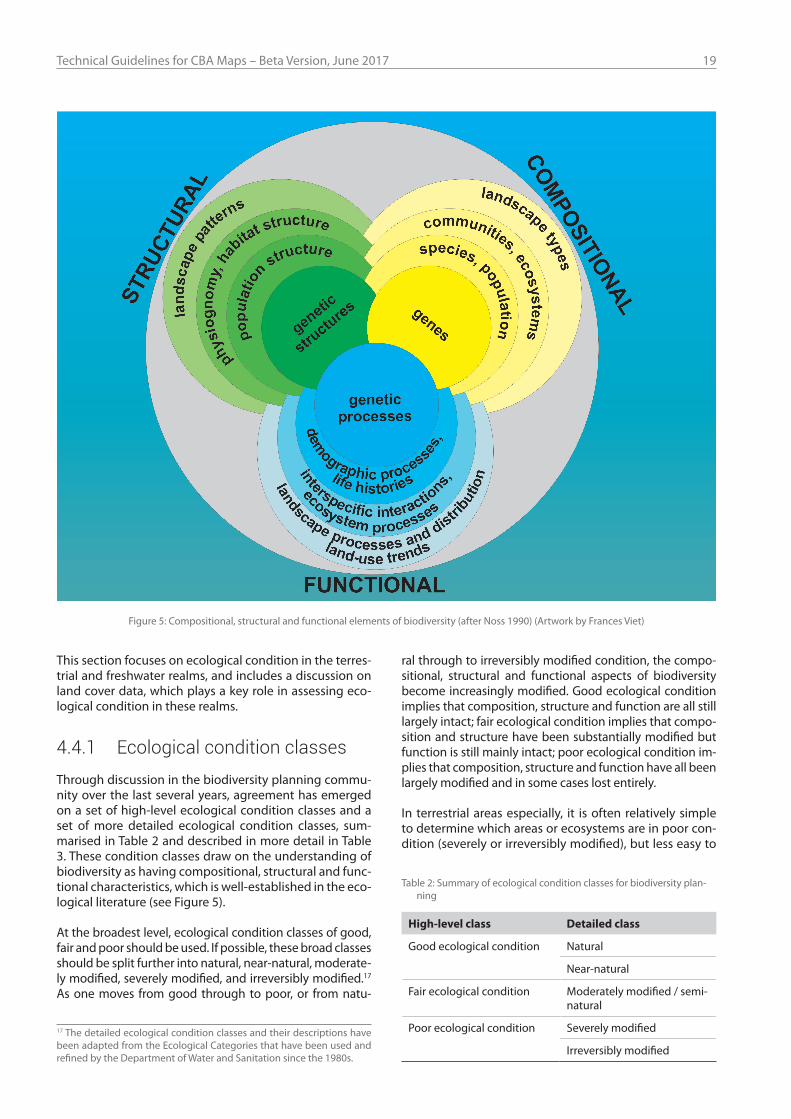
Technical Guidelines for CBA Maps – Beta Version, June 2017 19
This section focuses on ecological condition in the terres-trial and freshwater realms, and includes a discussion on land cover data, which plays a key role in assessing eco-logical condition in these realms.
4.4.1 Ecological condition classesThrough discussion in the biodiversity planning commu-nity over the last several years, agreement has emerged on a set of high-level ecological condition classes and a set of more detailed ecological condition classes, sum-marised in Table 2 and described in more detail in Table 3. These condition classes draw on the understanding of biodiversity as having compositional, structural and func-tional characteristics, which is well-established in the eco-logical literature (see Figure 5).
At the broadest level, ecological condition classes of good, fair and poor should be used. If possible, these broad classes should be split further into natural, near-natural, moderate-ly modified, severely modified, and irreversibly modified.17 As one moves from good through to poor, or from natu-
ral through to irreversibly modified condition, the compo-sitional, structural and functional aspects of biodiversity become increasingly modified. Good ecological condition implies that composition, structure and function are all still largely intact; fair ecological condition implies that compo-sition and structure have been substantially modified but function is still mainly intact; poor ecological condition im-plies that composition, structure and function have all been largely modified and in some cases lost entirely.
In terrestrial areas especially, it is often relatively simple to determine which areas or ecosystems are in poor con-dition (severely or irreversibly modified), but less easy to
Figure 5: Compositional, structural and functional elements of biodiversity (after Noss 1990) (Artwork by Frances Viet)
17 The detailed ecological condition classes and their descriptions have been adapted from the Ecological Categories that have been used and refined by the Department of Water and Sanitation since the 1980s.
Table 2: Summary of ecological condition classes for biodiversity plan-ning
High-level class Detailed class
Good ecological condition Natural
Near-natural
Fair ecological condition Moderately modified / semi-natural
Poor ecological condition Severely modified
Irreversibly modified
20 Technical Guidelines for CBA Maps – Beta Version, June 2017
distinguish between good and fair condition i.e. between natural, near-natural and semi-natural areas. This means that in many cases the condition assessment will over-es-timate the amount of area that is still in good condition, and that in some cases the condition assessment will be reduced to two categories – good or fair on the one hand, and poor on the other. This is not ideal but should not be seen as a fatal flaw in the production of a CBA Map.
There are many cases in which judgement needs to be applied in determining the most appropriate ecological condition class for a particular area or ecosystem; wher-ever possible such judgements should be made based on ecological knowledge of the system concerned.
For biodiversity planning, the terms “moderately modi-fied” and “severely or irreversibly modified” are preferred to “degraded” and “transformed” respectively. The terms degraded and transformed may have different meanings in other sectors and can be viewed as normative, whereas levels of modification provide a more neutral description of condition. 18
4.4.2 Approaches and methods for assessing and mapping ecological condition
Ecological condition can be assessed and mapped in vari-ous ways. The following three options are the main ones used for spatial biodiversity assessment and planning, with the first being most ideal and the third being least ideal.
y Option 1: Mapping of ecological condition based on direct observation;
y Option 2: Using proxies for ecological condition based on data;
y Option 3: Where direct mapping or proxy mapping from data is not possible, proxies based on expert opin-ion can be used, preferably with confidence ratings.
In practice, these three approaches are often used in combination.
To date in South Africa, assessment of ecological condition has tended to be undertaken differently in the terrestrial, freshwater and marine environments, involving different approaches, data and methods. These are described in more detail below. From a biodiversity planning perspec-tive, as long as there is alignment between ecological con-dition classes across different realms, different approaches and methods are not necessarily a problem.
4.4.3 Land cover dataLand cover data is fundamental for assessing ecological condition in the terrestrial realm, and is often very useful for assessing condition in aquatic realms as aquatic eco-systems are often impacted by land-based activities.
The scale and quality of the land cover data is an impor-tant determinant of the reliability of ecological condition assessments, and thus of the final CBA Map and the scale at which it can be applied. Even if the data on biodiversity features is excellent, poor land cover data at too broad a scale will be a limiting factor for the reliability and useful-ness of the resulting CBA Map.
The following recommendations related to land cover data are made:
y Spatial resolution of at least 30m is recommended for provincial biodiversity plans. Resolution of finer than 10m picks up detail that is not necessary and can even be problematic.
y Land cover data can be summarised to a few major land cover classes for biodiversity planning purposes, although more detailed classes can be useful – see discussion in Section 4.4.4 below. Land cover classes used in provincial land cover maps should preferably be aligned with or cross-walked to classes used in the National Land Cover.
y In summarising land cover classes, it is essential not to combine natural and non-natural classes. For example, natural water bodies and dams should be kept sepa-rate.
y It is valuable to enhance land cover data with addition-al data if available e.g. linear features such as roads and railways, more detailed spatial information on previ-ously ploughed areas, and spatial information on den-sity of invasive alien plants.
y Ideally land cover should be updated at least every five years, in line with the review and update of biodiver-sity sector plans or bioregional plans. Ideally updates of land cover data sets should be designed so that they allow for comparison of land cover over time.
4.4.4 Assessment of ecological condition in the terrestrial realm
Land cover data provides the starting point for mapping ecological condition of terrestrial ecosystems. However, it is often challenging to distinguish based on land cover data between areas in good ecological condition (natu-ral or near-natural) and areas in fair ecological condition (semi-natural), and the extent of areas in good ecologi-cal condition has probably been over-estimated. For ex-ample, it is often difficult to identify overgrazed areas or areas infested by invasive alien plants based on land cover data. Detailed mapping of old fields based on agri-cultural data is now available nationally and is useful for identifying previously ploughed areas that may appear as “natural” in the land cover data but should be classified as moderately modified. Where possible, land cover should be combined with such supplementary data.
A habitat modification layer is a summarised version of land cover (including any supplementary data used) that groups land cover classes into ecological condition class-es. It is the key informant for assessing ecological condi-
18 See the Lexicon of Biodiversity Planning in South Africa (SANBI, 2016) for further discussion of terms related to ecological condition
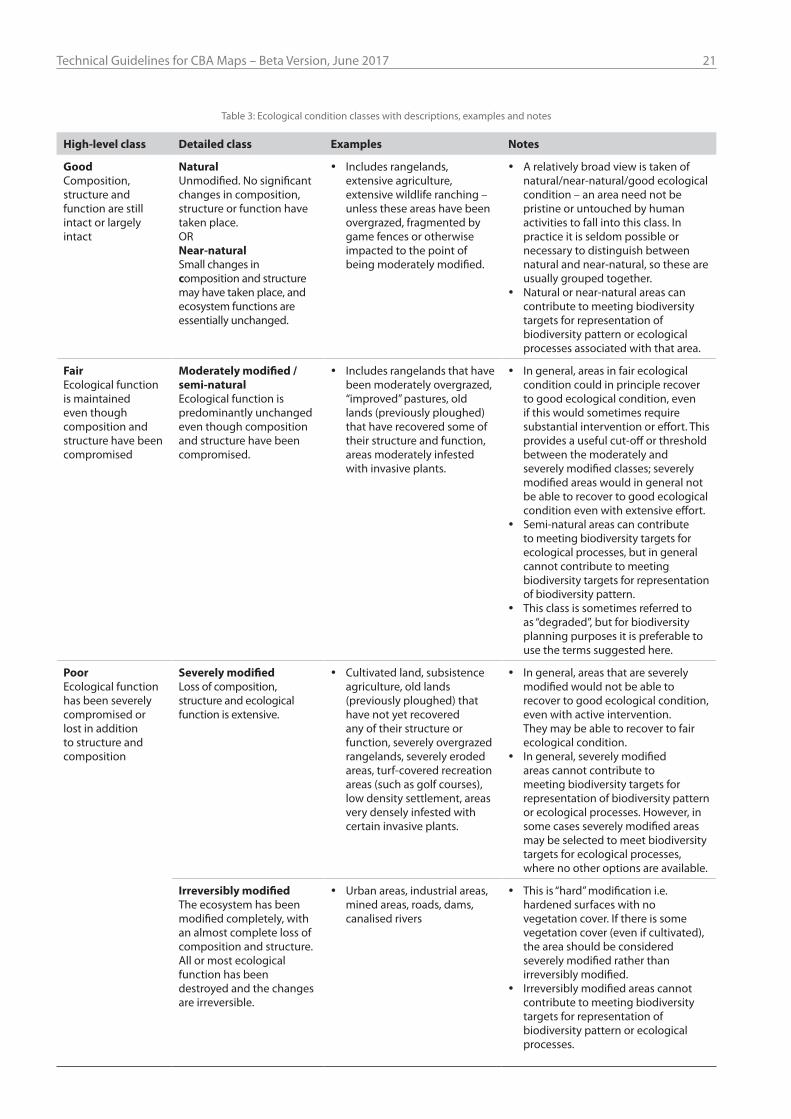
Technical Guidelines for CBA Maps – Beta Version, June 2017 21
Table 3: Ecological condition classes with descriptions, examples and notes
High-level class Detailed class Examples Notes
GoodComposition, structure and function are still intact or largely intact
NaturalUnmodified. No significant changes in composition, structure or function have taken place.ORNear-naturalSmall changes in composition and structure may have taken place, and ecosystem functions are essentially unchanged.
y Includes rangelands, extensive agriculture, extensive wildlife ranching – unless these areas have been overgrazed, fragmented by game fences or otherwise impacted to the point of being moderately modified.
y A relatively broad view is taken of natural/near-natural/good ecological condition – an area need not be pristine or untouched by human activities to fall into this class. In practice it is seldom possible or necessary to distinguish between natural and near-natural, so these are usually grouped together.
y Natural or near-natural areas can contribute to meeting biodiversity targets for representation of biodiversity pattern or ecological processes associated with that area.
FairEcological function is maintained even though composition and structure have been compromised
Moderately modified / semi-naturalEcological function is predominantly unchanged even though composition and structure have been compromised.
y Includes rangelands that have been moderately overgrazed, “improved” pastures, old lands (previously ploughed) that have recovered some of their structure and function, areas moderately infested with invasive plants.
y In general, areas in fair ecological condition could in principle recover to good ecological condition, even if this would sometimes require substantial intervention or effort. This provides a useful cut-off or threshold between the moderately and severely modified classes; severely modified areas would in general not be able to recover to good ecological condition even with extensive effort.
y Semi-natural areas can contribute to meeting biodiversity targets for ecological processes, but in general cannot contribute to meeting biodiversity targets for representation of biodiversity pattern.
y This class is sometimes referred to as “degraded”, but for biodiversity planning purposes it is preferable to use the terms suggested here.
PoorEcological function has been severely compromised or lost in addition to structure and composition
Severely modifiedLoss of composition, structure and ecological function is extensive.
y Cultivated land, subsistence agriculture, old lands (previously ploughed) that have not yet recovered any of their structure or function, severely overgrazed rangelands, severely eroded areas, turf-covered recreation areas (such as golf courses), low density settlement, areas very densely infested with certain invasive plants.
y In general, areas that are severely modified would not be able to recover to good ecological condition, even with active intervention. They may be able to recover to fair ecological condition.
y In general, severely modified areas cannot contribute to meeting biodiversity targets for representation of biodiversity pattern or ecological processes. However, in some cases severely modified areas may be selected to meet biodiversity targets for ecological processes, where no other options are available.
Irreversibly modifiedThe ecosystem has been modified completely, with an almost complete loss of composition and structure. All or most ecological function has been destroyed and the changes are irreversible.
y Urban areas, industrial areas, mined areas, roads, dams, canalised rivers
y This is “hard” modification i.e. hardened surfaces with no vegetation cover. If there is some vegetation cover (even if cultivated), the area should be considered severely modified rather than irreversibly modified.
y Irreversibly modified areas cannot contribute to meeting biodiversity targets for representation of biodiversity pattern or ecological processes.
22 Technical Guidelines for CBA Maps – Beta Version, June 2017
tion in the terrestrial environment, and also feeds into the assessment of ecological condition in the aquatic envi-ronment. Typically, land cover classes such as urban, built-up, mining and artificial water bodies are grouped as irre-versibly modified; land cover classes such as irrigated cul-tivation, dryland cultivation and forestry plantations are groups as severely modified; land cover classes such as degraded and improved grasslands, as well as additional mapping of old fields, are classified as moderately modi-fied; and categories such as grassland and shrubland are grouped as natural or near-natural.
4.4.5 Assessment of ecological condition in the freshwater environment
The Department of Water and Sanitation has a well-estab-lished system for assessing the ecological condition of riv-ers. The same system of ecological condition categories is also applied to wetlands and estuaries. Present Ecologi-cal State (PES) describes the extent to which the river has been modified by human activity, ranging from natural (A) to critically modified (F).
Present Ecological State is assessed based on several fac-tors, representing drivers of change in freshwater envi-ronment (such as flow and inundation) as well as habitat and biotic responses (such as instream and stream bank condition). These factors are assessed at the scale of sub-quaternary rivers reaches based on a combination of data and expert input, with a confidence rating, and then com-bined to give an overall PES score or class. A full national assessment of PES was done in 1999 at quaternary catch-ment scale and in 2011 at sub-quaternary catchment scale.
In the absence of PES scores, a habitat modification layer can be used to model ecological condition of rivers and wetlands, based on the proportion of natural or semi-natural habitat within successive buffers or the river or wetlands and/or within the sub-catchment.
4.5 Socio-economic constraints and opportunities
It is possible to include a wide range of information about opportunities for or constraints on meeting biodiversity objectives in a biodiversity planning process. The list of options is long, and depends on the socio-economic con-text within which the biodiversity plan is being undertak-en as well as the availability of spatially explicit informa-tion from other sectors.
Examples of socio-economic constraints that can be incor-porated if suitable spatial information is available include:
y Land-use planning information such as delineated ur-ban edges, areas intended for future urban expansion, areas intended for future industrial expansion such as Industrial Development Zones, or other relevant infor-mation from SDFs or land use schemes,
y Areas where there is likely to be demand for land use by other sectors, such as high potential agricultural land, sites under application for e.g. mining licences, or areas earmarked for development of built infrastructure.
Examples of socio-economic opportunities that can be incorporated if suitable spatial information is available include:
y Areas earmarked for forms of development that can be compatible with biodiversity management objectives, such as some forms of ecotourism,
y Game farms, y Natural sites that have cultural or religious significance, y Existing conservation initiatives beyond the bounda-
ries of protected areas.
Investing in modelling future land-use pressures in order to inform the development of a biodiversity plan is not essential. In our experience investing in such predictive modelling usually takes a great deal of effort, often yields unreliable results, and is thus unlikely to add sufficient value to justify the effort.
Box 8: Summary of essentials: Land cover and ecological condition y A spatial assessment of ecological condition is an essential input into a biodiversity plan. y Ecological condition classes can be broad (good, fair, poor) or more detailed (natural, near-natural, moderately
modified, severely modified, irreversibly modified). As a minimum, biodiversity features or areas in good or fair ecological condition should be distinguished from those in poor ecological condition.
y In the terrestrial realm, an assessment of ecological condition is usually based mainly on land cover data summa-rised to habitat modification classes; in the freshwater realm it can be based on a range of factors (such as flow, water quality, instream and riparian habitat), with land cover data providing a possible proxy in the absence of other data.
y Land cover data should preferably be at a resolution of at least 30m, and should be as recent as possible.
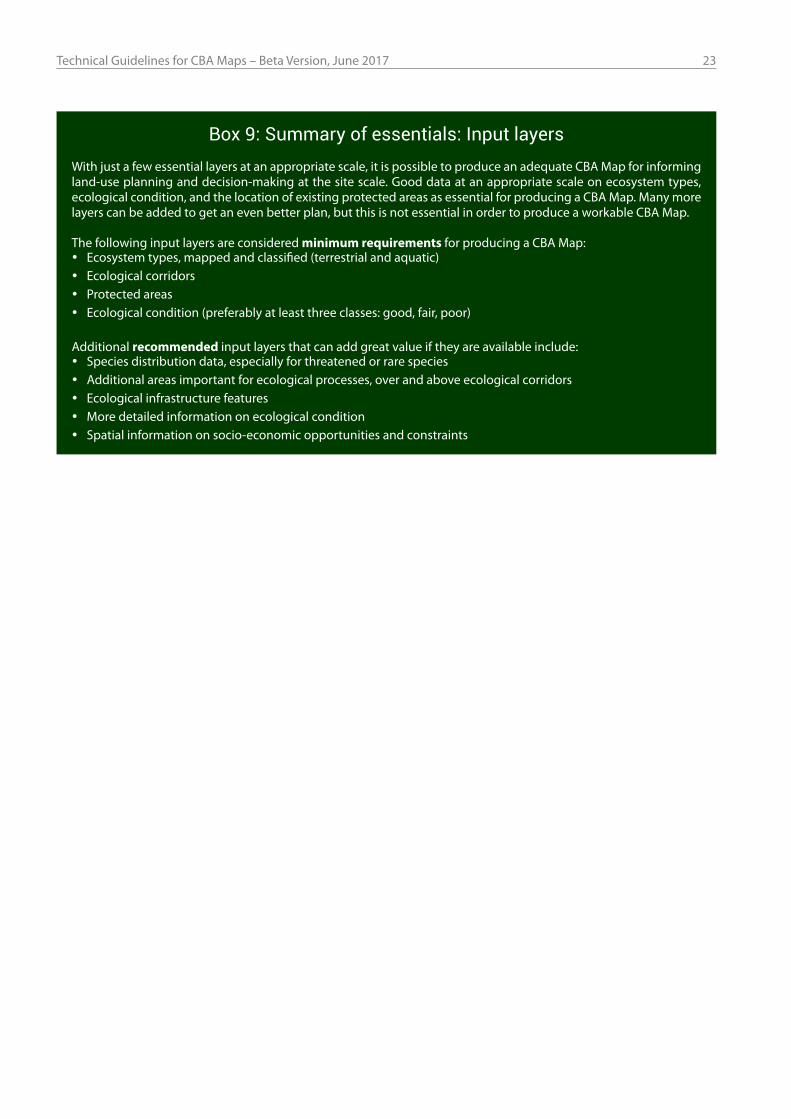
Technical Guidelines for CBA Maps – Beta Version, June 2017 23
Box 9: Summary of essentials: Input layersWith just a few essential layers at an appropriate scale, it is possible to produce an adequate CBA Map for informing land-use planning and decision-making at the site scale. Good data at an appropriate scale on ecosystem types, ecological condition, and the location of existing protected areas as essential for producing a CBA Map. Many more layers can be added to get an even better plan, but this is not essential in order to produce a workable CBA Map.
The following input layers are considered minimum requirements for producing a CBA Map: y Ecosystem types, mapped and classified (terrestrial and aquatic) y Ecological corridors y Protected areas y Ecological condition (preferably at least three classes: good, fair, poor)
Additional recommended input layers that can add great value if they are available include: y Species distribution data, especially for threatened or rare species y Additional areas important for ecological processes, over and above ecological corridors y Ecological infrastructure features y More detailed information on ecological condition y Spatial information on socio-economic opportunities and constraints
24 Technical Guidelines for CBA Maps – Beta Version, June 2017
Biodiversity targets for species, ecosystem types and ecological processes drive the efficiency and outcomes of a systematic biodiversity planning process. Biodiver-sity targets should be quantitative and defensible. This section discusses the rationale and principles for setting biodiversity targets for ecosystem types, species, and features representing ecological processes or ecological infrastructure.
5.1 Biodiversity targets for ecosystem types
The rationale for biodiversity targets for ecosystem types is to keep a sufficient proportion of each ecosystem type in good ecological condition in order to represent the majority of species associated with that ecosystem type. Biodiversity targets are expressed as a proportion of the historical extent of each ecosystem type.
Where possible, biodiversity targets for ecosystem types should be based on a detailed understanding of the specific ecological requirements of the species present within and ecosystems. This can be approximated using species-area relationships, represented by the species-ar-ea curve. As part of the National Biodiversity Assessment, targets for national vegetation types have been set based on species-area relationships. The target for each vegeta-tion type is a proportion of its historical extent, which is translated into an amount in hectares.
In the absence of specific ecological data to calculate tar-gets, a flat target of 20% of the historical extent of each ecosystem type is recommended. This approach is cur-rently usually used for freshwater ecosystem types. High-er targets should be used only when there is clear justifi-cation based on ecological characteristics. The degree of pressure on an ecosystem type does not constitute a valid justification for a higher target.
Where national ecosystem types are used, biodiversity targets should be aligned with the most recent NBA tar-get for each ecosystem type. Where finer scale ecosystem types or habitat types have been mapped at provincial or metro scale, the biodiversity target should preferably be aligned with national targets. This can be done in two ways:
y Targets can be based on the target for the most similar national vegetation type,
y Targets can be set as a geographically weighted mean from targets for vegetation types in the area con-cerned.
Where an ecosystem type spans more than one plan-ning domain (e.g. more than one province), the biodiver-sity target should generally be calculated proportionally, based on the historical extent of that ecosystem type in each of the planning domains concerned. In some cases, for example where an ecosystem type shared between two provinces has effectively been lost in one of the prov-inces, it may be necessary for the other province to meet a greater portion of the overall national target. This needs to be worked out on a case by case basis between gov-ernment departments and conservation agencies.
Biodiversity targets for each ecosystem type must be presented in a clear table in the technical report, as illus-trated in Table 4. The table should indicate the full set of ecosystem types occurring in the province or metro, their original extent, the biodiversity target as a percentage/proportion, the biodiversity target as an area (or other appropriate measure), and the area and /or percentage of the biodiversity target for each ecosystem type met in protected areas, CBAs and ESAs. This assists users of the CBA Map and is also essential for reviewers to evaluate the comprehensiveness of the plan in meeting biodiver-sity targets for ecosystem types.
5.2 Biodiversity targets for species of special concern19
The rationale for biodiversity targets for species is to avoid extinction or lower the risk of extinction using IUCN Red List criteria and thresholds as a basis. In general, tar-gets are set to avoid a species becoming Critically Endan-gered, and in most cases 100% targets are justifiable only where dropping below this value would pose a direct ex-tinction risk.
Recommendations for biodiversity targets for species dif-fer depending on both the type and quality of data used to represent species spatially (see Section 4.2.7.2). In all cases it is important to be cautious about setting targets that are too high and that may result in spatial inefficiency of the plan, difficulty in justifying areas selected as CBAs and ESAs, and a poor balance with the other biodiversity features.
5 SETTING BIODIVERSITY TARGETS
19 Biodiversity targets for species are an area of ongoing discussion in the biodiversity planning community, not fully resolved at the time of writing. Feedback on this section is particularly welcome.
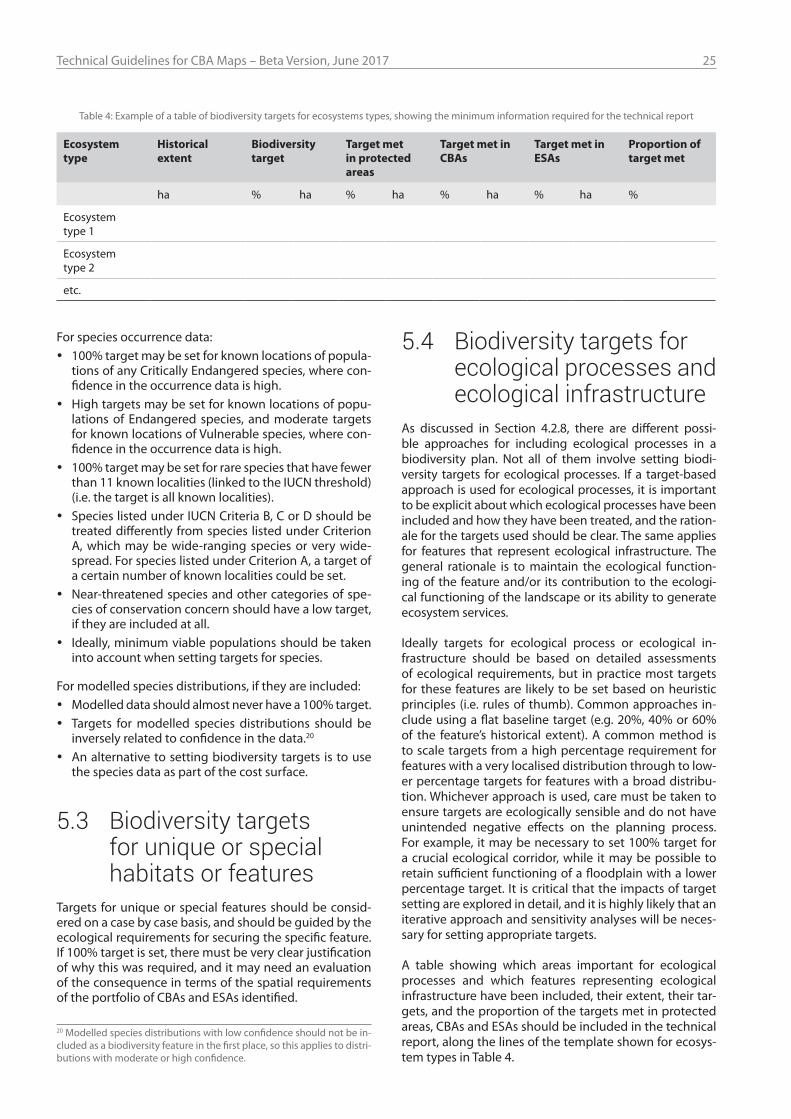
Technical Guidelines for CBA Maps – Beta Version, June 2017 25
For species occurrence data: y 100% target may be set for known locations of popula-
tions of any Critically Endangered species, where con-fidence in the occurrence data is high.
y High targets may be set for known locations of popu-lations of Endangered species, and moderate targets for known locations of Vulnerable species, where con-fidence in the occurrence data is high.
y 100% target may be set for rare species that have fewer than 11 known localities (linked to the IUCN threshold) (i.e. the target is all known localities).
y Species listed under IUCN Criteria B, C or D should be treated differently from species listed under Criterion A, which may be wide-ranging species or very wide-spread. For species listed under Criterion A, a target of a certain number of known localities could be set.
y Near-threatened species and other categories of spe-cies of conservation concern should have a low target, if they are included at all.
y Ideally, minimum viable populations should be taken into account when setting targets for species.
For modelled species distributions, if they are included: y Modelled data should almost never have a 100% target. y Targets for modelled species distributions should be
inversely related to confidence in the data.20 y An alternative to setting biodiversity targets is to use
the species data as part of the cost surface.
5.3 Biodiversity targets for unique or special habitats or features
Targets for unique or special features should be consid-ered on a case by case basis, and should be guided by the ecological requirements for securing the specific feature. If 100% target is set, there must be very clear justification of why this was required, and it may need an evaluation of the consequence in terms of the spatial requirements of the portfolio of CBAs and ESAs identified.
5.4 Biodiversity targets for ecological processes and ecological infrastructure
As discussed in Section 4.2.8, there are different possi-ble approaches for including ecological processes in a biodiversity plan. Not all of them involve setting biodi-versity targets for ecological processes. If a target-based approach is used for ecological processes, it is important to be explicit about which ecological processes have been included and how they have been treated, and the ration-ale for the targets used should be clear. The same applies for features that represent ecological infrastructure. The general rationale is to maintain the ecological function-ing of the feature and/or its contribution to the ecologi-cal functioning of the landscape or its ability to generate ecosystem services.
Ideally targets for ecological process or ecological in-frastructure should be based on detailed assessments of ecological requirements, but in practice most targets for these features are likely to be set based on heuristic principles (i.e. rules of thumb). Common approaches in-clude using a flat baseline target (e.g. 20%, 40% or 60% of the feature’s historical extent). A common method is to scale targets from a high percentage requirement for features with a very localised distribution through to low-er percentage targets for features with a broad distribu-tion. Whichever approach is used, care must be taken to ensure targets are ecologically sensible and do not have unintended negative effects on the planning process. For example, it may be necessary to set 100% target for a crucial ecological corridor, while it may be possible to retain sufficient functioning of a floodplain with a lower percentage target. It is critical that the impacts of target setting are explored in detail, and it is highly likely that an iterative approach and sensitivity analyses will be neces-sary for setting appropriate targets.
A table showing which areas important for ecological processes and which features representing ecological infrastructure have been included, their extent, their tar-gets, and the proportion of the targets met in protected areas, CBAs and ESAs should be included in the technical report, along the lines of the template shown for ecosys-tem types in Table 4.
Table 4: Example of a table of biodiversity targets for ecosystems types, showing the minimum information required for the technical report
Ecosystem type
Historical extent
Biodiversity target
Target met in protected areas
Target met in CBAs
Target met in ESAs
Proportion of target met
ha % ha % ha % ha % ha %
Ecosystem type 1
Ecosystem type 2
etc.
20 Modelled species distributions with low confidence should not be in-cluded as a biodiversity feature in the first place, so this applies to distri-butions with moderate or high confidence.
26 Technical Guidelines for CBA Maps – Beta Version, June 2017
Box 10: Summary of essentials: Biodiversity targetsFor ecosystem types:
y The most basic approach is a target of 20% of the historical extent of each ecosystem type. y More complex targets can be set based on ecological characteristics of different ecosystem types (for example,
using species-area curves for vegetation types) but this is not essential. y Wherever possible, targets for ecosystem types should be aligned with targets for national ecosystem types used
in the NBA.
For species of special concern: y Targets for species should ideally be based on the ecological requirements for ensuring their long-term persis-
tence. y 100% targets are generally only justifiable where dropping below this value would pose a direct extinction risk
(i.e. Critically Endangered species and possibly Endangered species).
For ecological processes and ecological infrastructure: y If targets are set for areas important for ecological processes and features representing ecological infrastructure,
a range of approaches to these targets is possible. The approach should be explicit and the rationale clear.
Technical Guidelines for CBA Maps – Beta Version, June 2017 27
CBAs and ESAs are identified through a spatial analysis process using the biodiversity features and other input layers described in Section 4. The analysis undertaken to produce a CBA Map must be consistent with the princi-ples and essential characteristics of systematic biodiver-sity planning, as outlined in Section 3.2. It must meet bio-diversity targets for representation and persistence in a spatially efficient way, while also ensuring connectivity at the landscape level and avoiding conflict with other land uses wherever possible.
The spatial optimisation problem can become extremely difficult to compute, and specialised software is usually needed. The most commonly used software programmes in South Africa at the time of writing were Marxan and C-Plan. These two tools utilise slightly different optimisation methods, each with its strengths and weaknesses. Either tool can be used to identify the planning units required to meet biodiversity targets in a way that is efficient, least cost, and ecologically and spatially coherent (e.g. ar-ranged in a connected or spatially linked way that allows ecological processes to function). Marxan is a very useful tool for most circumstances, and deals well with issues of adjacency and connectivity.
Care is always needed in applying the software tools, as in many ways they are easy to use from a technical perspec-tive and it is possible to obtain poor answers in ecological terms if one applies them blindly. Best practice guidelines for the software should be followed to ensure that it is used correctly. The spatial analysis process should gener-ally be iterative, with careful calibration of the analyses and critical review of the outcomes. It is often useful to in-volve experts with on-the-ground ecological knowledge to review interim outputs.
The output of the spatial planning tools is often a map of irreplaceability or selection frequency. This is an assess-ment of spatial options for meeting biodiversity targets (i.e. how necessary a particular planning unit is for meet-ing targets, or how often that unit is selected as part of potential portfolios that best meet targets). Maps of ir-replaceability or selection frequency can be used as the basis for selecting a portfolio of CBAs and ESAs; they are not in themselves CBA Maps and are not suitable as final outputs for general audiences or for direct inclusion in land-use planning processes.
In addition to systematic biodiversity planning software and analyses, a range of other software and methods can be used for various parts of the analysis, for example for designing ecological corridors or identifying specific ele-ments of ecological infrastructure.
Ideally the spatial analysis should integrate the terrestrial and freshwater realms, to provide a single map of CBAs and ESAs that meet both terrestrial and aquatic targets. Some provinces have done separate spatial analyses for terrestrial and freshwater features, resulting in separate terrestrial and aquatic CBA Maps. This partly reflects the fact that terrestrial and freshwater biodiversity planning evolved initially in parallel in South Africa, but integration of the two realms in a single spatial analysis process is in-creasingly the norm and is certainly preferable.
6.1 Criteria and sub-categories for CBAs and ESAs
The conceptual framework for CBA Maps was discussed in Section 2 and summarised in Table 1. It provides the broad rationale for selecting sites as either CBAs or ESAs in the spatial analysis process.
The management objective for CBAs is generally to keep them in good ecological condition, and for ESAs to keep them in at least fair ecological condition (or, if they are severely modified, to avoid further deterioration in con-dition). In general, only sites in good ecological condi-tion should be selected as CBAs, and sites in at least fair ecological condition are preferable for selection as ESAs (with exceptions, discussed below). Table 5 summarises the current ecological condition and desired state or management objective for CBAs and ESAs, providing a high-level framework within which the criteria for select-ing CBAs and ESAs are applied.
The discussion below deals with criteria for selecting CBAs and ESAs and sub-categories for CBAs and ESAs within this broad framework. The aim is to ensure consist-ency in the criteria and sub-categories while allowing for considerable flexibility in the analysis process.
Consistency in the criteria used to select sites or features as CBAs and ESAs is important for ensuring that the con-cept of a CBA or ESA can be taken to be equivalent across different provinces and different metros, even if the pre-cise data used was quite different for different plans. As mentioned in Section 1.3, this is important for the integ-rity of biodiversity plans, and for ensuring that stakehold-ers and decision-makers can have confidence in the con-sistency of these plans for informing land-use planning and decision-making.
6 SPATIAL ANALYSIS
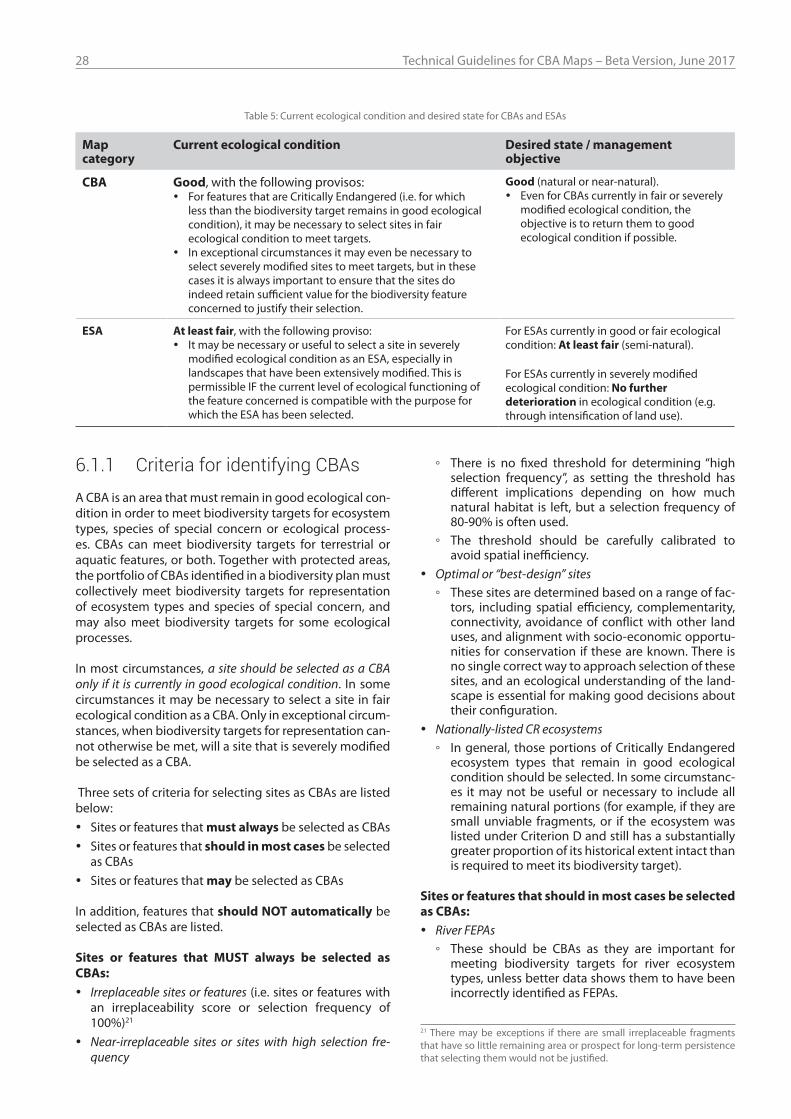
28 Technical Guidelines for CBA Maps – Beta Version, June 2017
6.1.1 Criteria for identifying CBAsA CBA is an area that must remain in good ecological con-dition in order to meet biodiversity targets for ecosystem types, species of special concern or ecological process-es. CBAs can meet biodiversity targets for terrestrial or aquatic features, or both. Together with protected areas, the portfolio of CBAs identified in a biodiversity plan must collectively meet biodiversity targets for representation of ecosystem types and species of special concern, and may also meet biodiversity targets for some ecological processes.
In most circumstances, a site should be selected as a CBA only if it is currently in good ecological condition. In some circumstances it may be necessary to select a site in fair ecological condition as a CBA. Only in exceptional circum-stances, when biodiversity targets for representation can-not otherwise be met, will a site that is severely modified be selected as a CBA.
Three sets of criteria for selecting sites as CBAs are listed below:
y Sites or features that must always be selected as CBAs y Sites or features that should in most cases be selected
as CBAs y Sites or features that may be selected as CBAs
In addition, features that should NOT automatically be selected as CBAs are listed.
Sites or features that MUST always be selected as CBAs:
y Irreplaceable sites or features (i.e. sites or features with an irreplaceability score or selection frequency of 100%)21
y Near-irreplaceable sites or sites with high selection fre-quency
◦ There is no fixed threshold for determining “high selection frequency”, as setting the threshold has different implications depending on how much natural habitat is left, but a selection frequency of 80-90% is often used.
◦ The threshold should be carefully calibrated to avoid spatial inefficiency.
y Optimal or “best-design” sites ◦ These sites are determined based on a range of fac-
tors, including spatial efficiency, complementarity, connectivity, avoidance of conflict with other land uses, and alignment with socio-economic opportu-nities for conservation if these are known. There is no single correct way to approach selection of these sites, and an ecological understanding of the land-scape is essential for making good decisions about their configuration.
y Nationally-listed CR ecosystems ◦ In general, those portions of Critically Endangered
ecosystem types that remain in good ecological condition should be selected. In some circumstanc-es it may not be useful or necessary to include all remaining natural portions (for example, if they are small unviable fragments, or if the ecosystem was listed under Criterion D and still has a substantially greater proportion of its historical extent intact than is required to meet its biodiversity target).
Sites or features that should in most cases be selected as CBAs:
y River FEPAs ◦ These should be CBAs as they are important for
meeting biodiversity targets for river ecosystem types, unless better data shows them to have been incorrectly identified as FEPAs.
Table 5: Current ecological condition and desired state for CBAs and ESAs
Map category
Current ecological condition Desired state / management objective
CBA Good, with the following provisos: y For features that are Critically Endangered (i.e. for which
less than the biodiversity target remains in good ecological condition), it may be necessary to select sites in fair ecological condition to meet targets.
y In exceptional circumstances it may even be necessary to select severely modified sites to meet targets, but in these cases it is always important to ensure that the sites do indeed retain sufficient value for the biodiversity feature concerned to justify their selection.
Good (natural or near-natural). y Even for CBAs currently in fair or severely
modified ecological condition, the objective is to return them to good ecological condition if possible.
ESA At least fair, with the following proviso: y It may be necessary or useful to select a site in severely
modified ecological condition as an ESA, especially in landscapes that have been extensively modified. This is permissible IF the current level of ecological functioning of the feature concerned is compatible with the purpose for which the ESA has been selected.
For ESAs currently in good or fair ecological condition: At least fair (semi-natural).
For ESAs currently in severely modified ecological condition: No further deterioration in ecological condition (e.g. through intensification of land use).
21 There may be exceptions if there are small irreplaceable fragments that have so little remaining area or prospect for long-term persistence that selecting them would not be justified.
Technical Guidelines for CBA Maps – Beta Version, June 2017 29
◦ The river itself should be selected, not the whole FEPA sub-catchment.
y Flagship free-flowing rivers ◦ As identified in NFEPA. There are 19 of these rivers
in the country. y In principle, nationally determined/designated priority
features from systematic biodiversity plans should be included as far as possible. In some cases their delinea-tion may need to be refined.
Sites or features that MAY be selected as CBAs: y National priority estuaries that require full protection:
◦ As identified in the National Estuary Biodiversity Plan (NEBP) (Turpie et al, 2012).
◦ If a province has a finer scale estuary biodiversity plan that still achieves national biodiversity targets for es-tuaries, this can be used in preference to the NEBP.
◦ For some priority estuaries, the estuarine functional zone includes large areas that have been severely or irreversibly modified, which should not be selected as CBAs. It may be appropriate for the severely mod-ified areas to be selected as ESAs.
y Sites that meet biodiversity targets for species of special concern
y Unique or special habitats or features ◦ See discussion in Section 4.2.8 about what these
might include. ◦ The management objective or desired state for
these sites should determine whether these are se-lected as CBAs or ESAs.
y Sites that are irreplaceable for connectivity at the land-scape scale ◦ These are “pinch points” or critical linkages, that if
lost lead to disruption of an entire landscape-scale ecological corridor.
y Sites that are irreplaceable for connectivity at the local scale ◦ These are “pinch points” or critical linkages, that
if lost lead to disruption of a local-scale ecological corridor.
y Wetland FEPAs ◦ These may be selected as CBAs to meet biodiversity
targets for wetland ecosystem types, but if refined local data or wetland prioritisations are available these are likely to be preferable.
y Ramsar sites in good ecological condition y Areas important for ecological processes for which the
desired state is natural or near-natural
Features that must not automatically be selected as CBAs (but may already be selected under one or more of the criteria listed above):
y Nationally listed EN ecosystems ◦ Selection of these ecosystems as CBAs should be
based on their biodiversity targets. y Nationally listed VU ecosystems
◦ Selection of these ecosystems as CBAs should be based on their biodiversity targets.
y Focus areas for expansion of protected areas from the National Protected Area Expansion Strategy 2008 ◦ The updated National Protected Area Expansion
Strategy (in draft form in 2016) supersedes the NPAES 2008 and provides a much more detailed set of priorities for protected area expansion, most of which are subsets of CBAs identified in provincial biodiversity plans.
6.1.2 Criteria for identifying ESAsAn ESA is an area that must remain in at least fair ecological condition in order to: meet biodiversity targets for ecologi-cal processes that have not been met in CBAs or protected areas; meet biodiversity targets for representation of eco-system types or species of special concern when it is not possible to meet them in CBAs; support ecological func-tioning of a protected area or CBA (e.g. protected area buff-ers); or a combination of these. ESAs can meet biodiversity targets for terrestrial or aquatic features, or both. All eco-logical processes important for the long-term persistence of ecosystems and species should be adequately included in the portfolio of protected areas, CBAs and ESAs.
Sites selected to form part of ESAs could include sites in good, fair or even severely modified ecological condition, as long as the current ecological condition is compatible with fulfilling the purpose for which the ESA has been se-lected. The desired state/management objective for most ESAs is to maintain them in at least fair ecological con-dition. For ESAs that are severely modified, the manage-ment objective is no further deterioration in the current ecological condition.
Two sets of criteria for selecting sites as ESAs are listed below:
y Sites or features that must always be selected as ESAs y Sites or features that may be selected as ESAs
Features that MUST be selected as ESAs: y Landscape-scale ecological corridors that have not been
selected as CBAs y All wetlands in good ecological condition that have not
been selected as CBAs ◦ Assuming sufficient confidence in the data
y Free-flowing rivers ◦ Other than the flagship free-flowing rivers that have
been selected as CBAs
Features that MAY be selected as ESAs:22
Portions of these features may have already been select-ed as CBAs for other reasons. In such cases the remainder of the feature should be selected as an ESA.
y Local-scale ecological corridors not selected as CBAs ◦ If these have been identified, they should be includ-
ed as ESAs
22 Portions of these features may have already been selected as CBAs for other reasons. In such cases the remainder of the feature should be selected as an ESA.
30 Technical Guidelines for CBA Maps – Beta Version, June 2017
y Features representing ecological infrastructure not se-lected as CBAs ◦ Such as Strategic Water Source Areas
y Severely modified sites that are essential for meeting tar-gets for species of special concern ◦ This includes, for example, cultivated fields that pro-
vide essential habitat for threatened species ◦ The desired state for these sites is not to return them
to good ecological condition, so they cannot be se-lected as CBAs
y Specific sites important for persistence or management of species of special concern and not selected as CBAs ◦ See Section 4.2.7 for a discussion of what these
might include. y Any wetland FEPAs not selected as CBAs y All other natural wetlands y Unique or special habitats or features not selected as
CBAs ◦ See Section 4.2.8 for a discussion of what these
might include. ◦ Desired state or management objective should de-
termine whether these are selected as CBAs or ESAs. y Other areas important for ecological processes (e.g. ripar-
ian zones) not selected as CBAs y National priority estuaries that require partial protection
◦ As identified in the National Estuary Biodiversity Plan (NEBP).
◦ If a province has a finer scale estuary biodiversity plan that still achieves national biodiversity targets for estuaries, this can be used in preference to the NEBP.
◦ The estuarine functional zone of some priority estu-aries is likely to include large areas that have been severely or irreversibly modified. There is not a one-size-fits-all solution to dealing with this, but it may be appropriate to select the severely modified por-tions of the estuarine functional zone as ESAs.
y All estuarine functional zones not selected as CBAs (ex-cept irreversibly modified areas)
y Nationally listed EN ecosystems based on Criterion A ◦ Those portions of EN ecosystems based on Criterion
A that are in good ecological condition and that have not already been selected as CBAs.
y Nationally listed VU ecosystems based on any criterion ◦ Those portions of VU ecosystems that are in good
ecological condition and that have not already been selected as CBAs.
6.1.3 Sub-categories within CBAs and ESAs
As a general principle it is important to minimise the num-ber of sub-categories of CBAs and ESAs, in order to keep CBA Maps visually simple and easy to understand. As shown by the lists above, CBAs and ESAs can be selected based on a wide range of criteria. Information about the reasons for selection of CBAs or ESAs should as far as possi-
ble be included as attribute data, and not reflected through multiple sub-categories of CBAs and ESAs. Nevertheless, it is often useful to distinguish between a small number of sub-categories of CBAs and ESAs, as summarised in Fig-ure 6.
For CBAs, it is often useful to distinguish between the fol-lowing two sub-categories:
y CBA1 (sometimes called CBA Irreplaceable) : ◦ These are areas that are irreplaceable or near-irre-
placeable (i.e. high selection frequency) for meeting biodiversity targets. There are no or very few other options for meeting biodiversity targets for the fea-tures associated with these areas.
y CBA2 (sometimes called CBA Optimal): ◦ These are areas that have been selected as the best
option for meeting biodiversity targets, based on complementarity, efficiency, connectivity and/or avoidance of conflict with other land or resources uses.
As discussed, in most cases only sites that are in good ecological condition will be selected as CBAs. If sites that are known to be in fair or poor ecological condition have been selected as CBAs because there are no other options for meeting biodiversity targets, these sites may be visu-ally distinguished on the map. However, it is preferable simply to include this information in the attribute data rather than making these CBAs a distinct sub-category.
For ESAs, it is usually useful to distinguish between the following two sub-categories:
y ESA1: ◦ These are ESAs that are currently in either good or
fair ecological condition, for which the objective is to retain them in at least fair ecological condition.
y ESA2: ◦ These are ESAs that are currently in severely modi-
fied ecological condition (e.g. cultivated areas in riparian zones) but that nevertheless retain suffi-cient ecological functioning to fulfil the purpose for which the ESA was selected. The objective is to pre-vent further deterioration in ecological condition.
The distinction between CBA1 and CBA2 is thus based on irreplaceability, while the distinction between ESA1 and ESA2 is based on ecological condition.
6.2 Identifying ecological corridors
As discussed in Section 4.2.9, ecological corridors are cor-ridors of intact habitat (i.e. mostly good or fair ecological condition) that allow for a range of ecological processes to occur over time and space. They promote connectivity and linkages in the landscape, for example between core areas important for biodiversity, such as protected areas and CBAs.
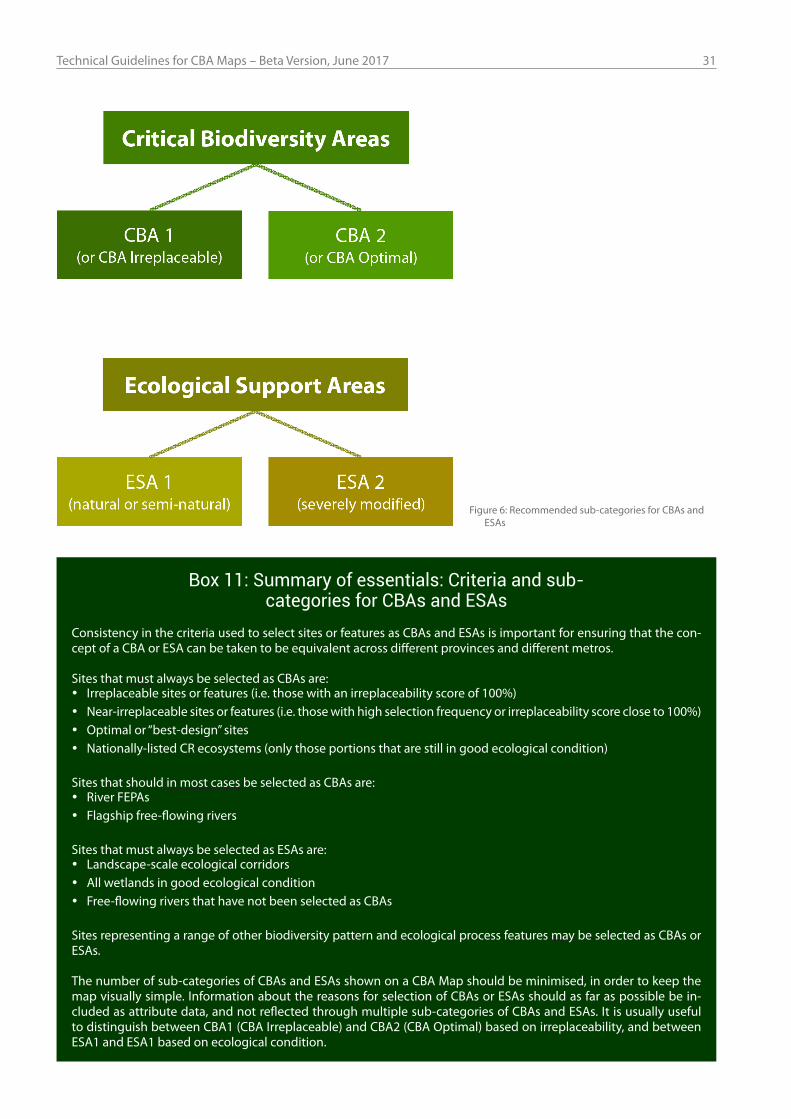
Technical Guidelines for CBA Maps – Beta Version, June 2017 31
Figure 6: Recommended sub-categories for CBAs and ESAs
Box 11: Summary of essentials: Criteria and sub-categories for CBAs and ESAs
Consistency in the criteria used to select sites or features as CBAs and ESAs is important for ensuring that the con-cept of a CBA or ESA can be taken to be equivalent across different provinces and different metros.
Sites that must always be selected as CBAs are: y Irreplaceable sites or features (i.e. those with an irreplaceability score of 100%) y Near-irreplaceable sites or features (i.e. those with high selection frequency or irreplaceability score close to 100%) y Optimal or “best-design” sites y Nationally-listed CR ecosystems (only those portions that are still in good ecological condition)
Sites that should in most cases be selected as CBAs are: y River FEPAs y Flagship free-flowing rivers
Sites that must always be selected as ESAs are: y Landscape-scale ecological corridors y All wetlands in good ecological condition y Free-flowing rivers that have not been selected as CBAs
Sites representing a range of other biodiversity pattern and ecological process features may be selected as CBAs or ESAs.
The number of sub-categories of CBAs and ESAs shown on a CBA Map should be minimised, in order to keep the map visually simple. Information about the reasons for selection of CBAs or ESAs should as far as possible be in-cluded as attribute data, and not reflected through multiple sub-categories of CBAs and ESAs. It is usually useful to distinguish between CBA1 (CBA Irreplaceable) and CBA2 (CBA Optimal) based on irreplaceability, and between ESA1 and ESA1 based on ecological condition.
32 Technical Guidelines for CBA Maps – Beta Version, June 2017
Key features of ecological corridors for a biodiversity plan include:
y They should be pathways of least cost. A least-cost pathway analysis or dedicated software such as Cir-cuitscape may be useful to identify these paths, and expert review of results is helpful.
y They should be ecologically sensible, reflecting real pathways that are useful for the ecological processes or species being targeted.
y They must be made up of a set of specific sites that will become either CBAs or ESAs. There is little point in hav-ing diagrammatic or indicative corridors.
Other issues related to ecological corridors include: y Ecological corridors in one province should link with
corridors in adjacent provinces. y Integration or links between terrestrial and aquatic
features can be facilitated by the identification of cor-ridors, for example by including rivers, wetland clusters and their buffers.
Critical linkages within corridors may be identified. Criti-cal linkages are sites that are irreplaceable for connectiv-ity in the landscape and are often under some degree of threat. Loss of these “pinch points” or critical linkage sites can lead to disruption of the entire corridor, hence these sites often need to be CBAs.
Box 12: Summary of essentials: Ecological corridors
Ecological corridors are essential features in a CBA Map. They link core areas important for biodiversity (such as protected areas and CBAs) and allow for the functioning of ecological processes at a range of scales. Ecological corridors should be pathways of least cost, and should link with corridors in adja-cent provinces. They can include critical linkages or “pinch points” that are irreplaceable for connectivity in the landscape.
6.3 Planning unitsPlanning units are essential for any systematic biodiver-sity planning process. Information about biodiversity fea-tures as well as ecological condition and socio-economic opportunities and constraints is attached to each plan-ning unit.
A wide range of options exists for delineating planning units. For example, they could be regular geometric units, ecological units, or land management units such as prop-erty boundaries. Factors to consider in deciding on the size and spatial form of planning units include:
y The size or spatial scale of the planning units relative to the resolution of the data on biodiversity features. For example, planning units should not dwarf the smallest
biodiversity features, and should not be too small rela-tive to the resolution of the biodiversity features.
y The spatial scale at which the outputs of the biodi-versity plan will be applied should be considered, but should not override the limitations of scale of the data on biodiversity features. CBA Maps are intended to be used to inform land-use planning and decision-making at the site scale, so ideally planning units should not be at a broader scale than individual properties.
y If planning units are irregularly sized, a large range in the size of planning units should be avoided.
y Protected areas can be treated as single planning units, or can be subdivided by the planning units used in the rest of the landscape.
Box 13: Summary of essentials: Planning units
A wide range of options exists for delineating plan-ning units. In general the spatial scale of planning units should not be much broader or much finer than the spatial scale of the input data for the bio-diversity plan.
6.4 Design and optimisation issues
Systematic biodiversity planning involves spatially ana-lysing biodiversity features, pressures on these features and other relevant socio-economic informants (e.g. op-portunities and constraints), using a robust, transparent and repeatable methodology. The aim is to identify an efficient portfolio of CBAs and ESAs which would ensure biodiversity features persist into the future and continue to deliver ecosystem services. The areas selected should sufficiently represent all important biodiversity features in a configuration that is ecologically sustainable, and is as robust as possible to ongoing land-use change, climate change and other impacts. The configuration should en-sure optimal benefits to society.
A number of issues related to the design and optimisation of the portfolio of CBAs and ESAs should be highlighted:
y The role of “costs”: There are almost always compet-ing social, economic, and environmental objectives across landscapes, and the prioritisation of CBAs and ESAs should as far as possible attempt to minimise conflict with competing land uses and align with com-patible ones. “Costs” are an important concept in sys-tematic biodiversity planning. The term “costs” is used to refer to constraints and opportunities that are taken into account in the process of identifying biodiversity priority areas. Costs are assigned to planning units (see Section 6.3), and can be negative, i.e. intended to bias selection away from the planning unit concerned, or positive, i.e. intended to bias selection towards the planning unit concern
Technical Guidelines for CBA Maps – Beta Version, June 2017 33
y Adjacency and edge-matching: Edge-matching of CBA Maps that fall on either side of a planning domain boundary (usually a provincial boundary) is impor-tant to ensure that important features or sites at the boundaries have some degree of continuity with adja-cent biodiversity plans. The general principle is that as far as possible adjacent biodiversity plans should align across administrative or planning boundaries. It is es-sential for landscape-scale ecological corridors to be continuous across the boundaries between adjacent provincial biodiversity plans. Where possible, CBAs and ESAs at the boundaries of adjacent plans should be aligned, especially when the underlying biodiver-sity features straddle the boundary.
y Consistency with previous biodiversity plans: Where possible, it is useful to ensure consistency with previous plans. Where priorities have previously been identified, these should be preferentially selected for meeting biodiversity targets. It is destructive to change selection just for the sake of it, and it can undermine the credibility of the plan with users.
y Stakeholder and expert input: Spatial prioritisation is not just a technical process, but often requires signifi-cant stakeholder inputs, particularly for understanding opportunities and constraints.23 Further, well docu-mented expert inputs can help fill data gaps e.g. in re-fining distributions of threatened species or refining/confirming maps of ecological condition.
y Iterative analysis: The analysis is often iterative, and should include sensitivity analysis and recalibration of parameters and targets, as discussed below. It is often useful for draft outputs to be reviewed by experts with on-the-ground ecological knowledge before the anal-ysis is finalised.
6.5 Sensitivity analysis, calibration of parameters and analysis of targets met
Conducting a sensitivity analysis to evaluate the effec-tiveness and efficiency of the biodiversity plan is best practice. Such as analysis will also help in determining how sensitive the biodiversity planning results are to dif-ferences in input data or design parameters set in the planning software, and will assist with calibration of pa-rameters set in the software or calibration of targets set for biodiversity features. Refer to the Marxan best prac-tices guidelines (Ardron et al., 2010) for a list of the vari-
ables and inputs that should be included in the sensitivity analysis.
The portfolio of protected areas, CBAs and ESAs should be carefully evaluated to ensure that it meets targets for biodiversity features. Where targets are not sufficiently met, it is important to examine why. Numerous possible reasons exist: some targets may be too high; it may be necessary to include more areas of poorer condition habi-tat to meet targets; planning unit costs may be incorrectly calibrated; or it may be that a particular feature is indeed critically endangered and that insufficient intact area ex-ists to meet the target for that feature, in which case one should just highlight that the target for that feature can-not be met. If targets are exceeded, the plan may not be spatially efficient, and this should also be examined.
It is important to document the extent to which the port-folio of protected areas, CBAs and ESAs meets the bio-diversity targets that were set for ecosystem types and species of special concern, and for ecological processes if applicable. Tables summarising this information should be included in the technical report (see Table 4 in Section 5 for an example). Clear justification should be provided both when targets have not been met and when they have been exceeded.
The portfolio of protected areas, CBAs and ESAs should be examined for spatial efficiency. Did the spatial analysis select a reasonable portion of the landscape? It is worth examining the sensitivity of the area selected to the tar-gets used. For example, it may be possible to reach 95% of a target easily and then require very large, fragmented or high-conflict areas to meet the remainder of the target. In such a case one would need to consider whether it is ecologically justifiable to adjust the target or whether it is better to accept that the target will not be fully met. This process is an important part of the balancing of interests across biodiversity, social and economic realms.
Box 14: Summary of essentials: Analysis of
biodiversity targets metThe extent to which the portfolio of protected areas, CBAs and ESAs meets the biodiversity targets must be assessed, and a tables summarising this informa-tion should be included in the technical report (see Table 4 in Section 5 for an example). Clear justifica-tion should be provided both when targets have not been met and when they have been exceeded.
23 As noted in Section 1.3, these guidelines deal primarily with techni-cal aspects of developing a CBA Map. They do not cover aspects such as institutional arrangements and stakeholder engagement, which are central to the process and are dealt with in the Guideline for Bioregional Plans.
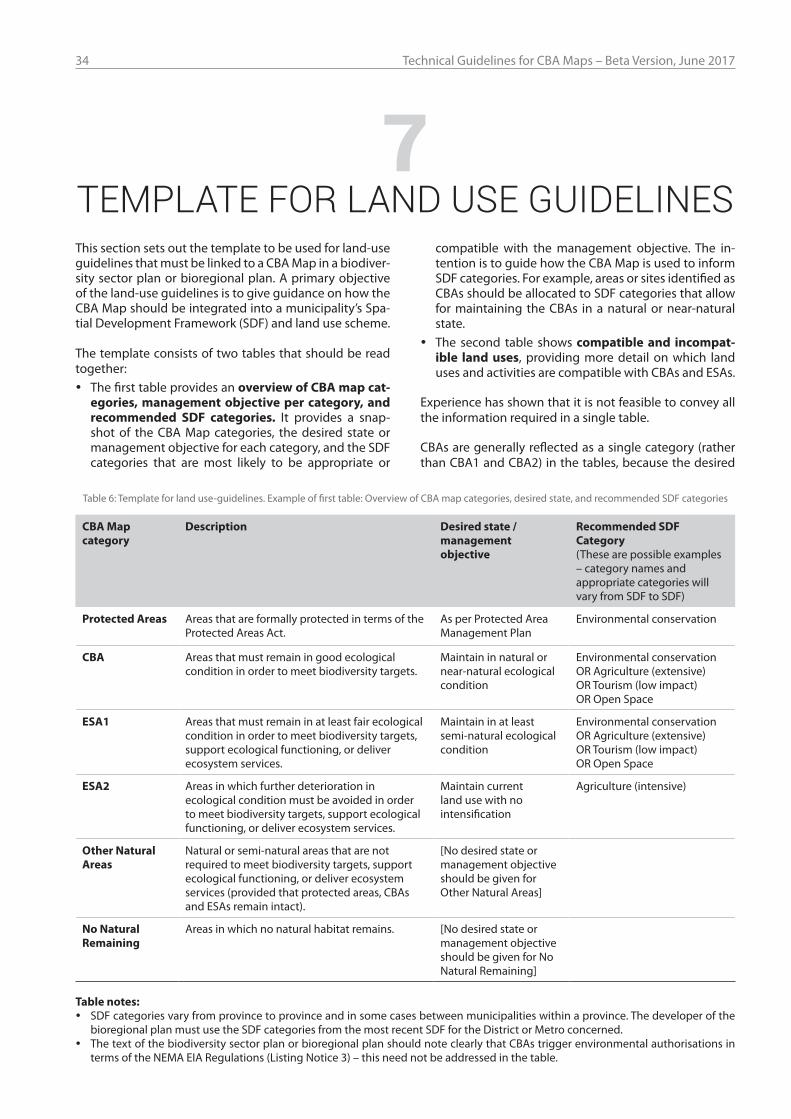
34 Technical Guidelines for CBA Maps – Beta Version, June 2017
This section sets out the template to be used for land-use guidelines that must be linked to a CBA Map in a biodiver-sity sector plan or bioregional plan. A primary objective of the land-use guidelines is to give guidance on how the CBA Map should be integrated into a municipality’s Spa-tial Development Framework (SDF) and land use scheme.
The template consists of two tables that should be read together:
y The first table provides an overview of CBA map cat-egories, management objective per category, and recommended SDF categories . It provides a snap-shot of the CBA Map categories, the desired state or management objective for each category, and the SDF categories that are most likely to be appropriate or
compatible with the management objective. The in-tention is to guide how the CBA Map is used to inform SDF categories. For example, areas or sites identified as CBAs should be allocated to SDF categories that allow for maintaining the CBAs in a natural or near-natural state.
y The second table shows compatible and incompat-ible land uses, providing more detail on which land uses and activities are compatible with CBAs and ESAs.
Experience has shown that it is not feasible to convey all the information required in a single table.
CBAs are generally reflected as a single category (rather than CBA1 and CBA2) in the tables, because the desired
7 TEMPLATE FOR LAND USE GUIDELINES
Table 6: Template for land use-guidelines. Example of first table: Overview of CBA map categories, desired state, and recommended SDF categories
CBA Map category
Description Desired state / management objective
Recommended SDF Category (These are possible examples – category names and appropriate categories will vary from SDF to SDF)
Protected Areas Areas that are formally protected in terms of the Protected Areas Act.
As per Protected Area Management Plan
Environmental conservation
CBA Areas that must remain in good ecological condition in order to meet biodiversity targets.
Maintain in natural or near-natural ecological condition
Environmental conservation OR Agriculture (extensive)OR Tourism (low impact)OR Open Space
ESA1 Areas that must remain in at least fair ecological condition in order to meet biodiversity targets, support ecological functioning, or deliver ecosystem services.
Maintain in at least semi-natural ecological condition
Environmental conservation OR Agriculture (extensive)OR Tourism (low impact)OR Open Space
ESA2 Areas in which further deterioration in ecological condition must be avoided in order to meet biodiversity targets, support ecological functioning, or deliver ecosystem services.
Maintain current land use with no intensification
Agriculture (intensive)
Other Natural Areas
Natural or semi-natural areas that are not required to meet biodiversity targets, support ecological functioning, or deliver ecosystem services (provided that protected areas, CBAs and ESAs remain intact).
[No desired state or management objective should be given for Other Natural Areas]
No Natural Remaining
Areas in which no natural habitat remains. [No desired state or management objective should be given for No Natural Remaining]
Table notes: y SDF categories vary from province to province and in some cases between municipalities within a province. The developer of the
bioregional plan must use the SDF categories from the most recent SDF for the District or Metro concerned. y The text of the biodiversity sector plan or bioregional plan should note clearly that CBAs trigger environmental authorisations in
terms of the NEMA EIA Regulations (Listing Notice 3) – this need not be addressed in the table.
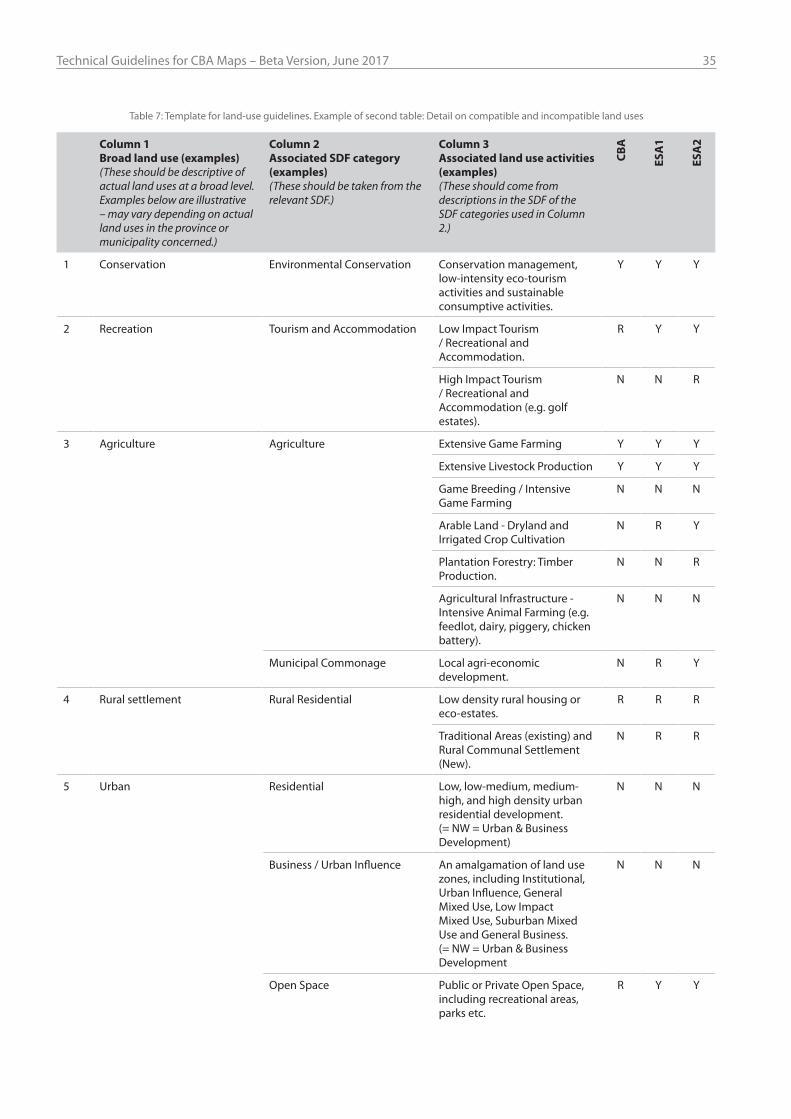
Technical Guidelines for CBA Maps – Beta Version, June 2017 35
Table 7: Template for land-use guidelines. Example of second table: Detail on compatible and incompatible land uses
Column 1Broad land use (examples)(These should be descriptive of actual land uses at a broad level. Examples below are illustrative – may vary depending on actual land uses in the province or municipality concerned.)
Column 2Associated SDF category (examples)(These should be taken from the relevant SDF.)
Column 3Associated land use activities (examples)(These should come from descriptions in the SDF of the SDF categories used in Column 2.)
CBA
ESA
1
ESA
2
1 Conservation Environmental Conservation Conservation management, low-intensity eco-tourism activities and sustainable consumptive activities.
Y Y Y
2 Recreation Tourism and Accommodation Low Impact Tourism / Recreational and Accommodation.
R Y Y
High Impact Tourism / Recreational and Accommodation (e.g. golf estates).
N N R
3 Agriculture Agriculture Extensive Game Farming Y Y Y
Extensive Livestock Production Y Y Y
Game Breeding / Intensive Game Farming
N N N
Arable Land - Dryland and Irrigated Crop Cultivation
N R Y
Plantation Forestry: Timber Production.
N N R
Agricultural Infrastructure - Intensive Animal Farming (e.g. feedlot, dairy, piggery, chicken battery).
N N N
Municipal Commonage Local agri-economic development.
N R Y
4 Rural settlement Rural Residential Low density rural housing or eco-estates.
R R R
Traditional Areas (existing) and Rural Communal Settlement (New).
N R R
5 Urban Residential Low, low-medium, medium-high, and high density urban residential development. (= NW = Urban & Business Development)
N N N
Business / Urban Influence An amalgamation of land use zones, including Institutional, Urban Influence, General Mixed Use, Low Impact Mixed Use, Suburban Mixed Use and General Business. (= NW = Urban & Business Development
N N N
Open Space Public or Private Open Space, including recreational areas, parks etc.
R Y Y
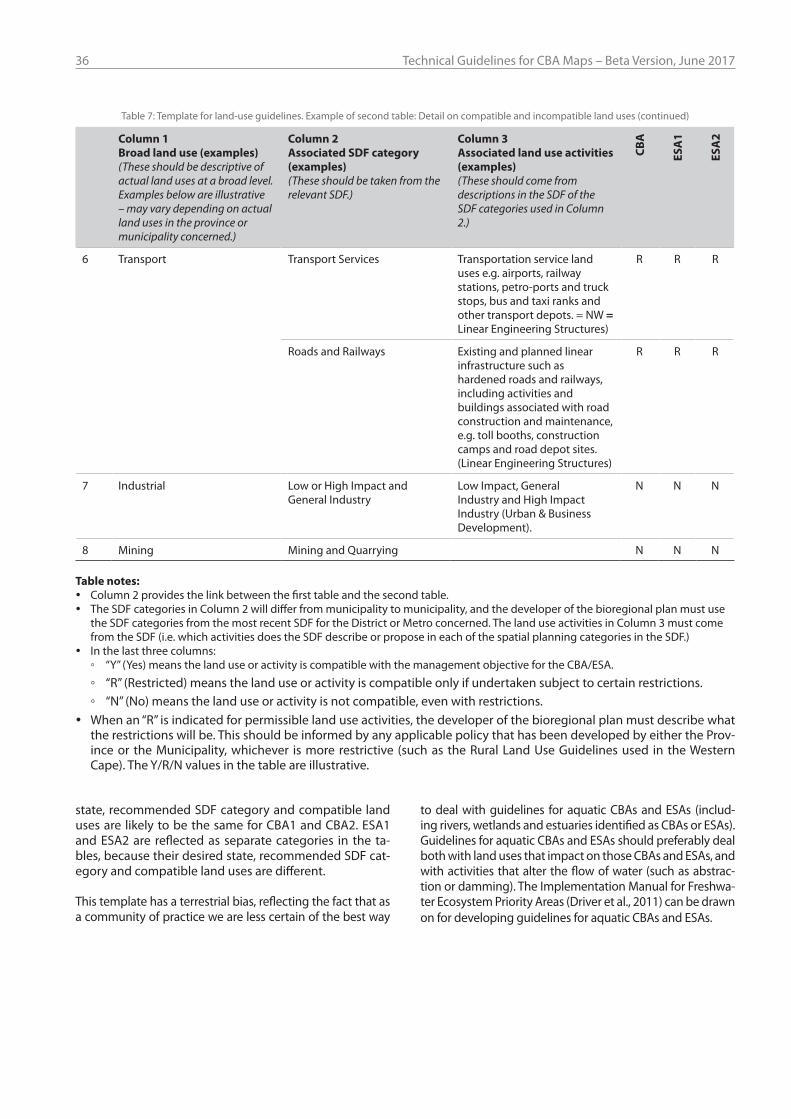
36 Technical Guidelines for CBA Maps – Beta Version, June 2017
state, recommended SDF category and compatible land uses are likely to be the same for CBA1 and CBA2. ESA1 and ESA2 are reflected as separate categories in the ta-bles, because their desired state, recommended SDF cat-egory and compatible land uses are different.
This template has a terrestrial bias, reflecting the fact that as a community of practice we are less certain of the best way
to deal with guidelines for aquatic CBAs and ESAs (includ-ing rivers, wetlands and estuaries identified as CBAs or ESAs). Guidelines for aquatic CBAs and ESAs should preferably deal both with land uses that impact on those CBAs and ESAs, and with activities that alter the flow of water (such as abstrac-tion or damming). The Implementation Manual for Freshwa-ter Ecosystem Priority Areas (Driver et al., 2011) can be drawn on for developing guidelines for aquatic CBAs and ESAs.
Column 1Broad land use (examples)(These should be descriptive of actual land uses at a broad level. Examples below are illustrative – may vary depending on actual land uses in the province or municipality concerned.)
Column 2Associated SDF category (examples)(These should be taken from the relevant SDF.)
Column 3Associated land use activities (examples)(These should come from descriptions in the SDF of the SDF categories used in Column 2.)
CBA
ESA
1
ESA
2
6 Transport Transport Services Transportation service land uses e.g. airports, railway stations, petro-ports and truck stops, bus and taxi ranks and other transport depots. = NW = Linear Engineering Structures)
R R R
Roads and Railways Existing and planned linear infrastructure such as hardened roads and railways, including activities and buildings associated with road construction and maintenance, e.g. toll booths, construction camps and road depot sites. (Linear Engineering Structures)
R R R
7 Industrial Low or High Impact and General Industry
Low Impact, General Industry and High Impact Industry (Urban & Business Development).
N N N
8 Mining Mining and Quarrying N N N
Table notes: y Column 2 provides the link between the first table and the second table. y The SDF categories in Column 2 will differ from municipality to municipality, and the developer of the bioregional plan must use
the SDF categories from the most recent SDF for the District or Metro concerned. The land use activities in Column 3 must come from the SDF (i.e. which activities does the SDF describe or propose in each of the spatial planning categories in the SDF.)
y In the last three columns: ◦ “Y” (Yes) means the land use or activity is compatible with the management objective for the CBA/ESA.
◦ “R” (Restricted) means the land use or activity is compatible only if undertaken subject to certain restrictions. ◦ “N” (No) means the land use or activity is not compatible, even with restrictions.
y When an “R” is indicated for permissible land use activities, the developer of the bioregional plan must describe what the restrictions will be. This should be informed by any applicable policy that has been developed by either the Prov-ince or the Municipality, whichever is more restrictive (such as the Rural Land Use Guidelines used in the Western Cape). The Y/R/N values in the table are illustrative.
Table 7: Template for land-use guidelines. Example of second table: Detail on compatible and incompatible land uses (continued)
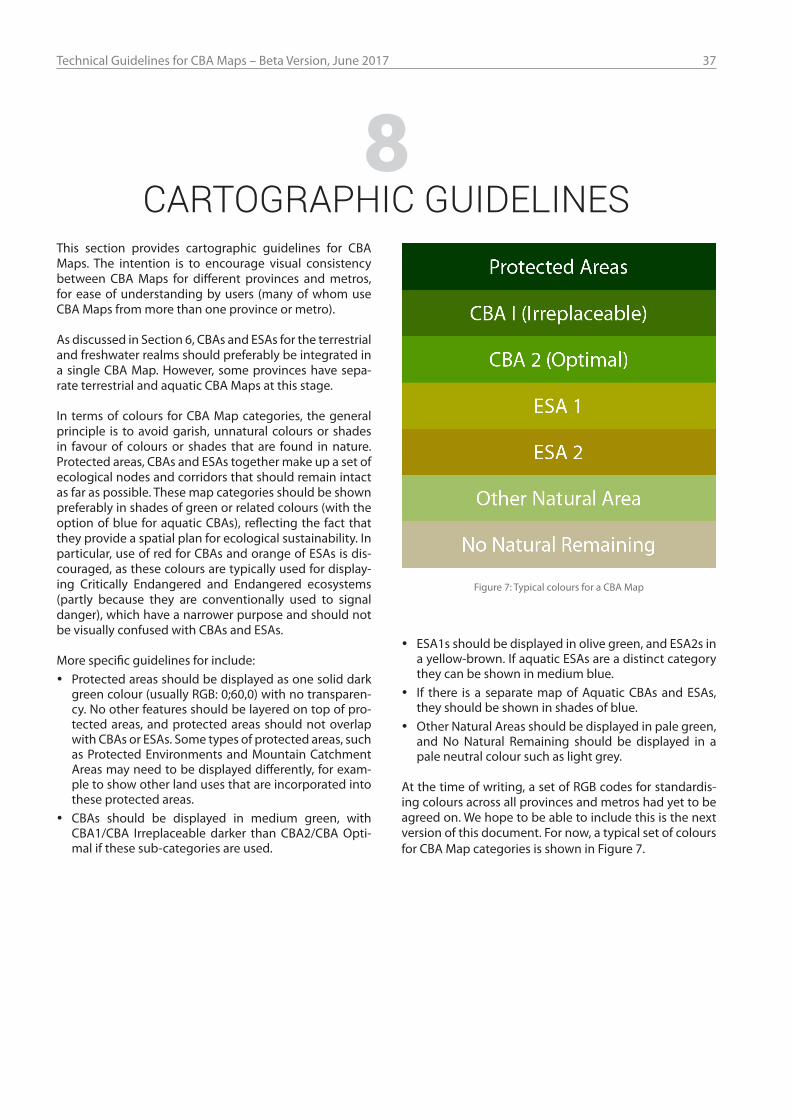
Technical Guidelines for CBA Maps – Beta Version, June 2017 37
This section provides cartographic guidelines for CBA Maps. The intention is to encourage visual consistency between CBA Maps for different provinces and metros, for ease of understanding by users (many of whom use CBA Maps from more than one province or metro).
As discussed in Section 6, CBAs and ESAs for the terrestrial and freshwater realms should preferably be integrated in a single CBA Map. However, some provinces have sepa-rate terrestrial and aquatic CBA Maps at this stage.
In terms of colours for CBA Map categories, the general principle is to avoid garish, unnatural colours or shades in favour of colours or shades that are found in nature. Protected areas, CBAs and ESAs together make up a set of ecological nodes and corridors that should remain intact as far as possible. These map categories should be shown preferably in shades of green or related colours (with the option of blue for aquatic CBAs), reflecting the fact that they provide a spatial plan for ecological sustainability. In particular, use of red for CBAs and orange of ESAs is dis-couraged, as these colours are typically used for display-ing Critically Endangered and Endangered ecosystems (partly because they are conventionally used to signal danger), which have a narrower purpose and should not be visually confused with CBAs and ESAs.
More specific guidelines for include: y Protected areas should be displayed as one solid dark
green colour (usually RGB: 0;60,0) with no transparen-cy. No other features should be layered on top of pro-tected areas, and protected areas should not overlap with CBAs or ESAs. Some types of protected areas, such as Protected Environments and Mountain Catchment Areas may need to be displayed differently, for exam-ple to show other land uses that are incorporated into these protected areas.
y CBAs should be displayed in medium green, with CBA1/CBA Irreplaceable darker than CBA2/CBA Opti-mal if these sub-categories are used.
y ESA1s should be displayed in olive green, and ESA2s in a yellow-brown. If aquatic ESAs are a distinct category they can be shown in medium blue.
y If there is a separate map of Aquatic CBAs and ESAs, they should be shown in shades of blue.
y Other Natural Areas should be displayed in pale green, and No Natural Remaining should be displayed in a pale neutral colour such as light grey.
At the time of writing, a set of RGB codes for standardis-ing colours across all provinces and metros had yet to be agreed on. We hope to be able to include this is the next version of this document. For now, a typical set of colours for CBA Map categories is shown in Figure 7.
8 CARTOGRAPHIC GUIDELINES
Figure 7: Typical colours for a CBA Map
38 Technical Guidelines for CBA Maps – Beta Version, June 2017
CBA Maps are intended to be in the public domain and to be easily accessible to users. For many users, the map it-self is the most visible product or output of a biodiversity planning process. However, it is not the only product. The CBA Map must also be available in GIS form, including at-tribute data.
The minimum GIS data that should be submitted to the Review Panel for Bioregional Plans and that should be made available to users is a shapefile of the CBA Map cat-egories (Protected Areas, CBAs, ESAs, ONA, NNR), prefer-ably as a single shapefile. Planning units will generally be dissolved in this shapefile. In addition, a more detailed shapefile with criteria for selection linked to planning units should be provided. Further, input data layers used to produce the plan are often useful in their own right, not simply as inputs into the analysis. Examples include maps of ecosystem types (such as the vegetation map, map of wetlands, map of rivers), protected areas and land cover or habitat modification map. SANBI’s Biodiversity GIS (BGIS) website provides a platform for making CBA Maps and accompanying data and information available to the public.
The main categories on a CBA Map must be mutually ex-clusive in the GIS outputs of the systematic biodiversity plan. Protected areas, CBAs, ESAs, ONA and NNR cannot overlap with each other.
9.1 Essential attribute dataA simple shapefile with CBA Map categories should be provided, with
The minimum attribute data that should be included in the shapefile of a CBA Map should include the following:
y CBA Map category (i.e. PA, CBA, ESA, ONA, NNR) y For CBAs and ESAs: the reason(s) for their selection (or
the criteria on which their selection was based), for ex-ample, “threatened vegetation type”, “threatened spe-cies”, “ecological corridor”.
y Ecological condition is generally best provided as a separate shapefile.
9.2 Guidelines for shapefiles and topology
GIS layers must be clean and topologically correct. In par-ticular, there should be no overlapping polygons within or between map categories, and line or polyline data should be continuous where this is appropriate.
GIS data must have metadata. GIS data must have pro-jection files, and information about the projection must be included in the metadata. Metadata should conform to the South African Spatial Data Infrastructure (SASDI) standard. It is highly recommended that contact details of the relevant person responsible for answering queries related to the CBA Map be included in the metadata.
9 REQUIREMENTS FOR
SUPPORTING GIS DATA

Technical Guidelines for CBA Maps – Beta Version, June 2017 39
A technical report is an essential part of a spatial biodiversity plan, and is a requirement for a spatial biodiversity plan that underpins a CBA Map in a bioregional plan. The technical re-port should explain the data and methods used to develop and produce the plan. It is usually not intended for general readers but is essential for those users who need more detail about how the plan was developed. Draft bioregional plans submitted to the Review Panel must be accompanied by a technical report for the underlying biodiversity plan. With-out this a bioregional plan cannot be published.
Technical reports for CBA Maps must: y Explain clearly how the principles of systematic biodi-
versity planning have been incorporated into the plan. y Explain clearly how the essential characteristics of a
systematic biodiversity plan have been addressed in the plan.
y Explain the methodology for developing the CBA Map, clearly identifying the input layers, biodiversity targets, the analysis methods (e.g. for corridors) and so on. As a minimum, a technical reader should be able to clearly understand the planning process and its limitations,
y Include an analysis of biodiversity targets met (see Sec-tion 6.5).
If any revisions to the CBA Map are undertaken as a re-sult of the consultation process involved in the develop-ment of a bioregional plan, the nature of the revisions, the technical methods used and the implications for meeting biodiversity targets must be set out clearly in a technical appendix to the Process and Consultation Report that ac-companies the bioregional plan, and preferably also in-cluded as addendum to the technical report.
10 GUIDELINES FOR TECHNICAL REPORTS
40 Technical Guidelines for CBA Maps – Beta Version, June 2017
Ardron, J.A., Possingham, H.P. & Klein, C.J. (eds). 2010. Marxan Good Practices Handbook, Version 2. Pacific Marine Analysis and Research Association, Victoria, BC, Canada. 165 pages
Cadman, M., Petersen, C., Driver, A., Sekhran, N., Maze, K. & Munzhedzi, S. 2010. Biodiversity for Development: South Africa’s landscape approach to conserving biodiversity and promoting ecosystem resilience. South African National Biodiver-sity Institute, Pretoria.
Department of Environmental Affairs and Tourism. 2009. Guideline regarding the determination of bioregions and the prep-aration and publication of bioregional plans. Notice No. 291, Government Gazette No. 32006, 16 March 2009.
Driver A., Sink, K.J., Nel, J.N., Holness, S., Van Niekerk, L., Daniels, F., Madjiet, P.A., Jonas, Z. and Maze, K. 2012. National Bio-diversity Assessment 2011: An assessment of South Africa’s biodiversity and ecosystems. Synthesis Report. South African National Biodiversity Institute and Department of Environmental Affairs, Pretoria.
Driver, A., Nel, J.L., Snaddon, K., Murray, K., Roux, D.J., Hill, L., Swartz, E.R., Manuel, J., Funke, N. 2011. Implementation Manual for Freshwater Ecosystem Priority Areas. WRC Report No. 1801/1/11, Water Research Commission, Pretoria.
Margules, C.R. & Pressey, R.L. 2000. Systematic conservation planning. Nature. 405, 243- 253.
Millennium Ecosystem Assessment. 2005. Ecosystems and human well-being: Synthesis. Island Press, Washington, DC.
Mucina, L. & Rutherford, M.C. (eds). 2006. The vegetation of South Africa, Lesotho and Swaziland. Strelitzia 19. South Afri-can National Biodiversity Institute, Pretoria.
Nel, J.L., Driver, A., Strydom, W.F., Maherry, A., Petersen, C., Hill, L., Roux, D.J., Nienaber, S., Van Deventer, H., Swartz, S. & Smith-Adao, L.B. 2011. Atlas of Freshwater Ecosystem Priority Areas in South Africa. WRC Report No. TT 500/11. Water Research Commission, Pretoria.
Noss, R.F. 1990. Indicators for monitoring biodiversity: a hierarchical approach. Conservation Biology 4(4): 355-364.
Pressey, R.L. & Bottrill, M.C. 2008. Opportunism, threats, and the evolution of systematic conservation planning. Conserva-tion Biology 22(5): 1340–1345.
Pressey, R.L. & Bottrill, M.C. 2009. Approaches to landscape- and seascape-scale conservation planning: convergence, contrasts and challenges. Oryx 43(4): 464–475.
SANBI. 2009. Further Development of a proposed National Wetland Classification System for South Africa. Primary Project Report. Prepared by the Freshwater Consulting Group (FCG) for the South African National Biodiversity Institute.
SANBI. 2013a. National Ecosystem Classification System: Concept note. March 2013. South African National Biodiversity Institute, Pretoria.
SANBI. 2013b. Factsheet on ecological infrastructure. 2nd edition, August 2013. South African National Biodiversity Insti-tute, Pretoria.
SANBI. 2016. Lexicon of biodiversity planning in South Africa. First edition, beta version. South African National Biodiversity Institute, Pretoria.
SANBI & UNEP-WCMC. 2016. Mapping biodiversity priorities: A practical, science-based approach to national biodiversity as-sessment and prioritisation to inform strategy and action planning. UNEP-WCMC, Cambridge, UK.
Turpie, J.K., Wilson, G. & Van Niekerk, L. 2012. National Biodiversity Assessment 2011: National Estuary Biodiversity Plan for South Africa. Anchor Environmental Consulting, Cape Town. Report produced for the Council for Scientific and In-dustrial Research and the South African National Biodiversity Institute.
REFERENCES
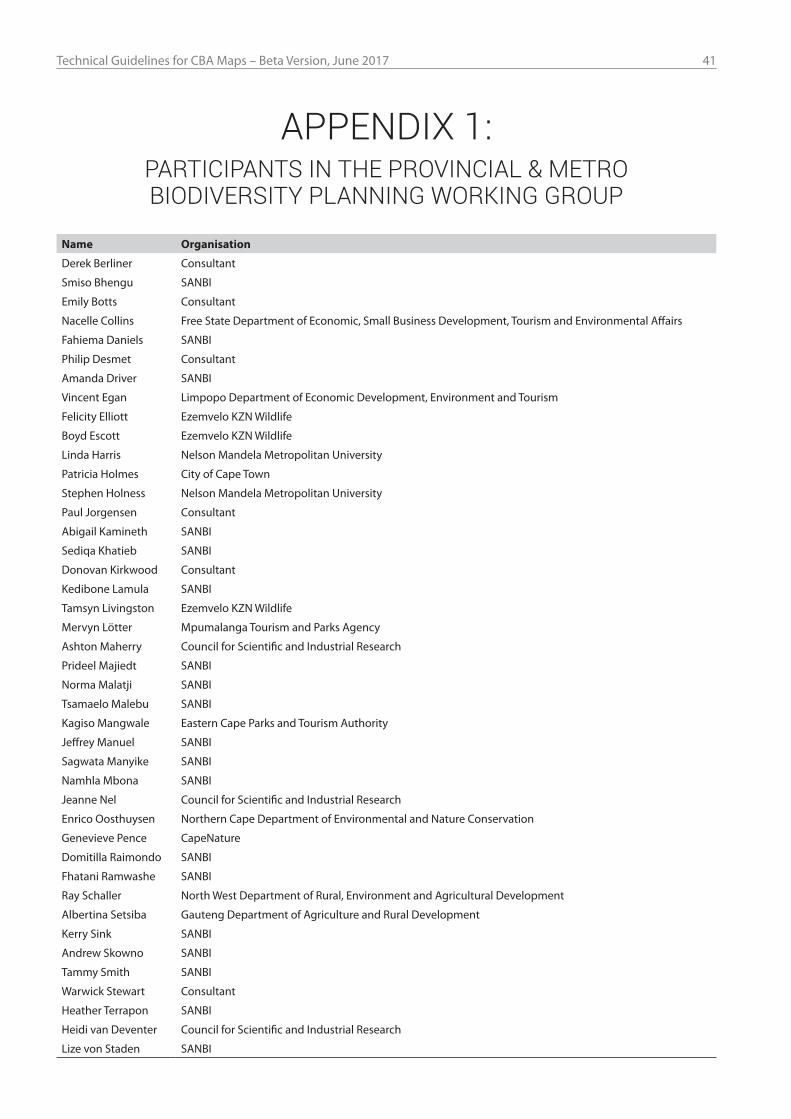
Technical Guidelines for CBA Maps – Beta Version, June 2017 41
Name Organisation
Derek Berliner Consultant
Smiso Bhengu SANBI
Emily Botts Consultant
Nacelle Collins Free State Department of Economic, Small Business Development, Tourism and Environmental Affairs
Fahiema Daniels SANBI
Philip Desmet Consultant
Amanda Driver SANBI
Vincent Egan Limpopo Department of Economic Development, Environment and Tourism
Felicity Elliott Ezemvelo KZN Wildlife
Boyd Escott Ezemvelo KZN Wildlife
Linda Harris Nelson Mandela Metropolitan University
Patricia Holmes City of Cape Town
Stephen Holness Nelson Mandela Metropolitan University
Paul Jorgensen Consultant
Abigail Kamineth SANBI
Sediqa Khatieb SANBI
Donovan Kirkwood Consultant
Kedibone Lamula SANBI
Tamsyn Livingston Ezemvelo KZN Wildlife
Mervyn Lötter Mpumalanga Tourism and Parks Agency
Ashton Maherry Council for Scientific and Industrial Research
Prideel Majiedt SANBI
Norma Malatji SANBI
Tsamaelo Malebu SANBI
Kagiso Mangwale Eastern Cape Parks and Tourism Authority
Jeffrey Manuel SANBI
Sagwata Manyike SANBI
Namhla Mbona SANBI
Jeanne Nel Council for Scientific and Industrial Research
Enrico Oosthuysen Northern Cape Department of Environmental and Nature Conservation
Genevieve Pence CapeNature
Domitilla Raimondo SANBI
Fhatani Ramwashe SANBI
Ray Schaller North West Department of Rural, Environment and Agricultural Development
Albertina Setsiba Gauteng Department of Agriculture and Rural Development
Kerry Sink SANBI
Andrew Skowno SANBI
Tammy Smith SANBI
Warwick Stewart Consultant
Heather Terrapon SANBI
Heidi van Deventer Council for Scientific and Industrial Research
Lize von Staden SANBI
APPENDIX 1: PARTICIPANTS IN THE PROVINCIAL & METRO BIODIVERSITY PLANNING WORKING GROUP