Embed Size (px)
Citation preview
Technical Guide on
Telecommunication
Industry
September 2014
Kathmandu, Nepal
Issued by

Preface
In modern days, we have witnessed the phenomenon of global economy getting transformed into a
knowledge based economy, with Telecommunications Industry as the principal driver of economic and
social development. The knowledge economy relies to a high degree on human resources and intellect,
as well as knowledge. With this philosophy in mind, the Institute of Chartered Accountants of Nepal
(ICAN) wanted to develop a guiding material on Telecommunications Industry in Nepal which may
enlighten the knowledge of our members and other concerned professionals.
As Telecommunications Industry is a dynamic and vibrant industry, our members need to be updated
with the recent status and developments in telecommunications sector both at local and global level.
The Institute of Chartered Accountants of Nepal (ICAN) has put its best efforts to fulfill the
requirements of knowledge of the telecommunications industry professionals. This technical guide
contains extensive material on all significant aspects of this industry such as telecom technology trends,
telecom network architecture, regulatory framework, accounting, financial reporting, taxation matters,
infrastructure sharing, fraud and revenue assurance, products and services etc. The technical guide
mentions in length on major KPIs related to telecommunications industry and also it discusses the
strategies adopted by some of the leading telecommunications service providers across the globe.
I am extremely grateful to CA. Achyut Raj Joshi, CA. Surya Bhakta Pokharel, CA. Bishnu Prasad
Bhandari and Er. Pratibha Vaidya for giving their valuable time to prepare and review this technical
guide. I am obliged to the ICAN Council for providing opportunity for entrusting this task to publish
Technical Guide on Telecommunication Industry.
I would also like to appreciate the efforts of the Secretariat of the Committee on Members in Industry
in giving the final shape to the technical guide.
I am certain that the readers, especially the members of the Institute, professionals in telecom industry,
other stakeholders would find this technical guide immensely helpful.
Date: June, 2015 CA. Suresh Devkota, FCA
Place: Lalitpur, Nepal Chairman, Committee on Members in
Industry
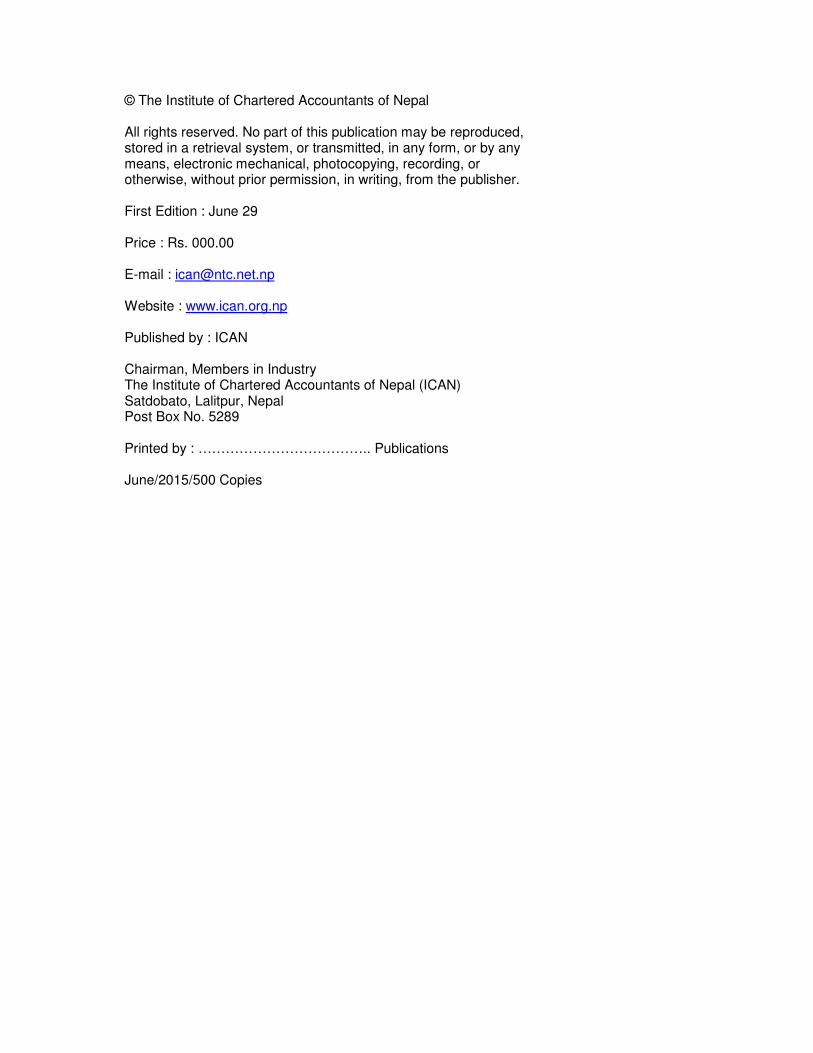
© The Institute of Chartered Accountants of Nepal All rights reserved. No part of this publication may be reproduced, stored in a retrieval system, or transmitted, in any form, or by any means, electronic mechanical, photocopying, recording, or otherwise, without prior permission, in writing, from the publisher. First Edition : June 29 Price : Rs. 000.00 E-mail : [email protected] Website : www.ican.org.np Published by : ICAN Chairman, Members in Industry The Institute of Chartered Accountants of Nepal (ICAN) Satdobato, Lalitpur, Nepal Post Box No. 5289 Printed by : ……………………………….. Publications June/2015/500 Copies
Contents
Chapters Topics Page Number
Forward
Preface
Chapter 1
Telecommunication Technology Trends
Chapter 2
Telecommunication Network Architecture
Chapter 3
Regulatory Framework
Chapter 4
Taxation
Chapter 5
Accounting and Financial Reporting
Chapter 6
Fraud and Revenue Assurance
Chapter 7
Infrastructure Sharing
Chapter 8
Major Key Performance Indicators (KPIs) of Telecommunication Industry
Chapter 9
Major Services Provided by Telecommunication Operators
Chapter 10
Illustrative Lists on Business Strategies of some Telecommunication Operators
Abbreviations
Bibliography
Chapter 1 Telecommunication Technology Trends
Communication is the exchange of thoughts, messages, or information; by speech, visuals, signals, writing, etc. If the communication process happens over significant distances, then it is called telecommunication.
In the past, telecommunication was either done with visual signals or audio signals such as fire, flags, horns, whistles, etc. After the beginning of the 19th century, new ways of telecommunication started after the introduction of electrical devices. Electrical telegraphs were the first form of electrical telecommunication. Samuel Morse invented the telegraph system of dots and dashes for letters of the alphabet which allowed complex messages to be sent and received. Then Alexander Graham Bell invented the Telephone to transmit speech electrically. Later, Tele-printers were used to communicate printed messages. Thereafter, the advent of satellites, wireless communications, fiber-optics, and the Internet opened the doors to more efficient ways of telecommunication.
Milestones in Telecommunication History
• 1837 Samuel Morse patents the telegraph • 1876 Alexander Graham Bell patents the telephone • 1878 the first switchboard starts operating • 1892 the first automatic phone switch • 1895 Guiglielmo Marconi transmits a radio telegram over a short distance • 1954
o Direct dialling of long distance calls was introduced. o First television broadcasting trials in Norway.
• 1962 Telstar the first active, direct relay commercial communications satellite was launched
• 1966 the mobile phone service introduced in Norway • 1969 the US DoD ARPA project ARPANET starts trials • 1970 the optical fibre was invented by Corning Glass Works • 1975 the first computer controlled phone switch in the Norwegian network • 1983 ARPANET became the Internet • 1986 the first digital phone switch in the Norwegian network. • 1989 Tim Berners-Lee proposed a project that was named World-Wide Web
The telephone network was originally designed to carry human voice and not digital information such as data, music, or video. It supported telephony (voice communications), but not telecommunications (data, image, and video). Telephony is traditional voice communications. As the use of communications networks changed, the telephone industry incorporated more than just voice communications; they began carrying data, and video. Further, they moved away from the traditional wired approach to delivering services to some new wireless delivery systems. To better fit the new business model, the telephone industry used telecommunications to describe their business. Today, the telephone industry uses telecommunications to describe the transmission of voice, video, image, and data across today’s telephone infrastructure.
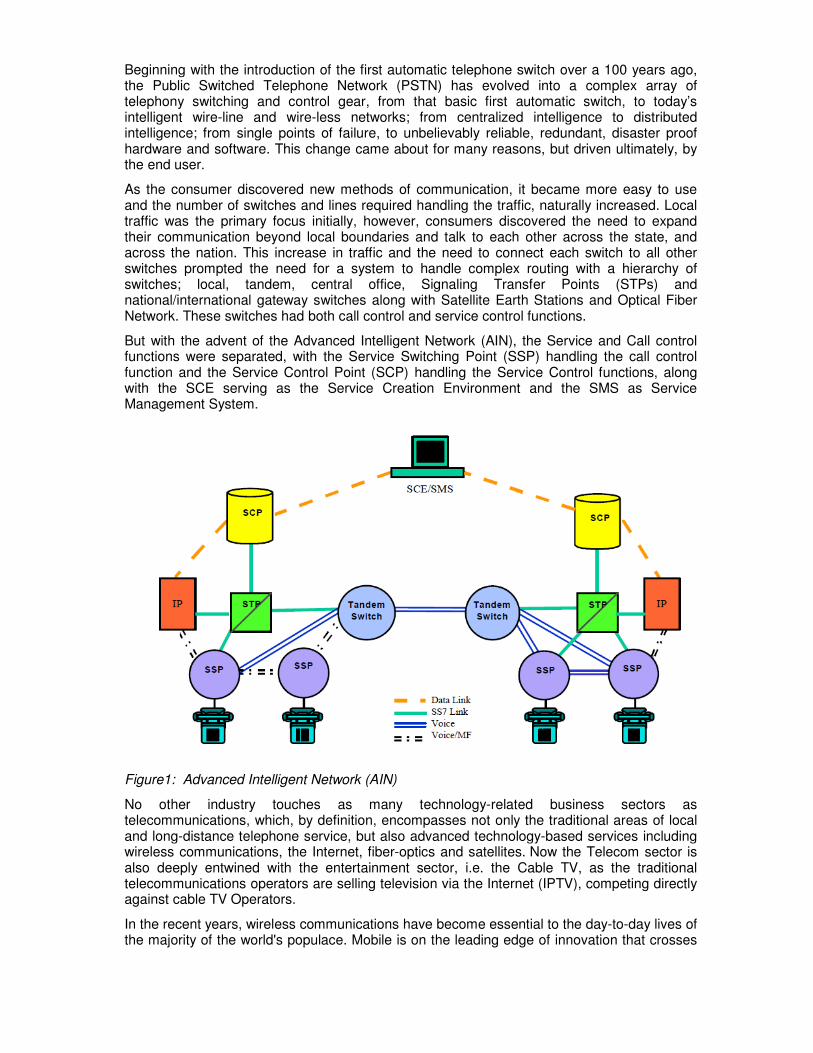
Beginning with the introduction of the first automatic telephone switch over a 100 years ago, the Public Switched Telephone Network (PSTN) has evolved into a complex array of telephony switching and control gear, from that basic first automatic switch, to today’s intelligent wire-line and wire-less networks; from centralized intelligence to distributed intelligence; from single points of failure, to unbelievably reliable, redundant, disaster proof hardware and software. This change came about for many reasons, but driven ultimately, by the end user.
As the consumer discovered new methods of communication, it became more easy to use and the number of switches and lines required handling the traffic, naturally increased. Local traffic was the primary focus initially, however, consumers discovered the need to expand their communication beyond local boundaries and talk to each other across the state, and across the nation. This increase in traffic and the need to connect each switch to all other switches prompted the need for a system to handle complex routing with a hierarchy of switches; local, tandem, central office, Signaling Transfer Points (STPs) and national/international gateway switches along with Satellite Earth Stations and Optical Fiber Network. These switches had both call control and service control functions.
But with the advent of the Advanced Intelligent Network (AIN), the Service and Call control functions were separated, with the Service Switching Point (SSP) handling the call control function and the Service Control Point (SCP) handling the Service Control functions, along with the SCE serving as the Service Creation Environment and the SMS as Service Management System.
Figure1: Advanced Intelligent Network (AIN)
No other industry touches as many technology-related business sectors as telecommunications, which, by definition, encompasses not only the traditional areas of local and long-distance telephone service, but also advanced technology-based services including wireless communications, the Internet, fiber-optics and satellites. Now the Telecom sector is also deeply entwined with the entertainment sector, i.e. the Cable TV, as the traditional telecommunications operators are selling television via the Internet (IPTV), competing directly against cable TV Operators.
In the recent years, wireless communications have become essential to the day-to-day lives of the majority of the world's populace. Mobile is on the leading edge of innovation that crosses

virtually every industry and sector and is a key engine of economic growth in every country, globally. The ongoing expansion of the mobile ecosystem, coupled with demand for high-bandwidth applications and services such as video and gaming, is keeping pressure on the telecom industry to increase the availability and quality of broadband connectivity. The big challenge thus lies in catering to the growing needs of the consumers for connectivity and speed. Therefore, the Telecom Operators are pursuing technological advancements to handle demand, including offloading some mobile bandwidth needs to Wi-Fi, which is proving an effective complement to mobile networks. At the same time, long-term spectrum availability, spectrum efficiency, small cells and continued backhaul improvements are the key focus points to assure continued mobile broadband momentum. Improved cell phone service has prompted tens of millions of consumers to cancel their landlines altogether, eating into traditional revenue streams while wireless access to the Internet threatens traditional DSL broadband suppliers. Meanwhile, Landline Telecom Service Providers are laying fiber-optic cable directly to the neighborhood, and even into the home and office, in order to retain customers with promises of ultra-high-speed Internet connections and enhanced entertainment offerings online. Hence, Landline Telecom Service Providers are focusing on bundled service packages (combining wireless accounts, very high-speed Internet access and entertainment such as video on demand and TV via IP, in addition to VOIP or landlines). The future of Fixed Landline Telephone Operators lies in the development of innovative new value-added services that are accessed online. Consumers are responding well to bundled services that monitor home security or adjust home energy usage or services that monitor the movements and needs of elderly family members at home via landline services. The right value-added services, controlled via smartphones, remote wireless sensors and/or the Internet seems to be the potential to build new revenues and stop customer turnover for Operators now. Mobile devices are recovering the slow demand of PCs and TVs. Usage of mobile application is accelerating along with increased consumption of smartphones Smartphone demand will continuously grow along with decreasing price. As advertising expenditure moves away from TV towards mobile, advertisers’ fortunes is tied more closely to the technology platforms that control internet TV and mobile advertising. Over the recent years, the telecom industry has experienced a shift away from its traditional product (i.e. voice telephony) toward high-margin data services. While this shift is much more prominent in the developed world, data services are expected to increasingly cement themselves as the telecom industry's main product moving forward. The telecom industry is increasingly shaped by the growing influence of the Internet, its OTT players, and the continued expansion of the cloud, which alters the way services are delivered. Consumers and enterprises are also changing, becoming more mobile and increasingly connected, as we all use an expanding range of technologies to enhance our working and personal lives. The increasing availability of sophisticated connected devices is changing every aspect of daily life; moving services and media online, changing the way we access and utilize them. Customer focus and cost reductions remain the core areas for Telecom service providers. Programs to improve customer experience remain top of the Telecom Sector investment priorities. Moreover, the Telcos are concentrating on programs that encompass network performance and IT domains, as well as customer service and marketing and sales activities, within the customer-facing business units. As the telecom ecosystem expands, beyond the unending need for broadband access to content and speed, new business models are emerging among both traditional and new
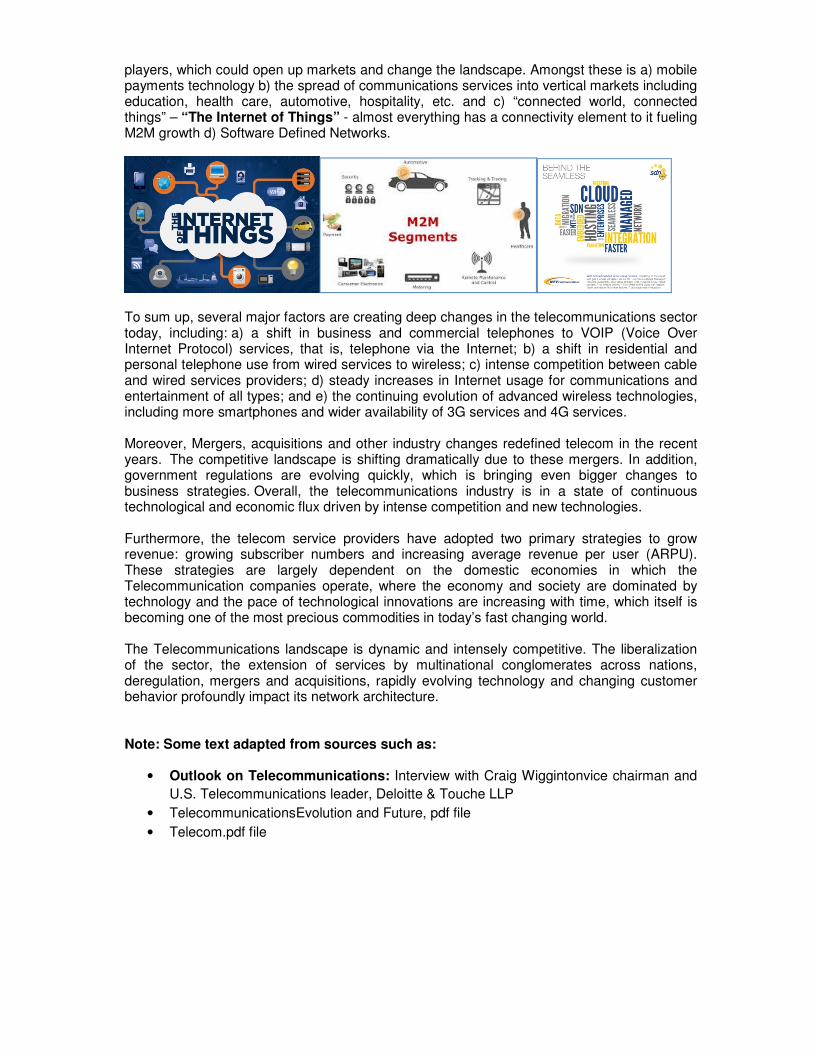
players, which could open up markets and change the landscape. Amongst these is a) mobile payments technology b) the spread of communications services into vertical markets including education, health care, automotive, hospitality, etc. and c) “connected world, connected things” – “The Internet of Things” - almost everything has a connectivity element to it fueling M2M growth d) Software Defined Networks.
To sum up, several major factors are creating deep changes in the telecommunications sector today, including: a) a shift in business and commercial telephones to VOIP (Voice Over Internet Protocol) services, that is, telephone via the Internet; b) a shift in residential and personal telephone use from wired services to wireless; c) intense competition between cable and wired services providers; d) steady increases in Internet usage for communications and entertainment of all types; and e) the continuing evolution of advanced wireless technologies, including more smartphones and wider availability of 3G services and 4G services. Moreover, Mergers, acquisitions and other industry changes redefined telecom in the recent years. The competitive landscape is shifting dramatically due to these mergers. In addition, government regulations are evolving quickly, which is bringing even bigger changes to business strategies. Overall, the telecommunications industry is in a state of continuous technological and economic flux driven by intense competition and new technologies. Furthermore, the telecom service providers have adopted two primary strategies to grow revenue: growing subscriber numbers and increasing average revenue per user (ARPU). These strategies are largely dependent on the domestic economies in which the Telecommunication companies operate, where the economy and society are dominated by technology and the pace of technological innovations are increasing with time, which itself is becoming one of the most precious commodities in today’s fast changing world. The Telecommunications landscape is dynamic and intensely competitive. The liberalization of the sector, the extension of services by multinational conglomerates across nations, deregulation, mergers and acquisitions, rapidly evolving technology and changing customer behavior profoundly impact its network architecture. Note: Some text adapted from sources such as:
• Outlook on Telecommunications: Interview with Craig Wiggintonvice chairman and
U.S. Telecommunications leader, Deloitte & Touche LLP
• TelecommunicationsEvolution and Future, pdf file
• Telecom.pdf file
Chapter 2 Telecommunication Network Architecture Telecommunication is the science of communicating over a long distance using telephone or radio technology. This involves using microelectronic (small semiconductor chip), computer and PC technologies to transmit, receive, and switch voice, data, and video communications over different transmission media, including copper, fiber and electromagnetic transmissions. The telephone network was originally designed to carry human voice and not digital information such as data, music, or video. It supported telephony (voice communications), but not telecommunications (data, image, and video). In its most fundamental form, a telecommunication system includes a transmitter to take information and convert it to a signal, a transmission medium to carry the signal and a receiver to take the signal and convert it back into usable information. This applies to any communication system, whether it uses computers or not. Most modern day telecommunications systems are best described in terms of a network. A telecommunication network is a complete technical system for transmission of signals over a distance. This includes the basic elements listed above but also the infrastructure and controls needed to support the system. There are six basic components to a telecommunications network.
1) Input and output devices, also referred to as 'terminals' These provide the starting and stopping points of all communication. A telephone is an example of a terminal. In computer networks, these devices are commonly referred to as 'nodes' and consist of computer and peripheral devices.
2) Telecommunication channels Thesetransmit and receive data. This includes various types of cables (copper, Coaxial, Fiber) and wireless radio frequencies.
3) Telecommunication processors These provide a number of control and support functions for example, in many systems; data needs to be converted from analog to digital and back.
4) Control software These are responsible for controlling the functionality and activities of the network
5) Messages They represent the actual data that is being transmitted. In the case of a telephone network, the messages would consist of audio as well as data or video.
6) Protocols They specify how each type of telecommunication systems handles the messages. For example, 3G is the protocol for mobile phone communications and TCP/IP is a protocol for communications over the Internet.
There are different kinds of telecommunication networks that may have different structure and may utilize different technologies such as, PSTN network, mobile network, and data network. The main components of different kinds of telecommunication networks are basically the same, which include the following;
• Transmission equipment • Switching equipment • Terminal/Access equipment • Support systems
The purpose of every kind of telecommunication network is to transmit signals in the network. Transmission of signals is done through different kinds of transmission media. Analog systems, in which electric signals are transmitted through wires that varies in a similar way to the variation of the air pressure due to sound, are old and of limited use. But digital transmission system in which only binary signals, i.e. 0s and 1s, are transmitted, can be efficiently used for both telephony and data networks. In a network, transmission lines are connected to nodes that usually are known as switches. Switches are equipment which enable us to connect two or more communication channels as needed. We differentiate between two different categories of switching:
• Circuit switching used in the telephone network, where is there is an end-to-end connection between two subscribers or terminals and resources are allocated for the duration of the call or transmission in the network
• Packet switching used in computer networks, where data is divided into smaller units that are transmitted only when there is data to transmit and no resources are allocated for an end-to-end connection.
We usually differentiate between two types of telephone switches in the public network
• The switches that connect to subscribers (C5 Type - Local Switch or Central Switch) • The switches that only connect to other switches in the network (C4 Type - Tandem
Switch) In the telephony network the access network is mainly the local loops – i.e., the twisted pair copper wires running from the subscriber to a switch or a remote subscriber unit. In modern telephone networks, there are alternative technologies for building the access network, like using the cable TV network, radio access or Optical Fiber. The local loops may also be used as an access network for computer networks (eg ADSL). The access network is sometimes called the last mile, i.e. the last part of the network infrastructure towards the users. Support systems are essential for providing a telecommunication service which is differentiated into two kinds of support systems:
• Administrative support systems aimed at managing customer information and billing
purposes • Technical support systems aimed at operations and maintenance of the network and
all network components A modern telecommunications network infrastructure of a Telecom Operator consists of a set of networks, each performing a particular function towards the provision of the service to the customer. These networks include the following:
� Access Network – Last Mile � Core Network - switching and signaling network � Transport Network - transmission aggregation and backhaul network � Application Network - Intelligent Network, Application Servers � Management network – EMS (Element Management System)/NOC (Network
Operation Center), OSS (Operating Support System) and BSS (Business Support system)
In both the transport network and access network segments, various technologies of wired (e.g., copper, coax, and fiber) and wireless (e.g., mobile, satellite and microwave) may be implemented and maintained. With the evolution towards IP-based network, the circuit switched network is migrating towards a new architecture called Next Generation Network (NGN) which emulates the behavior of circuit switching. With the advent of broadband access networks, the core network evolves towards IP Multimedia Subsystem (IMS) which provides IP-based multimedia services.
Public Switched Telephone Network (PSTN) PSTN is the fixed voice network. It consists of the transmission, switching, signaling and intelligent networks. The transmission network enables carrying all kinds of traffic (voice, video, data). It consists of nodes called multiplexers and links among multiplexers. The goal of the multiplexer is to multiplex/de-multiplex traffic onto/from the link. There exist three multiplexing technologies: PDH, SDH and DWDM. The link technology is generally optic fiber but may also be coax, radio, etc. A transmission network generally consists of hundreds of multiplexers and tens of thousands of kilometers of optic fiber. The switching network enables switching the traffic from the sender to the appropriate destination. A switching network consists of switches. All switches rely on the transmission network which provides digital trunks. A switch receives traffic from the transmission network at input ports, applies the switching function which forwards the traffic to output port. Then, the switch relies on the transmission network to send the traffic to an adjacent switch. The voice network is using the circuit switching technology which provides voice services. A switching network operates in a connection oriented mode. That means that prior to enabling users to exchanging their traffic; there is a need of reserving resources on the path between the sender/caller and the receiver/callee. To reserve resources, all switches on the path exchange signaling information. Signaling information is data. In the case of circuit switching, signaling data is carried over a separate network, i.e., a signaling network called Signaling System 7 (SS7). The intelligent network is used in the voice network for the provisioning of services such as Toll-free, premium rate, virtual private network, prepaid card calling, etc. It consists of a set of application servers containing service logic and service data. The access network is the network which enables attaching the user equipment to the switching/transmission network. The subscriber has a subscriber line, which may be an analog line, an ISDN line, a leased line, an ADSL line, etc., to connect to the PSTN. EMSs (Element Management Systems) are sold with the equipment by the telecom vendor. EMSs enable operators to manage their equipment. The OSS (Operation Support System) is the management of the network and the services. The BSS (Business Support System) is the interface to and the management of the customer.
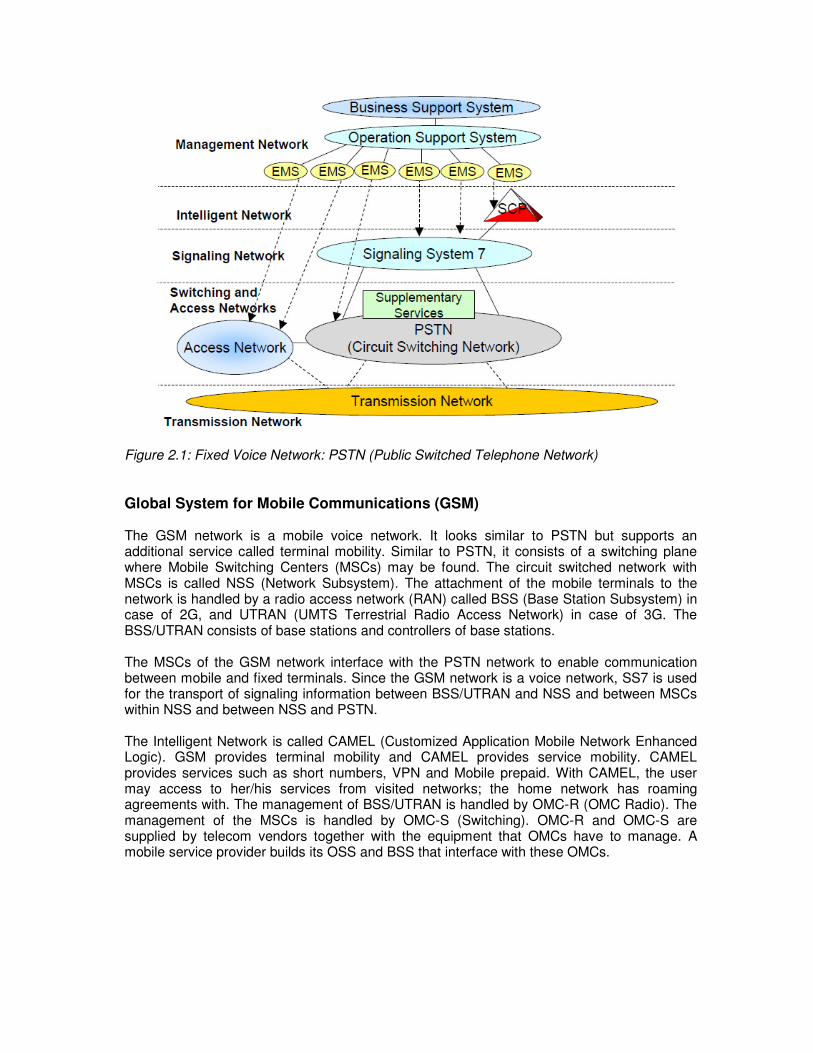
Figure 2.1: Fixed Voice Network: PSTN (Public Switched Telephone Network)
Global System for Mobile Communications (GSM) The GSM network is a mobile voice network. It looks similar to PSTN but supports an additional service called terminal mobility. Similar to PSTN, it consists of a switching plane where Mobile Switching Centers (MSCs) may be found. The circuit switched network with MSCs is called NSS (Network Subsystem). The attachment of the mobile terminals to the network is handled by a radio access network (RAN) called BSS (Base Station Subsystem) in case of 2G, and UTRAN (UMTS Terrestrial Radio Access Network) in case of 3G. The BSS/UTRAN consists of base stations and controllers of base stations. The MSCs of the GSM network interface with the PSTN network to enable communication between mobile and fixed terminals. Since the GSM network is a voice network, SS7 is used for the transport of signaling information between BSS/UTRAN and NSS and between MSCs within NSS and between NSS and PSTN. The Intelligent Network is called CAMEL (Customized Application Mobile Network Enhanced Logic). GSM provides terminal mobility and CAMEL provides service mobility. CAMEL provides services such as short numbers, VPN and Mobile prepaid. With CAMEL, the user may access to her/his services from visited networks; the home network has roaming agreements with. The management of BSS/UTRAN is handled by OMC-R (OMC Radio). The management of the MSCs is handled by OMC-S (Switching). OMC-R and OMC-S are supplied by telecom vendors together with the equipment that OMCs have to manage. A mobile service provider builds its OSS and BSS that interface with these OMCs.
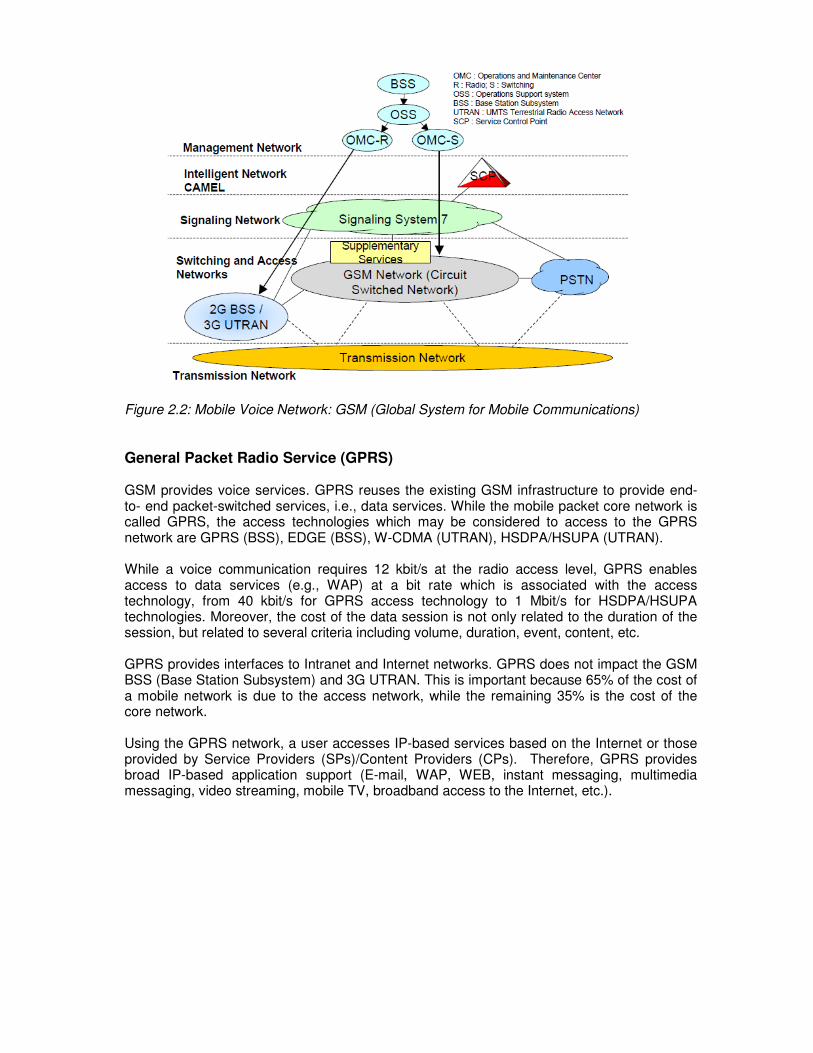
Figure 2.2: Mobile Voice Network: GSM (Global System for Mobile Communications)
General Packet Radio Service (GPRS) GSM provides voice services. GPRS reuses the existing GSM infrastructure to provide end-to- end packet-switched services, i.e., data services. While the mobile packet core network is called GPRS, the access technologies which may be considered to access to the GPRS network are GPRS (BSS), EDGE (BSS), W-CDMA (UTRAN), HSDPA/HSUPA (UTRAN). While a voice communication requires 12 kbit/s at the radio access level, GPRS enables access to data services (e.g., WAP) at a bit rate which is associated with the access technology, from 40 kbit/s for GPRS access technology to 1 Mbit/s for HSDPA/HSUPA technologies. Moreover, the cost of the data session is not only related to the duration of the session, but related to several criteria including volume, duration, event, content, etc. GPRS provides interfaces to Intranet and Internet networks. GPRS does not impact the GSM BSS (Base Station Subsystem) and 3G UTRAN. This is important because 65% of the cost of a mobile network is due to the access network, while the remaining 35% is the cost of the core network. Using the GPRS network, a user accesses IP-based services based on the Internet or those provided by Service Providers (SPs)/Content Providers (CPs). Therefore, GPRS provides broad IP-based application support (E-mail, WAP, WEB, instant messaging, multimedia messaging, video streaming, mobile TV, broadband access to the Internet, etc.).
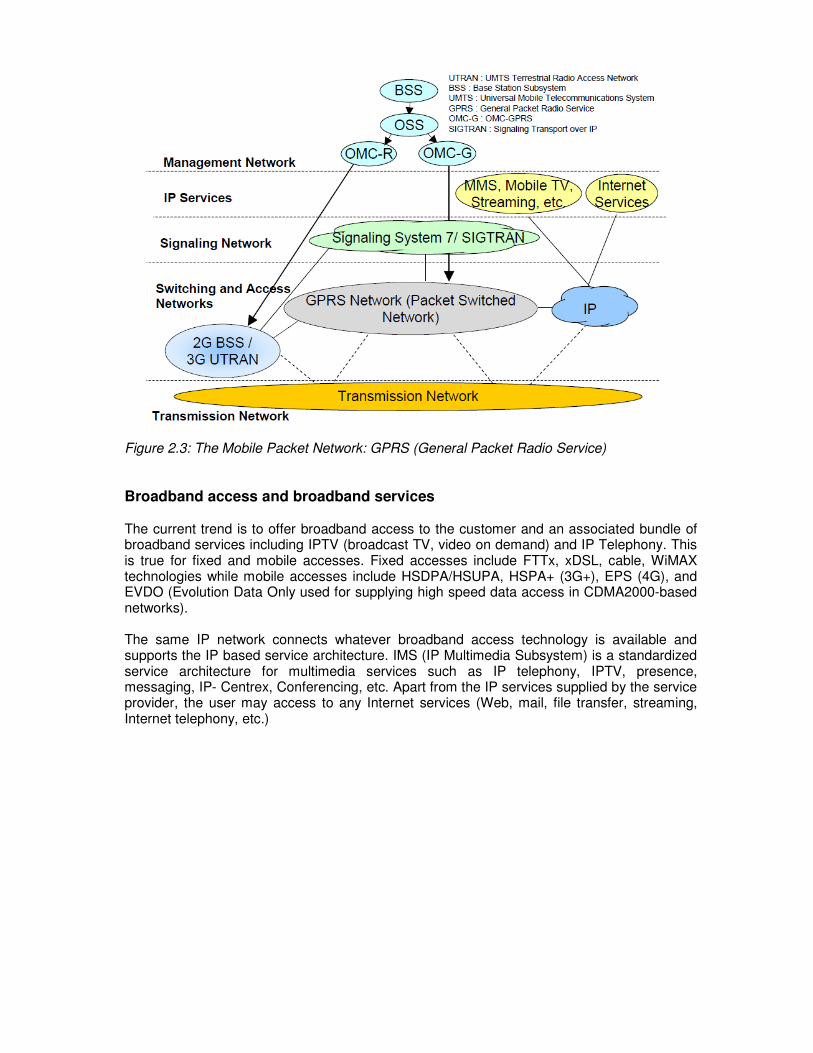
Figure 2.3: The Mobile Packet Network: GPRS (General Packet Radio Service)
Broadband access and broadband services The current trend is to offer broadband access to the customer and an associated bundle of broadband services including IPTV (broadcast TV, video on demand) and IP Telephony. This is true for fixed and mobile accesses. Fixed accesses include FTTx, xDSL, cable, WiMAX technologies while mobile accesses include HSDPA/HSUPA, HSPA+ (3G+), EPS (4G), and EVDO (Evolution Data Only used for supplying high speed data access in CDMA2000-based networks). The same IP network connects whatever broadband access technology is available and supports the IP based service architecture. IMS (IP Multimedia Subsystem) is a standardized service architecture for multimedia services such as IP telephony, IPTV, presence, messaging, IP- Centrex, Conferencing, etc. Apart from the IP services supplied by the service provider, the user may access to any Internet services (Web, mail, file transfer, streaming, Internet telephony, etc.)
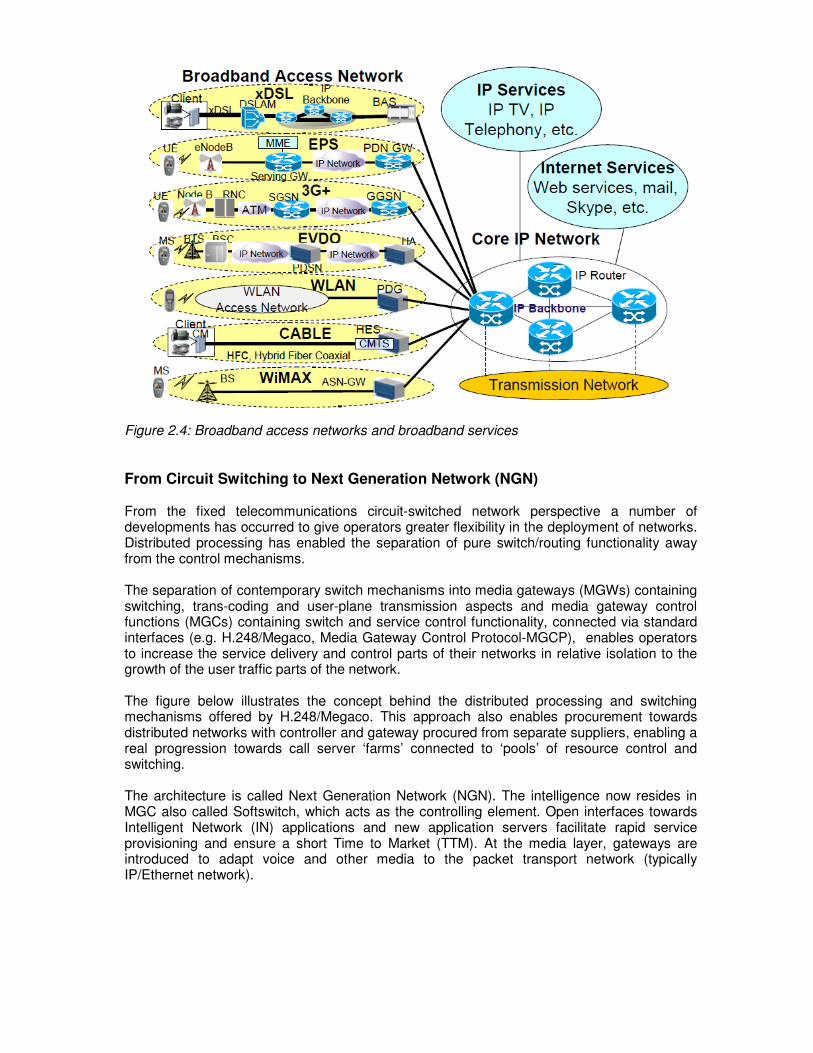
Figure 2.4: Broadband access networks and broadband services
From Circuit Switching to Next Generation Network (NGN) From the fixed telecommunications circuit-switched network perspective a number of developments has occurred to give operators greater flexibility in the deployment of networks. Distributed processing has enabled the separation of pure switch/routing functionality away from the control mechanisms. The separation of contemporary switch mechanisms into media gateways (MGWs) containing switching, trans-coding and user-plane transmission aspects and media gateway control functions (MGCs) containing switch and service control functionality, connected via standard interfaces (e.g. H.248/Megaco, Media Gateway Control Protocol-MGCP), enables operators to increase the service delivery and control parts of their networks in relative isolation to the growth of the user traffic parts of the network. The figure below illustrates the concept behind the distributed processing and switching mechanisms offered by H.248/Megaco. This approach also enables procurement towards distributed networks with controller and gateway procured from separate suppliers, enabling a real progression towards call server ‘farms’ connected to ‘pools’ of resource control and switching. The architecture is called Next Generation Network (NGN). The intelligence now resides in MGC also called Softswitch, which acts as the controlling element. Open interfaces towards Intelligent Network (IN) applications and new application servers facilitate rapid service provisioning and ensure a short Time to Market (TTM). At the media layer, gateways are introduced to adapt voice and other media to the packet transport network (typically IP/Ethernet network).
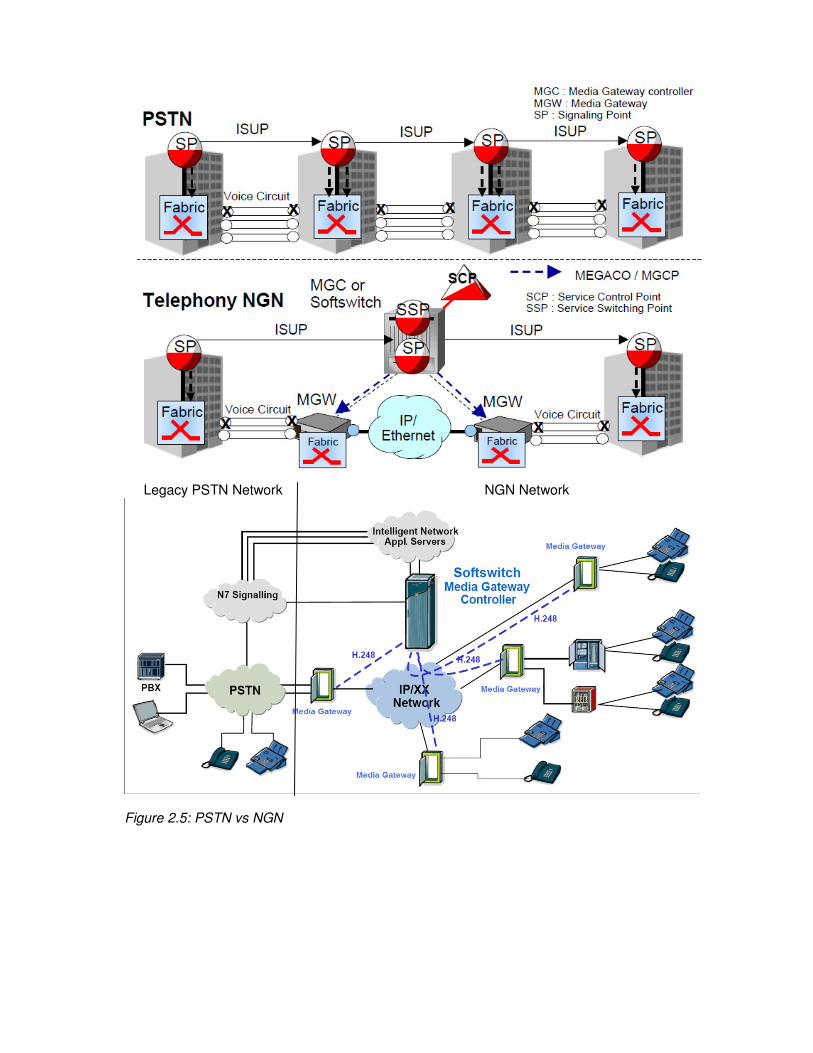
Legacy PSTN Network NGN Network
Figure 2.5: PSTN vs NGN
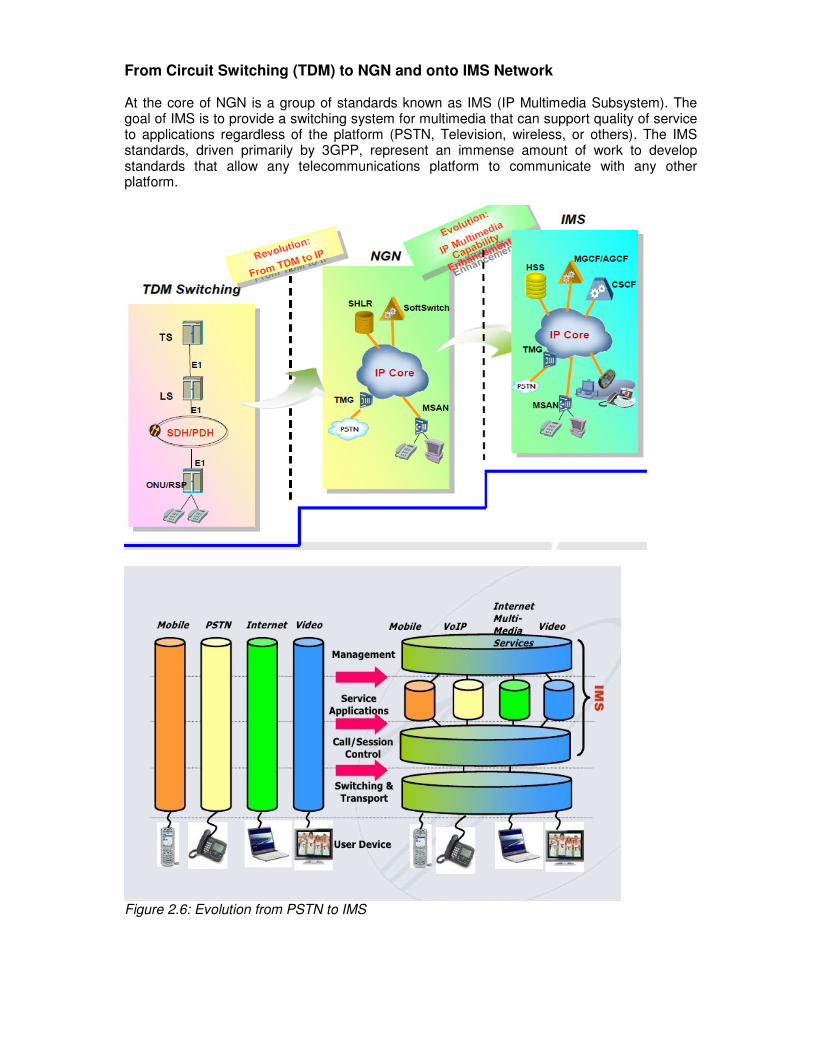
From Circuit Switching (TDM) to NGN and onto IMS Network At the core of NGN is a group of standards known as IMS (IP Multimedia Subsystem). The goal of IMS is to provide a switching system for multimedia that can support quality of service to applications regardless of the platform (PSTN, Television, wireless, or others). The IMS standards, driven primarily by 3GPP, represent an immense amount of work to develop standards that allow any telecommunications platform to communicate with any other platform.
Figure 2.6: Evolution from PSTN to IMS
In a world in which there is significant uncertainty about whether GSM, WCDMA, WiMax, Wifi will become the underlying communications technology, IMS holds the promise of making the underlying communications technology irrelevant to users. IMS allow users to roam between different technologies without a disconnection. Implementing IMS is about supporting a single architecture for all services, rather than multiple systems for multiple services. The IMS is designed to support all media, and all services, using one common architecture and one common signaling method. This simplifies all of the other functions needed by an operator to support its network and its services. NGN Vs IMS Network
• Both conform to basic ideas of NGN, that is, layered network architecture and separated functions
• Both are Access Agnostic • Both realize separation of control and bearer layers • IMS further realizes separation of control and service, and realizes unified control of
fixed network and mobile network, so that IMS is a higher level in the evolution of traditional network.
From IMS to Long Term Evolution (LTE) Data services’ rapid growth places stress on 3G networks, thereby driving the emergence of LTE as the means to deliver greater quantities of mobile data affordably. LTE enhances the Universal Mobile Telecommunications System (UMTS) architecture, providing both improved bandwidth and an improved Quality of Service (QoS) for these data-intensive services. LTE is based on an Evolved UMTS Terrestrial Radio Access Network (eUTRAN) and an Evolved Packet Core (EPC), which incorporate new modulation techniques and a flat, all-IP architecture for the efficient delivery of mobile data services. All traffic in an LTE system is carried as IP, providing seamless, high-speed connections between a handset or user equipment (UE), and various packet data networks, such as the Internet, IMS, and Content Delivery Networks (CDNs). The various IP bearers in the LTE system are assigned specific QoS Class Identifiers (QCIs) that correspond to specific treatment levels for connection types, priority, delay budgets and packet error loss rates. A single handset or UE may have multiple IP bearers serving it, where individual bearers serve conversational voice, gaming sessions, streaming video, e-mail or messaging. IMS best enables operators to create voice services that include partnering with application and content providers, realize the benefits of LTE’s all-IP network, and preserve global roaming and interoperability that we have achieved in today’s 2G/3G networks. Because voice and other communications services are under IMS control, operators can construct competitive service, such as blending voice with social networking sites.
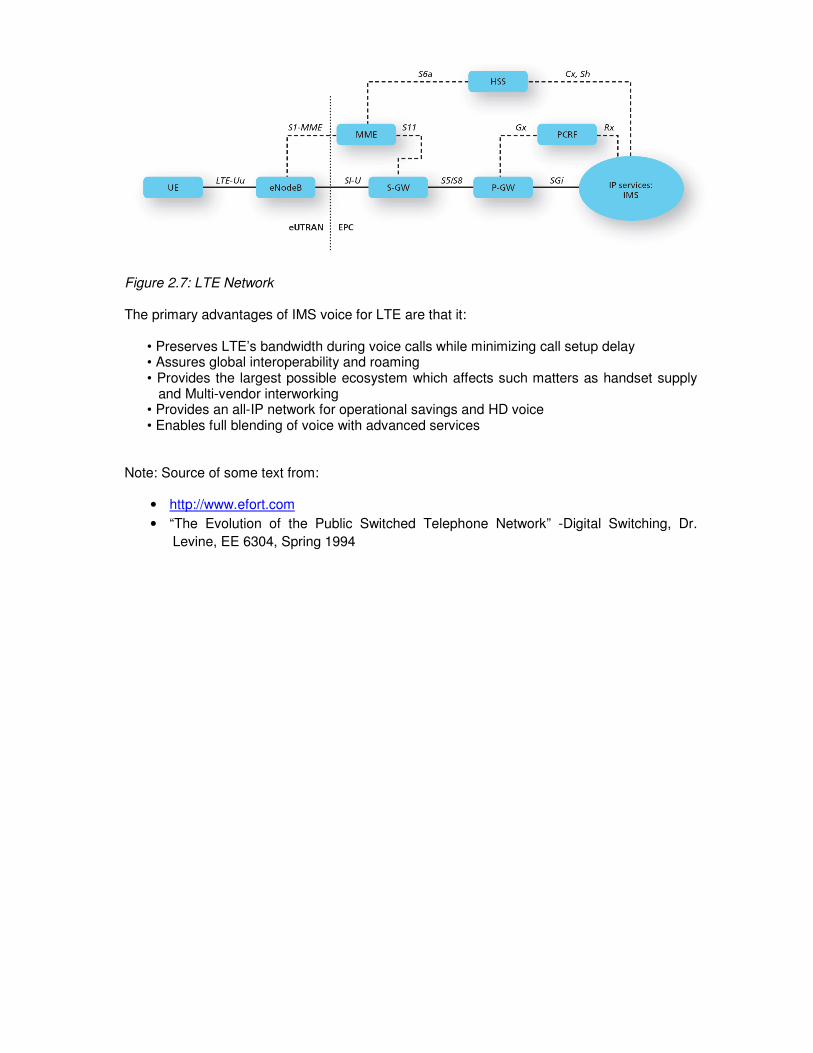
Figure 2.7: LTE Network The primary advantages of IMS voice for LTE are that it:
• Preserves LTE’s bandwidth during voice calls while minimizing call setup delay • Assures global interoperability and roaming • Provides the largest possible ecosystem which affects such matters as handset supply
and Multi-vendor interworking • Provides an all-IP network for operational savings and HD voice • Enables full blending of voice with advanced services
Note: Source of some text from:
• http://www.efort.com
• “The Evolution of the Public Switched Telephone Network” -Digital Switching, Dr.
Levine, EE 6304, Spring 1994
Chapter 3 Regulatory Framework
Telecommunication Industry in Nepal is regulated by the Ministry of Information and
Communications (MOIC) through Nepal Telecommunications Authority (NTA). Pursuant to the
provision made in the Telecommunications Act 2053 (1997), Nepal Telecommunications
Authority was established in March 1998.Telecommunications Act 2053 (1997),
Telecommunications Rules 2054 (1997), Radio Frequency (Assignment and Pricing) related
policy of the Telecommunications Service 2069 (2012) are the basic documents in Nepalese
Telecommunications Regulatory Framework.As prescribed in the Telecommunications Act
2053, NTA broadly has the following authority in terms of its functions, duties and power:
• Government advisor on telecom sector
• QoS benchmarking and regulation
• Licensing and Royalty
• Competition regulation
• Tariff regulation
• Spectrum management and new technology management
• Human Resource Development in telecommunication sector
• Consumer interest protection
• Universal service obligation (RTDF Management)
• Dispute settlement
• Law enforcement
However, the most important aspects in regulatory framework with respect to accounting
purposes are Licensing, Royalty, RTDF and Spectrum Frequency managementwhich are
detailed herewith:
3.1 Licensing
Section 21 of Telecommunications Act 2053 (1997) has made it mandatory for service
providers to operate the telecommunications service after obtaining a license.
3.1.1 Application for License
Section 23 of the act states that the person, who desires to operate the
telecommunications service and has prescribed capital, technical expertise and
professional experience shall have to submit an application to NTA, setting out the
prescribed particulars along with economic and technical study report as well as work
plan in connection with the Telecommunications service to be operated.
Rule 8 and schedule 3 of the Telecommunications Rules 2054 (1997) has mentioned
the following capital, Technical competency and professional efficiency pertaining to
telecommunications:
a) Net Worth to be required
i. Two Billion rupees for operation of local telephone service throughout Nepal,
ii. Five hundred million rupees for operation of cellular telephone service
throughout Nepal,
iii. Five hundred million rupees for operation of inland trunk service,
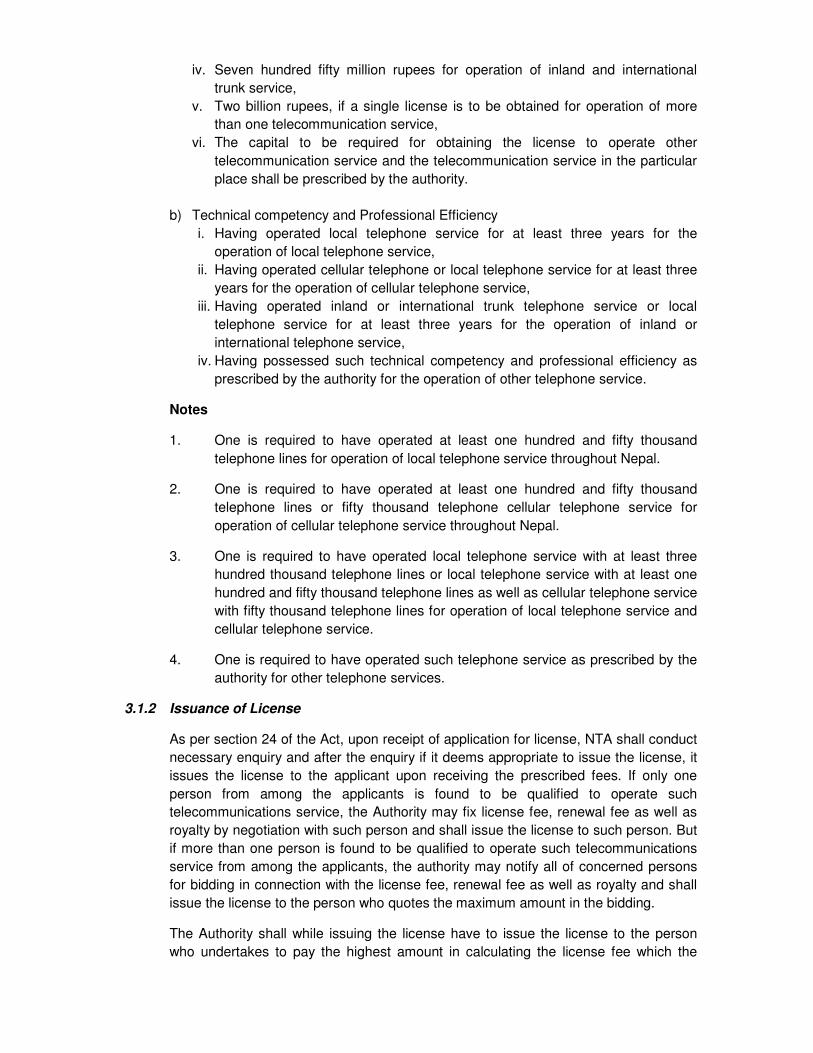
iv. Seven hundred fifty million rupees for operation of inland and international
trunk service,
v. Two billion rupees, if a single license is to be obtained for operation of more
than one telecommunication service,
vi. The capital to be required for obtaining the license to operate other
telecommunication service and the telecommunication service in the particular
place shall be prescribed by the authority.
b) Technical competency and Professional Efficiency
i. Having operated local telephone service for at least three years for the
operation of local telephone service,
ii. Having operated cellular telephone or local telephone service for at least three
years for the operation of cellular telephone service,
iii. Having operated inland or international trunk telephone service or local
telephone service for at least three years for the operation of inland or
international telephone service,
iv. Having possessed such technical competency and professional efficiency as
prescribed by the authority for the operation of other telephone service.
Notes
1. One is required to have operated at least one hundred and fifty thousand
telephone lines for operation of local telephone service throughout Nepal.
2. One is required to have operated at least one hundred and fifty thousand
telephone lines or fifty thousand telephone cellular telephone service for
operation of cellular telephone service throughout Nepal.
3. One is required to have operated local telephone service with at least three
hundred thousand telephone lines or local telephone service with at least one
hundred and fifty thousand telephone lines as well as cellular telephone service
with fifty thousand telephone lines for operation of local telephone service and
cellular telephone service.
4. One is required to have operated such telephone service as prescribed by the
authority for other telephone services.
3.1.2 Issuance of License
As per section 24 of the Act, upon receipt of application for license, NTA shall conduct
necessary enquiry and after the enquiry if it deems appropriate to issue the license, it
issues the license to the applicant upon receiving the prescribed fees. If only one
person from among the applicants is found to be qualified to operate such
telecommunications service, the Authority may fix license fee, renewal fee as well as
royalty by negotiation with such person and shall issue the license to such person. But
if more than one person is found to be qualified to operate such telecommunications
service from among the applicants, the authority may notify all of concerned persons
for bidding in connection with the license fee, renewal fee as well as royalty and shall
issue the license to the person who quotes the maximum amount in the bidding.
The Authority shall while issuing the license have to issue the license to the person
who undertakes to pay the highest amount in calculating the license fee which the

applicant undertakes to pay, the fee payable for the first renewal of the license and the
royalty undertaken to be paid during the period of the license.
3.1.3 Period of License and Renewal
As per section 25 of the Act, the period of license shall be of twenty five years at the
maximum, provided that the license shall not be issued for a period of more than ten
years at a time. A licensee desiring to have its license renewed shall have to make an
application to NTA for renewal three months prior to the expiry of the validity period of
the license after depositing the renewal fee. If the application is so made, the license
shall be renewed for a period of not more than five years at a time. If the license if not
renewed within the time limit, such license shall ipso facto be invalid.
3.1.4 Sale or Transfer of License
As per section 27 of the Act, in case a licensee desires to sell or transfer his license to
any other person, the licensee and the buyer or the transferee of the license shall have
to submit a joint application to the Authority stating the reasons thereof along with the
terms and conditions mutually agreed for the approval. Upon the receipt of an
application,NTA will enquire the details and if it deems appropriate to sell or transfer
the license to the person, the Authority shall grant approval for such sale or transfer.
As per Rule 14 of Telecommunications Rules, the Authority shall transfer the license
by way of sale or otherwise, issue approval to transfer the license by way of sale or
otherwise upon charging 5% of the license fees from the applicants.
3.1.5 Terms to be abided by the Licensee
As per Rule 15, the licensee shall have to abide by the following terms, in addition to
the terms set forth in the Act and the Rules:
a. To provide telecommunication service to the customers by using machine and
equipment on telecommunication of the quality standard specified by the
authority.
b. To operate telecommunication service in accordance with the minimum standard
specified by the authority from time to time.
c. Not to use the telecommunication machine and equipment installed by another
licensee without the consent of such licensee.
d. Not to distribute telecommunication lines through electric poles as far as possible
and even if the lines are to be so distributed, to distribute them by obtaining
approval of the concerned body and only in a manner that is safe from the
electricity.
e. To provide the telecommunication service in conformity with the agreement made
with the customer, while distributing the telecommunication service to the
customer.
f. To operate telecommunication service by using only the frequency specified in the
license for the telecommunication service in which frequency is used.
g. If the telecommunication service provided to the customer suffers disorder due to
any reason, to repair and maintain it free of cost in conformity with the standards
prescribed by the authority.
h. To publish materials on telecommunication, including the telephone directory for
the convenience and information of the customers.
i. To operate the telecommunication service in conformity with the minimum
standards prescribed by the International Telecommunication Union (ITU)
regarding the operation of the telecommunication service.
3.1.6 To be owned by Government of Nepal
As per section 33 of the Act, the land, building, plant, equipment and other structures
related to telecommunication service developed with more than fifty percent of its
investment by a foreign person or corporate body shall be under the ownership of
Government of Nepal after the expiry of the period of the license. The assets so
owned by the Government of Nepal may be purchased by the previous licensee upon
payment to Government of Nepal at a price fixed and after obtaining the license once
again, the telecommunication service may be operated. In case of the
telecommunication service operated with the investment of foreign person or corporate
body up to fifty person, the previous licensee may after the period of the license
operate the telecommunication service by obtaining the license once again.
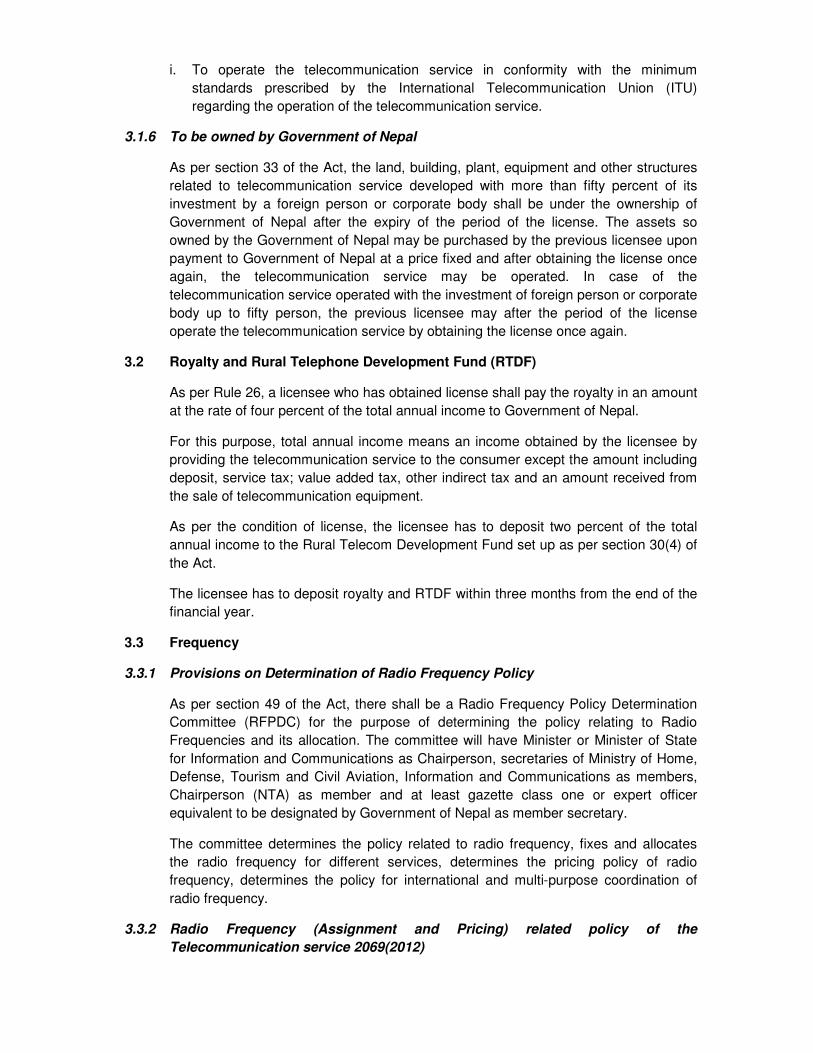
3.2 Royalty and Rural Telephone Development Fund (RTDF)
As per Rule 26, a licensee who has obtained license shall pay the royalty in an amount
at the rate of four percent of the total annual income to Government of Nepal.
For this purpose, total annual income means an income obtained by the licensee by
providing the telecommunication service to the consumer except the amount including
deposit, service tax; value added tax, other indirect tax and an amount received from
the sale of telecommunication equipment.
As per the condition of license, the licensee has to deposit two percent of the total
annual income to the Rural Telecom Development Fund set up as per section 30(4) of
the Act.
The licensee has to deposit royalty and RTDF within three months from the end of the
financial year.
3.3 Frequency
3.3.1 Provisions on Determination of Radio Frequency Policy
As per section 49 of the Act, there shall be a Radio Frequency Policy Determination
Committee (RFPDC) for the purpose of determining the policy relating to Radio
Frequencies and its allocation. The committee will have Minister or Minister of State
for Information and Communications as Chairperson, secretaries of Ministry of Home,
Defense, Tourism and Civil Aviation, Information and Communications as members,
Chairperson (NTA) as member and at least gazette class one or expert officer
equivalent to be designated by Government of Nepal as member secretary.
The committee determines the policy related to radio frequency, fixes and allocates
the radio frequency for different services, determines the pricing policy of radio
frequency, determines the policy for international and multi-purpose coordination of
radio frequency.
3.3.2 Radio Frequency (Assignment and Pricing) related policy of the
Telecommunication service 2069(2012)
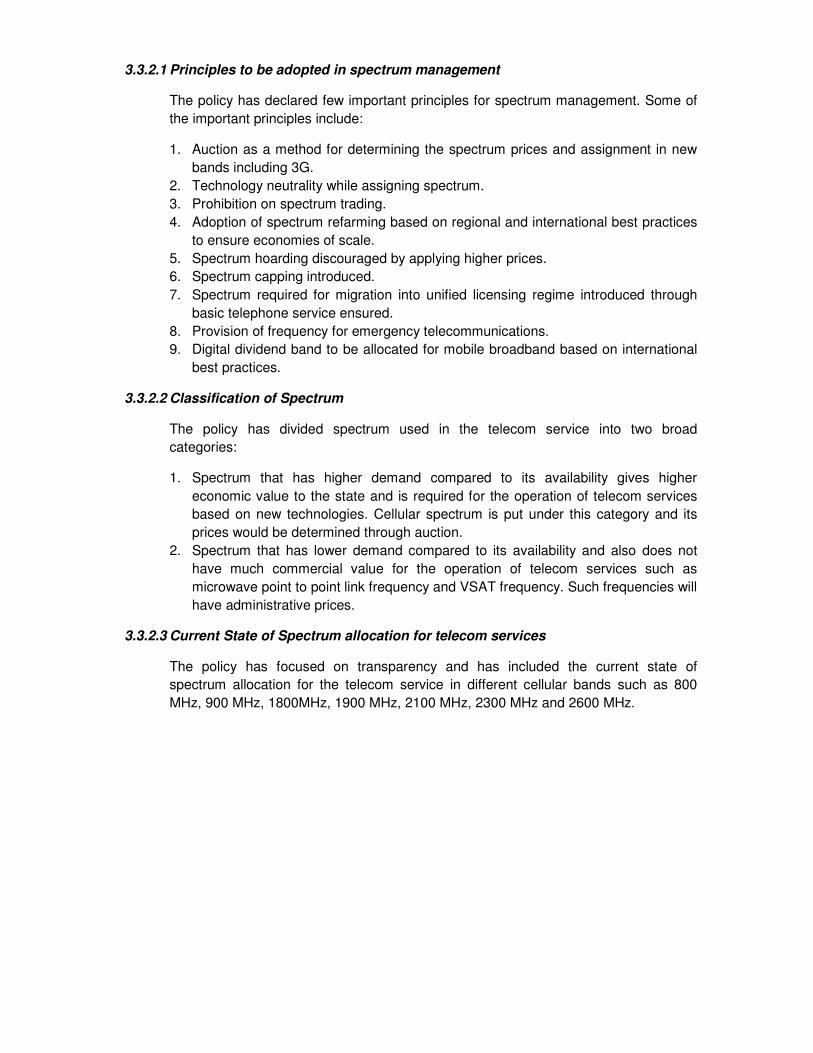
3.3.2.1 Principles to be adopted in spectrum management
The policy has declared few important principles for spectrum management. Some of
the important principles include:
1. Auction as a method for determining the spectrum prices and assignment in new
bands including 3G.
2. Technology neutrality while assigning spectrum.
3. Prohibition on spectrum trading.
4. Adoption of spectrum refarming based on regional and international best practices
to ensure economies of scale.
5. Spectrum hoarding discouraged by applying higher prices.
6. Spectrum capping introduced.
7. Spectrum required for migration into unified licensing regime introduced through
basic telephone service ensured.
8. Provision of frequency for emergency telecommunications.
9. Digital dividend band to be allocated for mobile broadband based on international
best practices.
3.3.2.2 Classification of Spectrum
The policy has divided spectrum used in the telecom service into two broad
categories:
1. Spectrum that has higher demand compared to its availability gives higher
economic value to the state and is required for the operation of telecom services
based on new technologies. Cellular spectrum is put under this category and its
prices would be determined through auction.
2. Spectrum that has lower demand compared to its availability and also does not
have much commercial value for the operation of telecom services such as
microwave point to point link frequency and VSAT frequency. Such frequencies will
have administrative prices.
3.3.2.3 Current State of Spectrum allocation for telecom services
The policy has focused on transparency and has included the current state of
spectrum allocation for the telecom service in different cellular bands such as 800
MHz, 900 MHz, 1800MHz, 1900 MHz, 2100 MHz, 2300 MHz and 2600 MHz.
3.3.2.4 Spectrum Refarming
Spectrum refarming is one of the principles adopted in the policy. It has categorically
declared that current 1900 MHz band used for CDMA will be freed to align with the
international best practices so that more spectrum will be available in the GSM 1800
and WCDMA 2100 MHz bands. Similarly CDMA 800 MHz and GSM 900 MHz bands
will be refarmed in such a way that E-GSM band now being occupied by CDMA 800
MHz band will be made available for GSM 900 MHz band.
The spectrum refarming process will ensure sufficient spectrum for the implementation
of unified licensing regime both in 2G and 3G bands and also in the IMT advanced
bands.
3.3.2.5 Spectrum Limits
The spectrum in 2G bands assigned for the operators are divided into 3 limiting
categories and that has direct implications for spectrum pricing. The limits are as
follows:
1. Minimum Spectrum
2. Additional Spectrum
3. Maximum Spectrum
Because of the differences in the radio propagation characteristics in different bands,
spectrum assigned in 1800 MHz band will be considered equivalent to 1.5 times that
assigned in the 800/900 MHz bands. For any cellular mobile operator or a unified
service license operator having basic telephone service license, 6 MHz in the GSM
900 MHz band or its equivalent 9 MHz in the GSM 1800 MHz band has been
considered the minimum spectrum. This figure comes from the historic first auction of
cellular mobile license in which 6 MHz in GSM 900 MHz band was committed. 2 MHz
in GSM 900 MHz band or its equivalent 3 MHz in 1800 MHz band is considered
additional spectrum. Beyond that the spectrum upto the maximum limit is considered
maximum spectrum.
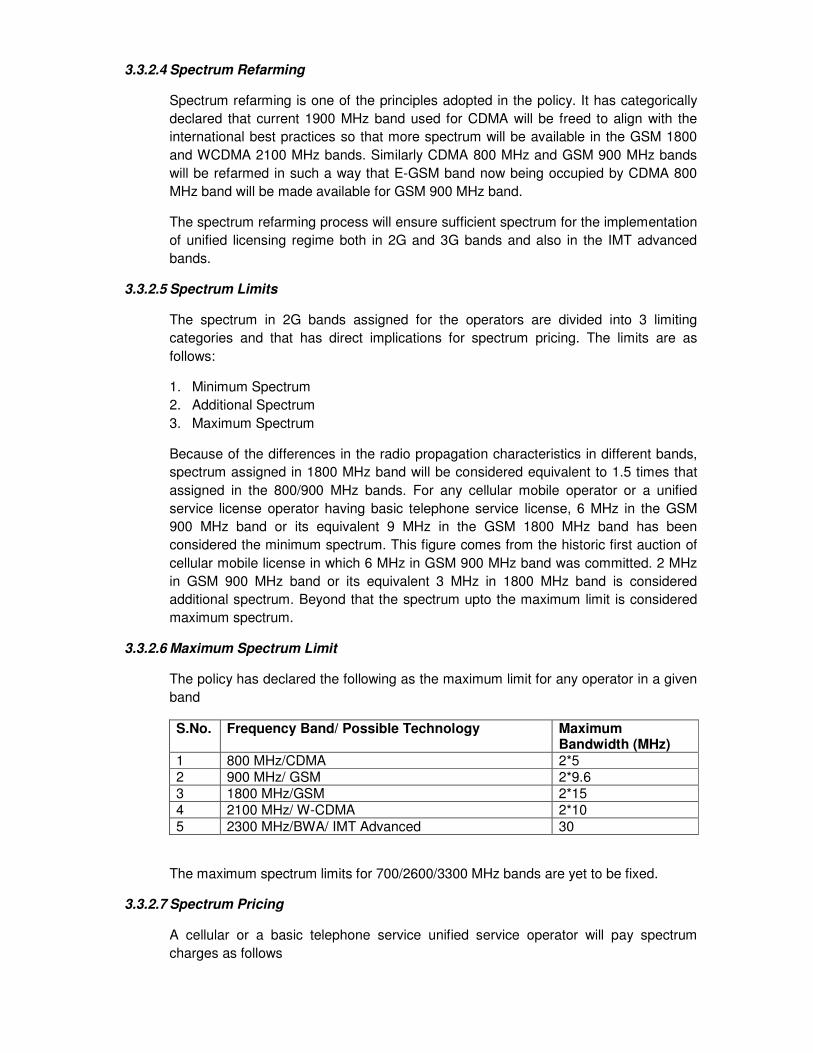
3.3.2.6 Maximum Spectrum Limit
The policy has declared the following as the maximum limit for any operator in a given
band
S.No. Frequency Band/ Possible Technology Maximum Bandwidth (MHz)
1 800 MHz/CDMA 2*5 2 900 MHz/ GSM 2*9.6 3 1800 MHz/GSM 2*15 4 2100 MHz/ W-CDMA 2*10 5 2300 MHz/BWA/ IMT Advanced 30
The maximum spectrum limits for 700/2600/3300 MHz bands are yet to be fixed.
3.3.2.7 Spectrum Pricing
A cellular or a basic telephone service unified service operator will pay spectrum
charges as follows
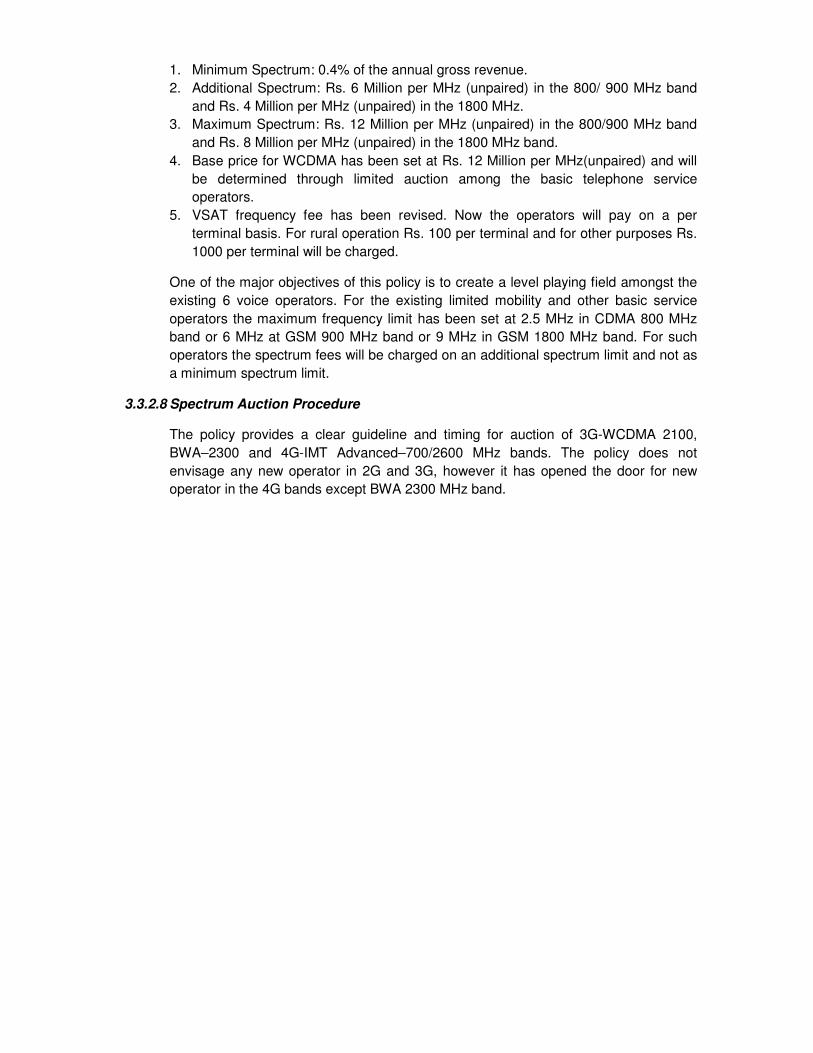
1. Minimum Spectrum: 0.4% of the annual gross revenue.
2. Additional Spectrum: Rs. 6 Million per MHz (unpaired) in the 800/ 900 MHz band
and Rs. 4 Million per MHz (unpaired) in the 1800 MHz.
3. Maximum Spectrum: Rs. 12 Million per MHz (unpaired) in the 800/900 MHz band
and Rs. 8 Million per MHz (unpaired) in the 1800 MHz band.
4. Base price for WCDMA has been set at Rs. 12 Million per MHz(unpaired) and will
be determined through limited auction among the basic telephone service
operators.
5. VSAT frequency fee has been revised. Now the operators will pay on a per
terminal basis. For rural operation Rs. 100 per terminal and for other purposes Rs.
1000 per terminal will be charged.
One of the major objectives of this policy is to create a level playing field amongst the
existing 6 voice operators. For the existing limited mobility and other basic service
operators the maximum frequency limit has been set at 2.5 MHz in CDMA 800 MHz
band or 6 MHz at GSM 900 MHz band or 9 MHz in GSM 1800 MHz band. For such
operators the spectrum fees will be charged on an additional spectrum limit and not as
a minimum spectrum limit.
3.3.2.8 Spectrum Auction Procedure
The policy provides a clear guideline and timing for auction of 3G-WCDMA 2100,
BWA–2300 and 4G-IMT Advanced–700/2600 MHz bands. The policy does not
envisage any new operator in 2G and 3G, however it has opened the door for new
operator in the 4G bands except BWA 2300 MHz band.
Chapter 4 Taxation
Telecommunication Industry as such makes significant contribution to the government
treasury. In Nepal, it is 1.09% of the annual GDP. The telecom industry makes payments to
the Government Treasury in the form of various taxes and non-taxes. Taxes include
Corporate Income Tax, Value Added Tax, customs duty, etc. among others. Non-taxes
include Ownership Tax, Telecom Service Charge among others. In this chapter, we will
discuss key concepts on various relevant taxes levied in the telecom industry.
4.1 Ownership Tax (OT)
Ownership Tax (OT) is levied on telecom services through the provision mentioned in
the Annual Finance Act. As per clause 14 of Finance Act 2071, it is levied in the legal
name of Telecom Ownership Fee.
As per the Finance Act, OT is collected at the rate of Rupees 1,000 per Connection of
telephone line. This is collected even when the ownership of the telephone line is
changed. But in case of Prepaid Mobile, ownership is collected at the rate of two
percent on the value of each SIM and Recharge Card.
Every telecom operator has to deposit the telecom ownership fee in the Government
Treasury within next 25 days from the end of the month in which the telecom
ownership fee is collected. If the amount is not deposited within the specified period,
then interest shall be charged at the rate of fifteen percent per annum.
As per the Act, administration of telecom ownership fee shall be done as per the
procedure set up by the Inland Revenue Department.
4.2 Telecom Service Charge (TSC)
Telecom Service Charge (TSC) is levied on telecom services through the provision
mentioned in the Annual Finance Act. As per clause 15 of Finance Act 2071, it is
collected at the rate of ten percent on the amount charged to the subscribers by the
telecom service providers. Telecom service providers have to deposit TSC to the
government treasury along with Value Added Tax. As per the Finance Act, telecom
service charge is not applicable to Internet (except VOIP Internet telephone service)
and Pager service providers.
In case of Interconnection charge to be paid for using other operator’s network,
Telecom Service Charge shall not be levied or charged.
Every telecom operator has to deposit the Telecom Service Charge in the Government
Treasury along with Value Added Tax within next 25 days from the end of the month in
which the Telecom Service Charge is collected. If the amount is not deposited within
the specified period, then additional charge at the rate of five percent per month shall
be charged.
As per the act, administration of telecom service charge shall be done as per the
procedure set up by the Inland Revenue Department.
4.3 Value Added Tax (VAT)
Value Added Tax is levied as per Value Added Tax Act 2052 and Value Added Tax
Rules 2053. Provisions mentioned in the VAT regulations like Registration, Taxable
Value, Supply, Reverse Charging, Records, Input Tax credit, Refund, Assessments,
Returns etc. are applicable to all telecom companies. But there are few instances in
the VAT regulations and VAT Directives which are specifically applicable to telecom
companies are discussed herewith:
4.3.1 Taxable Value
As per section 12(2)(kha) of the VAT Act, Ownership Fee is included in the
computation of taxable value.
4.3.2 Timing of Supply
As per section 6(3)(ka) of the Act, notwithstanding anything mentioned in sub-section
6(2) of the Act, in the case of telecommunications service that is continuously supplied
or similar kind of other public services, the time of supply shall be the time when the
invoice is issued.
4.3.3 As per clause 23 of Group 11 of Schedule 1 of the VAT Act, if any native industry that
manufactures cellular mobile phone sets and any importer thereof submits evidence
that they have sold the goods, sixty percent of the tax paid by them on the raw
materials of cellular mobile phone sets or readymade goods shall be refunded in
accordance with the procedures specified by the Department.
4.3.4 Supply of Software
As per the VAT Directives 2069, supply of software has been described in detail which
has been reproduced as below:
If software is supplied through electronic means, it is treated as supply of software. If it
is supplied through CD, DVD, Pen drive or any data carrier, then it is treated as supply
of goods.
There is software which are developed in such a way that a large number of users can
use it at a time, these are called standard software. For example, PC Software, PC
home software, Computer game etc. Few Programs and support material services are
generally embedded with standard software like software installation, operating
manual, maintenance service etc.
Standard software is considered as supply of service in case of the following:
a. If the ownership is not transferred to the buyer,
b. If it is transferred electronically,
c. If in the agreement between seller and buyer, only right to use software is
transferred.
Apart from above, all other standard software supply is considered as supply of goods.
4.3.5 Invoicing of Commission by Recharge Card Vendors
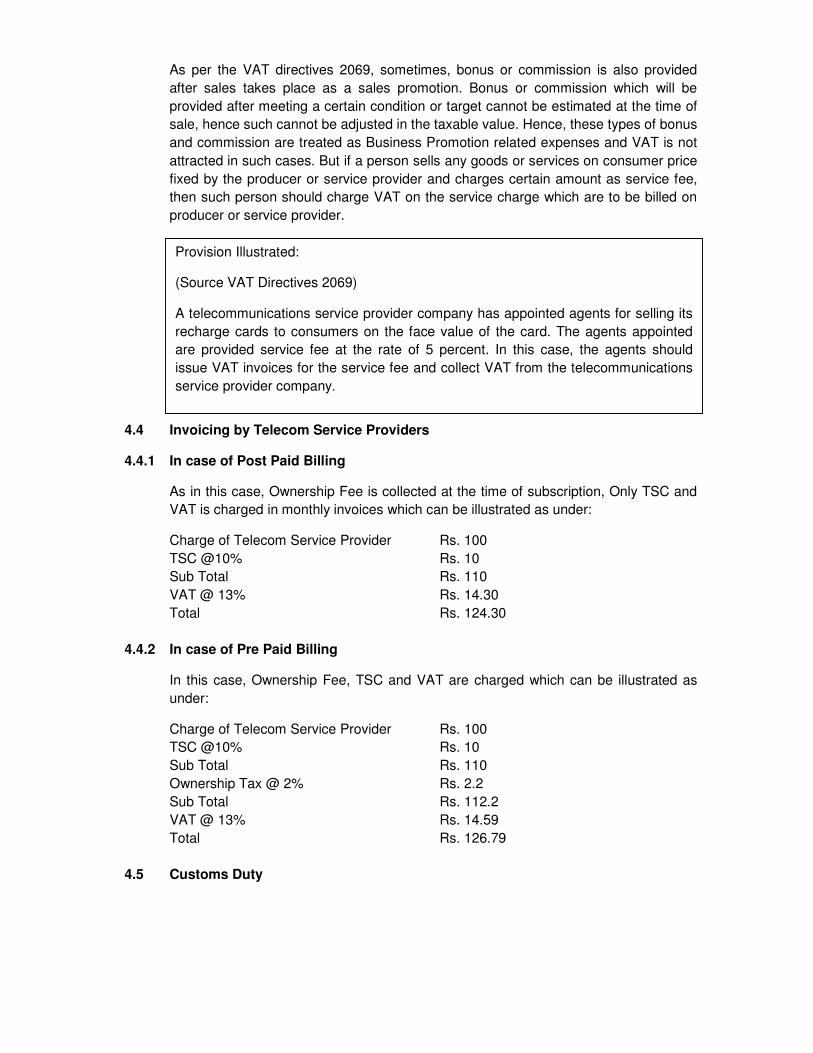
As per the VAT directives 2069, sometimes, bonus or commission is also provided
after sales takes place as a sales promotion. Bonus or commission which will be
provided after meeting a certain condition or target cannot be estimated at the time of
sale, hence such cannot be adjusted in the taxable value. Hence, these types of bonus
and commission are treated as Business Promotion related expenses and VAT is not
attracted in such cases. But if a person sells any goods or services on consumer price
fixed by the producer or service provider and charges certain amount as service fee,
then such person should charge VAT on the service charge which are to be billed on
producer or service provider.
4.4 Invoicing by Telecom Service Providers
4.4.1 In case of Post Paid Billing
As in this case, Ownership Fee is collected at the time of subscription, Only TSC and
VAT is charged in monthly invoices which can be illustrated as under:
Charge of Telecom Service Provider Rs. 100
TSC @10% Rs. 10
Sub Total Rs. 110
VAT @ 13% Rs. 14.30
Total Rs. 124.30
4.4.2 In case of Pre Paid Billing
In this case, Ownership Fee, TSC and VAT are charged which can be illustrated as
under:
Charge of Telecom Service Provider Rs. 100
TSC @10% Rs. 10
Sub Total Rs. 110
Ownership Tax @ 2% Rs. 2.2
Sub Total Rs. 112.2
VAT @ 13% Rs. 14.59
Total Rs. 126.79
4.5 Customs Duty
Provision Illustrated:
(Source VAT Directives 2069)
A telecommunications service provider company has appointed agents for selling its
recharge cards to consumers on the face value of the card. The agents appointed
are provided service fee at the rate of 5 percent. In this case, the agents should
issue VAT invoices for the service fee and collect VAT from the telecommunications
service provider company.
Telecom service providers pay Excise Duty and Customs Duty at the time of
importation of goods and equipment for network expansion. Excise Act 2058 and
Customs Act 2064 are the basic laws which are applied for levy of such duties.
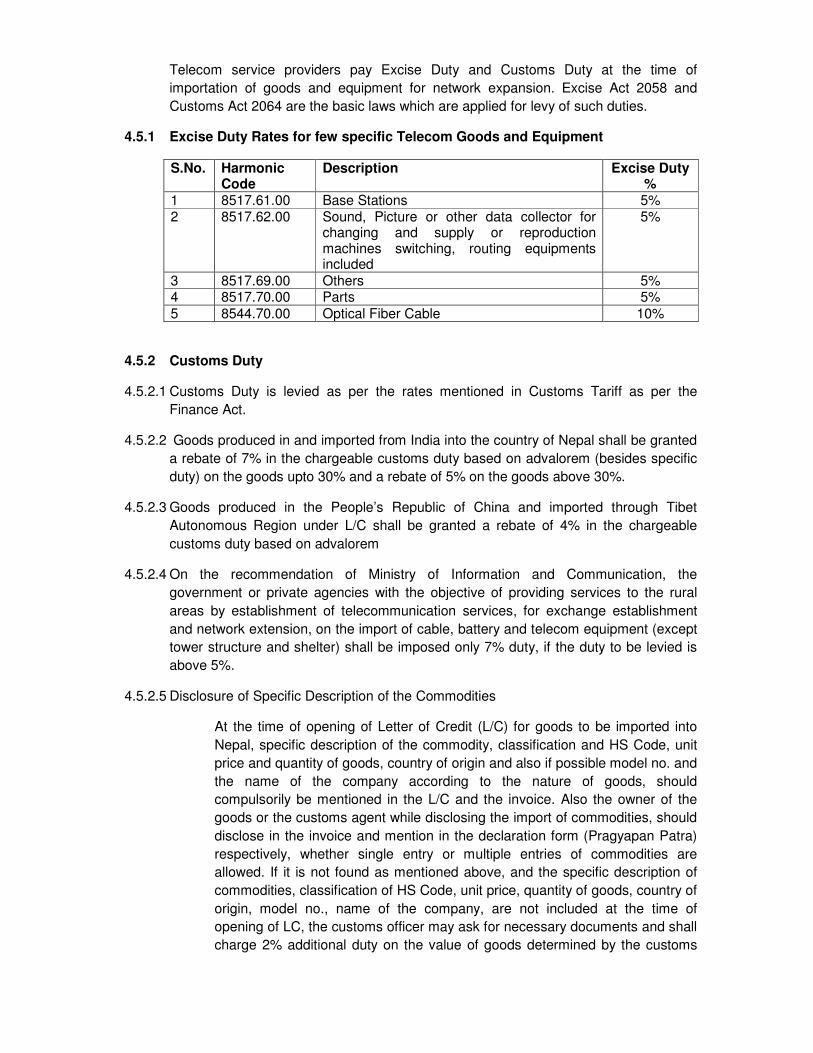
4.5.1 Excise Duty Rates for few specific Telecom Goods and Equipment
S.No. Harmonic Code
Description Excise Duty %
1 8517.61.00 Base Stations 5% 2 8517.62.00 Sound, Picture or other data collector for
changing and supply or reproduction machines switching, routing equipments included
5%
3 8517.69.00 Others 5% 4 8517.70.00 Parts 5% 5 8544.70.00 Optical Fiber Cable 10%
4.5.2 Customs Duty
4.5.2.1 Customs Duty is levied as per the rates mentioned in Customs Tariff as per the
Finance Act.
4.5.2.2 Goods produced in and imported from India into the country of Nepal shall be granted
a rebate of 7% in the chargeable customs duty based on advalorem (besides specific
duty) on the goods upto 30% and a rebate of 5% on the goods above 30%.
4.5.2.3 Goods produced in the People’s Republic of China and imported through Tibet
Autonomous Region under L/C shall be granted a rebate of 4% in the chargeable
customs duty based on advalorem
4.5.2.4 On the recommendation of Ministry of Information and Communication, the
government or private agencies with the objective of providing services to the rural
areas by establishment of telecommunication services, for exchange establishment
and network extension, on the import of cable, battery and telecom equipment (except
tower structure and shelter) shall be imposed only 7% duty, if the duty to be levied is
above 5%.
4.5.2.5 Disclosure of Specific Description of the Commodities
At the time of opening of Letter of Credit (L/C) for goods to be imported into
Nepal, specific description of the commodity, classification and HS Code, unit
price and quantity of goods, country of origin and also if possible model no. and
the name of the company according to the nature of goods, should
compulsorily be mentioned in the L/C and the invoice. Also the owner of the
goods or the customs agent while disclosing the import of commodities, should
disclose in the invoice and mention in the declaration form (Pragyapan Patra)
respectively, whether single entry or multiple entries of commodities are
allowed. If it is not found as mentioned above, and the specific description of
commodities, classification of HS Code, unit price, quantity of goods, country of
origin, model no., name of the company, are not included at the time of
opening of LC, the customs officer may ask for necessary documents and shall
charge 2% additional duty on the value of goods determined by the customs
and 1% additional duty on the goods, which are not chargeable of customs
duty and thus pass the checking.
4.6 Income Tax
Income Tax Act 2058 and Income Tax Rules 2059 governs the income tax provisions
in Nepal. Few Key issues are discussed here under.
4.6.1 Income from Business
Service fee, amount derived from the disposal of trading stock, other incomes are
included under the heading income from business. Following are the allowable
expenses in computing the net income from business:
- General Deduction (Section 13): All the expenses incurred by a person pertaining
to the same income year, in connection with the earning from the business, shall
be deducted from the income of the business in computing the net income from
business.
- Interest under Section 14.
- Cost of the trading stock sold during the year (Section15).
- Repairs and Improvement Expenses (Section 16) – Expenses incurred during an
income year on repair and improvement of an owned and used depreciable asset
in order to generate revenue is allowed to be deducted from taxable income.
Expenses on repair and improvement regarding a block of owned and used assets
during an income year, up to 7% of the depreciable basis of the respective block at
the end of the income year, can be deducted for this purpose.
- Pollution control costs(Section 17)
- Research and Development Costs(Section 18)
- Depreciation (Section 19):
� Income Tax Act allows a person to charge depreciation on a depreciable asset if
the person owns the asset and if it is in use during the year. The rates of
depreciation and the methods of charging depreciation are described in schedule 2
of the Act.
� Classification of Depreciable Assets
Block A – Buildings and Structures of permanent nature.
Block B – Computers, data handling equipment, Furniture, Fixtures, Office
Equipment.
Block C – Automobiles, Bus, Minibus.
Block D – Production Equipment, Earthmoving equipment, Pollution and
Research Development costs capitalized, Expenses on Natural Resource
prospecting and other depreciable tangible assets not covered by Blocks A,B
and C.
Block E – Intangible Assets
� Depreciable Basis – It is computed as: Depreciated amount of the block carried
from the previous year + Absorbed addition to the block during the year –
amount received from the disposal of any assets of the block during the year.
� For the purpose of Income Tax, Block E shall have to be presented separately
as per their classes.
� Depreciation Rates:
Block A – 5%
Block B – 25%
Block C – 20%
Block D – 15%
Block E – The amount of depreciation on intangible asset for each year of its
useful life is calculated by dividing the cost of the individual asset in the block E
at the time the asset is acquired, while rounded to the nearest half year by its
useful life.
4.6.2 Corporate Income Tax Rate is 25%
4.6.3 Withholding Tax
4.6.3.1 Withholding by Employer (Section 87)
Every resident employer need to deduct tax on the payment of remuneration based on
computation of tax on taxable income at the rate given in schedule 1 of the Act.
4.6.3.2 Withholding from Contract Payments (Section 89)
A resident person paying contract payments (including payments made in last 10
days) for more than Rs.50,000 has to withhold tax at source at the rate of 1.5% of the
amount of payment.
In case of a contract payment to non-resident, for repair of aircraft and other contract
or agreements 5% withholding tax rate is applicable.
For this purpose, contract means contract for supply of goods or manpower,
construction, installation or establishment of tangible assets or structures, any act
prescribed by IRD as contract and in case the contract or agreement is regarding
construction, installation or establishment of tangible assets or structures, includes the
supply of related services also, the payment for such services.
Chapter5 Accounting and Financial Reporting
5.1 Revenue Recognition
Revenue is one of the crucial aspects in the telecommunication industry. In the
absence of specific guideline to recognize revenue, different telecommunication
companies, sometimes, followdifferent principles/methods of revenue recognition.
Various revenue that telecommunication companies generate and recognition thereof
have been described in the following section.
5.1.1 Subscriber Type
There are two types of subscribers:
5.1.1.1 Prepaid Subscribers
Prepaid Subscribers are the oneswho pay the money in advance. Subscriber's
account is maintained at individual MSISDN level. Whenever a subscriber
recharges/tops up, his account is credited with the recharged/topped up amount. Once
the balance increases,the subscriber can make the call/utilize the services.
5.1.1.2 Postpaid Subscribers
The subscribers who pay the money once the billing cycle is completed are called
Postpaid Subscribers. Certain credit limit is provided to the subscriber up to which he
can make the call/utilize the services. Normally, Telecom Companies make the
credibility analysis of the subscriber before assigning any credit limit.
5.1.2 Broad Revenue Heads
5.1.2.1 Outgoing Call Revenue
When one subscriber makes the outgoing call to another subscriber, revenue is
generated to Telecom Companies. When the subscriber of one operator makes the
call to the other subscriber within its own network, it is called on-net call and if it is
made to other operator's network, it is an off-net call.
5.1.2.2 Incoming Call Revenue
Incoming Call Revenue is also known as Interconnection Usage Charges (IUC).
When the subscriber of one operator makes the call to the subscriber of other
operator's network there needs interconnection between two operators. The call
originated from one operator's network is terminated to another operator's network.
The call originating operator pays to the call terminating operator on the basis of
agreed rate, subject to interconnection guidelines issued by NTA. It is the expense of
call originating operator and in parallel, revenue of call terminating operator. This is
equally applicable to both national and international calls in case of revenue
calculation.
5.1.2.3 Roaming Revenue
Roaming is a general term referred to the extending of the connectivity of a service in
a location that is different from the home location. Traditional Roaming is defined as
the ability for a cellular subscriber to automatically make and receive voice calls, send
and receive data, or access other services, including home data services, when
travelling outside the geographical coverage area of the home network, by means of
using a visited network. Roaming may be national, international and within network.
5.1.2.4 Data Revenue
The data used and the revenue generating from its usage by the subscriber of an
operator isthe Data Revenue. Data service can be used via mobile phones, dongles,
PSTN network.Data service usedis measured in KB, MB, GB.
5.1.2.5 Service Activation/Connection fees
The amount charged for initial connection for activating a serviceis called activation
fee. This is the starter pack for the subscriber charged by Telecom Companies for
initial connection.
5.1.2.6 SMS, MMS, PRBT Revenue
SMS is the short message service wherein the subscriber can send text messages to
other subscriber. Similarly, MMS is the multimedia message services wherein the
subscriber can send/receive image along with text messages. PRBT is the personal
ring back tone wherein the calling party can hear personalized tone or song
downloaded.
5.1.2.7 Value Added Services (VAS)
VAS includes the additional services offered by the operator to the subscriber.
SMS2email, call notification, call waiting, voice mail, web SMS etc are few examples of
value added services.
5.1.2.8 Bundled Service Revenue
Sometimes Telecom Companies offer their services to the subscribers along with the
equipment, for example CDMA service bundled with CDMA handsets. The service
offered along with equipment are called bundle service and at times, Telecom
Companies face difficulty to recognize the revenue from bundled offers in the absence
of clear guidelines.
5.1.3 Relevant Provision of International Financial Reporting System (IFRS)
International Financial Reporting Standards (IFRS) are designed as a common global
language for business affairs so that company accounts are understandable and
comparable across international boundaries. They are a consequence of growing
international shareholding and trade and are particularly important for companies that
have dealings in several countries. They are progressively replacing the many different
national accounting standards. It deals with the rules to be followed by accountants to
maintain books of accounts which are comparable, understandable, reliable and
relevant as per the users internal or external.They are sometimes still called by the
original name of International Accounting Standards (IAS).
IAS 18-Revenue deals with the revenue recognition, measurement and disclosure.
Following are the relevant provisions of IAS 18.
Para 7
Revenue is the gross inflow of economic benefits during the period arising in the
course of the ordinary activities of an entity, when those inflows result in increases in
equity, other than increases relating to contributions from equity participants.
Para 9 Revenue shall be measured at the fair value of the consideration received or
receivable.
Para 14
Revenue from the sale of goods shall be recognized when all the following
conditions have been satisfied:
a) the entity has transferred to the buyer the significant risks and rewards of ownership of the goods;
b) the entity retains neither continuing managerial involvement to the degree usually associated with ownership nor effective control over the goods sold;
c) the amount of revenue can be measured reliably; d) it is probable that the economic benefits associated with the transaction will flow to
the entity; and e) the costs incurred or to be incurred in respect of the transaction can be measured
reliably.
Para 20
When the outcome of a transaction involving the rendering of services can be
estimated reliably, revenue associated with the transaction shall be recognized by
reference to the stage of completion of the transaction at the end of the reporting
period. The outcome of a transaction can be estimated reliably when all the following
conditions are satisfied:
a) the amount of revenue can be measured reliably;
b) it is probable that the economic benefits associated with the transaction will flow to the entity;
c) the stage of completion of the transaction at the end of the reporting period can be measured reliably; and
d) the costs incurred for the transaction and the costs to complete the transaction can be measured reliably.
Para 35
An entity shall disclose:
a) the accounting policies adopted for the recognition of revenue, including the
methods adopted to determine the stage of completion of transactions involving
the rendering of services;
b) the amount of each significant category of revenue recognized during the period,
including revenue arising from:
i. the sale of goods;
ii. the rendering of services; and
c) the amount of revenue arising from exchanges of goods or services included in
each significant category of revenue.
Note
It is suggested to the readers to go through IAS 18 Revenue for more details.
Note
Followings are the similar provisions in Nepal Financial Reporting System (NFRS) 7-
Revenue.
SN IFRS Reference NFRS Similar Provision Reference
1 Para 7 Para 7 2 Para 9 Para 9 3 Para 14 Para 14 4 Para 20 Para 20 5 Para 35 Para 35
The following is Revenue Recognition principle followed by one of the world's top Five
Telecom companies for the reference of the reader.
Significant Accounting Policies ............ Revenue Revenue is recognized to the extent the Group has delivered goods or rendered services under an agreement, the amount of revenue can be measuredreliably and it is probable that the economic benefits associated with the transaction will flow to the Group. Revenue is measured at the fair valueof the consideration received, exclusive of sales taxes and discounts. The Group principally obtains revenue from providing the following telecommunication services: access charges, airtime usage, messaging,interconnect fees, data services and information provision, connection fees and equipment sales. Products and services may be sold separatelyor in bundled packages. Revenue for access charges, airtime usage and messaging by contract customers is recognized as services are performed; with unbilled revenueresulting from services already provided accrued at the end of each period and unearned revenue from services to be provided in future periodsdeferred. Revenue from the sale of prepaid credit is deferred until such time as the customer uses the airtime, or the credit expires. Revenue from interconnect fees is recognized at the time the services are performed. Revenue from data services and information provision is recognized when the Group has performed the related service and depending on thenature of the service, is recognized either at the gross amount billed to the customer or the amount receivable by the Group as commission forfacilitating the service.
Customer connection revenue is recognized together with the related equipment revenue to the extent that the aggregate equipment andconnection revenue does not exceed the fair value of the equipment delivered to the customer. Any customer connection revenue not recognizedtogether with related equipment revenue is deferred and recognized over the period in which services are expected to be provided to the customer.
Revenue for device sales is recognized when the device is delivered to the end customer and the sale is considered complete. For device sales madeto intermediaries, revenue is recognized if the significant risks associated with the device are transferred to the intermediary and the intermediaryhas no general right of return. If the significant risks are not transferred, revenue recognition is deferred until sale of the device to an end customerby the intermediary or the expiry of the right of return. In revenue arrangements including more than one deliverable, the arrangements are divided into separate units of accounting. Deliverables areconsidered separate units of accounting if the following two conditions are met (1) the deliverable has value to the customer on a stand-alone basisand (2) there is evidence of the fair value of the item. The arrangement consideration is allocated to each separate unit of accounting based on itsrelative fair value. Critical Accounting Estimates Revenue recognition Arrangements with multiple deliverables In revenue arrangements including more than one deliverable,the deliverables are assigned to one or more separate unitsof accounting and the arrangement consideration is allocated to eachunit of accounting based on its relative fair value.Determining the fair value of each deliverable can require complexestimates due to the nature of the goods and services provided.The Group generally determines the fair value of individual elementsbased on prices at which the deliverable is regularly sold on a standalonebasis after considering volume discounts where appropriate. Gross versus net presentation When deciding the most appropriate basis for presenting revenueor costs of revenue, both the legal form and substance of the agreementbetween the Group and its business partners are reviewed to determineeach party’s respective role in the transaction.Where the Group’s role in a transaction is that of principal, revenueis recognized on a gross basis. This requires revenue to comprisethe gross value of the transaction billed to the customer, after tradediscounts, with any related expenditure charged as an operating cost.Where the Group’s role in a transaction is that of an agent, revenueis recognized on a net basis with revenue representing the margin earned. (Source: Vodafone group Plc, Annual Report 2013)
5.1.4 Relevant Provision of Income Tax
The relevant provisions of Income Tax Act, 2000 and Income Tax Rules, 2002are
mentioned below:
Section 22 (1)
Subject to this Act, the determination of when a person derives an amount or incurs an expense is made according to generally accepted accounting principles.
Section 22(3) A company shall account for tax purposes on an accrual basis. Rule 8(1)
For the purposes of tax accounting under Section 22 of the Act, the accounting
standard prescribed by the prevailing laws, if any, shall be followed.
Rule 8(2)
If there are no accounting standard as referred to in Rule 8(1), tax accounting shall be
done as per the standard prescribed by the Department on ground of any prevalent
international principles and practices.
Note
A company shall have to keep its books of account on accrual basis as per section
22(3) of the Act. Section 22(1) stipulates that unless otherwise specifically provided for
in the Act, income or expense shall be accounted for as per Generally Accepted
Accounting Principles (GAAP). Further, Rule 8 of Income Tax Rule, 2002 provides that
the accounting standard prescribed by prevailing laws (Nepal Accounting Standards,
currently Nepal Financial Reporting Standards issued by The Institute of Chartered
Accountants of Nepal-ICAN are prevailing) and in absence of NFRS, tax accounting
shall be done as per standard prescribed by the department with reference to
international principles and practices.
5.2 Property, Plant and Equipment and Intangible Assets
Telecommunication industry is the capital intensive industry. Huge amount of capital
expenditure has to be incurred for building the network and operating it. Technology
keeps on changing very rapidly. Telecom Companies have to follow the market trend
in order to cater the needs of their subscribers by offering products and services
wherein considerable amount of money has to be expensed out in the form of capital
expenditure in network equipment and infrastructure.
5.2.1 Group/class of assets related to infrastructure are discussed below:
5.2.1.1 Equipment, Fixtures and Fittings
Network infrastructure assets and other assets include significant amounts of
equipment, fixtures and fittings which are summarized below:
Radio Equipment
Radio equipment is any equipment or interconnected system or subsystem of
equipment (both transmission and reception) that is used to communicate over a
distance by modulating and radiating electromagnetic waves in space without artificial
guide. This does not include such items as microwave, satellite, or cellular telephone
equipment.
Transmission Equipment
Transmission Equipment are equipment used for transmitting signals. Radio,
microwave, satellite signals are pass through these equipment.
Core Equipment
MSC, BSC, HLR, VLR are core equipment.
Power Equipment
These equipment are used for supplying power system to various equipment.
Billing System
A 'Billing System'* is a combination of a software application and Database designed
to take customer information regarding charges to be made to that customer.
Telecommunication billing system is an enterprise application software designed to
support the telecommunications billing processes.
5.2.2 Relevant Provision of International Financial Reporting System (IFRS)
IAS 16-Property, Plant and Equipment (PPE) deals with the recognition, measurement
and disclosure of tangible non-current assets. Following are the relevant provisions of
IAS 16. Further, IAS 38 deals with Intangible Assets.
Property, Plant and Equipment
5.2.2.1 Recognition
Para 7
An item of property, plant and equipment should be recognized as an asset if and only
if:
(a) it is probable that future economic benefits associated with the asset will flow to
the enterprise; and
(b) the cost of the asset to the enterprise can be measured reliably.
5.2.2.2 Measurement
Para 15
An item of property, plant and equipment that qualifies for recognition as anasset shall
be measured at its cost.
5.2.2.3 Measurement after recognition
Para 29
An entity shall choose either the cost model or the revaluation model as its accounting policy and shall apply that policy to an entire class of property, plant and equipment.
Cost Model
Para 30
After recognition as an asset, an item of property, plant and equipment shall be carried at its cost less any accumulated depreciation and any accumulated impairment losses.
Revaluation Model
Para 31 After recognition as an asset, an item of property, plant and equipment whose fair
value can be measured reliably shall be carried at a revalued amount, being its fair value at the date of the revaluation less any subsequent accumulated depreciation and subsequent accumulated impairment losses. Revaluations shall be made with sufficient regularity to ensure that the carrying amount does not differ materially from that which would be determined using fair value at the end of the reporting period.
5.2.2.4 Depreciation
Para 43
Each part of an item of property, plant and equipment with a cost that is significant in relation to the total cost of the item shall be depreciated separately.
Para 48
The depreciation charge for each period shall be recognized in profit or loss unless it is included in the carrying amount of another asset.
Para 50
The depreciable amount of an asset shall be allocated on a systematic basis over its useful life.
Para 51
The residual value and the useful life of an asset shall be reviewed at least at each financial year-end and, if expectations differ from previous estimates, the change(s) shall be accounted for as a change in an accounting estimate in accordance with IAS 8 Accounting Policies, Changes in Accounting Estimates and Errors. Para 61
The depreciation method applied to an asset shall be reviewed at least at each financial year-end and, if there has been a significant change in the expected pattern of consumption of the future economic benefits embodied in the asset, the method shall be changed to reflect the changed pattern. Such a change shall be accounted for as a change in an accounting estimate in accordance with IAS 8. 5.2.2.5 Impairment IAS 36 deals with Impairment of Assets.
Para 6 Impairment Loss An impairment loss is the amount by which the carrying amount of an asset or a cash-generating unit exceeds its recoverable amount.
Recoverable Amount The recoverable amount of an asset or a cash-generating unit is the higher of its fair
value less costs to sell and its value in use. Fair value less costs to sell Fair value less costs to sell is the amount obtainable from the sale of an asset or cash-
generating unit in an arm’s length transaction between knowledgeable, willing parties, less the costs of disposal.
Value In Use Value in use is the present value of the future cash flows expected to be derived from an asset or cash-generating unit. Cost of disposal Costs of disposal are incremental costs directly attributable to the disposal of an asset or cash-generating unit, excluding finance costs and income tax expense. Para 60 An impairment loss shall be recognized immediately in profit or loss, unless the asset is carried at revalued amount in accordance with another Standard (for example, in accordance with the revaluation model in IAS 16). Any impairment loss of a revalued asset shall be treated as a revaluation decrease in accordance with that other Standard.
5.2.2.6 De-recognition Para 67 The carrying amount of an item of property, plant and equipment shall be de-
recognized: (a) on disposal; or (b) when no future economic benefits are expected from its use or disposal.
5.2.2.7 Disclosure Para 73 The financial statements shall disclose, for each class of property, plant and
equipment: (a) the measurement bases used for determining the gross carrying amount; (b) the depreciation methods used; (c) the useful lives or the depreciation rates used; (d) the gross carrying amount and the accumulated depreciation (aggregated with
accumulated impairment losses) at the beginning and end of the period; and (e) a reconciliation of the carrying amount at the beginning and end of the period
showing: (i) additions; (ii) assets classified as held for sale or included in a disposal group
classified as held for sale in accordance with IFRS 5 and other disposals;
(iii) acquisitions through business combinations; (iv) increases or decreases resulting from revaluations under paragraphs
31, 39 and 40 and from impairment losses recognized or reversed in other comprehensive income in accordance with IAS 36;
(v) impairment losses recognized in profit or loss in accordance with IAS 36;
(vi) impairment losses reversed in profit or loss in accordance with IAS 36; (vii) differences arising on the translation of the financial depreciation;
(viii) the net exchange statements from the functional currency into a different presentation currency, including the translation of a foreign operation into the presentation currency of the reporting entity; and
(ix) other changes. Para 74 The financial statements shall also disclose:
(a) the existence and amounts of restrictions on title, and property, plant and equipment pledged as security for liabilities;
(b) the amount of expenditures recognized in the carrying amount of an item of property, plant and equipment in the course of its construction;
(c) the amount of contractual commitments for the acquisition of property, plant and equipment; and
(d) if it is not disclosed separately in the statement of comprehensive income, the amount of compensation from third parties for items of property, plant and equipment that were impaired, lost or given up that is included in profit or loss.
Intangible Assets
Followings are the provisions mentioned in IAS 38 on recognition, measurement and
disclosure related to Intangible Assets.
Para 8
An intangible asset is an identifiable non-monetary asset without physical substance. Para 12 An asset is identifiable if it either:
(a) is separable, i. e. is capable of being separated or divided from the entity and sold,
transferred, licensed, rented or exchanged, either individually or together with a related contract, identifiable asset or liability, regardless of whether the entity intends to do so; or
(b) arises from contractual or other legal rights, regardless of whether those rights are transferable or separable from the entity or from other rights and obligations.
Para 21 An intangible asset shall be recognized if, and only if:
(a) it is probable that the expected future economic benefits that are attributable to the asset will flow to the entity; and
(b) the cost of the asset can be measured reliably. Para 24 An intangible asset shall be measured initially at cost. Para 54 No intangible asset arising from research (or from the research phase of an internal
project) shall be recognized. Expenditure on research (or on the research phase of an internal project) shall be recognized as an expense when it is incurred.
Para 57 An intangible asset arising from development (or from the development phase of an
internal project) shall be recognized if, and only if, an entity can demonstrate all of the following:
(a) the technical feasibility of completing the intangible asset so that it will be available
for use or sale (b) its intention to complete the intangible asset and use or sell it. (c) its ability to use or sell the intangible asset. (d) how the intangible asset will generate probable future economic benefits. Among
other things, the entity can demonstrate the existence of a market for the output of the intangible asset or the intangible asset itself or, if it is to be used internally, the usefulness of the intangible asset.
(e) the availability of adequate technical, financial and other resources to complete the development and to use or sell the intangible asset.
(f) its ability to measure reliably the expenditure attributable to the intangible asset during its development.
Para 63 Internally generated brands, mastheads, publishing titles, customer lists and items
similar in substance shall not be recognized as intangible assets.
Measurement after Initial Recognition
Para 74
After initial recognition, an intangible asset shall be carried at its cost less any
accumulated amortization and any accumulated impairment losses.
Para 75
After initial recognition, an intangible asset shall be carried at a revalued amount,
being its fair value at the date of the revaluation less any subsequent accumulated
amortization and any subsequent accumulated impairment losses. For the purpose of
revaluations under this Standard, fair value shall be measured by reference to an
active market. Revaluations shall be made with such regularity that at the end of the
reporting period the carrying amount of the asset does not differ materially from its fair
value.
Note
It is suggested to the readers to go through IAS 16 Property, Plant and Equipment,
IAS 36 Impairment of Assets and IAS 38 Intangible Assets for more details.
Further, it is suggested to the readers to go through IAS 16 ‘Property, Plant and
Equipment’, IAS 36 ‘Impairment of Assets’ and IAS 38 ‘Intangible Assets’ concurrently,
which can be correlated.
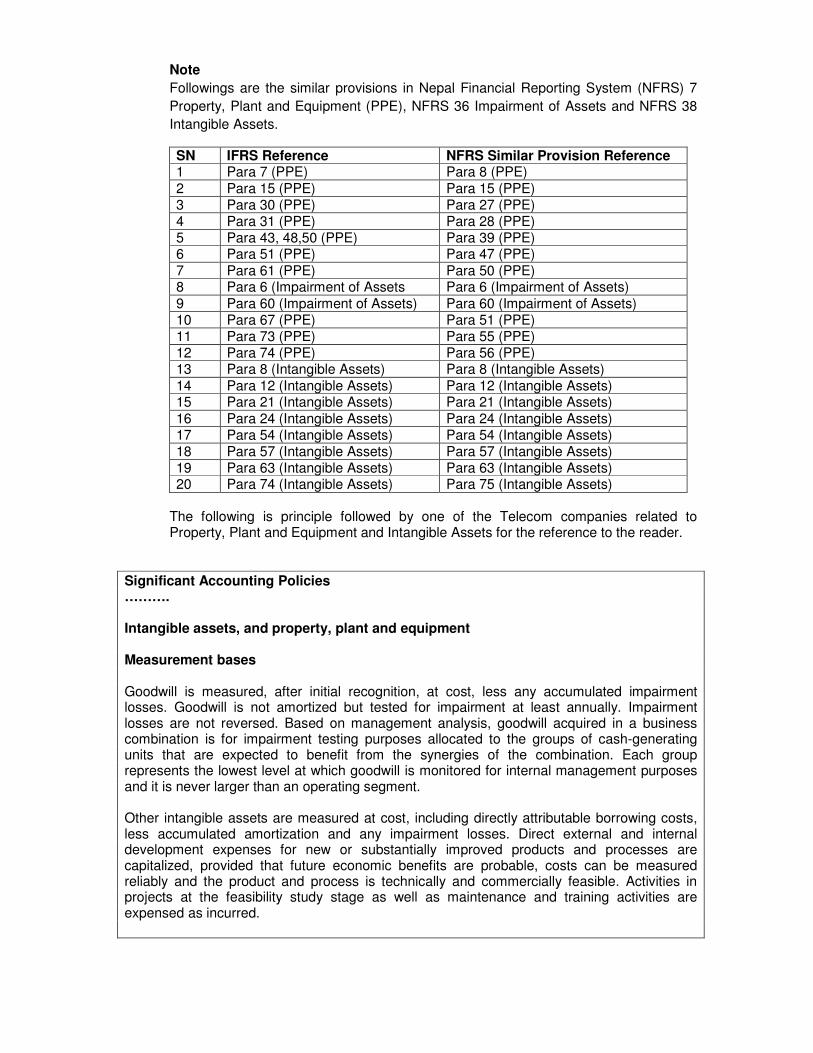
Note
Followings are the similar provisions in Nepal Financial Reporting System (NFRS) 7
Property, Plant and Equipment (PPE), NFRS 36 Impairment of Assets and NFRS 38
Intangible Assets.
SN IFRS Reference NFRS Similar Provision Reference 1 Para 7 (PPE) Para 8 (PPE) 2 Para 15 (PPE) Para 15 (PPE) 3 Para 30 (PPE) Para 27 (PPE) 4 Para 31 (PPE) Para 28 (PPE) 5 Para 43, 48,50 (PPE) Para 39 (PPE) 6 Para 51 (PPE) Para 47 (PPE) 7 Para 61 (PPE) Para 50 (PPE) 8 Para 6 (Impairment of Assets Para 6 (Impairment of Assets) 9 Para 60 (Impairment of Assets) Para 60 (Impairment of Assets) 10 Para 67 (PPE) Para 51 (PPE) 11 Para 73 (PPE) Para 55 (PPE) 12 Para 74 (PPE) Para 56 (PPE) 13 Para 8 (Intangible Assets) Para 8 (Intangible Assets) 14 Para 12 (Intangible Assets) Para 12 (Intangible Assets) 15 Para 21 (Intangible Assets) Para 21 (Intangible Assets) 16 Para 24 (Intangible Assets) Para 24 (Intangible Assets) 17 Para 54 (Intangible Assets) Para 54 (Intangible Assets) 18 Para 57 (Intangible Assets) Para 57 (Intangible Assets) 19 Para 63 (Intangible Assets) Para 63 (Intangible Assets) 20 Para 74 (Intangible Assets) Para 75 (Intangible Assets)
The following is principle followed by one of the Telecom companies related to
Property, Plant and Equipment and Intangible Assets for the reference to the reader.
Significant Accounting Policies ………. Intangible assets, and property, plant and equipment Measurement bases Goodwill is measured, after initial recognition, at cost, less any accumulated impairment losses. Goodwill is not amortized but tested for impairment at least annually. Impairment losses are not reversed. Based on management analysis, goodwill acquired in a business combination is for impairment testing purposes allocated to the groups of cash-generating units that are expected to benefit from the synergies of the combination. Each group represents the lowest level at which goodwill is monitored for internal management purposes and it is never larger than an operating segment. Other intangible assets are measured at cost, including directly attributable borrowing costs, less accumulated amortization and any impairment losses. Direct external and internal development expenses for new or substantially improved products and processes are capitalized, provided that future economic benefits are probable, costs can be measured reliably and the product and process is technically and commercially feasible. Activities in projects at the feasibility study stage as well as maintenance and training activities are expensed as incurred.
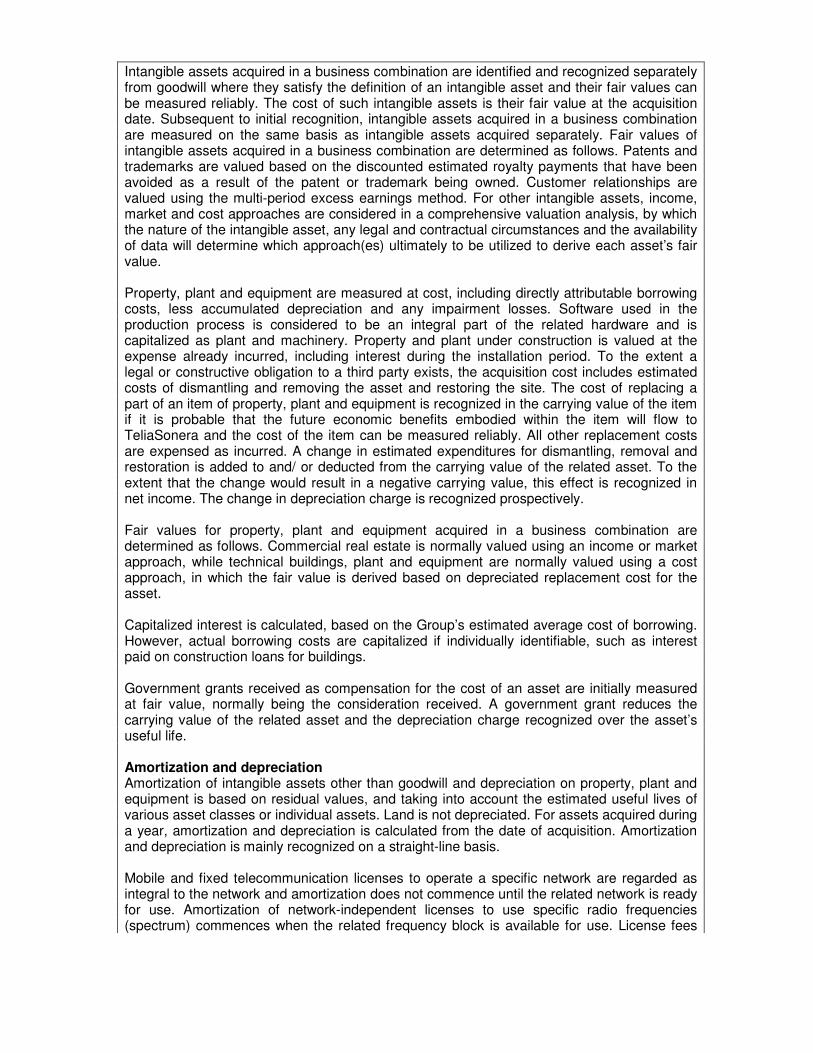
Intangible assets acquired in a business combination are identified and recognized separately from goodwill where they satisfy the definition of an intangible asset and their fair values can be measured reliably. The cost of such intangible assets is their fair value at the acquisition date. Subsequent to initial recognition, intangible assets acquired in a business combination are measured on the same basis as intangible assets acquired separately. Fair values of intangible assets acquired in a business combination are determined as follows. Patents and trademarks are valued based on the discounted estimated royalty payments that have been avoided as a result of the patent or trademark being owned. Customer relationships are valued using the multi-period excess earnings method. For other intangible assets, income, market and cost approaches are considered in a comprehensive valuation analysis, by which the nature of the intangible asset, any legal and contractual circumstances and the availability of data will determine which approach(es) ultimately to be utilized to derive each asset’s fair value. Property, plant and equipment are measured at cost, including directly attributable borrowing costs, less accumulated depreciation and any impairment losses. Software used in the production process is considered to be an integral part of the related hardware and is capitalized as plant and machinery. Property and plant under construction is valued at the expense already incurred, including interest during the installation period. To the extent a legal or constructive obligation to a third party exists, the acquisition cost includes estimated costs of dismantling and removing the asset and restoring the site. The cost of replacing a part of an item of property, plant and equipment is recognized in the carrying value of the item if it is probable that the future economic benefits embodied within the item will flow to TeliaSonera and the cost of the item can be measured reliably. All other replacement costs are expensed as incurred. A change in estimated expenditures for dismantling, removal and restoration is added to and/ or deducted from the carrying value of the related asset. To the extent that the change would result in a negative carrying value, this effect is recognized in net income. The change in depreciation charge is recognized prospectively. Fair values for property, plant and equipment acquired in a business combination are determined as follows. Commercial real estate is normally valued using an income or market approach, while technical buildings, plant and equipment are normally valued using a cost approach, in which the fair value is derived based on depreciated replacement cost for the asset. Capitalized interest is calculated, based on the Group’s estimated average cost of borrowing. However, actual borrowing costs are capitalized if individually identifiable, such as interest paid on construction loans for buildings. Government grants received as compensation for the cost of an asset are initially measured at fair value, normally being the consideration received. A government grant reduces the carrying value of the related asset and the depreciation charge recognized over the asset’s useful life. Amortization and depreciation Amortization of intangible assets other than goodwill and depreciation on property, plant and equipment is based on residual values, and taking into account the estimated useful lives of various asset classes or individual assets. Land is not depreciated. For assets acquired during a year, amortization and depreciation is calculated from the date of acquisition. Amortization and depreciation is mainly recognized on a straight-line basis. Mobile and fixed telecommunication licenses to operate a specific network are regarded as integral to the network and amortization does not commence until the related network is ready for use. Amortization of network-independent licenses to use specific radio frequencies (spectrum) commences when the related frequency block is available for use. License fees
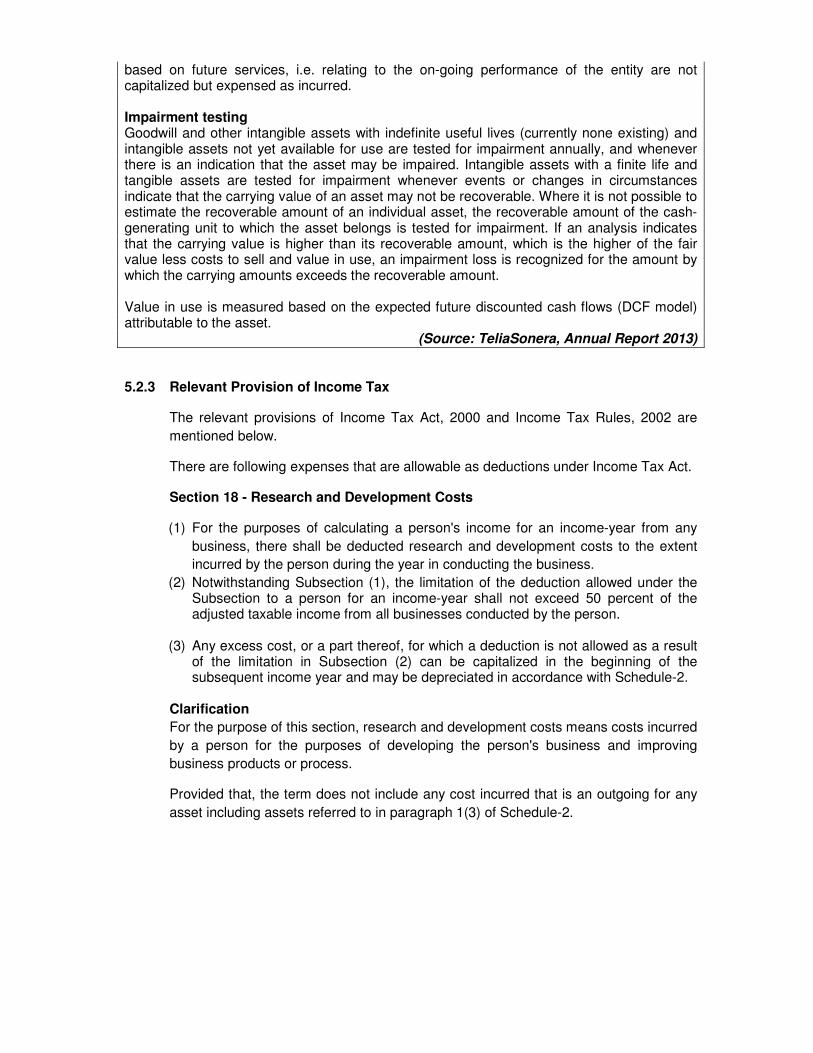
based on future services, i.e. relating to the on-going performance of the entity are not capitalized but expensed as incurred. Impairment testing Goodwill and other intangible assets with indefinite useful lives (currently none existing) and intangible assets not yet available for use are tested for impairment annually, and whenever there is an indication that the asset may be impaired. Intangible assets with a finite life and tangible assets are tested for impairment whenever events or changes in circumstances indicate that the carrying value of an asset may not be recoverable. Where it is not possible to estimate the recoverable amount of an individual asset, the recoverable amount of the cash-generating unit to which the asset belongs is tested for impairment. If an analysis indicates that the carrying value is higher than its recoverable amount, which is the higher of the fair value less costs to sell and value in use, an impairment loss is recognized for the amount by which the carrying amounts exceeds the recoverable amount. Value in use is measured based on the expected future discounted cash flows (DCF model) attributable to the asset.
(Source: TeliaSonera, Annual Report 2013)
5.2.3 Relevant Provision of Income Tax
The relevant provisions of Income Tax Act, 2000 and Income Tax Rules, 2002 are
mentioned below.
There are following expenses that are allowable as deductions under Income Tax Act.
Section 18 - Research and Development Costs
(1) For the purposes of calculating a person's income for an income-year from any
business, there shall be deducted research and development costs to the extent
incurred by the person during the year in conducting the business.
(2) Notwithstanding Subsection (1), the limitation of the deduction allowed under the Subsection to a person for an income-year shall not exceed 50 percent of the adjusted taxable income from all businesses conducted by the person.
(3) Any excess cost, or a part thereof, for which a deduction is not allowed as a result of the limitation in Subsection (2) can be capitalized in the beginning of the subsequent income year and may be depreciated in accordance with Schedule-2.
Clarification
For the purpose of this section, research and development costs means costs incurred
by a person for the purposes of developing the person's business and improving
business products or process.
Provided that, the term does not include any cost incurred that is an outgoing for any
asset including assets referred to in paragraph 1(3) of Schedule-2.
Section 19- Depreciation Allowance
(1) For the purposes of calculating a person's income for an income-year from any
business or investment, there shall be deducted in respect of depreciation of
depreciable assets owned and used by the person during the year in the
production of the person's income from the business or investment the allowances
granted to the person for the year under Schedule-2.
(2) Notwithstanding subsection (1), the following provision shall be applied in respect
of the depreciation of the machines, equipment and other machinery installed in
the electricity projects that are involving in building power station, generating and
transmitting electricity and in the projects conducted by any entity so as to build
public infrastructure, own, operate and transfer to Government of Nepal.
(a) in case where the old machines, equipment and other machinery that are
already installed require replacement in any income year as they are out of
order due to being too old, the balancing value of the old machines, equipment
and other machinery remained after subtracting the depreciation up to the year
from their cost shall be allowed as expenses for the year.
(b) at the time of transfer of other assets to the Government of Nepal except of
the old assets replaced in accordance with paragraph (a), the balancing value,
if remained, after subtracting the depreciation up to the year of the transfer
from their cost shall be allowed as expenses.
5.3 Asset Retirement Obligation (ARO)
5.3.1 Asset Retirement Obligation (ARO) - Meaning
An Asset Retirement Obligation (ARO) is a way of accounting for the costs related to
future disposal of assets. ARO accounting is particularly significant for remediation
work necessary to restore a property, such as decontaminating a nuclear power plant
site, removing underground fuel storage tanks, cleanup around an oil well, or removal
of improvements to a site. It does not apply to unplanned cleanup costs, such as from
an accident.
Companies must recognize the ARO liability in the period it was incurred, such as at
acquisition or construction. The liability equals the present value of the expected cost
of retirement/remediation.
5.3.2 Relevant provisions of International Financial Reporting Standard (IFRS) related
to ARO
IAS 37 Provisions, Contingent Liabilities and Contingent Assets deals with the
requirement of creation of liability under ‘Asset Retirement Obligation’.
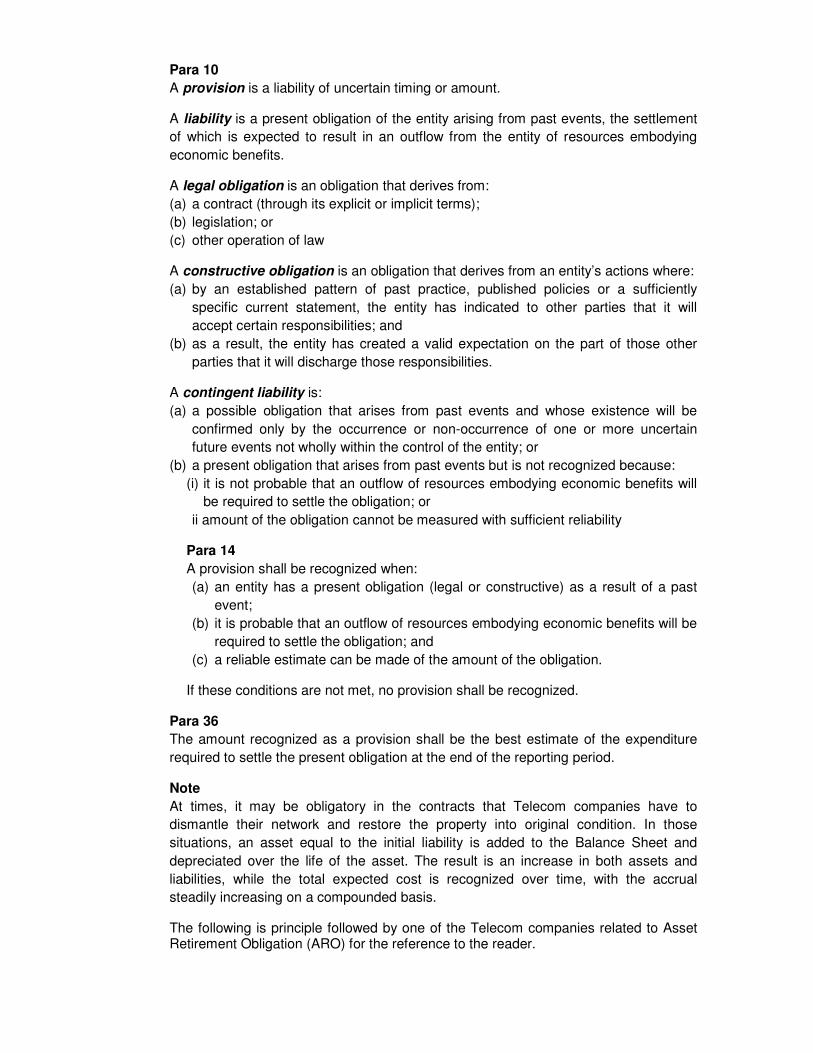
Para 10
A provision is a liability of uncertain timing or amount.
A liability is a present obligation of the entity arising from past events, the settlement
of which is expected to result in an outflow from the entity of resources embodying
economic benefits.
A legal obligation is an obligation that derives from:
(a) a contract (through its explicit or implicit terms);
(b) legislation; or
(c) other operation of law
A constructive obligation is an obligation that derives from an entity’s actions where:
(a) by an established pattern of past practice, published policies or a sufficiently
specific current statement, the entity has indicated to other parties that it will
accept certain responsibilities; and
(b) as a result, the entity has created a valid expectation on the part of those other
parties that it will discharge those responsibilities.
A contingent liability is:
(a) a possible obligation that arises from past events and whose existence will be
confirmed only by the occurrence or non-occurrence of one or more uncertain
future events not wholly within the control of the entity; or
(b) a present obligation that arises from past events but is not recognized because:
(i) it is not probable that an outflow of resources embodying economic benefits will
be required to settle the obligation; or
ii amount of the obligation cannot be measured with sufficient reliability
Para 14
A provision shall be recognized when:
(a) an entity has a present obligation (legal or constructive) as a result of a past
event;
(b) it is probable that an outflow of resources embodying economic benefits will be
required to settle the obligation; and
(c) a reliable estimate can be made of the amount of the obligation.
If these conditions are not met, no provision shall be recognized.
Para 36
The amount recognized as a provision shall be the best estimate of the expenditure
required to settle the present obligation at the end of the reporting period.
Note
At times, it may be obligatory in the contracts that Telecom companies have to
dismantle their network and restore the property into original condition. In those
situations, an asset equal to the initial liability is added to the Balance Sheet and
depreciated over the life of the asset. The result is an increase in both assets and
liabilities, while the total expected cost is recognized over time, with the accrual
steadily increasing on a compounded basis.
The following is principle followed by one of the Telecom companies related to Asset Retirement Obligation (ARO) for the reference to the reader.
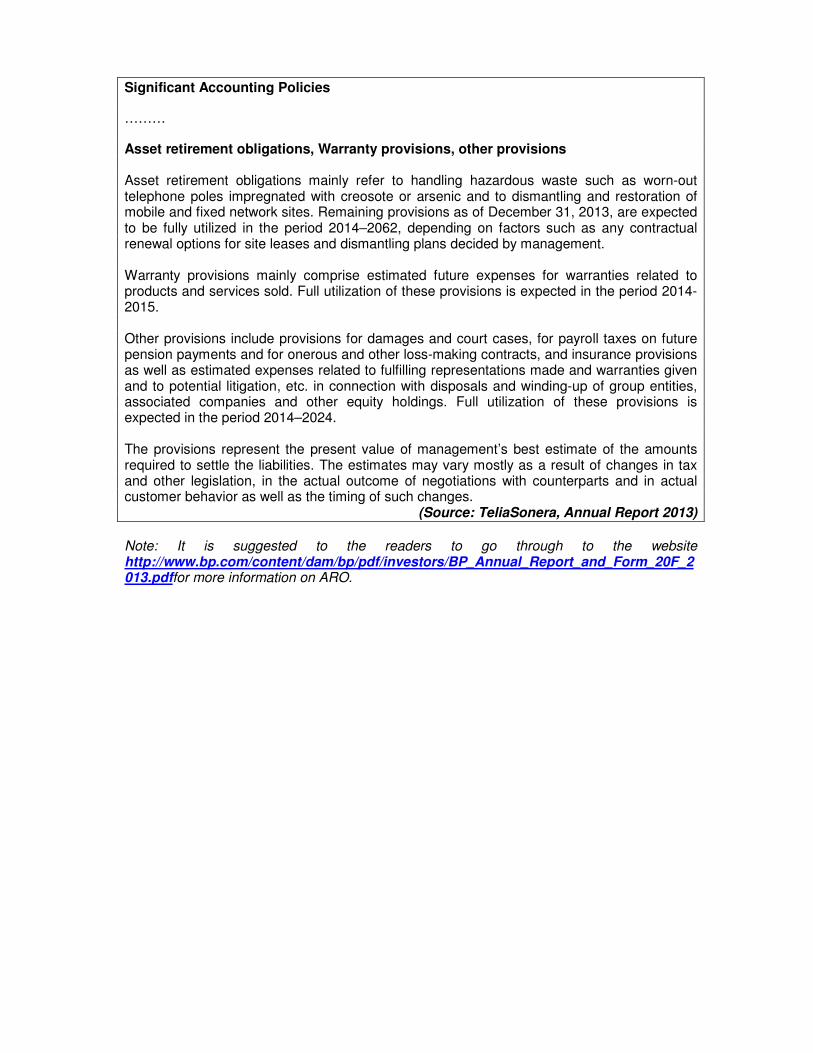
Significant Accounting Policies
………
Asset retirement obligations, Warranty provisions, other provisions Asset retirement obligations mainly refer to handling hazardous waste such as worn-out telephone poles impregnated with creosote or arsenic and to dismantling and restoration of mobile and fixed network sites. Remaining provisions as of December 31, 2013, are expected to be fully utilized in the period 2014–2062, depending on factors such as any contractual renewal options for site leases and dismantling plans decided by management. Warranty provisions mainly comprise estimated future expenses for warranties related to products and services sold. Full utilization of these provisions is expected in the period 2014-2015. Other provisions include provisions for damages and court cases, for payroll taxes on future pension payments and for onerous and other loss-making contracts, and insurance provisions as well as estimated expenses related to fulfilling representations made and warranties given and to potential litigation, etc. in connection with disposals and winding-up of group entities, associated companies and other equity holdings. Full utilization of these provisions is expected in the period 2014–2024. The provisions represent the present value of management’s best estimate of the amounts required to settle the liabilities. The estimates may vary mostly as a result of changes in tax and other legislation, in the actual outcome of negotiations with counterparts and in actual customer behavior as well as the timing of such changes.
(Source: TeliaSonera, Annual Report 2013)
Note: It is suggested to the readers to go through to the website http://www.bp.com/content/dam/bp/pdf/investors/BP_Annual_Report_and_Form_20F_2013.pdffor more information on ARO.
Chapter 6 Fraud and Revenue Assurance 6.1 Fraud Introduction 6.1.1 Fraud is a constantly evolving, many-facetted phenomenon. When the first analogue
mobile communications networks were launched, weaknesses in the security, particularly the lack of encryption of both the voice channel and the authentication data made the networks susceptible to eavesdropping and cloning. With the change of technology, ingenious ways of fraud are also emerging. As per an estimate, there are more than 200 types of telecom frauds that exist and the number is increasing with the advent of 3G services.
6.1.2 There is a very thin line between fraud and negligence. As far as telecom is
concerned, it may be difficult to establish frauds when mistakes occur in activities like configuration of switches/rate plan in billing system, waivers and adjustments and acquisition of nonpaying subscribers. Fraud in telecom industry may be described as any service obtained without intention of paying. Some common types of frauds in telecommunications industry are discussed in the following paragraphs.
External Frauds Subscription Fraud 6.1.3 Subscription fraud may be of two types. Firstly, connection is obtained by providing
fraudulent documents / information and secondly, after providing the correct documents, a customer uses the network for making NLD/ILD and roaming calls. The fraudsters start building up his credit limit by paying initial bills and as he enjoys the increased credit limit, he makes large number of NLD/ ILD calls with no intention to pay the bill.
6.1.4 For dealing with the first category of fraud, the telecom company should have practice
of verifying the original documents, proper address and credit verification of customers, so that, there is a minimal possibility of committing such frauds. Internal auditors should verify that these practices are rigorously followed by the operational team of the company.
6.1.5 Handling of second category of subscriber fraud poses a great difficulty as there are
no preventive measures and in many cases, the amount due from customers is lower than the cost of recovery and legal actions. But by adopting the following measures, telecom companies may be able to reduce their exposure:
i. Putting adequate de-duping processes (checking of the data base of existing bad
and suspended/ terminated customers) in place to ensure that existing bad suspended/terminated customer do not re-enter into the system by having a new connection.
ii. Evaluation of credit rating of the customers and assigning credit limit and allowing him to keep exposure upto his assigned credit limit.
iii. Efficient dunning policy, so that, the customers are made aware about exceeding credit limit and initiating barring of services in case exposure is above deposit /
credit limit. However, care should be taken by the company that the premier customers are not affected.
iv. Regular monitoring of high usage and exceptionally long duration ILD/NLD calls. v. Regular monitoring of the calls made during odd hours e.g. late night, early
morning calls. vi. There should be clear guidelines for screening of subscription forms and to verify
identity of subscriber. vii. Analysis of undelivered bills even though the payment is being received in respect
thereof. The fraudsters may pay the initial bills with no intention to pay future bills of large amounts.
6.1.6 Further, the regulatory authority has made it mandatory for all operators to verify the
identity of all their prepaid and postpaid subscribers. The internal auditor should evaluate whether the company has adopted requisite practices. They should be more vigilant while verifying the proof of identity and proof of address of the subscribers as the connections taken through fraudulent documents may lead to serious implications in addition to loss of revenue to the company.
Illegal Telephone Exchanges 6.1.7 These exchanges terminate voice over internet protocol (VoIP) International calls over
public switched telephone network (PSTN). Fraudster receives international calls from foreign countries over VoIP (through an ISP). VoIP calls forwarded to desired destinations within country by using switching equipment which may cause loss of ADC charges. Telecom Company may have to pay heavy penalty on detection of such calls by the authorities. Such frauds can be prevented or detected by adopting following measures:
i. Encourage the customers to report the display of local callingnumbers for International calls.
ii. By putting an appropriate configuration of alarms in the FraudManagement System for long duration ILD/NLD calls andanalysis of high usage of suspicious calls.
iii. Implement a system to identify the subscribers of high usage inBTS or nearby BTS,
iv. Subscribers’ verification process to be tightened, v. Analyze the incoming and outgoing call ratios.
6.1.8 Internal Auditor should analyze the reports of Revenue Assurance and Fraud
Management Cell and satisfy himself that the appropriate and timely steps are taken to detect and prevent such frauds.
Cloning of Handsets and SIM Cards 6.1.9 In cloning fraud, the phone's authentication parameters are copied into other
handsets, so that the network believes that it is the original handset that is being authenticated. The telecom company charges the calls to original customer who will obviously deny having made such calls and consequently the telecom company will lose its revenue.
6.1.10 Cloning of Handsets / SIM cards is re-emerging as a significant threat to mobile
operator’s revenues. It allows fraudsters to make high value calls for which the telecom company cannot collect any revenue. In addition, in most cases of cloning, the operator will have to make substantial payments in the form of IUC charges to other telecom companies. Such frauds can be identified by analyzing the call collusion / call velocity and calling pattern.
Credit Card Frauds
6.1.11 Many telecom companies accept e-payments and credit card payments. A fraudster may make payment by using a third party credit card number and three digit Card Verification Value (CVV)number. Subsequently, original card holder may refuse to pay the amount, claiming that he has not used the credit card. In such scenario, the credit card company may charge back the amount which may result into loss to the telecom company. The exposure to such type of frauds can be restricted by:
a. Putting a limit on number of swipes in a given time frame. b. Specifying the limit on the maximum of amount of payment which can be made
through credit card. c. Monitoring of payments of multiple bills using same credit card. d. Monitoring that batch closures for the credit cards by which credit card company
makes payment is done timely and such batch closure report to be scrutinized for identification of frauds.
Premium Rate / Value Added Services related Frauds 6.1.12 Telecom Companies are providing Premium Rate Numbers (i.e. 52222, 59999, 57777
etc.) to their customers for value added services, wherein, all calls are charged at a very high rate. Content provider for Premium Number Service is entitled for revenue share on the basis of the number of incoming calls. In such a scenario, a content provider may try to get the maximum number of calls using all tactics e.g. content provider may obtain another number with fraudulent documents / information with no intention to pay the bill and will make calls to Premium Rate Number for getting higher revenue.
This can be detected and prevented by monitoring the activities of Premium Rate
Services, traffic pattern and CDR's of Premium Rate Numbers. Internal Frauds Dealer Fraud 6.1.13 A telecom company appoints dealers, distributors, channel partners for various
business activities such as acquisition of customers, collection of bills, etc. These channels will get commission/incentives on the basis of different slabs for total number of new acquisitions / connections, collection targets achieved, etc. On the other hand they are penalized for not achieving the collection targets. Sometimes to maximize commission/ incentives or to avoid penalties these channels may use fake documents for acquisitions of customers or may make fake entries for collection of bills. They may delay deposit the amount collected. This can be detected by having:
i. Effective implementation of guidelines issued for screening of subscription forms and verification of identity and address of subscriber.
ii. Robust process for timely bank reconciliation of collectionsmade. iii. Review of channel partner’s profitability and policies on anongoing basis. iv. Incentives/commissions policy can be structured in such amanner that it will
not encourage the malpractices bypenalizing the Channel Partners in addition to non-payment ofcommission.
Wrong Configuration in Operating Systems 6.1.14 Telecom Company has to configure various data, such as subscriber data, tariff plans,
Call charges, in the various operating systems like switches, billing system, etc. The bills are generated after matching of entire data in these operating systems. The employee of Telecom Company may fraudulently modify the data, i.e. they may configure the switches in such a manner that the CDR is not generated for particular Number(s) or they may configure/modify the different tariff plan etc. This can be detected by effective monitoring of configuration of tariff plans and exceptional reports of billing systems/ switches etc.
Telecom Related Business Risks 6.1.15 The telecom industry is exposed to various business risks due to the following
reasons: i. Fast pace of growth of the telecommunication industry; ii. The enormous data being generated and handled due to large subscriber base; iii. The revenue per subscriber is very low due to which cost of collection of revenue
is higher; iv. Fast changing technology; dearth to keep ahead on innovative technology; v. Fierce competition amongst all the Telecom Service Providers; vi. Catering to the varying customer needs in the global marketplace; vii. Geographical wide spread of the subscriber base.
Every telecom company therefore needs to have an effective Enterprise Risk
Management framework in place for enhancing business performance by:
a. Identifying and managing strategic, operational, financial, compliance and financial reporting related risks on a real time basis across the enterprise;
b. Institutionalizing and embedding the risk assessment, mitigation and monitoring processes across and within the enterprise; and
c. Strengthening Corporate Governance mechanism to enhance stakeholder’s value. Clause 49 of the listing agreement requires that all companies should have an effective Enterprise Risk Management framework in place.
6.1.16 Some of the business risks relevant to telecommunication business in general are as
follows
i. Allocation of Spectrum by Government is one of the biggest risk persisting in the telecommunication business. If the required spectrum is not allocated, operators may not be able to provide innovative value added services;
ii. Since the volume of data is very large, there may be limitations of existing IT systems to support new service offerings.
iii. Due to enormous volume of data, the telecom fraud management system and revenue assurance system may not be adequate. As per a survey carried out by Subexazure, theaverage fraud loses have risen to 4.5% of the turnover in 2007as against 2.9% in 2006.
iv. Inadequate disaster recovery / business continuity policy andprocesses. The capital cost of having a parallel disasterrecovery system is very high.
v. Due to abnormally large volume of data, the data archival and retrieval processes may not be adequate.
vi. Establishment of an enterprise wide IT risk management program to identify, monitor and mitigate risks to IT infrastructure.
vii. The data is handled at various levels and by various outside agencies such as franchisees, channel partners, collection agencies etc., hence it is very difficult to maintain business information security.
viii. There are challenges in respect of customer service and timely complaint resolution. These challenges are resulting into customer dissatisfaction. This ultimately results into impacting company’s image which causes subscribers churn and revenue loss.
ix. Poor information flow from business groups resulting in delay in network upgradation decisions.
x. Internal scaling of operations may fall short of market demands thereby cause loss of potential revenue.
xi. Inaccurate estimate of the demand for network service and inability to continuously optimize standard specifications for passive infrastructure to reduce capital expenditure.
xii. Revenue leakages from postpaid, prepaid, interconnect and roaming billing systems may not be identified and plugged timely.
xiii. Revenue growth may lag substantially behind the subscriber growth, due to progressive reduction in Average Revenue Per User (ARPU).
xiv. Time to configure new products in the systems may be higher than the other operators, leading to delay in launching new products.
xv. Obtaining Right of Way (ROW) permissions for laying the cables particularly for last mile connectivity in respect of wire line business in metropolitan and other towns, is a challenge.
xvi. Due to involvement of various agencies and performance pressure, the subscriber’s documents may not be genuine thereby violating the regulatory guidelines and also result in loss of revenue to the company.
xvii. The acute shortage of skilled manpower in telecom industry. xviii. Telecom industry is also witnessing a very high employeeattrition.
6.2 Revenue Assurance and Leakages 6.2.1 The areas covered under revenue assurance review would inter alia include the review
of processes related to Call Data Record (CDR) generation, CDR processing, rate plan configuration, billing and rating for prepaid, postpaid, roaming, IUC and VAS revenue streams. Determination and recognition of revenue in case of Telecom Company is not simple. In telecom industry, revenue is earned on the basis of number of minutes services used (MoU).
There is no single rate for applying to number of minutes services used. There are
number of tariff plans which are configured in system and the customers are billed as per the plan applicable to them. The revenue is generated on the basis of CDR which a record is containing information relating to a single call. It contains the information such as caller number, called number, duration of call, place of origin, and destination, etc. In a broader way, the revenuecan be determined, assured and recognized by adopting the steps enumerated below.
6.2.2. When a call is made, it is transmitted to the nearest ‘Switch’ of the telecom operator,
so that, it identifies the calling number and destination (called number) and routes the call as per the predefined rules. Switch identifies the call and differentiates postpaid and prepaid subscribers and also the type of calls. Prepaid calls are diverted to the prepaid billing software first to find out whether subscriber is eligible to make a call and subsequently for rating of CDRs as per prepaid tariff plans and necessary adjustments in the customers talk time balance. Postpaid CDRs are pooled in the ‘Mediation’ (a call interpreting application) software, for further filtration and chargeable CDRs are sent to billing software in readable form, for rating and generation of bill. The customer data and the applicable tariff plans are pre-configured in the billing software. The bills are generated by matching CDRs with the configured data.
6.2.3 Telecom companies should also analyze the root causes of revenue leakages. Substantial revenue is lost because of the following reasons: -
• Prepaid CDR may be configured as postpaid CDR and vice versa, hence call may be allowed without reducing the balance of prepaid subscriber and not charged in case of postpaid subscriber.
• Prepaid calls may not be charged on ‘Real Time’ basis and the subscriber may get through with the calls without having adequate balance in his account.
• Configuration in ‘Switch’ may be wrong and CDRs may be blocked to be generated.
• Wrong configuration of tariff plans in the Prepaid/Postpaid billing system. • CDRs generated by ‘Switches’ may not be forwarded to the billing system due to
system constraints, such as high volume of data at particular point of time, lack of synchronization between the systems.
• Call duration discrepancies in CDRs between ‘Switch’ and billing system, due to system constraints.
• Chargeable CDRs as per ‘Switches’ may appear as non-chargeable in billing system.
Note This chapter “Fraud and Revenue Assurance” is extracted from the material “Technical Guide on Internal Audit in Telecommunications Industry” issued by The Institute of Chartered Accountants of India (ICAI) in 2008, source: www.icai.org
Chapter 7 Infrastructure Sharing
7.1 Introduction
Telecommunication, being a capital expenditure intensive business, needs huge
investment on year-on-year basis for growth and expansion. It involves significantly
high cost of setting up and maintaining the networks and high execution risks in
installing the active electronics components.
In order to lower the large fund requirements for network deployment, the business in
telecom industry is following infrastructure sharing model. The various telecom service
providers are becoming partners to minimize the duplication of effort and cost, bringing
about significant financial and operational savings and hence better margins.
In few countries like Indonesia, it is compulsory to share infrastructure bandwidth and
in most countries the tower infrastructure business has been regulated. While in
Nepal, we do not have such kind of barriers, the exponential growth has led to the
tower infrastructure business becoming a separate industry in itself, finding keen
takers in new players. In Global perspective, most telecom companies have de-
merged the tower infrastructure business from the main telecom business.
7.2 Constituents of a Mobile Network
• Active Infrastructure
The key components include the base tower station, the spectrum, microwave radio
equipment, antennas, switches, transceivers etc. (ICRA, 2009)
• Passive Infrastructure
The key components include the antenna mounting structures, base tower station
shelter, power supply, invertors and generators, battery bank, air conditioner, fire
extinguisher, security cabin etc. (ICRA, 2009)
• Backhaul
This part of the network consists of the intermediate links that transfer data and
voice traffic from a remote site to a central site. (ICRA, 2009)
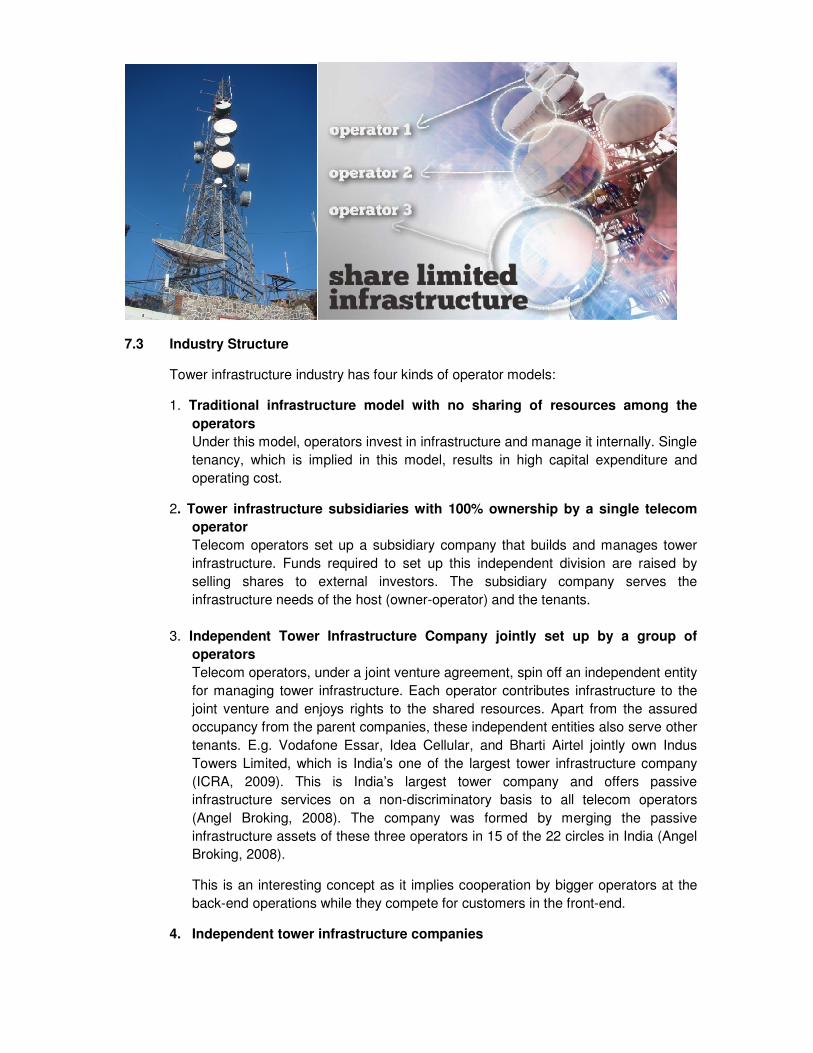
7.3 Industry Structure
Tower infrastructure industry has four kinds of operator models:
1. Traditional infrastructure model with no sharing of resources among the
operators
Under this model, operators invest in infrastructure and manage it internally. Single
tenancy, which is implied in this model, results in high capital expenditure and
operating cost.
2. Tower infrastructure subsidiaries with 100% ownership by a single telecom
operator
Telecom operators set up a subsidiary company that builds and manages tower
infrastructure. Funds required to set up this independent division are raised by
selling shares to external investors. The subsidiary company serves the
infrastructure needs of the host (owner-operator) and the tenants.
3. Independent Tower Infrastructure Company jointly set up by a group of
operators
Telecom operators, under a joint venture agreement, spin off an independent entity
for managing tower infrastructure. Each operator contributes infrastructure to the
joint venture and enjoys rights to the shared resources. Apart from the assured
occupancy from the parent companies, these independent entities also serve other
tenants. E.g. Vodafone Essar, Idea Cellular, and Bharti Airtel jointly own Indus
Towers Limited, which is India’s one of the largest tower infrastructure company
(ICRA, 2009). This is India’s largest tower company and offers passive
infrastructure services on a non-discriminatory basis to all telecom operators
(Angel Broking, 2008). The company was formed by merging the passive
infrastructure assets of these three operators in 15 of the 22 circles in India (Angel
Broking, 2008).
This is an interesting concept as it implies cooperation by bigger operators at the
back-end operations while they compete for customers in the front-end.
4. Independent tower infrastructure companies
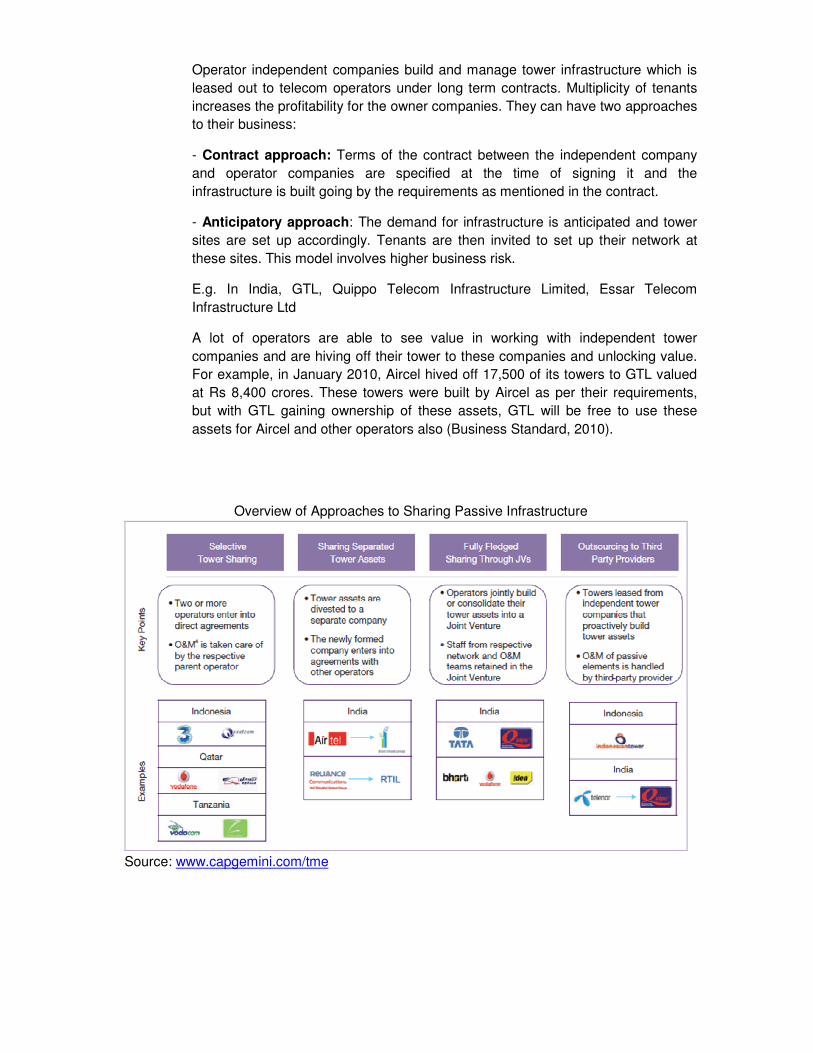
Operator independent companies build and manage tower infrastructure which is
leased out to telecom operators under long term contracts. Multiplicity of tenants
increases the profitability for the owner companies. They can have two approaches
to their business:
- Contract approach: Terms of the contract between the independent company
and operator companies are specified at the time of signing it and the
infrastructure is built going by the requirements as mentioned in the contract.
- Anticipatory approach: The demand for infrastructure is anticipated and tower
sites are set up accordingly. Tenants are then invited to set up their network at
these sites. This model involves higher business risk.
E.g. In India, GTL, Quippo Telecom Infrastructure Limited, Essar Telecom
Infrastructure Ltd
A lot of operators are able to see value in working with independent tower
companies and are hiving off their tower to these companies and unlocking value.
For example, in January 2010, Aircel hived off 17,500 of its towers to GTL valued
at Rs 8,400 crores. These towers were built by Aircel as per their requirements,
but with GTL gaining ownership of these assets, GTL will be free to use these
assets for Aircel and other operators also (Business Standard, 2010).
Overview of Approaches to Sharing Passive Infrastructure
Source: www.capgemini.com/tme
7.4 Why Infrastructure Sharing?
The telecom industry today is moving towards infrastructure sharing for a variety of
reasons and passive infrastructure forms a very important part of the same. At present
the capital cost required for active infrastructure is around 60% while that of passive
infrastructure is 40%. However, the prices of land, steel and cement are going up,
while those of electronic components are decreasing, leading to steep expected rises
in cost requirements (ICRA, 2009).
Costs are expected to rise even further in future, as penetration into rural areas
occurs. Issues such as higher cost of land development, insurance costs, power cuts
and lack of infrastructure will come to the fore. At the same time, more number of
towers will be required to cover the same number of people since population is more
dispersed in rural and semi-urban areas. Further, various clearances are needed
before the tower and active infrastructure are set up and ready for use. Given the rapid
changes in technology, often the high cost of existing infrastructure is not even
covered before operators have to pilot onto newer generations. Sharing will enable
faster rollouts and reduce the risk of redundancy. This will prove especially beneficial
for new players entering the market. Passive sharing will enable operators to convert
their high capital expenditures into operating expenditures which they can defer over
extended rental times. It will enable management to save time and focus on their core
tasks.
If an operator has already set up the infrastructure for a cell site, it can easily be
leased out, creating a source of income. The tower business can become a profitable
one by itself, rather than just serving as a by-product for cost cutting. Sharing also
provides various benefits to end-consumers in terms of reduced costs and increased
availability of telecom services across wider geographies.
7.5 Environmental and Health issues
Apart from the aforementioned benefits, various social benefits can be achieved
through infrastructure sharing. In developing countries, increased telecom penetration
can spread tele-education and health awareness. At the same time, sharing can
provide various environmental virtues in the form of reduced infrastructure, energy
requirements and carbon emissions.
With the need to improve coverage and achieve deeper penetration, the number of
telecom towers is growing at a rapid rate. In this light, people have become worried
about the health hazards caused by these towers.
Roof top towers (RTTs) are especially cropping up above homes and buildings in
congested residential areas, and this is matter of grave concern to citizens. There
have been complaints about the noise caused by standby generators, lack of public
safety and altering of the city landscape. But more importantly, there are growing
concerns over the carcinogenic nature of emissions by these towers. These towers
emit radio frequencies (RF) up to a distance of 2-3 miles, which although below
acceptable international standards, are speculated as being extremely harmful for
human beings, especially children, the elderly people, and pregnant women.
Even at low levels of radiation, studies have shown evidence of genetic mutations,
brain tumors, cancer and Alzheimer’s disease, among many others. Recently, some
Ghanaian scientists have claimed that these radiations are harmless. WHO too, has
said that thousands of studies conducted by the WHO across the world have shown
no link between human health and exposure to RF radiation. Nonetheless, vehement
debate is still on as to the validity of the studies (WHO, 2006).
However, the RF waves are definitely known to cause interference with electronic
equipment and thus need to be placed away from hospitals, laboratories and
research institutes (SignIndustry.com, 2004).
7.6 Indian Experience
Passive sharing has been allowed in the telecom sector of India since a long time. In
February 2008, the DoT approved TRAI’s proposal of allowing active sharing of
infrastructure. This move would enable companies to cut CAPEX by more than 50%
while allowing new players to utilize the infrastructure of existing players, further
reducing tariffs due to competition. At the same time, it would enable operators to
improve their quality and coverage area without additional capital expenditure, as well
as give them the option of switching their users to different operators in case of
network unavailability. However, until now, the DoT has not allowed spectrum-sharing.
The late acceptance of active sharing in the Indian context was mainly because it
requires a deeper integration amongst operators than passive sharing .The result
could have been significant loss of competitive differentiation among the operators,
discouraging operators from embracing technology and leading to fewer service
offerings for customers.
Co-operating at the ‘back-end’, competing at the ‘front-end’ Infrastructure sharing
involves the sharing of a few or several elements of cellular operators' network
infrastructure. Such arrangements lead to faster roll-out time-frames for newer and
regional operators. Given vast coverage requirements in a country like India, these
operators thus have an urgent need for this. If these operators were to construct their
own towers, there would be several negative consequences:
- It would lead to a significant loss of time and opportunity, given that it typically takes
several months to erect one tower. Each tower often needs up to as many as 40
clearances from separate authorities like SACFA clearance on detailed technical
evaluation, permission from local authorities, state electricity boards, land owners and
so on. Apart from the hassles in erecting towers, there are issues of loss of time and
hence opportunity loss of subscribers and revenues – more so for new players.
- Apart from the time lost and opportunity loss of subscribers and revenues, the capex
required would be significant, given that such an activity requires vast financial
resources. Apart from this, substantial CAPEX is needed to set up a countrywide
cellular network. A significant part of the network roll-out is likely to come in the as-yet
untapped rural areas, where mobile tele-density is barely in double digits.
Consequently, the cost of expansion will also be greater, given that many rural areas
are typically far-flung, difficult to access, roads are generally not satisfactory, power
supply is erratic (and often non-existent) and personnel are in scarce supply to operate
telecommunication towers. A greater number of ground-based towers will also be
needed in rural areas, thus further increasing the CAPEX requirements. These towers,
depending on their height, typically cost in the region of Rs40-45lakh, as against Rs20-
22lakh for a roof-top tower (ICRA, 2009) (Business Monitor International, 2009).
- The execution risks are significant and in the event of poor execution and roll-out, an
operator would lose further time, money and potential subscribers and revenues, not
to mention the 'sunk costs'.
-On the other hand, for incumbent operators – assuming they open their towers for
other players - it enables them to earn additional revenues from a new source, apart
from improving CAPEX and OPEX efficiencies, leading to freeing up of significant
resources and management time to focus on their core business of branding and
marketing of telecom services and solutions.
A case Study
The Indian telecom tower industry evolved from a 100% operator captive model in
2006 to an 85% operator-independent model as of 2010.
Historically, operators saw captive towers as offering a strategic advantage. The need
for monetization of assets, focus on customer acquisition and efficient CAPEX
utilization lured operators to hive off their tower assets to other entities in order to
secure the advantages of infrastructure sharing.
The change in tower ownership unfolded on the back of a series of action undertaken
by the regulator and the industry. Towards the middle of the last decade, the Indian
telecom regulator laid out the details contours of the regulatory regime governing
infrastructure sharing and the role of independent tower companies. Initially operators
viewed the independent tower model with suspicion, giving the need for high site
uptime and the lack of a proven independent tower company model.
In early 2006, when two independent tower companies proactively built tower sites and
leased these to multiple operators, they overcame this challenge and proved the
efficacy of their model. A few operators then began a carve-out process, setting up
separate divisions that controlled their tower assets. This allowed operators to value
their tower assets in isolation and either bring in financial investors or sell their assets
to independent tower companies. The effectiveness of these steps in releasing funds
for further network rollout and reduction in operating cost without affecting subscriber
acquisition, forced remaining operators to follow the first movers.
Today, the model has evolved to a high level of maturity. Operators focus on
subscriber acquisition and customer service, instead of tower infrastructure operations
and management. Largely because of sharing, operators managed EBITDA margins in
the range of 25% to 35% in 2010. For operators in India, tower sharing came at the
right point of heavy competition where the ARPM dropped from 0.01USD to 0.005
USD.
Similarly, independent tower companies have focused on passive infrastructure
through innovative process management, ensuring cost-effective high uptime for the
tower sites. On the back of successful hosting of multiple tenants on their sitesand
costefficient operations, independent tower companies enjoy EBITDA margins in
excess of 50%.
To conclude, the Indian telecom tower industry offers several interesting perspectives
to countries wanting to replicate their model of cost-effective service rollout.
Understanding these perspectives and the strategic planning for implementing them
can immensely aid the transition from an operator-owned to an independent-owned
model.
(Source: www.kpmg.com)
7.7 Factors driving Infrastructure Sharing
Driven by Cost dynamics, a PAT driver, Service provider margins are likely to come
under significant pressure on account of multiple factors:
- Falling ARPUs due to rural expansion
- Declining elasticity of demand thus making MoUs less responsive to a change in
tariffs
- Slowing revenue growth
- Heightened competitive intensity
- Higher network expansion costs
- Higher spectrum charges
Thus, factors on both the revenue and cost fronts are likely to adversely impact the
margin profile.Thus, it would be hugely beneficial for new operators to share sites with
existing operators who already have a presence in a particular service area.
Further, market conditions that make tower sharing more likely are following”
- Mature Networks: Network maturity is a very important aspect that drives tower
sharing. In countries where the war to gain a customer is still being fought on the
grounds of better network coverage, operators will not be willing to share tower
assets as it would mean giving away the advantage of a wider / better network.
- Growing market: Growing market mean an ever-increasing need to expand
network for the operators. If operators have the ability to share towers, they will
typically be able to roll networks out much faster.
- High cost regional / rural areas still being rolled out: Operators tend to have a
rollout obligation as part of their licenses. This could mean several unprofitable
investments as certain sparsely populated rural areas might need every operator
to set up a network. Tower sharing can be a good option for such rollouts as all
operators can rely on a single set of infrastructure for their network.
- New entrants looking to build scale: As towers take time to build; new entrants
can increase their speed of network rollout by sharing towers with existing
operators.
(Source: www.kpmg.com)
7.8 US market experience
In developed telecom markets such as the US, the infrastructure sharing concept is
mature and it is one of the few markets globally where infrastructure sharing has
succeeded. In this market, a majority of the towers (around 60%) are owned by
independent tower companies such as American Tower, Crown Castle International
and SBA Communications whereas just 12% of the towers are still owned by wireless
operators like AT&T, Verizon and T-Mobile USA. The remaining 28% are leased by
leading operators such as AT&T, Verizon to other operators (WikiInvest, 2010). In
complete contrast to this, in India, over 90% of the total telecommunication towers are
owned by telecom operators. Thus, in this sense, the Indian Telecom Infrastructure
Market is fairly unique.
The US market has approximately 2.15 lakh sites available for sharing and occupancy
rates are upwards of 2x in that market. Companies like American Tower have
recorded strong growth rates in revenues and EBITDA, with margins at impressive
levels of nearly 70%. This market has numerous similarities with other telecom
markets in terms of characteristics. Markets are highly competitive, with the presence
of multiple operators and with the top 4-5 operators commanding a majority of
subscriber market share. Large coverage requirements are also there in the US
market, thus necessitating a greater degree of site sharing between operators. Apart
from this, pricing and margin pressure exist in both markets, with high MoUsalso a
feature.
7.9 Infrastructure Sharing Regulation
Infrastructure-sharing regulation has proven to be a critical lever contributing to the
growth of the telecom sector. Operators should closely examine the economic benefits
and develop their internal positions on the subject. Regulators, on the other hand,
should encourage infrastructure sharing and issue necessary policies to ensure
effective adoption and alignment by competing operators. Both fixed and mobile
operators should consider infrastructure sharing as a medium to save costs and focus
more attention on customer-facing activities, in which innovation and differentiation are
the main competitive advantages. In the longer term, traditional operators could
leverage infrastructure sharing as a new vehicle for growth. This could be achieved by
structurally separating all or part of their network assets or spinning out network
provider companies. A trend in this direction is starting to materialize in Europe, where
both British Telecom in the UK and TeliaSonera in Sweden have already adopted
separation models. Talks about potential infrastructure separation ventures are also
underway in France, Italy, and New Zealand. This trend is expected to further develop
as regulatory pressures, the deployment of IP-based next-generation networks,
service integration and convergence, and the emergence of disruptive, service based
business models are leading to the commoditization of basic telecom services.
Telecom operators and traditional operators will be faced with a strategic choice:
Concentrate on high-value retail business or focus on wholesaling facilities services.
Regulators should carefully consider what infrastructure-sharing forms to mandate.
Passive network components are more commonly shared and are considered a good
starting point for infrastructure sharing obligations. Many obstacles prevent operators
from growing the number of passive components in their networks—such as high
property prices and continuously increasing construction costs—and it is becoming
increasing difficult to obtain permits to erect towers and masts. This approach can be
facilitated by encouraging the use of professional tower- and site management
companies as trusted independent entities to manage such infrastructure on behalf of
operators in the market.
Regulators should introduce necessary safeguards and enforcement tools. To ensure
compliance and successful adoption of infrastructure-sharing obligations, regulators
should assess and communicate the overall benefit of infrastructure sharing and ready
themselves to resolve eventual disputes.
(Source: Booz and Company)
7.10 NTA Interconnection Guidelines 2065(2008)
Clause 18 of the Interconnection Guidelines 2065 briefly mentions about Infrastructure
sharing. A licensee who controls telecommunications systems and
telecommunications networks used to support the provision of telecommunication
services shall allow other licensees to jointly use the same telecommunication systems
and telecommunication networks, at cost based prices and on non-discriminatory
terms and conditions to be mutually agreed by the licensees involved, provided it has
the capacity to do so.
A licensee may include as part of the interconnection agreement access to and shared
use of physical space at the premises and facilities of the licensees including but not
limited to buildings, land, ducts, pipelines, equipment, installations and wires.
Clause 16 of the Guidelines has fixed charges for following infrastructure:
i. Port Charge:
It is the charge payable by the interconnection seeker to the interconnection
provider.
Per year Port charges on pro rata basis (Rs.): N*35,000, where N is the no. of
E1s.
ii. Transmission Lease Charge for STM-4:
Rs. 600,000 per year per Kilometer on pro rata per E1 basis.
iii. Set up charge: Rs. 200,000 per Location.
7.11 Accounting Considerations
The accounting treatment for infrastructure arrangements would depend on the model
applied and the structure of the transaction. Accounting for these arrangements could
be complex and a detailed analysis of the substance of the arrangement is required.
Operators could:
• Retain the infrastructure assets on their books (typically if risks and rewards of
ownership are retained)
• De-recognize the infrastructure assets (typically if risks and rewards of ownership are
transferred to the third-party tower company)
• Recognize a portion of the assets (typically if there is joint control over the asset).
The potential accounting implications for the different models is discussed below.
Third-party vendor Tower Company
Under this model, operators sell their passive network infrastructure towerto
independent third-party Tower Company. Then, the operator ‘leases’allocated tower
slots from the tower company based on its operational needs. Alternatively,
independent third-party vendors construct the passive infrastructure and lease
allocated tower slots to operators. The accounting treatment varies depending on
whether the arrangement between the operator and tower company is legally
structured as a lease, contains a lease element or is for the rendering of services. The
contract contains a lease element (and the parties are required to account for all or a
portion of the arrangement as a lease) if the arrangement is dependent on the right to
use a specified asset as per IFRIC 4: Determining whether an arrangement contains a
Lease. A key issue in assessing whether the arrangement is dependent on a specific
asset is whether the space leased on the towers is considered a separately identifiable
asset or not. Where the space is a separately identifiable asset, this is a separate unit
of account. It is treated as a lease as long as the arrangement is also dependent upon
the right to use the applicable asset as per IFRIC 4.
Where the right to use the space cannot be separated from the physical infrastructure,
and does not represent a separate unit of account, these arrangements would typically
be accounted for as service contracts.
Lease accounting
Where the arrangement is accounted for as a lease, (even where it is not structured as
a lease) the accounting treatment for the operator and the third-party tower company
is driven by whether the lease is classified as a finance lease or an operating lease. A
key determinant in the accounting is who bears the risks and rewards of the
infrastructure assets or a portion thereof as per IAS 17: Leases. Finance leases are
distinguished from operating leases because finance leases transfer all the risks and
rewards incidental to ownership to the lessee.
Where the arrangement is accounted for as a finance lease, the lessee would
recognize a Finance lease liability at the present value of future lease payments or fair
value of the assets (whichever is lower). This will result in a gross-up on the statement
of financial position, due to recognition of infrastructure assets as property, plant and
equipment and the finance lease as a liability, and may affect certain ratios.
In a finance lease arrangement, the third-party tower company would reflect a lease
asset, being the receivable from the operator.
Service Arrangements
Service arrangements are accounted for in a manner similar to operating leases. If the
contract is considered to be a service arrangement, income or expenses are typically
treated as operating income/expenses as per IAS 18 Revenue.
Operating and maintenance (O&M) related payments included in the arrangement
might be priced separately or included in lease payments. These O&M payments
should be accounted for separately from the lease (regardless of how structured). This
separation is usually done by reference to the relative fair values of each element as
per IFRIC 4.
Transfer to a separate entity
Under this model, two or more operators enter into an arrangement to transfer their
existing towers to a newly formed or existing entity, or other operation. The operators
may establish a relationship over the newly formed or existing entity or operation.
Accounting by the operator

The operator should determine whether it has control, significant influence or joint
control over the new or existing entity as envisaged in IAS 27, 28, 31. The operator
may also be deemed to control the tower entity where it is a special purpose entity
(SPE), and in substance, the operator has control over the SPE as per SIC 12:
Consolidation – Special purpose entities.
In the consolidated financial statements of the operator, transactions with the tower
entity, whether in the form of leases or rendering of services, should be eliminated on
consolidation or equity accounting, as appropriate, depending on the interest in the
separate entity. The lease and revenue accounting principles discussed under the
preceding model will apply to any lease or service arrangement entered into between
the operator and separate entity. There may be certain limits on disposal gains
recognized by the operator on assets transferred to a separate tower entity.
(Source: www.kpmg.com)
Chapter 8 Major Key Performance Indicators (KPIs)
Telecommunication service industry around the world is facing significant challenges from competition, technological revamps at very short frequencies and never-ending customer demands. In full-grown markets, the preferred path to growth is that of acquisition of competitors or alliance with newer partners. On the other hand, promising markets with explosive demand provide vast opportunities for the players.
Customer satisfaction and marketing intelligence with innovative promotional schemes and advanced technology are the drivers of business. Also, cutthroat competition and huge investments in the telecom industry churn away profit margins and make intelligent decision making critical. And how do Chief Executives make decisions? Through KPI monitoring, control and analysis.
As in the rest of the industries, a performance indicator or key performance indicator (KPI) is a measure of performance. Such measures are commonly used to help an organization define and evaluate how successful it is, typically in terms of making progress towards its long-term organizational goals.
Some of the major KPIs are explained below;
8.1 Subscribers (Subs) The total number of customers are the subscribers of Telecommunication Operator.
The subscribers can be analyzed in terms of total subscribers, prepaid subscribers or postpaid subscribers. Subscriber per employee is another KPI.
8.2 Active Subscriber Ratio This KPI is calculated to find the quality of subscribers using the network of an
operator and is computed as:
Active Subscriber ratio= Active subscribers/Registered subscribers* 100
Through this KPI, subscribers' behavior of using the company service/length of stay can be analyzed. Higher ratio is a sign of longer subscription to the network reflecting more satisfaction of subscribers.
8.3 Churn
Churn is the total gross customer disconnections in the particular period divided by the average total customers in that period. It means switching over by the subscriber from one Telecommunication Operator’s network to another operator’s network or from one plan to another plan of the same operator. Various attractive packages and schemes offered by the operator may prevent the churn rate.
8.4 Minutes of Usage (MOU)
Minutes of Usage (MoU)is the total duration of usage of the network of Telecommunication Operator by a customer, during the particular period in minutes. MOU can be analyzed categorizing;
- the incoming and outgoing minutes
- prepaid and postpaid customer minutes of usage - number of SMSs - number of MMSs
8.5 Revenue
Revenue of a Telecommunication Operator, which shows the business strength or weakness, could be voice, data, interconnect, roaming, Value Added Service (VAS) revenue etc and booked as net of rebates and discounts, if any. An analysis of detailed breakdown of the product and service determines the strength and weakness of the Telecommunication Operator.
8.6 Average Revenue per User (ARPU)
Average Revenue per User (ARPU) is the net revenue earned by the Telecommunication Operator during the particular period divided by the number of subscribers/users for that period. While calculating ARPU, revenue includes the rental revenue, airtime revenue, VAS revenue and all other revenue as reduced by activation revenue (connection revenue) and handset revenue, if any. Further, ARPU can be calculated separately for prepaid and postpaid subscribers.
Analysis of ARPU of different segment of subscribers can help prioritize the needs of particular segments while designing future services and products.
8.7 ARPM (Average Revenue per Minute)
Average Revenue per Minute (ARPM) is the total revenue generated by the Telecommunication Operator divided by the total minutes of usage by the subscribers. This is the blended tariff, which the operator provides through various tariff structures. Generally, the tariff structure for prepaid and postpaid subscriber may be different but RPM gives the average rate of both the services.
8.8 Coverage
This is another KPI which determines the area covered by Telecommunication Operator in terms of population, town, geographical location, number of countries operating entity etc.
8.9 Market Share
Market share is the one which shows the chunk of share, a particular Telecommunication Operator is occupying, in the entire Telecommunication industry. Market share can be subscriber market share, revenue market share and minutes market share.
8.10 Subscriber Acquisition Cost (SAC)
This is the cost incurred by the Telecommunication Operator to acquire the subscriber. The cost could be dealer commission, terminal subsidy, sales, marketing, distribution cost.
High SAC is required in a very competitive market as well as in developed market where the penetration is already atoptimum level. In emerging markets, where penetration of subscription is at low level, operators can acquire new subscribers with low SAC.
8.11 Financial KPIs
8.11.1 Gross Profit (GP) Margin
Gross Profit is the gross profit generated after deducting revenue from cost of goods sold. Gross Profit Margin is calculated by dividing Revenue less cost of goods sold by revenue.
8.11.2 Earnings before Interest, Depreciation, Tax and Amortization (EBITDA)
EBITDA margin is the earnings of Telecommunication Operator which is measured in terms of total revenue. Total operating revenue less operating cost is EBITDA. In situation of economic downtown, this KPI is important.
The latest worldwide average of the EBITDA Margin of the operators in the telecom industry is 36.01%.
8.11.3 Cost above EBITDA line
Cost above EBITDA line are the expenditures needed for day to day operation of the business which are independent of financing structure. Proper classification of expenditure of an operator helps inunderstanding the cost structure, which can be used as a tool for planning, restructuring of new cost model or for introducing cost efficiency/cost saving measures in the operation of regular business.
Standard classification in telecommunication industry for the costs above EBITDA are operating expenditures (OPEX), sales and marketing expenditures (S&M) and general and administrative expenditures (G&E).
OPEX refers to the operating expenditures of telecom network infrastructure such as core network, billing, siterental, electricity, maintenance and transmissions related expenses.
Sales and marketing expenses are reported as separate category to learn the amount spent for sales and marketing activities, promotion for the company.
These expenses show the level of activity in the market for acquisition of new customers and retention programs of the company.
8.11.4 Cost below EBITDA line
Costs below the EBITDA line refers to interest expense, allocated cost of depreciation/amortization for the period out of capital expenditures and corporate tax on profit. Correct reporting of costs below EBITDA line helps in understanding of the impact of financing structure to company's profitability (interest), timely capitalization of the company assets whenever they are available for use (depreciation).
8.11.5 CAPEX to Sales ratio
CAPEX/Sales ratio refers to the percentage of capital expenditure of net sales.
Telecommunication industry requires continuous expansion and capacity enhancement of network infrastructures and development of platform for new services. To optimize the capital expenditure investment in the company, it is very wise to link the investment level with expected sales. Normally 11-13 percent of CAPEX/sales is considered as optimized investment level in telecom industry.
The latest worldwide average of the CAPEX/Sales ratio of the operators in this industry is 15.11 percent.
8.11.6 Profit after Tax (PAT)
The net amount earned by an entity after deduction of all expenses including taxes is the Profit after Tax (PAT). PAT Margin is the net income after all expenses divided by revenue.
8.11.7 Return on Capital Employed (ROCE)
A financial ratio that measures a company's profitability and the efficiency with which its capital is employed. Return on Capital Employed (ROCE) is calculated as: ROCE = Earnings Before Interest and Tax (EBIT) / Capital Employed
8.11.8 Free Cash Flow
A measure of financial performance calculated as operating cash flow minus capital expenditures. Free cash flow (FCF) represents the cash that a company is able to generate after laying out the money required to maintain or expand its asset base.
8.11.9 Capital Productivity
This KPI measures the productivity of the company. Revenue divided by Gross CAPEX is the way of calculating the Capital Productivity.
8.11.10 Price Earning (PE) Ratio
The P/E ratio is equal to a stock’s market capitalization divided by it’s after tax earnings over a period of twelve period.
8.12 Penetration
Penetration is the number of total subscribers of Telecommunication companies as a percentage of population. Penetration can be analyzed under different categories of services like voice penetration, data penetration etc. Market penetration in case of developed countries is high compared to developing countries.
More than 66 percent of total world population is penetrated with access and subscription of mobile phones.
8.13 Quality of Service related KPIs
8.13.1 Call setup time
The overall length of time required to establish a circuit-switched call between users. For data connection, the overall length of time required to establish a circuit-switched call between terminals is the call setup time.
8.13.2 Call setup success rate (CSSR)
The call setup success rate (CSSR) is the fraction of the attempts to make a call that result in a connection to the dialed number (due to various reasons not all call attempts end with a connection to the dialed number). This fraction is usually measured as a percentage of all call attempts made.
8.13.3 Congestion
Congestionrefers to a network state where a node or link carries so much data that it may deteriorate network service quality, resulting in queuing delay, frame or data packet loss and the blocking of new connections. In a congested network, response time slows with reduced network throughput. Congestion occurs when bandwidth is insufficient and network data traffic exceeds capacity.
8.13.4 Dropped Call Rate (DCR)
The dropped-call rate (DCR) is the fraction of the telephone calls which, due to technical reasons, were cut off before the speaking parties had finished their conversation and before one of them had hung up (dropped calls) This fraction is usually measured as a percentage of all calls.
Chapter 9 Major Services Provided by Telecommunication Operators
Traditionally, voice service was the main service of Telecommunication Operator. With the passage of time and advancement of technology, data service is also becoming important during recent days. Various types of services offered by Telecommunication operators are described below. 1. Broadband Services
Many telecom companies are providing broadband services in addition to the normal voice telephony. Broadband may be defined as “An ‘always-on’ data connection that is able to support interactive services including internet access and has the capability of the minimum download speed of 256 kilobits per second (kbps) to an individual subscriber from the Point Of Presence (POP) of the service provider intending to provide broadband service where multiple such individual broadband connections are aggregated and the subscriber is able to access these interactive services including the internet through this POP. The interactive services will exclude any services for which a separate license is specifically required, for example, real-time voice transmission, except to the extent that it is presently permitted under ISP license with Internet Telephony.”
The broadband business is divided in two segments as follows: (a) Voice; and (b) Data. Various products / services covered under Broadband have been discussed in the following paragraphs:
2. International Private Leased Circuit (IPLC)
IPLC is a point-to-point data service solely dedicated for business needs. Since the customer gets dedicated bandwidth, he is assured of complete security and privacy incommunication. This service entitles a high-speed connectivity - 24 hours a day, anywhere in the world via submarine cable or satellite.
3. Internet Leased Lines Internet Leased Line is a high-speed internet solution for organizations with large communication and information requirements. It provides effective internet access tailor-made according to the specific needs, from anywhere in the world.
4. Managed Data Network
The diverse and complex communication requirements of today have created the need for a highly efficient and intelligent wide area networking solution that runs uninterruptedly at all times. Managed Data Network Service based on Frame Relay technology is used to meet this growing need. Frame Relay technology is a managed end-to-end solution that provides a high performance integrated data network created to meet businesses' mission critical applications as well as the bandwidth on demand that most 'bursty' data applications need.
5. Internet Protocol - Virtual Private Network Services (IP-VPN) It provides a seamless and efficient flow of information between an enterprise’s corporate office, its business associates and employees. There are two types of IP-VPN packages:
a) Dial IP-VPN Services Dial IP-VPN services help mobile customers/branch offices to get connected to their corporate network by establishing a tunnel on the existing IP based network so that communication can be done effectively between two parties. The technology requires having a IPVPN concentrator at the customer's premises, which would permit only its authorized clients to access its network securely.
b) Site-to-Site IP-VPN Services This service would bring corporate networks on a cost-effective IP based network so they can communicate with each other anytime, as and when required. In doing so, they would be sharing public data network.
6. Video Conferencing (VC)
Videoconferencing (VC) is the combination of dedicated audio, video, and communications networking technology for real-time interaction, and is often used by groups of people who gather in a specific setting (often a conference room) to communicate with other groups of people.
7. Net Telephony
Making international calls through the net is no longer news of surprise. The convergence of voice, video, fax, and data has revolutionized the world of telecommunications. It is a new technology that will drastically reduce the cost of long distance calls and provide unprecedented opportunities for service providers, resellers, developers and end users. With the help of this technology one can dial through Session Initiation Protocol (SIP) based handset to any SIP based phone or PSTN phone abroad. Multi-location corporates can also substantially save on inter-office telephone call charges / NLD calling charges by subscribing to CUG (calling facility).
8. Integrated Services Digital Network (ISDN)
Integrated Services Digital Network (ISDN) is comprised of digital telephony and data-transport services offered by regional telephone carriers. ISDN involves the digitization of the telephone network, which permits voice, data, text, graphics, music, video, and other source material to be transmitted over existing telephone wires. The emergence of ISDN represents an effort to standardize subscriber services, user/network interfaces, and network and internetwork capabilities. ISDN applications include high-speed image applications (such as Group IV facsimile), additional telephone lines in homes to serve the telecommuting industry, high speed file transfer, and videoconferencing. Voice service is also an application for ISDN.
9. National Long Distance Leased Line National Long Distance Leased Line (NLD LL) is a highspeed solution for enterprises with large communication requirements. NLD leased line service is a dedicated point-to-pointbandwidth, solely dedicated for the customer's business needs. Since the bandwidth is totally dedicated to the customer, the service provides secure, reliable and high-speed connectivity.
10. Public Call Office (PCO) In addition to the revenue from retail and corporate customers, PCO is a major source of revenue for telecom companies. India still has low penetration as compared to other countries. PCO is the most convenient source of communication particularly in rural areas and for the people who cannot afford to subscribe a telecom service. The PCO business is carried out by PCO operators and it has two models, viz. a) Postpaid PCO
Under this model, PCO connection/ Coin collection boxes are given to PCO operator upon payment of predefined security deposit and calls are charged at concessional rates. The PCO operator is to deposit the bill on the due dates.
b) Prepaid PCO Under this model, PCO connection is given to PCO operator generally upon payment
of predefined security deposit. The telecom company provides the telephone instrument and PCO operator has to purchase the PCO Recharge Vouchers from the telecom operator/ dealer to make the calls. It can be of following two types:- i. Normal PCO ii. Coin-collection box
11. Value Added Services (VAS)
The Indian mobile telephony market has grown at a rapid pace in the past six to seven years. Declining call tariffs in conjunction with favorable regulatory policies have lead to a tremendous increase in the subscriber base, crossing the 100 million mark in 2006. While the growing subscriber base has positively impacted industry revenues (which have risen consistently over the past few years), operator margins also have shrunk, pulling down “Average Revenue per User” (ARPU). As ARPU declines and voice gets commoditized, the challenge is to retain customers, develop alternative revenue streams, and create basis for differentiation in high-churn markets. In the wake of changing industry markets, telecom operators are looking at Mobile Value Added Services” (MVAS) as the next wave of growth, and a large chunk of revenues is expected to flow from VAS in the near future. Market growth drivers on the supply side include declining ARPU, brand differentiation needs, and growing focus on entertainment-related content; demand-side drivers include the booming Indian economy, increasing user comfort with basic mobility services, personalization of content and devices and cheaper handsets.
12. Mobile Value Added Services (MVAS) Mobile Value Added Services are those services that are not part of the basic voice offer and are availed separately by the end user. They are used as a tool for differentiation which allows mobile operators to develop another stream of revenue.
Different MVAS Categories are explained below:
a) Mobile Music:Mobile music comprises ringtones, caller ring-back tones, and music
clips.
b) Mobile Gaming: According to the projections, as many as 78.6 mn people will be playing mobile games by 2009, and game downloads will have increased more than tenfold from current levels
c) Mobile Email:Mobile users can send and receive email and hook into corporate
computer networks.
d) Mobile Videos and Animation clips:Indians are crazy about Bollywood movies and music. Today there are 10, 20, and 30 second music video clips available for download and will soon expand to include movie trailers, sports highlights, animation
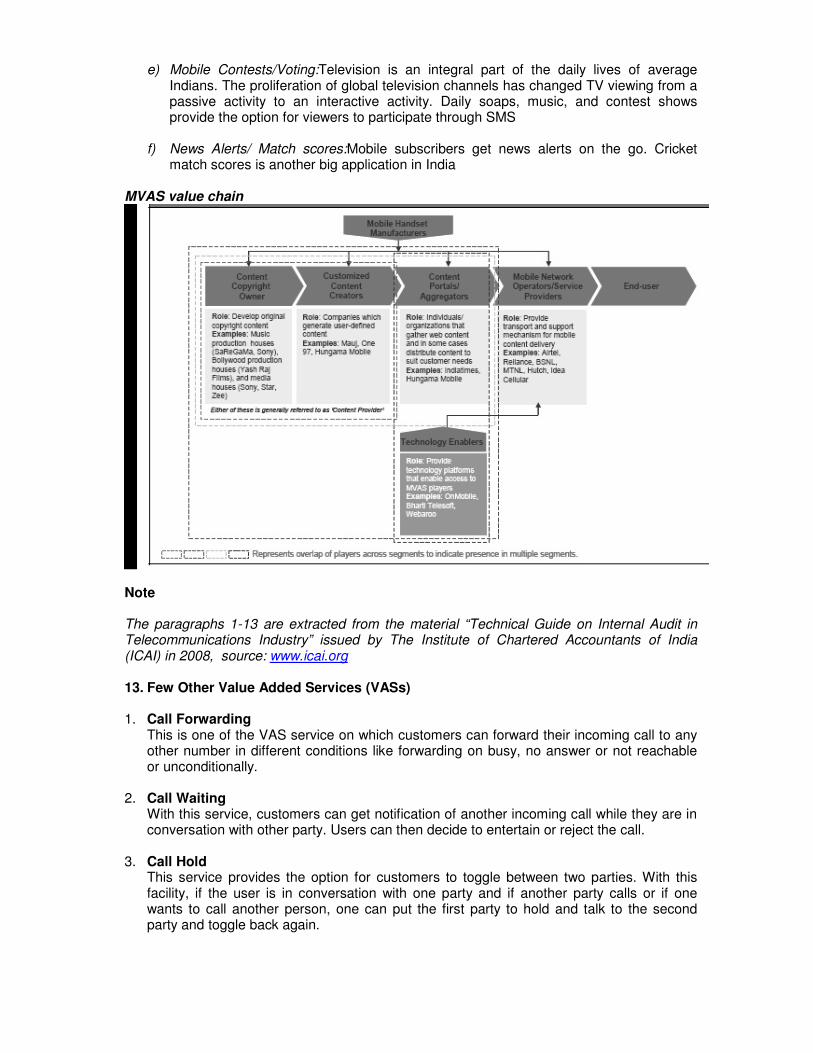
e) Mobile Contests/Voting:Television is an integral part of the daily lives of average Indians. The proliferation of global television channels has changed TV viewing from a passive activity to an interactive activity. Daily soaps, music, and contest shows provide the option for viewers to participate through SMS
f) News Alerts/ Match scores:Mobile subscribers get news alerts on the go. Cricket
match scores is another big application in India MVAS value chain
Note The paragraphs 1-13 are extracted from the material “Technical Guide on Internal Audit in Telecommunications Industry” issued by The Institute of Chartered Accountants of India (ICAI) in 2008, source: www.icai.org 13. Few Other Value Added Services (VASs) 1. Call Forwarding
This is one of the VAS service on which customers can forward their incoming call to any other number in different conditions like forwarding on busy, no answer or not reachable or unconditionally.
2. Call Waiting With this service, customers can get notification of another incoming call while they are in conversation with other party. Users can then decide to entertain or reject the call.
3. Call Hold
This service provides the option for customers to toggle between two parties. With this facility, if the user is in conversation with one party and if another party calls or if one wants to call another person, one can put the first party to hold and talk to the second party and toggle back again.
4. Voice Mail With this service, the customers can send and receive voice mail messages.
5. Multi party Conference In order to use this facility, customers have to subscribe Call Hold Service. The customer can make simultaneous calls with more than one party. This can be realized by putting the first party on hold and initiating or receiving the second call. Then start conversation with first and second party simultaneously by using multiparty conference facility. The Customer will be charged for the whole duration of calls.
6. Multi Media Message Service (MMS)
Multimedia Message Service (MMS) is a new standard in mobile messaging where audio, image and video along with text can be sent from one mobile to another mobile number.
7. Web SMS
Using this service one can send SMS through the web by registering for this service.
8. Missed Called Alert (MCA) Using MCA service facility, one can get information about the incoming calls to their mobile numbers by SMS, while their mobiles are either switched off or busy or out of network coverage.
Chapter 10 Illustrative Lists on Business Strategies of some Telecommunication Operators
In order to conduct any business, strategy is important. The following paragraph of this material contains some of the business strategies adopted by few telecommunication operators and the KPIs used for the measurement which have been extracted from their published annual reports. 10.1 Vodafone Group Plc. (Extracted from Annual Report 2014,
www.vodafone.com/ar2014)
10.1.1 About Vodafone
We’ve come a long way since making the first ever mobile call in the UK on 1 January
1985. In 30 years, a small mobile operator in Newbury has grown into a global
business and one of the most valuable telecoms brands in the world. We now have
mobile operations in 27 countries and partner with mobile networks in 48 more. Today,
we have 434 million mobile customers around the world. And because we now do
more than just mobile, we’re able to provide fixed broadband services in 17 markets,
and 9 million customers use us for their fixed broadband needs.
Our core purpose is to empower our customers to be confidently connected – whether
at home, during the daily commute, in the office, or abroad –wherever and however
they choose. We want everyone to be confidently connected to their friends, families,
and customers, and to always have access to the content and information they
choose.
10.1.2 Vodafone’s Assessment of Global Telecom Industry
The mobile industry alone has seven billion users, generating over US$960 billion of
annual service revenue every year. The majority of revenue comes from traditional
calls and texts (for example, last year 7,800 billion texts were sent around the world
last year). However, over the last few years the demand for data services, such as
internet browsing on a smartphone, has accelerated, and today around 28% of mobile
revenue is from data, up from 13% in 2009. Around 74% of mobile users are in
emerging markets, such as India and Africa, reflecting the typical combination of large
populations and the lack of fixed line infrastructure. The remaining users are from
wealthier mature markets, such as Europe. However, the proportion of the population
with a phone – or mobile penetration – tends to be higher in mature markets (usually
over 100%) and lower in emerging markets, particularly in rural areas, due mainly to
lower incomes and less network coverage.
Growth
The demand for mobile services continues to grow strongly. In the last three years the
number of users increased by an average of 9% each year. In 2009 global mobile
penetration was only 69%, and by 2013 it had risen to 98%. Most of the increase in
users has been from emerging markets due to favourable growth drivers – young and
expanding populations, faster economic growth, low but rising mobile penetration, and
less fixed line infrastructure. The other key area of growth is data, which is being
driven by increasing smartphone and tablet penetration, better mobile networks, and
an increased choiceof internet content and applications (‘apps’).
Competition
The mobile industry is highly competitive, with many alternative providers, giving
customers a wide choice of supplier. In each country there are typically at least three
to four mobile network operators (‘MNOs’), such as Vodafone. In addition, there can
be numerous mobile virtual network operators (‘MVNOs’) – suppliers that rent capacity
from mobile operators to sell on to their customers. There can also be competition
from internet-based companies and software providers that offer alternative
communication services such as voice over internet protocol (‘VoIP’) or instant
messaging services.
Regulation
The mobile industry is very heavily regulated by national and supranational authorities.
Regulators continue to lower mobile termination rates (‘MTRs’) which are the fees
mobile companies charge for calls received from other companies’ networks, and to
limit the amount that operators can charge for mobile roaming services. These two
areas represent around 12% of service revenue for Vodafone.
Revenue trends
In an environment of intense competition and significant regulatory pressures, the
price of mobile services has tended to reduce over time. However, with both more
mobile phone users, mainly in emerging markets, and more data usage, global mobile
revenue remains on a positive trend and expanded by 2% in 2013.
The global fixed market
The fixed communications market is valued at around USD 500 Billion. Over the last
three years, revenue from voice services has declined as the demand for traditional
fixed line calls has remained static to around one billion users. In contrast, revenue
from fixed broadband or internet usage on the PC is growing with an estimated 650
million customers worldwide – an increase of nearly 30% over the last three years.
This growth has been spread across all forms of broadband – DSL (copper), cable and
fibre, and within this, there is a growing preference for high speed capability provided
by cable and fiber.
Where the Industry is heading
The pace of change in the industry over the last few years has been significant and is
expected to continue – with new revenue streams, new users, new services, major
improvements to networks, and the convergence of fixed and mobile services.
Growing importance of data and other new revenue areas Mobile voice and texts, our
traditional revenue sources, have reached maturity in a number of markets. To deliver
future growth opportunities, we are investing in newer revenue areas such as data. It
is estimated that between 2013 and 2017 data revenue for the telecommunications
sector is set to grow by US$128 billion, compared to a US$38 billion decline in voice
revenue over the same period. The demand for data will continue to be driven by rising
smartphone and tablet penetration and usage, and improvements in mobile network
capability. As the demand for data grows, mobile networks have to be reconfigured to
data, while still meeting the need for traditional texts and calls. Already 91% of the
world’s total traffic on mobile networks is data. The data services most used are video
streaming and internet browsing which require high speed networks. Therefore, we are
investing in ultrafast 4G with average download speeds of over 75Mbps today, and the
expectation of faster speeds, of up to 300Mbps, by the end of calendar 2014.
New applications for mobile services are being developed by the industry to extend the
use of mobile beyond everyday communication and deliver new revenue streams,
such as mobile payments via a handset or machine-to-machine services, including the
location monitoring of vehicles, through a SIM card embedded in the vehicle.
Convergence of fixed and mobile into unified communications
We expect a continued trend towards unified communications such as bundled mobile,
fixed and TV services. These provide a range of benefits for the user, including
simplicity, flexibility and cost savings. The demand for these services is already
established among enterprise customers and it is now becoming more visible in the
consumer market, particularly in southern European markets, such as Spain. We
believe that this demand, combined with technological advances delivering easier
connection of multiple data devices, will support strong data growth in future, and that
this will need to be managed by access to next generation fixed networks, principally
cable or fiber to support increased capacity and demands.
Strong demand from emerging markets
Emerging markets have the most potential for future mobile customer and revenue
growth driven by rising populations, strong economic growth, lower mobile penetration
and a lack of alternative fixed line infrastructure. According to industry analysts, by
2017 there will be 1.7 billion new mobile users across the globe, and most will be from
emerging markets. As a result by 2017, 77% of the world’s mobile users will be from
these markets.
Increasing range of competitors
The high level of competition among established MNOs is expected to continue.
However, there is also a wider pool of new competitors. Alternative communication
technologies, such as instant messaging services which use data, rather than
traditional voice and text, are increasingly used by mobile consumers. In response,
operators have begun to replace per unit charges for voice and text services with
unlimited bundles, and combine this with a fixed fee for data usage. Meanwhile
MVNOs which offer low prices, but have little capital invested, have in recent periods
taken share from established capital intensive operators. However, the move to 4G
and unified communications presents an opportunity for the major operators to
differentiate the quality of their networks and services.
Regulation will continue to have a significant impact
The industry is expected to see continued downward revenue pressure from
regulation. For example the Europe Commission is seeking the removal of all roaming
surcharges after 2016 (for Vodafone roaming accounts for around 6% of European
service revenue). In contrast, Commission proposals to harmonize the speed at which
Member States roll out spectrum and the duration of contracts, should encourage
investment. In our largest emerging market, India, the regulatory framework is
becoming clearer.
Improving economic environment in Europe
The economic recession in Europe over the last two years has been a key driver of the
declining revenue trends in Europe for many operators. However, we have started to
see early signs of economic recovery in Europe, with a return to GDP growth in 2013
in Northern Europe and an expected recovery in 2014 in Southern Europe.
10.1.3 Three pillars of success of Vodafone
Three distinct elements sum up why Vodafone has had such a strong track record of
shareholder value creation over recent years. First, in response to the increasing
demand for data we have formulated a clear strategy of becoming a leading unified
communications provider and to strengthen further our network and service
differentiation, through investments in mobile and fixed capabilities. Second, we have
made significant progress in executing our strategy. We have actively managed our
portfolio, particularly disposing of our non-controlling interests, and used part of the
proceeds to accelerate the roll-out of 3Gand 4G mobile capability and the deployment
of next-generation fixed line operations in a number of key markets. To accelerate our
strategy further we acquired Kabel Deutschland in Germany and agreed the purchase
of Ono in Spain – two leading cable companies in their respective markets. Finally, we
have extended our very strong track record of balancing the long-term needs of the
business with significant returns to shareholders. We ended the year in a strong
financial position and with a clear strategy for long-term growth.
10.1.4 Services Vodafone Provide
Voice
We carried 1.2 trillion minutes of calls over our network last year – that’s the equivalent
of everyone around the world talking for two and a half hours.
Messaging
Our network carried 337 billion text, picture, music and video messages last year.
Data
Over 544 petabytes of data were sent across our network last year – that’s enough
data for over 100 billion one minute video clips.
Fixed broadband
We have 9.3 million fixed broadband customers, mainly in Germany, Spain and Italy.
Other services
Revenue from mobile virtual network operators (‘MVNOs’) using our network in our
markets and from operators outside our footprint using our products and services as
part of our partner market network that spans 48 countries.
10.1.5 Business Model
Our business model is based on continued high levels of investment to build a superior
telecommunications network and customer experience, and to sustain high levels of
cash generation with which we can reward shareholders and reinvest in the business –
hence creating a virtuous circle of investment, revenue, strong cash conversion and
reinvestment. We take a sustainable approach to the way we do business. The
majority of our products and services offer social and economic benefits for our
customers, whether through helping them to reduce their environmental footprint or
enhancing access to financial services, healthcare and education, particularly in
emerging markets.
Networks
We aim to have the best mobile network in each of our markets, combined with
competitive fixed networks in our main markets. This means giving our customers far-
reaching coverage, a very reliable connection, and increasing speeds and data
capacity. We believe that over time, offering a superior network experience will enable
us to secure a premium positioning in most of our markets. We combine our ongoing
high level of network investment with a commitment to securing the best possible
portfolio of spectrum.
Distribution and customer service
We reach our customers through around 14,500 exclusive branded stores including
franchises, a broad network of distribution partners and third party retailers. The
Internet, whether accessed through a mobile device or PC, is becoming an
increasingly important channel for both sales and after sales service. Our call centers
are available 24 hours a day, seven days a week in all our European markets.
Supplier relationships
In the last financial year we spent around £16 billion buying equipment, devices and
services. Given our large scale and global reach, we tend to be a key strategic partner
for many of our suppliers. We work closely with them to build robust networks, develop
innovative services and offer the widest range of the latest devices.
People
During the year we employed an average of nearly 93,000 people. We support, train
and encourage our employees, ensuring they have the right capabilities, commitment
and enthusiasm to achieve our targets and build on our success in delivering an
outstanding experience to all our customers. We are working hard to build a more
diverse workforce that is more representative of our customer base.
Brand
Today, Vodafone is the UK’s most valuable brand with an attributed worth of US$30
billion (Source: 2014 Brand Finance Global 500). The strength of our brand raises the
profile of our distribution channels and is a major driver of purchasing decisions for
consumers and enterprise customers alike.
Customers
With 434 million customers globally, we are one of the biggest mobile operators in the
world. Over 90% of our mobile customers are individuals and the rest are enterprise
customers ranging from large multinationals, to small and medium sized businesses,
down to the owner of the local corner shop. The majority and the growing share of our
mobile customers are in emerging markets. We also have over nine million fixed
broadband customers, and most of these are in Europe – in fact we are the fourth
largest provider of fixed broadband services in Western Europe and will become the
third following the pending acquisition of Ono in Spain.
Revenue
Mobile consumers pay for our services either via contracts (typically up to two years in
length) or through buying their airtime in advance (prepaid). Enterprise customers
often have longer contracts. Fixed customers typically pay via one to two year
contracts. We have a diverse service revenue stream with 51% from mobile services
in Europe, 30% from mobile operations in AMAP, 15% from fixed services and the
remainder from other items such as MVNO agreements. Within our mobile business,
51% of annual service revenue arises from consumers’ monthly price plans, which we
call in-bundled revenue. In-bundled revenue is an increasing proportion of our
business and is relatively stable compared to out-of-bundle revenue, which is much
more vulnerable to competitive and economic pressure
Cash flow
Our track record of converting revenue into cash flow is strong – with some £16 billion
generated over the last three years. We achieve this by operating efficient networks
where we seek to minimize costs, thus supporting our gross margin. We also have
strong market share positions – as we are typically the first or second largest mobile
operator out of three or four in each market. This provides economies of scale and is a
key driver of cost efficiencies and EBITDA margin, which in turn provides healthy cash
flow.
Shareholder returns
The cash generated from operations allows us to sustain a generous shareholder
returns programme while also investing in the future prosperity of the business – with
almost £23 billion returned to shareholders over the last three years, excluding the
Verizon Wireless return of value. With our strong financial foundation, and as a sign of
our confidence in our future performance, we intend to grow the annual dividend per
share each year going forward Reinvestment. We have maintained a high and
consistent level of CAPEX in recent years, to support wider coverage, higher speeds
and greater capacity in our networks. Through our IT investment we are enhancing our
customer relationship capability and providing new customer billing services. In
addition, we have continued to invest in our stores, our internet and social media
presence and spectrum licenses to support future services and growth.
To boost our investment even more we started Project Spring, our organic investment
programme, which aims to accelerate and extend our current strategy, and thereby
strengthen further our network and service differentiation. We expect total investments
including project spring to be around GBP 19 Billion over next two years.
10.1.6 Strategy
Accelerating our strategy
As the demand for ubiquitous data grows rapidly, we are transforming our business to
become a leading unified communications company, and to strengthen further our
network and service differentiation against our peers. In light of these expected
industry trends our strategic goals are focused on following key growth areas and
targets:
Consumer Europe
While voice and messaging remain important for European consumers, demand for
data is rapidly accelerating. We are focused on providing the best data experience –
both in mobile and fixed – matched by outstanding customer service combined with a
range of worry-free price plans and additional services.
Nearly half our European customers now use a smartphone, with more and more also
using tablets. The average data usage per customer is also increasing rapidly.
Customers want simplicity and worry-free bills and they demand the best in customer
service. The bundling of fixed and mobile products for residential customers is
becoming increasingly common across Europe and we expect this trend to continue.
Aggressive price competition continues in many of our markets
We are enabling worry-free usage through our Red and roaming plans. We are
improving our customer experience across all contact points. We are pushing the
adoption of smartphones and are encouraging our customers to use more and more
data.We are becoming a leading unified communications provider across Europe. We
are innovating in mobile payments.
Unified Communications
Our roots are in mobile services, and these still represent the majority of our revenues.
However, more and more businesses and individual consumers are seeking unified
communications, or converged fixed and mobile services, and we are changing the
shape of our Company to meet this demand. As customer demand for ubiquitous data
and content grows rapidly over the coming years, the most successful communications
providers will be the ones who can provide seamless high speed connectivity at home,
at work, at play and anywhere in between. This will require the integration of multiple
technologies – 3G, 4G, WiFi, cable and fibre – into a single meshed network offering
the best, uninterrupted experience –what we call “unified communications”.
Unified communications for enterprise
Combined fixed and mobile services have been a feature of the enterprise market,
particularly for small- and medium-sized companies, for several years. We have been
a market leader with products such as Vodafone One Net, which provides integrated
fixed and mobile services which create significant business efficiencies for customers.
Consumer Emerging Markets
It’s easy to think of Vodafone as simply a European company, with its headquarters in
the UK, but the reality is that one third of our revenue comes from countries outside
Europe and most of this is in fast-growing emerging markets where data demand is
taking off.
Enterprise
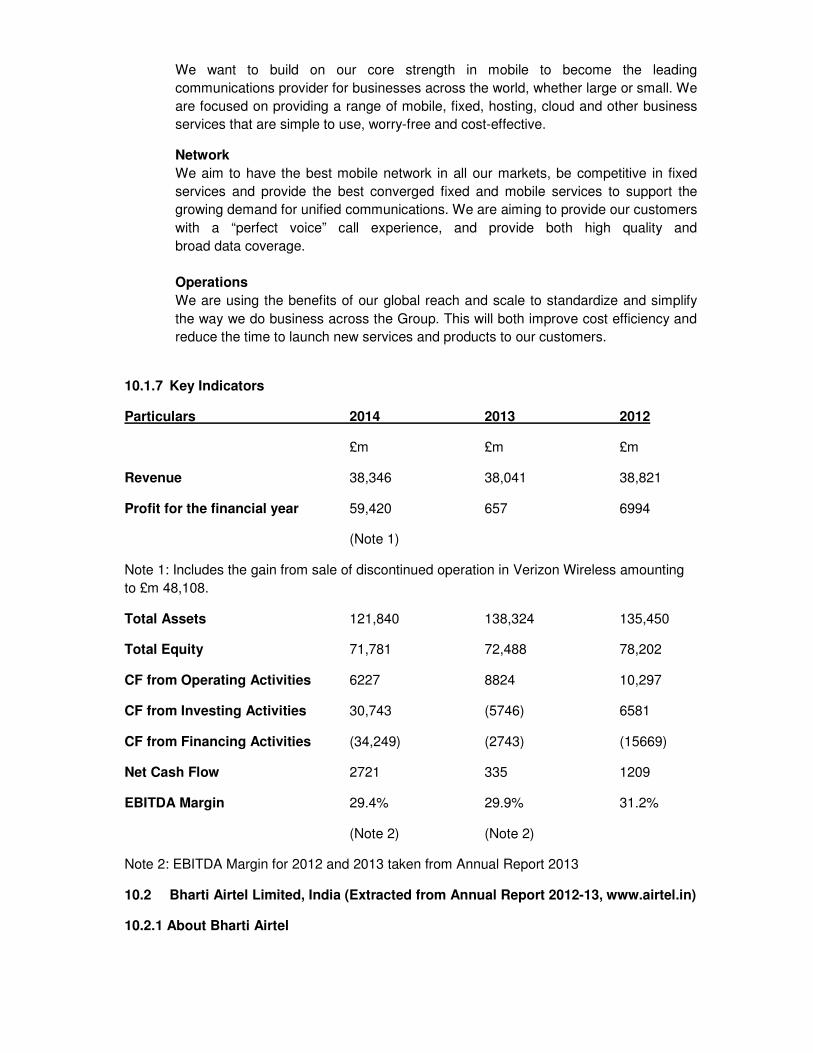
We want to build on our core strength in mobile to become the leading
communications provider for businesses across the world, whether large or small. We
are focused on providing a range of mobile, fixed, hosting, cloud and other business
services that are simple to use, worry-free and cost-effective.
Network
We aim to have the best mobile network in all our markets, be competitive in fixed
services and provide the best converged fixed and mobile services to support the
growing demand for unified communications. We are aiming to provide our customers
with a “perfect voice” call experience, and provide both high quality and
broad data coverage.
Operations
We are using the benefits of our global reach and scale to standardize and simplify
the way we do business across the Group. This will both improve cost efficiency and
reduce the time to launch new services and products to our customers.
10.1.7 Key Indicators
Particulars 2014 2013 2012
£m £m £m
Revenue 38,346 38,041 38,821
Profit for the financial year 59,420 657 6994
(Note 1)
Note 1: Includes the gain from sale of discontinued operation in Verizon Wireless amounting
to £m 48,108.
Total Assets 121,840 138,324 135,450
Total Equity 71,781 72,488 78,202
CF from Operating Activities 6227 8824 10,297
CF from Investing Activities 30,743 (5746) 6581
CF from Financing Activities (34,249) (2743) (15669)
Net Cash Flow 2721 335 1209
EBITDA Margin 29.4% 29.9% 31.2%
(Note 2) (Note 2)
Note 2: EBITDA Margin for 2012 and 2013 taken from Annual Report 2013
10.2 Bharti Airtel Limited, India (Extracted from Annual Report 2012-13, www.airtel.in)
10.2.1 About Bharti Airtel
Bharti Airtel is the largest telecom operator in India and having significant presence in
Africa and few other countries.
10.2.2 Management Discussion and Analysis
Economic Overview
Global Review
The global economy in financial year 2013 projected a wide canvas of concern and
measured optimism. The Eurozone crisis deepened, triggering emergency rescue
efforts by the European Central Bank to reduce tail risks in the region. On the other
hand, sustained fiscal prudence is enabling the US economy to strengthen its
macroeconomic fundamentals. Besides, Japan, after years of stagnation, is back with
a growth strategy designed to jolt the economy out of the doldrums. At the other end of
the spectrum are emerging economies, which remained resilient to headwinds, but
failed to sustain a high growth trajectory. However, there is urgency for policies to be
revisited and financial buffers reinforced in line with evolving economic realities.
The World Economic Outlook published by the International Monetary Fund (IMF) in
April 2013 reported global GDP growth of 3.2% in 2012; it is projected to inch up to
3.3% in 2013, and then likely to touch 4% in 2014. Growth in emerging markets and
developing economies slowed down from 6.4% in 2011 to 5.1% in 2012; it is expected
to reach 5.3% in 2013 and touch 5.7% in 2014. The slowdown in 2012 can be
attributed to a sharp demand deceleration in key advanced economies, domestic
liquidity tightening and bleak investment scenario in major emerging economies.
Indian Economy
India’s GDP growth in FY 2012-13 moderated to 5% from 6.2% in FY 2011-12,
primarily due to global economic contraction, domestic infrastructural bottlenecks,
policy uncertainty and regulatory obstacles. Consumption demand and consumer-
related sectors were impacted by inflation and high interest rates. However, the
moderation in core inflation and some progress on fiscal consolidation have provided
enough headroom to reduce interest rates and spur economic activity. The
Government is also initiating measures to limit the fiscal deficit for FY 2013-14 to 4.8%
of GDP and drive infrastructure investments under the 12th Five Year Plan. Such
measures will restore confidence in India’s macroeconomic policy and drive big-ticket
investment. The IMF’s growth forecast for India is 5.7% in 2013, which can touch 6.2%
in 2014, helped by growing domestic demand and enabling policy initiatives.
Neighbouring Bangladesh and Sri Lanka are also expected to grow by 6% and 6.3%,
respectively, in 2013.
African Economy
Sub-Saharan Africa is the most interesting story in a growth hungry world. It is now the
second fastest growing region globally, surpassed only by emerging Asia. More than
half of the world’s population already lives in cities and the urban population of Sub-
Saharan Africa is projected to double by 2030 (Source: The United Nations). Growing
urbanization is expected to boost consumption and investment in the region. The IMF
has projected 5.6% regional growth in 2013 and 6.1% in 2014, vis-à-vis 4.8% in 2012.
However, one needs to factor in the impact of weak Euro region on the Francophone
countries, given their strong linkages in terms of currency, investments, capital flows
and remittances.
Against the backdrop of global uncertainties, the relatively better economic prospects
of India, South Asia and Sub-Saharan African regions augur well for the Company’s
business.
Megatrends that Drive the Company’s Business
The following megatrends augur well for the Company’s business and brand building
globally.
1 Growing demand for individual empowerment and an increasing sense of a
single global community can be felt across the world. More openness and
solidarity among people, driven by technology, is a conspicuous feature of the
twenty-first century.
2. Power of social media, driven by mobile internet, is forcing socio-economic
change, especially in Asia and Africa. It is compelling institutions, businesses
and governments to be accountable to citizens in more ways than one.
3. People everywhere, but especially in South Asia and Africa, are aspiring for a
better quality of life, a life of empowerment, dignity and opportunity. Besides,
they are more vocal about it than ever before.
4. Young people are thirsty for digital data, a strongest driver of growth in the next
phase of the telecom revolution.
5. Growing focus on literacy and urbanization by governments across Asia and
Africa will drive business prospects.
6. McKinsey Research forecasts India’s internet users will increase five-fold by
2015, and more than threequarters of them will choose mobile access, as the
cost of handsets and wireless networks are declining globally
7. South Asia and Africa are young continents. More than 50% of India is younger
than 25 years and around 70% of the population in Sub-Saharan Africa is
under 30.
8. The penetration of mobile telephony across South Asia and Africa is still low,
compared to global standards.
9. By 2025, two thirds of the world’s population will live in Asia, a seismic shift in
global demographics to propel business prospects.
10. According to Census 2011, telephony in India is overwhelmingly about mobile
phones. While 63% of households owned a phone, 53% owned a mobile
phone only and another 6% owned both a landline and a mobilephone. A little
over half of rural households and threequarters of urban households now own
a mobile phone. This demonstrates significant headroom for growth.
Industry Overview
Indian Telecom Sector
India’s total customer base stood at 898.02 Mn, second only to China, with a
teledensity of 73.32%, as in March 2013. The urban teledensity stood at 149.55%,
whereas the rural teledensity stood at 39.90%, as in December 2012. Low cost and
increasing competition ensured that the share of private sector in the total telecom
space stood at 85.51%, as in December 2012. The announcement of the National
Telecom Policy 2012 will also stand the Company in good stead with the primary
objective of making affordable, reliable and secure telecommunication and broadband
services across India.
African Telecom Sector
Africa’s telecom sector witnessed a healthy, double-digit compound annual revenue
growth in the last decade. However, the year ended March 2013 was fraught with
challenges emanating from economic headwinds, especially in the Francophone
countries having strong Euro linkages. Currency movements and inflation as well as
political unrest in some countries or regions also adversely impacted the African
telecom sector’s growth. Currencies of several countries in the region depreciated
against the US dollar during the year. The vast young population represents a major
customer base that rapidly drives data usage, with significant future revenue potential.
Mobile money, data and VAS remain the top three revenue growth engines across
Africa. The Company has remained steadfast in its systematic efforts to develop its
own network and distribution, and is contributing to the development of Africa’s
telecom ecosystem. In the coming decade,despite adversities, Africa offers the most
valuable growth opportunities for the telecom industry.
SCOT Analysis
Strengths
• Present in more than 20 countries
• An integrated telecom company with complete tele-media solutions
• Present in the country with second largest population globally
• Largest operator in India and fourth largest in the world
• Technology, infrastructure and skilled manpower
Challenges
• High degree of financial leverage
• Inadequate infrastructure in rural regions pushing cost of operations
• Integration in operations across continents
• Understanding evolving customer perceptions in amulti-cultural and multi-lingual
environment
Opportunities
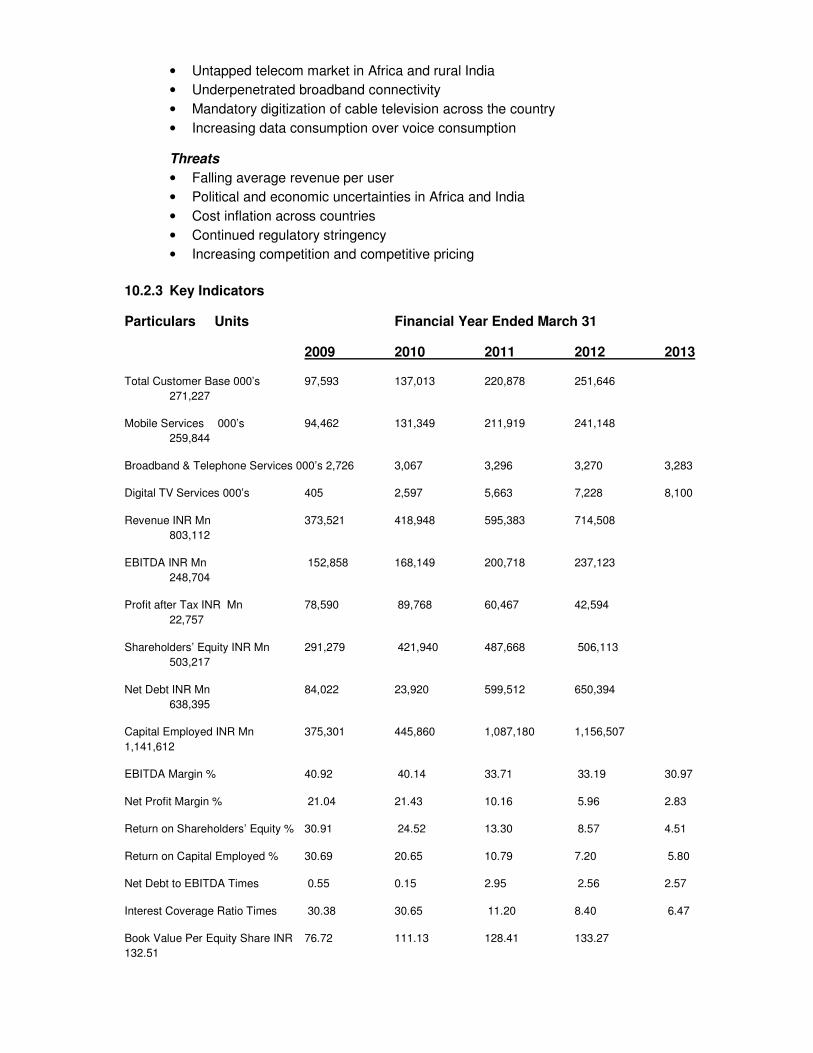
• Untapped telecom market in Africa and rural India
• Underpenetrated broadband connectivity
• Mandatory digitization of cable television across the country
• Increasing data consumption over voice consumption
Threats
• Falling average revenue per user
• Political and economic uncertainties in Africa and India
• Cost inflation across countries
• Continued regulatory stringency
• Increasing competition and competitive pricing
10.2.3 Key Indicators
Particulars Units Financial Year Ended March 31
2009 2010 2011 2012 2013
Total Customer Base 000’s 97,593 137,013 220,878 251,646
271,227
Mobile Services 000’s 94,462 131,349 211,919 241,148
259,844
Broadband & Telephone Services 000’s 2,726 3,067 3,296 3,270 3,283
Digital TV Services 000’s 405 2,597 5,663 7,228 8,100
Revenue INR Mn 373,521 418,948 595,383 714,508
803,112
EBITDA INR Mn 152,858 168,149 200,718 237,123
248,704
Profit after Tax INR Mn 78,590 89,768 60,467 42,594
22,757
Shareholders’ Equity INR Mn 291,279 421,940 487,668 506,113
503,217
Net Debt INR Mn 84,022 23,920 599,512 650,394
638,395
Capital Employed INR Mn 375,301 445,860 1,087,180 1,156,507
1,141,612
EBITDA Margin % 40.92 40.14 33.71 33.19 30.97
Net Profit Margin % 21.04 21.43 10.16 5.96 2.83
Return on Shareholders’ Equity % 30.91 24.52 13.30 8.57 4.51
Return on Capital Employed % 30.69 20.65 10.79 7.20 5.80
Net Debt to EBITDA Times 0.55 0.15 2.95 2.56 2.57
Interest Coverage Ratio Times 30.38 30.65 11.20 8.40 6.47
Book Value Per Equity Share INR 76.72 111.13 128.41 133.27
132.51
Net Debt to Shareholders’ Equity Times 0.29 0.06 1.23 1.29 1.27
Earnings Per Share (Basic) INR 20.70 23.67 15.93 11.22 6.00
10.3 TeliaSonera (Extracted from TeliaSonera Annual Report 2013, www.teliasonera.com)
10.3.1 TeliaSonera in brief
Communication the easy way TeliaSonera has its roots in the Nordic telecom market and holds strong positions in the Nordic and Baltic countries, Eurasia and Spain. Our core business is to create better communication opportunities for people and businesses through mobile and broadband communication services. TeliaSonera creates a world with better opportunities We help people communicate with family, friends and business contacts in an easy, efficient and environmentally-friendly way. We do this by providing high quality telecommunication services in the Nordic and Baltic countries, the emerging markets of Eurasia, including Russia and Turkey, and in Spain. Our ambition is to be a leading operator in all our markets, by providing the best customer experience high-quality networks and cost-efficient operations. We are an international group We have subsidiaries from the Nordics to Nepal, with 72.5 million subscriptions at year-end 2013 as well as 116.5 million subscriptions in our associated companies, mainly in Russia and Turkey. We are also the leading European wholesale provider with a wholly-owned international carrier network. We are organized into three business areas Mobility Services, Broadband Services and Eurasia are our three business areas. In the Nordic and Baltic countries, we provide mobile and fixed line services including TV. In Eurasia and Spain, we offer mobile services.
We want to help our customers get connected We offer high-quality services such as mobile broadband via 4G, digital home and fiber services to ensure we can meet future demands. Our employees We had 26,013 employees at year-end.
10.3.2 Market and Brands
Strong Market Positions Customers recognize us in each of our markets by our common identity. Our icon represents the international strength of TeliaSonera combined with a strong local connection as represented by our well-known local brand names. We also have local fighting brands in most markets, each with a different marketing strategy. We have subsidiaries in the Nordic and Baltic countries as well as in Eurasia and Spain and associated companies in Russia, Turkey and Latvia. We aim to be recognized as a leading player in all our markets.
10.3.3 Mission, Vision and Strategy
Mission: To provide network access and telecommunication services
TeliaSonera’s mission is to help people and companies communicate in an easy, efficient and environmentally friendly way, by providing network access and telecommunication services. Our focus is to deliver a first-rate customer experience, while ensuring the quality of our networks and maintaining a cost-efficient structure. TeliaSonera is an international group with a global strategy, but wherever we operate we act as a local company.
Our focus areas
• Providing world-class customer experience • High-quality networks • Driving cost efficiency
Vision: To contribute to a world with better opportunities TeliaSonera is a world-class service company, recognized as an industry leader. We
are proud pioneers of the telecom industry, a position we have gained by being innovative, reliable and customer-friendly. Wherever we operate, we act in a responsible way, based on a firm set of values and business principles. Our services form a major part of people’s daily lives – for business, education and pleasure.
Shared values
• Add value
• Show respect
• Make it happen Strategy: Solutions based on deep understanding Widespread access to reliable communication services has become pivotal in our daily lives both at home and at work. Since the arrival of smartphones and tablets, we rely increasingly on digital transmission for social and business communication. New pricing models have contributed to making communication services effective, transparent and personal. We expect this trend to increase and evolve in the coming years. TeliaSonera’s strategy is to deliver tailored products and services to best meet the core requirements of our diverse customer segments. We provide solutions formed by our in-depth understanding of our customers’ present and future needs. We create shareholder value by delivering services in a cost-effective and sustainable manner, which leads to improved profitability and strong cash flow. Three major challenges
Our customers’ behavior has been affected by the rapid digitalization of data within our society. Usage has become more dynamic and enhanced by videos, moving images, interactive entertainment and social networks. With consideration to this development, we believe our industry faces three main imminent challenges:
1. Continued rebalancing of data pricing to follow current business models 2. Fixed-mobile convergence and bundling of services 3. Development of value-added services linked to our core business, e.g. cloud
storage and virtual meetings
Our customers depend on us to prioritize our commitment to be their access provider – it is our primary role.
Additionally, we pledge to add value through applications that relate to network access to reduce churn and increase data transfer-speed and capacity.
An industry leader
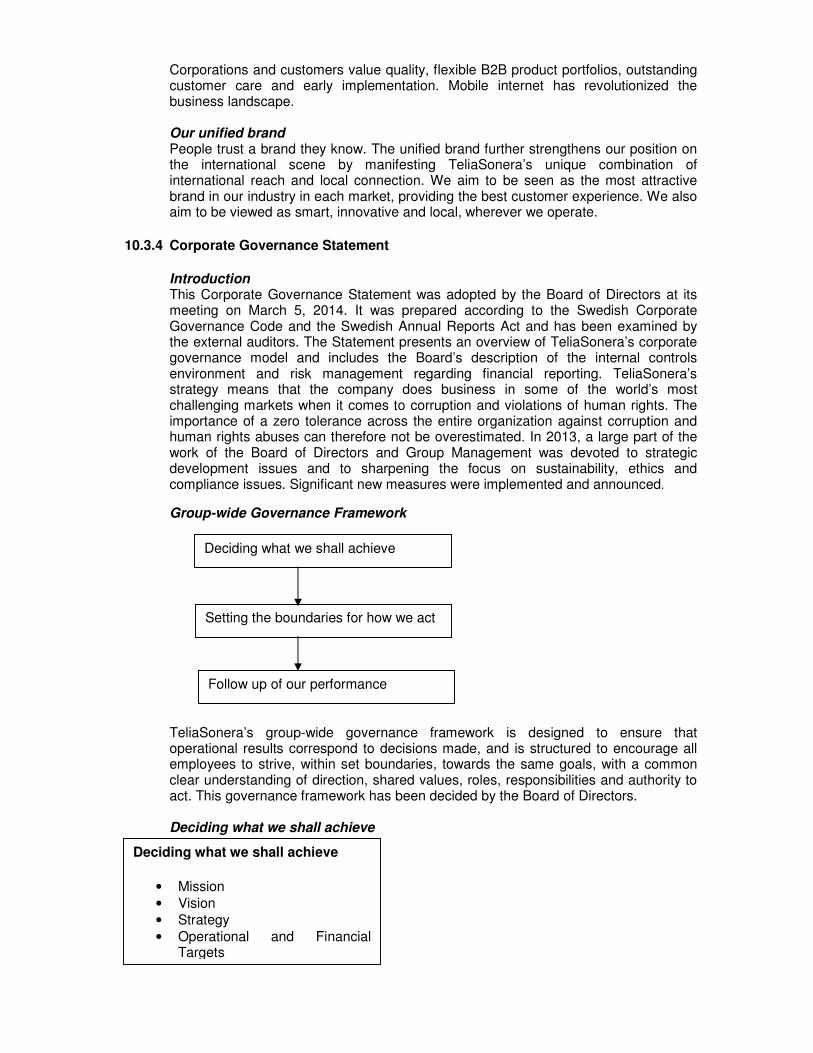
Corporations and customers value quality, flexible B2B product portfolios, outstanding customer care and early implementation. Mobile internet has revolutionized the business landscape.
Our unified brand People trust a brand they know. The unified brand further strengthens our position on the international scene by manifesting TeliaSonera’s unique combination of international reach and local connection. We aim to be seen as the most attractive brand in our industry in each market, providing the best customer experience. We also aim to be viewed as smart, innovative and local, wherever we operate.
10.3.4 Corporate Governance Statement
Introduction This Corporate Governance Statement was adopted by the Board of Directors at its
meeting on March 5, 2014. It was prepared according to the Swedish Corporate Governance Code and the Swedish Annual Reports Act and has been examined by the external auditors. The Statement presents an overview of TeliaSonera’s corporate governance model and includes the Board’s description of the internal controls environment and risk management regarding financial reporting. TeliaSonera’s strategy means that the company does business in some of the world’s most challenging markets when it comes to corruption and violations of human rights. The importance of a zero tolerance across the entire organization against corruption and human rights abuses can therefore not be overestimated. In 2013, a large part of the work of the Board of Directors and Group Management was devoted to strategic development issues and to sharpening the focus on sustainability, ethics and compliance issues. Significant new measures were implemented and announced.
Group-wide Governance Framework
TeliaSonera’s group-wide governance framework is designed to ensure that
operational results correspond to decisions made, and is structured to encourage all employees to strive, within set boundaries, towards the same goals, with a common clear understanding of direction, shared values, roles, responsibilities and authority to act. This governance framework has been decided by the Board of Directors.
Deciding what we shall achieve
Deciding what we shall achieve
• Mission • Vision • Strategy • Operational and Financial
Targets
Deciding what we shall achieve
Setting the boundaries for how we act
Follow up of our performance
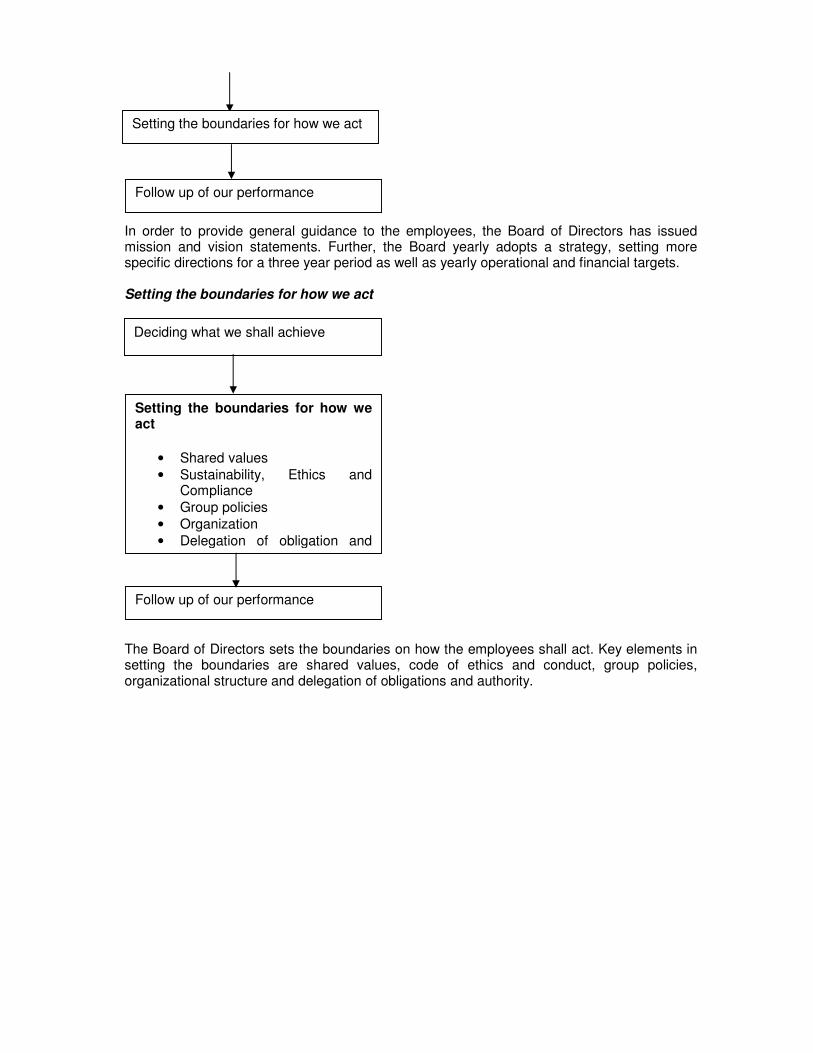
In order to provide general guidance to the employees, the Board of Directors has issued mission and vision statements. Further, the Board yearly adopts a strategy, setting more specific directions for a three year period as well as yearly operational and financial targets. Setting the boundaries for how we act
The Board of Directors sets the boundaries on how the employees shall act. Key elements in setting the boundaries are shared values, code of ethics and conduct, group policies, organizational structure and delegation of obligations and authority.
Setting the boundaries for how we act
Follow up of our performance
Deciding what we shall achieve
Setting the boundaries for how we act
• Shared values • Sustainability, Ethics and
Compliance • Group policies • Organization • Delegation of obligation and
Follow up of our performance
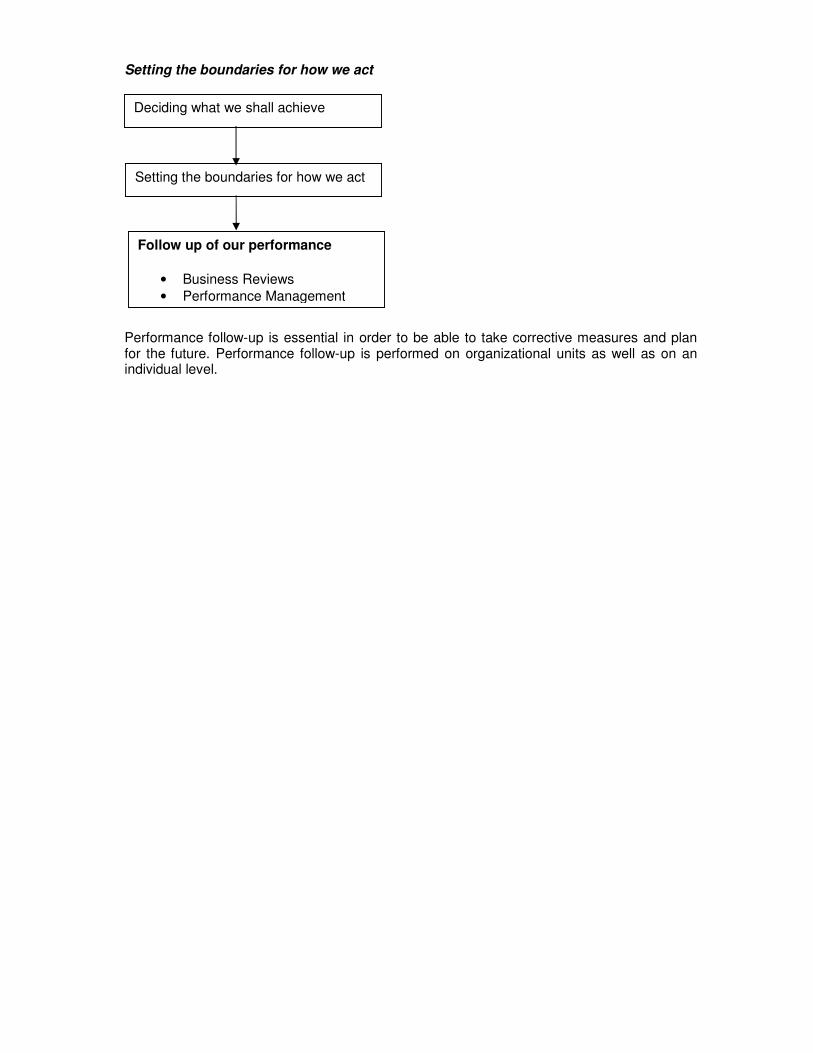
Setting the boundaries for how we act
Performance follow-up is essential in order to be able to take corrective measures and plan for the future. Performance follow-up is performed on organizational units as well as on an individual level.
Deciding what we shall achieve
Setting the boundaries for how we act
Follow up of our performance
• Business Reviews • Performance Management
10.3.5 Ten - Year Summary – Financial Data
TeliaSonera Group
Financial Data (IFRS) 2013 2012 2011 2010 2009 2008 2007 2006 2005 2004
Income (SEK in millions) Net sales 101,700 104,898 104,804 106,979 109,550 103,585 96,344 91,060 87,661 81,937Operating income 24,462 28,400 29,720 32,003 30,242 28,648 26,155 25,489 17,549 18,793
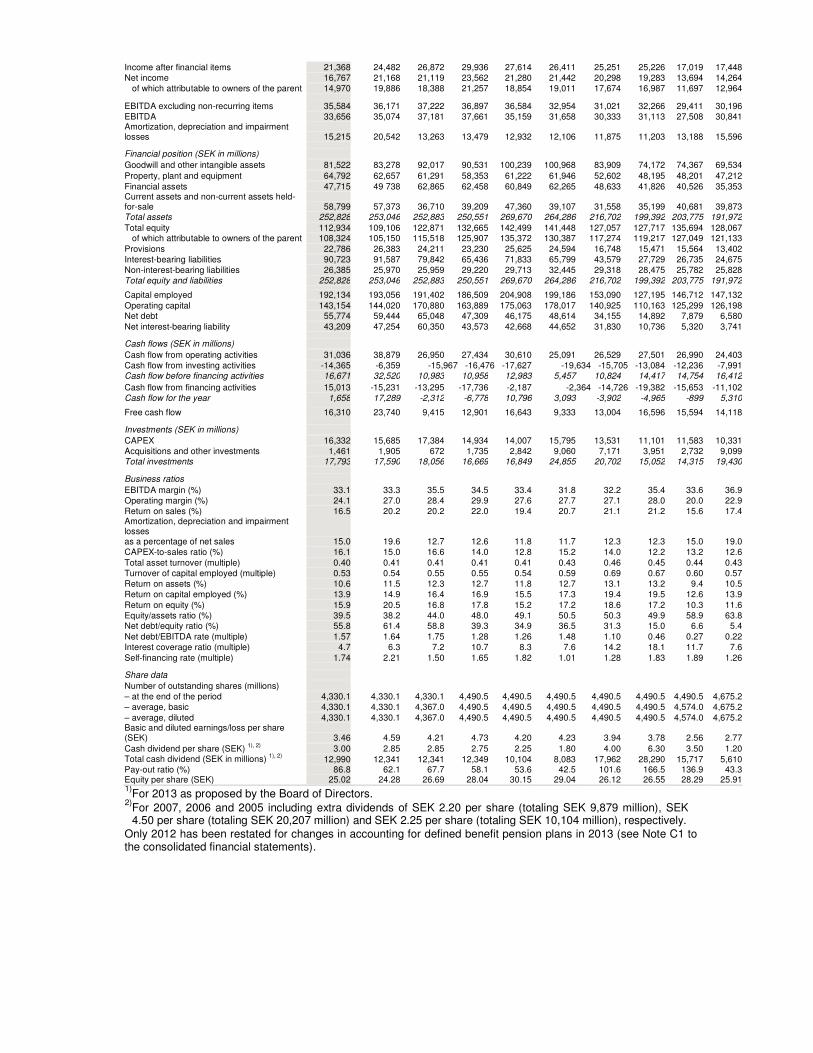
1)For 2013 as proposed by the Board of Directors.
2)For 2007, 2006 and 2005 including extra dividends of SEK 2.20 per share (totaling SEK 9,879 million), SEK 4.50 per share (totaling SEK 20,207 million) and SEK 2.25 per share (totaling SEK 10,104 million), respectively.
Only 2012 has been restated for changes in accounting for defined benefit pension plans in 2013 (see Note C1 to the consolidated financial statements).
Income after financial items 21,368 24,482 26,872 29,936 27,614 26,411 25,251 25,226 17,019 17,448Net income 16,767 21,168 21,119 23,562 21,280 21,442 20,298 19,283 13,694 14,264
of which attributable to owners of the parent 14,970 19,886 18,388 21,257 18,854 19,011 17,674 16,987 11,697 12,964
EBITDA excluding non-recurring items 35,584 36,171 37,222 36,897 36,584 32,954 31,021 32,266 29,411 30,196EBITDA 33,656 35,074 37,181 37,661 35,159 31,658 30,333 31,113 27,508 30,841Amortization, depreciation and impairment losses 15,215 20,542 13,263 13,479 12,932 12,106 11,875 11,203 13,188 15,596
Financial position (SEK in millions)
Goodwill and other intangible assets 81,522 83,278 92,017 90,531 100,239 100,968 83,909 74,172 74,367 69,534
Property, plant and equipment 64,792 62,657 61,291 58,353 61,222 61,946 52,602 48,195 48,201 47,212Financial assets 47,715 49 738 62,865 62,458 60,849 62,265 48,633 41,826 40,526 35,353Current assets and non-current assets held-for-sale 58,799 57,373 36,710 39,209 47,360 39,107 31,558 35,199 40,681 39,873Total assets 252,828 253,046 252,883 250,551 269,670 264,286 216,702 199,392 203,775 191,972
Total equity 112,934 109,106 122,871 132,665 142,499 141,448 127,057 127,717 135,694 128,067of which attributable to owners of the parent 108,324 105,150 115,518 125,907 135,372 130,387 117,274 119,217 127,049 121,133
Provisions 22,786 26,383 24,211 23,230 25,625 24,594 16,748 15,471 15,564 13,402Interest-bearing liabilities 90,723 91,587 79,842 65,436 71,833 65,799 43,579 27,729 26,735 24,675Non-interest-bearing liabilities 26,385 25,970 25,959 29,220 29,713 32,445 29,318 28,475 25,782 25,828Total equity and liabilities 252,828 253,046 252,883 250,551 269,670 264,286 216,702 199,392 203,775 191,972
Capital employed 192,134 193,056 191,402 186,509 204,908 199,186 153,090 127,195 146,712 147,132Operating capital 143,154 144,020 170,880 163,889 175,063 178,017 140,925 110,163 125,299 126,198Net debt 55,774 59,444 65,048 47,309 46,175 48,614 34,155 14,892 7,879 6,580Net interest-bearing liability 43,209 47,254 60,350 43,573 42,668 44,652 31,830 10,736 5,320 3,741
Cash flows (SEK in millions)
Cash flow from operating activities 31,036 38,879 26,950 27,434 30,610 25,091 26,529 27,501 26,990 24,403Cash flow from investing activities -14,365 -6,359 -15,967 -16,476 -17,627 -19,634 -15,705 -13,084 -12,236 -7,991Cash flow before financing activities 16,671 32,520 10,983 10,958 12,983 5,457 10,824 14,417 14,754 16,412
Cash flow from financing activities 15,013 -15,231 -13,295 -17,736 -2,187 -2,364 -14,726 -19,382 -15,653 -11,102Cash flow for the year 1,658 17,289 -2,312 -6,778 10,796 3,093 -3,902 -4,965 -899 5,310
Free cash flow 16,310 23,740 9,415 12,901 16,643 9,333 13,004 16,596 15,594 14,118
Investments (SEK in millions)
CAPEX 16,332 15,685 17,384 14,934 14,007 15,795 13,531 11,101 11,583 10,331Acquisitions and other investments 1,461 1,905 672 1,735 2,842 9,060 7,171 3,951 2,732 9,099Total investments 17,793 17,590 18,056 16,669 16,849 24,855 20,702 15,052 14,315 19,430
Business ratios
EBITDA margin (%) 33.1 33.3 35.5 34.5 33.4 31.8 32.2 35.4 33.6 36.9Operating margin (%) 24.1 27.0 28.4 29.9 27.6 27.7 27.1 28.0 20.0 22.9Return on sales (%) 16.5 20.2 20.2 22.0 19.4 20.7 21.1 21.2 15.6 17.4Amortization, depreciation and impairment losses as a percentage of net sales 15.0 19.6 12.7 12.6 11.8 11.7 12.3 12.3 15.0 19.0CAPEX-to-sales ratio (%) 16.1 15.0 16.6 14.0 12.8 15.2 14.0 12.2 13.2 12.6Total asset turnover (multiple) 0.40 0.41 0.41 0.41 0.41 0.43 0.46 0.45 0.44 0.43Turnover of capital employed (multiple) 0.53 0.54 0.55 0.55 0.54 0.59 0.69 0.67 0.60 0.57Return on assets (%) 10.6 11.5 12.3 12.7 11.8 12.7 13.1 13.2 9.4 10.5Return on capital employed (%) 13.9 14.9 16.4 16.9 15.5 17.3 19.4 19.5 12.6 13.9Return on equity (%) 15.9 20.5 16.8 17.8 15.2 17.2 18.6 17.2 10.3 11.6Equity/assets ratio (%) 39.5 38.2 44.0 48.0 49.1 50.5 50.3 49.9 58.9 63.8Net debt/equity ratio (%) 55.8 61.4 58.8 39.3 34.9 36.5 31.3 15.0 6.6 5.4Net debt/EBITDA rate (multiple) 1.57 1.64 1.75 1.28 1.26 1.48 1.10 0.46 0.27 0.22Interest coverage ratio (multiple) 4.7 6.3 7.2 10.7 8.3 7.6 14.2 18.1 11.7 7.6Self-financing rate (multiple) 1.74 2.21 1.50 1.65 1.82 1.01 1.28 1.83 1.89 1.26
Share data
Number of outstanding shares (millions) – at the end of the period 4,330.1 4,330.1 4,330.1 4,490.5 4,490.5 4,490.5 4,490.5 4,490.5 4,490.5 4,675.2– average, basic 4,330.1 4,330.1 4,367.0 4,490.5 4,490.5 4,490.5 4,490.5 4,490.5 4,574.0 4,675.2– average, diluted 4,330.1 4,330.1 4,367.0 4,490.5 4,490.5 4,490.5 4,490.5 4,490.5 4,574.0 4,675.2Basic and diluted earnings/loss per share (SEK) 3.46 4.59 4.21 4.73 4.20 4.23 3.94 3.78 2.56 2.77
Cash dividend per share (SEK) 1), 2)
3.00 2.85 2.85 2.75 2.25 1.80 4.00 6.30 3.50 1.20Total cash dividend (SEK in millions)
1), 2) 12,990 12,341 12,341 12,349 10,104 8,083 17,962 28,290 15,717 5,610
Pay-out ratio (%) 86.8 62.1 67.7 58.1 53.6 42.5 101.6 166.5 136.9 43.3Equity per share (SEK) 25.02 24.28 26.69 28.04 30.15 29.04 26.12 26.55 28.29 25.91
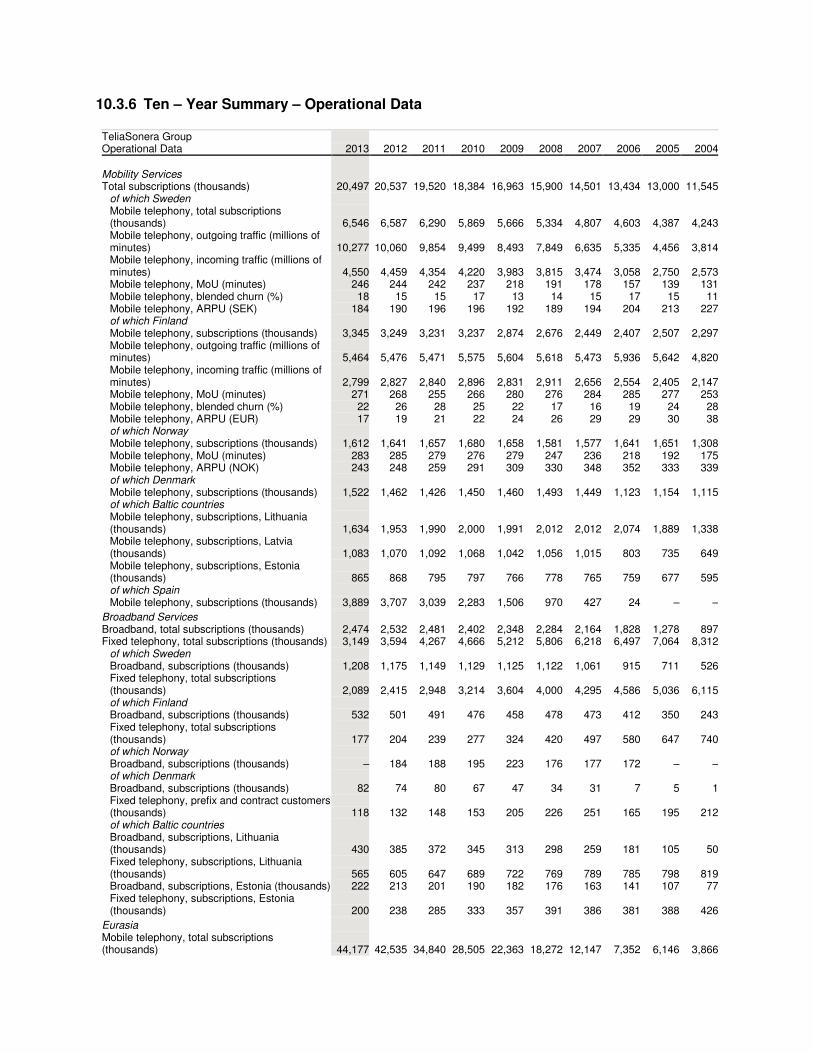
10.3.6 Ten – Year Summary – Operational Data
TeliaSonera Group
Operational Data 2013 2012 2011 2010 2009 2008 2007 2006 2005 2004
Mobility Services
Total subscriptions (thousands) 20,497 20,537 19,520 18,384 16,963 15,900 14,501 13,434 13,000 11,545of which Sweden
Mobile telephony, total subscriptions (thousands) 6,546 6,587 6,290 5,869 5,666 5,334 4,807 4,603 4,387 4,243Mobile telephony, outgoing traffic (millions of minutes) 10,277 10,060 9,854 9,499 8,493 7,849 6,635 5,335 4,456 3,814Mobile telephony, incoming traffic (millions of minutes) 4,550 4,459 4,354 4,220 3,983 3,815 3,474 3,058 2,750 2,573Mobile telephony, MoU (minutes) 246 244 242 237 218 191 178 157 139 131Mobile telephony, blended churn (%) 18 15 15 17 13 14 15 17 15 11Mobile telephony, ARPU (SEK) 184 190 196 196 192 189 194 204 213 227of which Finland
Mobile telephony, subscriptions (thousands) 3,345 3,249 3,231 3,237 2,874 2,676 2,449 2,407 2,507 2,297Mobile telephony, outgoing traffic (millions of minutes) 5,464 5,476 5,471 5,575 5,604 5,618 5,473 5,936 5,642 4,820Mobile telephony, incoming traffic (millions of minutes) 2,799 2,827 2,840 2,896 2,831 2,911 2,656 2,554 2,405 2,147Mobile telephony, MoU (minutes) 271 268 255 266 280 276 284 285 277 253Mobile telephony, blended churn (%) 22 26 28 25 22 17 16 19 24 28Mobile telephony, ARPU (EUR) 17 19 21 22 24 26 29 29 30 38of which Norway
Mobile telephony, subscriptions (thousands) 1,612 1,641 1,657 1,680 1,658 1,581 1,577 1,641 1,651 1,308Mobile telephony, MoU (minutes) 283 285 279 276 279 247 236 218 192 175Mobile telephony, ARPU (NOK) 243 248 259 291 309 330 348 352 333 339of which Denmark
Mobile telephony, subscriptions (thousands) 1,522 1,462 1,426 1,450 1,460 1,493 1,449 1,123 1,154 1,115of which Baltic countries
Mobile telephony, subscriptions, Lithuania (thousands) 1,634 1,953 1,990 2,000 1,991 2,012 2,012 2,074 1,889 1,338Mobile telephony, subscriptions, Latvia (thousands) 1,083 1,070 1,092 1,068 1,042 1,056 1,015 803 735 649Mobile telephony, subscriptions, Estonia (thousands) 865 868 795 797 766 778 765 759 677 595of which Spain
Mobile telephony, subscriptions (thousands) 3,889 3,707 3,039 2,283 1,506 970 427 24 – –
Broadband Services
Broadband, total subscriptions (thousands) 2,474 2,532 2,481 2,402 2,348 2,284 2,164 1,828 1,278 897Fixed telephony, total subscriptions (thousands) 3,149 3,594 4,267 4,666 5,212 5,806 6,218 6,497 7,064 8,312
of which Sweden
Broadband, subscriptions (thousands) 1,208 1,175 1,149 1,129 1,125 1,122 1,061 915 711 526Fixed telephony, total subscriptions (thousands) 2,089 2,415 2,948 3,214 3,604 4,000 4,295 4,586 5,036 6,115of which Finland
Broadband, subscriptions (thousands) 532 501 491 476 458 478 473 412 350 243Fixed telephony, total subscriptions (thousands) 177 204 239 277 324 420 497 580 647 740of which Norway
Broadband, subscriptions (thousands) – 184 188 195 223 176 177 172 – –of which Denmark
Broadband, subscriptions (thousands) 82 74 80 67 47 34 31 7 5 1Fixed telephony, prefix and contract customers (thousands) 118 132 148 153 205 226 251 165 195 212of which Baltic countries
Broadband, subscriptions, Lithuania (thousands) 430 385 372 345 313 298 259 181 105 50Fixed telephony, subscriptions, Lithuania (thousands) 565 605 647 689 722 769 789 785 798 819Broadband, subscriptions, Estonia (thousands) 222 213 201 190 182 176 163 141 107 77Fixed telephony, subscriptions, Estonia (thousands) 200 238 285 333 357 391 386 381 388 426
Eurasia
Mobile telephony, total subscriptions (thousands) 44,177 42,535 34,840 28,505 22,363 18,272 12,147 7,352 6,146 3,866
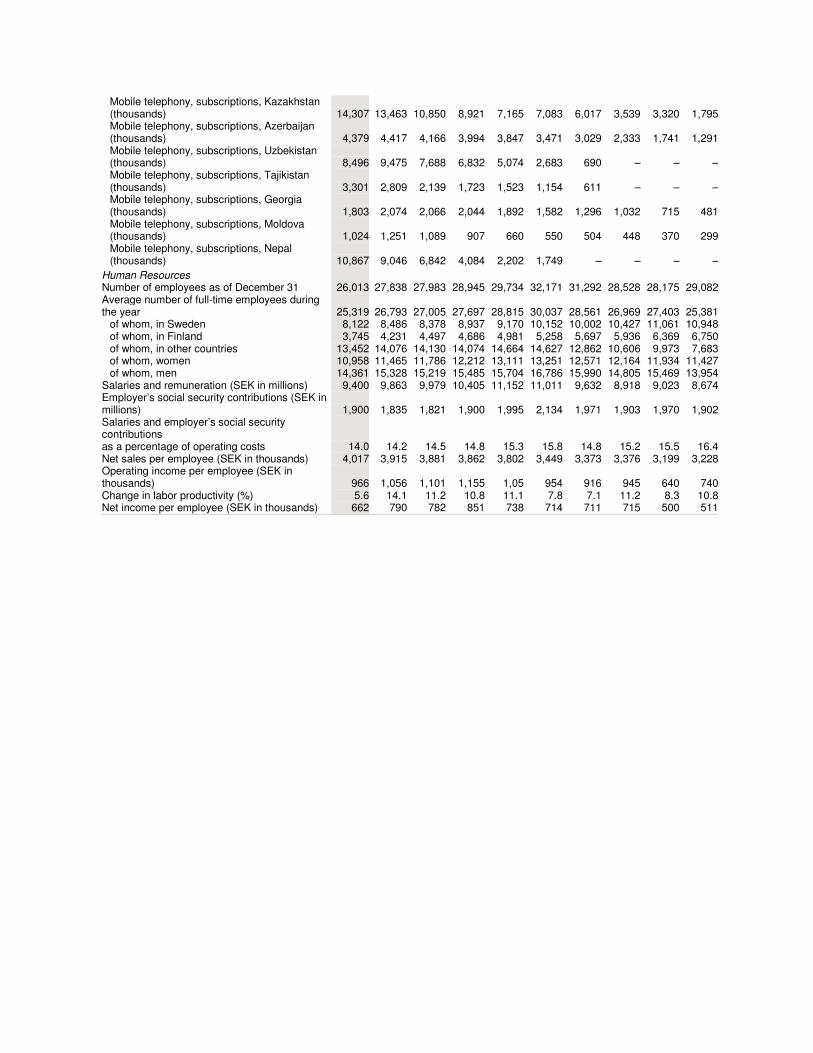
Mobile telephony, subscriptions, Kazakhstan (thousands) 14,307 13,463 10,850 8,921 7,165 7,083 6,017 3,539 3,320 1,795Mobile telephony, subscriptions, Azerbaijan (thousands) 4,379 4,417 4,166 3,994 3,847 3,471 3,029 2,333 1,741 1,291Mobile telephony, subscriptions, Uzbekistan (thousands) 8,496 9,475 7,688 6,832 5,074 2,683 690 – – –Mobile telephony, subscriptions, Tajikistan (thousands) 3,301 2,809 2,139 1,723 1,523 1,154 611 – – –Mobile telephony, subscriptions, Georgia (thousands) 1,803 2,074 2,066 2,044 1,892 1,582 1,296 1,032 715 481Mobile telephony, subscriptions, Moldova (thousands) 1,024 1,251 1,089 907 660 550 504 448 370 299Mobile telephony, subscriptions, Nepal (thousands) 10,867 9,046 6,842 4,084 2,202 1,749 – – – –
Human Resources
Number of employees as of December 31 26,013 27,838 27,983 28,945 29,734 32,171 31,292 28,528 28,175 29,082Average number of full-time employees during the year 25,319 26,793 27,005 27,697 28,815 30,037 28,561 26,969 27,403 25,381
of whom, in Sweden 8,122 8,486 8,378 8,937 9,170 10,152 10,002 10,427 11,061 10,948of whom, in Finland 3,745 4,231 4,497 4,686 4,981 5,258 5,697 5,936 6,369 6,750of whom, in other countries 13,452 14,076 14,130 14,074 14,664 14,627 12,862 10,606 9,973 7,683of whom, women 10,958 11,465 11,786 12,212 13,111 13,251 12,571 12,164 11,934 11,427of whom, men 14,361 15,328 15,219 15,485 15,704 16,786 15,990 14,805 15,469 13,954
Salaries and remuneration (SEK in millions) 9,400 9,863 9,979 10,405 11,152 11,011 9,632 8,918 9,023 8,674Employer’s social security contributions (SEK in millions) 1,900 1,835 1,821 1,900 1,995 2,134 1,971 1,903 1,970 1,902Salaries and employer’s social security contributions
as a percentage of operating costs 14.0 14.2 14.5 14.8 15.3 15.8 14.8 15.2 15.5 16.4Net sales per employee (SEK in thousands) 4,017 3,915 3,881 3,862 3,802 3,449 3,373 3,376 3,199 3,228Operating income per employee (SEK in thousands) 966 1,056 1,101 1,155 1,05 954 916 945 640 740Change in labor productivity (%) 5.6 14.1 11.2 10.8 11.1 7.8 7.1 11.2 8.3 10.8Net income per employee (SEK in thousands) 662 790 782 851 738 714 711 715 500 511
10.4 China Telecom (Extracted from China Telecom Annual Report 2013, www.chinatelecom-h.com/en/ir/report/annual2013.pdf) 10.4.1 About China Telecom China Telecom Corporation Limited (“China Telecom” or the “Company”, together with
its subsidiaries, collectively the “Group”) is a full services integrated information service operator and the world’s largest wirelineTelecommunications, CDMA mobile network and broadband Internet services provider, providing basic telecommunications services such as wireline telecommunications services and mobile telecommunications services, and value-added telecommunications services such as Internet access services and information services in the PRC. As at the end of 2013, the Company has wireline access lines in service of about 156 million, wireline broadband subscribers of about 100 million and mobile subscribers of about 186 million.The Company’s H shares and American Depositary Shares (“ADSs”) are listed on The Stock Exchange of Hong Kong Limited and the New York StockExchange, respectively.
10.4.2 Business Review
Business operating strategies In 2013, the Company adhered to the operating theme of “promoting dual enhancement in scale development and profitability through dual-leadership in innovation and service”, vigorously implemented the two key strategies of scale operation and data traffic operation, and carried out operational measures in “efficiently- centralized marketing, terminal-led approach, application-driven promotion, open channel expansion and excellent services provision”. First, strengthened efficiently-centralized marketing intensity and raised sales efficiency In 2013, the Company further refined package design to meet the customers’ demand, launching “e-Surfing Young” data-only and “DIY” mobile packages. At the same time, the Company optimized its package structure and centralized marketing resources and strategy that tilted towards high-valued clients and services. To actively adopt non-cost marketing model, the Company carried out various activities, including vigorous development of pre-paid subscribers and providing rebate to existing customers upon depositing of fees in advance. The Company further strengthened the centralized effort of marketing activities by organizing four unified marketing campaigns during the year and substantially enhanced customer acquisition and terminal sales.
Second, strengthened terminal led-approach and optimize terminal portfolio structure The Company continued to promote the “terminal-led” strategy that facilitated the continued prosperity of CDMA terminal industry value chain. For the whole year, a total of 334 CDMA handset models were newly launched, of which 270 were newly-launched 3G smartphone models. The smartphone sales volume accounted for 80.4% of the total sales volume, up 19 percentage points over last year. Through chipset upgrade, screen enlargement and other initiatives, the price-to-performance ratio of the smartphones priced around RMB1,000 was enhanced, strengthening the competitive edges of the market of smartphones priced around RMB1,000. The Company also successfully managed to participate in the global launches of various star handsets, such as Apple’s 5S/5C, Samsung’s S4 and NOTE3 and raised its market share in the high-end market.
The Company also collaborated with upstream chipset manufacturers to launch low-end smartphones priced at RMB299, tackling the disadvantages of the lack of presence for CDMA network standard smartphones in the low-end market.
Third, the Company accelerated the promotion of applications to create
differentiated competitive edges The Company attached great importance to development and promotion of the industry
applications for government and enterprise customers, and development of livelihood applications and mobile Internet applications. For industry application, the Company focused on promoting e-Surfing School, work unit e-Surfing RFID, field work assistant, integrated office, busy-shop assistant and campus e-Surfing RFID and the industry applications drove over 13 million of net addition of mobile subscribers. For livelihood application, the Company vigorously promoted applications for water, electricity and gas bills payment, gas refuel, traffic fines and public transport payments. For mobile Internet applications, the Company sped up the pace of corporatization and equity restructuring of emerging services such as product centre businesses in order to establish competitive specializedcorporate. China Telecom actively worked with mobile Internet companies and jointly launched “YiChat” with NetEase, Inc., serving as the mobile Internet portal.
Fourth, the Company stepped up synergy of channels, and improved sales
capabilities ofchannels The Company strengthened the collaboration of the three major channels, namely, direct
sales, physical outlets and electronic channels, to coverage the strengths and improve sales capabilities. For government and enterprises customers, the company strengthened the training for direct sales managers and enhanced the training for direct sales managers and enhanced the capability to secure sizable contracts. At the same time, it adopted a synergistic marketing approach that combined “channel manager + agent + physical outlet” to enhance coverage of small to medium sized government and enterprise customers. For outlets, the Company continued to deepen the implementation of “sub-division of performanceevaluation units” in the self-operated outlets to motivate staff vitality and increase sales. The Company extensively cooperated with open channels, especially with chain stores and terminal manufacturers, as well as strengthened the direct supply of terminals and calling cards at the convenience outlets such as telephone booths and service outlets in rural areas. For electronic channels, the Company centralized its development and operation, established dedicated marketing policyand a B2B-focused distribution system, leading to improvement of the electronic channel’s ability to operate independently, and accelerating transformation to be an e-commerce operator as well as the closer cooperation with third party e-commerce companies.
Fifth, the company focused on customers’ perception and customers’ satisfaction To improve customers’ perception and enhance their satisfaction, the Company
implemented the “Service of Excellence” strategy. Using service standard as a starting point, the Company promoted instant customer satisfaction feedback system in 10 pilot provinces, to evaluate services such as the physical outlets and broadband service installation and maintenance, strengthening the control over the service delivery to enhance customers’ experience. With focus on key services, the Company enhanced 3G service standardization, optimized data traffic queries, reminder service, credit control management and service cancellation process, strengthened the coaching of applications adoption and achieved EVDO network optimization in urban areas. In addition, it provided customers of different tiers and clusters with differentiated
broadband services, enhancing the efficiency of installation and maintenance, and effectively promoting customer access bandwidth upgrade. All these put the Company top in 3G and broadband satisfaction survey. To provide convenient and fast service, the company enriched its service channels by offering mobile “e-surfing customer service”, launching customer service platform in “YiChat” and “WeChat”
Network and operation support In 2013, the Company continued to uphold the “return- focused” investment principal, optimized investment structure, accelerated network upgrade and evolution and progressively expanded capacity, supporting business scale expansion and steadily enhancing resource utilization. First, the Company continued to enhance the core competitiveness of the mobile network. The Company appropriately implemented a “rapid and targeted” capacity expansion based on subscriber growth and network traffic loads in 2G/3G network to ensure the network quality and customers’ satisfaction, raising the network utilization by more than 2 percentage points. Leveraging on the 4G licensing, the Company promptly deployed LTE network in over 60 cities to provide network assurance for its 4G operation. Second, the Company progressively promoted fibre network in cities and bandwidth upgrade. The Company focused on fibre network construction and upgrade in the urban areas based on customers’ demand, enhancing the broadband network edges. More than 9-% of the urban areas were covered with at least 20Mbps customer access bandwidth, with fibre access port utilization reaching 405, an improvement of 7.6 percentage points. In rural areas, the Company deployed wireline, wireless and other means subject to local conditions to meet the demand of new broadband users, with more than 91% coverage with at least 4Mbps customer access bandwidth.
Development measures and highlights for 2014 In 2014, 4G commercial launch, along with the rapid growth of the new Internet-based information consumption and e-commerce transactions, will bring new market opportunities and room for information consumption growth. The Company will accelerate the deployment of 4G services and plan to launch 4G products focusing on data traffic and multi-terminal sharing. The 4G services positioning will be targeted to mid-to-high-end users in mainly urban areas, while 3G will be positioned to mid-to-low-end users leveraging on the Company’s superior 3G network coverage in rural areas with accelerated expansion of rural subscribers. The Company continues to enhance the utilization of wireline broadband network through upgrade of customer access bandwidth and quality and iTV HD content enrichment to improve productcompetitiveness and maintain the market leadership in wireline broadband service. In addition, the Company continues to accelerate the coverage of its open channels, strengthen channels collaboration, and raise marketing capabilities and sales per store. The Company will actively expand in information services, accelerate the emerging business development,improve the data traffic product mechanism, cooperate with Internet companies to promote the adoption of heavy data traffic applications, such as video, and vigorously expand “data traffic backward monetization”. To speed up the expansion of Internet applications, the Company will strengthen the integrated platform as the fundamental, build the core capabilities on
payment, location-based services and account operation and leverage on “YiChat” as portal for building Internet business system.
The Company will reinforce traditional advantages in the integrated outsourcing, IDC
and Cloud products, while nurturing new products in the areas of big data and Internet of thing, etc. We will also continue to optimize network resources, improve operating and maintenance efficiency, enhance service capabilities of full services and enhance customers’ satisfaction to attain continuous growth in customer value and corporate value.
10.4.3 Corporate Culture
Corporate Mission Let the customers fully enjoy a new information life
Strategic Goal Be a world-class integrated information service provider
Core Value Comprehensive innovation, pursuing truth and pragmatism, respecting people and creating value all together
Operation Philosophy Pursue mutual growth of corporate value and customer value Service Philosophy
Customer First Service Foremost Code of Corporate Practice
• Keep promise and provide excellent service for customers • Cooperate honestly and seek win-win result in joint innovation • Operate prudently and enhance corporate value continuously • Manage precisely and allocate resources scientifically • Care the staff and tap their potential to the full • Reward the society and be a responsible corporate citizen
Corporate Slogan Connecting the World
10.4.4 Financial Highlights
1. EBITDA was calculated based on operating revenues minus operating expenses plus depreciation and amortization.
2. EBITDA margin was calculated based on EBITDA divided by the operating revenues excluding mobile terminal sales.
3. Net profit represented profit attributable to equity holders of the Company.
4. Equity and net asset value represented equity attributable to equity holders of the Company.
5. Certain prior years figures were retrospectively restated due to the acquisition of China Telecom (Europe) Limited. Please refer to note 1 to
the audited financial statements in this annual report for details.
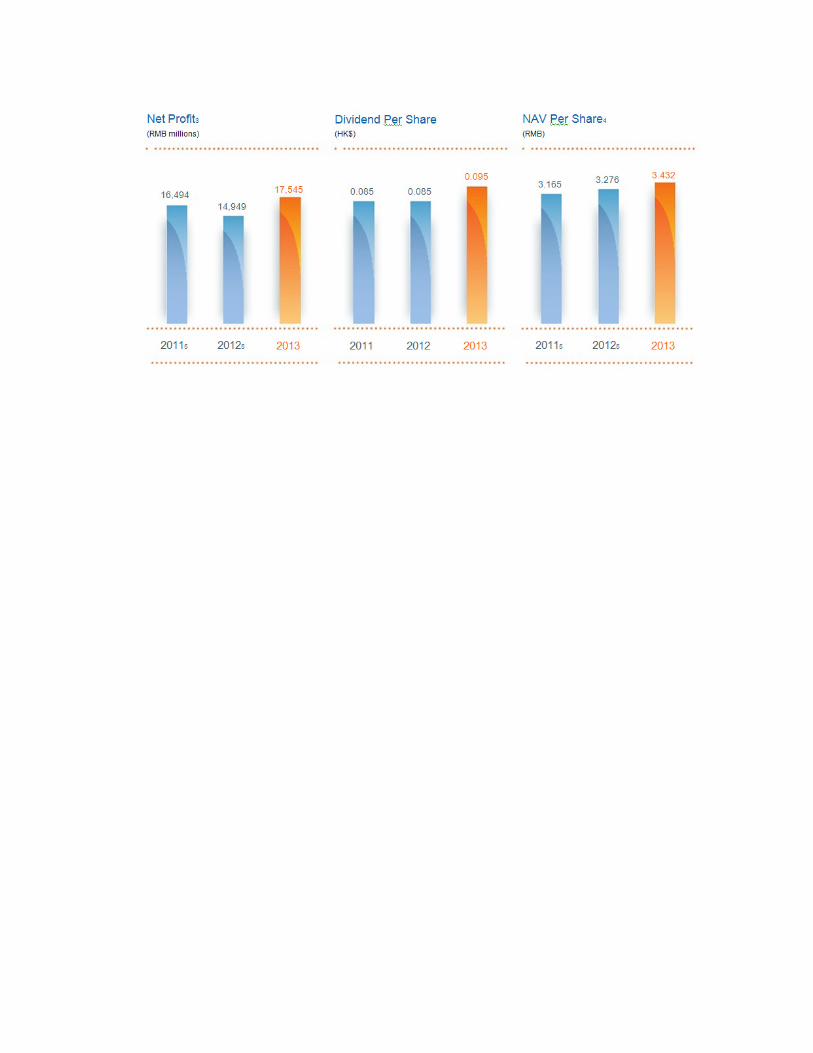
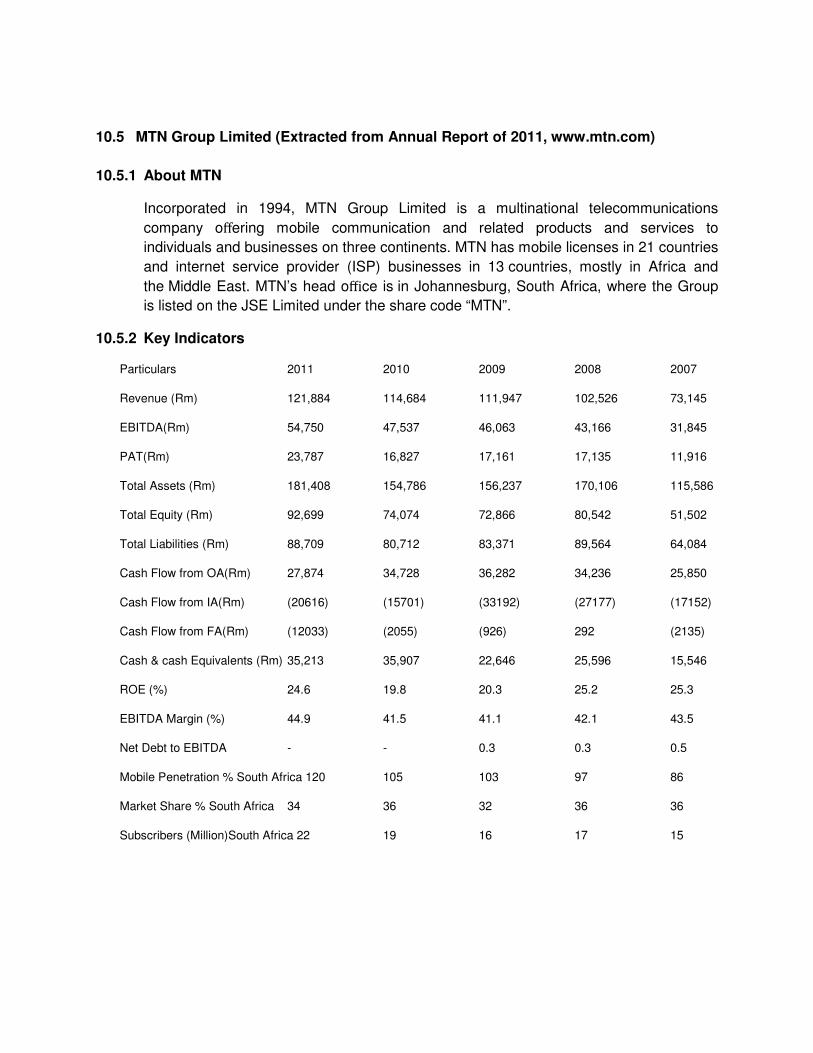
10.5 MTN Group Limited (Extracted from Annual Report of 2011, www.mtn.com)
10.5.1 About MTN
Incorporated in 1994, MTN Group Limited is a multinational telecommunications
company offering mobile communication and related products and services to
individuals and businesses on three continents. MTN has mobile licenses in 21 countries
and internet service provider (ISP) businesses in 13 countries, mostly in Africa and
the Middle East. MTN’s head office is in Johannesburg, South Africa, where the Group
is listed on the JSE Limited under the share code “MTN”.
10.5.2 Key Indicators
Particulars 2011 2010 2009 2008 2007
Revenue (Rm) 121,884 114,684 111,947 102,526 73,145
EBITDA(Rm) 54,750 47,537 46,063 43,166 31,845
PAT(Rm) 23,787 16,827 17,161 17,135 11,916
Total Assets (Rm) 181,408 154,786 156,237 170,106 115,586
Total Equity (Rm) 92,699 74,074 72,866 80,542 51,502
Total Liabilities (Rm) 88,709 80,712 83,371 89,564 64,084
Cash Flow from OA(Rm) 27,874 34,728 36,282 34,236 25,850
Cash Flow from IA(Rm) (20616) (15701) (33192) (27177) (17152)
Cash Flow from FA(Rm) (12033) (2055) (926) 292 (2135)
Cash & cash Equivalents (Rm) 35,213 35,907 22,646 25,596 15,546
ROE (%) 24.6 19.8 20.3 25.2 25.3
EBITDA Margin (%) 44.9 41.5 41.1 42.1 43.5
Net Debt to EBITDA - - 0.3 0.3 0.5
Mobile Penetration % South Africa 120 105 103 97 86
Market Share % South Africa 34 36 32 36 36
Subscribers (Million)South Africa 22 19 16 17 15
Abbreviations 2G Second Generation 3G PS Third Generation Packet switched 3G Third Generation 3GPP Third Generation Partnership Project ADSL Asynchronous digital subscriber line AIN Advanced Intelligent Network ARO Asset Retirement Obligation ARPANET Defense Advanced Research Projects Agency Network ARPU Average Revenue Per User BSC Base Station Controller BSS Base Station Subsystem BTS Base Transceiving Station CAMEL Customized Application Mobile Network Enhanced Logic CDMA Code Division Multiple Access CDN Content Delivery Network CDR Call Data Record CODEC Coder-decoder CPs Content Providers CSSR Call Set Up Success Rate CVV Card Verification Value DCR Dropped Call Rate DoD ARPA Department of Defense, Defense Advanced Research Projects Agency DoT Department of Telecommunication DSL Digital subscriber line DWDM Dense wavelength division multiplexing EBITDA Earnings Before Interest Tax Depreciation and Amortization EDGE Enhanced Data Rates for Global Evolution eHSPA Enhanced High-Speed Packet Access EMS Element Management System EPC Evolved Packet Core EPS Enhanced Packet Core eUTRAN Enhanced UMTS Terrestrial Radio Access Network EVDO Evolution Data Only GDP Gross Domestic Product GMSC Gateway MSC GP Gross Margin GPRS General Packet Radio Service GSM Global System for Mobile telecommunications HD voice high-definition voice HLR Home Location Register HSDPA High-Speed Downlink Packet Access HSUPA High-Speed Uplink Packet Access IAS International Accounting Standards ICRA Investment Information and Credit Rating Agency IFRIC International Financial Reporting Interpretation Committee IFRS International Financial Reporting System ILD International Long Distance
IMS IP Multimedia Subsystem IPLC International Private Leased Circuit ISC International Switching Center ISDN Integrated Services Digital Network IUC Interconnection Charges LTE Long Term Evolution M2M Machine to Machine MCA Missed Call Alert MGC Media Gateway Control MGCP Media Gateway Control Protocol MGW Media gateways MIMO Multiple input-multiple output MME Mobility management entity MMS Multimedia Message Service MOIC Ministry of Information and Communications MOU Minutes of Service Used MoU Minutes of Usage MSAN Multi Access Service Nodes MSC Mobile Switching Center MSISDN Mobile Station International Subscriber Directory Number MVAS Mobile Value Added Service NAS Nepal Accounting Standards NFRS Nepal Financial Reporting Standards NGN Next Generation Network NGN Next-generation network NLD National Long Distance NOC Network Operation Center NSS Network Subsystem NTA Nepal Telecommunication Authority OMC Operation and Maintenance Center OSS Operating Support System OT Ownership Tax OTT Over-the-Top P/E Price Earning PC Personal Computer PCO Public Call Office PDH Plesiochronous digital hierarchy PDH Synchronous Digital Hierarchy PPE Property, Plant and Equipment PSTN Public Switched Telephone Network QCI Quality Class Identifier QoS Quality of Service RAN Radio access network RF Radio Frequency ROCE Return on Capital Employed RTDF Rural Telephone Development Fund RTT Roof Top Towers SAC Subscriber Acquisition Cost SACFA Standing Advisory Committee on Radio Frequency Allocation SCP Service Control Point SDH Synchronous Digital Hierarchy
SHLR Standalone Home Location Register SIM Subscriber Identification Module SMS Short Message Service SPs Service Providers SSP Service Switching Point STP Signaling Transfer Point TCP/IP Transmission Control Protocol/Internet Protocol TRAI Telecommunication Regulatory Authority of India TSC Telephone Service Tax UE User equipment UMTS Universal Mobile Telephone System UTRAN UMTS Terrestrial Radio Access Network VAS Value Added Services VAT Value Added Tax VLR Visited Location Register VoIP Voice over Internet Protocol WAP Wireless Application Protocol W-CDMA Wideband Code Division Multiple Access WHO World Health Organization WiMAX Worldwide Interoperability for Microwave Access
Bibliography
1. Value Added Tax, 2052 (1996)
2. Value Added Rules, 2053 (1997)
3. Value Added Tax Directives, 2069 (2012)
4. Income Tax Act, 2058 (2000)
5. Income Tax Rules, 2059 (2001)
6. Telecommunication Act, 2053 (1997)
7. Telecommunication Regulation, 2054 (1997)
8. Interconnection Guideline, 2065(2008)
9. Finance Act, 2071 (2014)
10. Radio Frequency (Assignment and Pricing) related policy of the Telecommunications
Service, 2069(2012)
11. www.icai.org
12. www.ird.gov.np
13. www.nta.gov.np
14. www.kpmg.com
15. www.vodafone.com
16. www.airtel.in
17. www.teliasonera.com
18. www.chinatelecom-h.com
19. www.mtn.com
20. www.ican.org.np
21. www.ifrs.org
22. www.bp.com
23. www.signIndustry.com
24. www.icra.in
25. Booz and Company
26. www.capgemini.com/tme
27. http://www.efort.com

Disclaimer: